Article

A Versatile Setup for Time-Resolved Functional Near Infrared Spectroscopy Based on Fast-Gated Single-Photon Avalanche Diode and on Four-Wave Mixing Laser

1
Politecnico di Milano, Dipartimento di Fisica, Piazza Leonardo da Vinci 32, I-20133 Milano, Italy
2
Consiglio Nazionale delle Ricerche, Istituto di Fotonica e Nanotecnologie, Piazza Leonardo da Vinci 32, 20133 Milano-I, Italy
*
Author to whom correspondence should be addressed.
Appl. Sci. 2019, 9(11), 2366; https://doi.org/10.3390/app9112366
Submission received: 15 April 2019 / Revised: 1 June 2019 / Accepted: 4 June 2019 / Published: 10 June 2019
(This article belongs to the Special Issue New Horizons in Time-Domain Diffuse Optical Spectroscopy and Imaging)

Abstract

:
In this paper, a time-domain fast gated near-infrared spectroscopy system is presented. The system is composed of a fiber-based laser providing two pulsed sources and two fast gated detectors. The system is characterized on phantoms and was tested in vivo, showing how the gating approach can improve the contrast and contrast-to-noise-ratio for detection of absorption perturbation inside a diffusive medium, regardless of source-detector separation.

1. Introduction

Among the fascinating applications of lasers, the non-invasive/non-destructive analysis of diffusive samples [1] (such as biological tissues, fruit, chemicals and wood [2,3,4]) has recently gained a lot of interest for the promising exploitations in biomedicine, in the food sector and in industrial fields. Photons injected in a diffusive medium undergo many scattering events due to refractive index mismatches at the micro and meso scale. Moreover, if light absorption is weak, like what happens in the so-called “therapeutic window” (600 to 1100 nm), where biological tissues are almost transparent to red and near infrared light, diffusing photons can easily be reemitted at the medium boundaries after having travelled deep in the tissue (e.g., >1 cm below skin in biological tissue in a reflectance configuration). The information carried by diffusing photons relates to the structural properties (linked to the scattering coefficient) and to the chemical properties (linked to the absorption coefficient) of the medium. For biomedical applications, the main chromophores of interest in the range between 600–850 nm are oxygenated and deoxygenated hemoglobin (O2Hb and HHb, respectively) [5]. For this reason, diffuse optical spectroscopy is a promising tool to assess brain and muscle oxygenation. In particular, functional near infrared spectroscopy (fNIRS) exploits the difference in absorption spectrum between HHb and O2Hb to recover their concentration over time, thus enabling the ability to see variation in haemodynamics, which can be a fingerprint of a brain activation thanks to the neurovascular coupling mechanism.
While the use of steady state light sources and detectors enables the so-called continuous wave (CW) approach to fNIRS, the time-resolved (TR) approach relies on the injection in the sample of short laser pulses (few tens of ps duration) and on the recording of the arrival time of re-emitted photons (distribution of time of flight, DTOF) at a given distance, the so-called source-detector distance (SDD). It has been demonstrated that the TR-technique provides a higher information content than CW, in particular when a single SDD is used [6]. Indeed, it is possible to recover the optical properties (absorption coefficient -μa- and reduced scattering coefficient -μs’), after fitting of the DTOF with a proper theoretical model [7]. Moreover, when using the TR technique in the so-called “reflectance geometry” (i.e., injection and collection put on the same side of the sample), the depth reached by photons is intrinsically encoded in their arrival time—the later the photon is re-emitted, the longer is its pathlength, thus increasing significantly the probability of the photon to have probed a deeper region [8]. It has also been demonstrated that the mean penetration depth of photons is independent of the SDD. For this reason, the null-SDD approach was proposed some years ago [9]. The use of short (or even null) SDD improves the confinement of photons, thus resulting in a higher spatial resolution and number of photons recorded, as well as a larger contrast at all times. To apply this approach, however, a fast-gated detector (i.e., a detector that can be turned on/off in a few hundred ps) is needed to prevent the detector saturation (or its damage). To meet this requirement, fast-gated (FG) single-photon avalanche diodes (SPADs) have been proposed in the literature [10,11]. The use of a FG-detector permits also the ability to reconstruct the DTOF with a larger dynamic range [12] and this great potentiality can be exploited if the laser source is powerful enough to increase the signal at late times, thus allowing the ability to probe deeper regions [13]. Additionally, the possibility to collect photons only at a given portion of the DTOF (by using a classical time-correlated single photon counting board or with simpler devices [14]) allows for the ability to increase the number of late photons, thus improving the visibility of possible deep inhomogeneities in the medium which affect the DTOF shape.
Different works based on FG-SPADs have been published, demonstrating experimentally that an improved spatial resolution, contrast and even chromophore quantification can be achieved using a gated detector [15,16,17]. However, to the best of our knowledge, the FG-SPAD detectors have never been adopted to demonstrate the improvement given by the use of short-SDD in fNIRS measurements. Indeed, the higher spatial resolution allows for the ability to retrieve more precisely the area wherein the activation occurs and the capability to collect photons in a given portion of the DTOF, improving the robustness of the detectability of a brain activation.
In this paper, we propose an instrument [18] based on a prototypal dual-channel (710 and 820 nm) high power (around 100 mW output for each channel) laser which allows for the ability to exploit at its best capacity the high-dynamic range acquisition technique. The laser light was spread over a sufficiently large area in order to guarantee skin safety by means of a spacer, while eye safety was guaranteed by means of the use of proper protection. Two state-of-the-art fast-gated SPAD modules (featuring a diffusion tail of about 90 ps [19]) were adopted to monitor both wavelengths, thus allowing for the recovery of the concentration of both O2Hb and HHB simultaneously. The proposed system was firstly characterized using some tests from two internationally-agreed protocols for performance assessment of TR-instrument/oximeter (such as the Instrument Response Function/IRF) from the “Basic Instrumental Protocol” (BIP) protocol [20], and contrast and contrast-to-noise ratio (CNR) from “nEUROPt” ones [21]). We then exploited the system for fNIRS measurements with the aim to demonstrate the improvement in terms of detectability of brain activation with respect to the classical oximetry instrument [22,23], simulating a free-running (i.e., not-gated) acquisition.

2. Materials and Methods

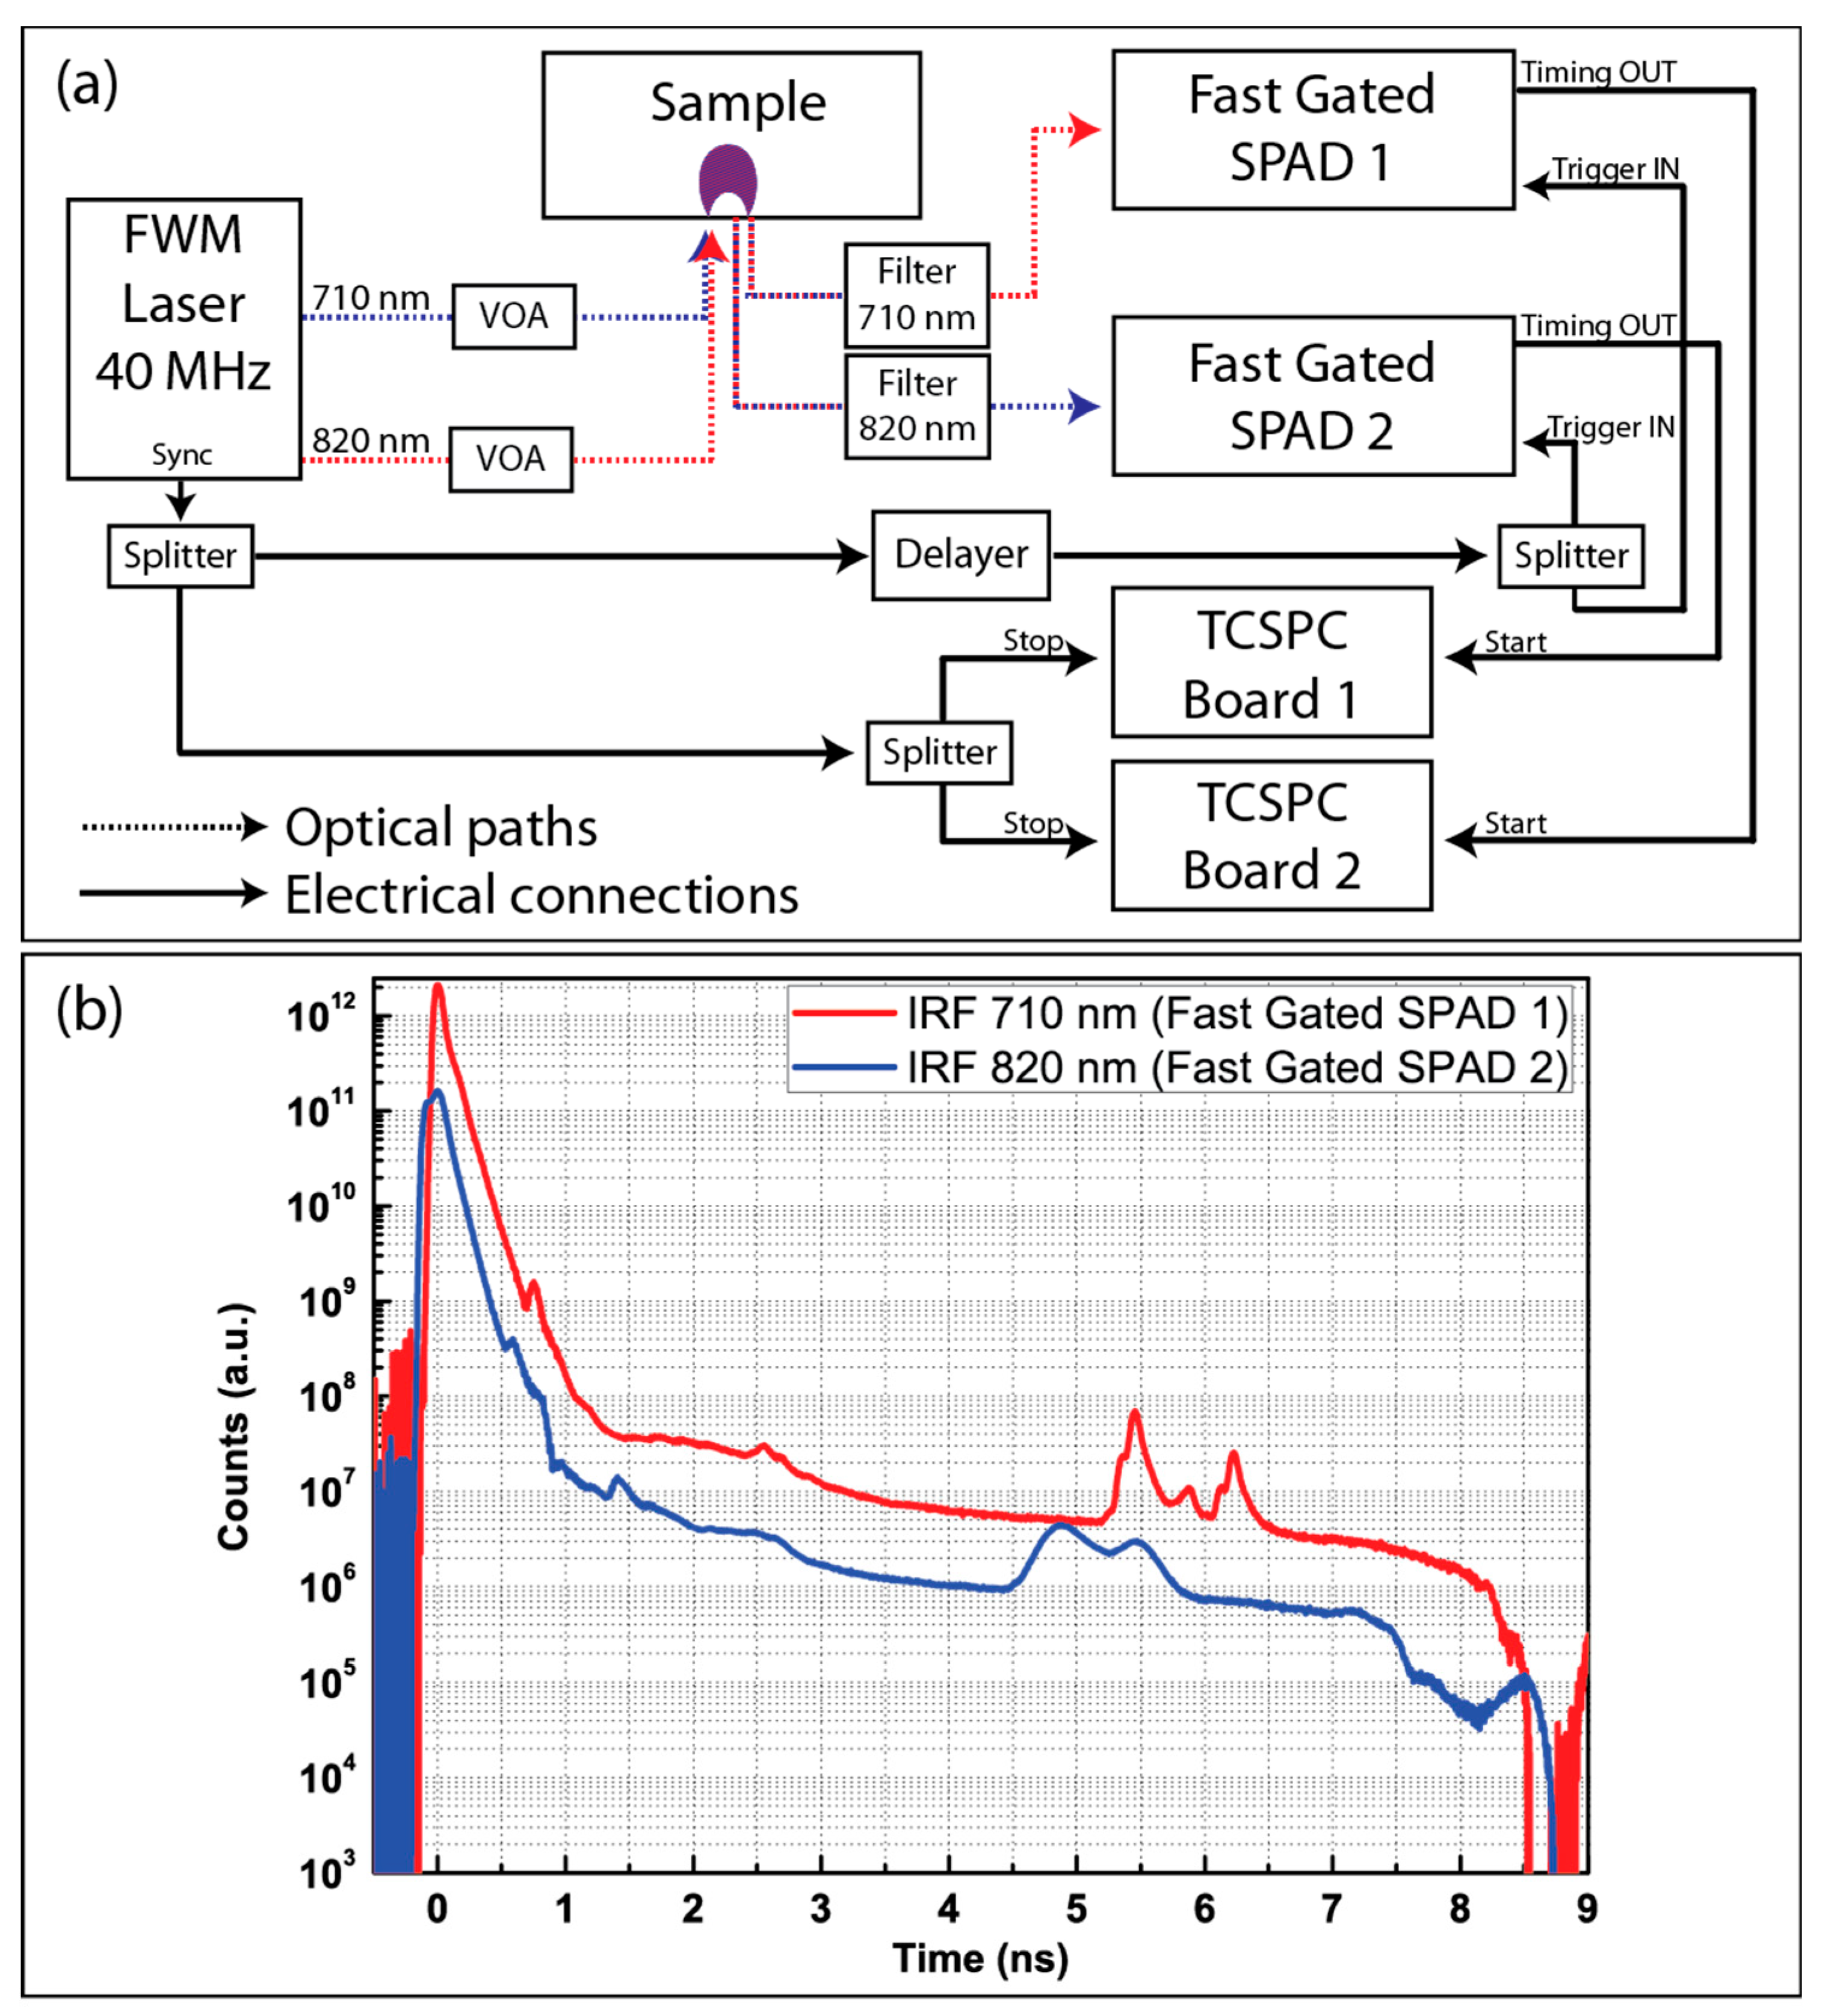
2.1. Experimental Setup

The setup used in the measurements is schematically depicted in Figure 1a. The laser source was a prototypal four-wave mixing laser (Fianium Ltd, Southampton, UK), providing two separate laser beams (710 and 820 nm) with a temporal duration of about 25 ps full width at half maximum (FWHM) at the repetition rate of 40 MHz. Each beam was properly attenuated by means of the variable optical attenuator (VOA, Edmund Optics Inc., Barrington, NJ, USA) and light was collimated into a 400 μm fiber by means of a collimator. Collimated beams were then injected into the sample and retro-diffused photons were collected through two 1 mm core fibers (with a NA of 0.37) at a given source-detector distance (5 or 30 mm).
In the in vivo measurements, it was fundamental to disentangle the contribution of the two wavelengths in order to recover the concentration of both oxygenated and deoxygenated hemoglobin. For this reason, an interferential filter (centered at 710 or 820 nm) was put at the other tip of each collection fiber. Such a solution allowed for the ability to separate the two beams and send each of them to a different fast-gated SPAD (FG-SPAD) module, thus having a parallel acquisition of the two wavelengths. The arrangement of the launching and detection fiber was conceived so as to probe the same area with both source-detector couples.
The FG-SPAD modules were state-of-the-art time-gated detectors, having an active area of 100 μm diameter and nearly 200 ps of raising edge for the gate opening. The full description of the FG-SPAD modules can be found in Boso et al. [10].
Concurrently with the optical pulse, the laser provided a synchronism signal, which was split into two paths. The former was fed to the FG-SPAD modules to trigger the enabling of the detector for a given period of time (5 ns). In order to acquire different “slices” of the DTOF, the detector was enabled at given delays with respect to the peak of the reflectance curve by means of a home-made delayer. It was a transmission-line based one, and it provided delays from 0 up to 6375 ps at a step of 25 ps.
On the other side, the second path of the split sync was sent to the time-correlated single photon counting (TCSPC) electronics, feeding the “stop” signal for both acquiring boards (SPC-130, Becker&Hickl GmbH, Berlin, Germany). The “start” signal for the TCSPC board was provided by each FG-SPAD module. Indeed, each module generated a pulse (timing OUT signal in Figure 1a) when a photon was detected within each SPAD, thus triggering an avalanche.

2.2. Performance Assessment

In order to impartially assess the performances of the proposed setup, we made use of some parameters of two internationally agreed protocols for diffuse optics instrumentation (the “Basic Instrumental Protocol” (BIP) [20] and “nEUROPt” [21] ones). Their aim is to characterize the TR setup for brain imaging.
For what concerns the BIP protocol, we acquired the IRF of the proposed setup at both wavelengths, coupling the launching and collection fiber with a diffusive medium (a thin film of TeflonTM) so as to excite all propagation modes of the detection fibers. In order to have a high-dynamic range measurement, we adopted the technique explained in Dalla Mora et al. and Tosi et al. [12,24], acquiring the re-emitted photons at different delays (from 0 up to 3450 ps at step of 25 ps) with an integration time of each delay of 10 s. Before rescaling the acquisitions and reconstructing the IRF, we subtracted the constant background (the so-called “dark count”, which is not correlated with laser light) to all curves. We finally computed the FWHM and the dynamic range of the reconstructed IRF, as suggested by the BIP protocol.
We then characterized the proposed setup at 820 nm using two features of the “nEUROPt” protocol (contrast and contrast-to-noise ratio (CNR)) since they are meant to define quantitatively the capability of detecting a small absorption change within the probed volume (e.g., absorption changes in the cortex due to brain activation).
For both tests, we made use of a liquid phantom composed of a mix of water, Intralipid 20%, and Indian ink in such a proportion to have an absorption coefficient (μa) of 0.1 cm−1 and a reduced scattering one of 10 cm−1 at 820 nm. In order to simulate the absorption changes related to a localized brain activation, we made use of solid black cylindrical inclusions (height: 4.5 mm; diameter: 5.32 mm). In Martelli et al. [25], the equivalence relation between a realistic absorption change in a finite volume and the perturbation produced by a small black object had been demonstrated. In our case, we performed all tests using the 100 mm3 totally absorbing inclusion (which corresponded to a Δμa of 0.15 cm−1 over a 1 cm3 volume). The inclusion was posed beneath the surface of the phantom and its position was moved from 2 up to 30 mm in depth (the distance between the centroid of the inclusion and the surface). For each depth, the time-resolved curve was acquired in difference slices, delaying the opening of the gate from 0 ns (situation where the first re-emitted photon was recorded) up to 3250 ps at step of 250 ps. The VOA was set in order to have nearly 1 Mcps for each delay (except for the latest where it was not possible to increase the injected power). For each delay, we acquired five repetitions (1 s each) of the distribution of time-of-flight of re-emitted photons.
We computed contrast and CNR according the definition given in Wabnitz et al. [21] and briefly summarized in the following section.
The contrast is a primary assessment of the effect of variation in absorption coefficient. In the case of time-resolved reflectance measurements, often the analysis is performed using time-windows, meaning that the distribution of time-of-flight is subdivided into portions and contrast (as well as other features) and can be computed within those subdivisions of the curve. In case of the so-called “time-window” analysis, the contrast in each temporal window ( C ( t W ) ) was computed by the following equation:
C ( t w ) = N 0 ( t w ) N ( t w ) N 0 ( t w ) ,
where N 0 ( t w ) and N ( t w ) represent the overall number of counts computed in the time-window (tw) in the homogeneous or perturbed (e.g., when the inclusion mimicking the perturbation is inserted into the probed volume) state, respectively. In our case, each recorded curve was subdivided in time-windows of 500 ps in width. For the homogeneous acquisition, the inclusion was posed 30 mm aside from the source-detector couple, where its effect on the time-resolved curve was considered negligible.
The contrast-to-noise ratio affects the detection of a small variation in absorption coefficient. Indeed, CNR was defined in the case of “time-window” analysis as
CNR ( t w ) = N ( t w ) N 0 ( t w ) σ ( N 0 ( t w ) ) ,
where σ ( N 0 ( t w ) ) is the fluctuation of counts in the unperturbed state (i.e., the inclusion far from the source-detector couple) computed over different repetitions. Usually, this standard deviation is mostly due to photonic noise, but also instrumental fluctuations (such as laser instability) can affect this value.
Both contrast and CNR were computed with and without the exploitation of the FG technique. Indeed, when analyzing the “non-gated” data, we used the measurements where the gate was opened before the first re-emitted photons were detected, and closed when the last ones were collected, thus mimicking the acquisitions obtained with a “classical” single-photon detector operating in the so-called “free-running” mode. On the other hand, for “gated” results, we analyzed the curve acquired enabling the FG-SPAD module with a given delay with respect to the peak of the reflectance curve.
Contrast and CNR were computed using the same portion of the curve (the same time-window defined with respect to the peak of the IRF). In this way the photons analyzed had reached the same mean depth (which was encoded in time for time-resolved measurements), thus leading to a fair comparison between the “gated” and “non-gated” technique.

2.3. In Vivo Measurements

Preliminary in vivo experiments were performed in order to test the performance of the system in a real case. Different finger-tapping experiments were performed to check system sensitivity in functional studies of the brain. Two healthy volunteers were recruited from the lab and informed consent was obtained (Subject one: male, 30 years old. Subject two: male, 43 years old). The competent ethics committee authorized the study.
The optical probe was placed over the left motor area and it was centered (according to the international 10–20 system for the Electro Encephalography -EEG- (electrode placement) at the C3 point. The measurement protocol was composed of 20 s of baseline, 20 s of motor task (finger opposition at a frequency rate as high as possible) and 20 s of recovery. This sequence was repeated five times with the right hand (controlateral hand) and five times with the left hand (ipsilateral hand). The entire protocol was repeated four times for each subject—using a short source-detector separation (ρ = 6 mm for both subjects) with and without the gating approach and using a long source-detector separation (ρ = 20 mm for subject 1 and ρ = 30 mm for subject 2) with and without the gating approach. The short source-detector separation distance was limited to 6 mm because of the size of the fiber terminator at the probe side, while the long source-detector separation was chosen in order to guarantee a photon count as closer as possible to 1 Mcps. The same criterion was followed for the choice of the applied gating. Measurements were performed in a dimmed room to decrease the amount of background light.
In all the measurements, reemitted photons at both wavelengths were collected together with an integration time of 1 s. The photon time of flight distributions were divided into 25 time windows of 500 ps each. For each time window, we estimated the value of the quantity Δμavt at both the wavelengths [24], where Δμa is the variation of the absorption coefficient in the activated brain cortex, while v is the speed of light in the medium and t, the time spent by photons in the activated brain cortex. From this quantity at both wavelengths, we derived the changes in the amount of oxygenated hemoglobin (ΔO2Hb) and deoxygenated hemoglobin (ΔHHb), expressed in an arbitrary unit in the activated brain cortex. As mentioned in the phantom measurements section, we used the same time window for both gated and non-gated experiments in order to consider photons investigating the same depth. From the ΔO2Hb and ΔHHb curves, we can estimate contrast and CNR of the changes in the hemoglobin species with respect to the baseline.

3. Results and Discussion

3.1. Characterization of the Setup (Phantom Measurements)

Figure 1b represents the IRF of the proposed setup for the two channels. For both wavelengths the dynamic range was about 5.5 decades, while the computed FWHM was about 120 and 180 ps, respectively, for 710 and 820 nm. Some reflections were visible at 5.5 ns or 4.8 ns after the main peak (depending on the wavelength). Those reflections were most probably due to a second order of Fresnel reflections at the tip of the fibers. When conceiving the setup, the fibers’ length was chosen in order to delay reflections at least some ns from the peak. Indeed, reflections did not represent a problem for the measurements, since they were quite late and several decades (about 4.5) under the main peak. Other small reflections presented at a shorter time were not significant since their amplitude was small enough to not distort the curve or saturate the dynamic range of the gated measurements.
Figure 2 reports the contrast and CNR computed at both the 5 and 30 mm source-detector distance (first and second row respectively) in the case of the fast-gating technique being applied (“gated”, blue curve) or not (“non-gated”, red lines). For all features, the time-window used for the analysis was opened 3 ns after the peak of the IRF (i.e., 3 ns after the injection of the light in the sample).
When a 5 mm source-detector distance was used, the fast-gating technique was fundamental to retrieve information about a buried perturbation. Indeed, the contrast recorded at 5 mm source-detector distance in the non-gated mode was low and very noisy, while, for the gated acquisitions, the contrast was much higher and its standard deviation (computed on the several repetitions) was nearly negligible. The improvement given by the fast-gating technique was clearly noticeable also in the CNR graph. Indeed, the curve relative to the gated acquisition was always higher than 10, even at the deepest position of the inclusion. On the other hand, the CNR for the non-gated acquisition was always less than 10 and, in most cases, also smaller than 1, meaning that the contrast was more sensitive to the noise of the measurements (e.g., photonic noise) than to the presence of an inclusion.
As predicted by the theory [9,26], the improvement given by the fast-gating technique was fundamental when using a small interfiber distance. Indeed, when the distance between the launching and detection fiber was shortened, a huge increase of the scarcely diffused photons (the so-called “early photons”) was experienced. If a non-gated detector was used, this peak of “early photons” caused the saturation of its dynamic range, thus limiting the number of late photons detected and lowering the capability to discriminate a perturbation in depth.
The improvements given by the use of a fast-gated acquisition was less evident if a larger SDD was used, as it was clearly noticeable from curves reported in the last row of Figure 2. Indeed, the contrast obtained exploiting the fast-gating technique was slightly higher than what was achievable in the “non-gated” situation. The CNR graph clearly shows that in the gated mode there was a constant improvement of about a factor of 4.
This was mostly because, when using the fast-gating technique, we recorded photons enabling the FG-SPAD module with a delay of 2.25 ns with respect to what was done in the non-gated mode, thus rejecting the first part of the time-resolved curve. The delay was chosen in order to exploit the dynamic range of the detector with the latest possible delay. Since we collected the same number of photons (nearly 106 per acquisition) for both gated and not gated acquisition, it was obvious that in the former case there was a boost in the number of late photons detected, thus increasing the number of counts recorded in the region of the time-window used for analysis. This resulted in a decrease of the noise (which was also visible from the errorbar in the contrast graph) and in an increase of the CNR in the case of gated measurements.
Considering as a conservative threshold the 0.05 contrast and a CNR higher than 10, using the gated technique we could detect the inclusion until 2.6 cm and 3 cm in depth, with 5 and 30 mm source-detector distance, respectively.
This conclusion is in contrast with theoretical findings predicting a contrast that is always higher when using a small source-detector distance [26]. Such a disagreement can be due to both the effect of the “diffusion tail” of the detector and to the so-called “memory effect”.
The former effect [19] is due to the non-perfectly efficient time-gating mechanism that causes a “leakage” of early photons in a temporal region of the curve where only the contribution of late photons are expected. This effect is as high as the source-detector distance decreases, since the peak of early photons increases. On the other side, the memory effect [27] causes a boost in the background level at longer delays that can hide the late photons, thus decreasing the maximum contrast achievable. Since the memory effect is proportional to the number of photons impinging on the detector when it is in the OFF state, its consequences are more evident when using a small source-detector distance.

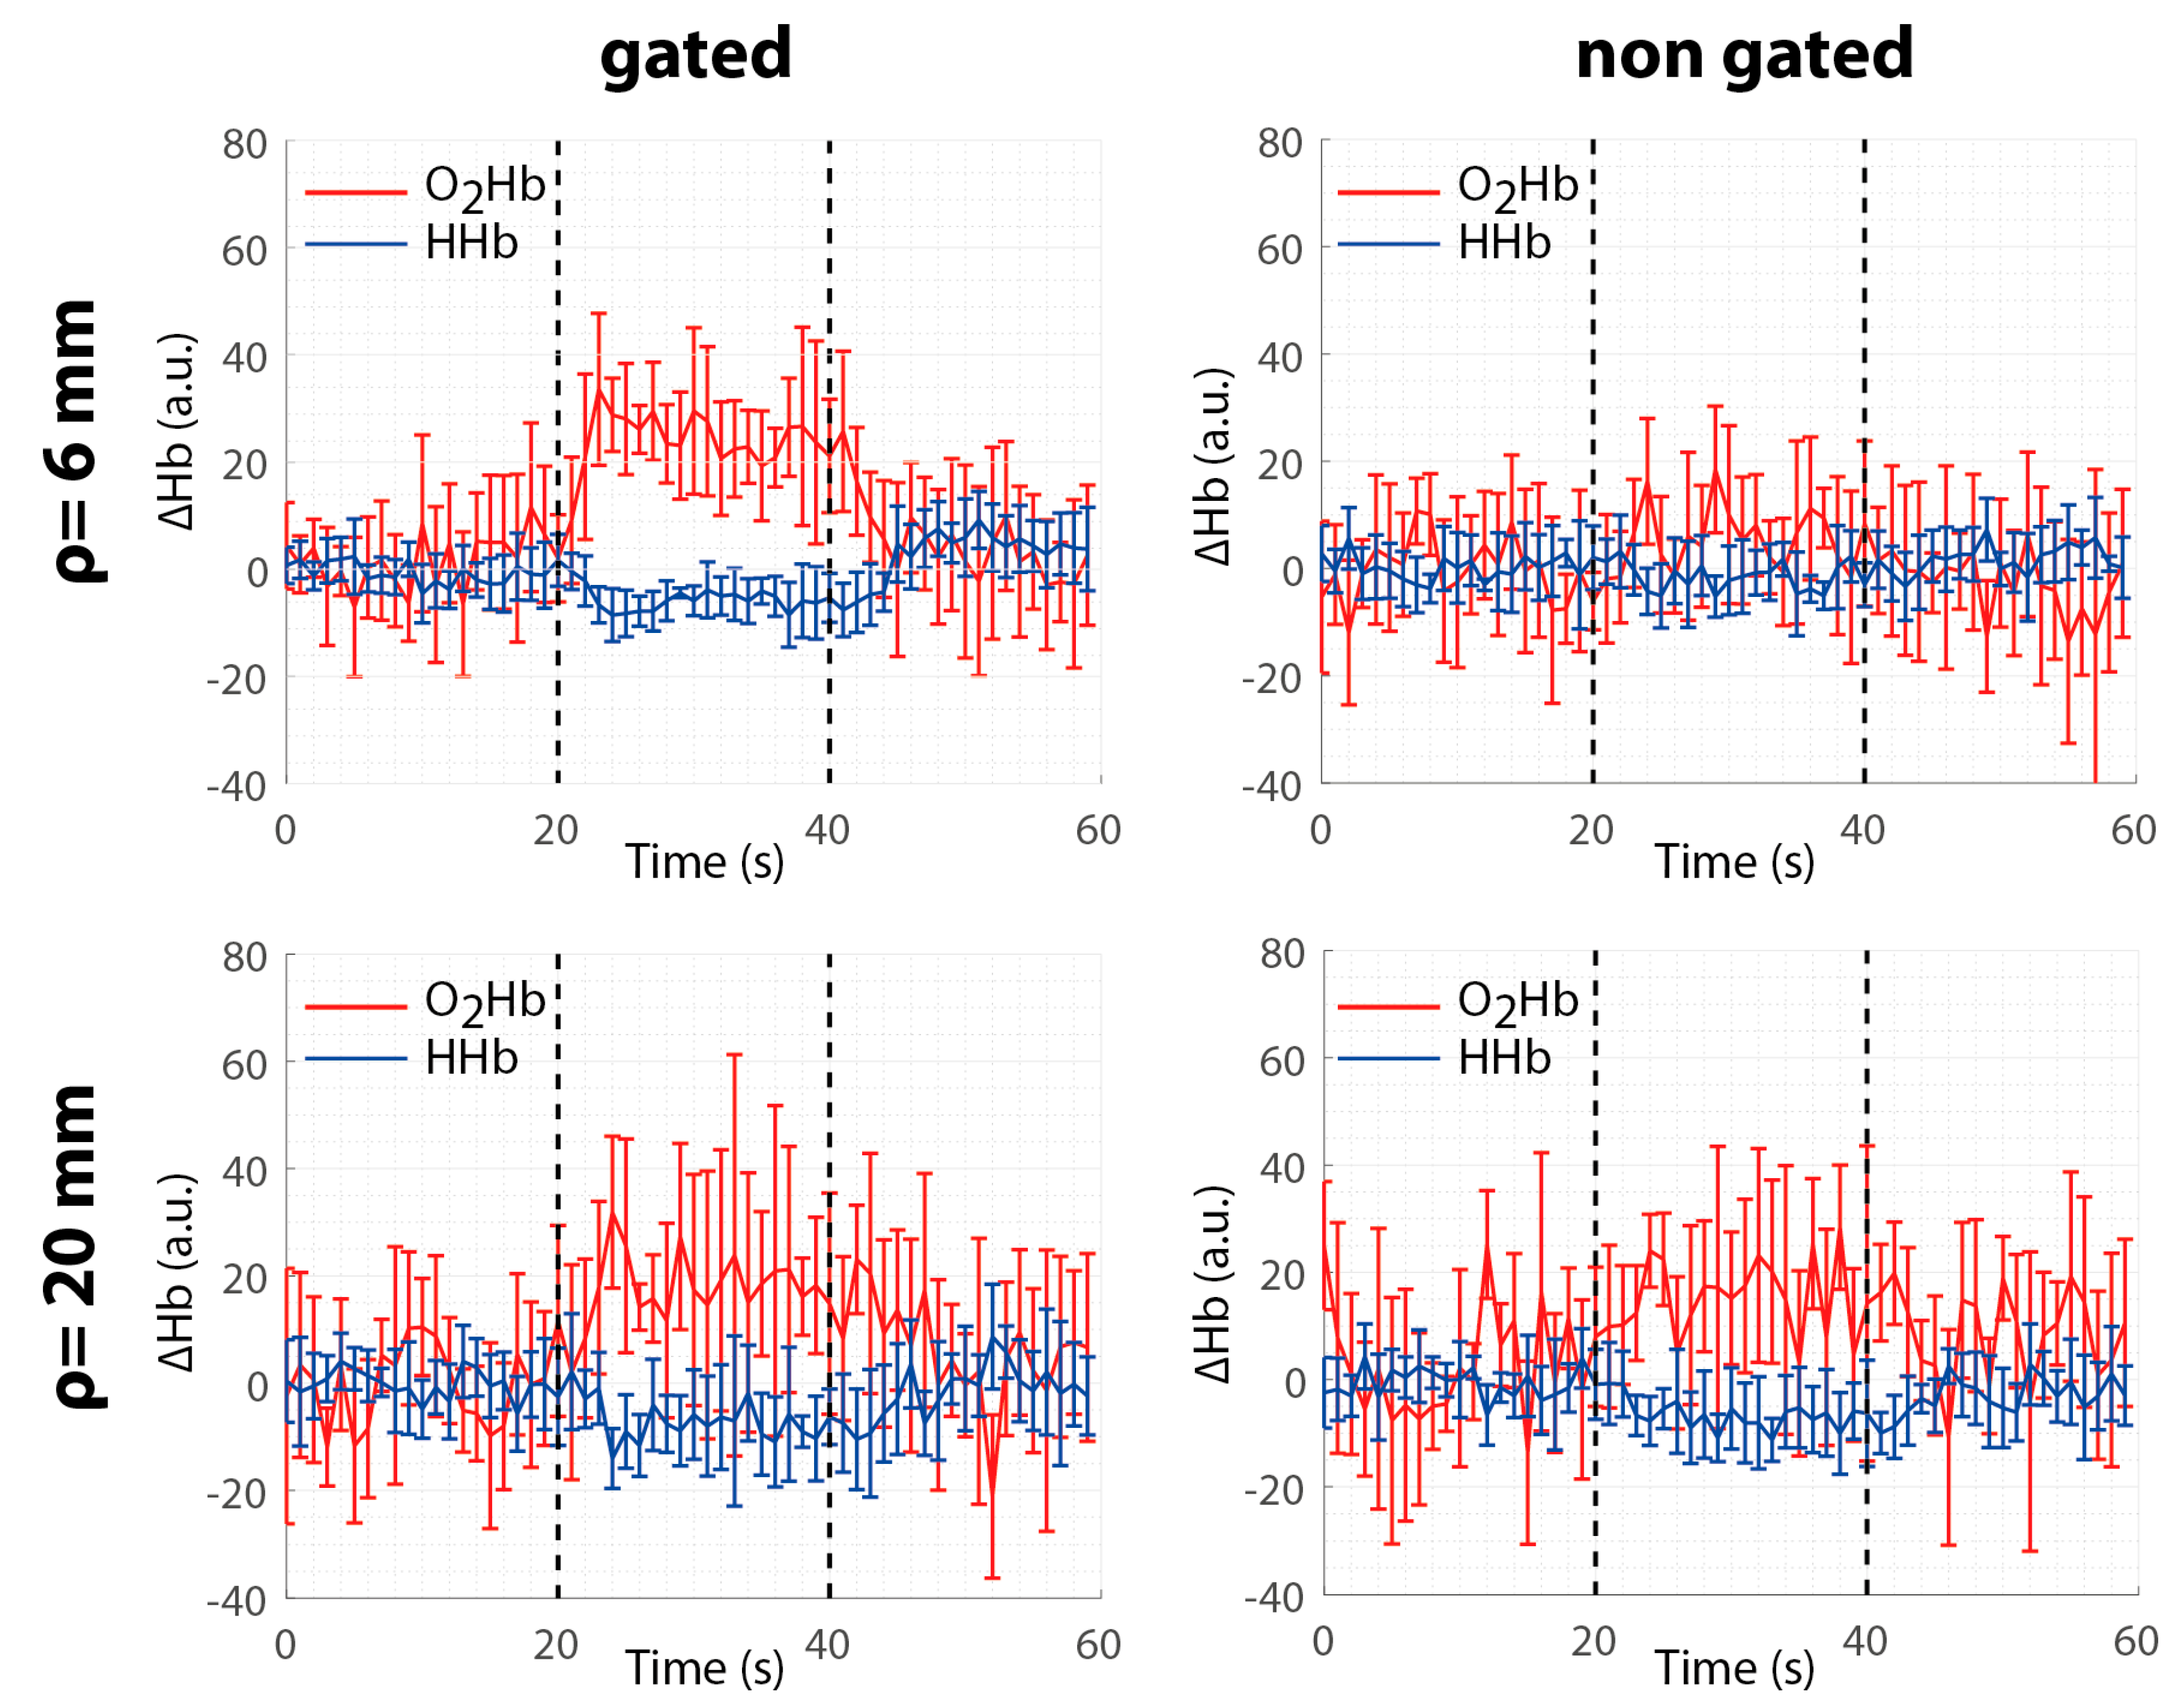
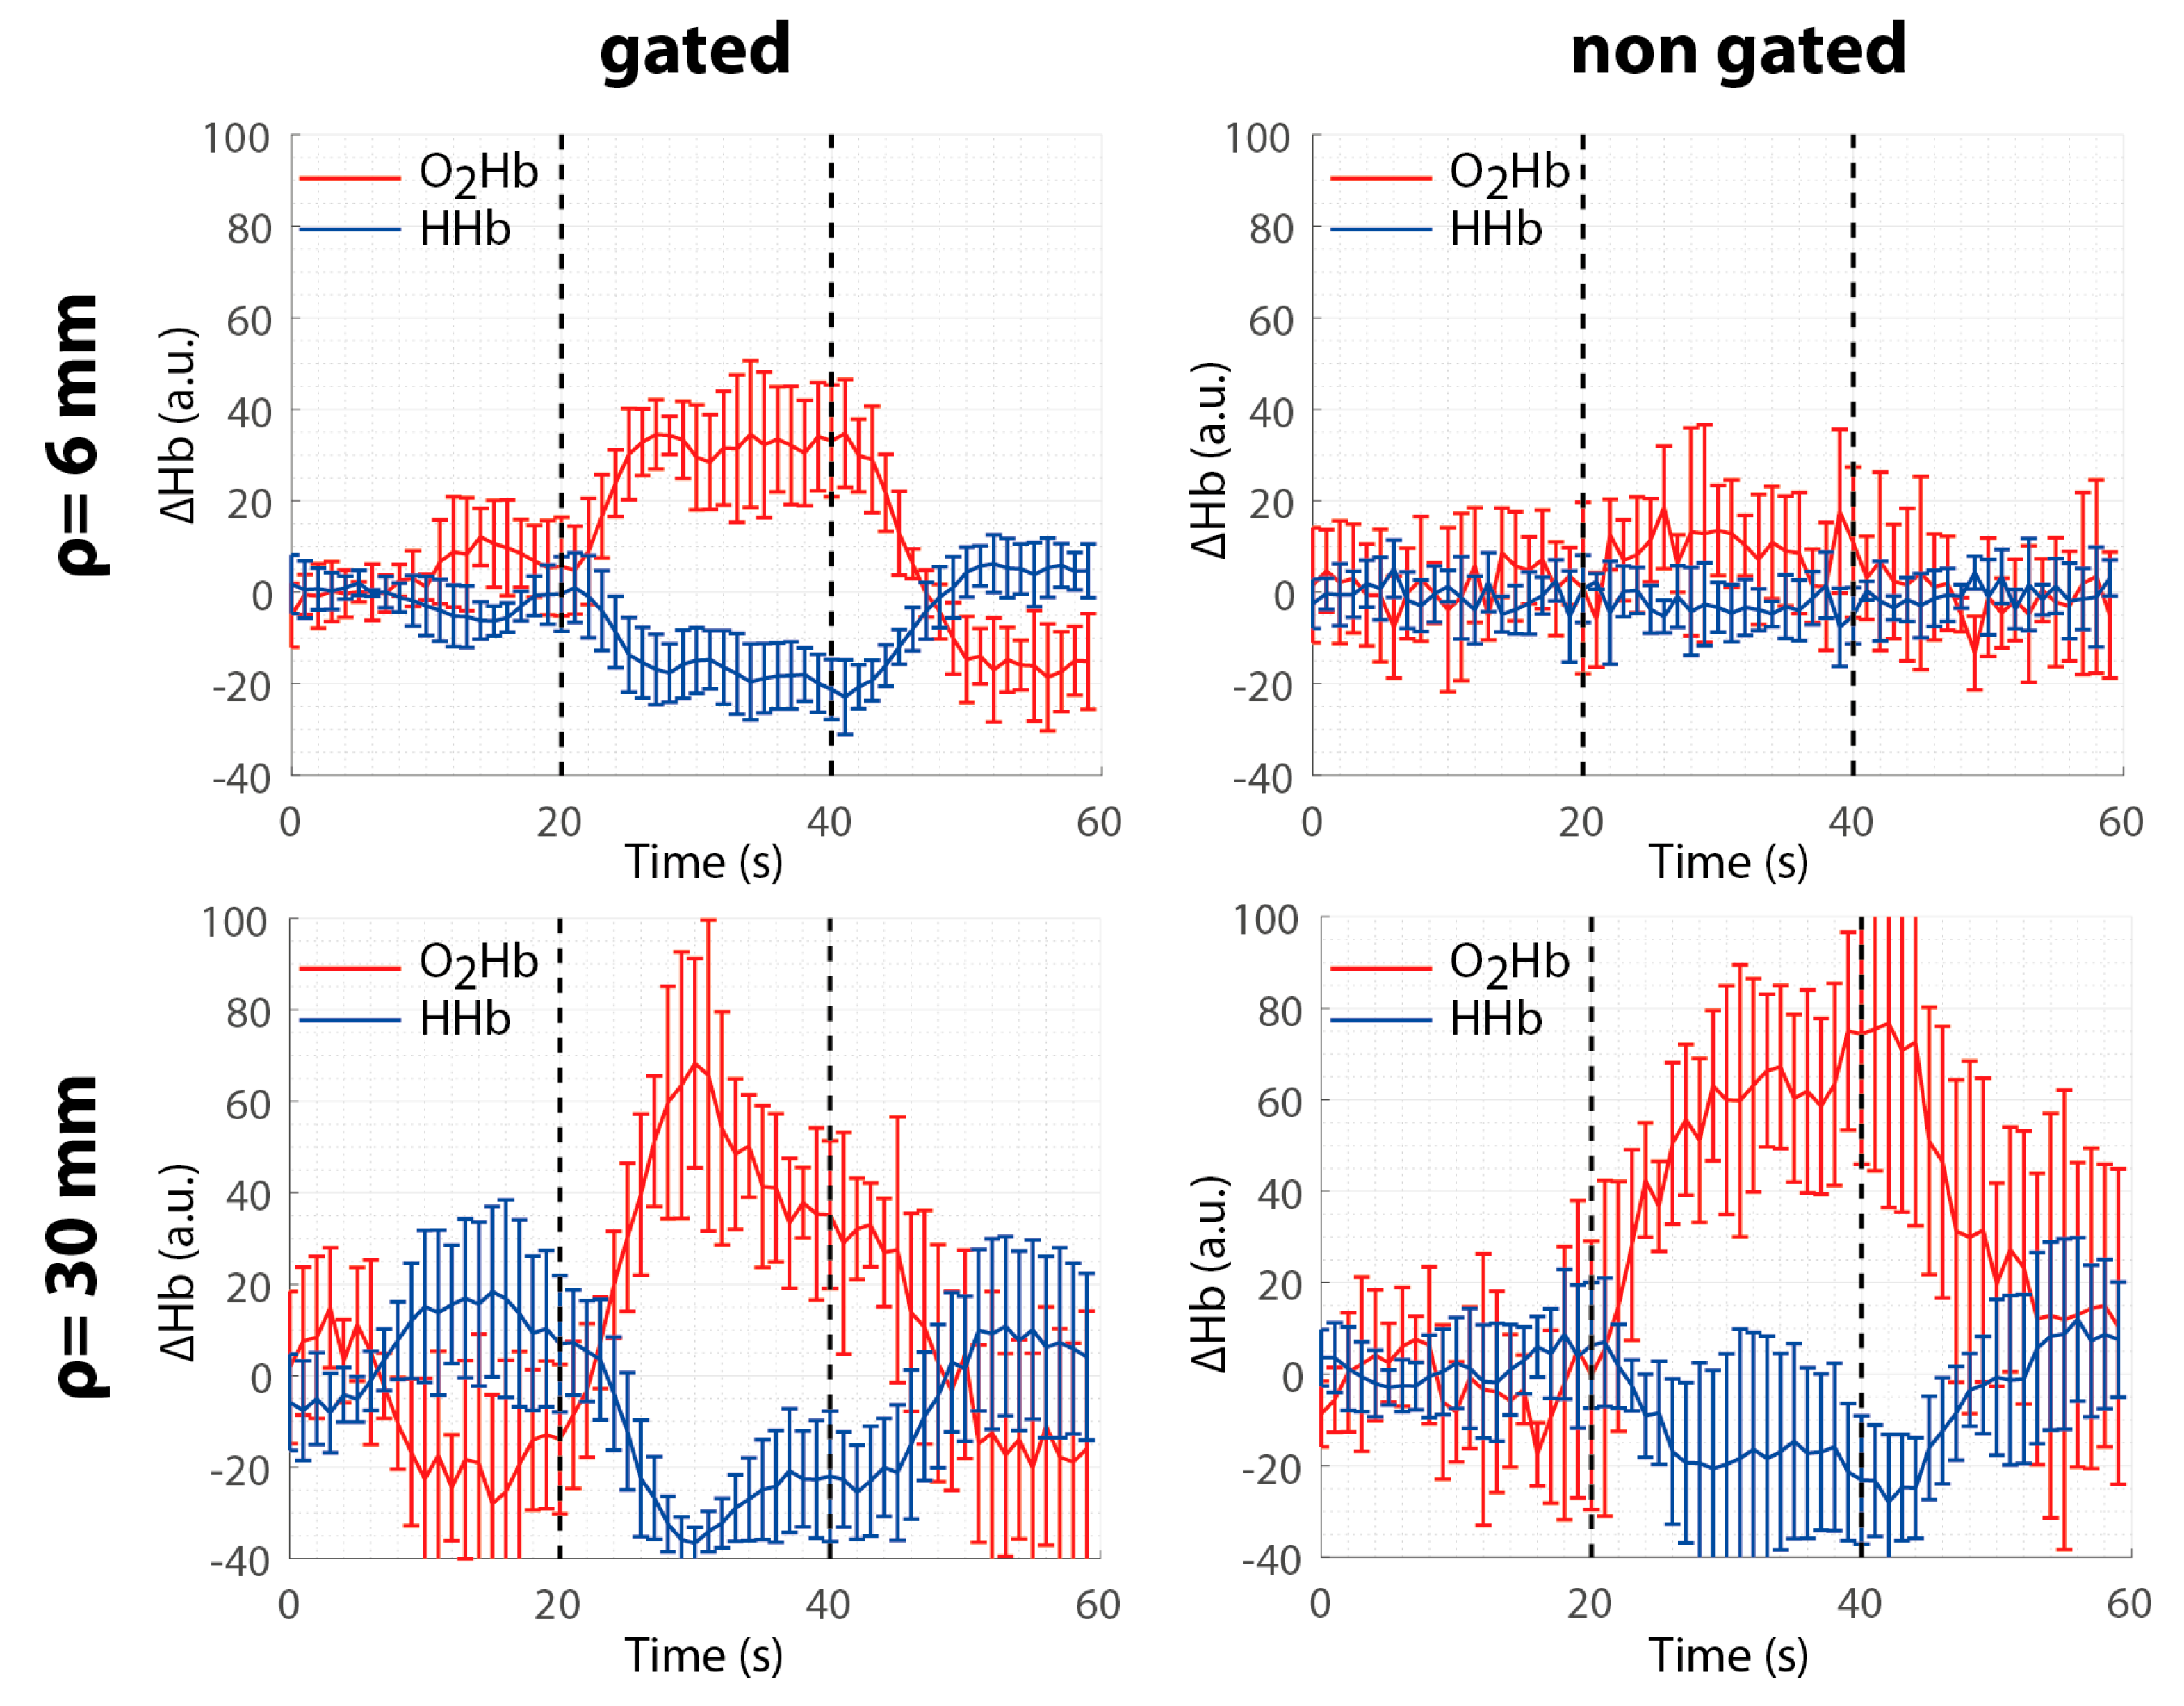
3.2. In Vivo Measurements

Table 1 represents the summary of the in vivo experiments. Only data regarding the finger tapping with the contralateral hand were proposed because of the absence of any activation during finger tapping with the ipsilateral hand due to the lateralization of the motor area. For measurements at short SDD, contrast and CNR are higher for gated measurements, confirming that the time gated approach is necessary in order to perform time resolved functional measurements at short SDD. For long SDD measurements, this finding was not confirmed. In fact, only for subject 1 and for HHb in subject 2 did we have a slight improvement in contrast and CNR.
Figure 3 and Figure 4 show the changes in hemoglobin species (Hb) concentrations averaged over the five repetitions of finger tapping with the contralateral hand for subject 1 and 2, respectively. Error bars represent the standard deviation over the five repetitions. Normally, brain activation is identified by a task related increase in O2Hb concentration and a corresponding decrease in HHb. We can clearly see this pattern in the gated column of both Figure 3 and Figure 4, demonstrating the capability of a time gated system in performing functional measurements independently of the SDD, while in the non-gated approach this trend can be recognized only for long SDD.

4. Conclusions

The double-wavelength time-gated system proposed can perform measurements at SDD of few millimeters, showing the improvements theoretically predicted—increased contrast and CNR as highlighted by phantom and in vivo tests. Furthermore, the simultaneous acquisition of photon counts in a temporal window at two wavelengths allowed for the estimation of the changes in O2Hb and HHb concentration during brain activation. The use of time gating—necessary for short SDD—however, can be useful also for long SDD measurements. In fact, as demonstrated with phantom measurements, CNR for an absorption perturbation was always higher in time gated measurements. This was true because, in the presence of enough laser power, time gating allowed the exploitation of the entire dynamic range of the acquisition chain of the system to collect more late photons—which brought about information about the deeper structure in the medium—than without time gating. This last aspect was demonstrated with phantom measurements, but not completely with in vivo measurements. It is noteworthy that the in vivo measurements at different gates and at different distances were performed at different times; it is therefore plausible that their comparison is not completely reliable because of the intrinsic variability of the brain activation.

Author Contributions

Conceptualization, A.D.M., A.T., L.S., A.P. and D.C.; data curation, L.D.S., A.D.M. and D.C.; formal analysis, L.D.S., A.T., L.S., R.R. and D.C.; validation, L.D.S., A.D.M., A.T., L.S., A.P. and D.C.; writing—original draft, L.D.S., A.D.M., A.T., L.S., A.P. and D.C.; writing—review and editing, L.D.S., A.D.M., A.T., L.S., R.R., A.P. and D.C.

Funding

This research was partially supported from the EU project nEUROPt (grant agreement 201076).

Conflicts of Interest

The authors declare no conflict of interest.

References

  1. Yodh, A.; Chance, B. Spectroscopy and imaging with diffusing light. Phys. Today 1995, 48, 34–41. [Google Scholar] [CrossRef]
  2. Wolf, M.; Ferrari, M.; Quaresima, V. Progress of near-infrared spectroscopy and topography for brain and muscle clinical applications. J. Biomed. Opt. 2007, 12, 062104. [Google Scholar] [CrossRef] [PubMed]
  3. Durduran, T.; Choe, R.; Baker, W.B.; Yodh, A.G. Diffuse optics for tissue monitoring and tomography. Rep. Prog. Phys. 2010, 73, 076701. [Google Scholar] [CrossRef] [PubMed]
  4. Bellincontro, A.; Taticchi, A.; Servili, M.; Esposto, S.; Farinelli, D.; Mencarelli, F. Feasible Application of a Portable NIR-AOTF Tool for On-Field Prediction of Phenolic Compounds during the Ripening of Olives for Oil Production. J. Agric. Food Chem. 2012, 60, 2665–2673. [Google Scholar] [CrossRef] [PubMed]
  5. Scholkmann, F.; Kleiser, S.; Metz, A.J.; Zimmermann, R.; Pavia, J.M.; Wolf, U.; Wolf, M. A review on continuous wave functional near-infrared spectroscopy and imaging instrumentation and methodology. Neuroimage 2014, 85, 6–27. [Google Scholar] [CrossRef] [PubMed]
  6. Torricelli, A.; Contini, D.; Pifferi, A.; Caffini, M.; Re, R.; Zucchelli, L.; Spinelli, L. Time domain functional NIRS imaging for human brain mapping. Neuroimage 2014, 85, 28–50. [Google Scholar] [CrossRef] [PubMed]
  7. Martelli, F.; del Bianco, S.; Ismaelli, A.; Zaccanti, G. Light Propagation through Biological Tissue and Other Diffusive Media: Theory, Solutions, and Software; SPIE: Bellingham, WA, USA, 2009. [Google Scholar]
  8. Martelli, F.; Binzoni, T.; Pifferi, A.; Spinelli, L.; Farina, A.; Torricelli, A. There’s plenty of light at the bottom: Statistics of photon penetration depth in random media. Sci. Rep. 2016, 6, 27057. [Google Scholar] [CrossRef]
  9. Pifferi, A.; Torricelli, A.; Spinelli, L.; Contini, D.; Cubeddu, R.; Martelli, F.; Zaccanti, G.; Tosi, A.; Dalla Mora, A.; Zappa, F.; et al. Time-Resolved Diffuse Reflectance Using Small Source-Detector Separation and Fast Single-Photon Gating. Phys. Rev. Lett. 2008, 100, 138101. [Google Scholar] [CrossRef]
  10. Boso, G.; Dalla Mora, A.; della Frera, A.; Tosi, A. Fast-gating of single-photon avalanche diodes with 200 ps transitions and 30 ps timing jitter. Sens. Actuators A Phys. 2013, 191, 61–67. [Google Scholar] [CrossRef]
  11. Saha, S.; Lu, Y.; Weyers, S.; Sawan, M.; Lesage, F. Compact Fast Optode-Based Probe for Single-Photon Counting Applications. IEEE Photonics Technol. Lett. 2018, 30, 1515–1518. [Google Scholar] [CrossRef]
  12. Dalla Mora, A.; Tosi, A.; Zappa, F.; Cova, S.; Contini, D.; Pifferi, A.; Spinelli, L.; Torricelli, A.; Cubeddu, R. Fast-gated single-photon avalanche diode for wide dynamic range near infrared spectroscopy. Sel. Top. Quantum Electron. 2010, 16, 1023–1030. [Google Scholar] [CrossRef]
  13. Behera, A.; di Sieno, L.; Pifferi, A.; Martelli, F.; Dalla Mora, A. Instrumental, optical and geometrical parameters affecting time-gated diffuse optical measurements: A systematic study. Biomed. Opt. Express 2018, 9, 5524–5542. [Google Scholar] [CrossRef] [PubMed]
  14. Di Sieno, L.; Dalla Mora, A.; Boso, G.; Tosi, A.; Pifferi, A.; Cubeddu, R.; Contini, D. Diffuse optics using a dual window fast-gated counter. Appl. Opt. 2014, 53, 7394–7401. [Google Scholar] [CrossRef] [PubMed]
  15. Puszka, A.; di Sieno, L.; Dalla Mora, A.; Pifferi, A.; Contini, D.; Planat-Chrétien, A.; Koenig, A.; Boso, G.; Tosi, A.; Hervé, L.; et al. Spatial resolution in depth for time-resolved diffuse optical tomography using short source-detector separations. Biomed. Opt. Express 2015, 6, 1–10. [Google Scholar] [CrossRef] [PubMed]
  16. Zouaoui, J.; di Sieno, L.; Hervé, L.; Pifferi, A.; Farina, A.; Dalla Mora, A.; Derouard, J.; Dinten, J.-M. Quantification in time-domain diffuse optical tomography using Mellin-Laplace transforms. Biomed. Opt. Express 2016, 7, 4346–4363. [Google Scholar] [CrossRef] [PubMed] [Green Version]
  17. Di Sieno, L.; Wabnitz, H.; Pifferi, A.; Mazurenka, M.; Hoshi, Y.; Dalla Mora, A.; Contini, D.; Boso, G.; Becker, W.; Martelli, F.; et al. Characterization of a time-resolved non-contact scanning diffuse optical imaging system exploiting fast-gated single-photon avalanche diode detection. Rev. Sci. Instrum. 2016, 87, 035118. [Google Scholar] [CrossRef] [PubMed] [Green Version]
  18. Di Sieno, L.; Contini, D.; Dalla Mora, A.; Torricelli, A.; Spinelli, L.; Cubeddu, R.; Tosi, A.; Boso, G.; Pifferi, A. Functional near-infrared spectroscopy at small source-detector distance by means of high dynamic-range fast-gated SPAD acquisitions: First in-vivo measurements. Proc. SPIE 2013, 880402–880406. [Google Scholar]
  19. Contini, D.; Dalla Mora, A.; Spinelli, L.; Farina, A.; Torricelli, A.; Cubeddu, R.; Martelli, F.; Zaccanti, G.; Tosi, A.; Boso, G.; et al. Effects of time-gated detection in diffuse optical imaging at short source-detector separation. J. Phys. D Appl. Phys. 2015, 48, 45401. [Google Scholar] [CrossRef] [Green Version]
  20. Wabnitz, H.; Taubert, D.R.; Mazurenka, M.; Steinkellner, O.; Jelzow, A.; Macdonald, R.; Milej, D.; Sawosz, P.; Kacprzak, M.; Liebert, A.; et al. Performance assessment of time-domain optical brain imagers, part 1: Basic instrumental performance protocol. J. Biomed. Opt. 2014, 19, 86010. [Google Scholar] [CrossRef] [PubMed]
  21. Wabnitz, H.; Jelzow, A.; Mazurenka, M.; Steinkellner, O.; Macdonald, R.; Milej, D.; Zolek, N.; Kacprzak, M.; Sawosz, P.; Maniewski, R.; et al. Performance assessment of time-domain optical brain imagers, part 2: nEUROPt protocol. J. Biomed. Opt. 2014, 19, 86012. [Google Scholar] [CrossRef] [PubMed]
  22. Kirilina, E.; Jelzow, A.; Heine, A.; Niessing, M.; Wabnitz, H.; Brühl, R.; Ittermann, B.; Jacobs, A.M.; Tachtsidis, I. The physiological origin of task-evoked systemic artefacts in functional near infrared spectroscopy. Neuroimage 2012, 61, 70–81. [Google Scholar] [CrossRef] [PubMed] [Green Version]
  23. Gerega, A.; Milej, D.; Weigl, W.; Kacprzak, M.; Liebert, A. Multiwavelength time-resolved near-infrared spectroscopy of the adult head: Assessment of intracerebral and extracerebral absorption changes. Biomed. Opt. Express 2018, 9, 2974–2993. [Google Scholar] [CrossRef] [PubMed]
  24. Tosi, A.; Dalla Mora, A.; Zappa, F.; Gulinatti, A.; Contini, D.; Pifferi, A.; Spinelli, L.; Torricelli, A.; Cubeddu, R. Fast-gated single-photon counting technique widens dynamic range and speeds up acquisition time in time-resolved measurements. Opt. Express 2011, 19, 10735–10746. [Google Scholar] [CrossRef] [PubMed]
  25. Martelli, F.; Pifferi, A.; Contini, D.; Spinelli, L.; Torricelli, A.; Wabnitz, H.; Macdonald, R.; Sassaroli, A.; Zaccanti, G. Phantoms for diffuse optical imaging based on totally absorbing objects, part 1: Basic concepts. J. Biomed. Opt. 2013, 18, 066014. [Google Scholar] [CrossRef] [PubMed]
  26. Torricelli, A.; Pifferi, A.; Spinelli, L.; Cubeddu, R.; Martelli, F.; del Bianco, S.; Zaccanti, G. Time-Resolved Reflectance at Null Source-Detector Separation: Improving Contrast and Resolution in Diffuse Optical Imaging. Phys. Rev. Lett. 2005, 95, 078101. [Google Scholar] [CrossRef] [PubMed]
  27. Dalla Mora, A.; Tosi, A.; Contini, D.; di Sieno, L.; Boso, G.; Villa, F.; Pifferi, A. Memory effect in silicon time-gated single-photon avalanche diodes. J. Appl. Phys. 2015, 117, 114501. [Google Scholar] [CrossRef] [Green Version]
Figure 1. (a) Schematics of the setup used for the in vivo experiment. (b) Instrumental response function recorded for both fast-gated single-photon avalanche diode (SPAD) modules at their operating wavelengths (710 nm for fast-gated SPAD (FG-SPAD) 1—red line; and 820 nm for FG-SPAD 2—blue line). Time bin size: 3.05 ps. IRF = instrument response function, VOA = variable optical attenuator, TCSPC = time-correlated single photon counting. FWM: Four Wave Mixing.
Applsci 09 02366 g001
Figure 2. Contrast (left column) and contrast-to-noise ratio (CNR) (right column) computed at two different source-detector distances (5 mm, top row; 30 mm, bottom row) with and without the exploitation of the fast-gating technique (blue and red curves, respectively).
Applsci 09 02366 g002
Figure 3. In vivo measurements of subject 1. Changes in O2Hb (red) and HHb (blue) averaged over the five repetitions of finger tapping with the contralateral hand for the gated and non-gated approach (left and right column, respectively) at the short and long distance (upper and bottom lines, respectively). Error bars represent the standard deviation over the five repetitions.
Applsci 09 02366 g003
Figure 4. In vivo measurements of subject 2. Changes in O2Hb (red) and HHb (blue) averaged over the five repetitions of finger tapping with the contralateral hand for the gated and non-gated approach (left and right column, respectively) at the short and long distance (upper and bottom lines, respectively). Error bars represent the standard deviation over the five repetitions.
Applsci 09 02366 g004
Table 1. Summary of the in vivo measurements—finger tapping with the controlateral hand. Error for contrast and CNR is the standard deviation over the 5 finger tapping task repetitions. SDD = source-detector distance, O2Hb = oxygenated hemoglobin, HHb = deoxygenated hemoglobin.
SubjectSDDGatedTime WindowContrast O2HbCNR O2HbContrast HHbCNR HHb
Subject 16 mmYes2.5–3 ns21.9 ± 4.42.1 ± 0.64.5 ± 2.81.1 ± 0.7
Subject 16 mmNo2.5–3 ns5.1 ± 4.70.4 ± 0.41.7 ± 0.50.3 ± 0.1
Subject 26 mmYes3–3.5 ns23 ± 6.33.7 ± 2.511.2 ± 6.23.2 ± 3.2
Subject 26 mmNo3–3.5 ns6.9 ± 6.50.6 ± 0.51.7 ± 30.3 ± 0.5
Subject 120 mmYes2.5–3 ns18.1 ± 71.3 ± 0.76.3 ± 3.91 ± 0.7
Subject 120 mmNo2.5–3 ns12.4 ± 30.7 ± 0.25.4 ± 10.7 ± 0.2
Subject 230 mmYes4.5–5 ns44.8 ± 14.72.6 ± 1.225.4 ± 4.92.5 ± 1.1
Subject 230 mmNo4.5–5 ns50.2 ± 13.63.6 ± 1.113.5 ± 16.82.3 ± 3.2

