1. Introduction
Compared with the general population, people with physical disabilities have significantly diminished ability to perceive the environment, and are therefore at higher risk of missing warning signs of imminent fire or explosion, resulting in a lower chance to escape. This poses a serious threat when they use mobility scooters (motorized wheelchairs). With the scooter frames becoming smaller, lighter, and more convenient in recent years, various types of foldable mobility scooters have emerged. Along with this trend, conventional lead-acid batteries have been increasingly replaced by lithium-ion batteries in a wide range of products. This implies that people with physical disabilities are constantly exposed to the risk of lithium battery fires and explosions [
1].
Against this background, this study was conducted to establish reliable test profiles for safety testing for lithium batteries used in mobility scooters by experimentally examining vibrations and mechanical shock while riding a mobility scooter.
As shown in
Figure 1, random vibrations and mechanical shock are test items for lithium-ion batteries as part of reliability testing for automobiles and motorcycles. However, they have not yet been developed as test items for mobility scooters. Therefore, we try to create a standard for lithium battery testing of electric wheelchairs, using vehicle and motorcycle standards, as shown in
Figure 2 [
2,
3].
In an effort to bridge this gap, the acceleration, velocity, and impact force working on a lithium-ion battery mounted on a mobility scooter while driving by simulating driving conditions were calculated, and the safety test profiles were determined by performing on-road driving tests and impact tests. Then, the reliability of the test data was verified in a statistical validation process. The safety of the test profiles established in this study was tested and verified in a nationally accredited testing laboratory.
2. Materials and Methods
Vibration on a lithium-ion battery mounted on a mobility scooter is low-frequency noise (≤250 Hz) caused by the excitation force generated by the friction of the tires on the road and transferred to the battery through the tires and frame while driving. The vibration level was measured with a vibration sensor (triaxial accelerometer) attached to the lithium-ion battery to identify the range of vibrations, and the random vibration levels within the given bandwidth were determined using the fast Fourier transform (FFT).
2.1. Vibrations
2.1.1. Experimental Environment
(1)
Table 1 shows the detailed specifications of test models for electric wheelchairs and medical scooters. The experiments were performed in indoor and on-road driving environments.
Table 2 outlines the experimental environments and road conditions. Vibration testing was performed in the X-, Y-, and Z-axis directions, in that order. Additionally, a temperature profile was set for different driving durations and ambient temperatures, as shown in
Table 3. In consideration of the reliability test requirements under extreme temperature conditions, the maximum and minimum ambient temperatures were set at twice the usual temperatures of summer and winter months in which mobility scooters are used [
4].
(2) For indoor experiments, the test track (16-M and 14-M circuit; lane width: 2 m; total length: 60 m) in the Rehabilitation Engineering Research Center of the Korea Labor Welfare Corporation was used. Each test running lasted 30 min. For on-road driving experiments, the roads commonly used by people with physical disabilities, including sidewalks, bicycle lanes, and roads, were used. The experiments on sidewalks, which are most frequently used by mobility scooter users, were performed in an environment created pursuant to the Mobility Enhancement for the Mobility Impaired Act and the “Road Safety Facility Installation and Management Guidelines—Safety Facilities for People with Disabilities.” The experiments on bicycle lanes and roads were performed on those designed in compliance with the guidelines laid down in the Road Design Standards issued by the Ministry of Land, Infrastructure, and Transport. All road tests were performed for 30 min under the road conditions of cross slope of ≤2%, super-elevation of ≤7%, longitudinal slope of ≤15%, and friction factor of 0.14–0.16.
2.1.2. Test Items
(1) The test model is shown in
Table 1.
(2) Tri-axial random vibration testing was performed, and the vibration levels were measured using a tri-axial accelerometer (Saver 3 × 90, Lansmont Corporation, Monterrey, CA, USA) attached to a lithium-ion battery mounted on the mobility scooter. The calibration uncertainty of this accelerometer (calibrated at 25 °C and 50% RH) was ≤0.06 Grms per unit input value of 5 Grms in the measurement bandwidth of 1–250 Hz.
(3)
Table 3 and
Table 4 present the frequency-dependent test profile of tri-axial random vibration levels of the lithium-ion battery while driving.
2.1.3. Analysis Results
(1) The curves in
Figure 3 represent the vibration levels in the time and frequency domains measured in the bandwidth of 1–250 Hz in indoor and on-road driving environments (red: X-axis; green: Y-axis; yellow: Z-axis). The graphs show higher amplitudes along the X-axis in indoor driving and higher amplitudes along the Z-axis in the on-road driving environment. Increasing random vibrations are observed in the higher bandwidth segment (100–250 Hz), which suggests a need for segment-wise vibration testing and standardization. Because the turning radius of a mobility scooter does not generally exceed 1.2 m, the amplitude values along the Y-axis exceed those along the Z-axis in the bandwidth of more than 100 Hz.
2.2. Mechanical Shock
2.2.1. Experimental Environment
(1) The mechanical shock to which the lithium-ion battery was exposed while driving was measured under the same experimental conditions as outlined in
Table 2. Additionally, impact conditions were set as follows: the impact condition for a tri-axial shock test while driving at the maximum driving speed of 15 km/h and the impact condition for a shock test when the wheels roll from a 0.25-cm-high curbstone [
5].
2.2.2. Test Items
(1) This test can be applied not only to the lithium-ion battery but also to the system mounted on the frame or rigid parts of an electric wheelchair.
Table 5 presents the test profile for the impact exerted on the lithium-ion battery while driving. The test profile was created based on the impact levels on the battery when the wheels roll down a curbstone and those during a front collision (against a wall) while driving at the maximum speed and a side-on collision while turning. Tri-axial impact levels were measured while driving at an acceleration of 0.4 m/s
2 and maximum speed of 15 km/h, and each test was repeated 10 times on each axis. The impact pattern was a half-sine wave with irregular intervals, but the impact was exerted every 2.5 s for data collection and normalization purposes. The impact on the battery while rolling down or up a curbstone or external impact independent of driving was measured every 10 s with five repetitions.
2.2.3. Analysis Results
(1)
Figure 4 illustrates the triaxial impact frequency caused by collisions while driving. The average impact frequency was 30 times every 50 s, the average driving impact level was 0.667 Grms, and the average externally exerted impact level was 1.337 Grms.
2.3. Dewing
Test Items
(1) This test simulates the use of the system and components under high ambient humidity. This test applies to battery packs and systems. The test profile is shown in
Table 6 and
Table 7.
2.4. Thermal Shock
Test Items
(1) This test simulates a thermal load derived from the electric wheelchair operations, which a battery system will likely experience during its life. The test profile is shown in
Table 8.
2.5. Overcharge Protection
Test Items
(1)
Figure 5 shows the overcharge protection circuit test results. The overcharge protection is to check the function of the overcharge protection device of the lithium battery and the overcharge current should be cut off to protect the sample from serious additional accident by overcharge [
6,
7].
As the charging voltage rises to 32.7 V, the overcharge voltage is sensed in the protection circuit and the current is cut off. However, when the overcharge protection circuit is shut off due to the voltage drop again, chattering occurs. As a result of this test, if the overcharge condition occurs, it is necessary to prevent the charge in the protection circuit for a certain period of time [
8].
2.6. Overdischarge Protection
Test Items
(1) The purpose of the over-discharge protection test is to check the function of the over-discharge protection device. This device should block the over-discharge current to protect the sample from serious add-on accidents due to over-discharge current.
Figure 6 shows the results of over-discharge test. The lithium battery capacity used in the test was 24 Ah, so discharge was performed at 12 A. When the final battery voltage was 17.9 V, the battery protection circuit was activated and the discharge was stopped [
9,
10].
2.7. Short-Circuit Protection
Test Items
(1) The purpose of the short-circuit protection test is to check the function of the overcurrent protection device. This device should be short-circuited to prevent serious add-on accidents due to short-circuit current [
11,
12].
Figure 7 shows the test results of short-circuit protection operation. The safety was checked for 10 min by connecting a short-circuit resistance of 20 mΩ. After connecting the sample battery, overcurrent of 80 A or more occurred, and after that, the protection circuit operates and chattering phenomenon occurs, in which current interruption and conduction are repeated. After 0.8 s, the battery completely stops discharging [
13,
14].
2.8. Immersion Test—Water
Test Items
(1) This test simulates immersion that can occur when an electric wheelchair is immersed in water.
Figure 8 shows a photograph of the battery immersion test. The sample battery was immersed in a water tank of 1 M, and the battery was observed for 30 min. However, it was confirmed that the protection circuit against flooding was operating normally because no fire or explosion occurred [
15,
16].
2.9. Charging and Discharging Durability Test
Test Items
(1) In addition to the other aging factors (e.g., time, temperature), the durability test of lithium batteries has a significant impact on the battery’s life expectancy, and when selecting the relevant aging profile for energy throughput box. In order to obtain reliable and meaningful data to predict battery life, it is important that the supplier and the customer agree on the baseline data of the test profile, and on the other hand do not stress the battery system too much. Therefore, monitoring of the battery system is mandatory and specific dormant steps are required for equilibrium and cell equilibrium [
17,
18].
Figure 9 and
Figure 10 show the battery charging and discharging test photos and test results, respectively. The test method is repeated until the battery voltage reaches the discharge voltage limit specified by the supplier. The battery is discharged at 1 C discharge rate and then kept in a dormant state for 10 min [
19,
20]. The number of times of durability is selected. In this study, a tester was constructed for the durability test of the sample products. The constructed tester consisted of DC power supply, DC electronic load, an explosion-proof device and control part for controlling charging, discharging, and stopping time of the battery [
21,
22]. The number of the durability of the electric lithium battery for wheelchairs was set to 1000 in consideration of the durability (200 times) of an existing spark battery, the number of free battery support (4 times) for 6 years in an electric wheelchair, and safety factor (1.25). For reference, a portable lithium battery is 300 times, and a large capacity energy storage system (ESS) is 500 times [
23]. The lithium battery pack used in electric wheelchairs developed by the Rehabilitation Engineering Research Institute guarantees 1000 times of battery life up to 80% capacity and has test data from the battery pack maker [
24]. Charging conditions were 1 C charge of CC/CV, rated capacity of 16.0 A, buffer cutoff at 33.6 V 800 mA, dwell time 10 min, and test environment (23 ± 2) °C. The discharge condition was 1C discharge of rated capacity of 16.0 A at CC, discharge cutoff condition was 24.0 V, and durability test was performed by recharging after 10 min of idle time [
25,
26].
3. Results
3.1. Vibration and Shock Testing While Driving
Test profiles were determined based on the measurements of the vibration and shock levels exerted on the lithium-ion battery mounted on a mobility scooter in indoor and on-road driving environments, and the proposed test profiles were tested and verified in a nationally accredited testing laboratory—KTC (Korea Testing Certification).
The vibrations transferred to the battery under the indicated driving conditions were found to incur no leakage, short circuit, burst, or explosion.
Impacts generated half-sine waves of 10 ms pulse width with an upper- and lower-level error range of ±5%. The shocks transferred to the battery under the indicated impact conditions were found to incur no leakage, short circuit, burst, or explosion.
3.2. Reliability Testing for the Test Results
Robust statistics were used to validate the study results. This statistical methodology lends itself well to testing experimental results and analysis data, having outliers such as vibrations and shocks. The robust validation of vibration and shock tests yielded more than 95% reliability at 10 repetitions, with Z-scores of 0.84 and 0.75, respectively. If the Z-score converges to zero, the confidence level of the test results is greater than 95%. Therefore, test results are very consistent or satisfactory, with levels above 95% confidence [
27].
Proficiency testing was performed by a group of test persons on the same samples, and it was evaluated using analysis of variance (ANOVA). The ANOVA on the proficiency levels showed more than 95% reliability (F ratio < F critical value = H0: the test results are consistent = over 95% reliability) [
28].
3.3. Clinical Trial Results
Clinical trials were conducted on five male patients age 40–49. The clinical trial procedure is shown in
Table 8.
The Institutional Review Board (IRB) approval number is RERI-IRB-190425-2.
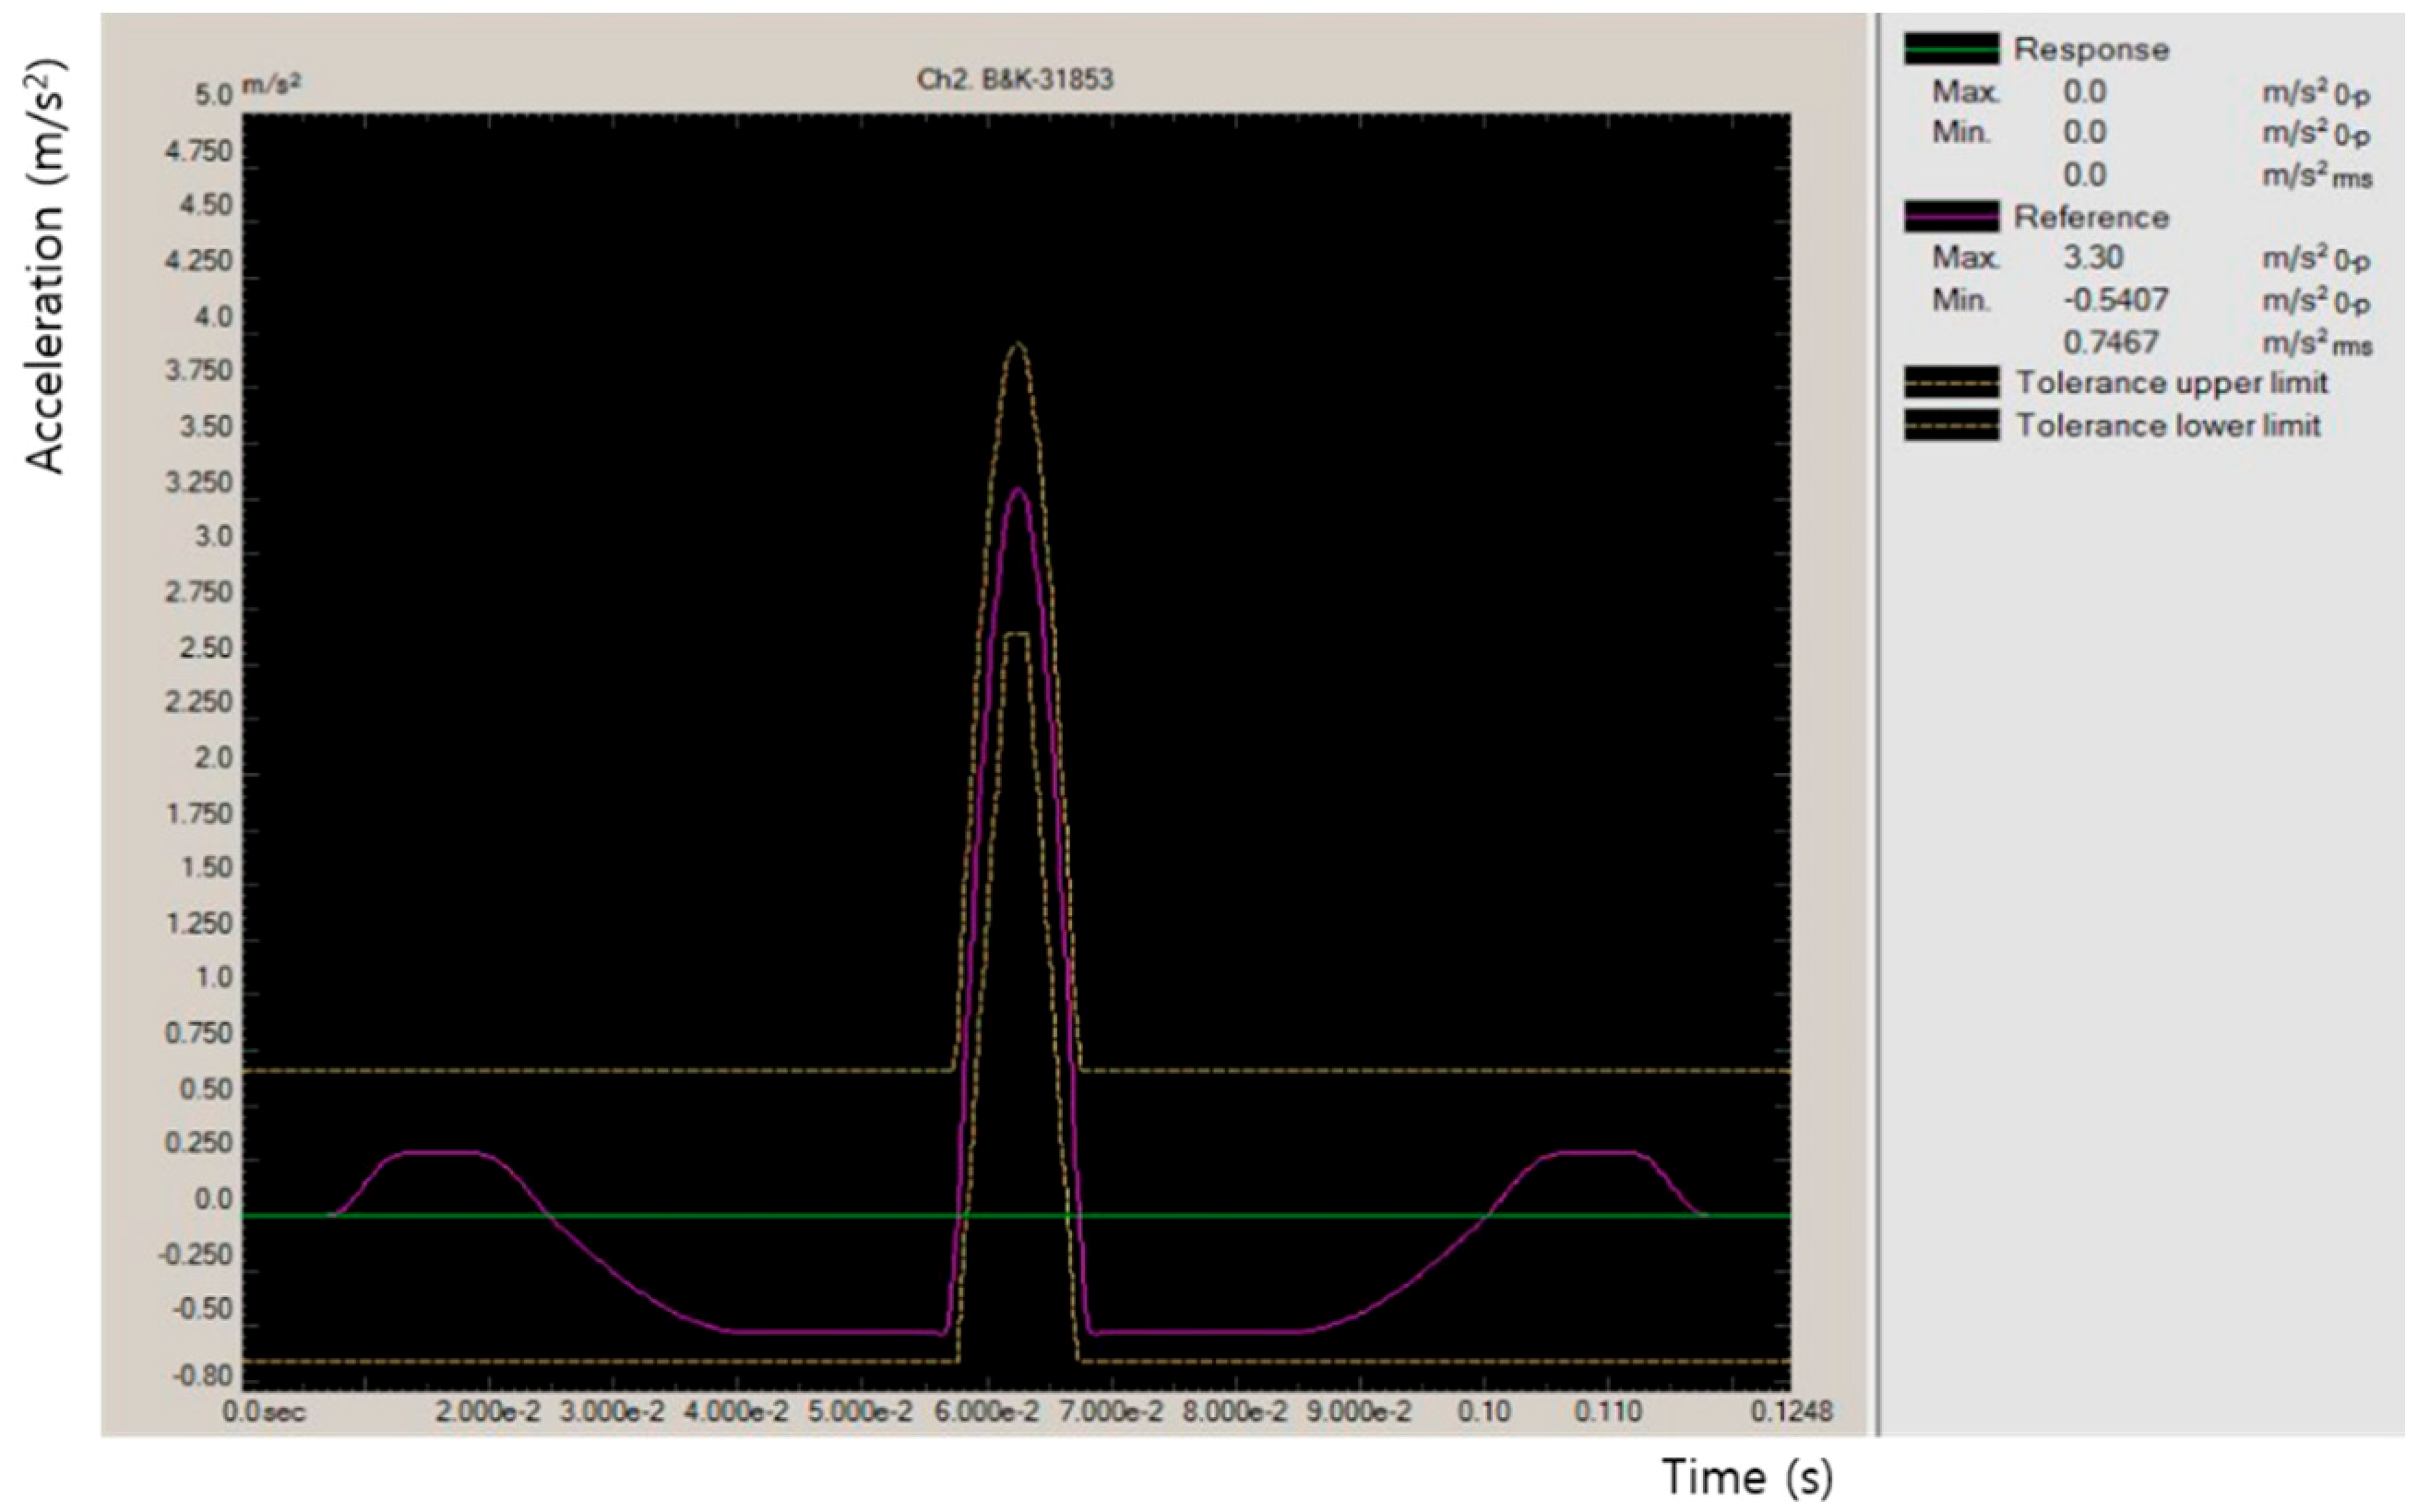
Figure 11 shows acceleration and deceleration data for a 75 kg wheelchair driver. In the data, it is less than 4 m/s
2, so the test was carried out with the safety secured when boarding the human body.
Figure 12 shows the impact time on the battery and the human body when driving. The wheelchair and human body, including the battery, are impacted for less than 10 ms.
Figure 13 and
Figure 14 show the impact of the lithium battery on the wheelchair and the impact of the human body on the wheelchair, respectively. Looking at the data, the human body is impacted at 20 Hz or less, 120 Hz or more, and the battery and the body reach the peak at about 160 Hz.
4. Conclusions
Lithium-ion-based battery systems are an efficient alternative energy storage system for electric wheelchairs and medical scooters. The requirements of lithium-ion-based battery systems used as propulsion power sources for electric wheelchairs differ significantly from those used for consumer, portable (portable), or stationary applications. The test results from this study provide a specific test process for vibration testing and mechanical impact testing, which are key test items for lithium-ion battery packs and systems specially developed for electric wheelchairs. The results also include testing and related requirements to help the electric wheelchair industry meet specific requirements for battery packs or systems. Thus, the test results allow the user to identify the essential characteristics of the Li-ion battery pack and system performance, safety, and reliability. Obtained test results can be compared with various battery packs or systems.
Finally, the results of this study will be the basis for the establishment of the ISO standard in the TC173 WG, and the establishment of the KS standard accordingly.
Based on the results of this study, I believe that adding lithium-ion battery reliability test items in the next study will provide great momentum for establishing test standards for the safety and reliability of medical scooters. In addition, it can contribute to improvement of traffic safety and quality of life of vulnerable road users.
Author Contributions
Conceptualization, S.Y. and S.L.; methodology, S.Y.; software, K.C.; validation, K.C.; formal analysis, S.Y.; investigation, K.C.; resources, S.L.; data curation, K.C.; writing—original draft preparation, S.-G.P.; writing—review and editing, S.-G.P.; visualization, S.-G.P.; supervision, S.L.; project administration, S.L.; funding acquisition, S.L.
Funding
This research was funded by from Korea Ministry of Food and Drug Safety, grant number 17172MFDS395.
Conflicts of Interest
The authors declare no conflict of interest.
References
- Park, D.C. Future trend suggestion for vehicle noise vibration development. J. Korea Soc. Automot. Eng. 2011, 34, 18–23. [Google Scholar]
- International Standard—ISO 18243, Electrically Propelled Mopeds and Motorcycles. Test Specifications and Safety Requirements for Lithium-Ion Battery Systems; ISO: Geneva, Switzerland, 2017.
- International Standard—ISO 12405-1, Electrically Propelled Road Vehicles: Test Specifications for Lithium-Ion Traction Battery Pack and System; ISO: Geneva, Switzerland, 2012.
- Tetter, V.Y. Method of Generating Vibration Test Signals. Meas. Tech. 2017, 60, 173–176. [Google Scholar] [CrossRef]
- Boggs, C. Efficient empirical modelling of a high-performance shock absorber for vehicle dynamic studies. Veh. Syst. Dyn. 2010, 48, 481–505. [Google Scholar] [CrossRef]
- Kim, H.S. Smart Battery System of Lithium ion Batteries. J. Electrochem. Sci. Technol. 2001, 4, 132–137. [Google Scholar]
- Xiao, L.F.; Ai, X.P.; Cao, Y.L.; Wang, Y.D.; Yang, H.X. A composite polymer membrane with reversible overcharge protection mechanism for lithium ion batteries. Electrochem. Commun. 2005, 7, 589–592. [Google Scholar] [CrossRef]
- Li, S.L.; Ai, X.P.; Yang, H.X.; Cao, Y.L. A polytriphenylamine-modified separator with reversible overcharge protection for 3.6 V-class lithium-ion battery. J. Power Sources 2008, 189, 771–774. [Google Scholar] [CrossRef]
- Wang, Z.; Liu, K.; Liu, J.; Luo, Q.; Ma, C. Influence of the charging and discharging of the 18650 lithium-ion battery thermal runaway. J. Loss Prev. Process Ind. 2017. [Google Scholar] [CrossRef]
- Zheng, X.; Liu, X.; He, Y.; Zeng, G. Active Vehicle Battery Equalization Scheme in the Condition of Constant-Voltage/Current Charging and Discharging. IEEE Trans. Veh. Technol. 2017, 66, 3714–3723. [Google Scholar]
- Vaurio, S.; Ronkainen, T. Short Circuit Protection of the Lithium-Ion Battery in Heavy-Duty Hybridvehicle; Aalto University: Helsinki, Finland, 2013. [Google Scholar]
- Kousalya, M.; Iyyengar, K.R. An Electronic Overload/Short Circuit Protection for Battery-Powered Equipment. Veh. Syst. Dyn. 1980, 21, 125. [Google Scholar] [CrossRef]
- Chen, M.; Bai, F.; Lin, S.; Song, W.; Li, Y.; Feng, Z. Performance and safety protection of internal short circuit in lithium-ion battery based on a multilayer electro-thermal coupling model. Appl. Thermal Eng. 2019, 146, 775–784. [Google Scholar] [CrossRef]
- Choi, C.S. Study on the Analysis of Damage Patterns of Cellular Phone Batteries According to Energy Sources. Fire Sci. Eng. 2011, 25, 21–26. [Google Scholar]
- Tan, C.L.; Zhou, H.J.; Li, W.S.; Hou, X.H.; Lü, D.S.; Xu, M.Q.; Huang, Q.M. Performance improvement of LiMn2O4 as cathode material for lithium ion battery with bismuth modification. J. Power Sources 2008, 184, 408–413. [Google Scholar] [CrossRef]
- Laskar, S.; Harada, N. Different Conditions of Cold Water Immersion Test for Diagnosing Hand-Arm Vibration Syndrome. Environ. Health Prev. Med. 2005, 10, 351–359. [Google Scholar] [CrossRef] [PubMed]
- Klink, S.; Madej, E.; Ventosa, E.; Lindner, A.; Schuhmann, W.; La Mantia, F. The importance of cell geometry for electrochemical impedance spectroscopy in three-electrode lithium ion battery test cells. Electrochem. Commun. 2012, 22, 120–123. [Google Scholar] [CrossRef]
- Ye, Y.; Shi, Y.; Cai, N.; Lee, J.; He, X. Electro-thermal modeling and experimental validation for lithium ion battery. J. Power Sources 2012, 199, 27–238. [Google Scholar] [CrossRef]
- Fan, J.; He, H.; Xiong, R. Evaluation of Lithium-Ion Battery Equivalent Circuit Models for State of Charge Estimation by an Experimental Approach. Energies 2011, 4, 582–598. [Google Scholar]
- Einhorn, M.; Conte, F.V.; Kral, C.; Fleig, J. A Method for Online Capacity Estimation of Lithium Ion Battery Cells Using the State of Charge and the Transferred Charge. IEEE Trans. Ind. Appl. 2012, 48, 736–741. [Google Scholar] [CrossRef]
- Choi, Y.S.; Kang, D.M. Prediction of thermal behaviors of an air-cooled lithium-ion battery system for hybrid electric vehicles. J. Power Sources 2014, 270, 273–280. [Google Scholar] [CrossRef]
- Firouz, Y.; Relan, R.; Timmermans, J.M.; Omar, N.; Van den Bossche, P.; Van Mierlo, J. Advanced lithium ion battery modeling and nonlinear analysis based on robust method in frequency domain: Nonlinear characterization and non-parametric modeling. Energy 2016, 106, 602–617. [Google Scholar]
- Kim, J.-G.; Youn, S.-J.; Kim, J.-H.; Won, C.-Y.; Na, J.-K. AC Regeneratable Battery Charging and Discharging Test System. J. Power Electron. 2012, 17, 99–106. [Google Scholar] [CrossRef]
- Georgiev, A.; Busso, A.; Roth, P. Shallow borehole heat exchanger: Response test and charging—Discharging test with solar collectors. Renew. Energy 2005, 31, 971–985. [Google Scholar] [CrossRef]
- Kang, B.; Ceder, G. Battery materials for ultrafast charging and discharging. Nature 2009, 458, 190–193, E-ISSN 1476-4687Nature Publishing Group. [Google Scholar] [CrossRef] [PubMed]
- Agarwal, V.; Uthaichana, K.; DeCarlo, R.A.; Tsoukalas, L.H. Development and Validation of a Battery Model Useful for Discharging and Charging Power Control and Lifetime Estimation. IEEE Trans. Energy Convers. 2010, 25, 821–835. [Google Scholar] [CrossRef]
- Todorov, V.; Filzmoser, P. Robust Statistic for the One-way MANOVA. Comput. Stat. Data Anal. 2010, 54, 37–48. [Google Scholar] [CrossRef]
- Karlin, S. Applications of ANOVA type decompositions for comparisions of conditional variance statistics including jackknife estimates. Ann. Start. 1982, 10, 485–501. [Google Scholar] [CrossRef]
Figure 1.
International standards for lithium batteries.
Figure 1.
International standards for lithium batteries.
Figure 2.
Process for establishing medical wheelchair standard.
Figure 2.
Process for establishing medical wheelchair standard.
Figure 3.
Vibration levels in the time and frequency domains while indoor-outdoor driving.
Figure 3.
Vibration levels in the time and frequency domains while indoor-outdoor driving.
Figure 4.
Vibration levels in the time and frequency domains.
Figure 4.
Vibration levels in the time and frequency domains.
Figure 5.
Test results of overcharge protection test.
Figure 5.
Test results of overcharge protection test.
Figure 6.
Test results of over discharge protection test.
Figure 6.
Test results of over discharge protection test.
Figure 7.
Test results of short-circuit protection.
Figure 7.
Test results of short-circuit protection.
Figure 8.
Lithium battery immersion test photo.
Figure 8.
Lithium battery immersion test photo.
Figure 9.
Charging and discharging durability test.
Figure 9.
Charging and discharging durability test.
Figure 10.
Test results of charging and discharging durability test.
Figure 10.
Test results of charging and discharging durability test.
Figure 11.
Acceleration data during wheelchair driving test.
Figure 11.
Acceleration data during wheelchair driving test.
Figure 12.
Battery and human body impact time during wheelchair operation.
Figure 12.
Battery and human body impact time during wheelchair operation.
Figure 13.
Impact amount of lithium battery during vibration and mechanical shock test.
Figure 13.
Impact amount of lithium battery during vibration and mechanical shock test.
Figure 14.
The amount of impact received by the human body during the vibration and mechanical shock test.
Figure 14.
The amount of impact received by the human body during the vibration and mechanical shock test.
Table 2.
Test environment.
Table 2.
Test environment.
| | Indoor Driving | Outdoor Driving |
|---|
| Temperature and Humidity | (23 ± 2) °C, (45 ± 5)% R.H. |
|---|
| Speed | 4–15 km/h |
| Cross slope | 0.1% or less | 2% or less |
| Curved slope | 0.1% or less | 7% or less |
| End slope | 0.1% or less | 15% or less |
| Frictional Force | 0.09–0.11 | 0.14–0.16 |
| Driving Time | 30 min | 30 min |
Table 3.
Temperature profile during vibration test.
Table 3.
Temperature profile during vibration test.
| Test Time | Temperature |
|---|
| 120 min | (23 ± 2) °C |
| 60 min | −20 °C |
| 120 min | (23 ± 2) °C |
| 60 min | 65 °C |
| 120 min | (23 ± 2) °C |
Table 4.
Test profile of triaxial random vibration levels of the lithium-ion battery while driving.
Table 4.
Test profile of triaxial random vibration levels of the lithium-ion battery while driving.
| Axis | X | Y | Z |
|---|
| Frequency (Hz) | PSD (g2/Hz) | PSD (g2/Hz) | PSD (g2/Hz) |
| 5 | 0.000177609 | 0.0005893977 | 0.001236914 |
| 10 | 0.000047391 | 0.0000345278 | 0.001137809 |
| 20 | 0.000040545 | 0.0000495555 | 0.000038132 |
| 50 | 0.000337868 | 0.0004478374 | 0.000087719 |
| 100 | 0.000017964 | 0.0000174850 | 0.000018480 |
| 200 | 0.000000794 | 0.0000003972 | 0.000001117 |
Table 5.
Test profile for the impact exerted on the lithium-ion battery while driving.
Table 5.
Test profile for the impact exerted on the lithium-ion battery while driving.
| Maximum Speed | 15 km/h |
|---|
| Acceleration | 4 m/s2 |
| Pulse Width | 10 ms |
| Pulse type | half-sine wave |
| Cycle | X, Y, Z = 10 |
| Battery charging | 1 C, 80% SOC |
Table 6.
Test profile for dewing of Lithium-ion battery.
Table 6.
Test profile for dewing of Lithium-ion battery.
| | Minimum | Maximum |
|---|
| Humidity | 50% | 95% |
| Temperature | 25 °C | 80 °C |
| Change time | <30 min |
| Cycle | 10 |
| Battery charging | 1 C, 80% SOC |
Humidity
(50–95)% | ![Applsci 09 02299 i005]() |
Temperature
(25–80) °C | ![Applsci 09 02299 i006]() |
Table 7.
Test profile for thermal shock of Lithium-ion battery.
Table 7.
Test profile for thermal shock of Lithium-ion battery.
| | Minimum | Maximum |
|---|
| Temperature | 25 °C | 65 °C |
| Temp. of change time | <30 min |
| Temp. of hold time | 60 min |
| Cycle | 10 |
| Battery Charging | 1 C, 80% SOC |
Table 8.
Clinical trial procedures.
Table 8.
Clinical trial procedures.
| 1. IRB number: RERI-IRB-190425-2 |
| 2. Selecting conditions for human subjects |
| A. Number of participants: 5 |
| B. Those who have experience using electric wheelchairs |
| C. A person who is fully aware of this experiment |
| D. Those who agreed to the clinical participation after the description of the experiment |
| E. Excluding those who cannot evacuate in an emergency |
| 3. All experimental data use only data values that meet 95% confidence with robust statistical processing techniques |
| 4. Experimental method |
| A. Participants measured height and weight before testing |
| B. Before driving test, check the driving ability by driving 20 tracks on the driving track |
| C. Perform a preliminary test according to the electric wheelchair test standard to verify that the test model is functioning normally |
| D. For the safety of patients, the pre-test items are as follows: |
| Driving, Speed, Acceleration and Deceleration, Dynamic Safety |
| E. Attach vibration and impact sensors to the top of the battery in the electric wheelchair |
| F. Record the initial values of the vibration and impact sensors |
| G. The test is carried out in the road condition (road condition for the disabled; Table 2) |
| H. Driving is limited to 30 min once (the test can be conducted within 30 min considering the sampling interval of the vibration sensor) |
| I. The test evaluation is limited to only one per day |
| J. For safety, the test should be conducted under the control of the relevant operator during the test |
| K. Measuring vibration range for X, Y, Z axis |
| L. Measuring the impact range for the X, Y, and Z axes |
| M. If all data exceed the KS P 6114 standard, stop the test. |
| N. If all the data exceeds the pre-test reference value by more than 10%, stop the test |
| O. Evaluation of whether all data satisfy 95% confidence level in robust statistics. |
| Only data satisfying the 95% confidence level by robust statistics among all the data exceeding the threshold value) |
© 2019 by the authors. Licensee MDPI, Basel, Switzerland. This article is an open access article distributed under the terms and conditions of the Creative Commons Attribution (CC BY) license (http://creativecommons.org/licenses/by/4.0/).


