Review

Reviews on Corrugated Diaphragms in Miniature Fiber-Optic Pressure Sensors

College of Information and Communication Engineering, Harbin Engineering University, Harbin 150001, China
*
Author to whom correspondence should be addressed.
Appl. Sci. 2019, 9(11), 2241; https://doi.org/10.3390/app9112241
Submission received: 26 April 2019 / Revised: 27 May 2019 / Accepted: 28 May 2019 / Published: 30 May 2019
(This article belongs to the Special Issue Recent Progress in Fiber Optic Sensors: Bringing Light to Measurement)

Abstract

:
Corrugated diaphragms (CDs) have been widely used in many fields because of their higher pressure sensitivity and wider linear range compared to flat diaphragms (FDs) in the same circumstances. Especially in the application of miniature fiber-optic pressure sensors, the introduction of the corrugated structure gives the sensor high sensitivity, large dynamic range, good linearity, small hysteresis, good stability, and so on. Research on CD-based miniature fiber-optic pressure sensors has gradually attracted more attention in recent years. In this paper, the principles of operation of a miniature fiber-optic pressure sensor are briefly introduced, then the mechanical properties of FD and CD, as well as their influences on the performance of the sensor, are analyzed in detail. The application status of CDs in miniature fiber-optic pressure sensors is reviewed, and our conclusions and the prospects for the application of CDs in miniature fiber-optic pressure sensors are given finally.

1. Introduction

Pressure sensors are widely used in many fields of life. The applications of pressure sensors can be divided into static pressure sensors (such as atmospheric pressure or hydrostatic pressure) and dynamic pressure (such as acoustic pressure) sensors. Compared with the traditional electronic pressure sensors, the fiber optic pressure sensors enjoy the advantages of high sensitivity, wide frequency response, large dynamic range and strong anti-electromagnetic interference, along with small size, light weight and miniaturization. These make them suitable for use in harsh environments, such as limited space, high temperature, high pressure, strong corrosion and radiation. Therefore, the fiber optic pressure sensors have been highly valued and extensively used in many key areas, such as national defense security [1], medical health [2], oil and gas exploration [3] and underwater monitoring [4].
According to the difference between sensing elements, fiber-optic pressure sensors can be classified as intrinsic or extrinsic pressure sensors. For the intrinsic fiber-optic pressure sensor, the length and refractive index of optical fiber, when subjected to external pressure, will change and result in the variation of the internal transmission light state (polarization, phase, amplitude, etc.). In contrast, for the extrinsic fiber-optic pressure sensor the optical fiber is only used as a light guide element and the sensing of the pressure will be realized by an external pressure sensitive diaphragm. Due to the flexibility of the diaphragm’s structural design, the diaphragm-based fiber-optic pressure sensor has attracted widespread attention. Pressure sensitive structures based on the diaphragm have been extensively studied by Mach-Zehnder (M-Z) [5,6,7], Michelson [8,9], Sagnac [10,11,12] and Fabry-Perot (F-P) [13,14,15] interference structures. Among them, the extrinsic Fabry-Perot interferometer (EFPI) structure, usually formed by two interference beams sharing a common optical path, is insensitive to the disturbances in the transmission fiber, and thus is widely used in pressure sensing.
As the core component of the EFPI pressure sensor, the diaphragm’s material and structure directly determine the performance of the sensor. Up to now, the probe manufacturing for diaphragm-based EFPI sensors is usually realized using the microelectromechanical system (MEMS). According to the structures, the diaphragms could be mainly divided into three types: flat diaphragms (FDs), Mesa-diaphragms and Corrugated diaphragms (CDs) [16]. The FD, the traditional structure, is simple to design and fabricate. However, the nonlinear deformation under large applied pressure limited the FD’s application. Meanwhile, the mechanical sensitivity of the FD will decrease rapidly, when there is a large initial stress in the FD. Generally, there are two methods to improve the performance of the diaphragm-based sensors. The first is to add a boss structure to the diaphragm. The boss structure can improve the optical performance of the sensor by declining the nonlinear deformation in the diaphragm’s central region, but the fabrication of the boss structure is pretty complex, and the introduce of boss structure will enhance the sensor’s undesirable sensitivity to vibration. The second is to add a corrugated structure to the diaphragm. The corrugated structure can not only reduce the impact of initial stress on the diaphragm (if there is any) and increase the linear range effectively, but also can easily be fabricated using MEMS technology.
Recently, the application of CDs in miniature fiber-optic pressure sensors has been developing rapidly [17,18,19,20,21,22,23,24,25,26,27]. In this paper, the mechanical properties of CD are analyzed in detail. We are trying to summarize the application of CD in miniature fiber-optic pressure sensors, to point out the existing problems and to explore the potential application of CDs in miniature fiber-optic pressure sensors.

2. The Principles of Operation of Miniature Fiber-Optic Pressure Sensors

2.1. The Basic Principles of EFPI Pressure Sensors

The typical structure of a diaphragm-based EFPI fiber-optic pressure sensor is shown in Figure 1. The F-P cavity, either the fiber-tip structure (Figure 1a) or the fiber-end structure (Figure 1b), is usually composed of a fiber end and a sensitive diaphragm. The diaphragm’s deformation due to external pressure will cause the F-P cavity’s length to change, then modulate the reflected light signal, and then the external pressure information will be detected [16]. According to the F-P interference principle, the cavity length L could be written as
L = λ 1 λ 2 2 n ( λ 1 λ 2 ) ,
where λ1, λ2 are the two center wavelengths of adjacent resonance peaks in interference spectra of the F-P cavity, n is the refractive index of medium in the F-P cavity, here, for air, n = 1. Thus, the cavity length L can be determined by obtaining the wavelengths λ1 and λ2 from the interference spectra, thereby calculating the pressure applied to the diaphragm.

2.2. Demodulation Methods of EFPI Sensors

The demodulation method is an important part of the fiber-optic sensing system, whose function is to measure external physical quantities by detecting changes in the reflection spectrum or the reflection intensity. The demodulation method determines the accuracy and speed of the demodulation results and should be selected according to the needs and sensor probe structure due to their own advantages and disadvantages. The intensity method and phase method are usually adopted to demodulate the EFPI sensors.

2.2.1. Intensity demodulation

As shown in Figure 2, intensity demodulation usually uses a narrow-band light source and detects the external signal according to the change of the reflected light intensity, which is directly received by the photodetector.
The intensity demodulation method has the advantages of high sensitivity, fast demodulation speed, simple processing and low cost. So, it is very effective in measuring small dynamic disturbance signals. However, this method has the disadvantages of a small dynamic range, it is difficult to control and stabilize the working point and it is very susceptible to fluctuations in light intensity. In order to overcome the shortcomings of the intensity demodulation algorithm, the operating point control technique [28,29], self-compensation method [30,31], quadrature phase method [32,33], and three-wavelength demodulation method [34] have been proposed, and so on.

2.2.2. Phase demodulation

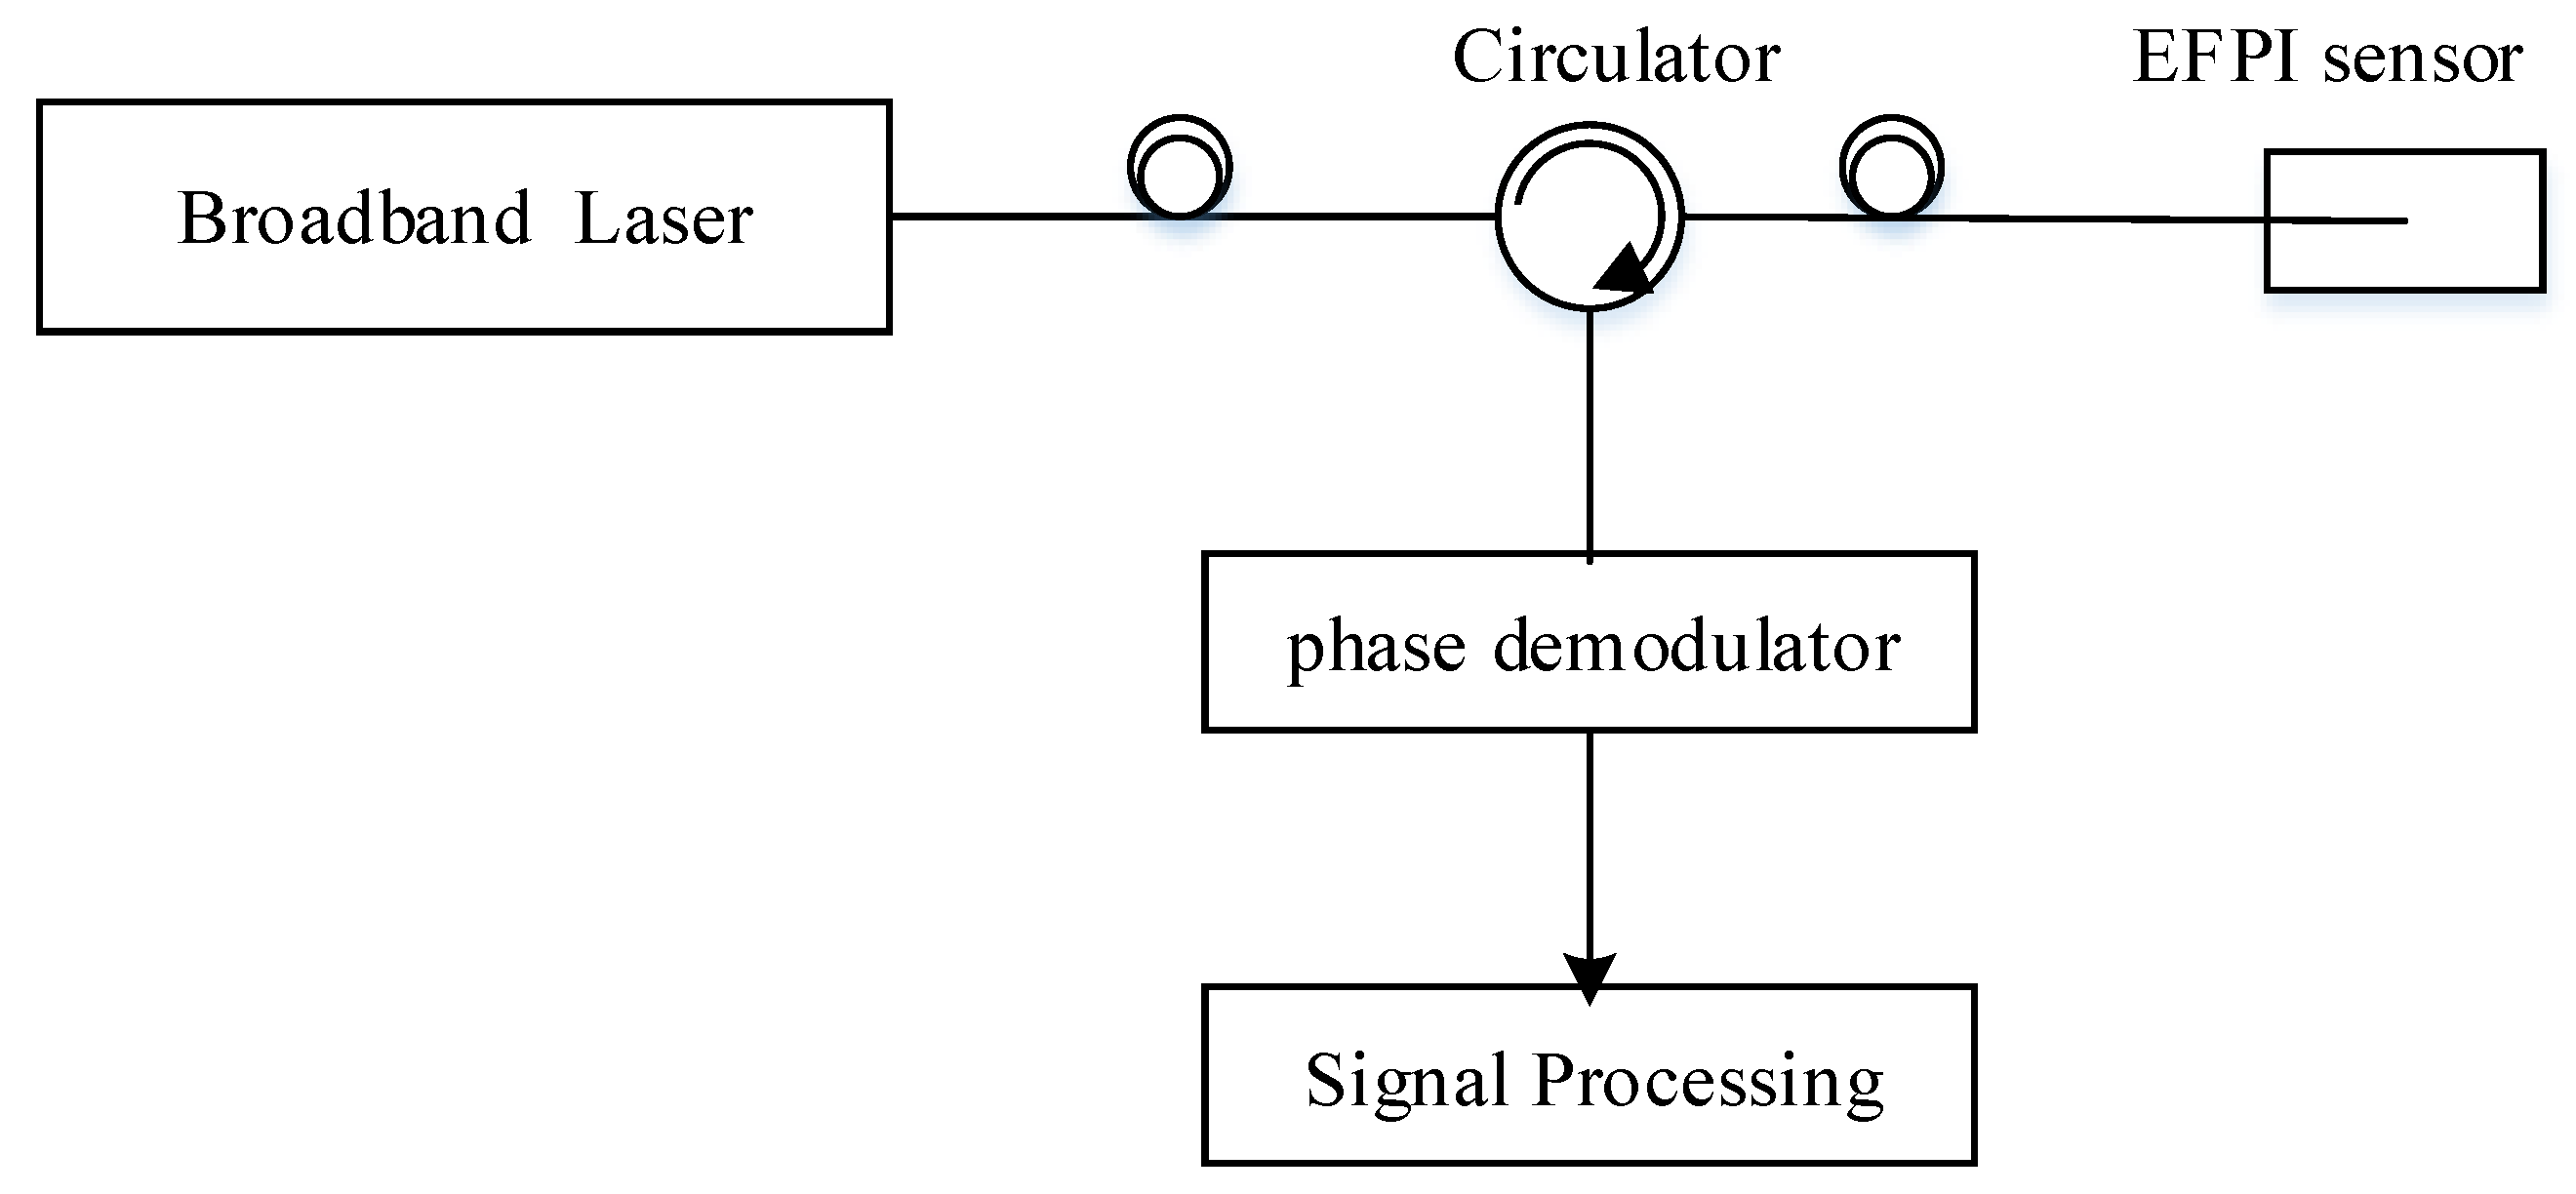
Phase demodulation, as shown in Figure 3, has high demodulation accuracy [35]. In phase demodulation, a broadband light source or a tunable laser is generally used to obtain the whole spectrum. Compared to intensity demodulation, there is no strict limitation on the cavity length, and the intensity fluctuation has little effect on the demodulation performance, so the phase demodulation can be universally applied. Many schemes, such as the fringe detection method [36], spectrum transform method [37], cross-correlation cavity length matching algorithm [38], path-matched interferometry method [39,40], and so on, are proposed to implement phase demodulation. But most of these methods’ demodulation speed is low, which makes them more suitable for static pressure measurement.

3. The Mechanical Properties of Diaphragms

The response of the diaphragm to pressure is primarily based on the deformation theory of the diaphragm. The mechanical properties of both the FD and the CD, whether with or without initial stress, will be discussed in detail. As for the CD, two different kinds, the shallow corrugated diaphragm (SCD) and the single deeply corrugated diaphragm (SDCD), will be discussed in the coming sections, and the influence of the diaphragm structure on the overall performance of the sensor will be analyzed last.

3.1. Mechanical Properties of the FD

The deflection of a flat circular diaphragm with clamped edges responding to homogeneous pressure P is shown in Figure 4, where ω0, Rd and hd are the center deflection, the radius and the thickness of the diaphragm, respectively.
1. Without initial stress
The deflection of the circular clamped diaphragm without initial stress can be calculated from [41]
P = 5.33 E ( 1 ν 2 ) h d 4 R d 4 ω 0 h d + 2.83 E ( 1 ν 2 ) h d 4 R d 4 ω 0 3 h d 3 ,
where E and v are the Young’s modulus, the Poisson’s ratio of the diaphragm, respectively.
2. With initial stress
The deflection of the circular diaphragm with clamped edges and initial stress can be calculated by [42]
P = 5.33 E ( 1 ν 2 ) h d 4 R d 4 ω 0 h d + 4 h d 2 R d 2 ω 0 h d σ + 2.83 E ( 1 ν 2 ) h d 4 R d 4 ω 0 3 h d 3 ,
where σ is the initial stress of the diaphragm.
According to the elastic mechanics, when the central deflection is less than 30% of the diaphragm’s thickness, that is, no larger than 20% of the diameter of the diaphragm [17], the small deflection theory could be adopted and the cubic terms of ω0 in Equations (2) and (3) can be neglected. In this case, the homogeneous pressure P is linearly related to the center deflection ω0, and the mechanical sensitivity of the FD with initial stress can be obtained as
S m ( F D ) = d ω 0 d P = R d 2 4 h d [ σ + 5.33 4 ( 1 v 2 ) E h d 2 R d 2 ] ,
In Equation (4), it can be seen that the mechanical sensitivity of the FD depends on the initial stress in the diaphragm, and the smaller the initial stress, the higher the sensitivity. The initial stress of the diaphragm can be reduced by controlling the parameters of the diaphragm deposition process. However, due to the limitations of the manufacturing technology, it is difficult to control the initial stress of the diaphragm accurately [42].

3.2. Mechanical Properties of the SCD

Figure 5 shows the schematic view of the SCD [41]. The edges of the circular diaphragm are clamped, and the central area of the diaphragm is flat with periodic annular corrugations around. Rd, hd, l, s and H are the radius, the thickness, the radial length, the arc length and the corrugation depth of CD, respectively. The profiles of corrugation can be rectangular, trapezoidal, triangular, sinusoidal, and so on. For small deflections, the profiles of corrugation have little effect on the mechanical properties of the diaphragm [43].
1. Without initial stress
In order to facilitate the analysis, we first discuss the case in which the CD is not provided with a flat center zone, and the deflection equation of CD without initial stress can be given by [42]
P = a p E h d 4 R d 4 ω 0 h d + b p E ( 1 ν 2 ) h d 4 R d 4 ω 0 3 h d 3 ,
where
a p = 2 ( q + 1 ) ( q + 3 ) 3 ( 1 ν 2 q 2 ) ,
b p = 32 1 ν 2 q 2 9 [ 1 6 3 ν ( q ν ) ( q + 3 ) ] ,
and for a sinusoidal corrugation profile [42]
q 2 = s l [ 1 + 1.5 H 2 h d 2 ] ,
where q is the corrugation profile factor, which is larger than 1 for CDs. For FDs (H = 0), q is equal to 1. If the CD has a flat center zone, it can be compensated by the factor s/l. For a rectangular corrugation profile [42]
s l = R d + 2 N H R d ,
where N is the number of corrugations. From Equations (6) and (7), it is obviously that with the increase of q, ap increases rapidly and bp decreases rapidly, and the decrease of bp indicates that the cube of the central deflection (the nonlinear component) of the diaphragm decreases. Therefore, the linear deformation range of the diaphragm can effectively increase by controlling the corrugation structure parameters [41].
2. With initial stress
When the initial stress exists in the circular CD, the first term of the Equations (2) and (5) is the elastic restoring force of the diaphragm caused by the bending stress, while the second term is the elastic recovery caused by the mid-face stretching, and the ratio of FD to the CD in this term is 2.83/bp. The mid-face stretch can also be regarded as the behavior of initial stress. Thus, the ratio of the elastic restoring force between the FD with initial stress and the CD with initial stress should also be 2.83/bp, and the deflection equation of the CD with initial stress is [44]
P = a p E h d 4 R d 4 ω 0 h d + 4 h d 2 R d 2 ω 0 h d σ b p 2.83 + b p E ( 1 ν 2 ) h d 4 R d 4 ω 0 3 h d 3 ,
For small deflection, the cubic term of center defection ω0 can be neglected, and mechanical sensitivity of the CD with initial stress can be obtained as [44]
S m ( C D ) = d ω 0 d P = R d 2 4 h d [ σ b p 2.83 + a p 4 E h d 2 R d 2 ] ,
As shown in Equations (6) (7) and (11), the mechanical sensitivity of the CD depends on the corrugation profile factor q. Compared with the number of corrugations N, as shown in Equation (9), the corrugation depth H has a much more important effect on q, or the mechanical sensitivity of CD.
In the case of small deflection, compared with Equation (4), the factor bp/2.83 in Equation (11) indicates that the effective initial stress will be reduced by 2.83/bp times. It is easily proved that 2.83/bp will be bigger than 1 when the corrugation depth is larger than 0 [42]. This means that the influence of initial stress on the mechanical sensitivity of the diaphragm will be reduced and improve the mechanical sensitivity of the diaphragm due to the introduction of corrugation. At the same time, the corrugated structure can be accurately fabricated by MEMS technology, which greatly reduces the dependence on the manufacturing technology compared to the deposition process.

3.3. Mechanical Properties of the single deep corrugated diaphragm (SDCD)

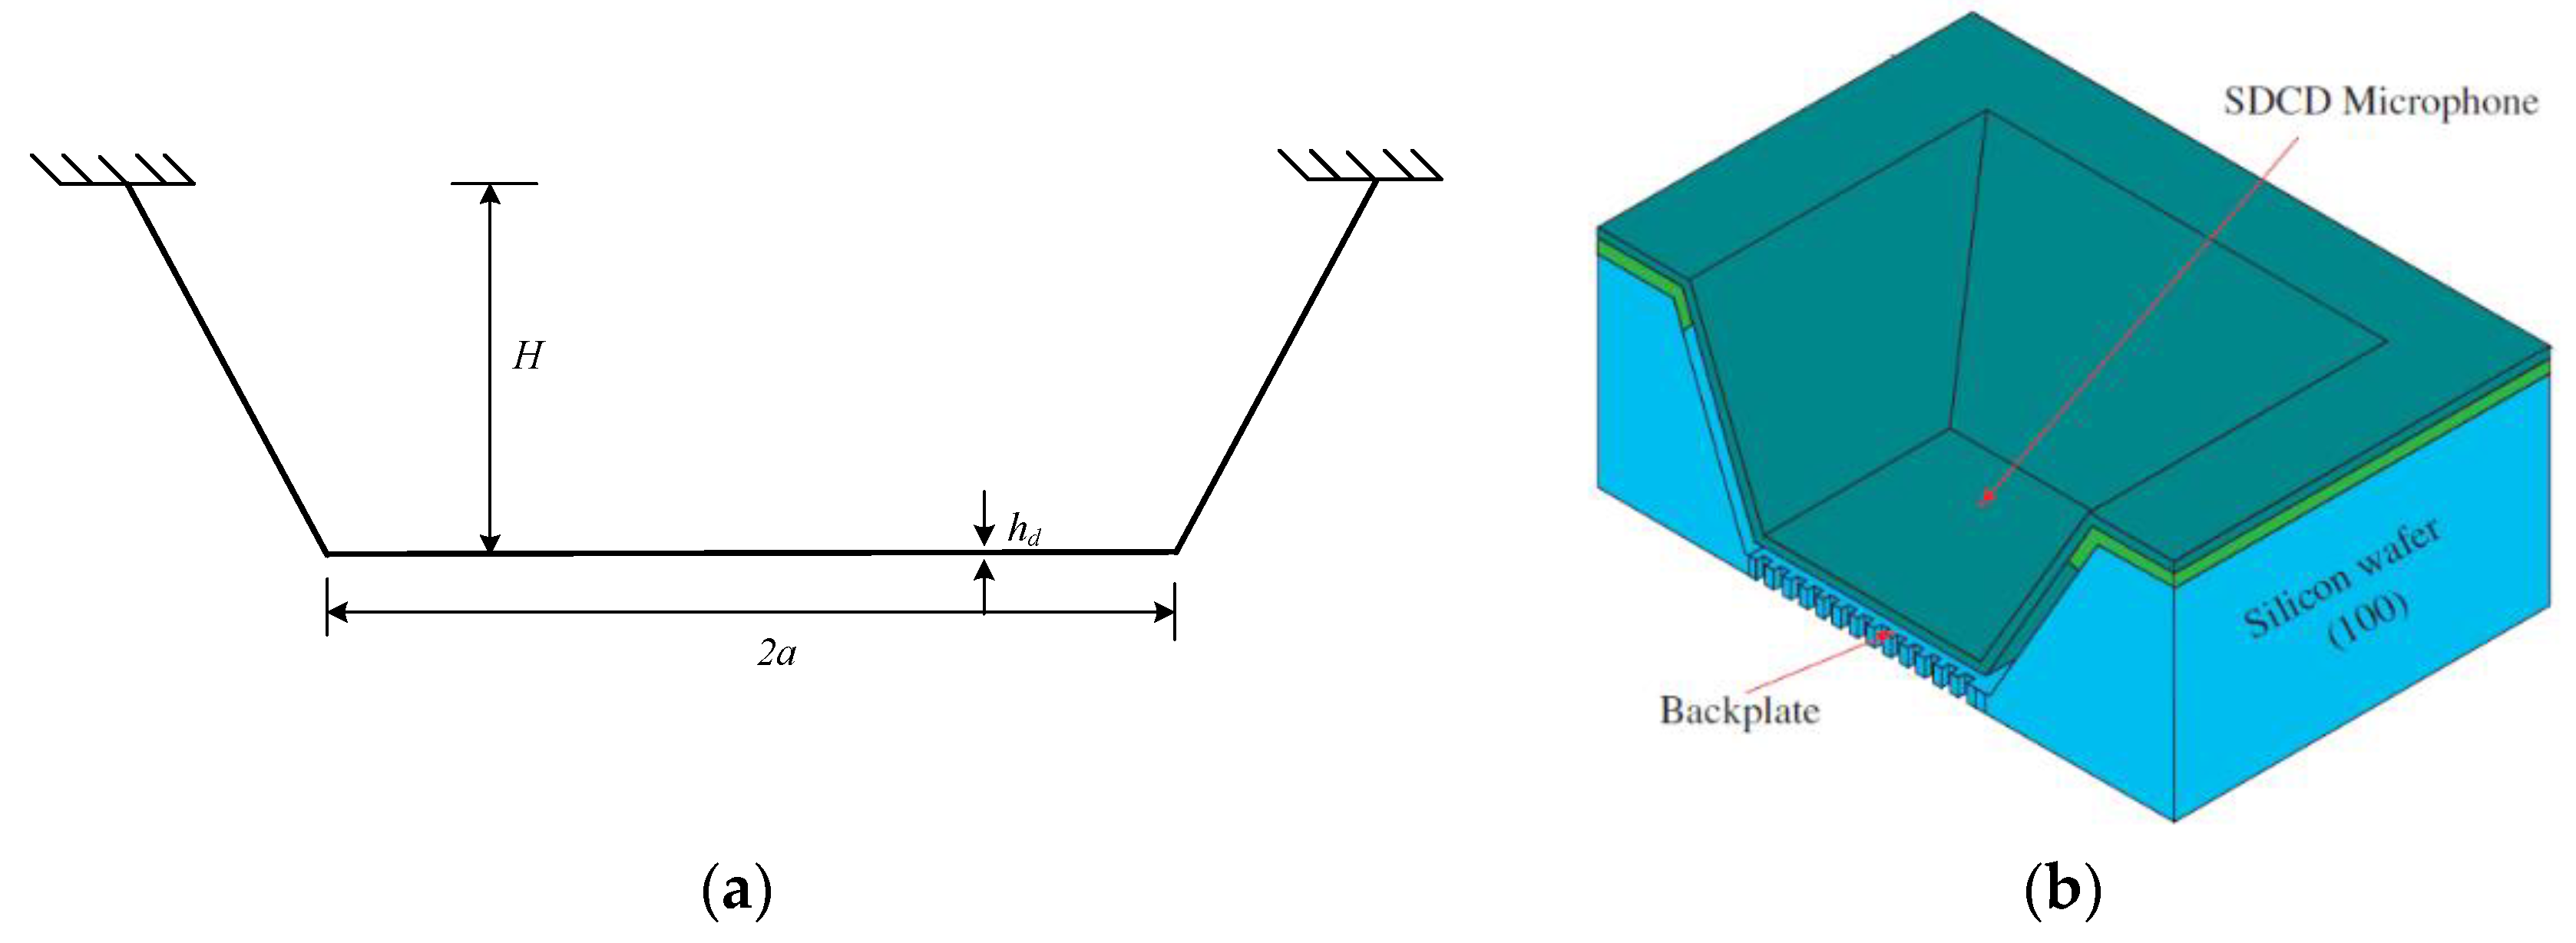
Figure 6a and b show the schematic cross section of the SDCD structure with geometrical parameters and a three-dimensional cross-section of the microphone fabricated by SDCD [45], respectively. hd is the thickness of the diaphragm, 2a is the side length of the flat bottom square diaphragm, and H is the vertical distance between the bottom surface and the fixed point. The SDCD consists of a FD which is suspended all around with free sidewalls. The flat bottom region is believed to behave just like a normal flat square diaphragm with lower stiffness. The suspending sidewalls are expected to release the residual stress of the SDCD structure.
1. Without initial stress
The clamped square diaphragm’s deflection without initial stress can be written as [41]
P a 4 E h d 4 = 4.2 ( 1 ν 2 ) ω 0 h d + 1.58 ( 1 ν 2 ) ω 0 3 h d 3 ,
2. With initial stress
For large initial stress, the deflection equation of a flat circular diaphragm can be represented by [41]
P R 4 E h d 4 = 4 σ R 2 E h d 2 ω 0 h d ,
By placing R2 with 4a2/π in (13), this resistance to bending due to initial stress can be added to (12) using the principle of superposition. The deflection equation of the square diaphragm with initial stress is [46]
P a 4 E h d 4 = 4.2 ( 1 ν 2 ) ω 0 h d + π σ a 2 E h d 2 ω 0 h d + 1.58 ( 1 ν 2 ) ω 0 3 h 0 3 ,
For small deflection, mechanical sensitivity of the square diaphragm with initial stress can be obtained as [46]
S m = ω 0 P = a 2 π h d [ 4.2 E h d 2 π a 2 ( 1 ν 2 ) + σ ] ,
For the SDCD structure, in order to reflect the effect of single deep corrugation, corrective factors C1(H) and C2(H) are introduced into (15). Here, corrective factors C1(H) and C2(H) reflect the improved mechanical compliance by decreasing mechanical stiffness of the diaphragm and releasing the initial stress, respectively. The mechanical sensitivity of a SDCD is then modified as [46]
S m = a 2 π h d [ 4.2 C 1 ( H ) E h d 2 / π a 2 ( 1 ν 2 ) + C 2 ( H ) σ ] ,
The values of the two corrective factors are obtained by finite element model (FEM) simulation, and it is confirmed that both of the two factors are less than 1 and will decrease with the increase of the corrugation’s depth [46]. Therefore, the single deep corrugation will release the diaphragm’s initial stress and lower the diaphragm’s stiffness, which will both contribute to improving the diaphragm’s mechanical sensitivity.
Through the above analysis, it can be concluded that the mechanical sensitivity of the FD depends on the initial stress in the diaphragm. The smaller the initial stress is, the higher the sensitivity is. However, due to the limitations of the manufacturing technology, there will be initial stress in the FD that is difficult to control. The shallow corrugated structure can reduce the influence of the initial stress to improve the mechanical performance sensitivity of the diaphragm and increase the linear range of the diaphragm; the SDCD structure can improve the mechanical sensitivity of the diaphragm by releasing the initial stress and reducing the bending stiffness. Compared with controlling the parameters of the diaphragm deposition process, the method of introducing the corrugated structure is much simpler and more accurate, which greatly reduces the complexity of manufacturing technology and production cost.

3.4. Influences on the Performance of the Sensor

As the core part of diaphragm-based fiber-optic pressure sensor, the sensitive diaphragm greatly determines the performance of the sensor. In the following, the influence of the mechanical properties of the diaphragm on the sensor overall performance, such as sensitivity, measurement range and stability, will be discussed.
1. Sensitivity
The overall sensitivity of the sensor can be expressed as [16]
S s e n s o r = S m | H s e n s o r | ,
where Sm is the mechanical sensitivity of the diaphragm and | H s e n s o r | is the transfer function of the sensor, which depends on the overall structure of the sensor. Detailed discussion on the transfer function is difficult and beyond the scope of this manuscript. But according to (17), one can see that Sm has a great impact on the overall sensitivity of the sensor. It has been proved theoretically and experimentally that the sensor’s overall sensitivity will increase with the diaphragm’s mechanical sensitivity to some extent [16]. Therefore, the introduction of the corrugated structure in the diaphragm with initial stress will do good to improve the overall sensitivity of the sensor. Detailed discussion will be given in our future work.
2. Measurement range (Dynamic range)
The measurement range of the fiber-optic pressure sensor represents the range in which the output signal has a linear relationship with the input pressure. For static pressure sensors, the minimum is usually set to be zero and the maximum is the input pressure when the output remains linear. For dynamic pressure sensors, the measurement range usually is referred to as the dynamic range, where the minimum is determined by the minimum detectable pressure (MDP), and the maximum depends on the total harmonic distortion in the output signal caused by the nonlinearity. Typically, the output response of the sensor is considered linear when the total harmonic distortion is less than −30 dB [16].
The MDP can be expressed as [47]
P M D P = U / M V ,
where PMDP is the minimum detectable pressure of the sensor (Pa/Hz1/2), U is the measured overall noise spectrum of the sensor (V/Hz1/2), MV is the measured voltage sensitivity of the sensor (V/Pa). For fiber-optic pressure sensors, the overall noise is usually dominated by the environmental noise, which varies little for different sensors. Therefore, the MDP depends on the voltage sensitivity of the sensor. As the voltage sensitivity can be rewritten as Mv = kSm (k is a constant in the measurement range), the MDP will decrease with the increase in the sensor’s mechanical sensitivity.
For the case of “with initial stress”, the corrugated structure can effectively improve the overall sensitivity of the sensor, thus reducing the MDP of the sensor. Meanwhile, as the cubic item (or the nonlinear item) in Equation (10) is reduced with the help of corrugations, the maximum linear deform range of the diaphragm (or the upper limits of the measurement range) will increase. Both lead to the extension of the sensor’s measurement range, for static and dynamic pressure sensor simultaneously.
But things will change in the case of “without initial stress”. For the static pressure sensor, the measurement range will increase due to the reduction of the cubic item in Equation (5). For the dynamic pressure sensor, the corrugated structure will reduce the overall sensitivity of the sensor, thus increasing the MDP of the sensor. So, the estimation of change of the sensor’s measurement range is difficult. The measurement range of the sensor in this case should be determined by experiment.
3. Stability
As discussed in Equations (10) and (16), the diaphragm’s internal stress, no matter how it is generated, will be released more or less by the corrugation. It has been calculated that the corrugated zone in a diaphragm can easily reduce the stress by more than 1000 times [48]. Therefore, the CD-based sensors’ thermal stability will be greater than that of FD-based sensors. CD has already been used to help the mechanical sensor to achieve stress-free packaging [49], or reduce the sensitivity of the sensor to temperature [50,51].

4. The Application of CDs in Miniature Fiber-Optic Pressure Sensors

CDs have been studied for quite a long time and were first widely used in capacitive pressure sensors and RF MEMS switches [41,42,44,45,46,52,53,54,55,56]. Introducing the corrugated structure into the fiber-optic sensor can significantly improve the performance of sensors. The CD-based EFPI fiber-optic pressure sensors have been favored by researchers because of their advantages, such as high sensitivity, large dynamic range, good linearity, and easy integration with signal processing circuits.

4.1. In the Miniature Fiber-Optic Static Pressure Sensors

The general requirements for a static pressure sensor are to have as small a size as possible and as large a linear working range on the premise of satisfying the sensitivity. For applications in harsh environments, it is generally necessary to have good heat resistance; for medical applications, it is necessary to have good biocompatibility. The introduction of the corrugated structure helps to reduce the influence temperature on the internal stress of the diaphragm, which is convenient for the design and fabrication of the pressure sensor under high temperature conditions.
In 1993, Rao, Y.J. et al. [18] reported the first prototype multimode fiber-based F-P high-accuracy pressure probe utilizing a CD with built-in temperature compensation. The F-P cavity of the probe consisted of the surface of a thin glass plate bonded to a CD and the end face of a multimode fiber. Within the full pressure range of 10 bar (1 MPa), a measurement range to resolution of 3.6 × 10⁴ 1 and an overall measurement accuracy of ±0.15% were achieved. This system represented a practical approach for industrial use.
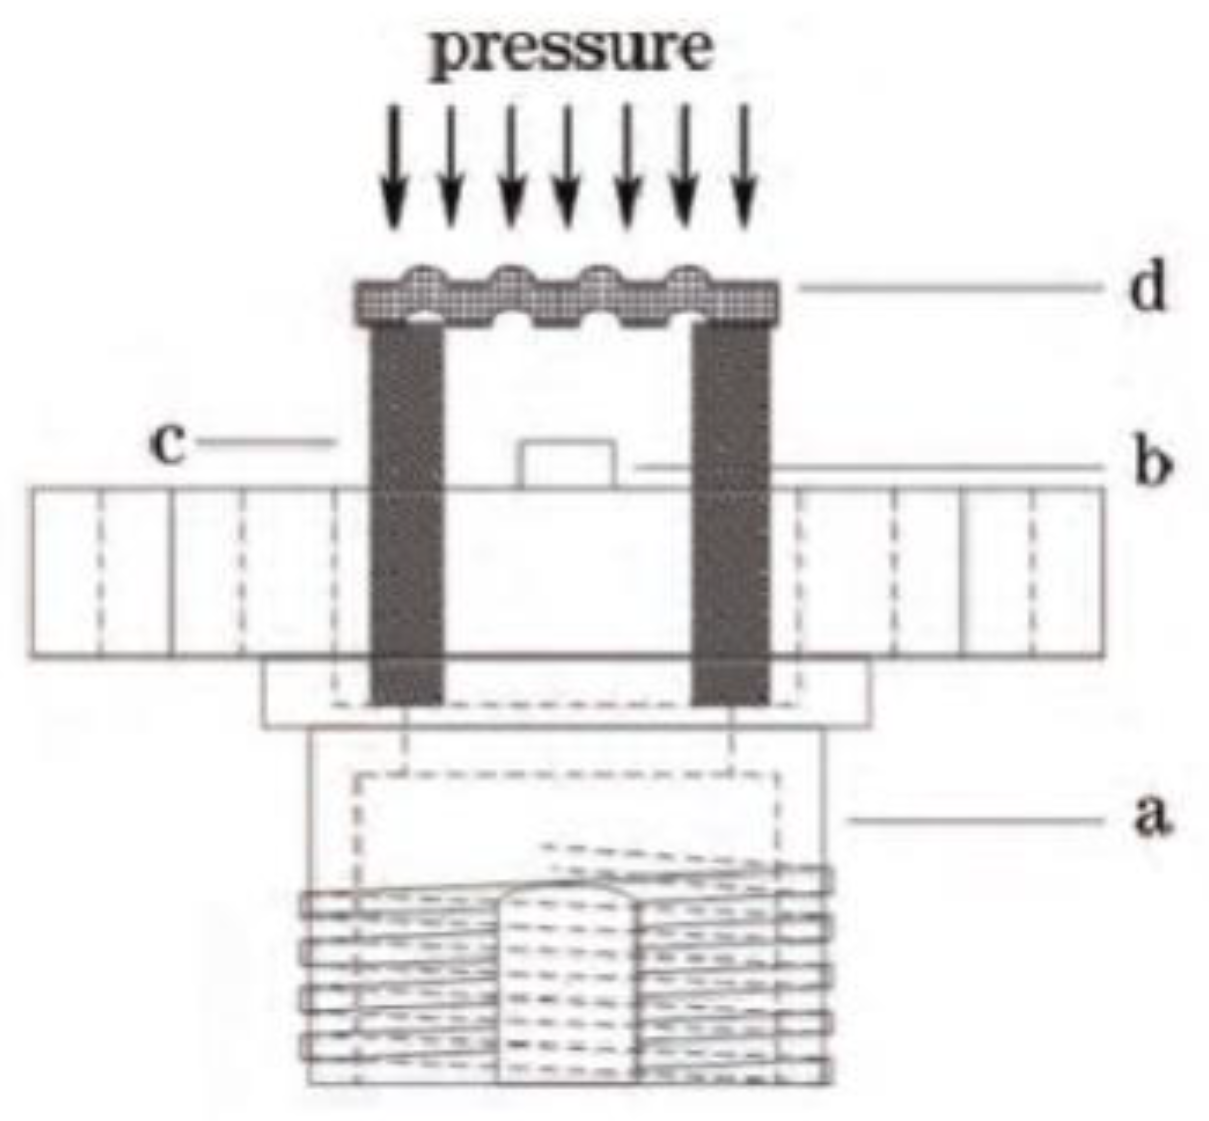
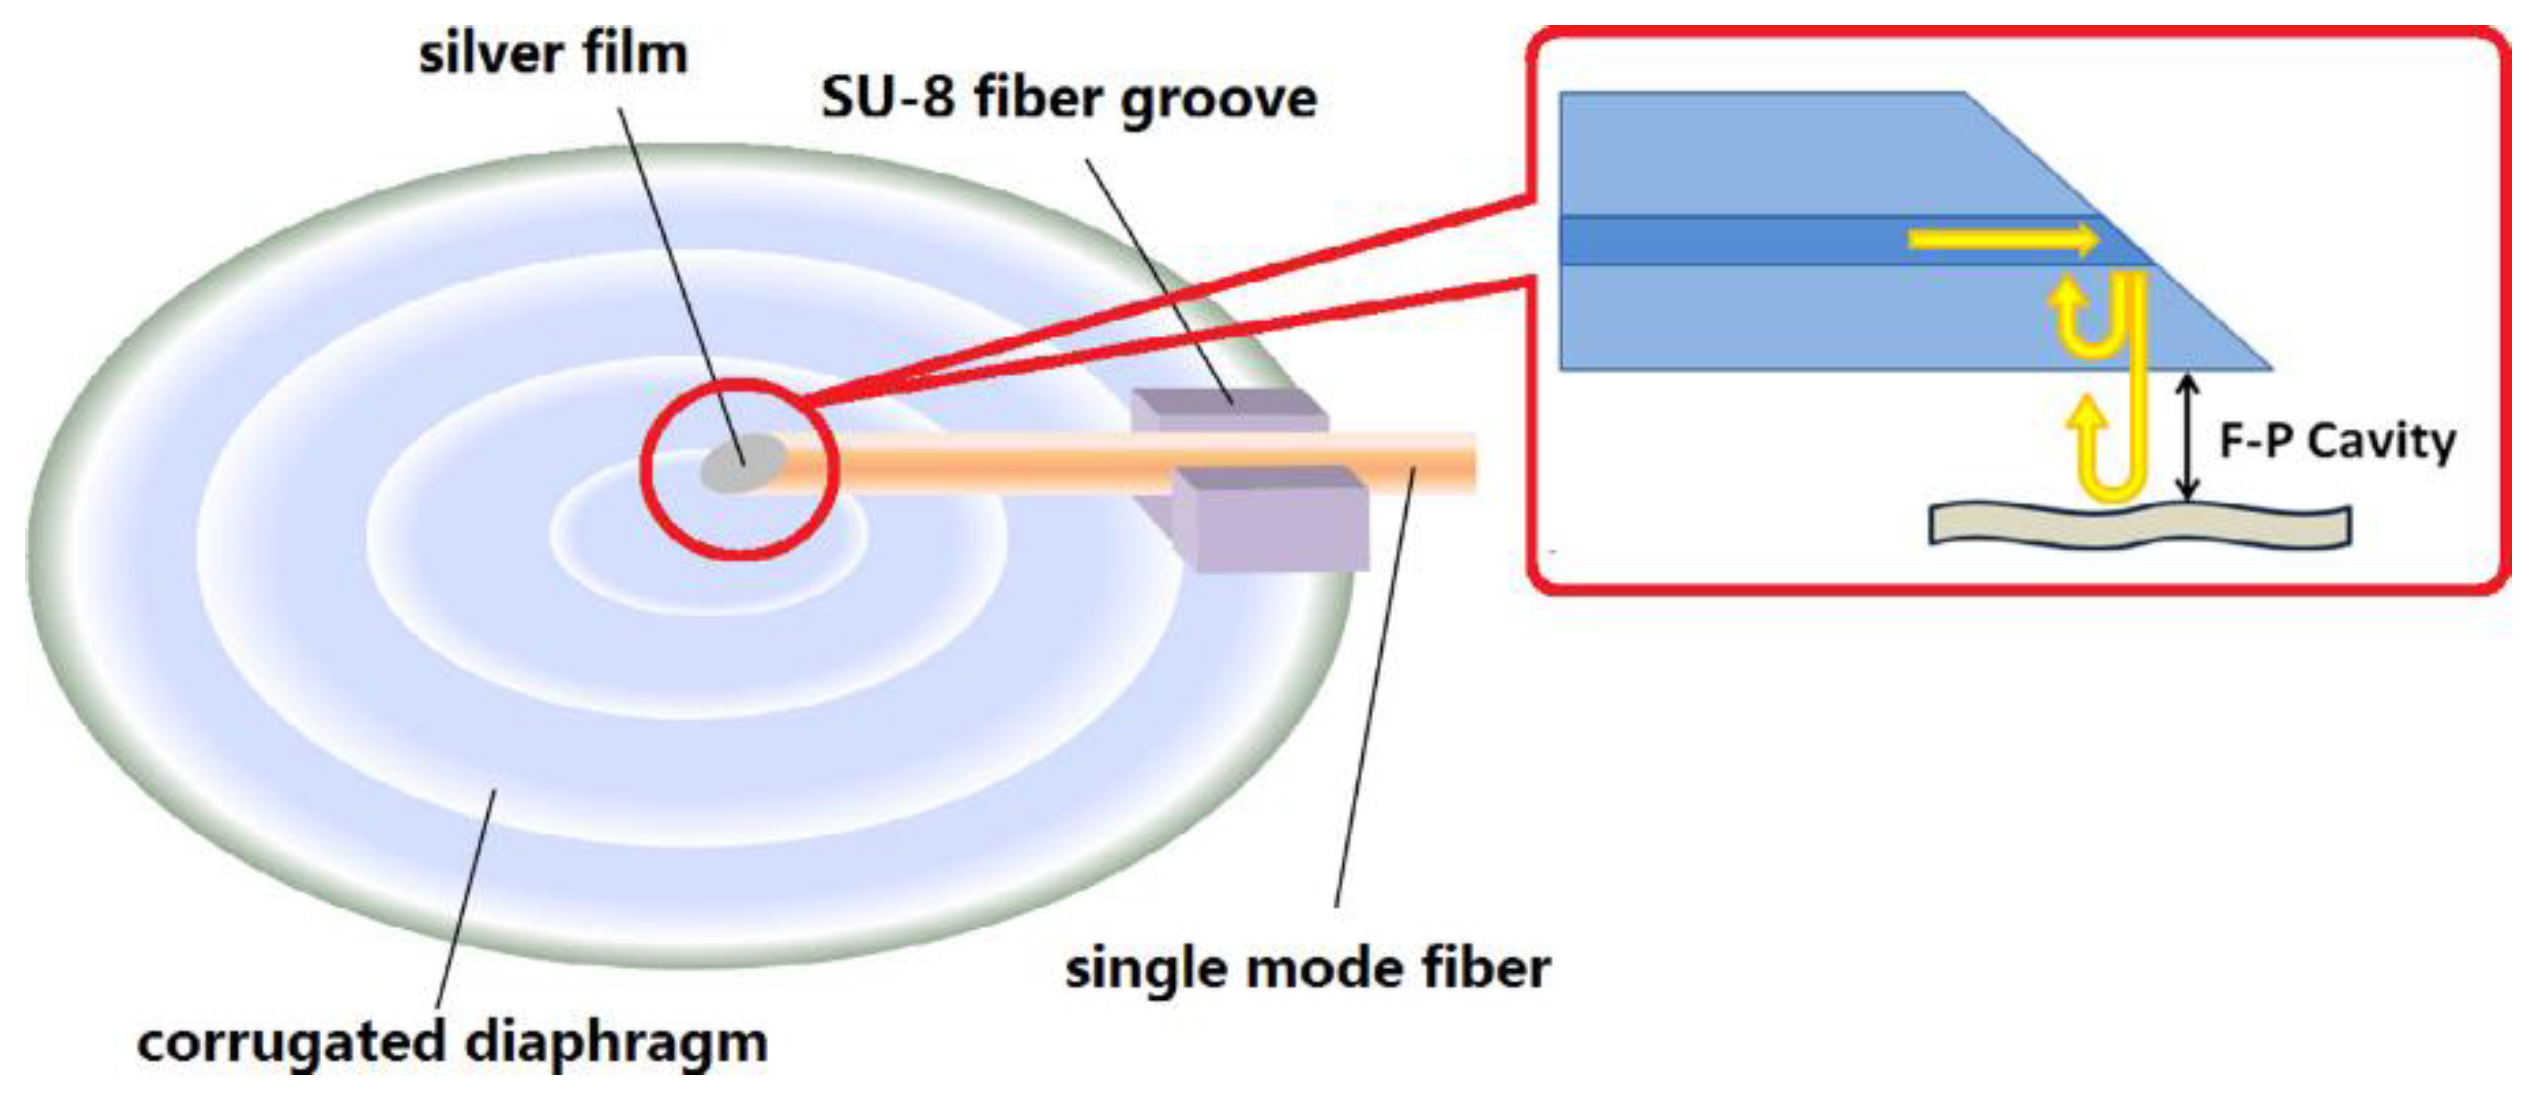
In 2015, Chen Lu et al. [19] designed and fabricated a fiber-optic F-P pressure sensor based on CD. The structure of the sensor is shown in Figure 7. The material of the annular CD was 316L stainless steel with a radius of 4600 μm, a thickness of 30 μm, a corrugation depth of 60 μm and a corrugation width of 750 μm. Experimental results showed that the sensor had good linearity over the pressure range of 0~0.1 MPa, and the sensitivity was up to 518 μm /MPa, compared with the pressure sensor with the boss structure in the central area of the diaphragm which, was designed by their group [57] in 2008; the sensitivity was increased by two orders of magnitude. In 2017, Zhu Jiali et al. [20] designed and fabricated an annular CD-based fiber-optic pressure sensor with a novel F-P structure, which further improved the sensitivity of the sensor and reduced the influence of temperature on the measurement accuracy of the sensor. The structure of the CD was similar to the previous one, and the material was also 316L stainless steel. As shown in Figure 8, the F-P cavity was composed of sidewall of a 45° polished single-mode fiber which had a silver-plated end face and a CD. Experimental results showed that the sensor had good linearity and repeatability over the pressure range of 0~0.1 MPa, and the sensitivity reached 705.64 um/MPa. In addition, the temperature compensation was achieved by measuring the relationship between temperature change from 15 °C to 65 °C with cavity length.
In 2017, Zhao Qingchao et al. [21] developed a CD-based EFPI fiber-optic pressure sensor, which provided a new idea for the design of pressure sensors applied in oil and gas wells. As shown in Figure 9, the F-P cavity adopted a capillary structure, and the measured medium was isolated from the fiber F-P cavity by CD, which could transmit pressure simultaneously; the influence of temperature change on the cavity length of the F-P cavity was compensated for by a fiber grating connected with fiber F-P cavity in series. The connection point material was quartz, which solved the high temperature creep problem which existed in the gelatinized package. The pressure measuring range of the sensor was 0~69 MPa, which had the advantages of high resolution, good repeatability, small hysteresis and stable long-term operation. However, the ambient temperature during measurement was only 100 °C, the application of this sensor in higher temperature environments needs to be detected.
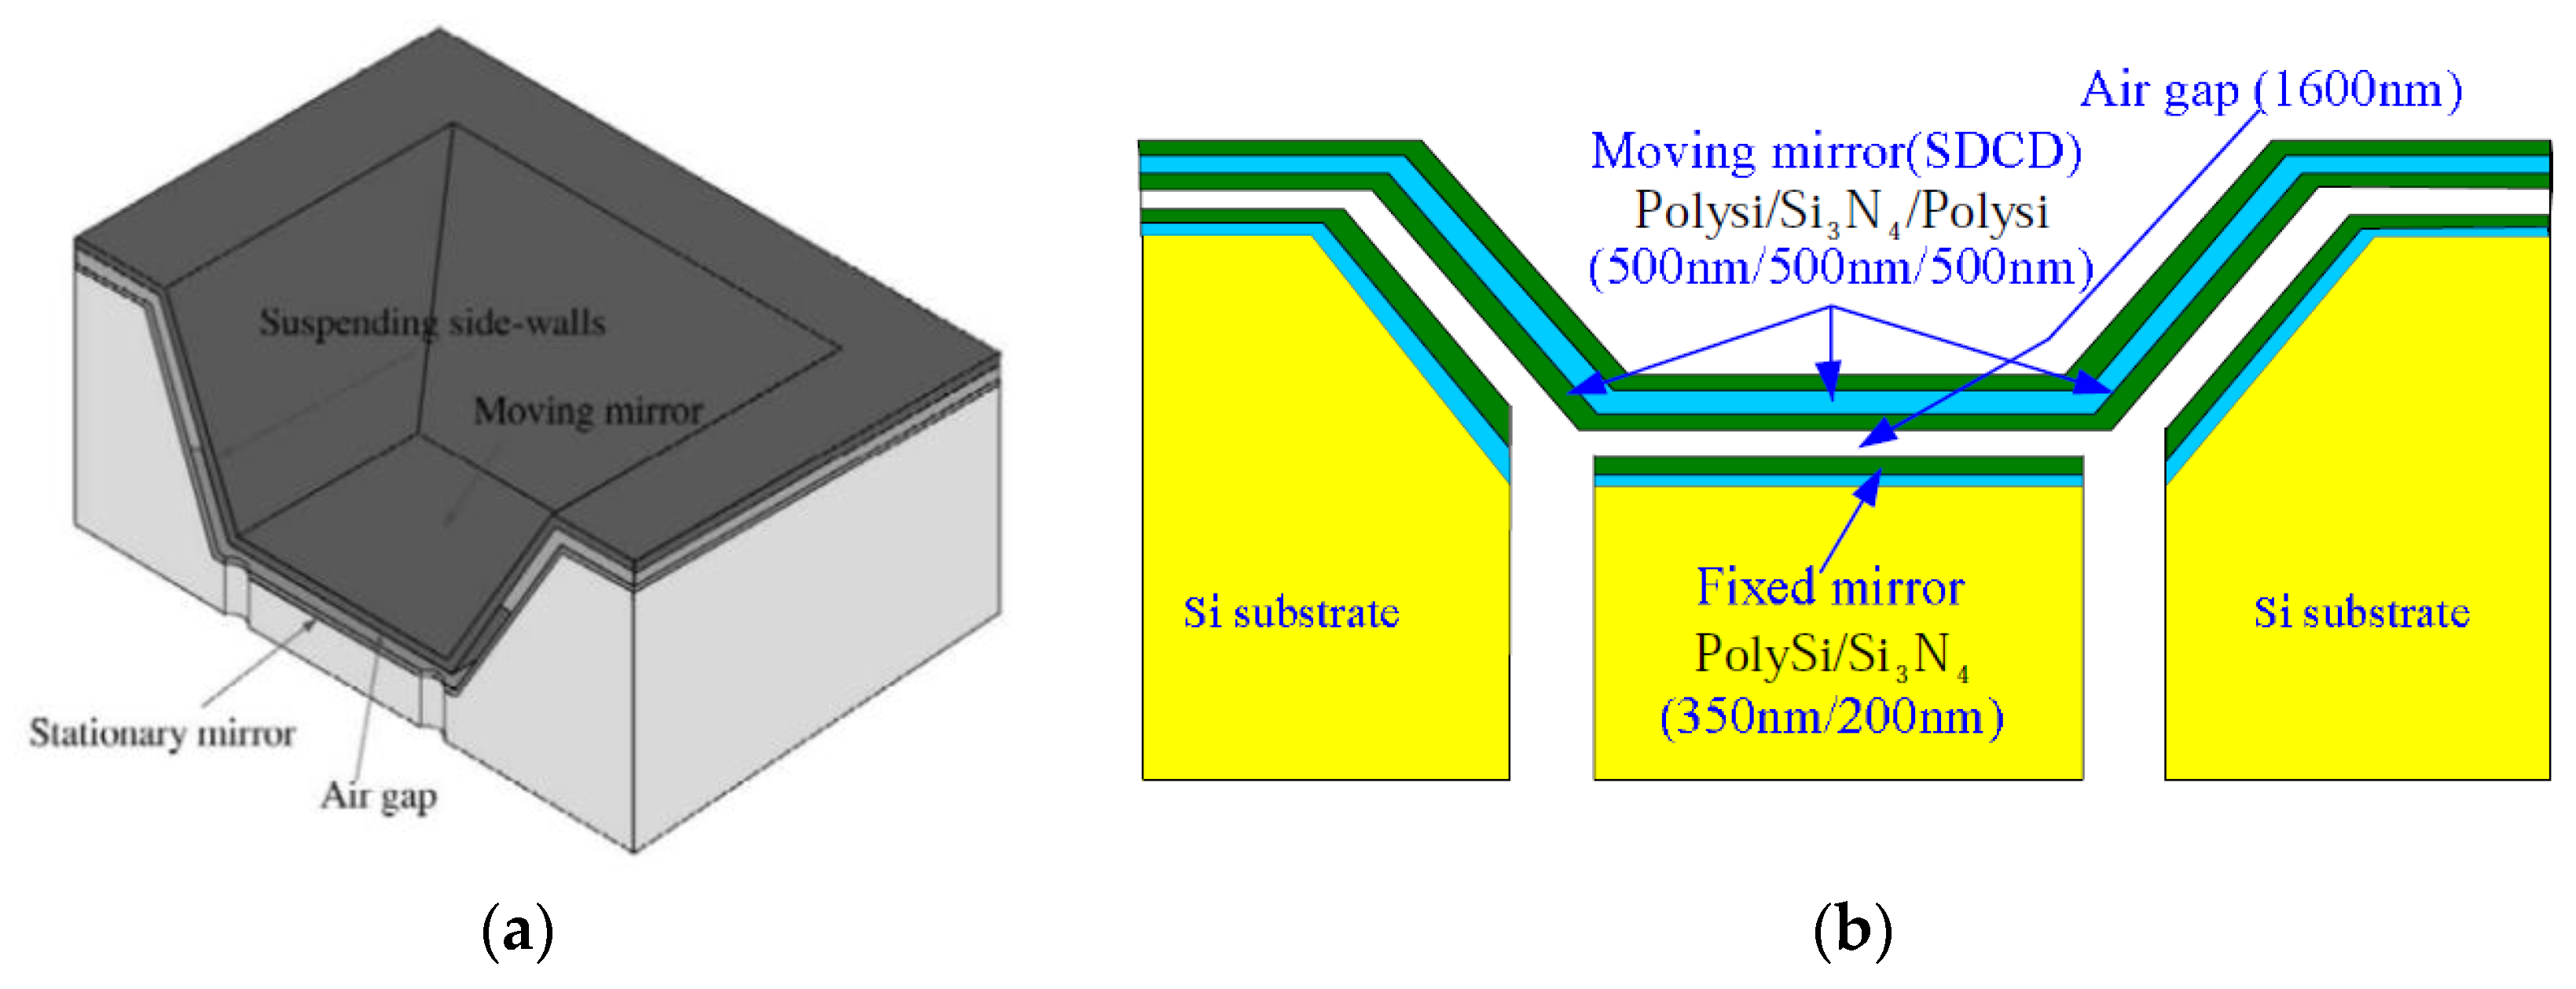
CD-based pressure sensors have also been used in the medical field. In addition to the good biocompatibility of the diaphragm, the size of the pressure sensor for intravascular measurement must be ultra-miniature. In 2003, Wang, W.J. et al. [58,59] presented an F-P micro cavity structure with a novel, single deep corrugated diaphragm (SDCD). The F-P micro cavity was fabricated on a single-chip using both surface and bulk micromachining techniques which facilitated the mass production and F-P micro cavity was significantly miniaturized, they could apply the advantage of small size and dense arrays, which played an important role in medical applications. The proposed F-P micro cavity sensing component, as shown in Figure 10, was composed of three parts: the SDCD structure that served as a moving mirror composed of a polysilicon/silicon nitride/polysilicon composite diaphragm; a bottom diaphragm that served as the stationary mirror; and the gap between the moving and the stationary mirrors of the F-P micro cavity. The theoretical analyses, as well as the measurements, showed that the SDCD-based structure could enhance the flatness of the diaphragm and significantly reduce the signal-averaging effect for the proposed F-P micro cavity pressure sensor. The next year, based on the previous work, the research team [51] proved that the proposed SDCD structure could substantially reduce the cross-sensitivity to temperature of the F-P pressure sensor.
In 2006, Guo Dagang et al. [22] designed a dual-fiber F-P pressure sensor using this SDCD F-P micro cavity structure for blood pressure measurement. Structural parameters of the F-P micro cavity and the structure of the sensor are shown in Figure 11a,b respectively. The bottom area of the SDCD was 150 μm × 150 μm and the corrugation depth was 40 μm. The aim of adopting a double fiber structure was to minimize such unwanted perturbation in the output signal. Experimental results showed that the proposed pressure sensor achieved less than 2% nonlinearity in the blood pressure range of 0~150 mmHg (0~20 kPa). In 2018, Amr A. Sharawi et al. [23] proposed a CD-based miniature EFPI pressure sensor model for pulse pressure detection. The diaphragm’s material was silicon nitride, and the total diameter of the sensor was only 650 μm. The simulation results showed that the sensor designed gained a static pressure range of 0~300 mmHg (0~40 kPa) and the sensitivity was 2.13 × 10⁻³ mm/mmHg (16 μm/MPa). At present, the CD-based pressure sensors applied in the medical field are still in the experimental stage, and the pressure measurement range and structural size basically meet the requirements, but the sensor also has many defects, such as low sensitivity, poor linearity, and poor stability.
Performance comparisons were made between the CD-based static pressure sensor and conventionally commercialized electric pressure sensor, as shown in Table 1. In this paper, three electronic pressure transmitters applied to different fields produced by JUMO of Germany were selected, and their types are 404366, 402050 and 404327 respectively. (Note: Some of the performance parameters in the table are not given or qualitatively described, as the corresponding parameters are not explicitly given in the literature or data sheet.). One can find that CD-based fiber optic pressure sensors have been used in all the fields that commercial electronic pressure sensors have been used.
However, the performance of CD-based static pressure sensors still has many shortcomings, such as low sensitivity, small measurement pressure range, and poor stability. Especially in harsh environments (high temperature, high pressure, strong corrosion, limited space, etc.), the performance of the sensor is still not satisfactory. In the future, it will be necessary to further optimize the material selection and structural design of the diaphragm. On the other hand, it is necessary to design the appropriate sensor structure and consider the appropriate manufacturing technology to meet the needs of a specific environment.

4.2. In the Miniature Fiber-Optic Acoustic Pressure Sensors

For the acoustic pressure sensor, in addition to the high sensitivity and large linear working range required by the static pressure sensor, wide and flat frequency response and small MDP are required. Vibration diaphragm with both high mechanical and optical quality is the key to determine the performance of the acoustic pressure sensor [15,60]. The introduction of the corrugated structure can release the initial stress and improve the mechanical sensitivity.
In 2015, Gong Kui [24] proposed an EFPI fiber-optic acoustic pressure sensor based on silicon dioxide annular CD to measure gas concentration. The CD was fabricated using the MEMS process and its surface was coated with a layer of gold film with a thickness of about 50 nm. Experimental tests showed that the probe voltage sensitivity was 7.3374 mV/Pa and the MDP was 115.04 μPa/Hz1/2 at a frequency of 10 kHz. The gas concentration sensor was designed and manufactured with the main resonant frequency of the diaphragm at 4.275 kHz as the characteristic sensing frequency, and its minimum detectable concentration sensitivity was 1356.15 ppm/Hz1/2. However, due to the immature release process, large residual stress, and up to 1200 nm thickness of diaphragm, the acoustic pressure response sensitivity of the diaphragm and the detectable concentration sensitivity of the fiber-optic gas concentration sensor based on this CD were not very high. In 2018, Cheng Jianmin [25] designed and fabricated an EFPI fiber-optic acoustic pressure sensor based on an aluminum-polyimide film (Al-Pl) CD using the same manufacture method. The thickness of the diaphragm was about 300 nm, and the front diameter of the acoustic pressure sensor formed was only 2 mm. However, the sensor did not perform well when tested. The fabrication of the above two kinds of diaphragms required processing both sides of the silicon substrate, and the diaphragm was released by etching off the silicon substrate, which was rather complex.
The most common applications of fiber-optic acoustic pressure sensors based on CD are fiber-optic microphones (FOM) and fiber-optic hydrophones. In 2017, Wang Ailin [17] adopted a simpler MEMS process to fabricate CD. Only one side of the silicon substrate was processed, and the diaphragm was fabricated on the sacrificial layer by deposition and then released by etching the sacrificial layer. This manufacturing technology had good repeatability and low production cost, which was advantageous for mass production. Based on this manufacturing technology, EFPI fiber optic sound pressure sensors based on metal CD were fabricated; the materials contain metal and polyethylene terephthalate (PET). The metal CDs were made of silver, their diameter, thickness, corrugation width and number of corrugations were 2.5 mm, 210 nm, 50 μm and 7 respectively. Tests in air showed that the sensor based on metal corrugation diaphragm with the corrugation depth of 2.3 μm had a relatively uniform frequency response between 80 and 1000 Hz, the phase sensitivity was −123.42 dB re 1 rad/μPa, and the corresponding mechanical sensitivity was 83.24 nm/Pa. The MDP at 1 kHz was 57.45 μPa/Hz1/2 and the dynamic range was 67.41 dB.
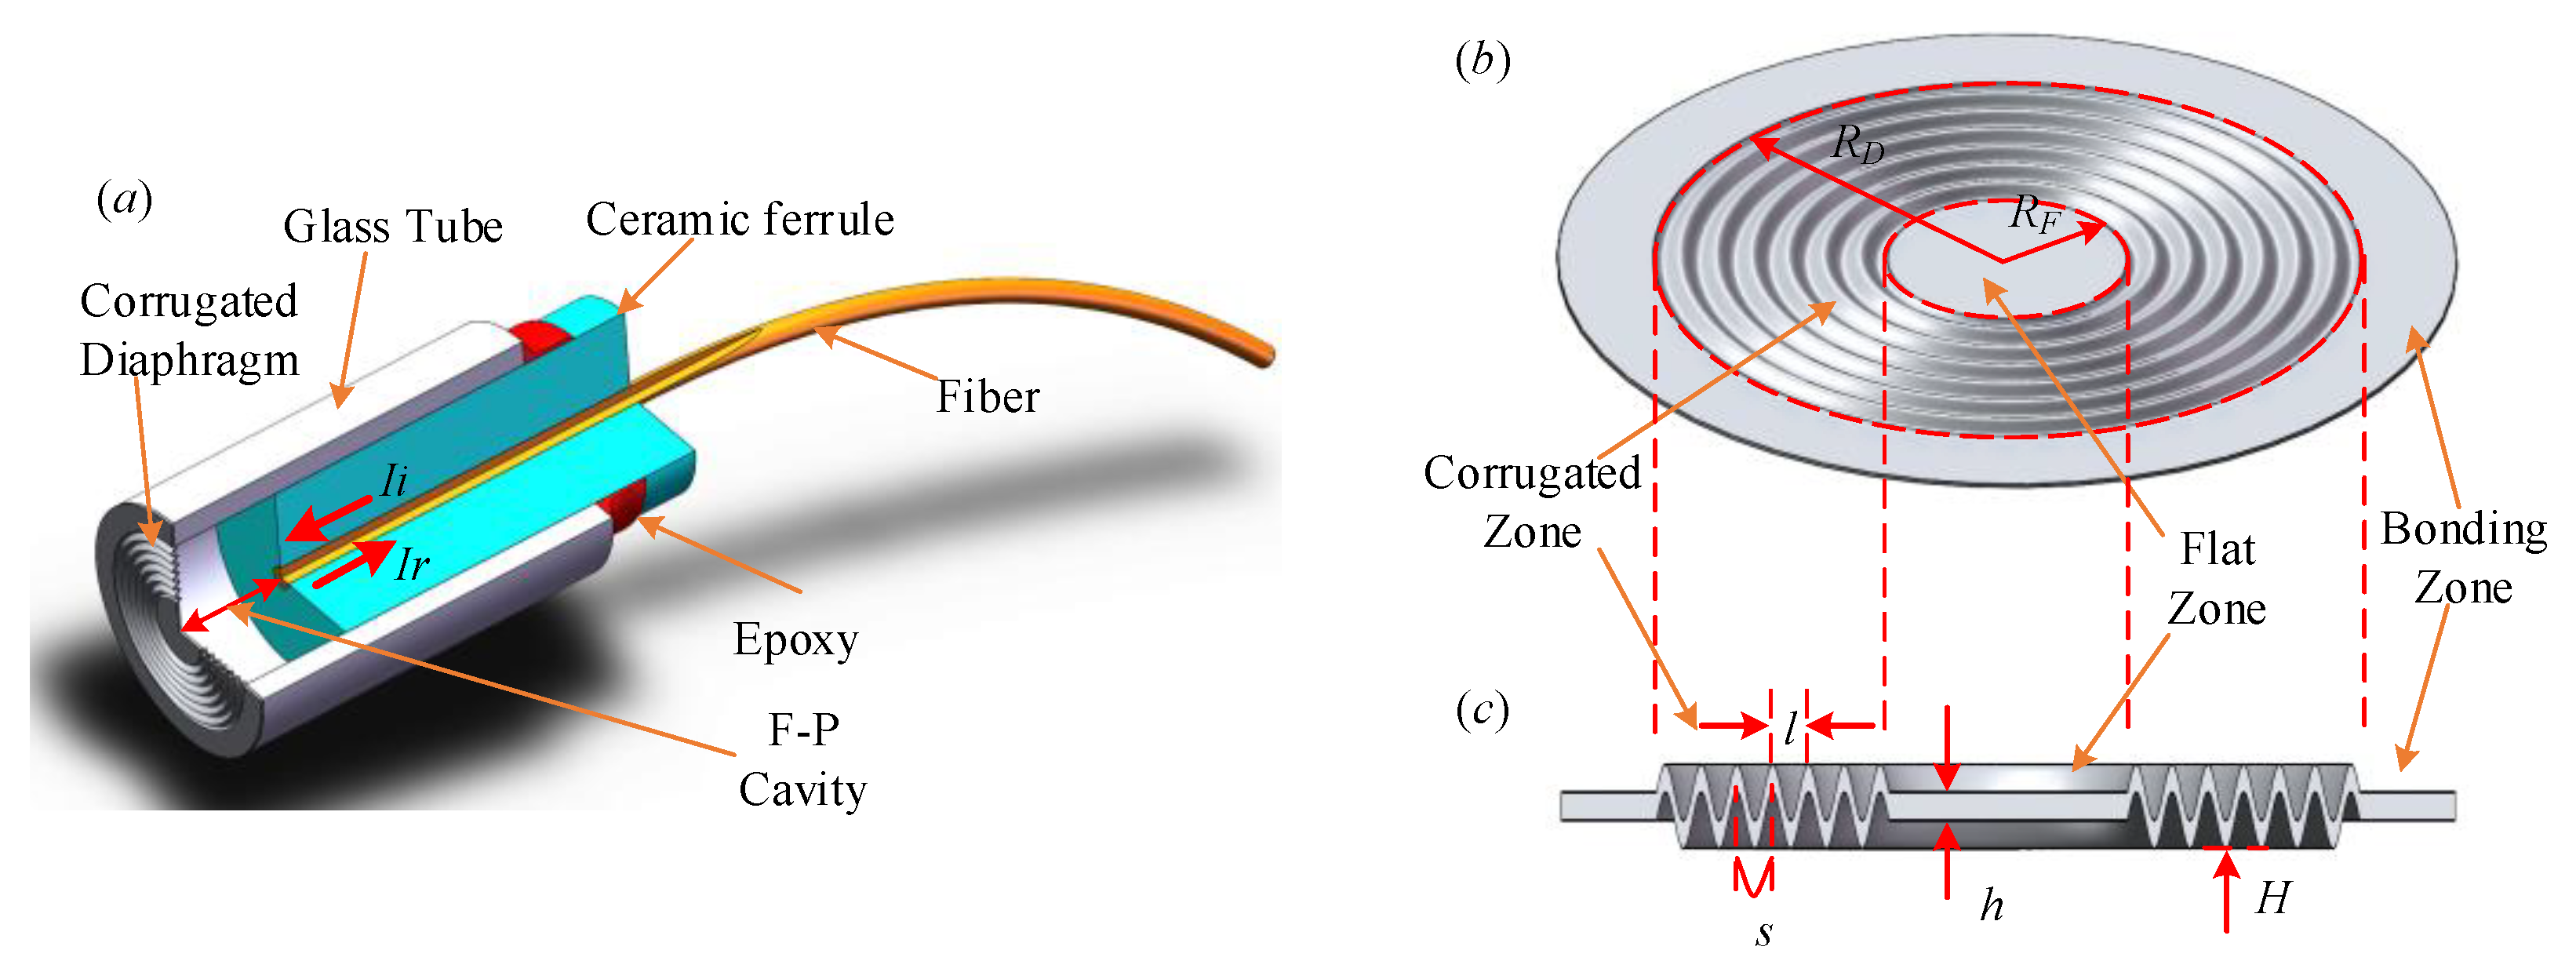
In 2018, Liu Bin et al. [26] designed and fabricated a fiber-optic microphone with EFPI structure based on corrugated silver diaphragm. The structure is shown in Figure 12. The rectangular corrugated structure was introduced into the diaphragm by “gray-scale exposure”, and the corrugation depth could be easily controlled by adjusting the exposure duration. The radius, thickness, corrugation depth, corrugation width and corrugation period of the diaphragm were 1.25 mm, 200 nm, 3 um, 0.05 mm and 0.1 mm, and a number of corrugations of 7. The experimental results showed that the mechanical sensitivity of the CD was 52 nm/Pa, which was twice that of the FD under the same parameters. The FOM had a uniform frequency response in the range of 63~1 kHz, the phase sensitivity was −127.5 dB re 1 rad/μPa, and the MDP and dynamic range were 86.97 μPa/Hz1/2 and 64.88dB at 1 kHz, respectively. The proposed FOM was simple in manufacturing technology and low in cost, which was expected to be applied in the field of weak acoustic sensing.
Similarly, in 2018, Lu Xueqi et al. [27] developed a miniature fiber-optic microphone based on a silicon nitride CD to improve the MDP and frequency response range of the microphone. The CD was fabricated using the bulk-silicon micromachining technology of MEMS. The diaphragm had a size of 1.9 mm × 1.9 mm, a corrugation width of about 25 μm, and a corrugation number of 5. The FOM with a thickness of 400 nm was tested to have a flat frequency response and a linear sound pressure response in the audible sound frequency range. The acoustic pressure sensitivity was 2.23 V/Pa and the maximum measurable pressure was 165 mPa at the acoustic pressure signal of 1 kHz. Under the acoustic pressure signal of 37.76 mPa and 1 kHz, the signal-to-noise ratio was 79.08 dB, and the corresponding MDP reached 2.97 μPa/Hz1/2.
Similarly, the performance parameters of CD acoustic pressure sensor are compared with those of commercially electronic acoustic pressure sensor (B&K 4192), as shown in Table 2.
At present, CD-based acoustic pressure sensors have shown great superiority in sensitivity, and the frequency response range has also gradually improved. But the shortcomings, such as high self-noise, low consistency and poor stability, still need to be resolved. There is a trade-off between the bandwidth and mechanical sensitivity of this sensor, and the diaphragm may be easily damaged under strong acoustic pressure, so a more suitable diaphragm structure needs to be designed. With further research and development, CD-based acoustic pressure sensors will have great potential in practical applications.

5. Conclusions

In this paper, the application status of CDs in miniature fiber-optic pressure sensors has been reviewed. It was proved by both theory and experiment that the introduction of a corrugated structure can effectively reduce the influence of diaphragm’s initial stress and improve the mechanical sensitivity and linear range of the diaphragm, and thus improve the overall sensitivity, measurement pressure range and stability of the sensor. CD-based fiber optic pressure sensors have been developing towards being high performance, anti-harsh environment, micro-sized, low in cost and practical in application. However, up to now, most of the sensors have still been in the experimental stage, and their performance in some aspects needs to be improved compared with commercially electronic pressure sensors. The main obstacles to the practical application of CD-based miniature fiber-optic pressure sensors are as follows:
  • The fabrication of CDs: At present, almost all CDs are fabrication by MEMS technology, including photolithography, thin film technology, etching technology, and so on. Some of the processing parameters are difficult to control accurately, which makes the center area of the CD uneven, resulting in a reduction in the accuracy and consistency of the CD, and seriously affecting the performance of the sensor. It could be said that the manufacturing technology is currently the main factor that limits the practical application of the CD-based miniature fiber-optic pressure sensor.
  • The bonding method of the sensor: At present, most components of the CD-based miniature fiber-optic pressure sensor are fixed by curing glue. Due to the large thermal expansion coefficient of the curing gel, the sensor’s performance is greatly affected by temperature, and the length of the F-P cavity will be changed during the use, which makes the temperature-pressure crossover sensitivity of the sensor large, limiting the high temperature performance of the sensor.
  • The packaging of the sensor: At present, MEMS devices mainly use chip-level packaging, that is, dicing before releasing, which can avoid damage to the diaphragm in dicing process, but this method cannot be mass-produced, and the size of the product is large with high cost.
  • For the existing problems, the following improvements can be made:
  • Develop more suitable and easy-to-control MEMS technology to reduce the difficulty of controlling technological parameters and improve the accuracy and consistency of the CD.
  • Develop new diaphragm materials, design new structures of diaphragm and sensor to improve the performance of diaphragm-based pressure sensors to meet the needs of different application environments.
  • Consider the packaging of the sensor according to the actual situation, select the appropriate bonding method, and use wafer-level packaging which releases the diaphragm first and then performs dicing, so as to improve the production efficiency.
  • Consider the integration of a temperature sensor with the pressure sensor to compensate for the influence of temperature change on the performance of the sensor.
Although there are still many problems in the practical mass production of the CD-based miniature fiber-optic pressure sensors, the unique advantages of the corrugated structure make CDs attractive to use in the application of the miniature fiber-optic pressure sensors. It is the existence of these problems that makes the research on CD-based miniature fiber-optic pressure sensors of great interest. With the continuous emergence of new materials, the innovation of design structures and manufacturing techniques, CD-based miniature fiber-optic pressure sensors will usher in a new opportunity for development, the performance of the sensor will be gradually improved, the production cost will gradually decline, and ultimately practical application will be achieved. In the future, the signal processing unit can be integrated on the pressure sensor to form an intelligent measurement system. At the same time, with the progress of the manufacturing technique, multiple types of sensors can be integrated on the same chip, and multi-parameter measurements can be carried out simultaneously to improve the application range and practical value of pressure sensors. It can be predicted that the CD-based miniature fiber-optic pressures sensor will play important roles in more fields and their development prospects will be very broad.

Author Contributions

Conceptualization, H.L. and H.D.; writing—original draft preparation, H.D.; writing—review and editing, H.L., H.D., G.Z., B.L.; supervision, M.S.; project administration, Z.Z. and B.L.; funding acquisition, B.L.

Funding

This research was funded by Heilongjiang Science Foundation of China (QC2018076, LC2018027), National Natural Science Foundation of China (61775046) and the Fundamental Research Funds for the Central Universities (3072019CF0801).

Conflicts of Interest

The authors declare no conflict of interest.

References

  1. Qiao, X.G.; Shao, Z.H.; Bao, W.J.; Rong, Q.Z. Fiber-optic ultrasonic sensors and applications. Acta Phys. Sin. 2017, 66, 074205. [Google Scholar] [CrossRef]
  2. Zhou, W.; Hou, W.; Zhang, H. Development and Application of Fiber-optic Pressure Sensor in Medical Field. Zhongguo Yi Liao Qi Xie Za Zhi 2018, 42, 354–356. [Google Scholar] [CrossRef] [PubMed]
  3. Wang, X.N. Study on the Optical Fiber EFPI Sensor System and Its Applications in Gas and Oil Well. Ph.D. Thesis, Dalian University of Technology, Dalian, China, 2008. [Google Scholar]
  4. Wooler, J.P.; Crickmore, R.I. Fiber-optic microphones for battlefield acoustics. Appl. Opt. 2007, 46, 2486–2491. [Google Scholar] [CrossRef]
  5. López-Higuera, J.M.; Jones, J.D.C.; López-Amo, M.; Santos, J.L.; Krisch, H.; Niermann, B.; Gedikli, A.; Tenderenda, T.; Nasilowski, T. Advanced photonic vortex flowmeter with interferometer sensor for measurement of wide dynamic range of medium velocity at high temperature and high pressure. In Proceedings of the 23rd International Conference on Optical Fibre Sensors, Santander, Spain, 2–6 June 2014. [Google Scholar]
  6. Jindal, S.K.; Raghuwanshi, S.K.; Kumar, A. Realization of MOEMS pressure sensor using mach zehnder interferometer. J. Mech. Sci. Technol. 2015, 29, 3831–3839. [Google Scholar] [CrossRef]
  7. Thondagere, C.; Kaushalram, A.; Srinivas, T.; Hegde, G. Mathematical modeling of optical MEMS differential pressure sensor using waveguide Bragg gratings embedded in Mach Zehnder interferometer. J. Opt. 2018, 20, 085802. [Google Scholar] [CrossRef]
  8. Liu, L.; Lu, P.; Wang, S.; Liao, H. A Novel Acoustic Sensor Based on a PP/PET Diaphragm. In Proceedings of the 2015 Opto-Electronics and Communications Conference (Oecc), Shanghai, China, 28 June–2 July 2015. [Google Scholar]
  9. Liao, H.; Lu, P.; Liu, D.; Liu, L.; Zhang, J. Demodulation Of Diaphragm Based Fiber-optic Acoustic Sensor Using with Symmetric 3 × 3 Coupler. In Proceedings of the 2017 Opto-Electronics and Communications Conference (OECC) and Photonics Global Conference (PGC), Singapore, 31 July–4 Aug 2017. [Google Scholar]
  10. Ma, J.; Yu, Y.; Jin, W. Demodulation of diaphragm based acoustic sensor using Sagnac interferometer with stable phase bias. Opt. Express 2015, 23, 29268–29278. [Google Scholar] [CrossRef]
  11. Fu, X.; Lu, P.; Ni, W.; Liu, L.; Liao, H.; Liu, D.; Zhang, J. Intensity Demodulation Based Fiber Sensor for Dynamic Measurement of Acoustic Wave and Lateral Pressure Simultaneously. IEEE Photonics J. 2016, 8, 1–13. [Google Scholar] [CrossRef]
  12. Li, X.; Zhen, S.; Qian, K.; Liang, X.; Wang, X.; Shi, J.; Wu, X.; Yu, B. A heat-resistance and high-sensitivity acoustic pressure sensor based on aluminum-polyimide diaphragm. Sens. Actuators A Phys. 2018, 279, 75–78. [Google Scholar] [CrossRef]
  13. Han, M.; Wang, X.W.; Xu, J.C.; Cooper, K.L.; Wang, A.B. Diaphragm-based extrinsic Fabry-Perot interferometric optical fiber sensor for acoustic wave detection under high background pressure. Opt. Eng. 2005, 44. [Google Scholar] [CrossRef]
  14. Chen, L.H.; Chan, C.C.; Yuan, W.; Goh, S.K.; Sun, J. High performance chitosan diaphragm-based fiber-optic acoustic sensor. Sens. Actuators A Phys. 2010, 163, 42–47. [Google Scholar] [CrossRef]
  15. Gong, Z.; Chen, K.; Zhou, X.; Yang, Y.; Zhao, Z.; Zou, H.; Yu, Q. High-Sensitivity Fabry-Perot Interferometric Acoustic Sensor for Low-Frequency Acoustic Pressure Detections. J. Lightwave Technol. 2017, 35, 5276–5279. [Google Scholar] [CrossRef]
  16. Liu, B. Research on the Key Technologies of Micro Fiber Acoustic Sensor Based on Fabry-Perot Interferometer. Ph.D. Thesis, Harbin Institute of Technology, Harbin, China, 2017. [Google Scholar]
  17. Wang, A.L. Research on the Influence of Corrugated Structure on The Performance of Diaphragm-based EFPI Fiber Acoustic Sensor. Master’s Thesis, Harbin Institute of Technology, Harbin, China, 2017. [Google Scholar]
  18. Rao, Y.J.; Jackson, D.A. Prototype fiber-optic-based pressure probe with built-in temperature compensation with signal recovery by coherence reading. Appl. Opt. 1993, 32, 7110–7113. [Google Scholar] [CrossRef] [PubMed]
  19. Chen, L.; Zhu, J.L.; Li, Z.Y.; W, M. Optical Fiber Fabry-Perot Pressure Sensor Using Corrugated Diaphragm. Acta Optica Sinica 2016, 36, 0306002:1–0306002:5. [Google Scholar] [CrossRef]
  20. Zhu, J.; Wang, M.; Chen, L.; Ni, X.; Ni, H. An optical fiber Fabry–Perot pressure sensor using corrugated diaphragm and angle polished fiber. Opt. Fiber Technol. 2017, 34, 42–46. [Google Scholar] [CrossRef]
  21. Zhao, Z.-S.; Liao, Y.; Grattan, K.T.; Wang, W.; Jiang, D.; Zhang, W.; Wei, L.; Zhao, W.; Zhao, Q.; Wang, H.; et al. Design of fiber optic F-P cavity pressure sensor based on corrugated diaphragm. In Proceedings of the AOPC 2017: Fiber Optic Sensing and Optical Communications, Beijing, China, 4–6 June 2017. [Google Scholar]
  22. Dagang, G.; Po, S.N.C.; Hock, F.T.E.; Rongming, L. Design and Optimization of Dual Optical Fiber MEMS Pressure Sensor for Biomedical Applications. J. Phys. Conf. Ser. 2006, 34, 1073–1078. [Google Scholar] [CrossRef]
  23. Sharawi, A.A.; Aouf, M.; Kareem, G.; Elhag Osman, A.H. Sensitivity Improvement of Micro-diaphragm Deflection for Pulse Pressure Detection. In International Conference on Advanced Intelligent Systems and Informatics; Springer: Cham, Switzerland, 2018; pp. 137–151. [Google Scholar]
  24. Gong, K. Study on Fabrication of Fiber-Optic Sensor Based on Film by MEMS Technology and Its Application. Master’s Thesis, Anhui University, Hefei, China, 2015. [Google Scholar]
  25. Cheng, J.M. The Design and Experimental Study of Interferometric Microstructure Fiber Optic Sensor. Master’s Thesis, Anhui University, Hefei, China, 2018. [Google Scholar]
  26. Liu, B.; Zhou, H.; Liu, L.; Wang, X.; Shan, M.; Jin, P.; Zhong, Z. An Optical Fiber Fabry-Perot Microphone Based on Corrugated Silver Diaphragm. IEEE Trans. Instrum. Meas. 2018, 67, 1994–2000. [Google Scholar] [CrossRef]
  27. Lu, X.; Wu, Y.; Gong, Y.; Rao, Y. A Miniature Fiber-Optic Microphone Based on an Annular Corrugated MEMS Diaphragm. J. Lightwave Technol. 2018, 36, 5224–5229. [Google Scholar] [CrossRef]
  28. Tian, J.; Zhang, Q.; Fink, T.; Li, H.; Peng, W.; Han, M. Tuning operating point of extrinsic Fabry-Perot interferometric fiber-optic sensors using microstructured fiber and gas pressure. Opt. Lett. 2012, 37, 4672–4674. [Google Scholar] [CrossRef]
  29. Chen, J.; Chen, D.; Geng, J.; Li, J.; Cai, H.; Fang, Z. Stabilization of optical Fabry-Perot sensor by active feedback control of diode laser. Sens. Actuators A Phys. 2008, 148, 376–380. [Google Scholar] [CrossRef]
  30. Wang, A.; May, R.G.; Wang, A.; Xiao, H.; Deng, J.; Huo, W.; Wang, Z. SCIIB pressure sensors for oil extraction applications. In Proceedings of the Harsh Environment Sensors II, Boston, MA, USA, 8 December 1999; pp. 29–35. [Google Scholar]
  31. Zhang, G.; Yu, Q.; Song, S. An investigation of interference/intensity demodulated fiber-optic Fabry-Perot cavity sensor. Sens. Actuators A Phys. 2004, 116, 33–38. [Google Scholar] [CrossRef]
  32. Murphy, K.A.; Gunther, M.F.; Vengsarka, A.M.; Claus, R.O. Quadrature phase-shifted, extrinsic Fabry-Perot optical fiber sensors. Opt. Lett. 1991, 16, 273–275. [Google Scholar] [CrossRef] [PubMed]
  33. Dahlem, M.; Santos, J.L.; Ferreira, L.A.; Araújo, F.M. Passive interrogation of low-finesse Fabry-Perotcavities using fiber Bragg gratings. IEEE Photonics Technol. Lett. 2001, 13, 990–992. [Google Scholar] [CrossRef]
  34. Schmidt, M.; Fürstenau, N. Fiber-optic extrinsic Fabry-Perot interferometer sensors with three-wavelength digital phase demodulation. Opt. Lett. 1999, 24, 599–601. [Google Scholar] [CrossRef] [PubMed]
  35. Jiang, Y. High-resolution interrogation technique for fiber optic extrinsic Fabry–Perot interferometric sensors by the peak-to-peak method. Appl. Opt. 2008, 47, 925–932. [Google Scholar] [CrossRef] [PubMed]
  36. Mei, J.; Xiao, X.; Yang, C. High-resolution and large dynamic range fiber extrinsic Fabry-Perot sensing by multi-extrema-tracing technique. Appl. Opt. 2015, 54. [Google Scholar] [CrossRef]
  37. Jiang, Y. Fourier Transform White-Light Interferometry for the Measurement of Fiber-Optic Extrinsic Fabry-Perot Interferometric Sensors. IEEE Photonics Technol. Lett. 2008, 20, 75–77. [Google Scholar] [CrossRef]
  38. Rao, Y.J.; Wang, X.J.; Zhu, T.; Zhou, C.X. Demodulation algorithm for spatial-frequency-division-multiplexed fiber-optic Fizeau strain sensor networks. Opt. Lett. 2006, 31, 700–702. [Google Scholar] [CrossRef]
  39. Wang, W.; Hu, Z.; Jiang, P.; Li, G.; Hu, Y. Breaking through the intensity restriction of the asymmetric fiber Bragg grating based Fabry-Perot sensitivity enhancement system. In Proceedings of the 7th International Symposium on Advanced Optical Manufacturing and Testing Technologies: Smart Structures and Materials for Manufacturing and Testing, Harbin, China, 26–29 April 2014. [Google Scholar]
  40. Wang, F.; Xie, J.; Hu, Z.; Xiong, S.; Luo, H.; Hu, Y. Interrogation of Extrinsic Fabry-Perot Sensors Using Path-Matched Differential Interferometry and Phase Generated Carrier Technique. J. Lightwave Technol. 2015, 33, 2392–2397. [Google Scholar] [CrossRef]
  41. Jerman, J.H. The Fabrication and Use Of Micromachined Corrugated Silicon Diaphragms. Sens. Actuators A Phys. 1990, 23, 988–992. [Google Scholar] [CrossRef]
  42. Scheeper, P.R.; Olthuis, W.; Bergveld, P. The Design, Fabrication, and Testing of Corrugated Silicon Nitride Diaphragms. J. Microelectromech. Syst. 1994, 3, 36–42. [Google Scholar] [CrossRef]
  43. Beeby, S.; Ensel, G.; Kraft, M. MEMS Mechanical Sensors; Artech House: Norwood, MA, USA, 2004. [Google Scholar]
  44. Zou, Q.B.; Liu, L.T.; Li, Z.J. Study of Corrugated Diaphragms Used in Silicon Condenser Microphones. Chin. J. Semicond. 1996, 17, 907–913. [Google Scholar]
  45. Wang, W.J.; Lin, R.M.; Li, X.; Guo, D.G. Study of single deeply corrugated diaphragms for high-sensitivity microphones. J. Micromech. Microeng. 2003, 13, 184–189. [Google Scholar] [CrossRef]
  46. Wang, W.J.; Lin, R.M.; Zou, Q.B.; Li, X.X. Modeling and characterization of a silicon condenser microphone. J. Micromech. Microeng. 2004, 14, 403–409. [Google Scholar] [CrossRef]
  47. Akkaya, O.C.; Akkaya, O.; Digonnet, M.J.F.; Kino, G.S.; Solgaard, O. Modeling and Demonstration of Thermally Stable High-Sensitivity Reproducible Acoustic Sensors. J. Microelectromech. Syst. 2012, 21, 1347–1356. [Google Scholar] [CrossRef]
  48. Spiering, V.L.; Bouwstra, S.; Spiering, R.M.E.J. On-chip decoupling zone for package-stress reduction. Sens. Actuators A Phys. 1993, 39, 149–156. [Google Scholar] [CrossRef] [Green Version]
  49. Offereins, H.L.; Sandmaier, H.; Folkmer, B.; Steger, U.; Lang, W. Stress free assembly technique for a silicon based pressure sensor. Proceedings of TRANSDUCERS ’91: 1991 International Conference on Solid-State Sensors and Actuators. Digest of Technical Papers, San Francisco, CA, USA, 24–27 June 1991; pp. 986–989. [Google Scholar]
  50. Spiering, V.L.; Bouwstra, S.; Burger, J.F.; Elwenspoek, M. Membranes fabricated with a deep single corrugation for package stress reduction and residual stress relief. J. Micromech. Microeng. 1993, 3, 242–246. [Google Scholar] [CrossRef]
  51. El-Fatatry, A.; Guo, D.G.; Wang, W.J.; Lin, R. Extrinsic Fabry-Perot pressure sensor using single deeply corrugated diaphragm technique. In Proceedings of the MOEMS and Miniaturized Systems IV, San Jose, CA, USA, 24 January 2004. [Google Scholar]
  52. Chen, J.; Liu, L.T.; Li, Z.J.; Tan, Z.M.; Xu, Y.; Ma, J. On the single-chip condenser miniature microphone using DRIE and backside etching techniques. Sens. Actuators A Phys. 2003, 103, 42–47. [Google Scholar] [CrossRef]
  53. Huang, C.H.; Lee, C.H.; Hsieh, T.M.; Tsao, L.C.; Wu, S.; Liou, J.C.; Wang, M.Y.; Chen, L.C.; Yip, M.C.; Fang, W. Implementation of the CMOS MEMS condenser microphone with corrugated metal diaphragm and silicon back-plate. Sensors 2011, 11, 6257–6269. [Google Scholar] [CrossRef]
  54. Feixiang, K.; Jianmin, M.; Oberhammer, J. A Ruthenium-Based Multimetal-Contact RF MEMS Switch with a Corrugated Diaphragm. J. Microelectromech. Syst. 2008, 17, 1447–1459. [Google Scholar] [CrossRef]
  55. Ke, F.X.; Miao, J.M.; Wang, Z.H. Ohmic series radio-frequency microelectromechanical system switch with corrugated diaphragm. J. Micro/Nanolithogr. MEMS 2009, 8, 021122. [Google Scholar] [CrossRef]
  56. Ke, F.; Miao, J.; Wang, Z. A wafer-scale encapsulated RF MEMS switch with a stress-reduced corrugated diaphragm. Sens. Actuators A Phys. 2009, 151, 237–243. [Google Scholar] [CrossRef]
  57. Ge, Y.X.; Wang, M.; Yan, H.T. Optical MEMS pressure sensor based on a mesa-diaphragm structure. Opt. Express 2008, 16, 21746–21752. [Google Scholar] [CrossRef]
  58. Wang, W.J.; Lin, R.M.; Sun, T.T.; Guo, D.G.; Ren, Y. Performance-enhanced Fabry-Perot microcavity structure with a novel non-planar diaphragm. Microelectron. Eng. 2003, 70, 102–108. [Google Scholar] [CrossRef]
  59. Wang, W.J.; Lin, R.M.; Ren, Y.; Sun, T.T.; Guo, D.G. Fabry-Perot microcavity pressure sensor with a novel single deeply corrugated diaphragm. Microw. Opt. Technol. Lett. 2003, 39, 240–243. [Google Scholar] [CrossRef]
  60. Kilic, O.; Digonnet, M.; Kino, G.; Solgaard, O. External fibre Fabry-Perot acoustic sensor based on a photonic-crystal mirror. Meas. Sci. Technol. 2007, 18, 3049–3054. [Google Scholar] [CrossRef]
Figure 1. The typical structure of a diaphragm-based extrinsic Fabry-Perot interferometer (EFPI) fiber-optic pressure sensor. (a) Fiber-tip structure; (b) Fiber-end structure.
Applsci 09 02241 g001
Figure 2. Schematic of intensity demodulation system.
Applsci 09 02241 g002
Figure 3. Schematic of phase demodulation system.
Applsci 09 02241 g003
Figure 4. The deflection of a flat circular diaphragm with clamped edges.
Applsci 09 02241 g004
Figure 5. The schematic view of the shallow corrugated diaphragm (CD).
Applsci 09 02241 g005
Figure 6. (a) Schematic cross section of the SDCD structure with geometrical parameters; (b) The three-dimensional cross-section of the microphone fabricated by SDCD (Reproduced from [45]).
Applsci 09 02241 g006
Figure 7. Schematic of the fiber-optic Fabry-Perot sensor based on stainless steel CD. (a: fiber flange; b: ceramic ferrule; c: glass ring; d: CD) (Reproduced from [19]).
Applsci 09 02241 g007
Figure 8. Sketch of the fiber-optic F-P pressure sensor. (Reproduced from [20]).
Applsci 09 02241 g008
Figure 9. The structure diagram of optical fiber F-P cavity pressure sensor. (Reproduced from [21]).
Applsci 09 02241 g009
Figure 10. (a) Three-dimensional schematic with cross section of the proposed SDCD FP microcavity pressure-sensing element (Reproduced from [58]); (b) Schematic view of the proposed F-P microcavity pressure sensor (Reproduced from [51]).
Applsci 09 02241 g010
Figure 11. (a) Structural parameters of the F-P microcavity; (b) Schematic view of dual optical fiber F-P pressure sensor. (Reproduced from [22]).
Applsci 09 02241 g011
Figure 12. Schematic of the proposed OFM based on CD. (a) Schematic diagram of the proposed OFM; (b) Schematic, and (c) section diagram of the CD. (Reproduced from [26]).
Applsci 09 02241 g012
Table 1. Performance of CD-based static pressure sensors and commercial electronic pressure sensors.
TypeMeasurement RangeTemperatureSensitivityAccuracyApplication
JUMO 4043660~60MPa−20~80 °C—— 0.2 % general
Rao [18]0~1MPa32~42 °C22.3 rad/bar±0.15%
Chen [19]0~0.1 MPa25 °C518 μm/MPa1.05%
Zhu [20]0~0.1 MPa15~65 °C706.64 μm /MPagood
JUMO 4020500~6 MPa-30~200 °C—— 0.2 % high temperature
Zhao [21]0~69 MPa25~100 °C211 nm/MPagood
JUMO 4043270~0.1 MPa-20~80 °C—— 0.2 % medical
Wang [22]0~20 kPa————<2%
Amr [23]0~40 kPa 1——16 μm/MPa 1——
1 FEM simulation.
Table 2. Performance of CD-based acoustic sensors and commercially electronic acoustic sensor.
TypeDynamic RangeFrequency ResponseSensitivityMDPTemperature
B&K 419219~162 dB3.15 Hz~20 kHz12.5 mV/Pa——−30~300 °C
Gong [24]————7.3374 mV/Pa115.04 μPa/Hz1/2——
Wang [17] 19.17~76.58 dB80~1000 Hz83.24 nm/Pa57.45 μPa/Hz1/2——
Wang [17] 263.6~130.94 dB31.5~800 Hz3.31 nm/Pa1514.22 μPa/Hz1/2——
Liu [26]12.77~77.65 dB63~1000 Hz52 nm/Pa86.97 μPa/Hz1/2——
Lu [27]~165 mPa20Hz~20 kHz2.23 V/Pa2.97 μPa/Hz1/2——
1 silver diaphragm based sensor with the corrugated depth of 2.3 μm tested in air. 2 PET diaphragm based sensor with the corrugated depth of 7.85 μm tested in water.