Review

Digital Shearography for NDT: Phase Measurement Technique and Recent Developments

1
School of Instrument Science and Opto-electronics Engineering, Hefei University of Technology, Hefei 230009, China
2
Department Mechanical Engineering, Oakland University, Rochester, MI 48309, USA
3
School of Instrumentation Science and Opto-electronics Engineering, Beijing Information Science and Technology University, Beijing 100192, China
*
Authors to whom correspondence should be addressed.
Appl. Sci. 2018, 8(12), 2662; https://doi.org/10.3390/app8122662
Submission received: 21 November 2018 / Revised: 11 December 2018 / Accepted: 14 December 2018 / Published: 18 December 2018
(This article belongs to the Special Issue Damage Inspection of Composite Structures)

Abstract

:
Composite materials have seen widespread use in the aerospace industry and are becoming increasingly popular in the automotive industry due to their high strength and low weight characteristics. The increasing usage of composite materials has resulted in the need for more effective techniques for nondestructive testing (NDT) of composite structures. Of these techniques, digital shearography is one the most sensitive and accurate methods for NDT. Digital shearography can directly measure strain with high sensitivity when combined with different optical setups, phase-shift techniques, and algorithms. Its simple setup and less sensitivity to environmental disturbances make it particularly well suited for practical NDT applications. This paper provides a review of the phase measurement technique and recent developments in digital shearographic NDT. The introduction of new techniques has expanded the range of digital shearography applications and made it possible to measure larger fields and detect more directional or deeper defects. At the same time, shearography for different materials is also under research, including specular surface materials, metallic materials, etc. Through the discussion of recent developments, the future development trend of digital shearography is analyzed, and the potentials and limitations are demonstrated.

1. Introduction

Composite materials have seen widespread use in the aerospace industry and are becoming increasingly popular in the automotive industry due to their high strength and low weight characteristics. Composite materials, however, have a higher possibility of having defects due to their complexity [1,2,3,4,5]. Composite materials, such as glass-fiber-reinforced materials, carbon-fiber-reinforced materials and honeycomb structures, usually have a multilayered structure with a likelihood of internal defects, particularly the separation between layers called delaminations. In addition, there are defects such as false adhesion, wrinkle, crack, impact damage, etc., which can reduce the mechanical properties of materials and even cause serious consequences. Therefore, nondestructive testing (NDT) plays an important role in ensuring that composite materials are free from defects and damage before putting into use.
With the growing requirements for product performance and reliability, the need for better NDT techniques is urgent, especially for advantages such as real-time, whole-field, noncontact, and high-sensitivity [6]. Optical NDT techniques such as holography [7], electronic speckle pattern interferometry (ESPI) [8], shearography [9], and digital image correlation (DIC) [10] all have the characteristics mentioned above. Among them, shearography has been recognized as being one of the best NDT methods for inspecting delaminations of relatively thin panels made by composite materials and honeycomb structures due to its simple setup, direct strain measurement, and relative insensitivity to environmental interruptions [11,12,13].
Shearography, also known as speckle pattern shearing interferometry, was first proposed on the basis of electronic speckle pattern interferometry (ESPI) in the 1970s. In comparison with other optical NDT techniques, shearography offers many advantages. It is similar to holography and ESPI, but it directly measures the deformation gradient and the strain information, while holography and ESPI measure just the deformation. This means shearography can reveal defects easier because defects in objects usually generate strain concentration. In addition, shearography is insensitive to small rigid body movement because a rigid-body motion does not produce strain. This means that shearography has a huge space for development in industrial operations.
Regarding the development stage, shearography can be divided into photographic shearography [14], electronic shearography [15], and digital shearography [16]. Among them, digital shearography is the latest version and the mainstream of recent development. It uses image sensors (charge-coupled device (CCD) or complementary metal-oxide semiconductor (CMOS)) to capture information and analyze data. The development of the phase measurement technique was crucial for improving the measurement sensitivity and phase map quality of digital shearography [17,18]. This paper will give a review of digital shearography for NDT. After a brief introduction of the principles of digital shearography, the paper presents the development process of the phase measurement technique and discusses the advantages and disadvantages of the temporal phase-shift algorithm and spatial phase-shift algorithm in detail. Then, its recent developments and applications for NDT are introduced. Finally, the potentials and limitations of digital shearography are shown and demonstrated.

2. Brief Review of Digital Shearography

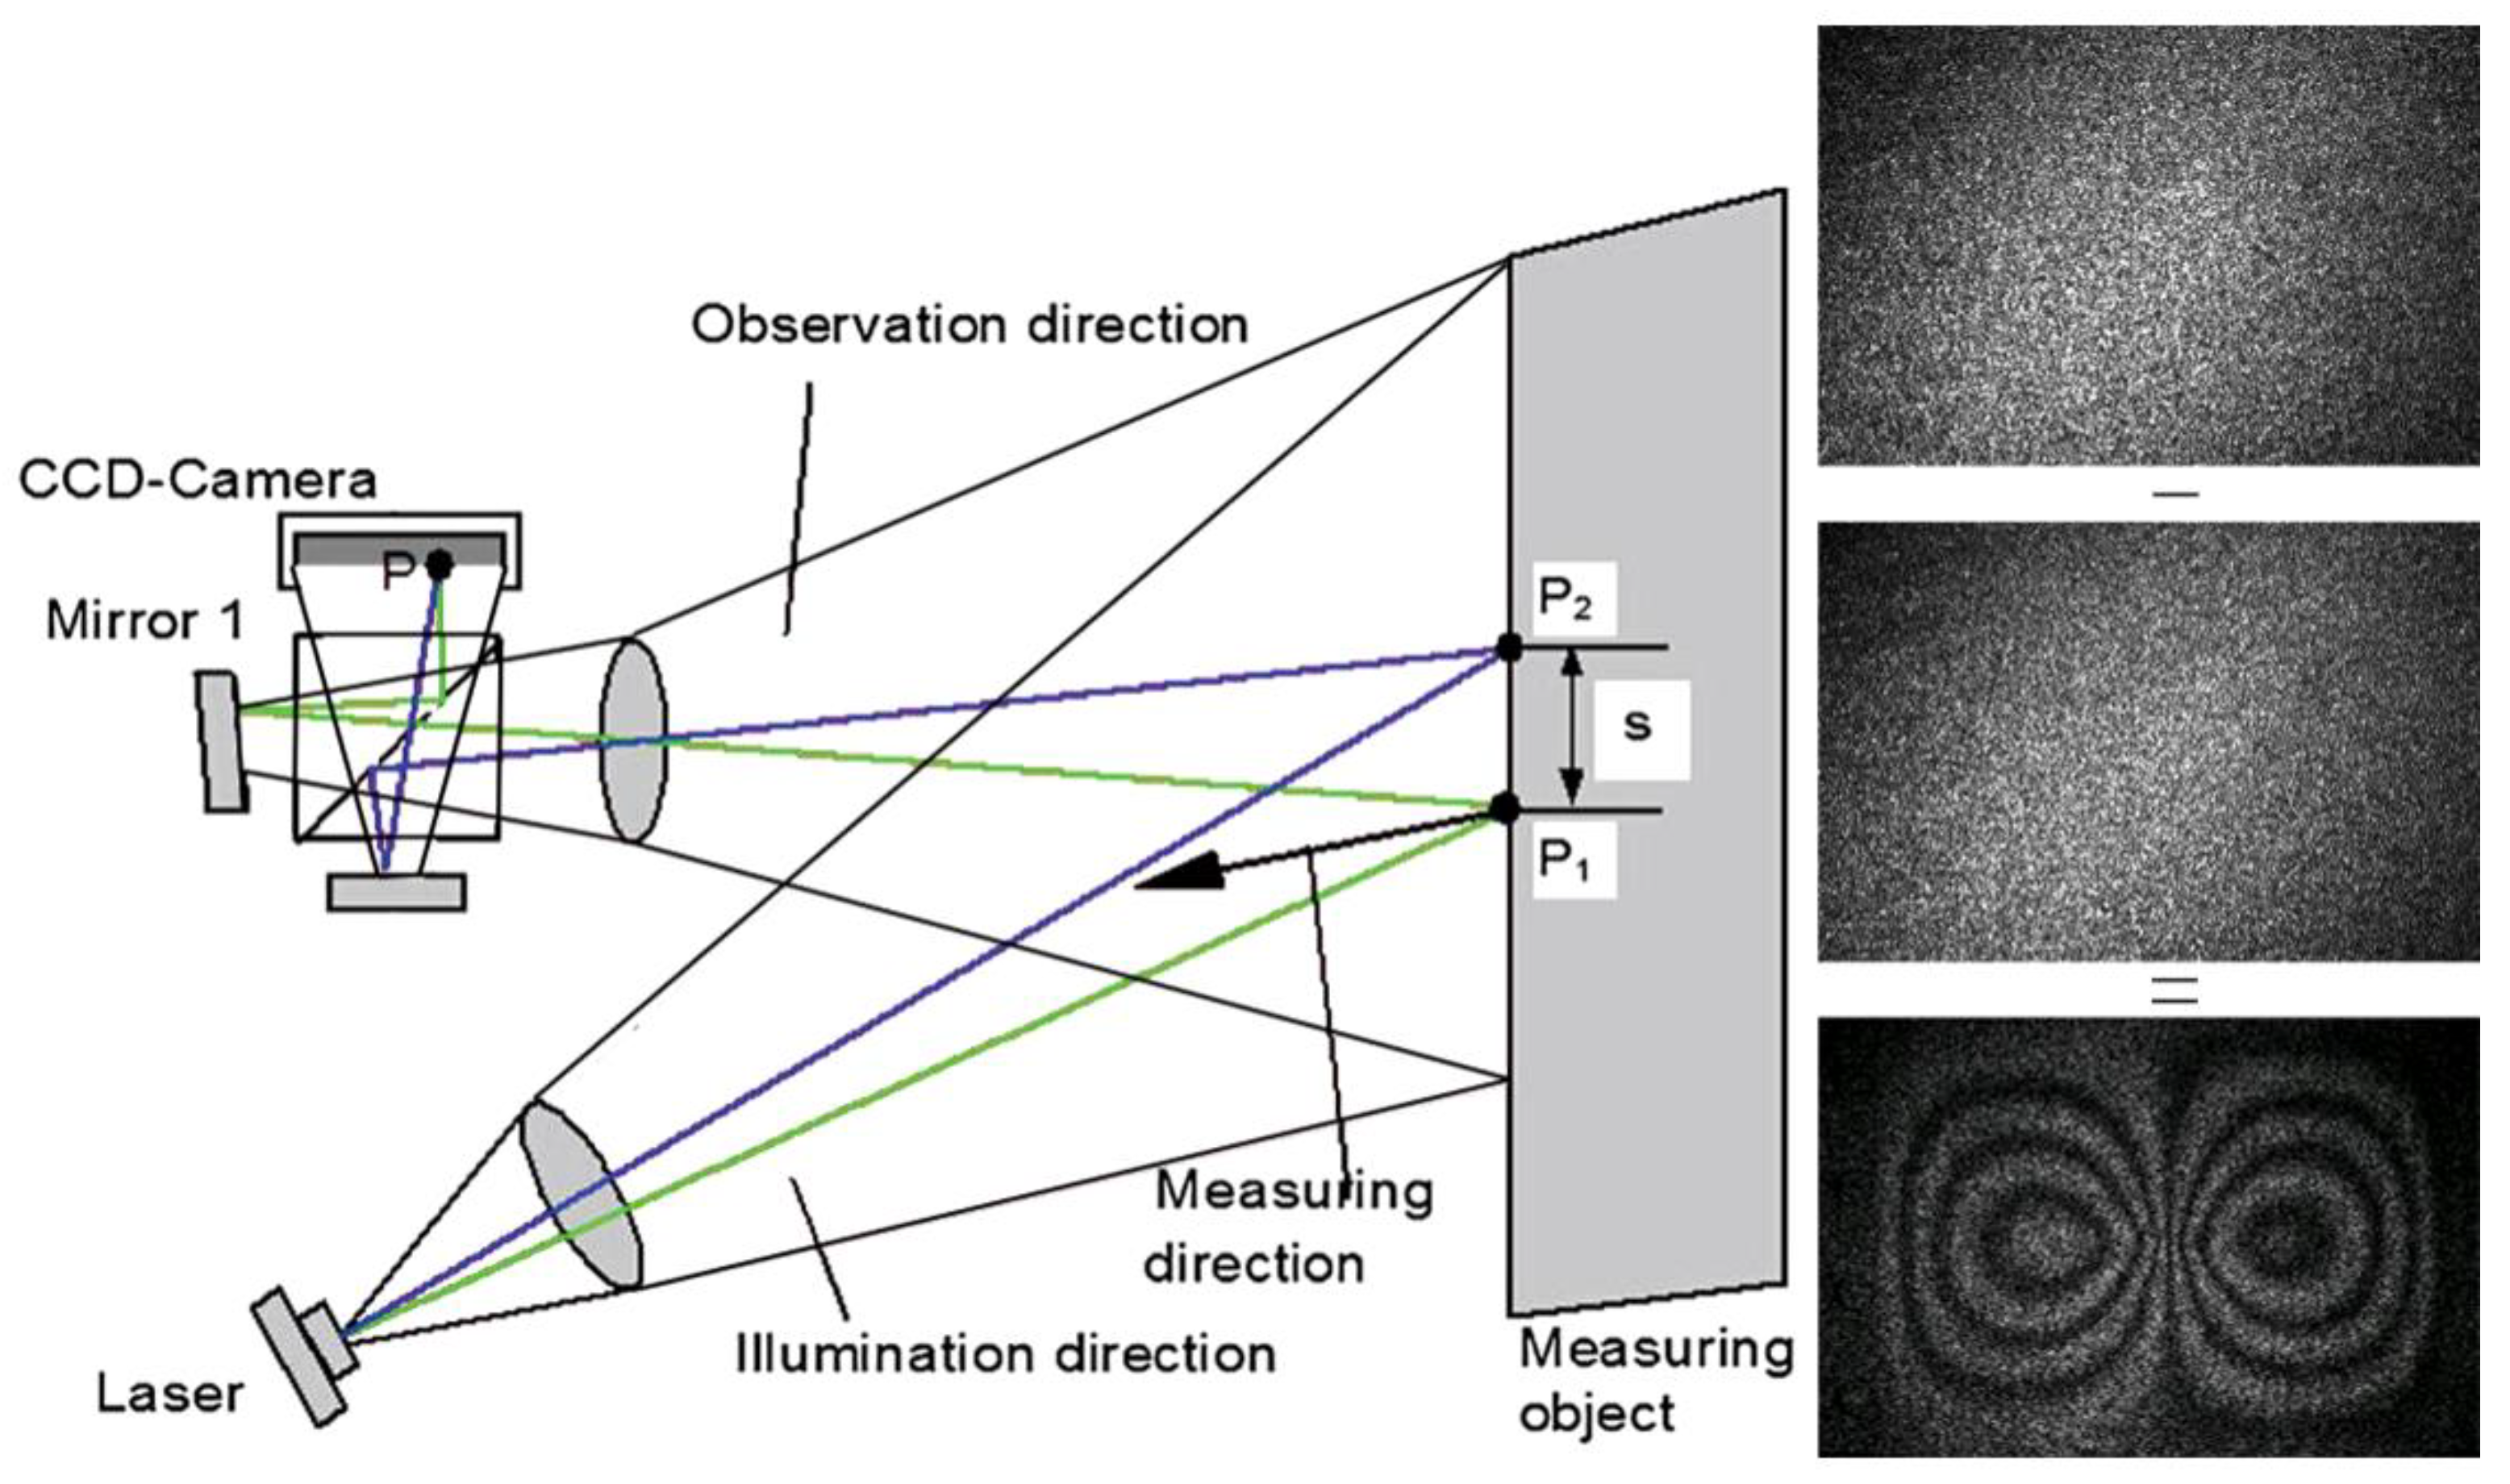
2.1. Formation of Fringes in Digital Shearography

Digital shearography is a laser-based optical interferometry technique that requires a shearing device to be placed in front of the camera to introduce image shearing, thereby allowing light reflected from two different object points to interfere at one point in the image plane. Different shearing devices, such as an optical wedge or biprism [19], a Mach–Zehnder interferometer [20], and a modified Michelson interferometer [21], have been used for digital shearography measurements. The modified Michelson interferometer is the most common shearing device because of its simple structure and ease in changing the shearing amount and shearing direction. This section introduces the basic principle of digital shearography with the modified Michelson interferometer as the shearing device.
Figure 1 shows the classic shearographic setup using a modified Michelson interferometer to create shearing amount and make interference at point P. The shearing can be created by tilting mirror 1 by a very small angle. Then, light waves from points P1 and P2 on the surface of the object can be transmitted to a point P on the sensor plane. These light waves interfere with each other and produce a speckle pattern, or speckle interferogram, which is registered by a CCD camera and saved in the computer [22]. The total light field U t at the point P on the image plane can be expressed by the following equation:
U t = U 1 + U 2 = a 1 e i θ 1 + a 2 e i θ 2
where θ 1 and θ 2 represent the random phase angle of points P1 and P2, respectively, and a 1 and a 2 are the light amplitudes.
Thus, the intensity at point P can be expressed as follows:
I = U t U t * = ( a 1 e i θ 1 + a 2 e i θ 2 ) ( a 1 e i θ 1 + a 2 e i θ 2 ) = ( a 1 2 + a 2 2 ) + a 1 a 2 [ e i ( θ 1 θ 2 ) + e i ( θ 1 θ 2 ) ] = ( a 1 2 + a 2 2 ) + 2 a 1 a 2 cos ( θ 1 θ 2 ) = A + B cos ϕ
where U t * is the complex conjugate of U t , cos ( θ 1 θ 2 ) = [ e i ( θ 1 θ 2 ) + e i ( θ 1 θ 2 ) ] / 2 (Euler equation), A = a 1 2 + a 2 2 , B = 2 a 1 a 2 , and ϕ = θ 1 θ 2 is the phase difference between the light waves from the two points.
After the object is loaded, the phase difference between the two points becomes ϕ = ϕ + Δ , where Δ is the relative phase change, resulting from a relative deformation between points P1 and P2, between the light waves from two points before and after loading. The intensity of the speckle pattern after loading then becomes the following:
I = A + B cos ϕ = A + B cos ( ϕ + Δ )
A fringe pattern, or shearogram, which is shown in Figure 1, can be obtained by direct subtraction between the intensity images before and after loading. Because the intensity value must be positive, the absolute value will be displayed, represented as follows:
| I s | = | I I | = B | cos ( ϕ + Δ ) cos ( ϕ ) |
where Δ = 2 n π ( n = 1 , 2 , 3 ) . Dark fringes appear on the shearogram when | I s | = 0 . The shearogram is therefore displayed as a highly visible fringe pattern. Due to the relative phase difference between two adjacent fringes being equal to 2 π , the phase at each fringe can be determined by counting the shearogram fringes. Then, the derivative of the deformation can be determined based on the relationship between the relative phase change and the relative deformation between points P1 and P2.
For digital shearography NDT, the angle between the illumination direction of the laser and the observation direction of the CCD camera is usually small or close to zero, and the shearing amount δ w is also small. Under these conditions, the relative phase change can be approximated only to the relative deformation δ w between two points in the out-of-plane direction. The equations for shearing in the x-direction and y-direction are therefore as follows:
Δ x 4 π λ w x δ x Δ y 4 π λ w y δ y
where λ is the laser wavelength used. As can be seen from Equation (6), the deformation derivative can be measured directly without additional numerical differentiation of deformation data, meaning digital shearography can directly measure strain or strain concentration information.

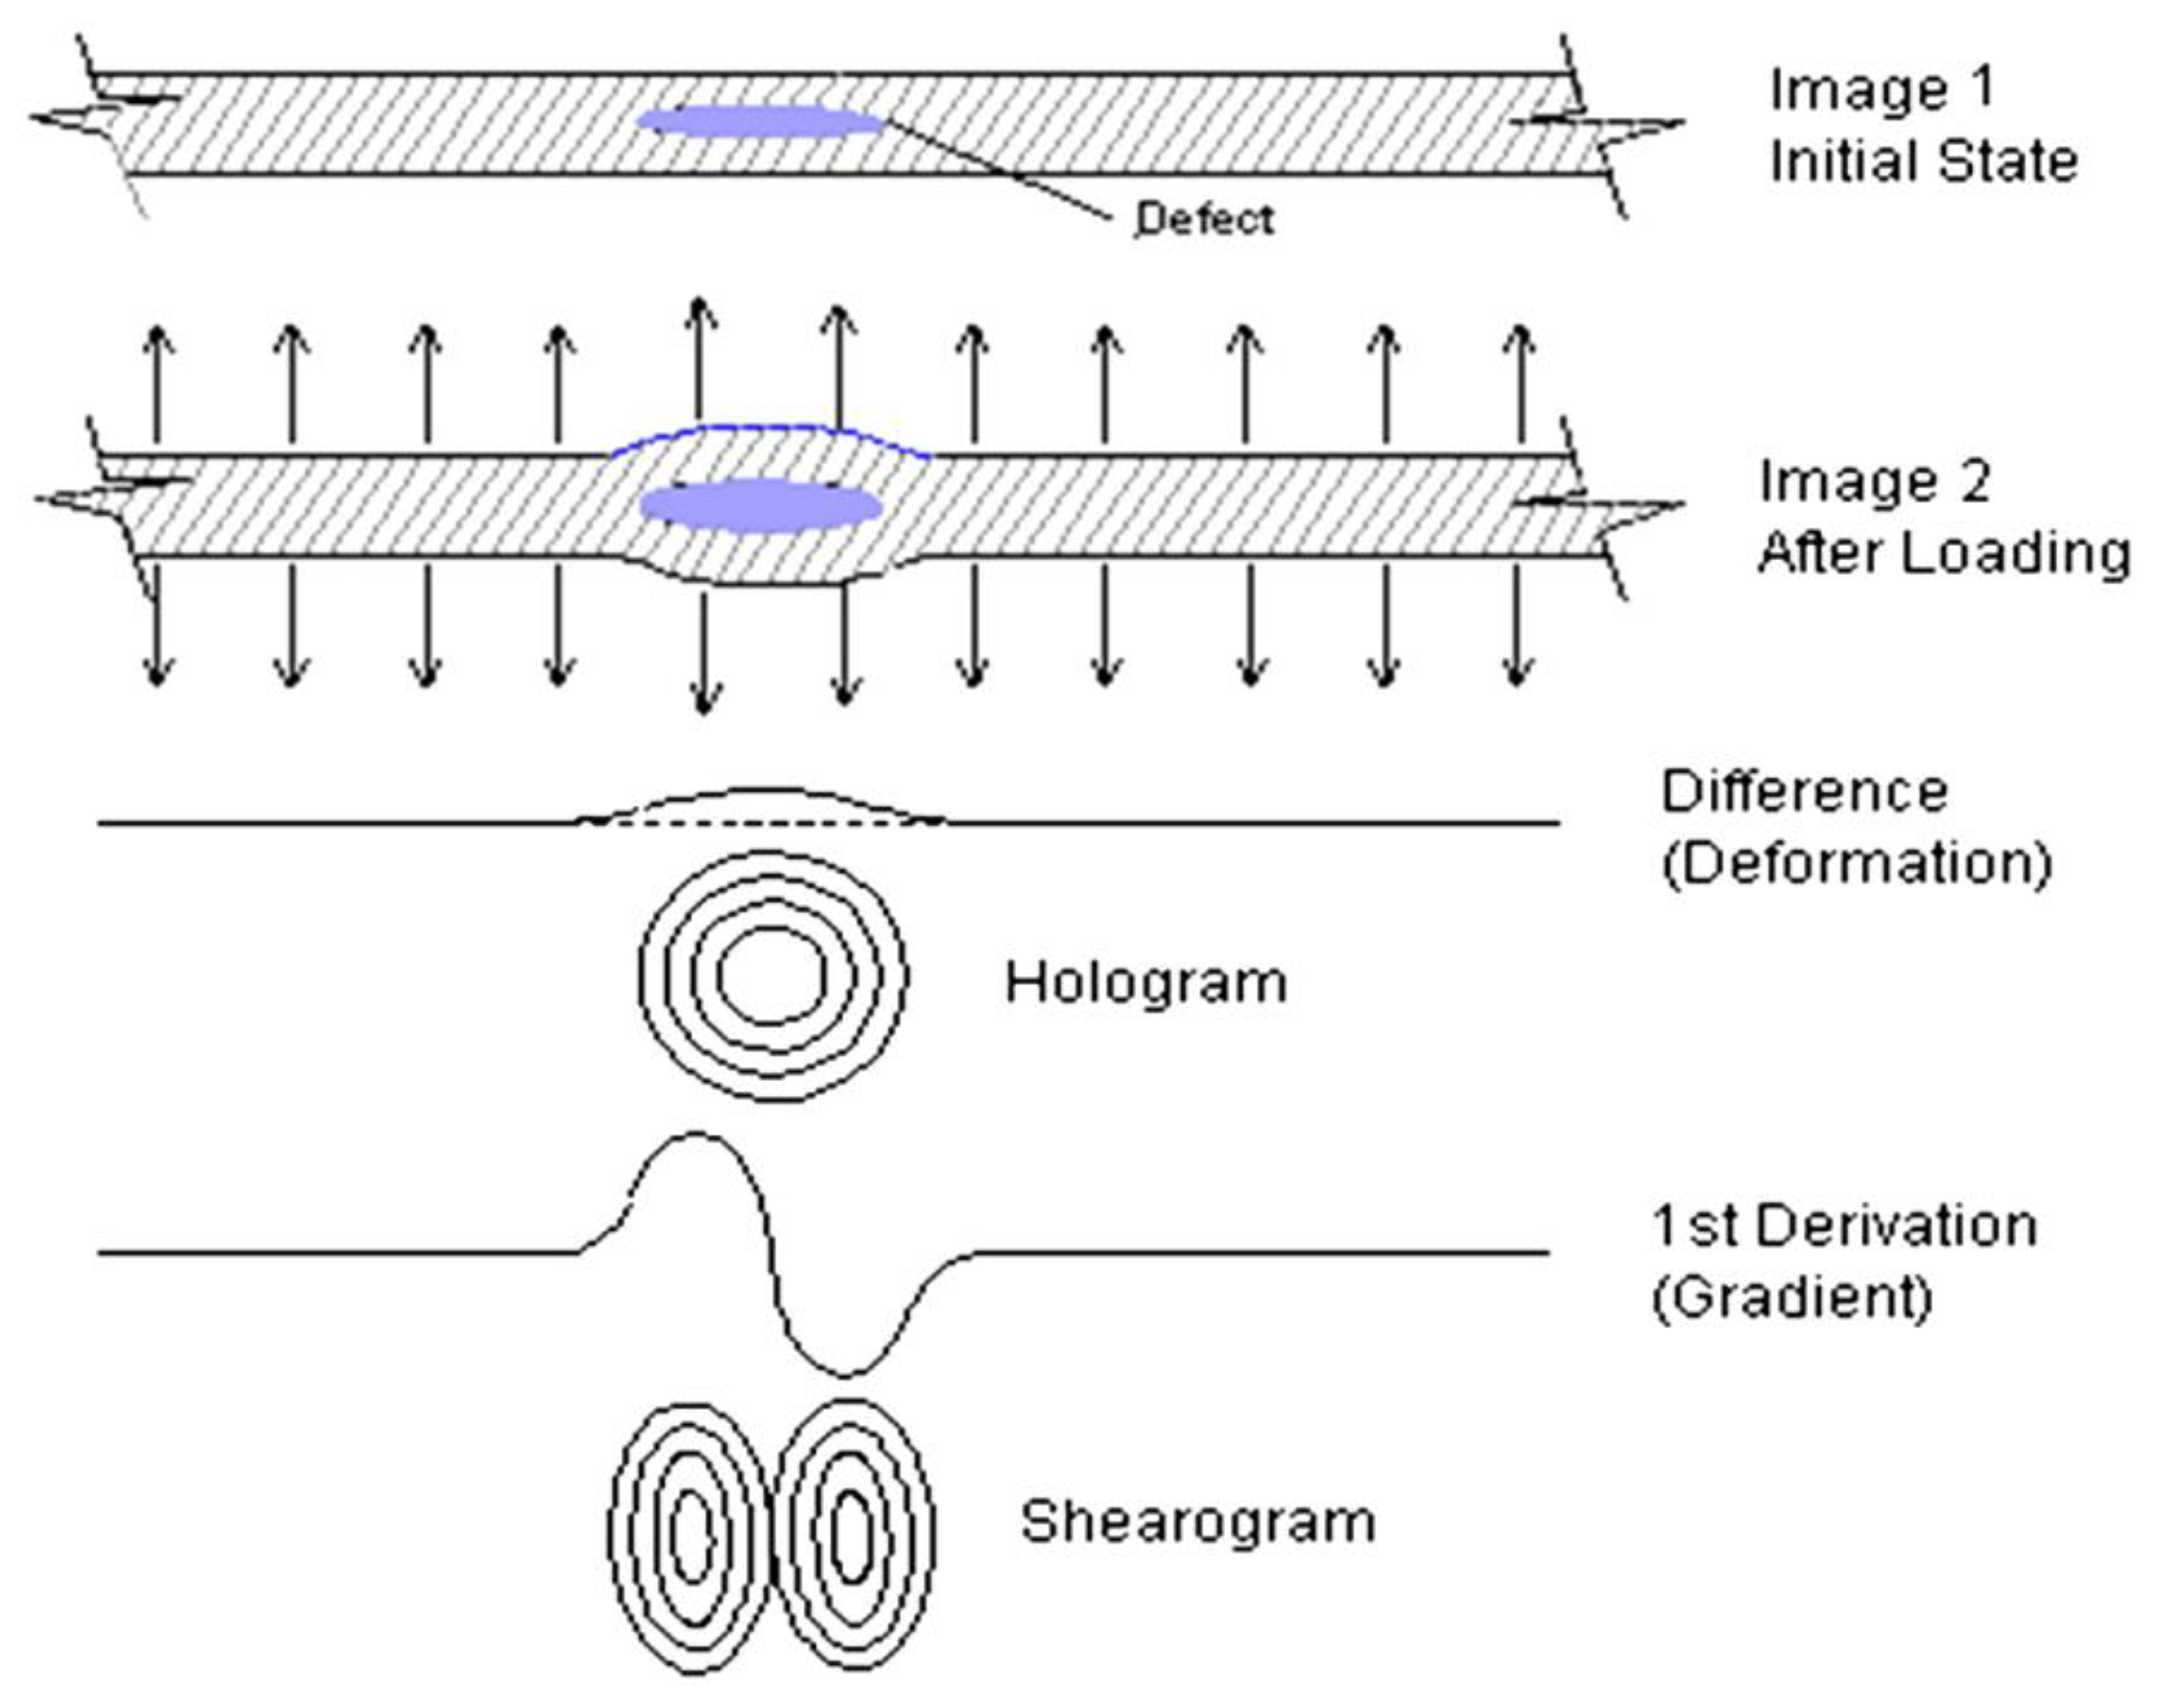
2.2. Interpretation of Fringes in Digital Shearography

As can be seen from the previous section, the relative phase change of shearography is directly related to the deformation derivative. This section describes an interpretation of digital shearographic results from another perspective. As it is well known how to interpret holography results [7], a comparison between holographic and shearographic measurements are presented. Figure 2 shows a comparison of the results of holographic and shearographic NDT. Assuming a delamination exists in a sample, the surface of the sample is slightly curved by thermal or vacuum loading. As shown, holography discovers the flaw by detecting the deformation anomalies caused by the flaw, and the anomaly area exhibits a circular fringe pattern. Shearography detects it by looking for strain anomalies, and the anomaly area presents a butterfly pattern.
In order to demonstrate the concept above, a laminated plate with three debonds is simultaneously detected using holography and shearography. The measurement results are shown in Figure 3. The results of holography, which appears as circular fringes, are shown in Figure 3a, while Figure 3b shows the shearographic measurement results, which appear as butterfly patterns. It should be noted that the shearographic measurement results were obtained using the phase-shift technique, which will be introduced in the next section.

3. Phase Measurement Technique

In Section 2.1, the relative phase change is calculated by counting fringes. Therefore, the method’s measurement sensitivity is only one fringe, or 2 π , and smaller phase changes cannot be determined. This means the direct subtraction method has a relatively low measurement sensitivity, limiting its use in practical applications. The phase-shift technique was introduced to obtain higher phase measurement sensitivity. Theoretically, the sensitivity can reach 2 π / 256 when the hardware bit resolution is 8 bits. Considering speckle noise, hardware, and other factors, the measurement sensitivity of digital shearography based on the phase-shift technique can be at least 2 π / 10 , which is 10 times higher than the real-time subtraction version. This has led to tremendous development in digital shearography. The comparison between real-time subtraction and phase-shift shearography results is shown in Figure 4.
Phase-shift digital shearography can be divided into two categories: temporal phase-shift digital shearography (TPS-DS) and spatial phase-shift digital shearography (SPS-DS). The temporal phase shift has high accuracy and is normally suitable for static or quasi-static measurements, while the spatial phase shift is suitable for dynamic measurements. Both categories will be described in detail in the following sections.

3.1. Phase Measurement Technique: Temporal Phase-Shift Shearography

Temporal phase-shift digital shearography refers to a technique of introducing different phase-shift amounts in a time series to obtain phase information [23]. Several methods exist for introducing the phase shift, including the piezoelectric transducer method (PZT), polarization phase-shift method, and grating phase-shift method. Among them, the piezoelectric transducer is the most commonly used in practical applications due to its simple use. It produces a precisely designed movement through a piezoelectric crystal driven mirror, introducing a known phase shift between the two images in the time series.
The previous section introduced the basic principles of shearography, where the intensity formula for a single speckle pattern image is as follows:
I = I 0 ( 1 + γ cos ϕ ) = A + B cos ϕ
There are three unknowns in the formula: background intensity I 0 , contrast γ , and phase difference ϕ . Therefore, at least three equations are needed. In theory, three equations are sufficient to obtain the relative phase difference. However, as can be seen in Table 1, the calculation relationship of the 4 + 4 algorithm is the simplest and has a higher extraction accuracy. As a result, it has become the most widely used algorithm in temporal phase-shift shearography. Called the 4 + 4 algorithm, four images are captured before loading to solve for ϕ , then four images are captured after loading to solve for ϕ [24]. The four intensity equations before loading with a known phase can be expressed as follows:
I 1 = A + B cos ϕ I 2 = A + B cos ( ϕ + π 2 ) I 3 = A + B cos ( ϕ + π ) I 4 = A + B cos ( ϕ + 3 π 2 )
Then, the phase difference before loading can be calculated by the following formula:
ϕ = arctan ( I 4 I 2 ) ( I 1 I 3 )
Similarly, the phase difference after loading can be calculated using the same formulas, and the relative phase change can be obtained by subtracting the phase difference before and after loading. Compared with the direct subtraction method, the measurement sensitivity is much improved, but it requires four images to be captured under each loading condition, making it unsuitable for dynamic measurements. The phase-shift algorithm has been improved to adapt to continuous or dynamic measurements, resulting in the development of various fast temporal phase-shift algorithms. The phase-shift steps before loading have no effect on the acquisition rate of the system. The fast temporal phase-shift algorithms reduce the number of phase-shift steps after or during loading and can realize dynamic measurement when no phase shift is required [25,26,27].
The 4 + 1 temporal phase-shift algorithm takes four images before loading, using the same procedure as described in the previous section. A single image is recorded on each loading, and no phase-shifting step is required. For each load, a phase map is obtained from the four phase images before loading and one real-time image during loading. The 4+1 temporal phase-shift algorithm provides the ability to achieve dynamic measurements, but its poor phase map quality is not suitable for high-precision quantitative measurements, limiting its use for qualitative measurements such as NDT.
A 4 + 2 algorithm has also been developed, requiring only one phase-shift step during loading. The phase map quality is markedly better than the 4 + 1 algorithm, meaning that the fringes in the phase map are clear and complete. Compared with the 4 + 4 algorithm, the phase map quality is reduced within a reasonable range to achieve an increase in the acquisition rate, thereby realizing dynamic measurement in a low dynamic range.
Similarly, there are other N + N, N + 2, and N + 1 algorithms that have been developed. A comparison of the various temporal phase-shift algorithms is presented in Table 1.

3.2. Phase Measurement Technique: Spatial Phase-Shift Shearography

Temporal phase-shift shearography is generally only applicable to static measurements. Despite the fast temporal phase-shift algorithms that have been developed, the phase map quality and measurement range are limited and not suitable for many applications. Therefore, spatial phase-shift digital shearography (SPS-DS), in which phase-shift interferograms are obtained in different spatial positions at the same time to realize dynamic shearography measurements, was proposed. This section will describe spatial phase-shift shearography by introducing multichannel spatial phase-shift shearography and carrier-frequency spatial phase-shift shearography, respectively.

3.2.1. Multichannel Spatial Phase-Shift Shearography

Multichannel spatial phase-shift shearography can be divided into the multidetector method and the single-detector method. Among them, the multidetector method generally uses three or more CCD cameras to simultaneously acquire a speckle interferogram with a known fixed phase difference [28]. Although this method can perform dynamic measurements, the system is complicated, has a large error, and the setting of the phase shift between multiple cameras is difficult to implement, making the method unsuitable for practical applications. A method of obtaining spatial phase shift using only a single CCD camera was later proposed [29]. One method of doing this is to divide a single CCD into at least three imaging regions, then introduce a fixed phase difference between each region. This method requires the use of a large number of wave plates, gratings, and polarizers, which is costly and difficult to adjust. Another method uses a single pixel as a channel to introduce a phase difference between pixels covered by the same speckle, resulting in a spatial phase shift [30]. Figure 5 is a schematic of the method. The interpixel intensity is calculated to determine the phase value, which in turn obtains the phase value of the entire image.
By setting the reference beam at an appropriate angle α , the optical path difference (OPD) between two adjacent pixels can be created as follows:
O P D = S × sin α
where S is the pixel size. If the laser wavelength is λ , the phase shift can be calculated by the following formula:
δ = 2 π OPD λ = 2 π ( S sin α λ )
Thus, for a given wavelength and pixel size, the phase difference can be determined by setting the appropriate reference beam angle. Assuming that the optical path difference by adjusting the angle α is λ / 4 and the phase difference between pixels is π / 2 , then the phase difference can be calculated using Equations (8) and (9). After loading, the same process can be used to calculate the phase distribution under loading conditions.
The adjacent pixel phase-shift method can obtain the phase distribution from a single speckle pattern and is suitable for dynamic measurement. However, in practical applications, this method has reduced spatial resolution due to its need for at least three pixel points to determine the phase distribution of one point. Another problem with this method is that these three or more pixels should have the same values for A and B as shown in Equations (3) and (4). Although it can be partly realized by adjusting the aperture of the camera, it is not highly accurate, resulting in a noisy phase map. Moreover, only one dimension can be measured in one speckle pattern. Therefore, a carrier frequency method was proposed to enhance the quality of the phase map and the ability to extract information from multiple dimensions in a single image.

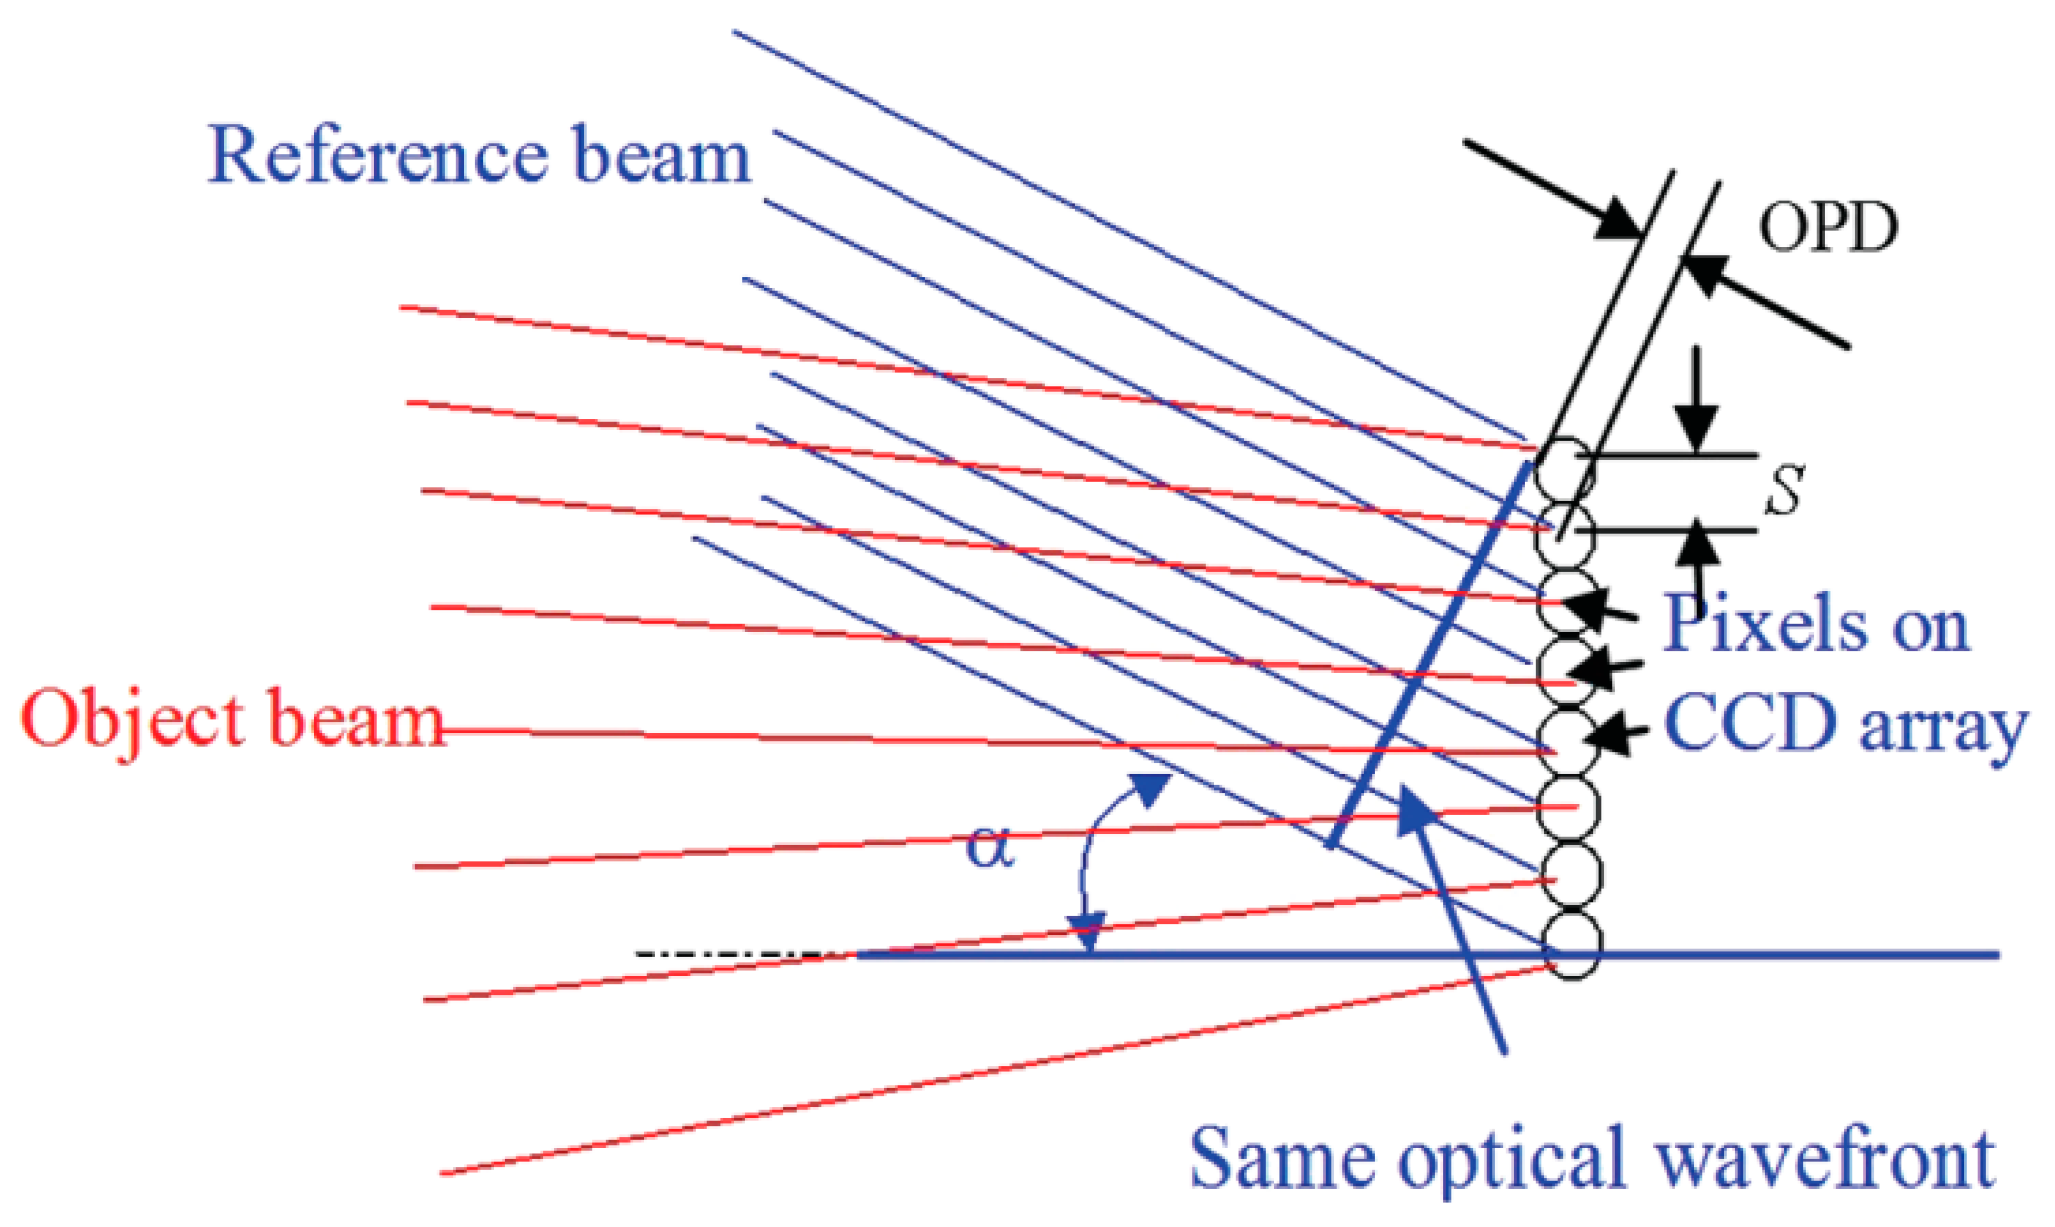
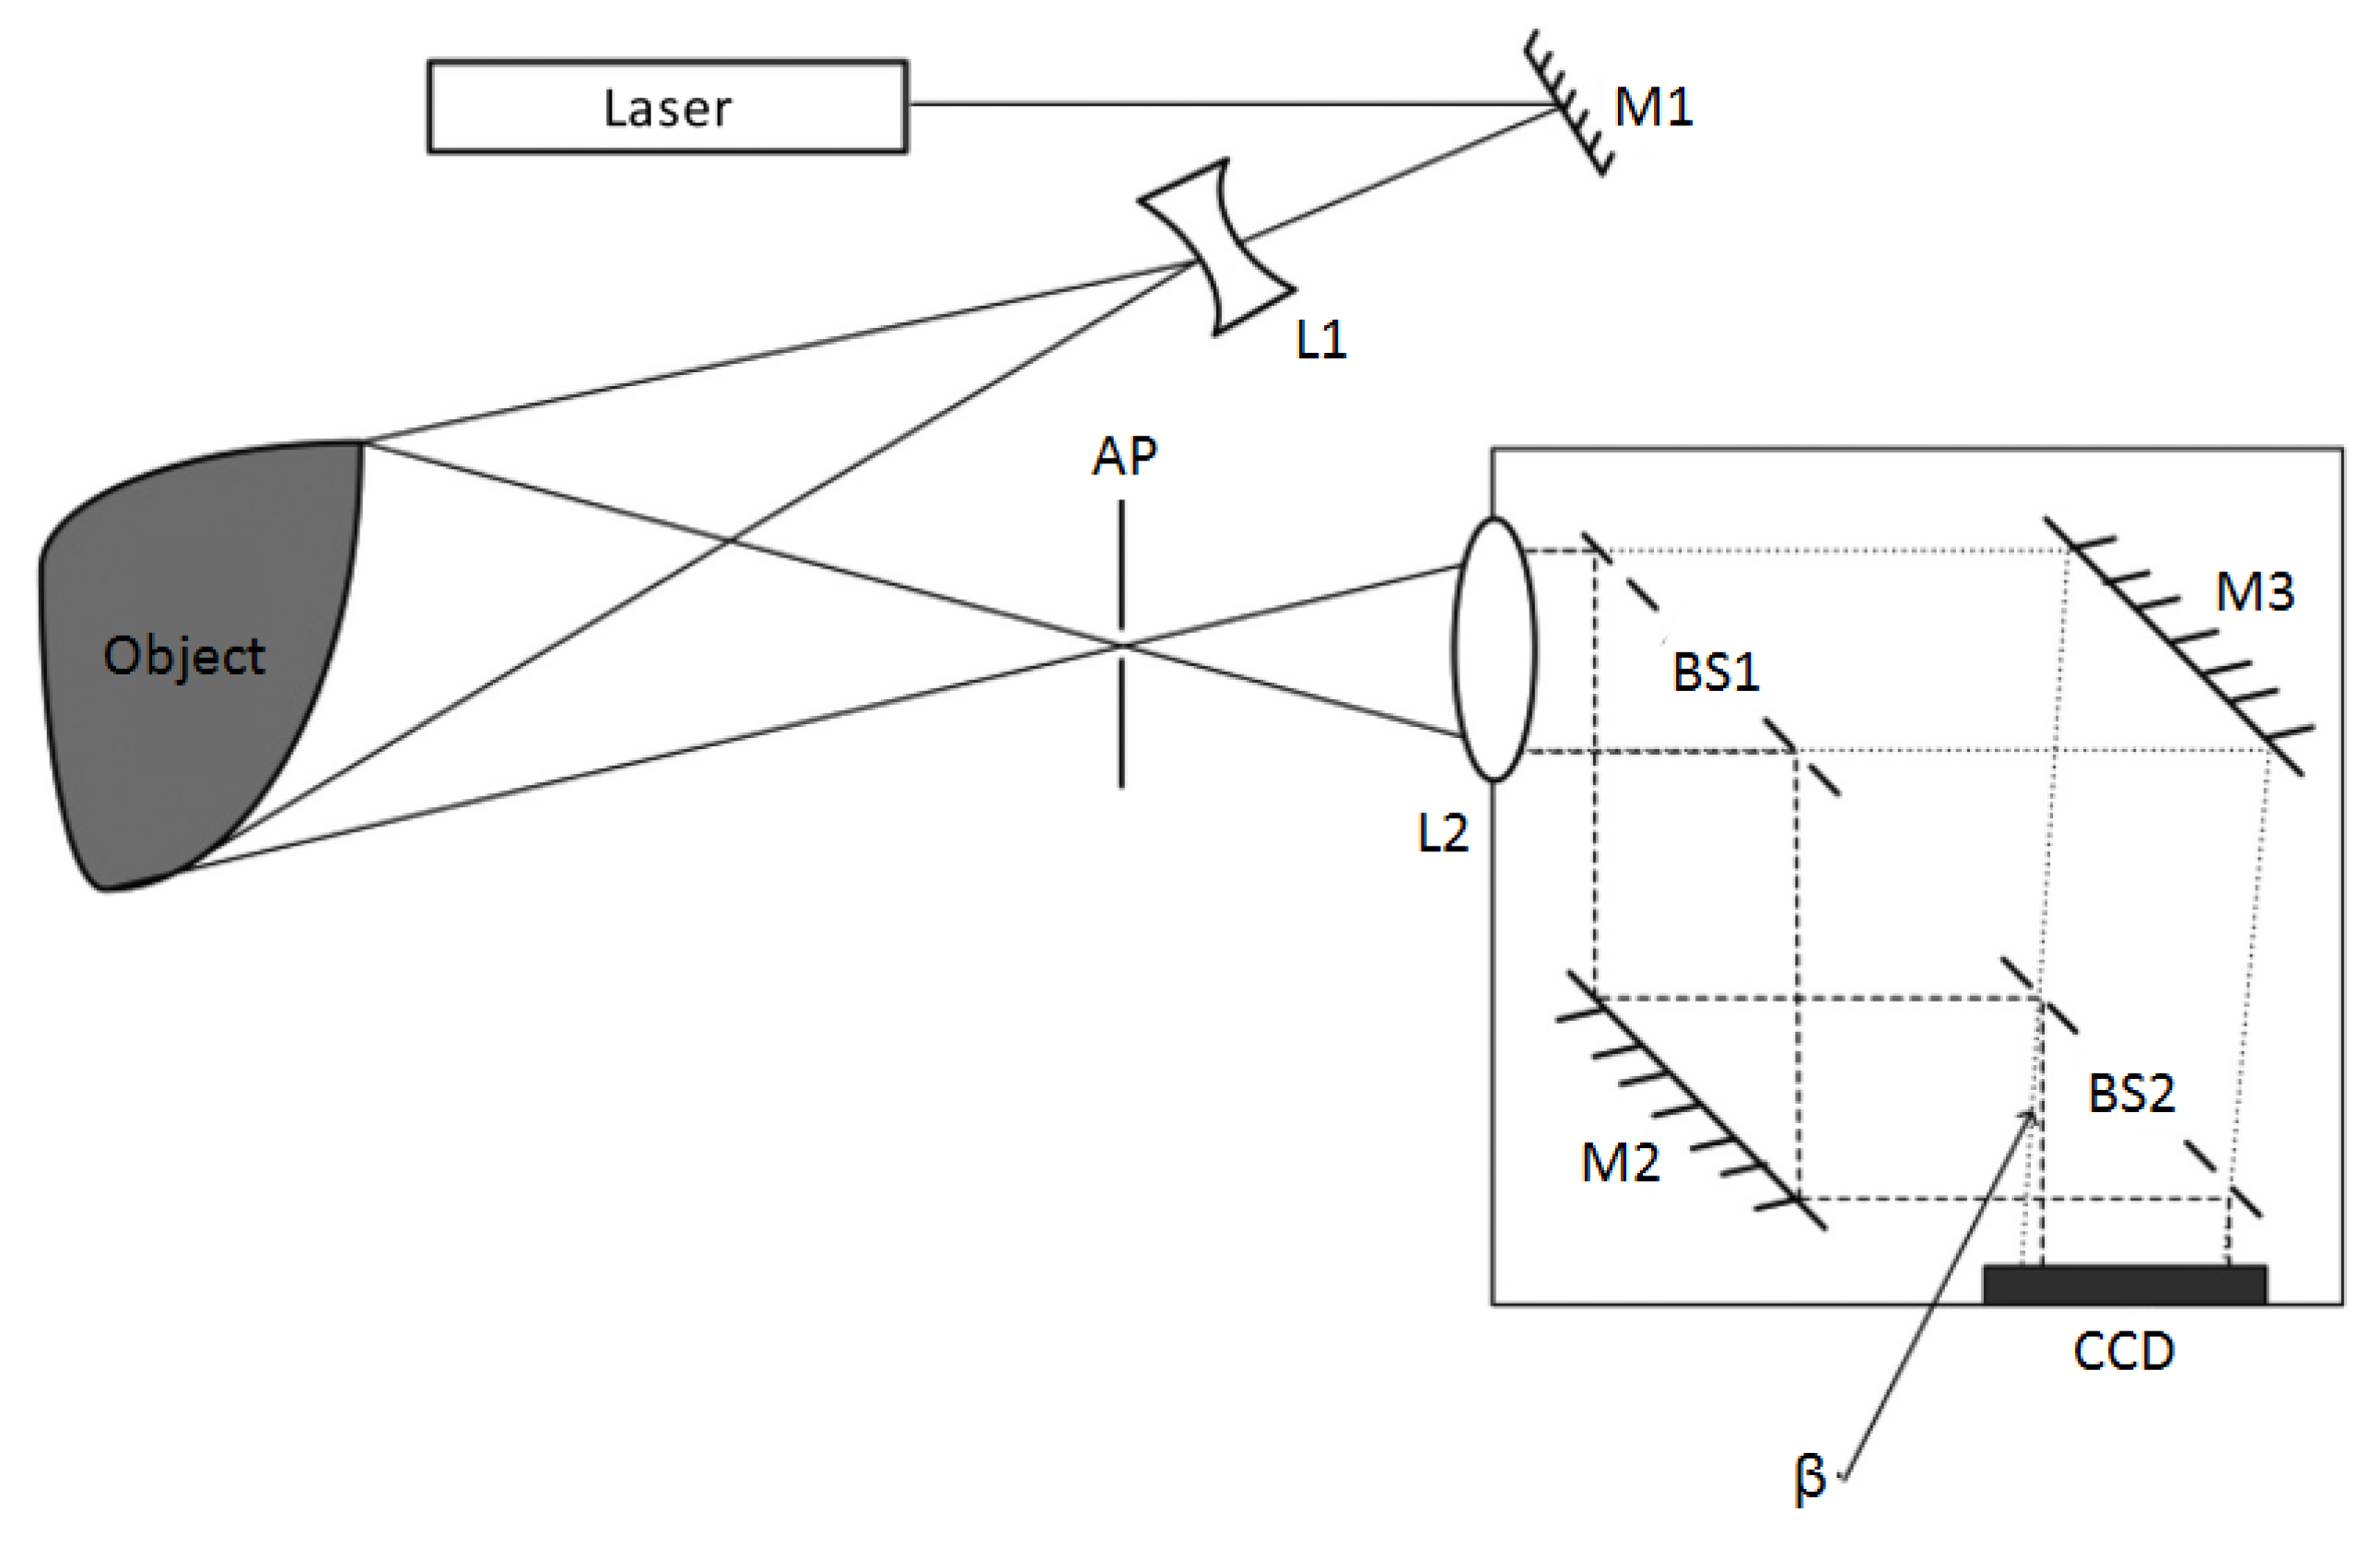
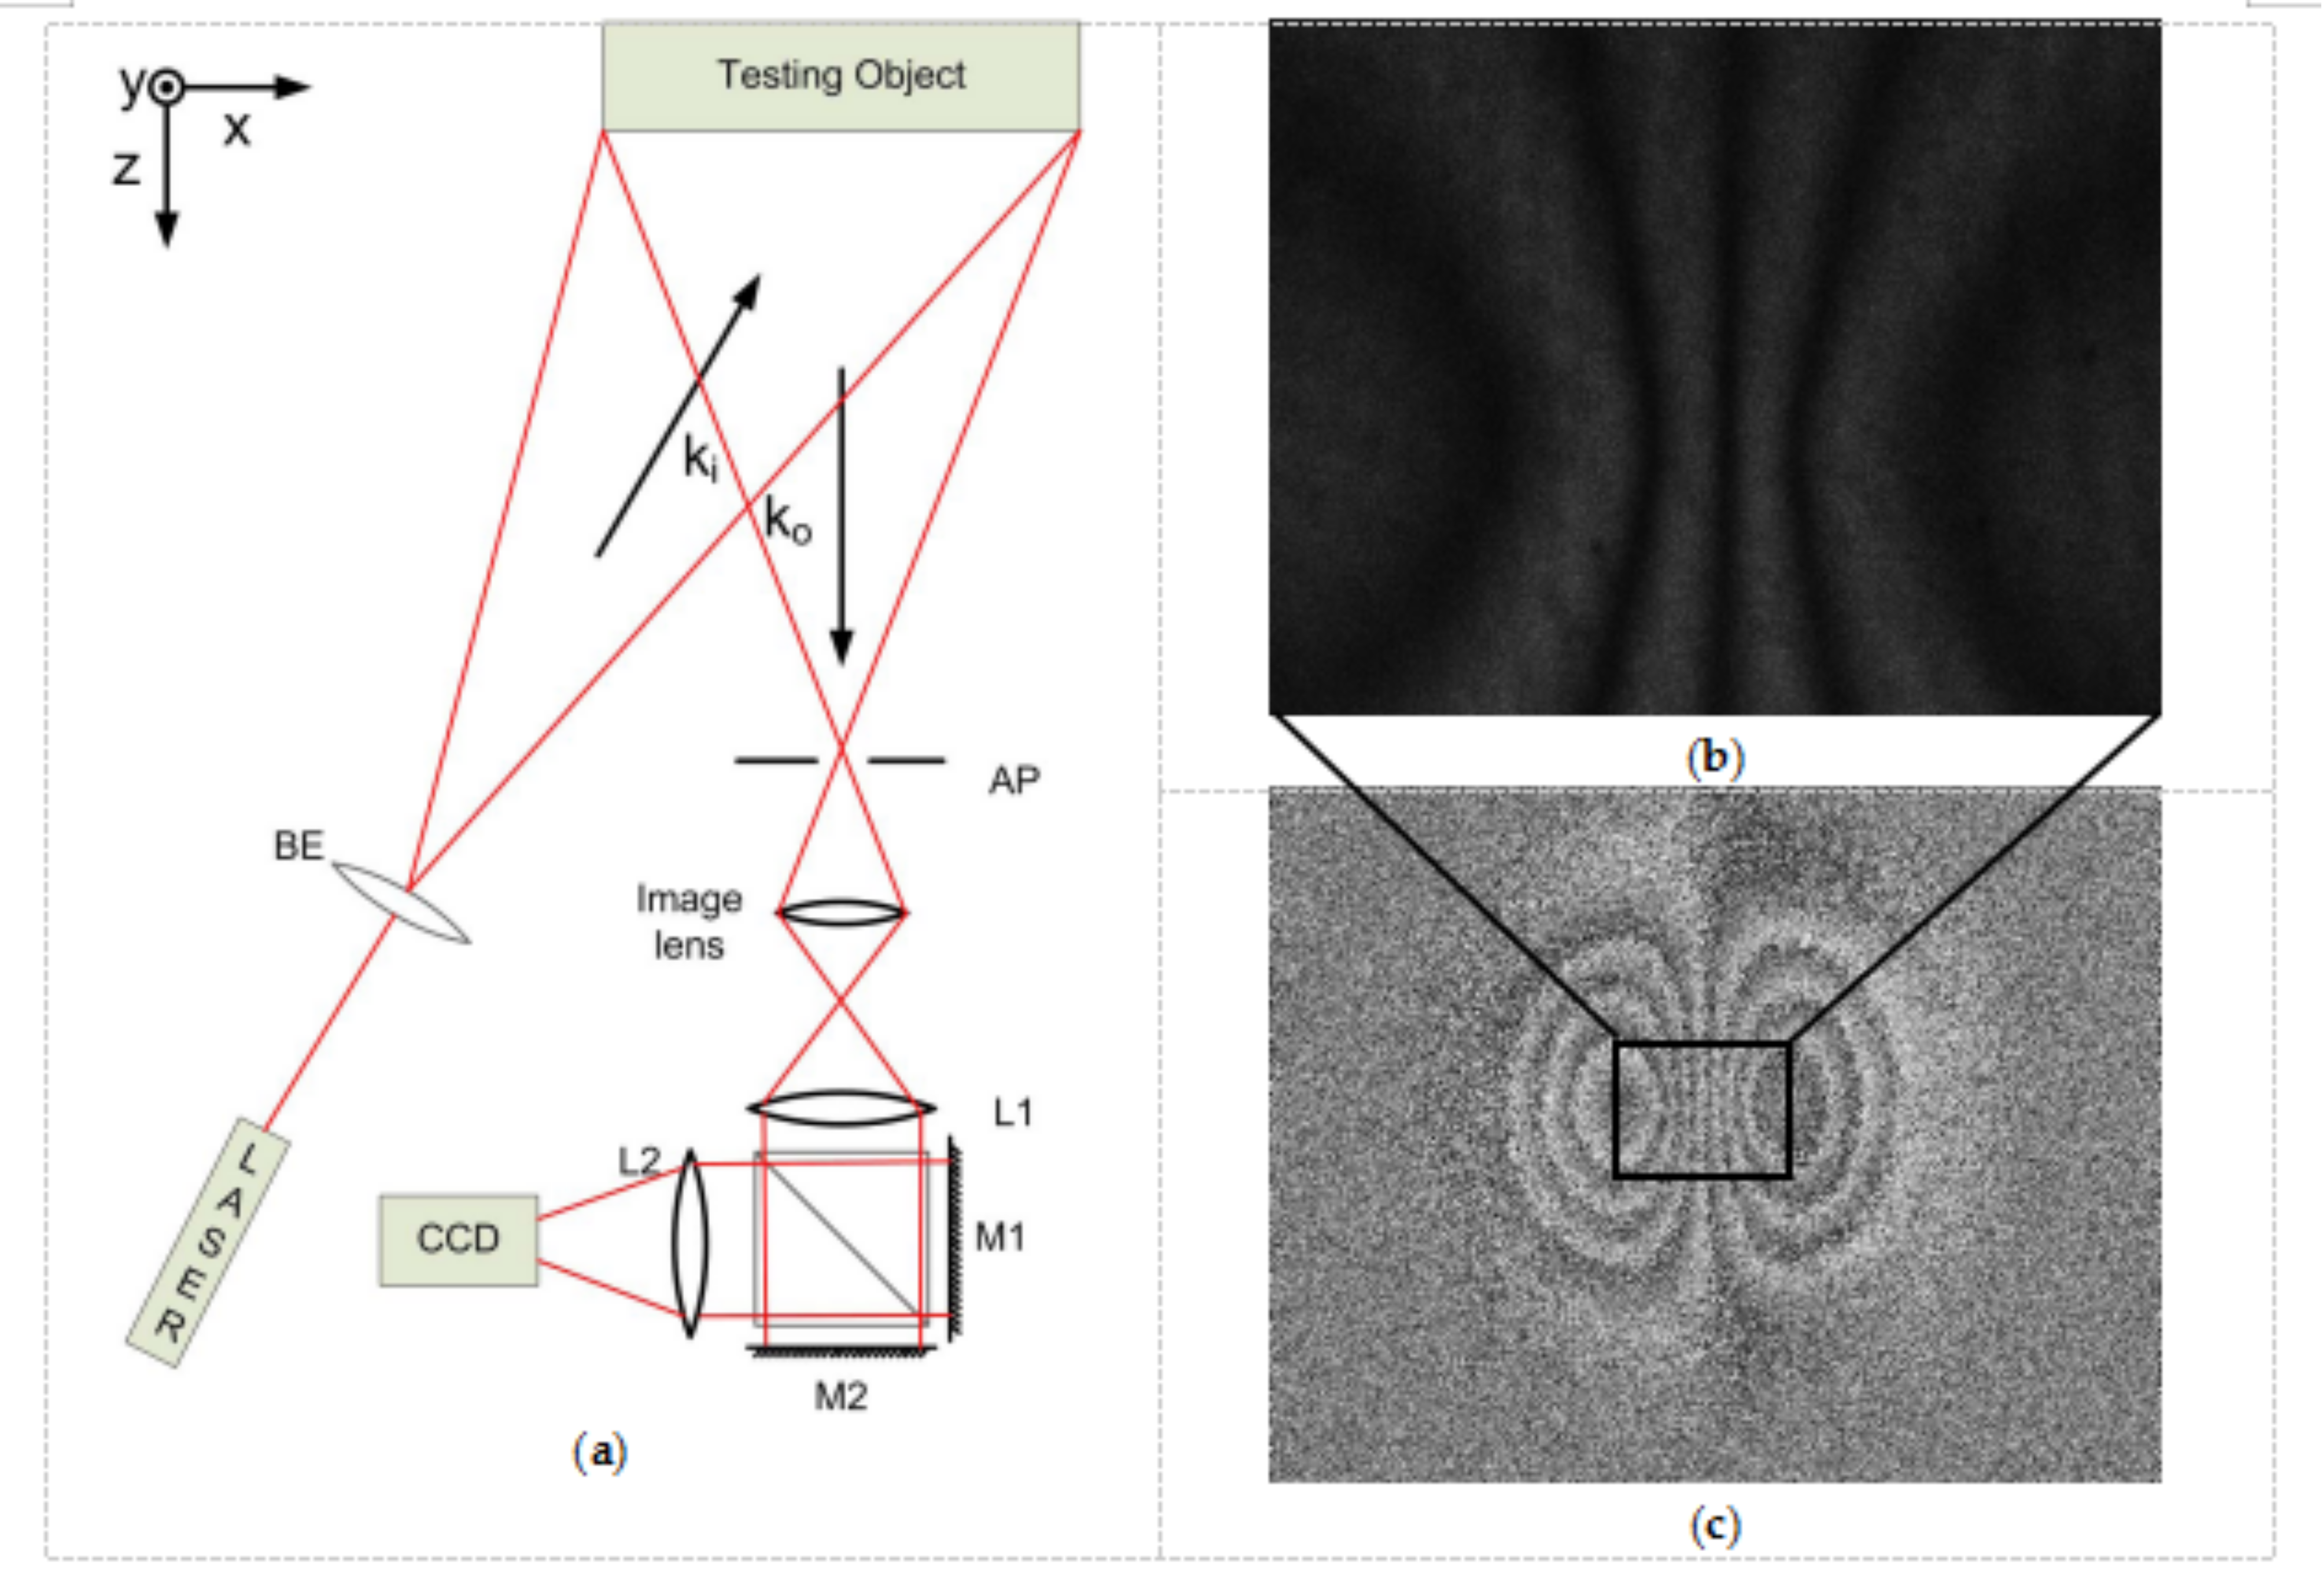
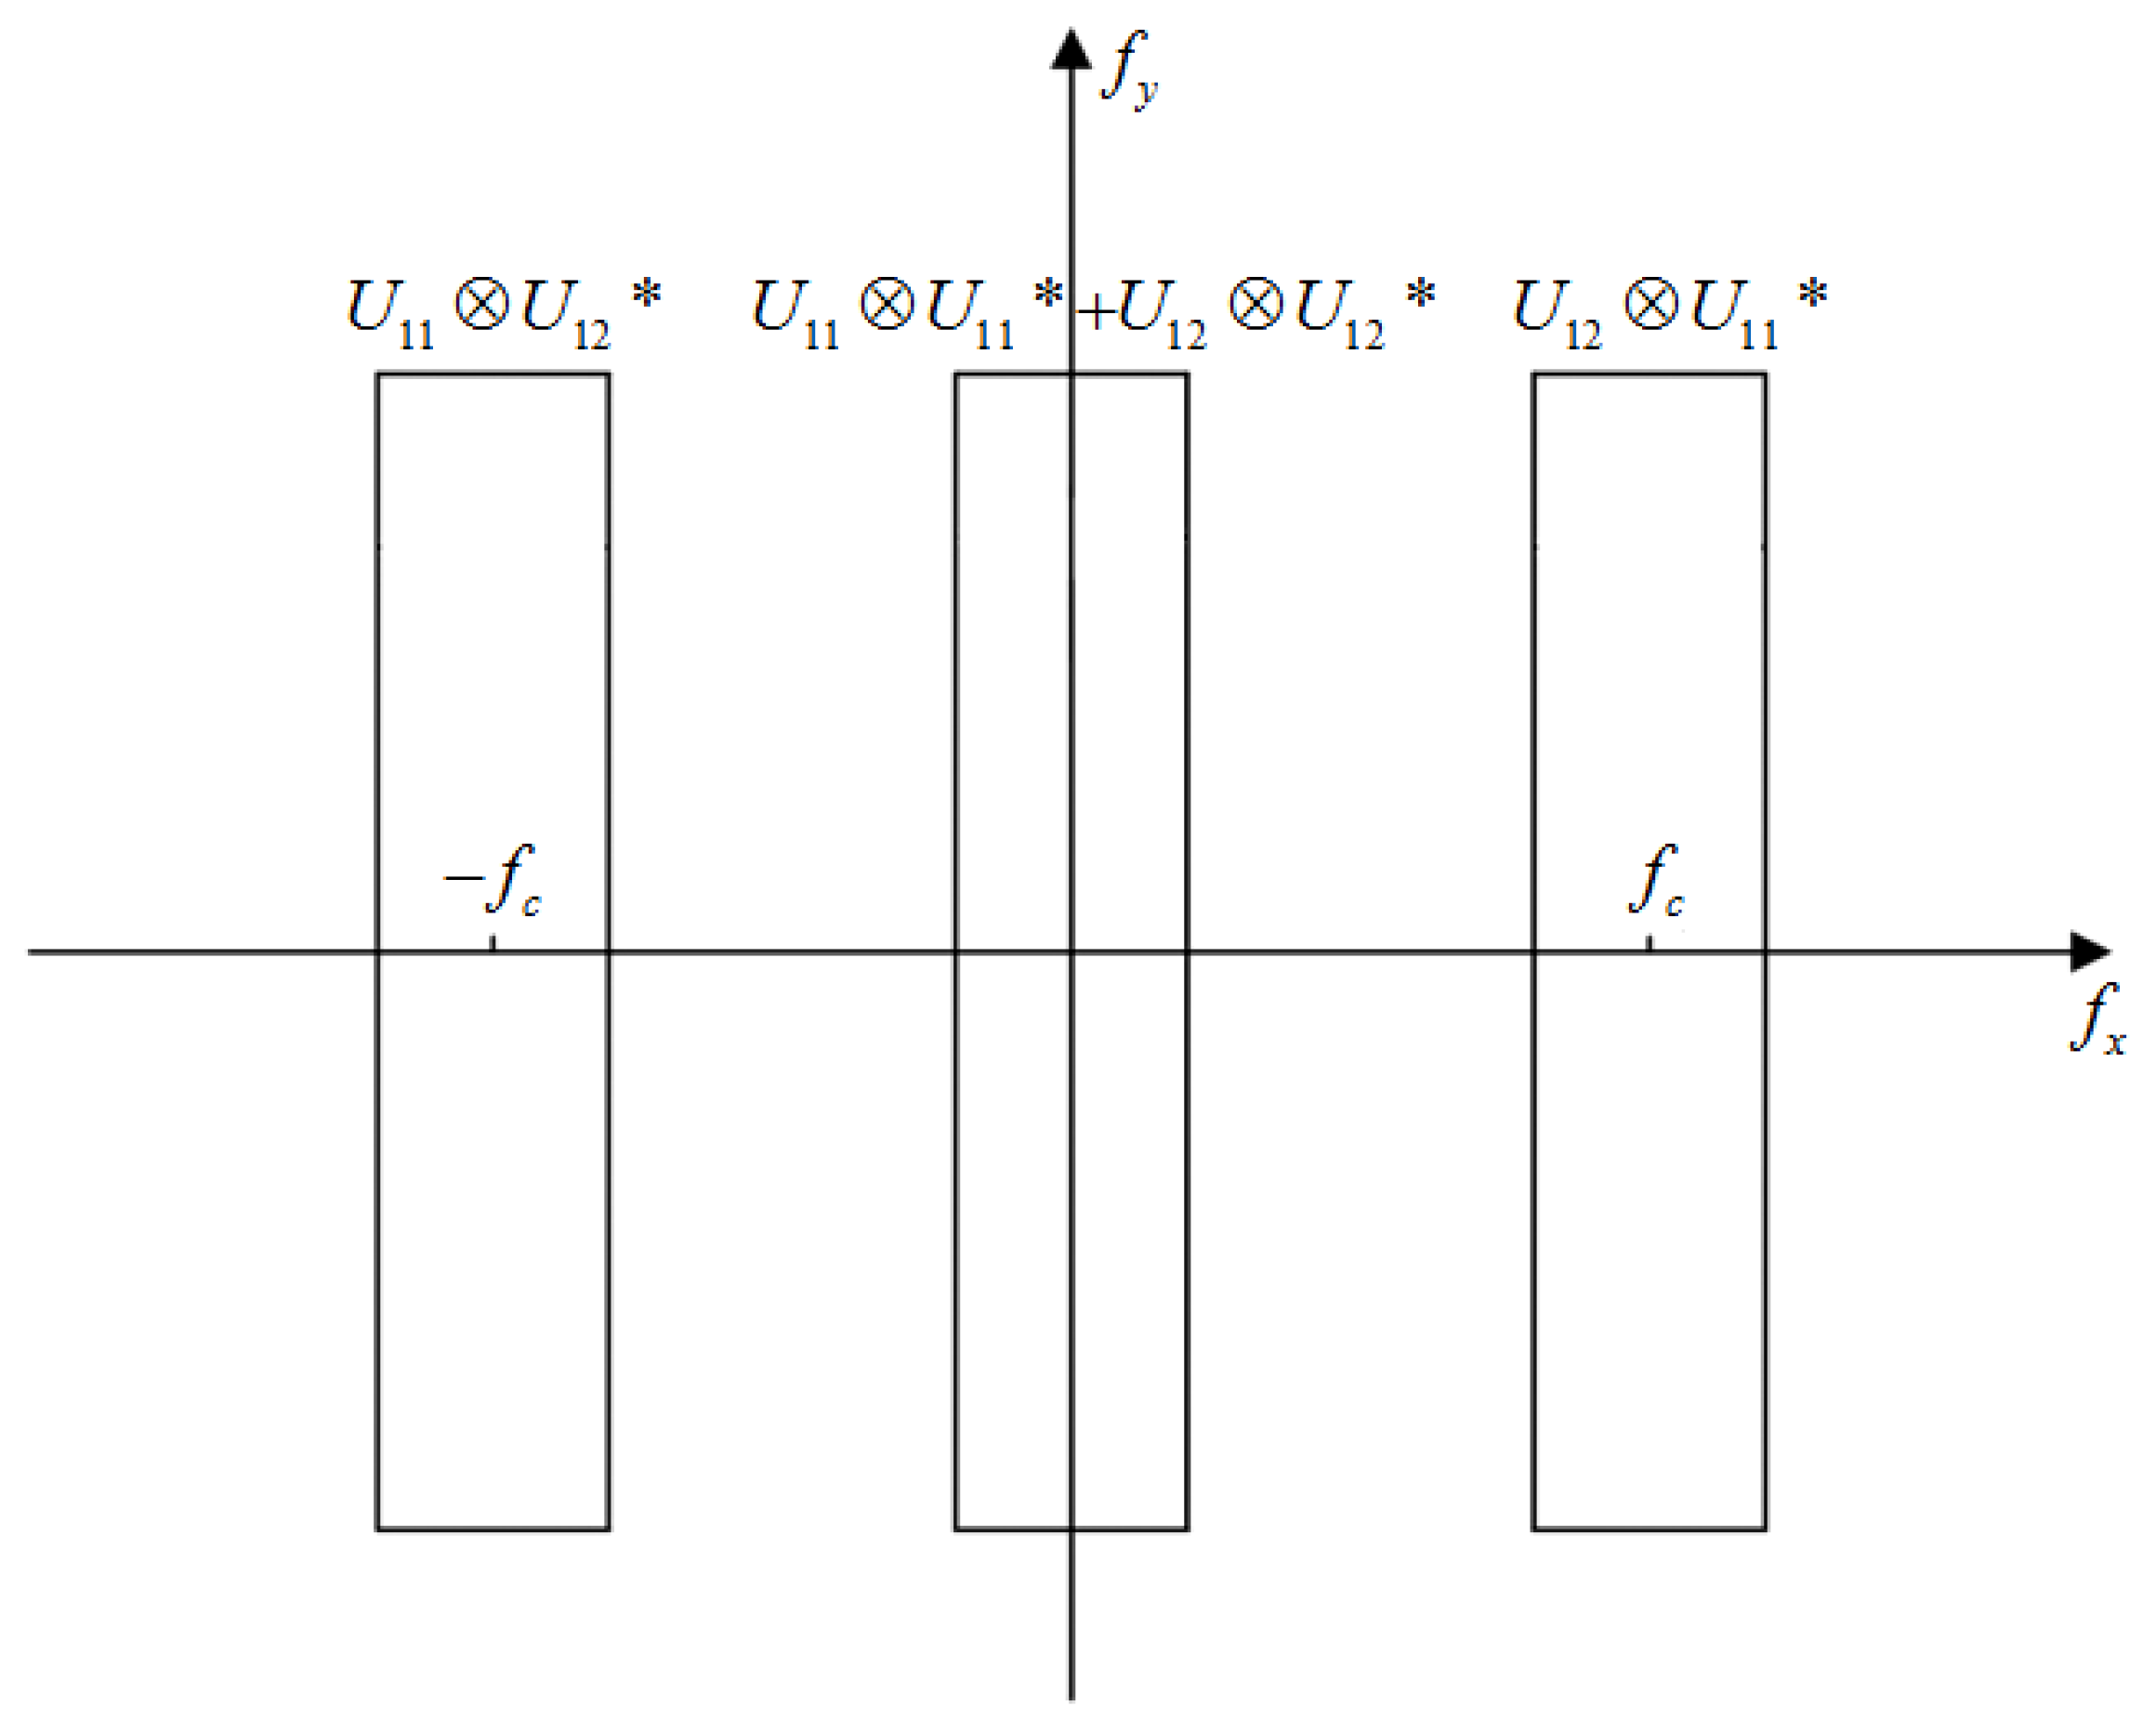
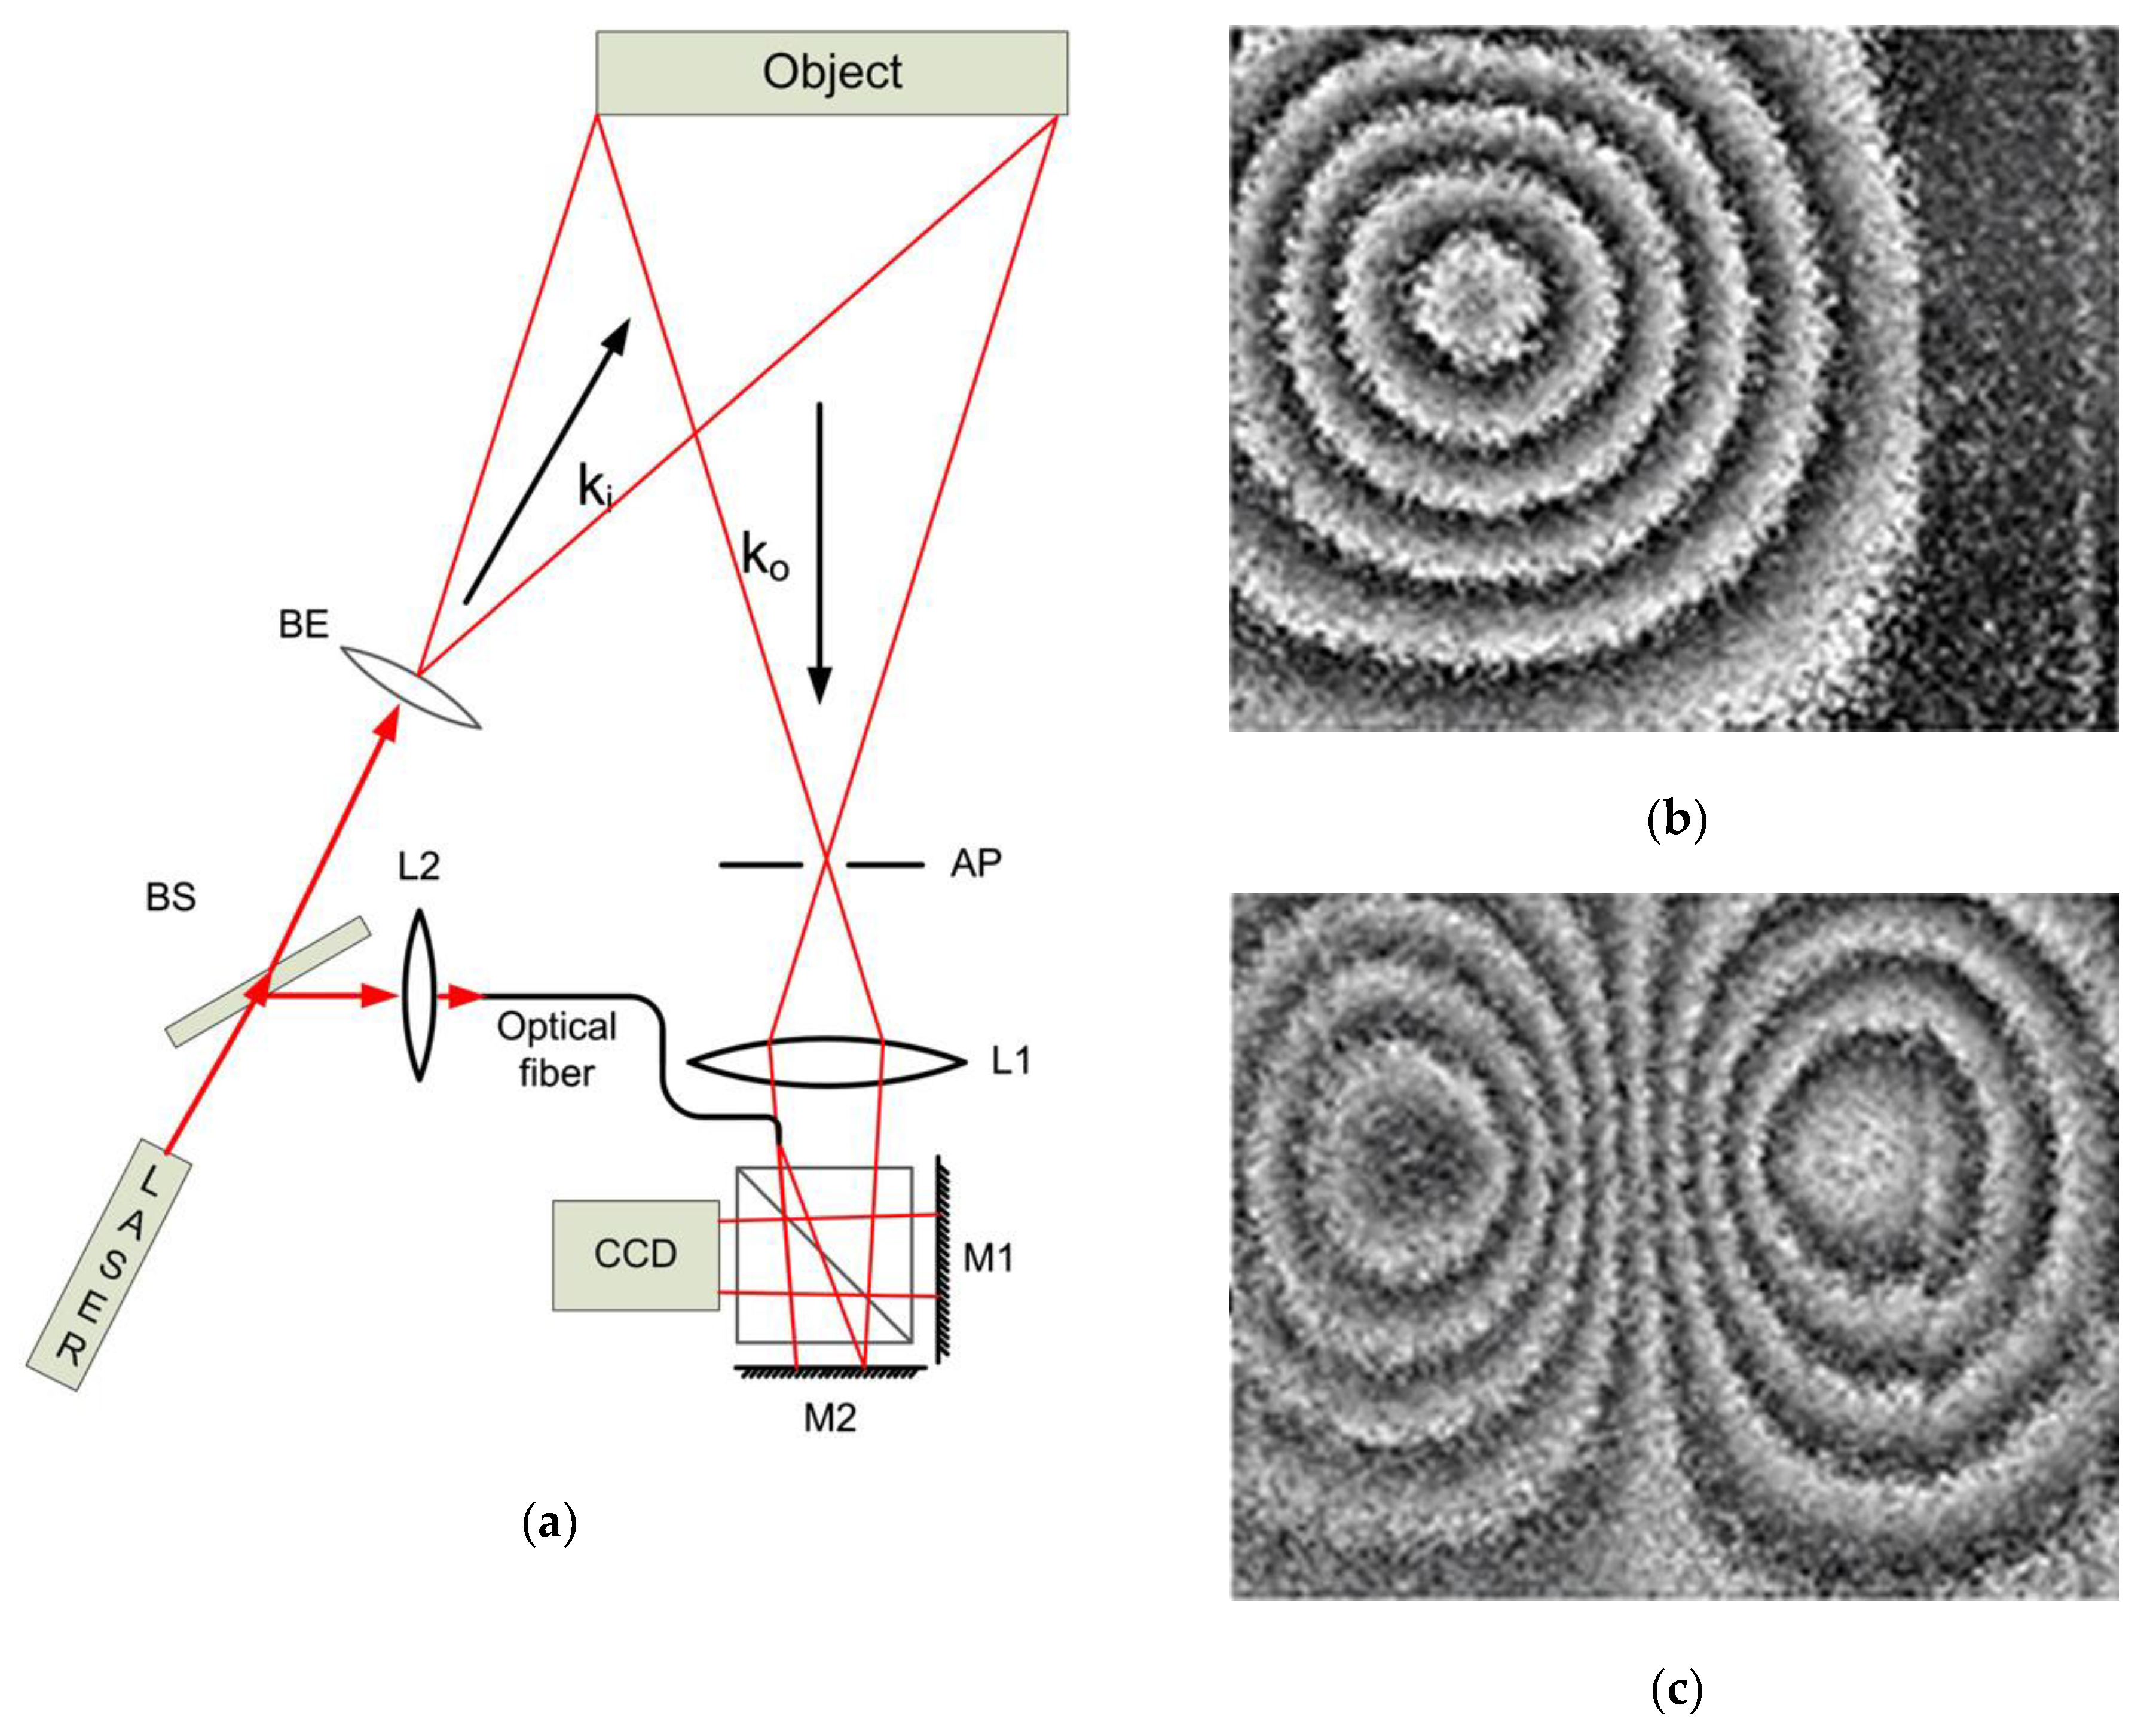
3.2.2. Carrier-Frequency Spatial Phase-Shift Shearography

In addition to the multichannel spatial phase-shift shearography method introduced above, another phase extraction method suitable for dynamic measurements is the carrier-frequency spatial phase-shift shearography. Compared with the multichannel spatial phase-shift method, the carrier-frequency spatial phase-shift method can provide higher spatial resolution. A typical carrier-frequency spatial phase-shift setup is based on the Mach–Zehnder interferometer [20]. In this case, the carrier frequency is introduced by tilting a mirror in the interferometer as shown in Figure 6.
After passing through the shearing device, the laser is divided into a sheared part and an unsheared part, which can be expressed as follows:
u 1 ( x , y ) = | u 1 ( x , y ) | exp [ i ϕ ( x , y ) ] u 2 ( x , y ) = | u 2 ( x + Δ x , y + Δ y ) | exp [ i ϕ ( x + Δ x , y + Δ y ) 2 π i f c x ]
where u 1 and u 2 are the components of the sheared and unsheared part, respectively, and Δ x and Δ y represent the shearing distances in the x and y directions, respectively. The carrier frequency component f c introduced by tilting angle β can be expressed as follows:
f c = sin β λ
The intensity recorded by the CCD is as follows:
I = ( u 1 + u 2 ) ( u 1 * + u 2 * ) = u 1 u 1 * + u 1 u 2 * + u 2 u 1 * + u 2 u 2 *
where * represents the complex conjugate of u i . To extract the phase, a Fourier transform is performed on the formula to convert it from the spatial domain to the Fourier domain as follows:
F ( I ) = U 1 ( f x , f y ) U 1 * ( f x , f y ) + U 2 ( f x + f c , f y ) U 2 * ( f x + f c , f y ) + U 1 ( f x , f y ) U 2 * ( f x + f c , f y ) + U 2 ( f x + f c , f y ) U 1 * ( f x , f y )
where denotes the convolution operation. Figure 7 is a schematic diagram of the Fourier spectrum of the image (with shearing in the x direction). Corresponding to the formula, the four items can be divided into three spectra in the frequency domain, where the central spectrum is a low-frequency term F ( u 1 u 1 * + u 1 u 2 * ) , containing information from the background. The high-frequency terms F ( u 2 u 1 * ) and F ( u 1 u 2 * ) on both sides contain the phase information of the interferogram, which are located at the positions ( f c , 0 ) and ( f c , 0 ) on the spectrum, respectively, and the width is determined by the size of the aperture (AP).
By appropriately selecting an illumination angle, the three spectrums on the Fourier domain can be separated. By appropriately selecting the windowed inverse Fourier transform (WIFT), the phase distribution can be calculated as follows:
ϕ + 2 π f c x = arctan Im [ F ( u 1 u 2 * ) ] Re [ F ( u 1 u 2 * ) ]
where Im and Re denote the imaginary and real parts of the complex number, respectively. The relative phase difference due to deformation can be obtained after loading using a similar process.
The carrier-frequency spatial phase-shift method can evaluate the phase map from a single pair of speckle images obtained before and after loading. The acquisition rate is no longer limited by the phase-shift steps but only by the camera function, thereby achieving dynamic measurements with high speed. However, there are still limitations, such as small measurement size, poor phase map quality, and the shearing and carrier-frequency both being controlled by tilting mirrors. Spatial phase-shift systems that introduce carrier frequencies with other carriers, such as a double-aperture mask and a Michelson interferometer, have been developed to solve these problems. In 2006, Bhaduri et al. proposed a digital shearography system using a double-aperture mask as a carrier to introduce the carrier frequency [31,32]. Compared to the system based on the Mach–Zehnder interferometer, the double-aperture-based system provides better phase map quality, comparable to that of the TPS-DS system. However, similar to the Mach–Zehnder system, the measurement size of the double-aperture-based system is also small due to the use of a collimated light source and dual apertures. The stability of the entire measurement system is also reduced due to its complex optical path, which also limits its application in the laboratory and industry.
Both the Mach–Zehnder-based SPS-DS system and double-aperture SPS-DS system have the disadvantage of limited measurement area. A Michelson-based SPS-DS system also exists, which can be used to obtain a larger measurement area by embedding the 4f system [33,34]. The SPS-DS system with a 4f system is shown in Figure 8a. The imaging range for this system is no longer affected by the beam splitting prism but only depends on the lens and the camera. Figure 8b,c show the field of view of the conventional shearography device and the 4f system. At the same measuring distance, the measuring area of the conventional device only covers the framed portion of the 4f system measurement result.
The Michelson-based system has a simpler setup than the Mach–Zehnder and double-aperture systems, so it is relatively insensitive to external disturbances. Additionally, it is easy to change the shearing amount and shearing direction, making it the most widely used shearing device. However, the Michelson-based system typically requires a large shearing amount to enable the two side spectra to be separated from the center spectrum, while the Mach–Zehnder-based setup can easily be performed with a small or large shearing amount. In order to solve this problem, a special slit aperture can be used instead of the usual circular aperture [35]. Under the same shearing amount and aperture size, the slit aperture provides a larger spectral region containing the phase information. Experiments have shown that under the same experimental conditions, using the slit aperture requires a lower shearing amount, and the side spectral area after Fourier transform is much larger than that obtained using the circular aperture. This reduces the shearing amount required for the Michelson-based system and improves the quality of the phase map.
Figure 9 shows the results of an application of the Michelson-based SPS-DS system for NDT of delaminations/disbonds of a composite plate. All images were captured during dynamic loading. The settings of the camera parameters, such as exposure time, shutter mode, and resolution, should be noted. For dynamic measurements, a short exposure time and global shutter should be chosen for a clear image.
Based on the above introduction, the two methods are summarized in Table 2.
In recent years, some new phase extraction algorithms and optimizations have been proposed [36,37,38,39]. In 2014, Albertazzi et al. proposed an alternative approach for retrieving phase information from a sequence of images with unknown phase shifts [40]. The approach combines data from several good modulation points on the image to form an N-dimensional Lissajous ellipsis. An overall phase-shift value is determined from the fitted ellipsis for each interferogram, then the phase-shifted values are used to determine the phase value for each image pixel. In 2015, Xie et al. provided a review of recent developments of spatial phase-shift digital shearography and specifically introduced the problem of improving the phase map quality of spatial phase-shift digital shearography [41]. In 2018, Aranchuk et al. developed a pulsed digital shearography system that utilizes the spatial phase-shifting technique, which allows for instantaneous phase measurements [42]. In 2018, Kirkove et al. applied a method that combines the time-averaging and phase-shifting techniques, which improved the contrast and resolution compared to traditional time averaging [43] and has proven to be particularly useful in vibration testing performed under industrial conditions.

4. Recent Developments of Shearographic NDT

The digital shearography technique has many advantages, including real-time and full-field measurements, simple setup, direct measurement of strain information, and relative insensitivity to the environment. More importantly, with the development of phase-shifting technology, the sensitivity of digital shearography has correspondingly improved, and smaller flaws can be detected. For some flaws that cannot accurately be measured conventionally, digital shearography can also detect them by determining the second derivative of the deformation [44]. At the same time, however, some limitations exist for digital shearography, and research in the past few years has focused on these and will focus on them in the future. Some of these limitations have been addressed, and the solutions developed for these limitations will be covered in this section. Others, such as only being able to measure surface flaws and suitability for high-strength materials, currently have no solution. However, the lack of solution for these limitations does not affect the suitability of digital shearography as a measurement method for NDT.

4.1. Simultaneous Measurement of Deformation and the First Derivative

As mentioned above, the data obtained by the shearography technique is the strain information, that is, the first derivative of the deformation. Sometimes it is necessary to quickly calculate the deformed data to achieve accurate positioning and quantification of the flaws, but the inverse calculation is very complicated. In 2013, Xie et al. developed an SPS-DS setup for simultaneous measurement of deformation and first derivative, which obtains phase information recorded by one camera through the introduction of two carrier frequencies [45,46]. Thus, the phase information obtained by the holography and shearography optical paths can be separated from a single intensity map. Figure 10 shows the SPS-DS setup and the results of simultaneous measurements with the device.

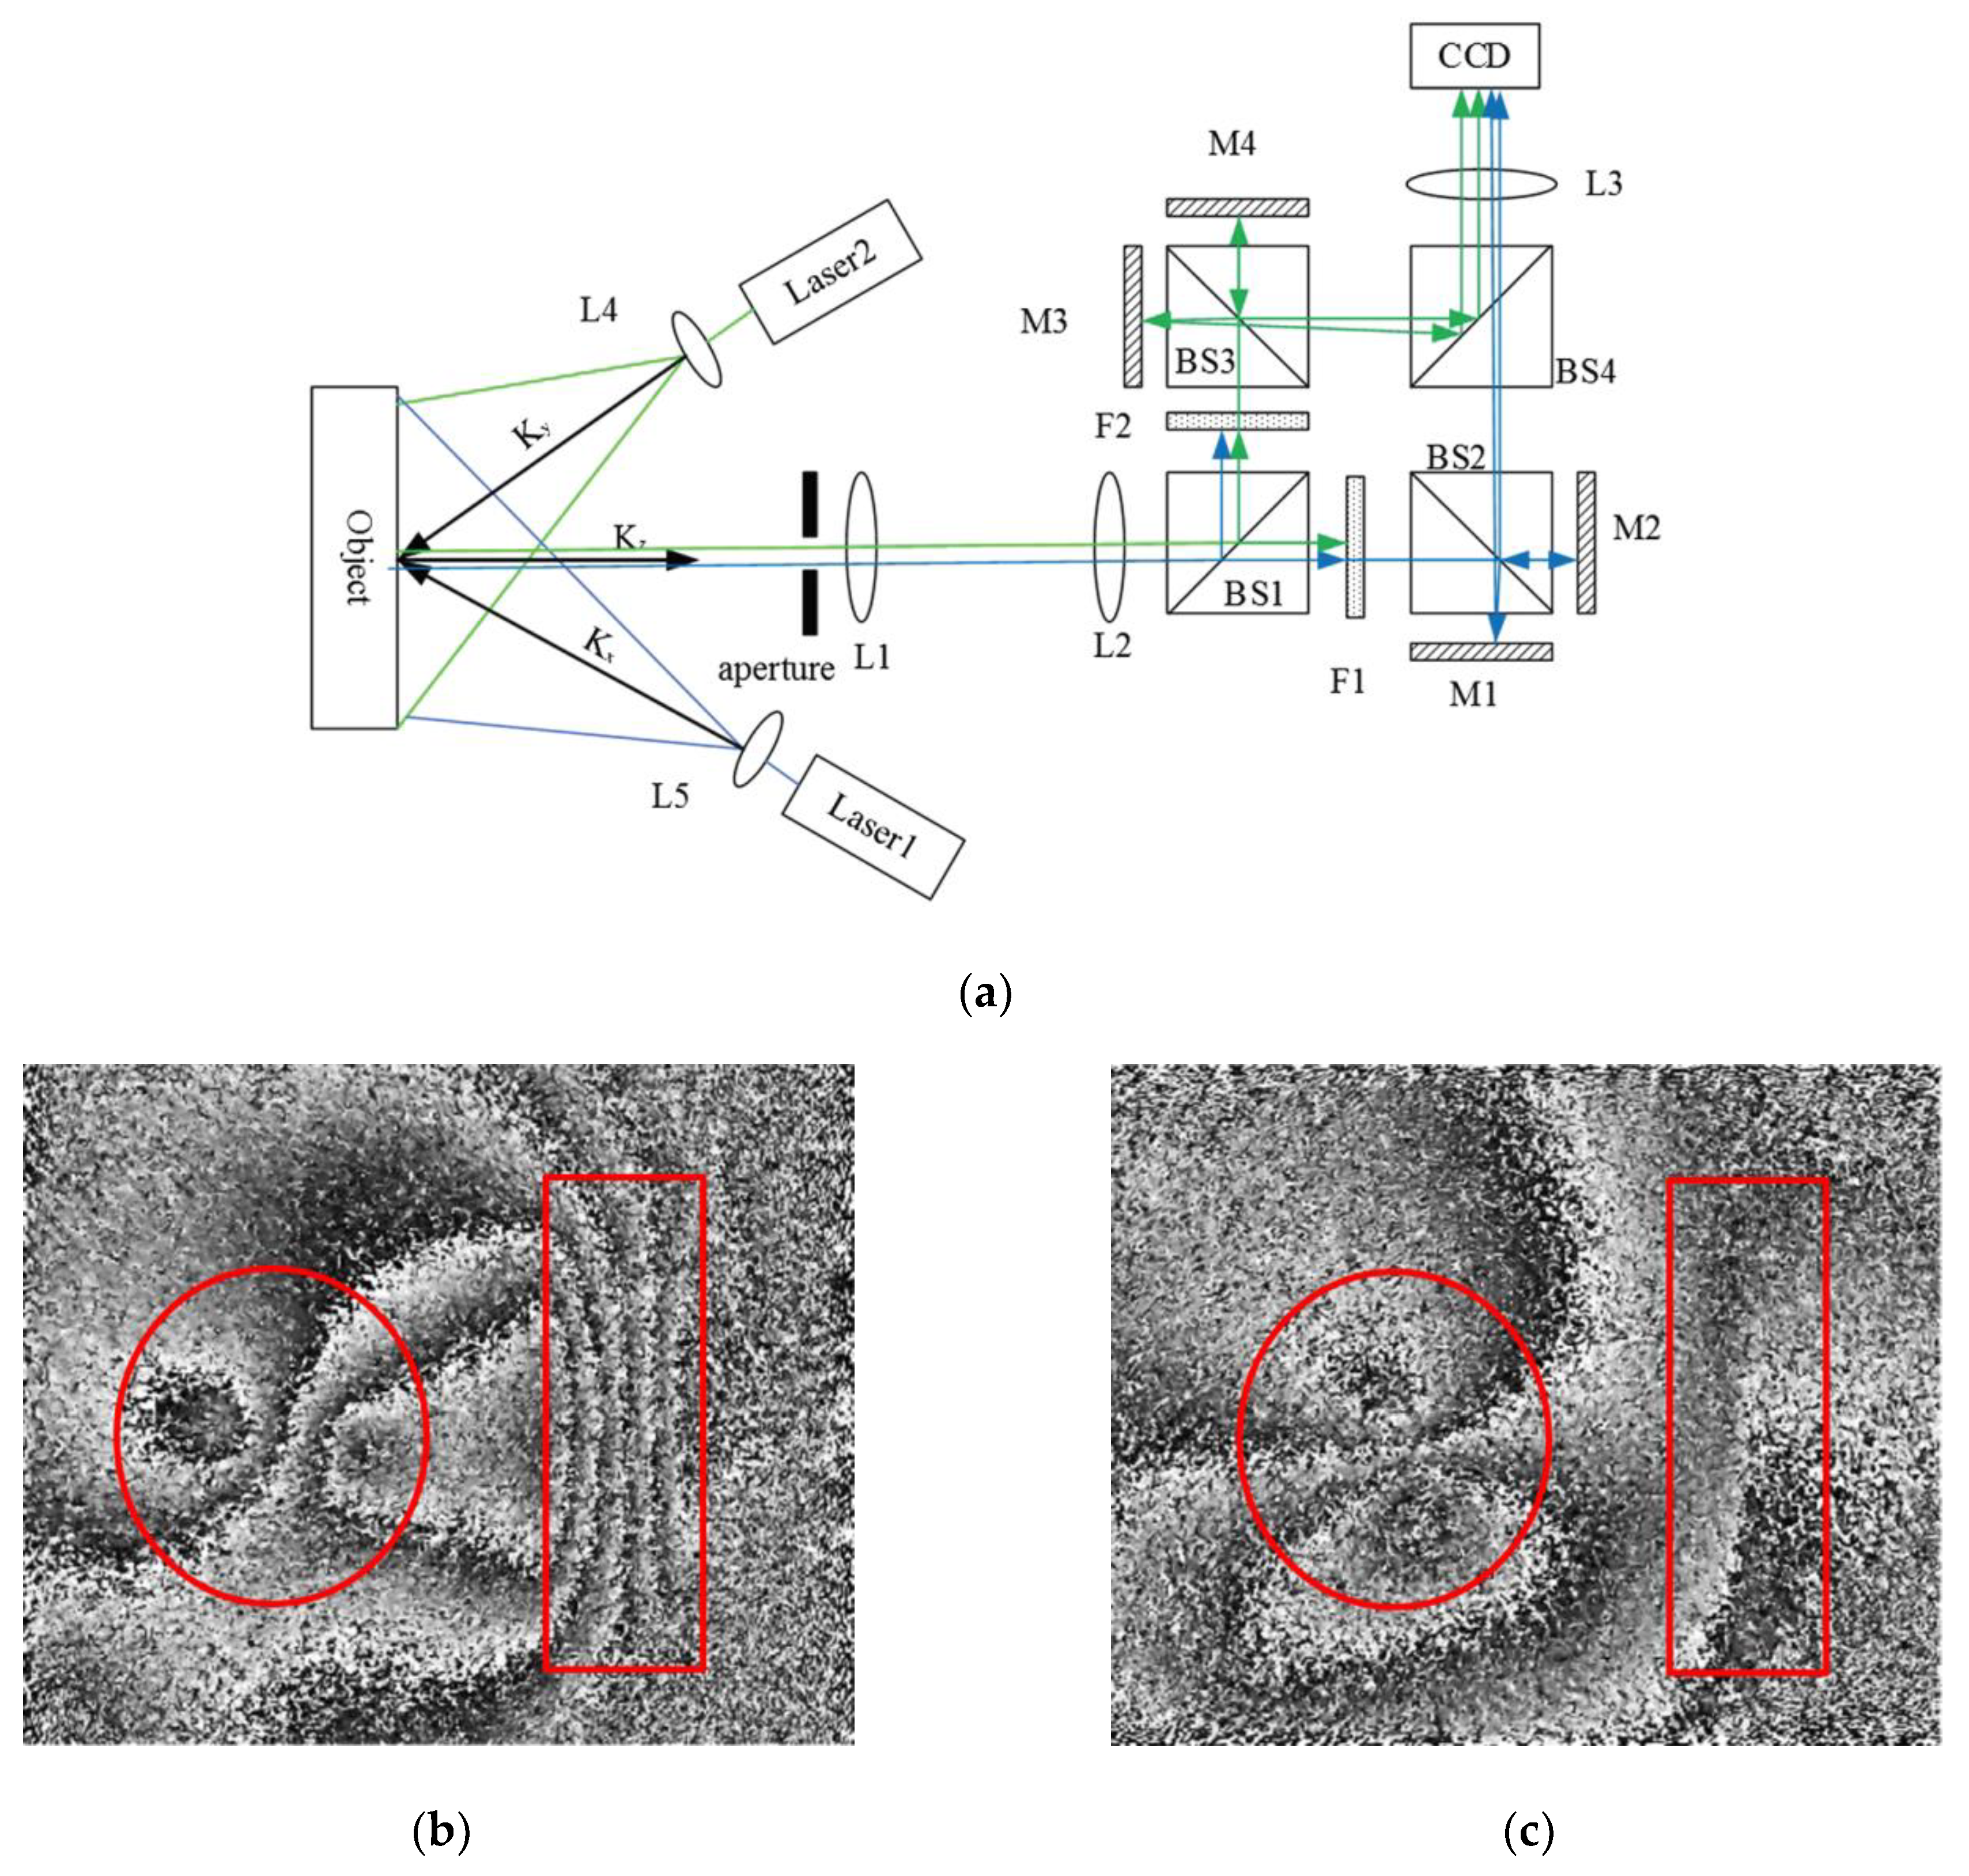
4.2. Multidirectional Sheared SPS-DS

The sensitivity direction of digital shearography is related to its shearing direction, which leads to the problem of missed detection of directional flaws with the single shearing direction system. Therefore, shearographic setup with double shearing directions was developed. In 1997, Yang proposed a TPS dual-shearing direction shearography system based on the Michelson interferometer [47]. This system is composed of two modified Michelson interferometers superimposed on the vertical plane, and the different shearing directions are generated by the upper and lower system. In 2016, Xie et al. proposed an SPS dual-shearing direction shearography system based on the Mach–Zehnder interferometer, which is a polarized system recording shearograms in the two orthogonal directions simultaneously [48]. In 2016, Wang et al. proposed an SPS dual-shearing direction shearography system based on the Michelson interferometer as shown in Figure 11a [49]. The system is composed of two modified Michelson interferometers on the horizontal plane. Only one camera is required using the carrier frequency technique. Due to the different shearing directions, the carrier frequency of the two parts are different, and the phase map can be separated from one intensity map. The experimental results are shown in Figure 11b,c. In addition, in 2018, Barrera et al. proposed an aperture-based SPS multishearing direction system that can acquire information in three different shearing directions simultaneously [50]. A set of three wedge prisms combined with three apertures were used to obtain the interferograms in three directions.

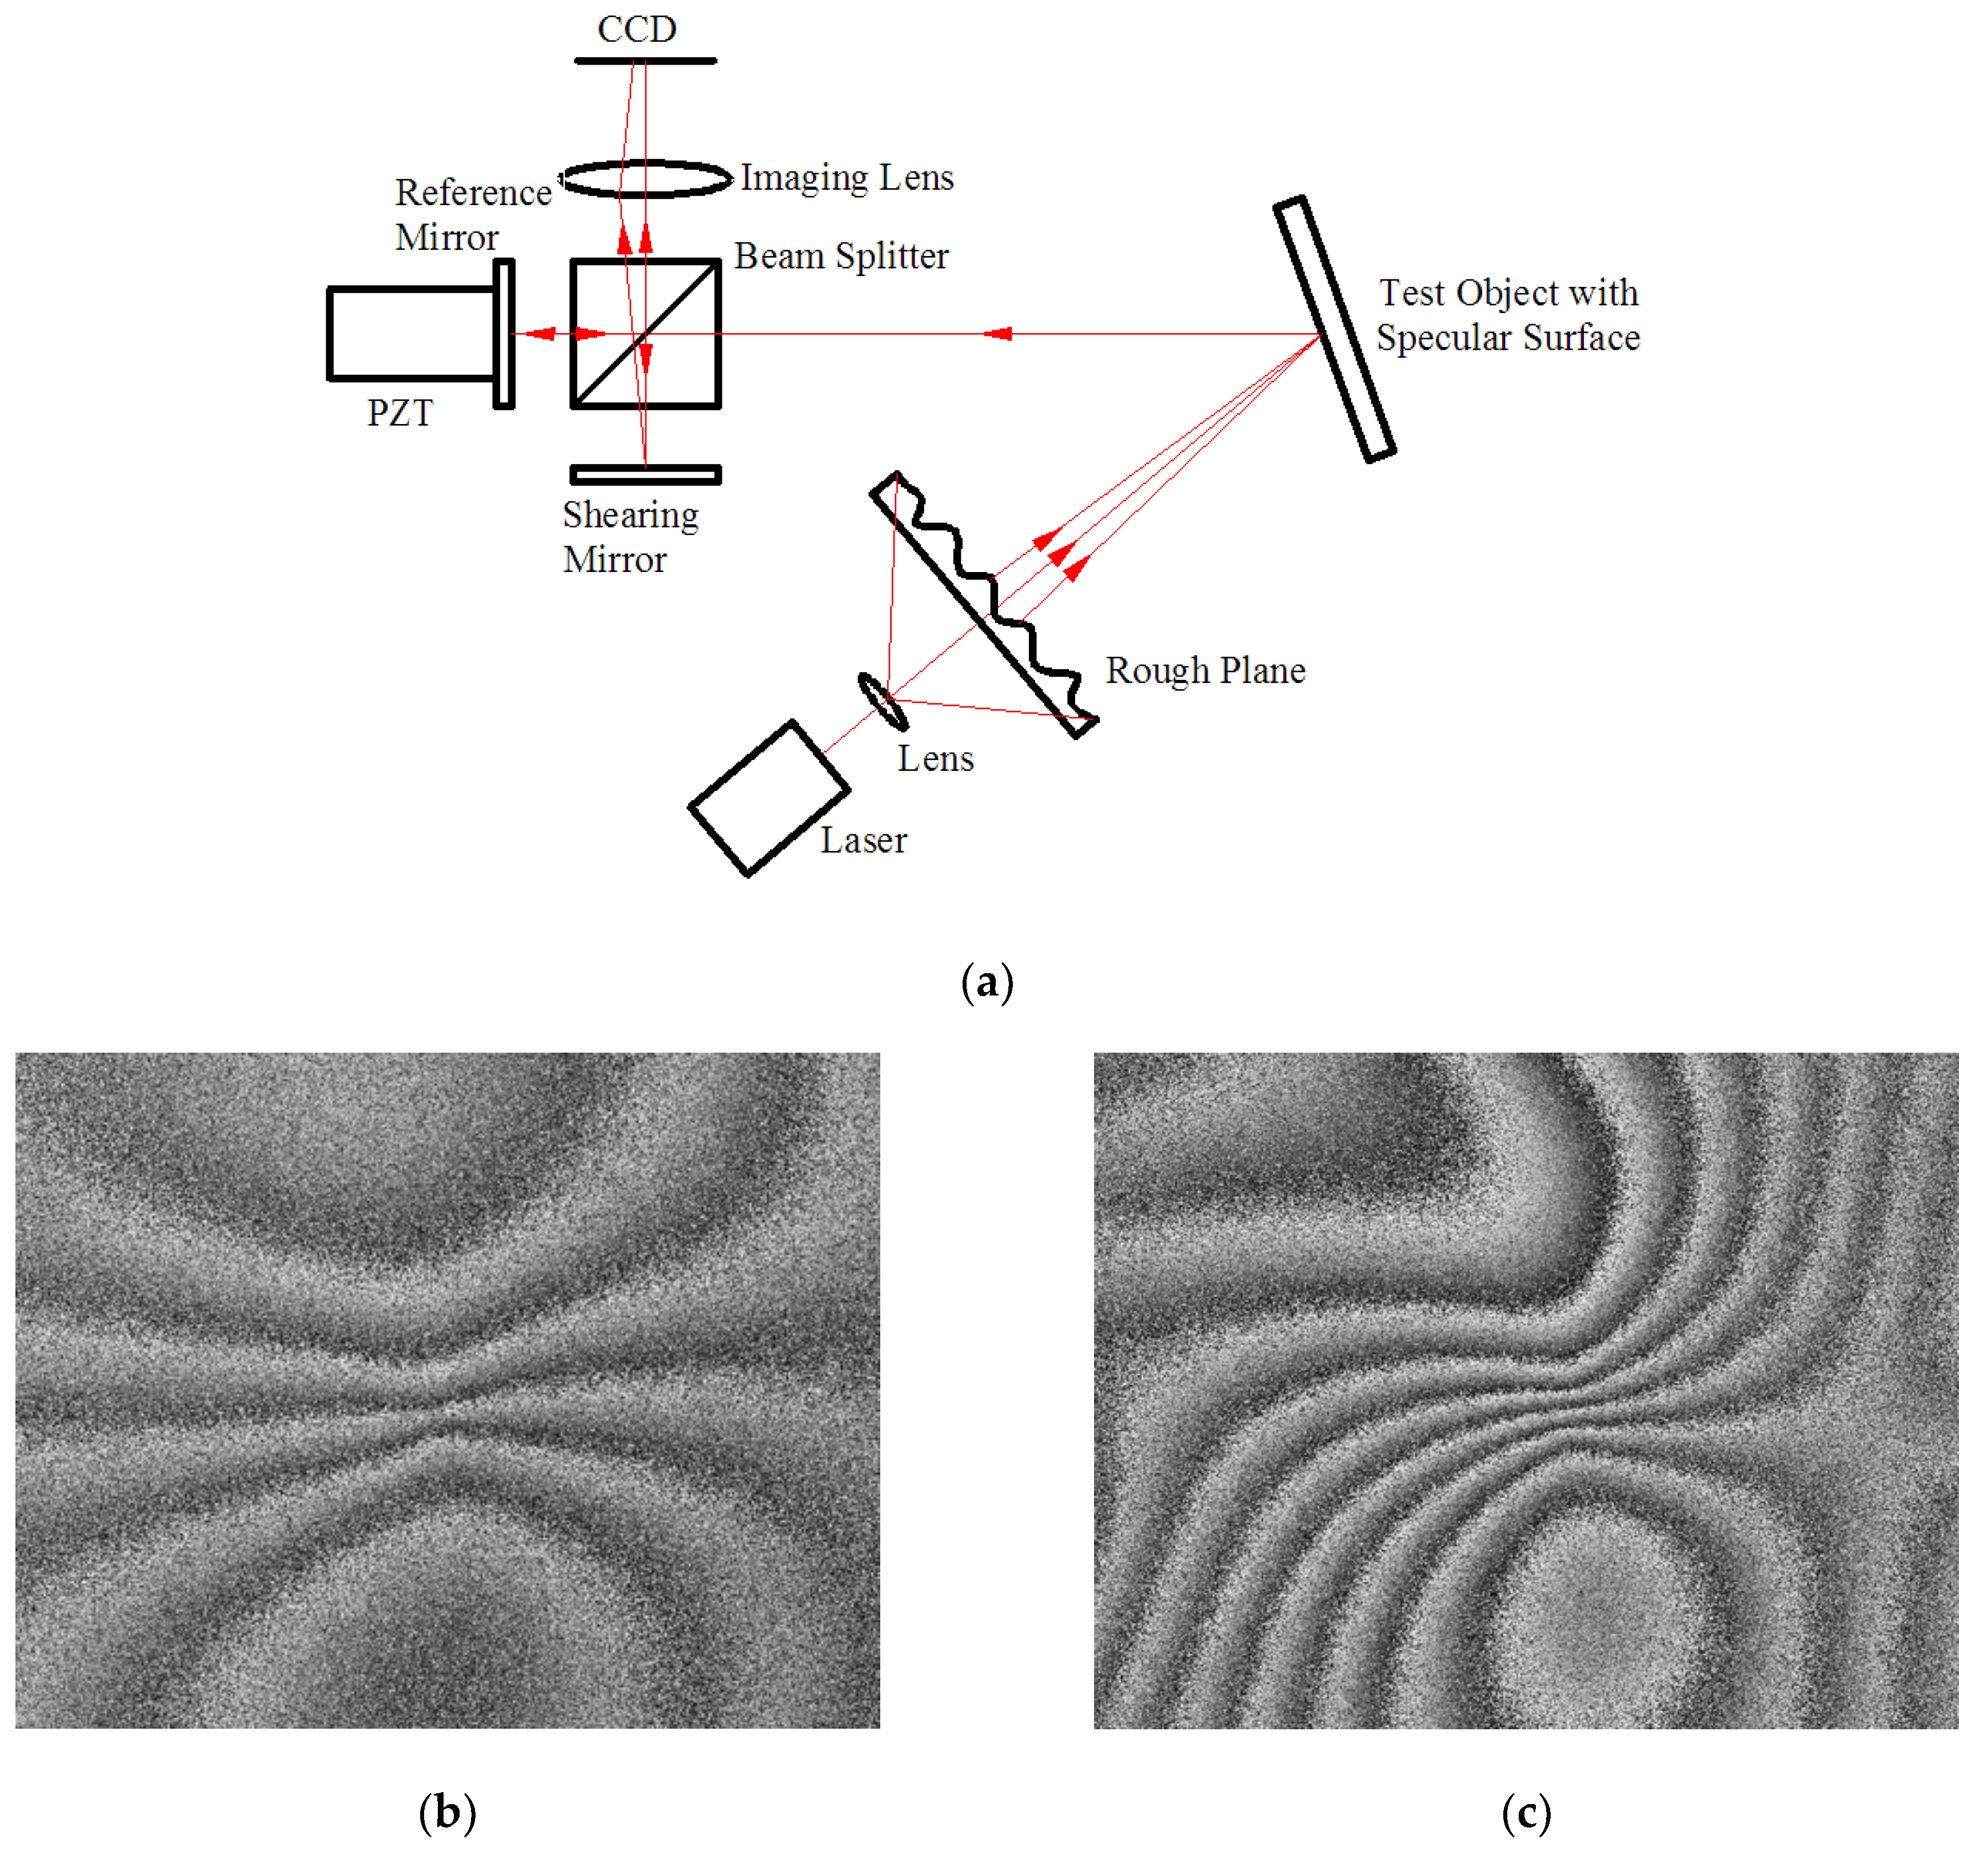
4.3. Shearographic NDT on Specular Surface Materials

In general, shearography is suitable for the measurement of rough surfaces because the speckle pattern can be generated by diffuse reflection on the object surface, which is a basic requirement for shearography. However, if the object surface is specular or quasi-specular, a speckle pattern cannot be created and digital shearography cannot be used for measurement. In 2014, Xu et al. proposed a new shearographic setup to achieve measurement for a specular surface material [51] in which a rough plane M is embedded into the optical path to produce the speckle pattern required for shearographic measurement. In 2018, Yan et al. improved the shearographic optical path of specular surfaces [52]. The rough surface was placed at the front portion of the optical path to improve the problem of the flaw location on the phase map being shifted when the area has high local slope. Moreover, the conjugate of the specular surface and the phase map makes it easy to determine the positional correspondence between the interferogram and the internal flaws. This setup is shown in Figure 12a, and the experimental results of cone-shape deformation and irregular deformation are shown in Figure 12b,c, respectively.

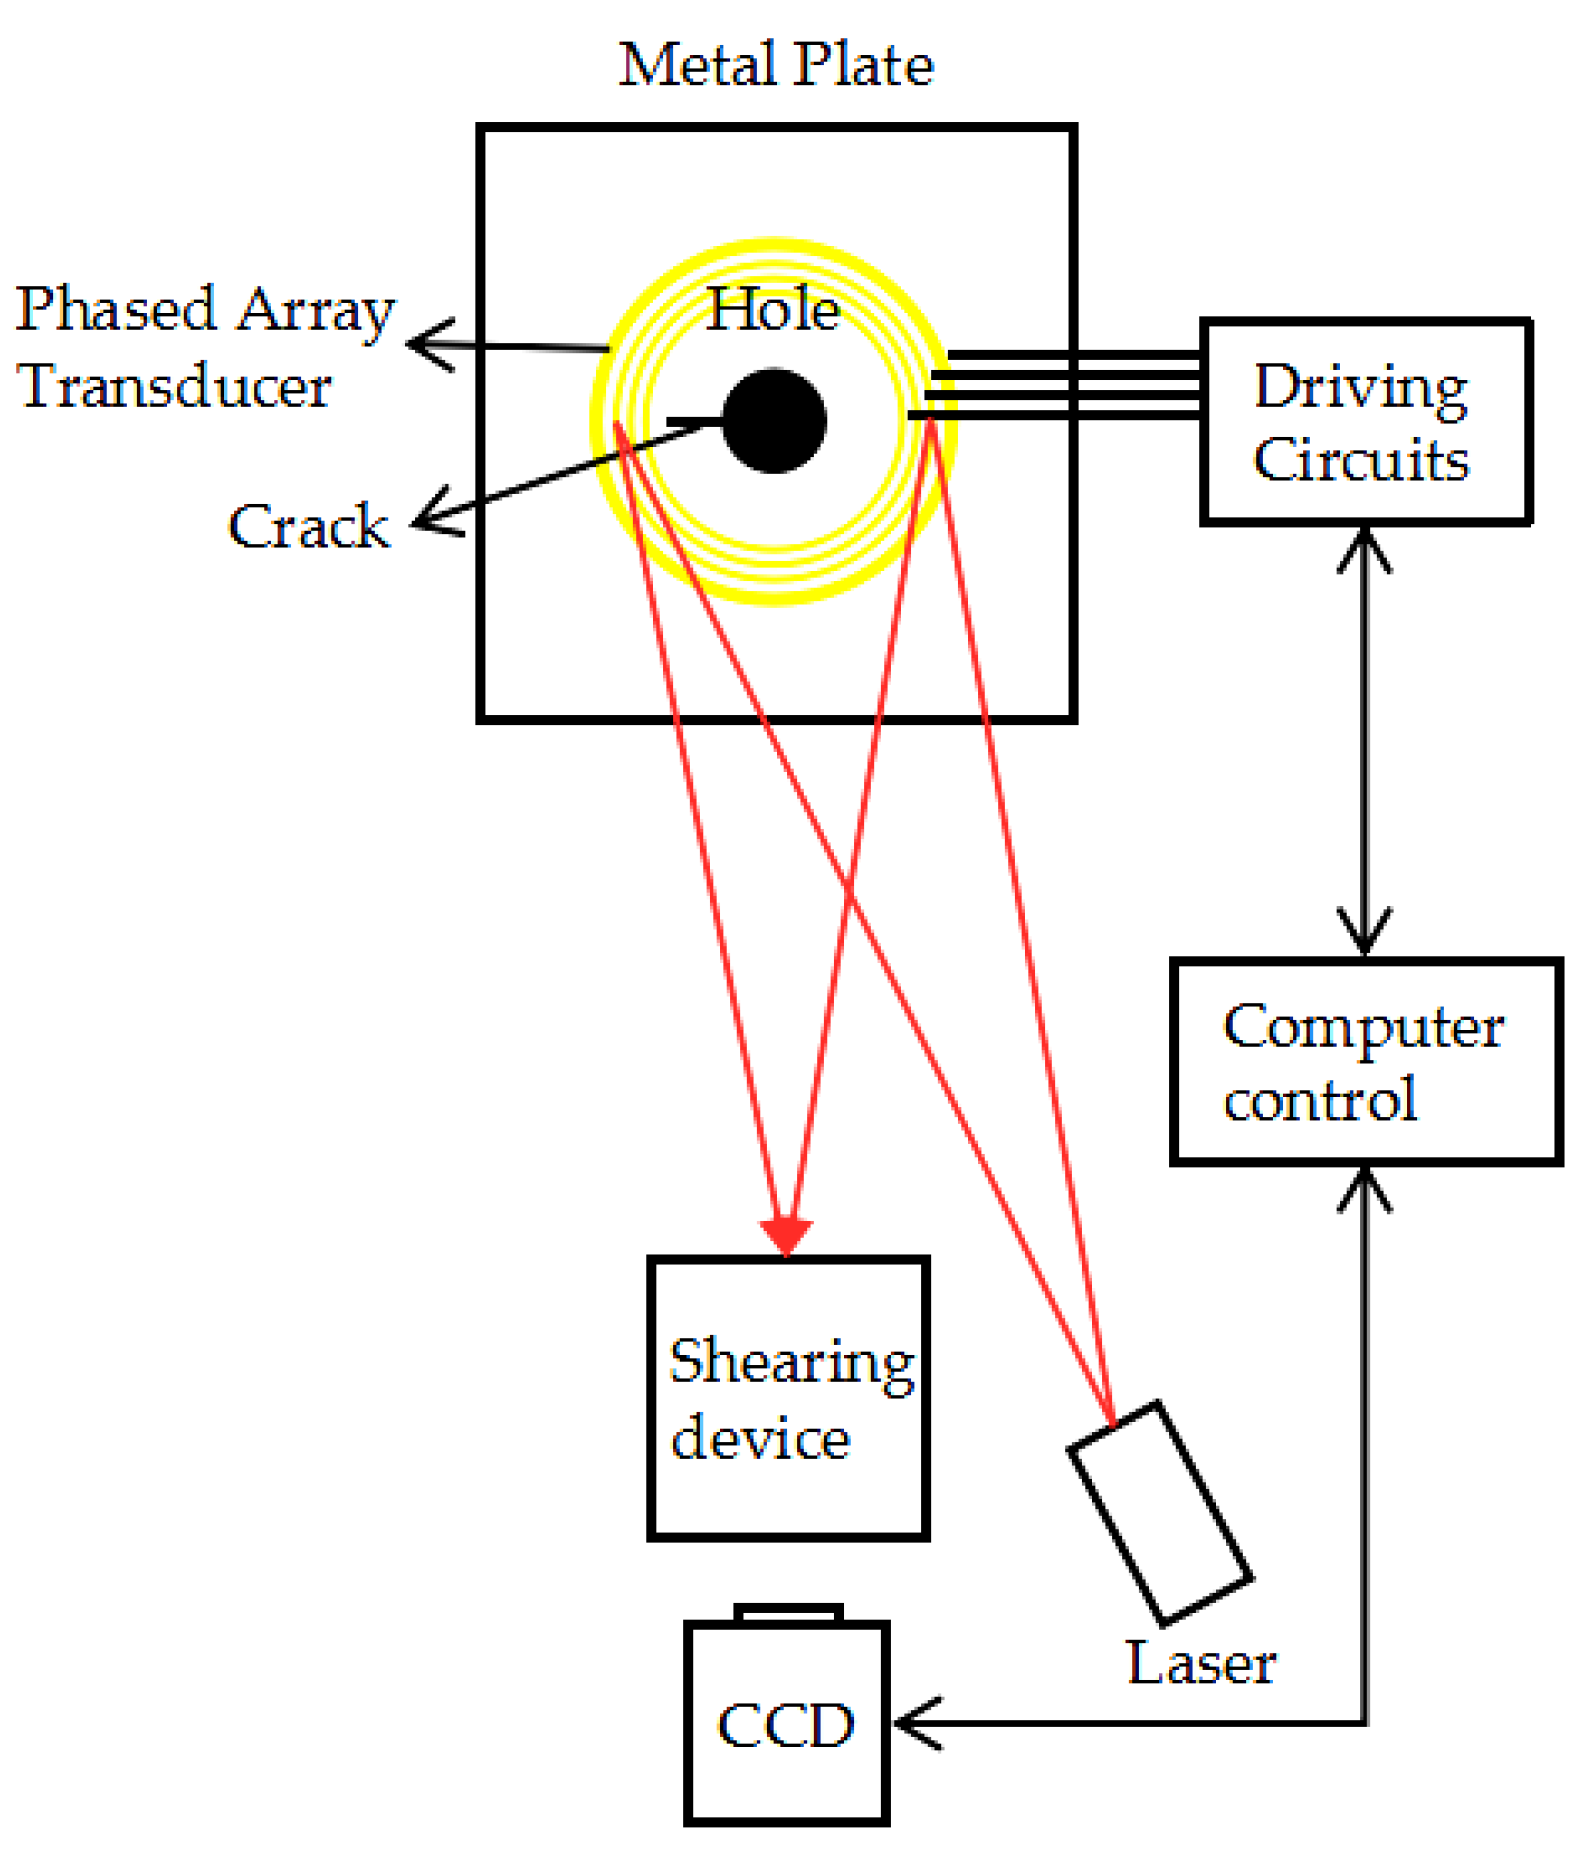
4.4. Directed Acoustic Shearography for Subsurface Crack

With respect to the difficulty of using digital shearography to measure flaws away from the object surface, a directed acoustic shearography system using a ring-shaped phased array transducer was developed to measure subsurface depth flaws. In 2010, Kurtz proposed the concept of directed acoustic shearography [53]. In 2017, Liu et al. demonstrated that it was feasible to use acoustic waves as stress loading for shearography testing with a piezoelectric disc transducer [54,55], thus demonstrating the feasibility of such a system. The directed acoustic shearography system consists of a phased array transducer, laser light source, and shearography sensor as shown in Figure 13. The phased array transducer provides pressure loading to the object, then the object is measured by a shearography measuring device.

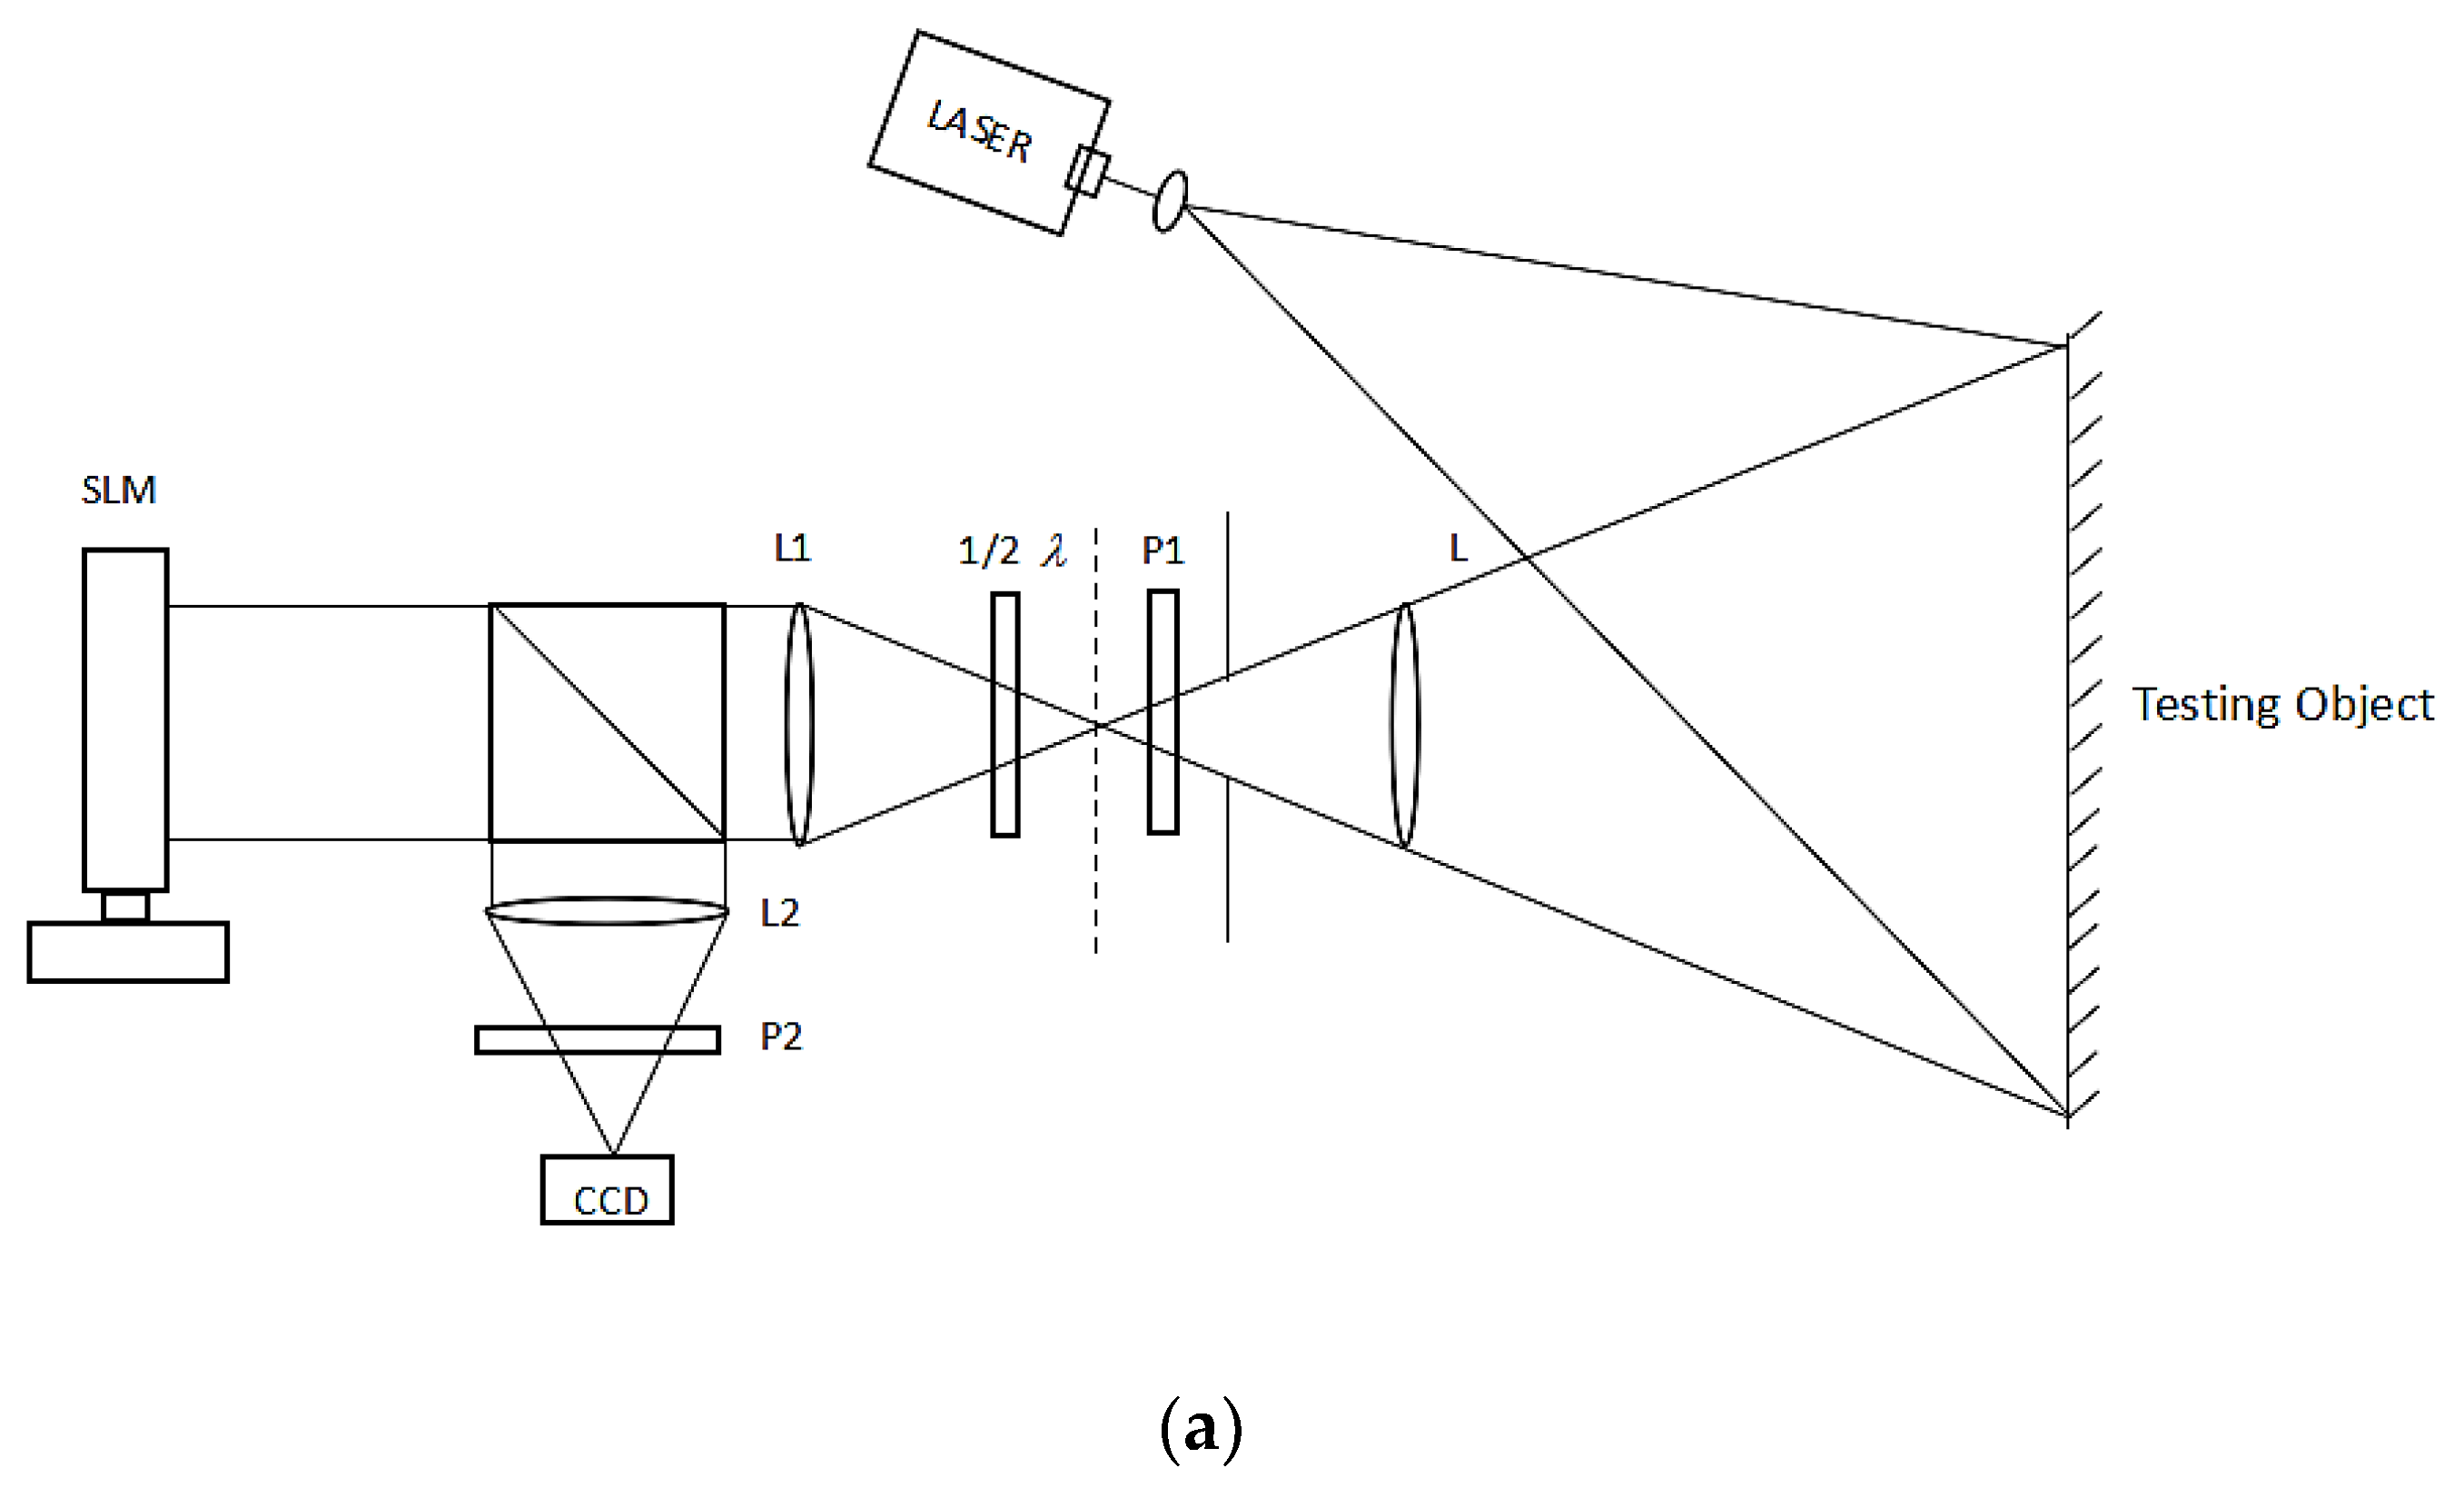
4.5. New Shearographic System with SLM

As technology has advanced, new technologies have been applied to shearography, such as the spatial light modulator [56], to further improve system performance. In traditional shearography, the shearing amount is controlled by mechanical adjustment, and the piezoelectric ceramics that introduce the phase shift tend to be nonlinear, producing random errors that are difficult to eliminate. In 2018, Sun et al. proposed a new shearographic system with a spatial light modulator [57] in which the spatial light modulator can accurately change the phase and shearing amount, eliminating the nonlinear random error with higher efficiency. The shearography system with spatial light modulator is shown in Figure 14a, while the experimental results are shown in Figure 14b,c. It can be seen that the quality of the phase diagram is good, so the system can meet NDT applications on the basis of precise control.

4.6. Recent Applications of Shearographic NDT

Digital shearographic NDT has some limitations at present, but it is still a very practical NDT tool for material evaluation and quality inspection. In the field of nondestructive testing of traditional aerospace materials, it can be used for detecting flaws such as delamination, sticking, cracking, voids, and damage in aircraft components, composite materials, and honeycomb structures. In the automotive industry, it can also be used for applications such as tire testing and table inspection. In addition, digital shearography is a good prospect for applications such as the detection and measurement of composite materials in machinery, construction, transportation, and other industries [58,59,60,61].
In 2015, Feng studied the inner defect detection of pressure vessels via the theoretical mode, numerical simulation (finite element method), and experiment in which digital shearography and the phase-shifting method was used [62]. This work proved that it is feasible and advantageous to use digital shearography for the detection of inner defects of pressure vessels. In 2017, Benedet et al. used an endoscopic shearography system with radial sensitivity for inner inspection of adhesion faults in composite material pipes [63]. The system used two conical mirrors to achieve radial sensitivity, and a special Michelson-like interferometer was formed, replacing one of the plane mirrors with a conical mirror. In 2017, Buchta used the digital shearography technique for defect detection on artwork while using the lock-in-technique to control the penetration depth of the thermal wave, enabling the determination of depth information [64]. Due to the high rigidity and/or high thermal conductivity of metals, it is difficult for shearography with conventional loading methods to detect defects. In response to this problem, in 2017, Liu et al. proposed shearography using wave-defect interactions for crack detection in metallic structures [54]. In 2017, Pascual-Francisco et al. presented a new application of shearography using the technique to measure viscoelasticity in terms of creep compliance of elastomeric materials [65,66]. The results were compared to that obtained with DIC, and this work demonstrated that shearography can be successfully applied to the creep analysis of viscoelastic materials. The applications and scope of the digital shearography technique is still expanding. At the same time, research on the specific effects of loading methods and parameters on digital shearography is also ongoing.

5. Potentials and Limitations

5.1. Potentials

Digital shearography not only has the advantages of optical NDT techniques, but it also has many advantages compared to other optical methods:
  • Digital shearography has all of the advantages of the optical NDT technique; it is full-field, noncontact, highly sensitive, and robust.
  • Compared to noncoherent measurement methods (such as DIC), digital shearography has a much higher measurement sensitivity. Combined with the phase-shift technique, digital shearography can achieve measurement sensitivity at dozens of nanometer levels.
  • Compared to other coherent measurement methods (such as holographic interferometry and ESPI), digital shearography is more robust and well suited for practical applications. This is because digital shearography directly measures the first derivative of deformation, which is the strain information. Therefore, digital shearography is less sensitive to environmental disturbances than other coherent methods.
  • Digital shearography simplifies the optical system using a self-reference interferometric device. At the same time, the self-reference interferometric device does not require a coherence length of the laser source and can be illuminated with a low-cost laser diode.

5.2. Limitations

Although some limitations already have a corresponding solution, there are still problems for NDT by digital shearography:
  • It is difficult to measure defects away from the object surface using digital shearography. Although directed acoustic shearography can detect subsurface defects, the defects away from the object surface are difficult to detect because they cannot be loaded to produce enough abnormality on the surface that can be detected by shearography.
  • Although a new digital shearography system has been developed for specular surface materials, the measurement field is limited by the size of the rough surface in the optical path.
  • As an interference-based technique, digital shearography is still sensitive to environmental disturbances. Large rigid-body motions, strong thermal air currents, etc. will all affect the measurement results.
  • The phase map obtained by digital shearography still contains lots of noise, which will affect the detection of defects. How to effectively improve the quality of the phase map during dynamic measurement is a problem.

6. Conclusion

This paper reviews the development of the digital shearography technique, especially the development of the phase-shift technique. Recent developments and shearographic NDT applications have also been presented. In recent research, new techniques have been introduced to offer new possibilities for a wider range of applications of digital shearography. The range of digital shearographic applications has been further extended, both for measured materials, such as metallic materials, specular surface materials, etc., and type of measured defects, such as larger defects, multidirectional defects, subsurface defects, etc. However, these techniques are not very mature, and there are still some limitations. This is a problem that needs to be considered in future research. It is expected that digital shearography still has the potential for further exploration and application.

Author Contributions

Q.Z. prepared the whole manuscript, including writing the original draft, explaining techniques/technologies, and analyzing experimental results based on the instructions of the corresponding author, L.Y. The other co-authors provided some specific information and helped in writing and editing the original draft.

Funding

This work was partially supported by the National Natural Science Foundation of China (Grant number: 11672045), National Key Research and Development Program of China (Grant number: 2016YFF0101803), and Anhui Provincial Natural Science Foundation (Grant number: 1808085QE129).

Acknowledgments

The authors would like to express their sincere thanks to Dr. Bernard Sia from Oakland University, USA, who made careful correction of the English for the manuscript.

Conflicts of Interest

The authors declare no conflict of interest.

References

  1. Talreja, R. Damage and fatigue in composites-A personal account. Sci. Technol. 2008, 68, 2585–2591. [Google Scholar] [CrossRef]
  2. Haider, M.F.; Majumdar, P.K.; Angeloni, S.; Reifsnider, K.L. Nonlinear anisotropic electrical response of carbon fiber-reinforced polymer composites. J. Compos Mater. 2018, 52, 1017–1032. [Google Scholar] [CrossRef]
  3. Majumdar, P.K.; Haider, M.F.; Reifsnider, K. Multi-Physics Response of Structural Composites and Framework for Modeling using Material Geometry. In Proceedings of the 54th AIAA/ASME/ASCE/AHS/ASC Structures, Structural Dynamics, and Materials Conference, Boston, NJ, USA, 8–11 April 2013. [Google Scholar]
  4. Miller, A. The Boeing 787 Dreamliner. In Proceedings of the 22nd American Society for Composites Technical Conference, Seattle, WA, USA, 17–19 September 2007. [Google Scholar]
  5. Reifsnider, K.L.; Case, S.W. Damage Tolerance and Durability of Material Systems; Wiley-VCH: Weinheim, Germany, 2002. [Google Scholar]
  6. Yang, L.X.; Chen, F.; Steinchen, W.; Hung, M.Y. Digital Shearography for Nondestructive Testing: Potentials, Limitations, and Applications. J. Hologr. Speckle 2004, 1, 69–79. [Google Scholar] [CrossRef]
  7. Vest, C.M. Holographic Interferometry; John Wiley and Sons: Hoboken, NJ, USA, 1979. [Google Scholar]
  8. Lokberg, O.J.; Malmo, J.T. Long-distance electronic speckle pattern interferometry. Opt. Eng. 1988, 27, 150–156. [Google Scholar] [CrossRef]
  9. Leendertz, J.A.; Butters, J.N. An image-shearing speckle-pattern interferometer for measuring bending moments. J. Phys. E 1973, 6, 1107–1110. [Google Scholar] [CrossRef]
  10. Yamaguchi, I. A laser-speckle strain gauge. J. Phys. E Sci. Instrum. 1981, 14, 1270–1273. [Google Scholar] [CrossRef]
  11. Hung, Y.Y. Shearography for non-destructive evaluation of composite structures. Opt. Lasers Eng. 1996, 24, 161–182. [Google Scholar] [CrossRef]
  12. Yang, L.X.; Hung, Y.Y. Digital shearography for nondestructive evaluation and application in automotive and aerospace industries. In Proceedings of the 16th WCNDT, Montreal, QC, Canada, 1 January 2004. [Google Scholar]
  13. Hung, Y.Y.; Yang, L.X.; Huang, Y.H. Non-destructive evaluation (NDE) of composites: Digital shearography. In Non-Destructive Evaluation (NDE) of Polymer Matrix Composites; Karbhari, V.M., Woodhead, Eds.; Woodhead Publishing Limited: Sawston, Cambridge, 2013; pp. 84–115. [Google Scholar]
  14. Hung, Y.Y. Shearography: A new optical method for strain measurement and nondestructive testing. Opt. Eng. 1982, 21, 391–395. [Google Scholar] [CrossRef]
  15. Steinchen, W.; Yang, L.X.; Schuth, M.; Kupfer, G. Electronic shearography (ESPSI) for direct measurement of strains. In Proceedings of the Optical Measurements and Sensors for the Process Industries, Optics for Productivity in Manufacturing, Frankfurt, Germany, 15 November 1994. [Google Scholar]
  16. Hung, Y.Y. Applications of digital shearography for testing of composite structures. Compos. B Eng. 1999, 30B, 765–773. [Google Scholar] [CrossRef]
  17. Creath, K. Phase-shifting speckle interferometry. Appl. Opt. 1985, 24, 3053. [Google Scholar] [CrossRef] [PubMed]
  18. Creath, K. V Phase-Measurement Interferometry Techniques. In Progress in Optics Volume 26; ELSEVIER: North-Holland, THe Netherlands, 1988; pp. 349–393. [Google Scholar]
  19. Sim, C.W.; Chau, F.S.; Toh, S.L. Vibration analysis and non-destructive testing with real time shearography. Opt. Laser Technol. 1995, 27, 45–49. [Google Scholar] [CrossRef]
  20. Pedrini, G.; Zou, Y.L.; Tiziani, H.J. Quantitative evaluation of digital shearing interferogram using the spatial carrier method. Pure Appl. Opt. 1996, 5, 313–321. [Google Scholar] [CrossRef]
  21. Steinchen, W.; Yang, L.X.; Kupfer, G.; Mackel, P. Non-destructive testing of aerospace composite materials using digital shearography. J. Aerosp. Eng. 1998, 212, 21–30. [Google Scholar] [CrossRef]
  22. Hung, Y.Y.; Rowlands, R.E.; Daniel, I.M. Speckle-shearing interferometric technique: A full-field strain gauge. Appl. Opt. 1975, 14, 618–622. [Google Scholar] [CrossRef] [PubMed]
  23. Carré, P. Installation et utilisation du comparateur photoélectrique et interférentiel du Bureau International des Poids et Mesures. Metrologia 1966, 2, 13–20. [Google Scholar] [CrossRef]
  24. Steinchen, W.; Yang, L.X. Digital Shearography: Theory and Application of Digital Speckle Pattern Shearing Interferometry; SPIE Press: Bellingham, WA, USA, 2003. [Google Scholar]
  25. Bi, H.B.; Zhang, Y.; Ling, K.V.; Wen, C.Y. Class of 4+1-phase algorithms with error compensation. Appl. Opt. 2004, 43, 4199–4207. [Google Scholar] [CrossRef] [PubMed]
  26. Sun, C.; Chen, J.L.; Lu, H. Improved phase-shifted digital speckle shearography for time-dependent deformation measurement. Opt. Eng. 2008, 47, 8. [Google Scholar]
  27. Zhu, L.Q.; Wang, Y.H.; Xu, N.; Wu, S.J.; Dong, M.L.; Yang, L.X. Real-time monitoring of phase maps of digital shearography. Opt. Eng. 2013, 52, 8. [Google Scholar] [CrossRef]
  28. Smythe, R.; Moore, R. Instantaneous phase measuring interferometry. Opt. Eng. 1984, 23, 361–364. [Google Scholar] [CrossRef]
  29. Kranz, J.; Lamprecht, J.; Hettwer, A.; Schwider, J. Fiber optical single frame speckle interferometer for measuring industrial surfaces. Proc. Spie Int. Soc. Opt. Eng. 1998, 328–331. [Google Scholar]
  30. Hettwer, A.; Kranz, J.; Schwider, J. Three channel phase-shifting interferometer using polarization-optics and a diffraction grating. Opt. Eng. 2000, 39, 960–966. [Google Scholar] [CrossRef]
  31. Bhaduri, B.; Mohan, N.K.; Kothiyal, M.P.; Sirohi, R.S. Use of spatial phase shifting technique in digital speckle pattern interferometry (DSPI) and digital shearography (DS). Opt. Express 2006, 14, 11598–11607. [Google Scholar] [CrossRef] [PubMed]
  32. Bhaduri, B.; Mohan, N.K.; Kothiyal, M.P. Simultaneous measurement of out-of-plane displacement and slope using a multiaperture DSPI system and fast Fourier transform. Appl. Opt. 2007, 46, 5680–5686. [Google Scholar] [CrossRef] [PubMed]
  33. Wu, S.J.; He, X.Y.; Yang, L.X. Enlarging the angle of view in Michelson-interferometer-based shearography by embedding a 4f system. Appl. Opt. 2011, 50, 3789–3794. [Google Scholar] [CrossRef] [PubMed]
  34. Xie, X.; Yang, L.X.; Xu, N.; Chen, X. Michelson interferometer based spatial phase shift shearography. Appl. Opt. 2013, 52, 4063–4071. [Google Scholar] [CrossRef] [PubMed]
  35. Yang, L.X.; Xie, X. Spatial Phase Shift Shearography for Strain Measurement. In Digital Shearography: New Developments and Applications; SPIE: Washington, WA, USA, 2016. [Google Scholar]
  36. Huang, Y.H.; Janabi-Sharifi, F.; Liu, Y.S.; Hung, Y.Y. Dynamic phase measurement in shearography by clustering method and Fourier filtering. Opt. Express 2011, 19, 606–615. [Google Scholar] [CrossRef] [PubMed]
  37. Wu, S.J.; Zhu, L.Q.; Feng, Q.B.; Yang, L.X. Digital shearography with in situ phase shift calibration. Opt. Lasers Eng. 2012, 50, 1260–1266. [Google Scholar] [CrossRef]
  38. Amar, S.; Bahich, M.; Dalimi, H.; Barj, E.; Afifi, M. Digital carrier superposition by Hilbert-Huang transform for optical phase recovery in speckle shearing interferometry. Opt. Eng. 2015, 54, 7. [Google Scholar] [CrossRef]
  39. Maeda, T.; Kadambi, A.; Schechner, Y.Y.; Raskar, R. Dynamic Heterodyne Interferometry. In Proceedings of the IEEE International Conference on Computational Photography, Pittsburgh, PA, USA, 8–10 April 2018. [Google Scholar]
  40. Albertazzi, A.; Fantin, A.V.; Willemann, D.P.; Benedet, M.E. Phase Maps Retrieval from Sequences of Phase Shifted Images with Unknown Phase Steps Using Generalized N-Dimensional Lissajous Figures-Principles and Applications. Int. J. Optomechat. 2014, 8, 340–356. [Google Scholar] [CrossRef]
  41. Xie, X.; Li, X.N.; Chen, X.; Yang, L.X. Review of Recent Developments of Spatial Phase-Shift Digital Shearography. In Proceedings of the International Conference on Experimental Mechanics, Singapore, 4 March 2015. [Google Scholar]
  42. Aranchuk, V.; Lal, A.K.; Hess, C.F.; Trolinger, J.D.; Scott, E. Pulsed spatial phase-shifting digital shearography based on a micropolarizer camera. Opt. Eng. 2018, 57, 6. [Google Scholar] [CrossRef]
  43. Kirkove, M.; Guerit, S.; Jacques, L.; Loffet, C.; Languy, F.; Vandenrijt, J.F.; Georges, M. Determination of vibration amplitudes from binary phase patterns obtained by phase-shifting time-averaged speckle shearing interferometry. Appl. Opt. 2018, 57, 8065–8077. [Google Scholar] [CrossRef] [PubMed]
  44. Yang, L.X. Recent developments in digital shearography for nondestructive testing. Mater. Eval. 2006, 64, 704–709. [Google Scholar]
  45. Bhaduri, B.; Tay, C.J.; Quan, C.; Niu, H.; Sjodahl, M. Two wavelength simultaneous DSPI and DSP for 3D displacement field measurements. Opt. Commun. 2011, 284, 2437–2440. [Google Scholar] [CrossRef]
  46. Xie, X.; Xu, N.; Sun, J.F.; Wang, Y.H.; Yang, L.X. Simultaneous measurement of deformation and the first derivative with spatial phase-shift digital shearography. Opt. Commun. 2013, 286, 277–281. [Google Scholar] [CrossRef]
  47. Yang, L.X. Grundlagen und Anwendungen der phaserschieb shearografie zur zerstoerungsfreien werkstoffpruefung. In Proceedings of the VDI Fortschritt-Berichte Reihe 8: Mess-, Steuerungs- und Reqelungstechnik, VDI Verlag GmbH, Duesseldorf, Geremany, 1998. [Google Scholar]
  48. Xie, X.; Lee, C.P.; Li, J.R.; Zhang, B.Y.; Yang, L.X. Polarized digital shearography for simultaneous dual shearing directions measurements. Rev. Sci. Instrum. 2016, 87, 7. [Google Scholar] [CrossRef] [PubMed]
  49. Wang, Y.H.; Gao, X.Y.; Xie, X.; Wu, S.J.; Liu, Y.X.; Yang, L.X. Simultaneous Dual Directional Strain Measurement Using Spatial Phase-Shift Digital Shearography. Opt. Lasers Eng. 2016, 87, 197–203. [Google Scholar] [CrossRef]
  50. Barrera, E.S.; Fantin, A.V.; Willemann, D.P.; Benedet, M.E.; Gonçalves, A.A. Multiple-aperture one-shot shearography for simultaneous measurements in three shearing directions. Opt. Lasers Eng. 2018, 111, 86–92. [Google Scholar] [CrossRef]
  51. Xu, N.; Xie, X.; Chen, X.; Yang, L.X. Shearography for specular object inspection. Opt. Lasers Eng. 2014, 61, 14–18. [Google Scholar] [CrossRef]
  52. Yan, P.Z.; Wang, Y.H.; Sun, F.Y.; Lu, Y.; Liu, L.; Zhao, Q.H. Shearography for non-destructive testing of specular reflecting objects using scattered light illumination. Opt. Laser Technol. 2019, 112, 452–457. [Google Scholar] [CrossRef]
  53. Kurtz, R.M. Directed Acoustic Shearography. In Proceedings of the Photonics in the Transportation Industry: Auto to Aerospace III, International Society for Optics and Photonics, Orlando, FL, USA, 20 April 2010. [Google Scholar]
  54. Liu, H.; Guo, S.; Chen, Y.F.; Liu, H.; Tan, C.Y.; Ke, K.L.; Zhang, L. Shearography using wave-defect interactions for crack detection in metallic structures. In Proceedings of the 2017 IEEE International Ultrasonics Symposium, Washington, WA, USA, 5–9 September 2017. [Google Scholar]
  55. Liu, H.; Guo, S.; Chen, Y.F.; Tan, C.Y.; Zhang, L. Acoustic shearography for crack detection in metallic plates. Smart Mater. Struct. 2018, 27, 10. [Google Scholar] [CrossRef]
  56. Mahmud, M.S.; Naydenova, I.; Toal, V. Implementation of phase-only modulation utilizing a twisted nematic liquid crystal spatial light modulator. J. Opt. A Pure Appl. Opt. 2008, 10, 7. [Google Scholar] [CrossRef]
  57. Sun, F.Y.; Wang, Y.H.; Yan, P.Z.; Zhao, Q.H.; Yang, L.Y. The application of SLM in shearography detecting system. Opt. Lasers Eng. 2019, 114, 90–94. [Google Scholar] [CrossRef]
  58. Dhanotia, J.; Prakash, S. Phase Contrast Imaging of Small Transparent Objects using Digital Shearography. In Proceedings of the Conferene on Light and Its Interactions with Matter, Natl Inst Technol, Kerala, India, 19–21 March 2014. [Google Scholar]
  59. Sanati, H.; Reshadi, F.; Faraji, G.; Soltani, N.; Zalnezhad, E. Evaluation of residual stress in ultrafine-grained aluminum tubes using shearography. Proc. Inst. Mech. Eng. Part B J. Eng. Manuf. 2015, 229, 953–962. [Google Scholar] [CrossRef]
  60. Barmouz, M.; Behravesh, A.H.; Reshadi, F.; Soltani, N. Assessment of defect detection in wood-plastic composites via shearography method. J. Thermoplast. Compos. Mater. 2016, 29, 28–36. [Google Scholar] [CrossRef]
  61. Wang, X.; Gao, Z.; Yang, S.; Gao, C.; Sun, X.; Wen, X.; Feng, Z.; Wang, S.; Fan, Y. Application of digital shearing speckle pattern interferometry for thermal stress. Measurement 2018, 125, 11–18. [Google Scholar] [CrossRef]
  62. Feng, X.; He, X.Y.; Tian, C.P.; Zhou, H.H. Research on Inner Defect Detection of Pressure Vessels with Digital Shearography. In Proceedings of the International Conference on Experimental Mechanics, Singapore, 15–17 November 2014. [Google Scholar]
  63. Benedet, M.E.; Macedo, F.J.; Fantin, A.V.; Willemann, D.P.; Silva, F.A.A.; Soares, S.D.; Albertazzi, A. An endoscopic shearography system with radial sensitivity for inner inspection of adhesion faults in composite material pipes. In Proceedings of the Conference on Optical Measurement Systems for Industrial Inspection X part of the SPIE Optical Metrology Symposium, Munich, Germany, 25–29 June 2017. [Google Scholar]
  64. Buchta, D.; Heinemann, C.; Pedrini, G.; Krekel, C.; Osten, W. Lock-in-shearography for the detection of transport-induced damages on artwork. In Proceedings of the Conference on Optics for Arts, Architecture, and Archaeology VI, Munich, Germany, 25–29 June 2017. [Google Scholar]
  65. Pascual-Francisco, J.B.; Barragan-Perez, O.; Susarrey-Huerta, O.; Michtchenko, A.; Martinez-Garcia, A.; Farfan-Cabrera, L.I. The effectiveness of shearography and digital image correlation for the study of creep in elastomers. Mater. Res. Express 2017, 4, 11. [Google Scholar] [CrossRef]
  66. Pascual-Francisco, J.B.; Susarrey-Huerta, O.; Michtchenko, A.; Barragan-Perez, O. Measurement of creep strain in polymers by means of electronic speckle pattern shearing interferometry. In Proceedings of the Dimensional Optical Metrology and Inspection for Practical Applications VII, Orlando, FL, USA, 15–19 April 2018. [Google Scholar]
Figure 1. Fundamentals of digital shearography.
Applsci 08 02662 g001
Figure 2. Comparison between the NDT results of holography and shearography.
Applsci 08 02662 g002
Figure 3. (a) Holographic NDT result, (b) shearographic NDT result.
Applsci 08 02662 g003
Figure 4. Comparison between (a) real-time subtraction version and (b) phase-shift shearography.
Applsci 08 02662 g004
Figure 5. Schematic of single-detector spatial phase-shift technique.
Applsci 08 02662 g005
Figure 6. Spatial phase-shift digital shearography (SPS-DS) based on Mach–Zehnder interferometer.
Applsci 08 02662 g006
Figure 7. Schematic of the Fourier spectrum of the image.
Applsci 08 02662 g007
Figure 8. (a) The modified Michelson-based SPS-DS system with a 4f system; (b) measurement result by traditional shearography system; (c) measurement result by modified 4f system.
Applsci 08 02662 g008
Figure 9. Results of an application of Michelson-based SPS-DS system during dynamic loading.
Applsci 08 02662 g009
Figure 10. (a) The SPS-DS setup for out-of-plane deformation and its first derivative measurement; (b) phase map of a hologram; (c) phase map of a shearogram.
Applsci 08 02662 g010
Figure 11. (a) The dual-shearing direction SPS-DS system; (b) measurement result of circular flaw and bar flaw in x direction; (c) measurement result of circular flaw and bar flaw in y direction.
Applsci 08 02662 g011
Figure 12. (a) The modified shearography system for specular surfaces; (b) experimental result of the metal plate with a cone-shape deformation; (c) experimental result of the metal plate with an irregular deformation.
Applsci 08 02662 g012
Figure 13. Experimental setup of directed acoustic shearography.
Applsci 08 02662 g013
Figure 14. (a) The new shearography system with a spatial light modulator; (b) experimental result of a thimble-loaded aluminum plate; (c) experimental result of a composite plate with three flaws.
Applsci 08 02662 g014aApplsci 08 02662 g014b
Table 1. The common temporal phase-shift algorithms.
Phase-shift step NAlgorithmsFormulaFeature
33 + 3 Δ = arctan 3 ( I 3 I 2 ) 2 I 1 I 2 I 3 arctan 3 ( I 3 I 2 ) 2 I 1 I 2 I 3 Good phase map quality, only for static measurements, and enough calculation.
44 + 4 Δ = arctan ( I 4 I 2 ) ( I 1 I 3 ) arctan ( I 4 I 2 ) ( I 1 I 3 ) Good phase map quality, only for static measurements, and simpler calculation.
4 + 2 Δ = arctan ( A I 2 I 1 A ) A = I 1 + I 2 + I 3 + I 4 4 Acceptable phase map quality for dynamic measurement at a low dynamic range.
4 + 1 Δ = arctan ( I ˜ 4 2 I ˜ 2 2 ) ( I ˜ 1 2 I ˜ 3 2 ) I ˜ n 2 = ( I n I ) 2 , n = 1 , 2 , 3 , 4 Poor phase map quality and small measurement range for a real dynamic measurement.
55 + 5 Δ = arctan ( 2 I 2 I 4 2 I 3 I 1 I 5 ) arctan ( 2 I 2 I 4 2 I 3 I 1 I 5 ) Good phase map quality, only for static measurements, and more accurate calculation.
Table 2. A comparison of phase-shift digital shearography methods.
Phase-Shift Digital Shearography MethodAdvantageDisadvantage
TPS-DSEasy to implement with high precision.Generally cannot measure dynamic phase.
SPS-DSMultichannel spatial phase shiftAbility to measure dynamic phase.Position matching is needed between interferograms or can only measure information in one dimension.
Carrier-frequency spatial phase shiftMach–Zehnder basedNo requirement for shearing amount.Small measurement size, poor phase map quality, and poor stability.
Double-aperture basedGood phase map quality.Small measurement size and poor stability.
Michelson basedEasy to use due to its simple structure and good stability.Large shearing amount required.

