1. Introduction
Aggregate microstructure and gradation have great impacts on the performance of asphalt mixture, which also influences the pavement durability, stiffness, and fatigue behavior [
1,
2,
3]. Traditionally, gradation is evaluated by passing the aggregates through a series of sieves. The sieve retains particles larger than the sieve opening, while smaller ones pass through. In practice, the non-uniform distribution of coarse and fine aggregate components within the asphalt mixture is called aggregate segregation [
4,
5]. The solvent extraction method or the ignition oven method is often used to measure segregation. However, these laborious and time-consuming tests involve a specially-equipped laboratory, as well as the use of solvents hazardous to workers’ health [
6].
With the development of the digital image processing (DIP) technique, which has advantage of high efficiency, convenience, automation, and reducing manpower, many researchers have attempted to evaluate the gradation of asphalt mixture through the DIP technique.
In early years, the research was toward two dimensional (2D) images of vertical or horizontal plane cross-sections that were cut from field cores or laboratory-prepared asphalt concrete (AC) specimens. Different parameters were used to describe the size of aggregate in order to obtain a size distribution. Yue et al. applied the DIP technique to quantify the distribution, orientation, and shape of coarse aggregates in AC mixtures [
7]. Area gradations on different cross-sections were obtained based on the minor axis length, major axis length, and equivalent circular diameter.
As the gradation estimated from a cross-section is dependent on the position at which the slice was taken, the average gradations of multiple sections were used to evaluate gradation. Masad et al. characterized the internal structure of AC in terms of aggregate gradation. The volume gradation based on the equivalent circular diameter was obtained from the analysis of 2D vertical sections [
8]. In volume calculations, the thickness of the aggregate was taken as the average diameter measured in two dimensions. It was found that two specimens (six sections) was sufficient to satisfactorily capture the actual gradation of coarse aggregate. Bruno et al. estimated mixture gradation using the length of the minor axis of the ellipse that had the same normalized second central moments as the aggregate [
6]. The average gradation curve obtained from 22 planar slices was compared with the laboratory gradation.
One of the major problems with the two dimensional DIP technique is that only the area gradation is computed. Since volume gradation has a better correlation with traditional weight gradation, a stereological method was developed to acquire the volume gradation [
9,
10]. Guo et al. adopted the minor axis of the circumscribed ellipse of the aggregate to calculate the planar gradation of the mixture [
10]. Then the planar area gradation was transformed to a three-dimensional volume gradation by the stereological method with the assumption of ellipsoidal particles. The results indicated that aspect ratio of the aggregate affected the stereological coefficients significantly.
Although the X-ray computed tomography (CT) technique has been applied to the study of the internal structure of asphalt mixtures since 1999, it was not until 10 years ago that CT images began to be used in calculation of the three dimensional (3D) size and volume gradation. The improvement in image resolution and particle segmentation algorithms were the main reasons. Kutay et al. presented the filtered watershed transform method to overcome the problem of touching aggregates [
11]. Gradations by equivalent diameter, major principal axis, minor principal axis, and average axial length were estimated from the CT images. The results showed that the closest match was achieved by the gradation based on the equivalent diameter. In other areas, Wang et al. developed an image segmentation method for multi-size particles and calculated dimensions along three principal axes, which was determined from the analysis of moments [
12]. The gradation curves based on traditional sieve analysis, equivalent diameter, maximum dimension, intermediate dimension, and minimum dimension were compared.
However, these techniques, based on indirect parameters, utilized only partial characteristics of aggregate shape to evaluate gradation, making them unable to exactly capture the real sieve opening that the aggregate passed through. In addition, there is a need to study the potential error brought by indirect parameter in describing particle size.
The aim of this study is to develop 3D digital sieving technique used to evaluate the gradation of the asphalt mixture in X-ray CT images, which considers both the shape of aggregate particles and the square opening of the mechanical sieve. For this purpose, the definition of digital sieve size was proposed and the corresponding program was developed using Matlab™ (Natick, MA, USA) to obtain the digital sieve size. After that, laboratory experiments consisting of epoxy-filled aggregate specimens were conducted to calibrate the program. Moreover, the digital sieving technique was used to estimate the gradation of stone mastic asphalt mixtures.
4. Three-Dimensional Digital Sieving
In the laboratory, a gradation test is performed by mechanical size analysis. A representative sample of aggregates is poured into a column of sieves, which is typically placed in a mechanical sieve shaker. During the shaking process, the mechanical device would move the sieves to cause the particles to bounce, tumble, or otherwise turn so as to present different orientations to the sieving surface [
16]. As a result, aggregate larger than the sieve opening remains on the sieve, while the smaller ones pass through. Due to numerous particles in the mixture, high-frequency interaction between the sieve mesh and particles, and the very large computation consumption, it is impractical to simulate the laboratory sieve analysis based on the mechanical model. However, if the sieving process is possible to be simplified as a mathematical problem, the digital gradation test could be solved by numerical calculation.
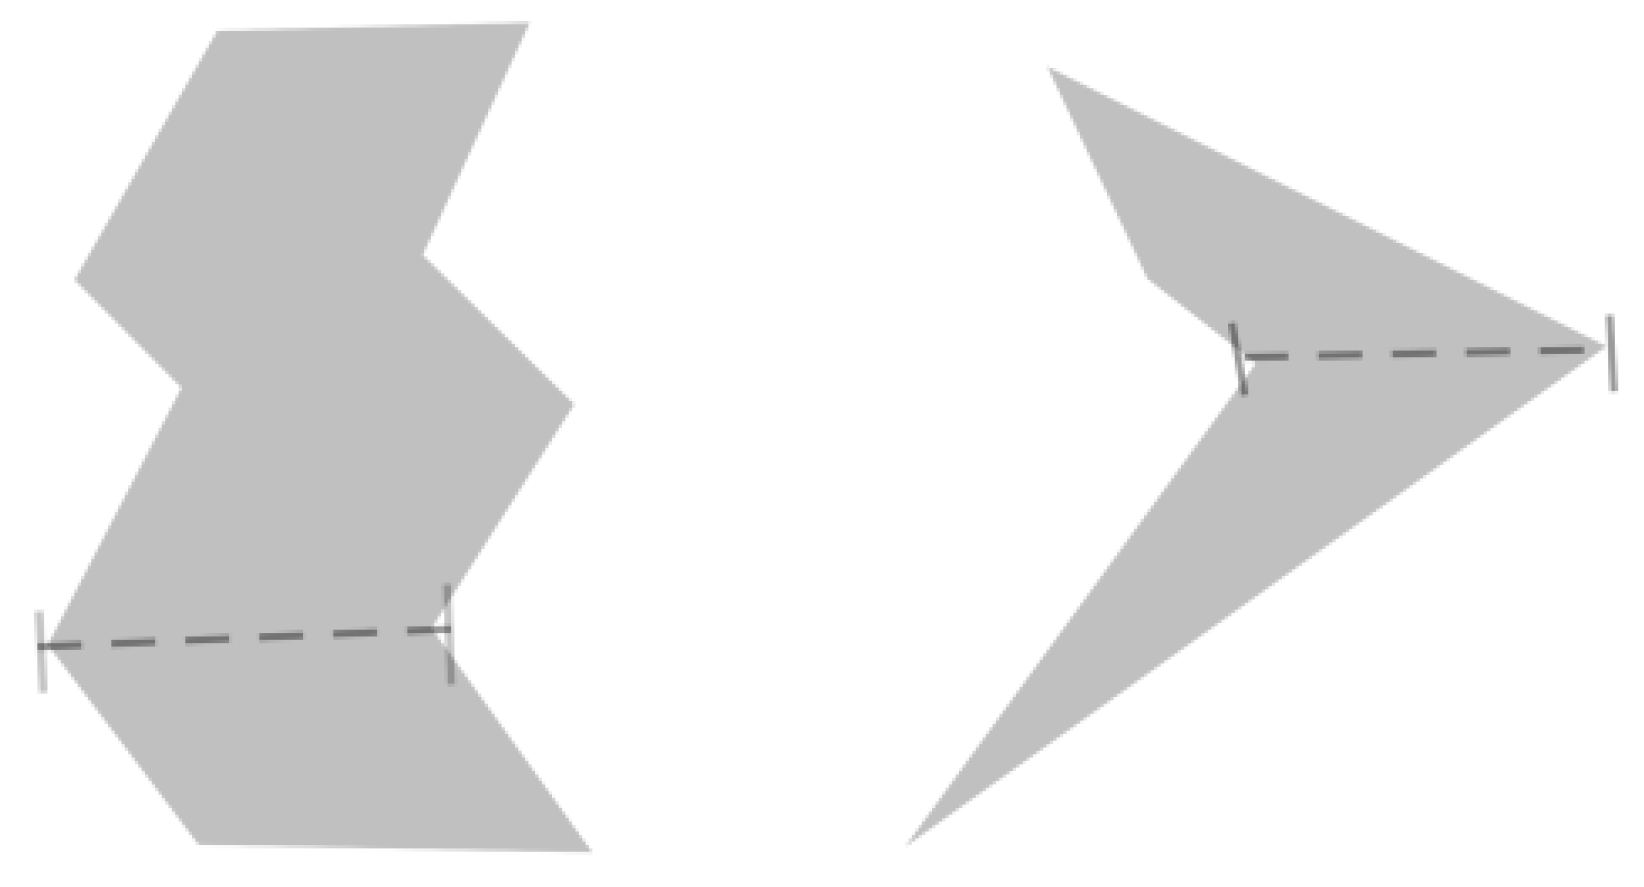
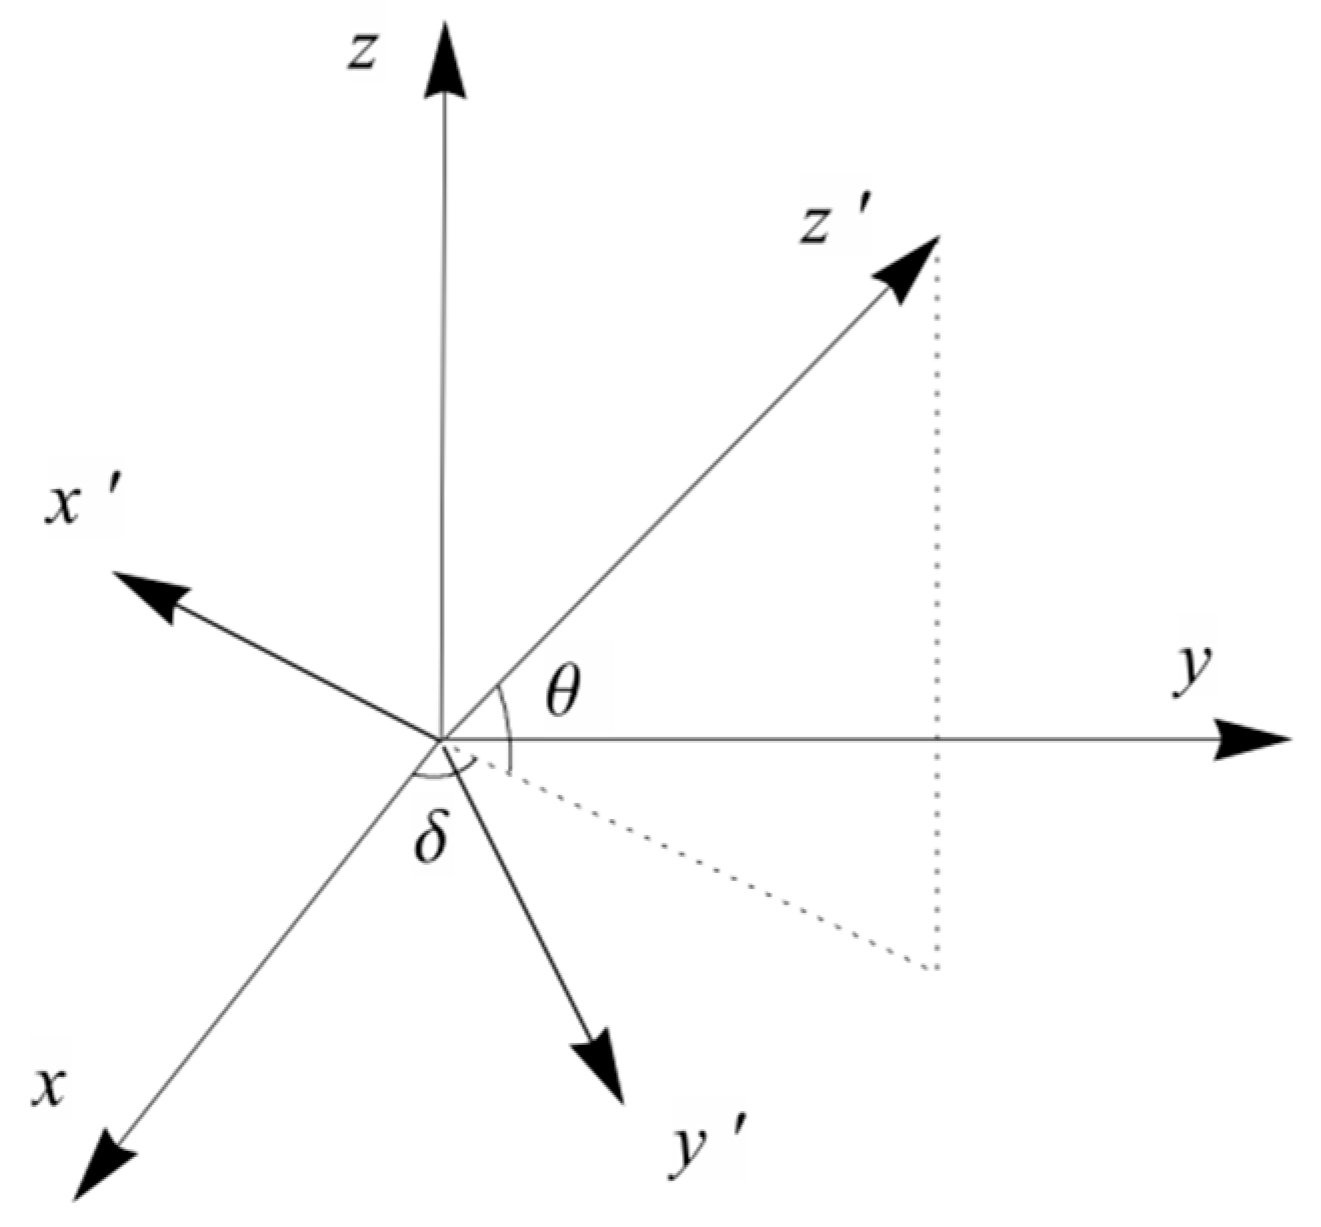
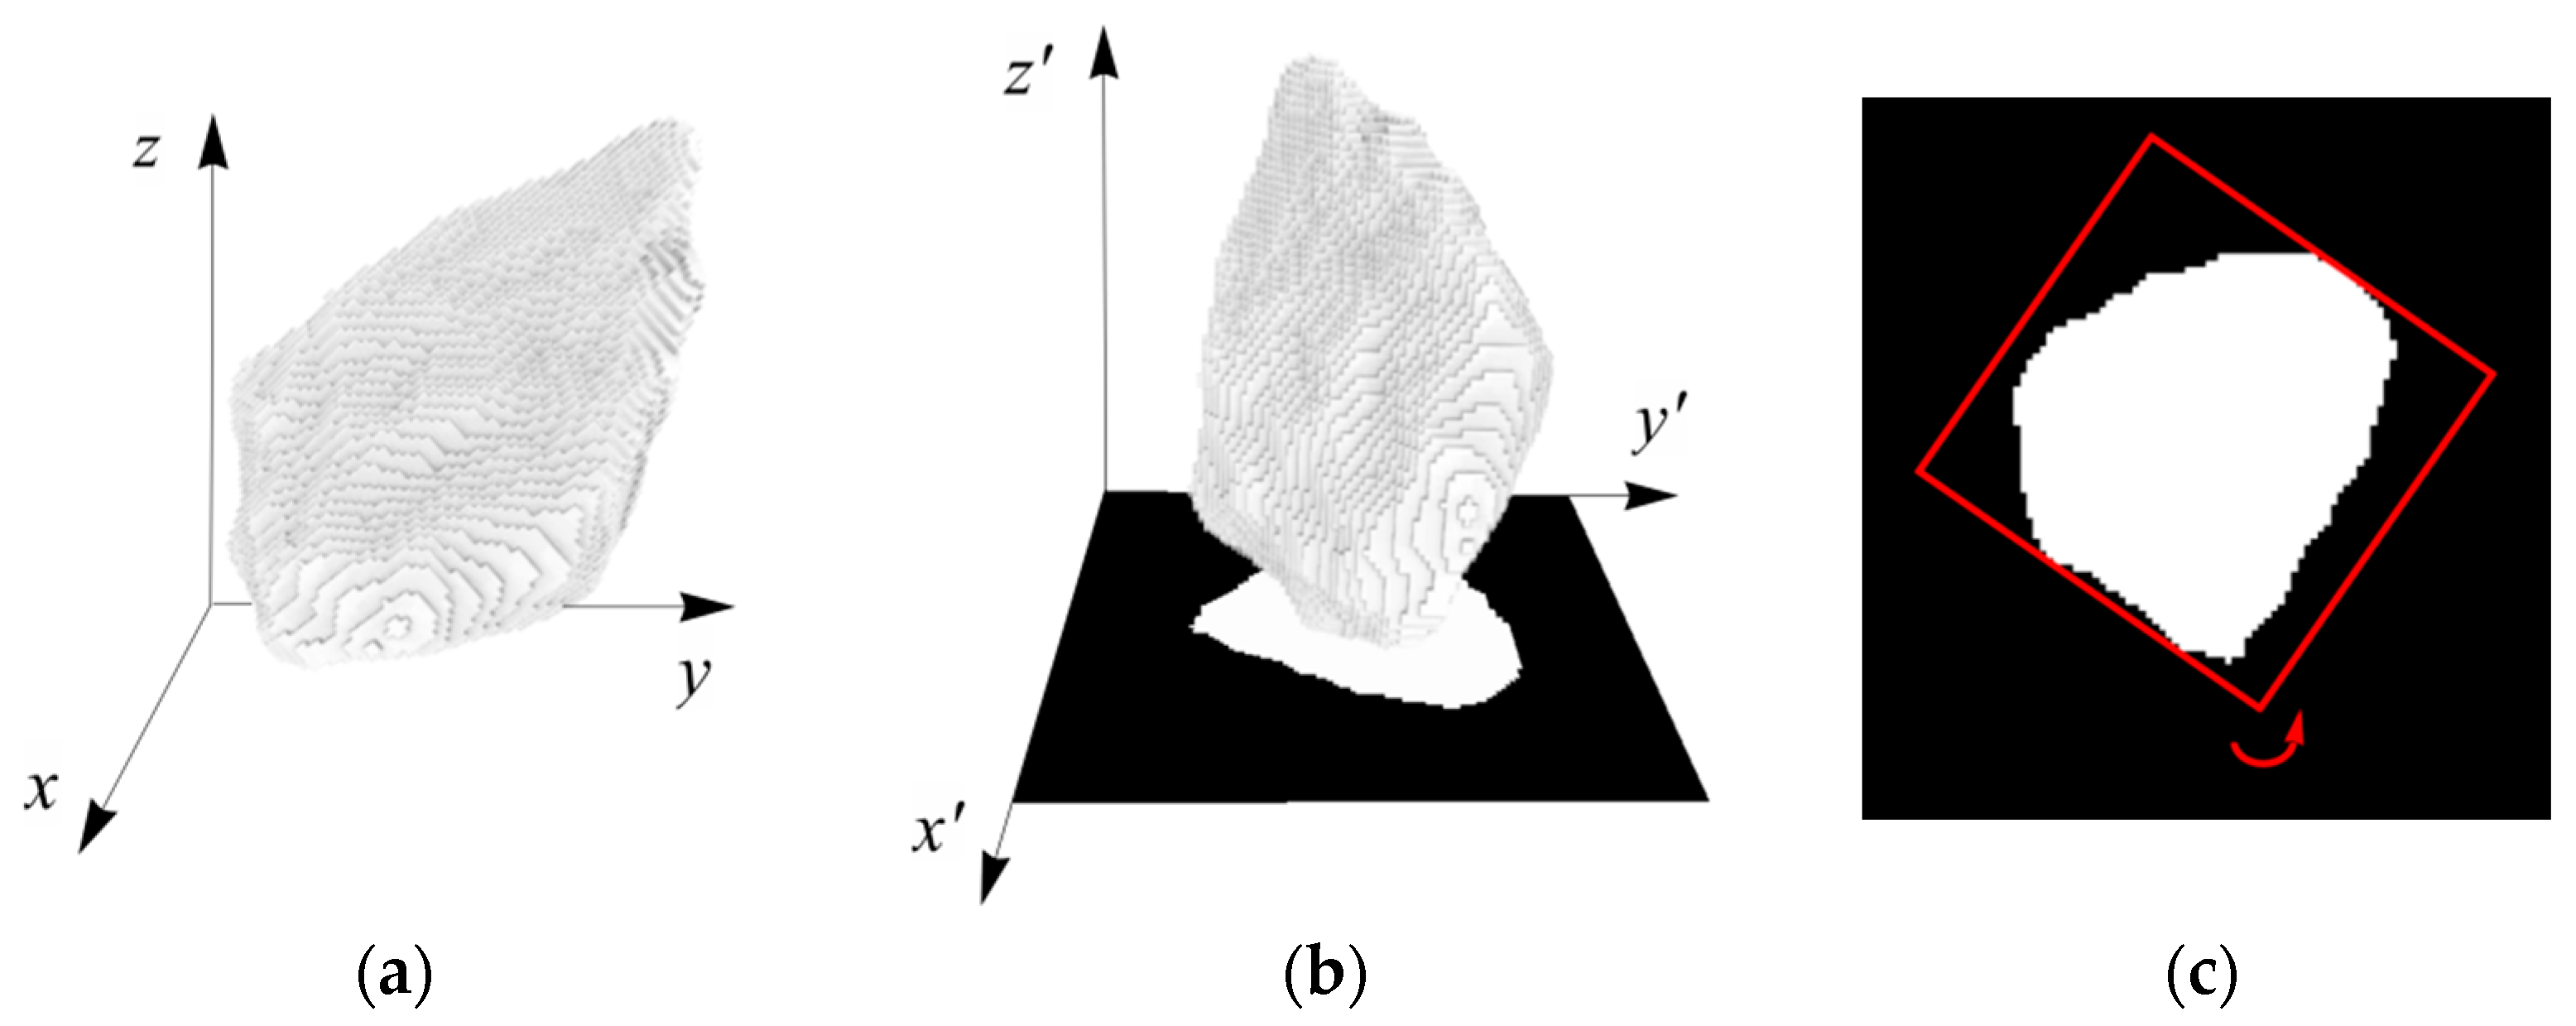
In order to simplify the problem, an assumption related to passage judgment of aggregate is made first. When an aggregate is right above a sieve opening, whether it can pass that sieve opening is assumed to be equivalent to whether its orthographic projection on the sieve plate can be surrounded by four sides of the square opening. Apparently, this could be determined by the length of the minimum bounding square (MBS) of the projection area. If the length of the MBS of the projection is smaller than the sieve size, the aggregate passes through. It should be noted that the MBS is obtained when the length of circumscribed square achieves the minimum value. Though the problem of particle passage judgment is solved, the displacement of aggregate during shaking is not considered. In the actual mechanical sieving process, the aggregate will experience rotation. Thus, orthographic projection in every direction might be the critical projection that determines the smallest sieve opening that aggregate passes through. In this paper, digital sieve size (DSS) is defined as the minimum length of the minimum bounding squares of all possible orthographic projections. Ideally, each aggregate has only one DSS because it corresponds to the smallest MBS. It could be thought as a virtual sieve opening that aggregate is just able to fit in. Hereinafter, whether an aggregate is able to pass through certain sieve opening is totally depend on the value of DSS of the aggregate.
The numerical method used to obtain the DSS of an aggregate is described as follows:
It is noted that, in order to improve the efficiency of numerical method used to calculate DSS, the voxel data of each aggregate is simplified to a point set of its convex hull using Matlab function convhull before the above mentioned steps. The possible error of this simplification will be examined in the following section. The average calculation time of DSS for an aggregate with 100,000 voxels is 1.4 s on a 3.2 GHz single-core processor. Since the numerical method is based on heuristics only, its run time can be further improved by an iterative approach [
20].
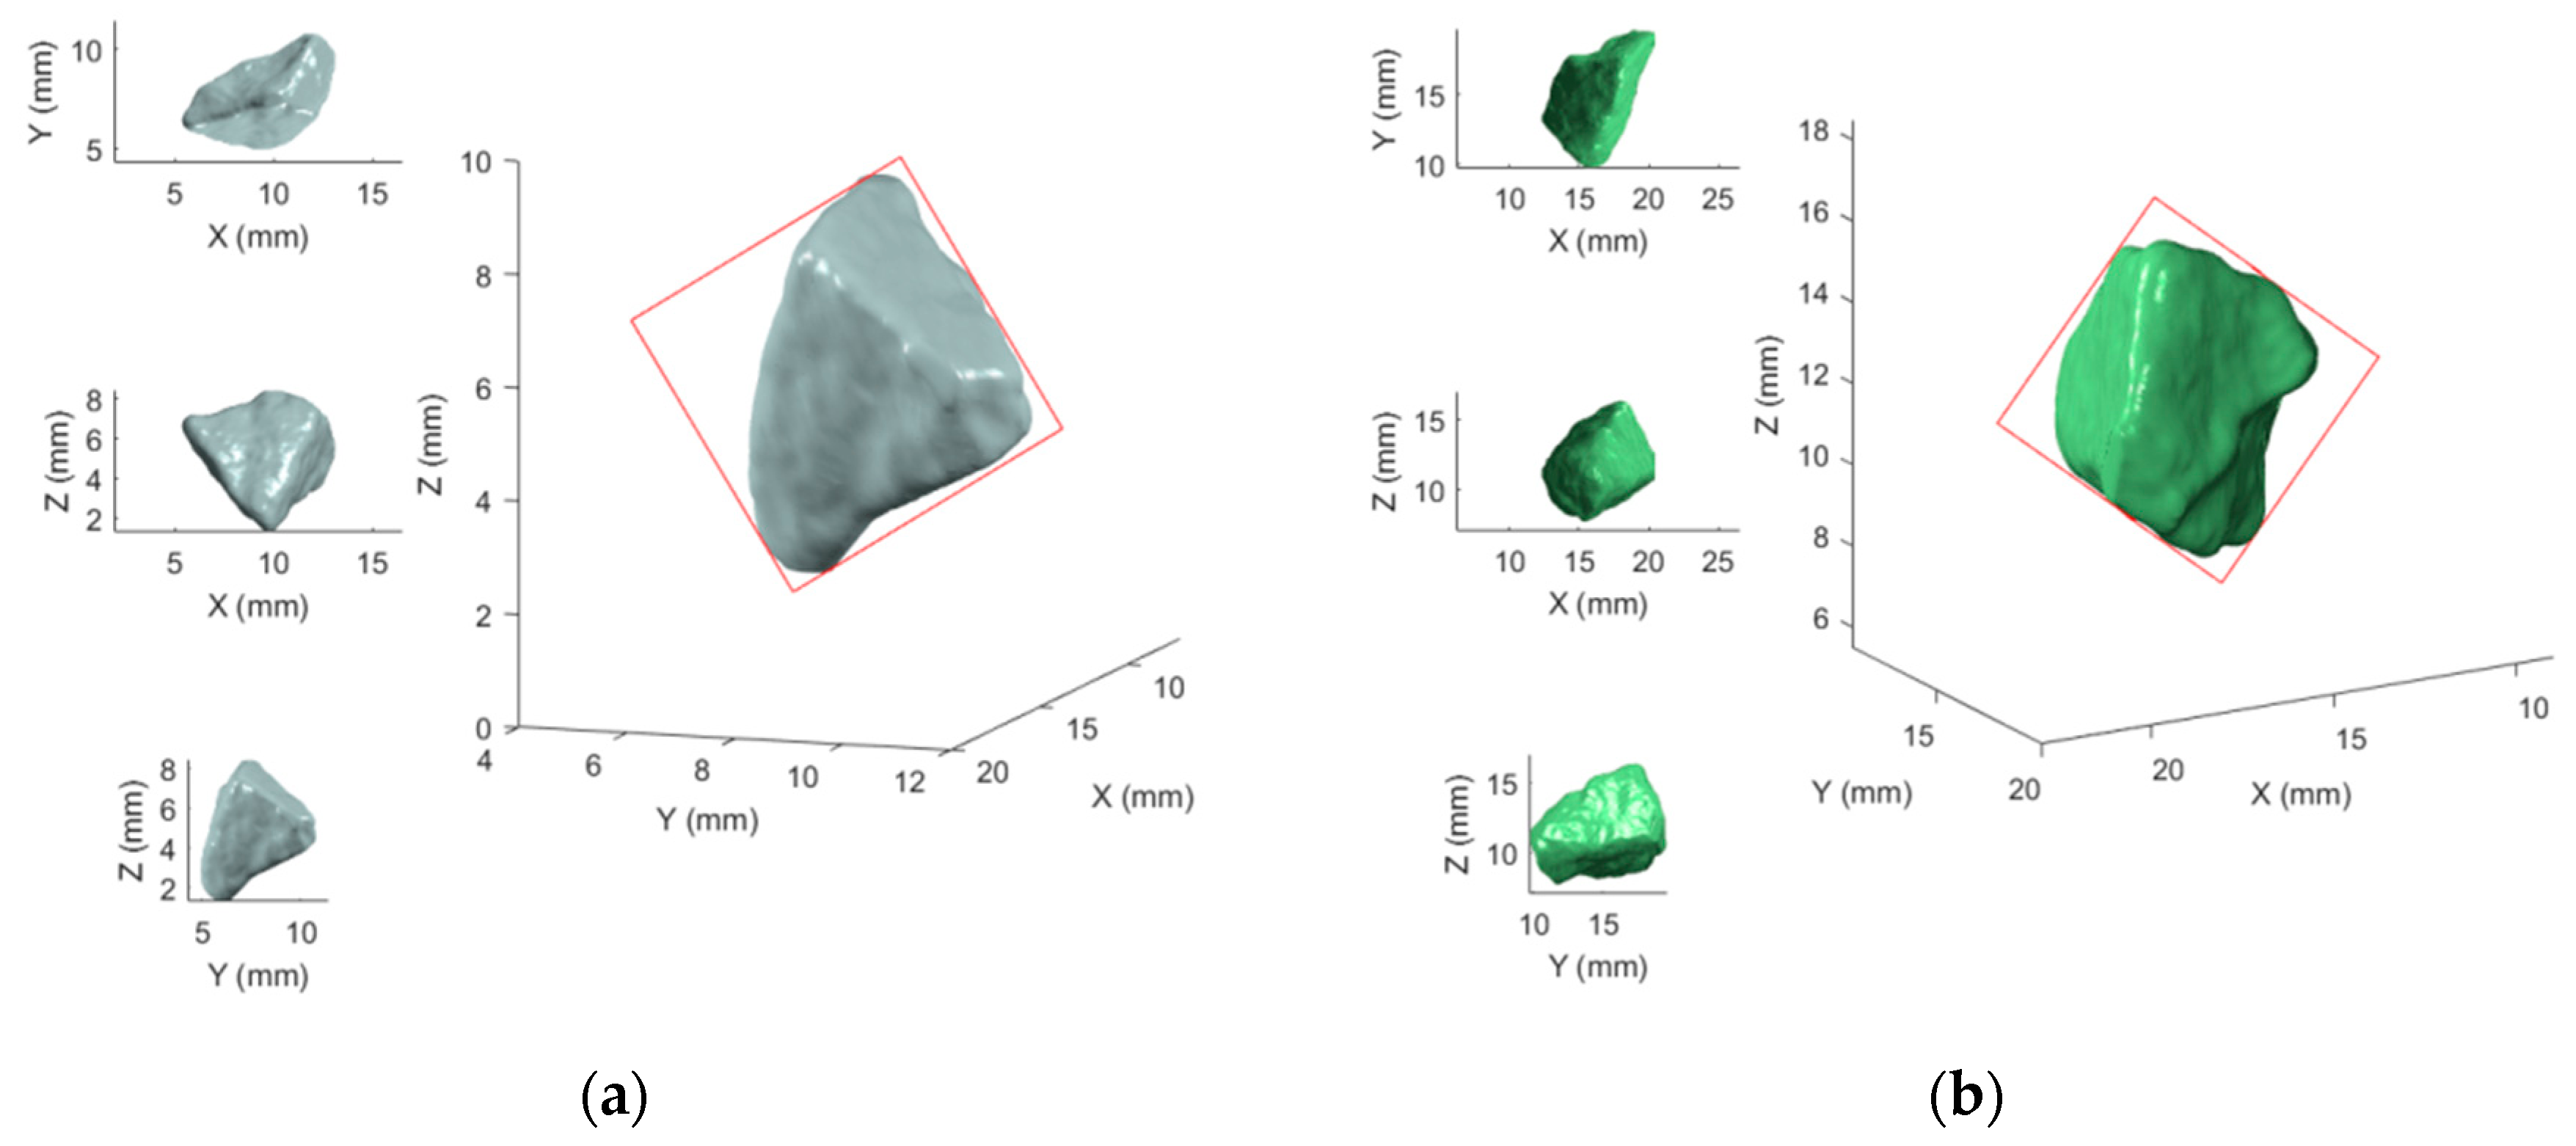
Two examples of DSS are shown in
Figure 4.
5. Calibration of Digital Sieving Technique
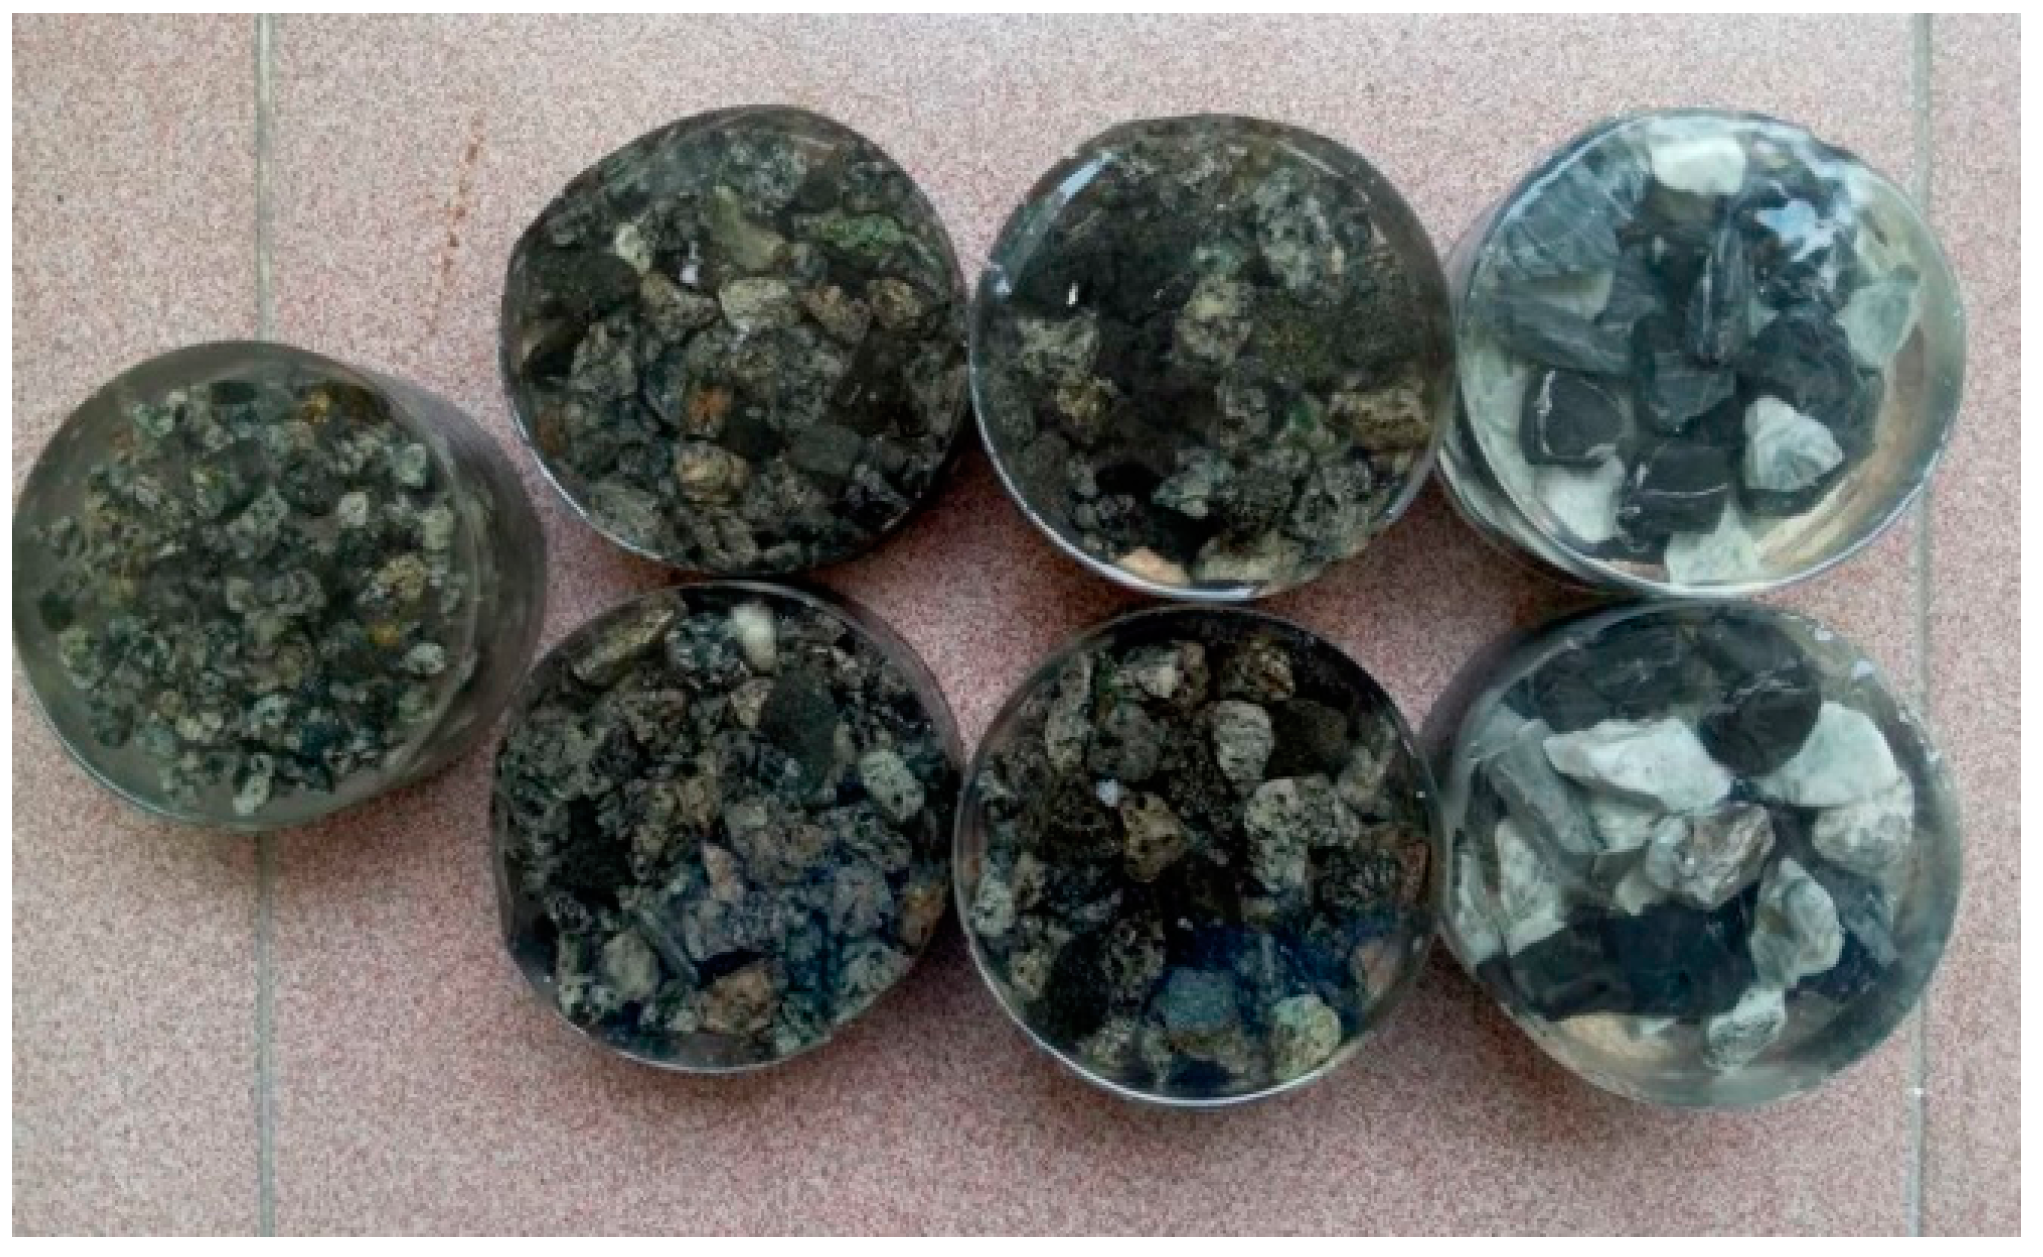
As the shape of aggregate particles is quite complex and diverse, further investigation of the difference between mechanical sieve analysis and the digital sieving technique developed in this research is essential. In order to accomplish this, four groups of epoxy-filled aggregate specimens were prepared using aggregates retained on four different sieve sizes (4.75 mm, 9.5 mm, 13.2 mm and 16 mm, respectively). The number and type of aggregates for different specimens are shown in
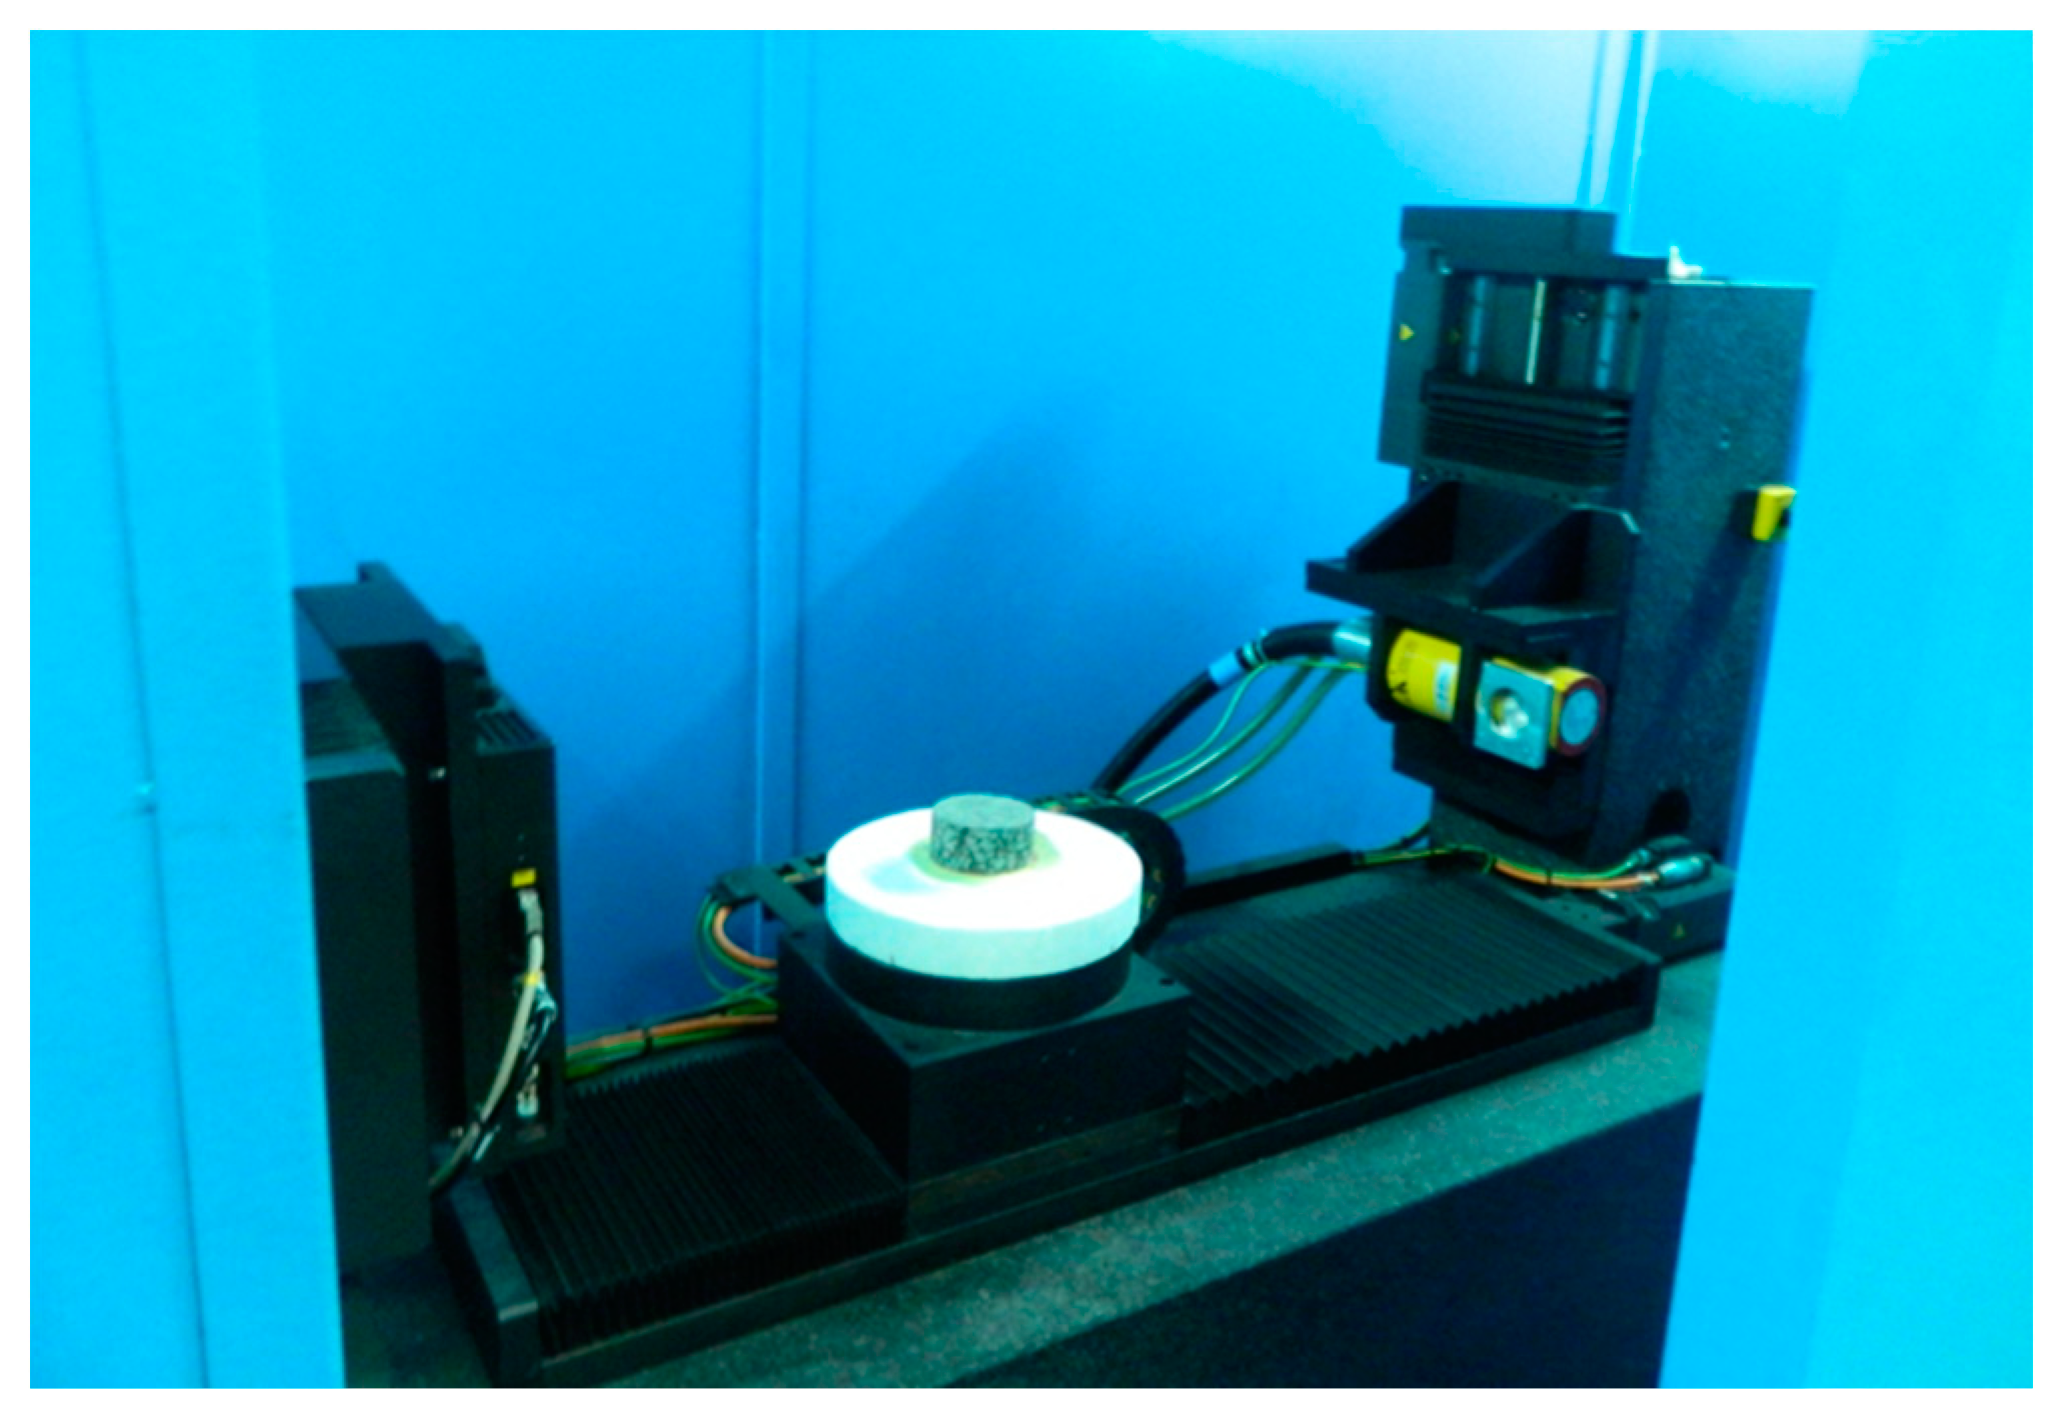
Table 1. The specimen dimension was 104 ± 1 mm in diameter, and the gaps between aggregates were filled using epoxy resin (see
Figure 5) which would significantly enhance the contrast between the aggregates and background in the X-ray CT images.
After the voxel data of each aggregate was extracted from X-ray CT images of epoxy-filled aggregate specimens, the properties such as volume, equivalent diameter, and DSS were computed. The following equations were used to calculate volume and equivalent diameter:
where
V is the volume,
ED is the equivalent diameter,
Nvoxels is the number of voxels that the given aggregate is made of, and
dx,
dy and
dz are the dimensions of one voxel (mm).
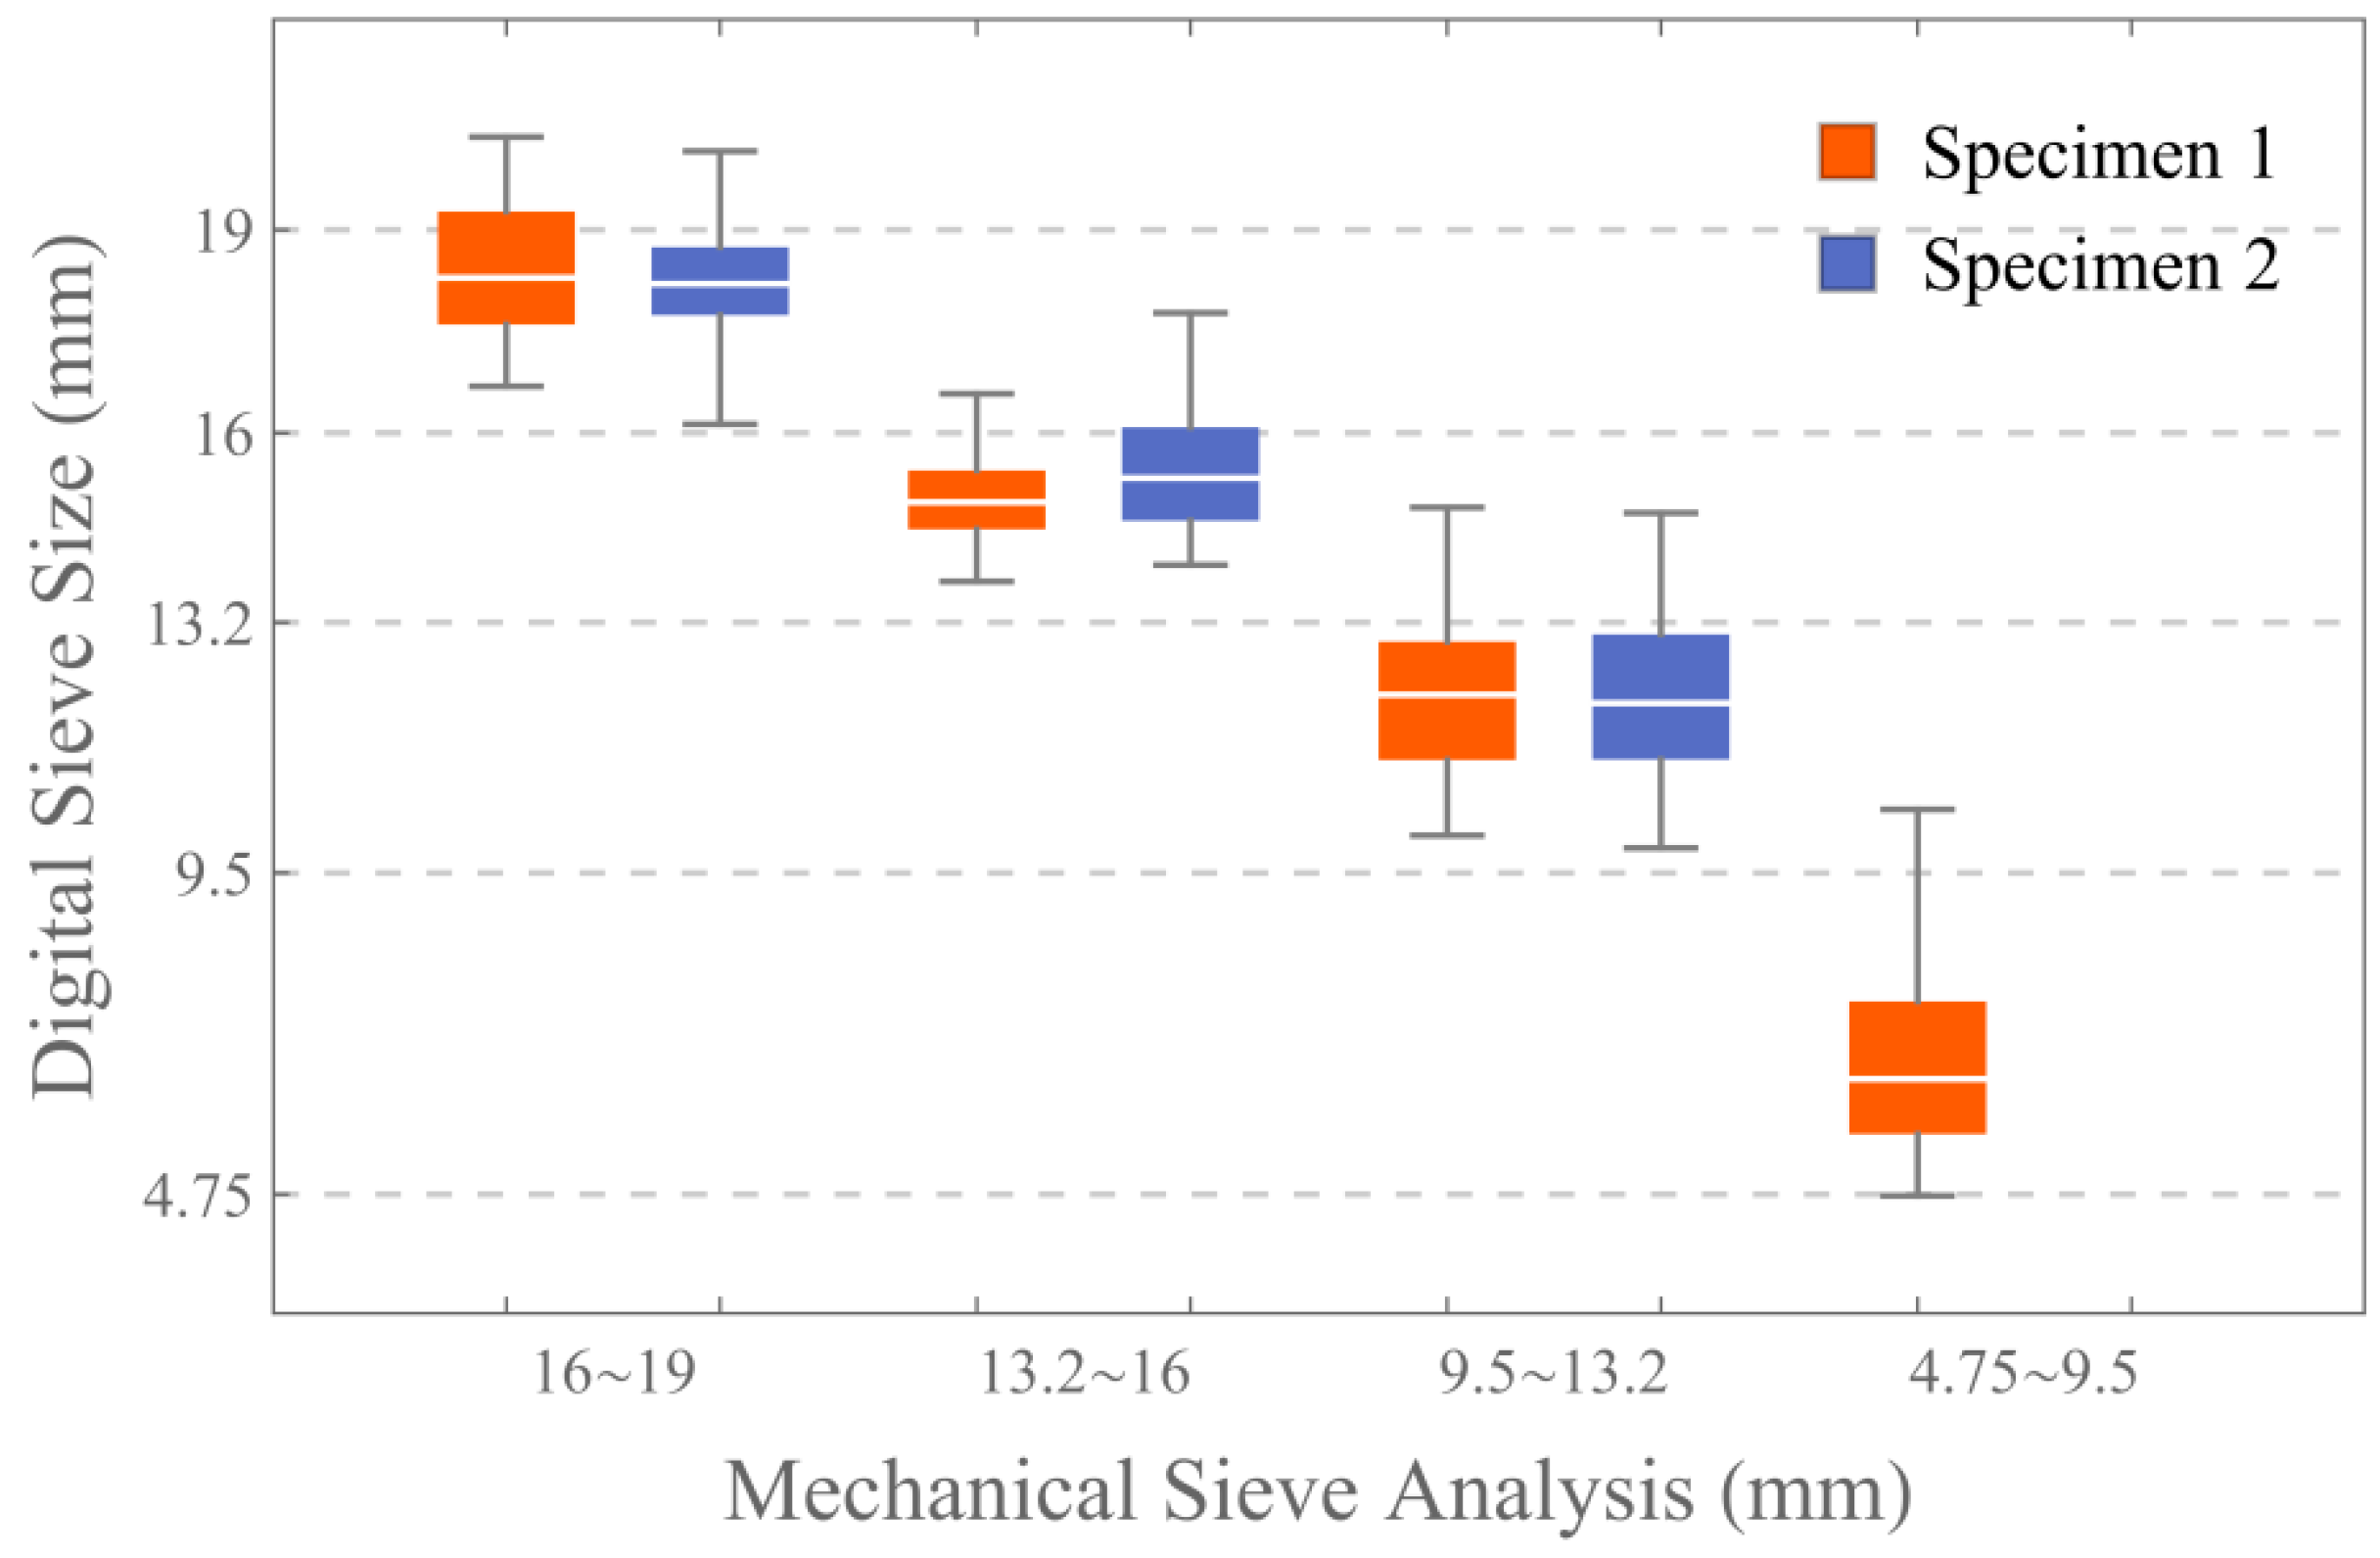
Figure 6 shows the results of the DSS for four different groups. It can be seen that, in each specimen, there was a certain percent of aggregates whose DSS was larger than the upper limit of their mechanical size. That percentage (counted by number) ranged from 5.69% to 31.43% in seven specimens, with the maximum ratio achieved by Group 1, Specimen 1. Additionally, those aggregates having the largest DSS in Group 2, Specimen 2 and Group 3, both specimens, should be noted because their DSS were over the mid-value of their superior sieve size range. For instance, the largest DSS in Group 3, Specimen 1 was 14.8985 mm, and its superior sieve size range was 13.2~16 mm. As the smallest DSS in Group 3, Specimen 1 was quite close to the lower limit (9.5 mm), the above phenomenon was not caused by the selection of the threshold value in the segmentation process that may increase the dimension of aggregate data. It was also observed that there were overlaps between the DSS distribution ranges of three different groups of granite.
In order to investigate the simplification of voxel data of each aggregate to its convex hull, 70 aggregates (10 from each specimen) were chosen to calculate the DSS with or without the simplification. It was found that the relative error brought by the simplification was less than one billionth, indicating that treating the aggregate as convex hulls was entirely feasible for the DSS computation. Considering the definition of DSS involved orthographic projection and minimum bounding square, both hid the convex basis, the above approaching-zero relative error was not unexpected. It can be concluded that the concave surface of aggregate was the possible reason for the disparity between DSS and mechanical sieve size, as shown in
Figure 7.
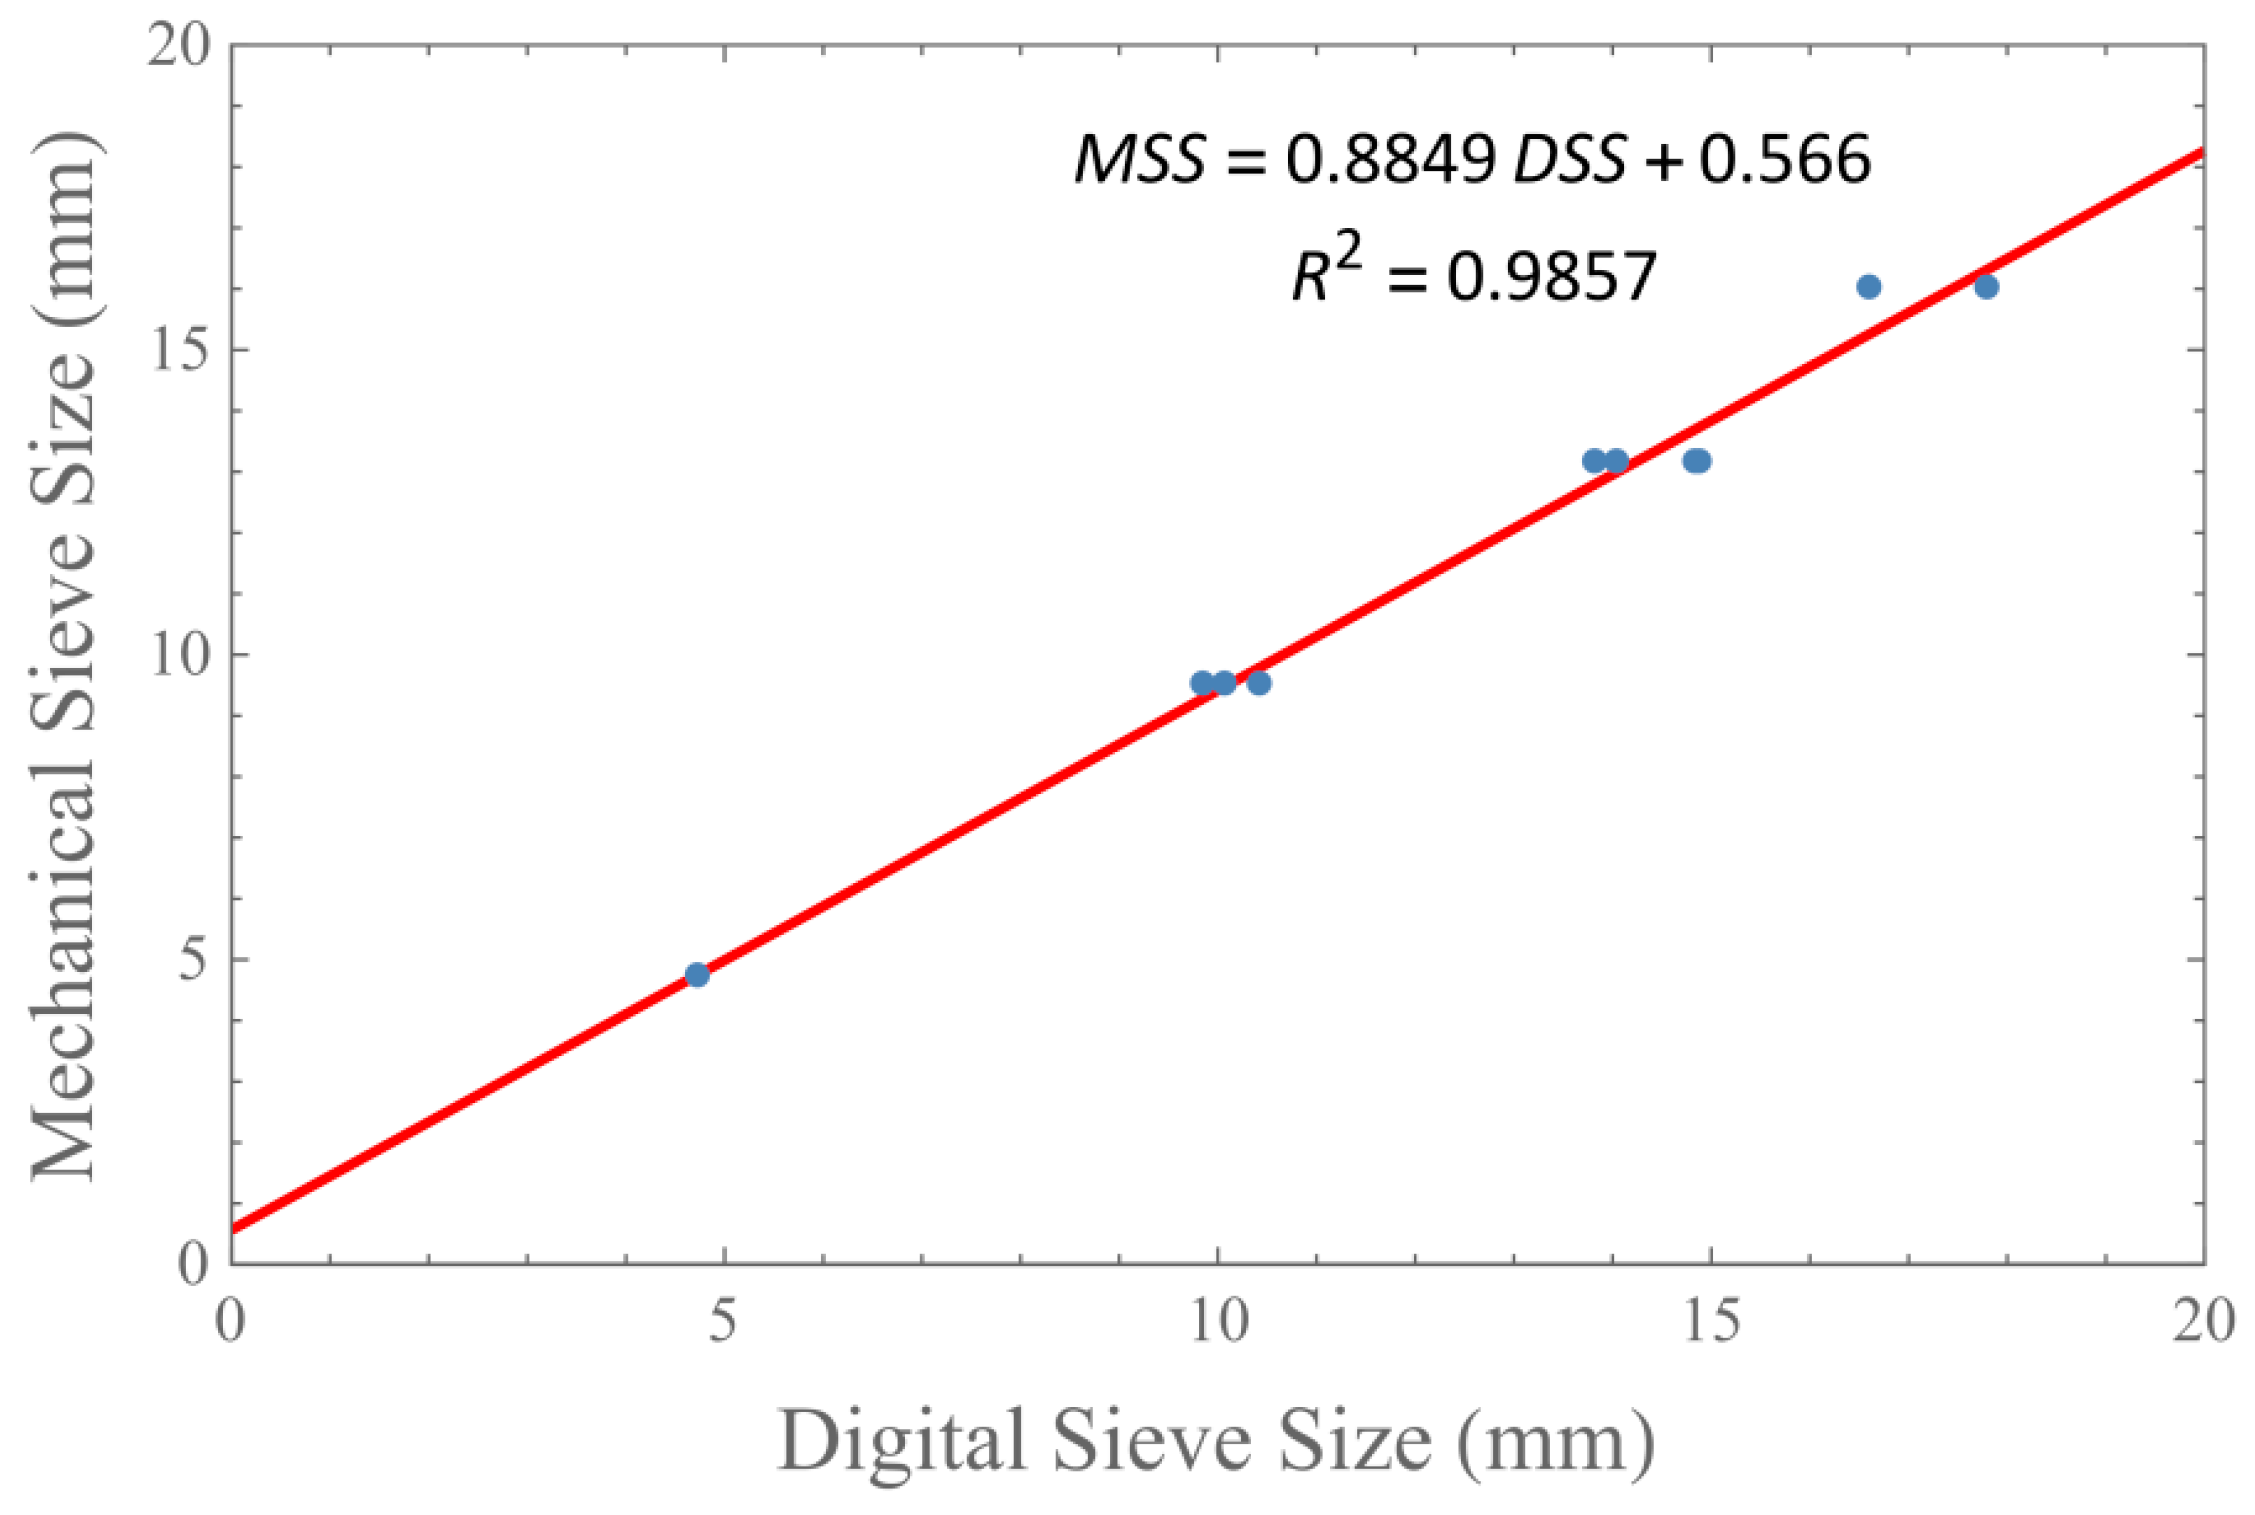
Due to difference between the digital and mechanical sieve size, the digital sieving technique was required to be calibrated before it can be employed to evaluate the gradation of the asphalt mixture. For granite, the maximum and minimum DSS in each specimen and their corresponding upper and lower bounds of mechanical sieve size were used for calibration. The result of linear fitting is shown in
Figure 8.
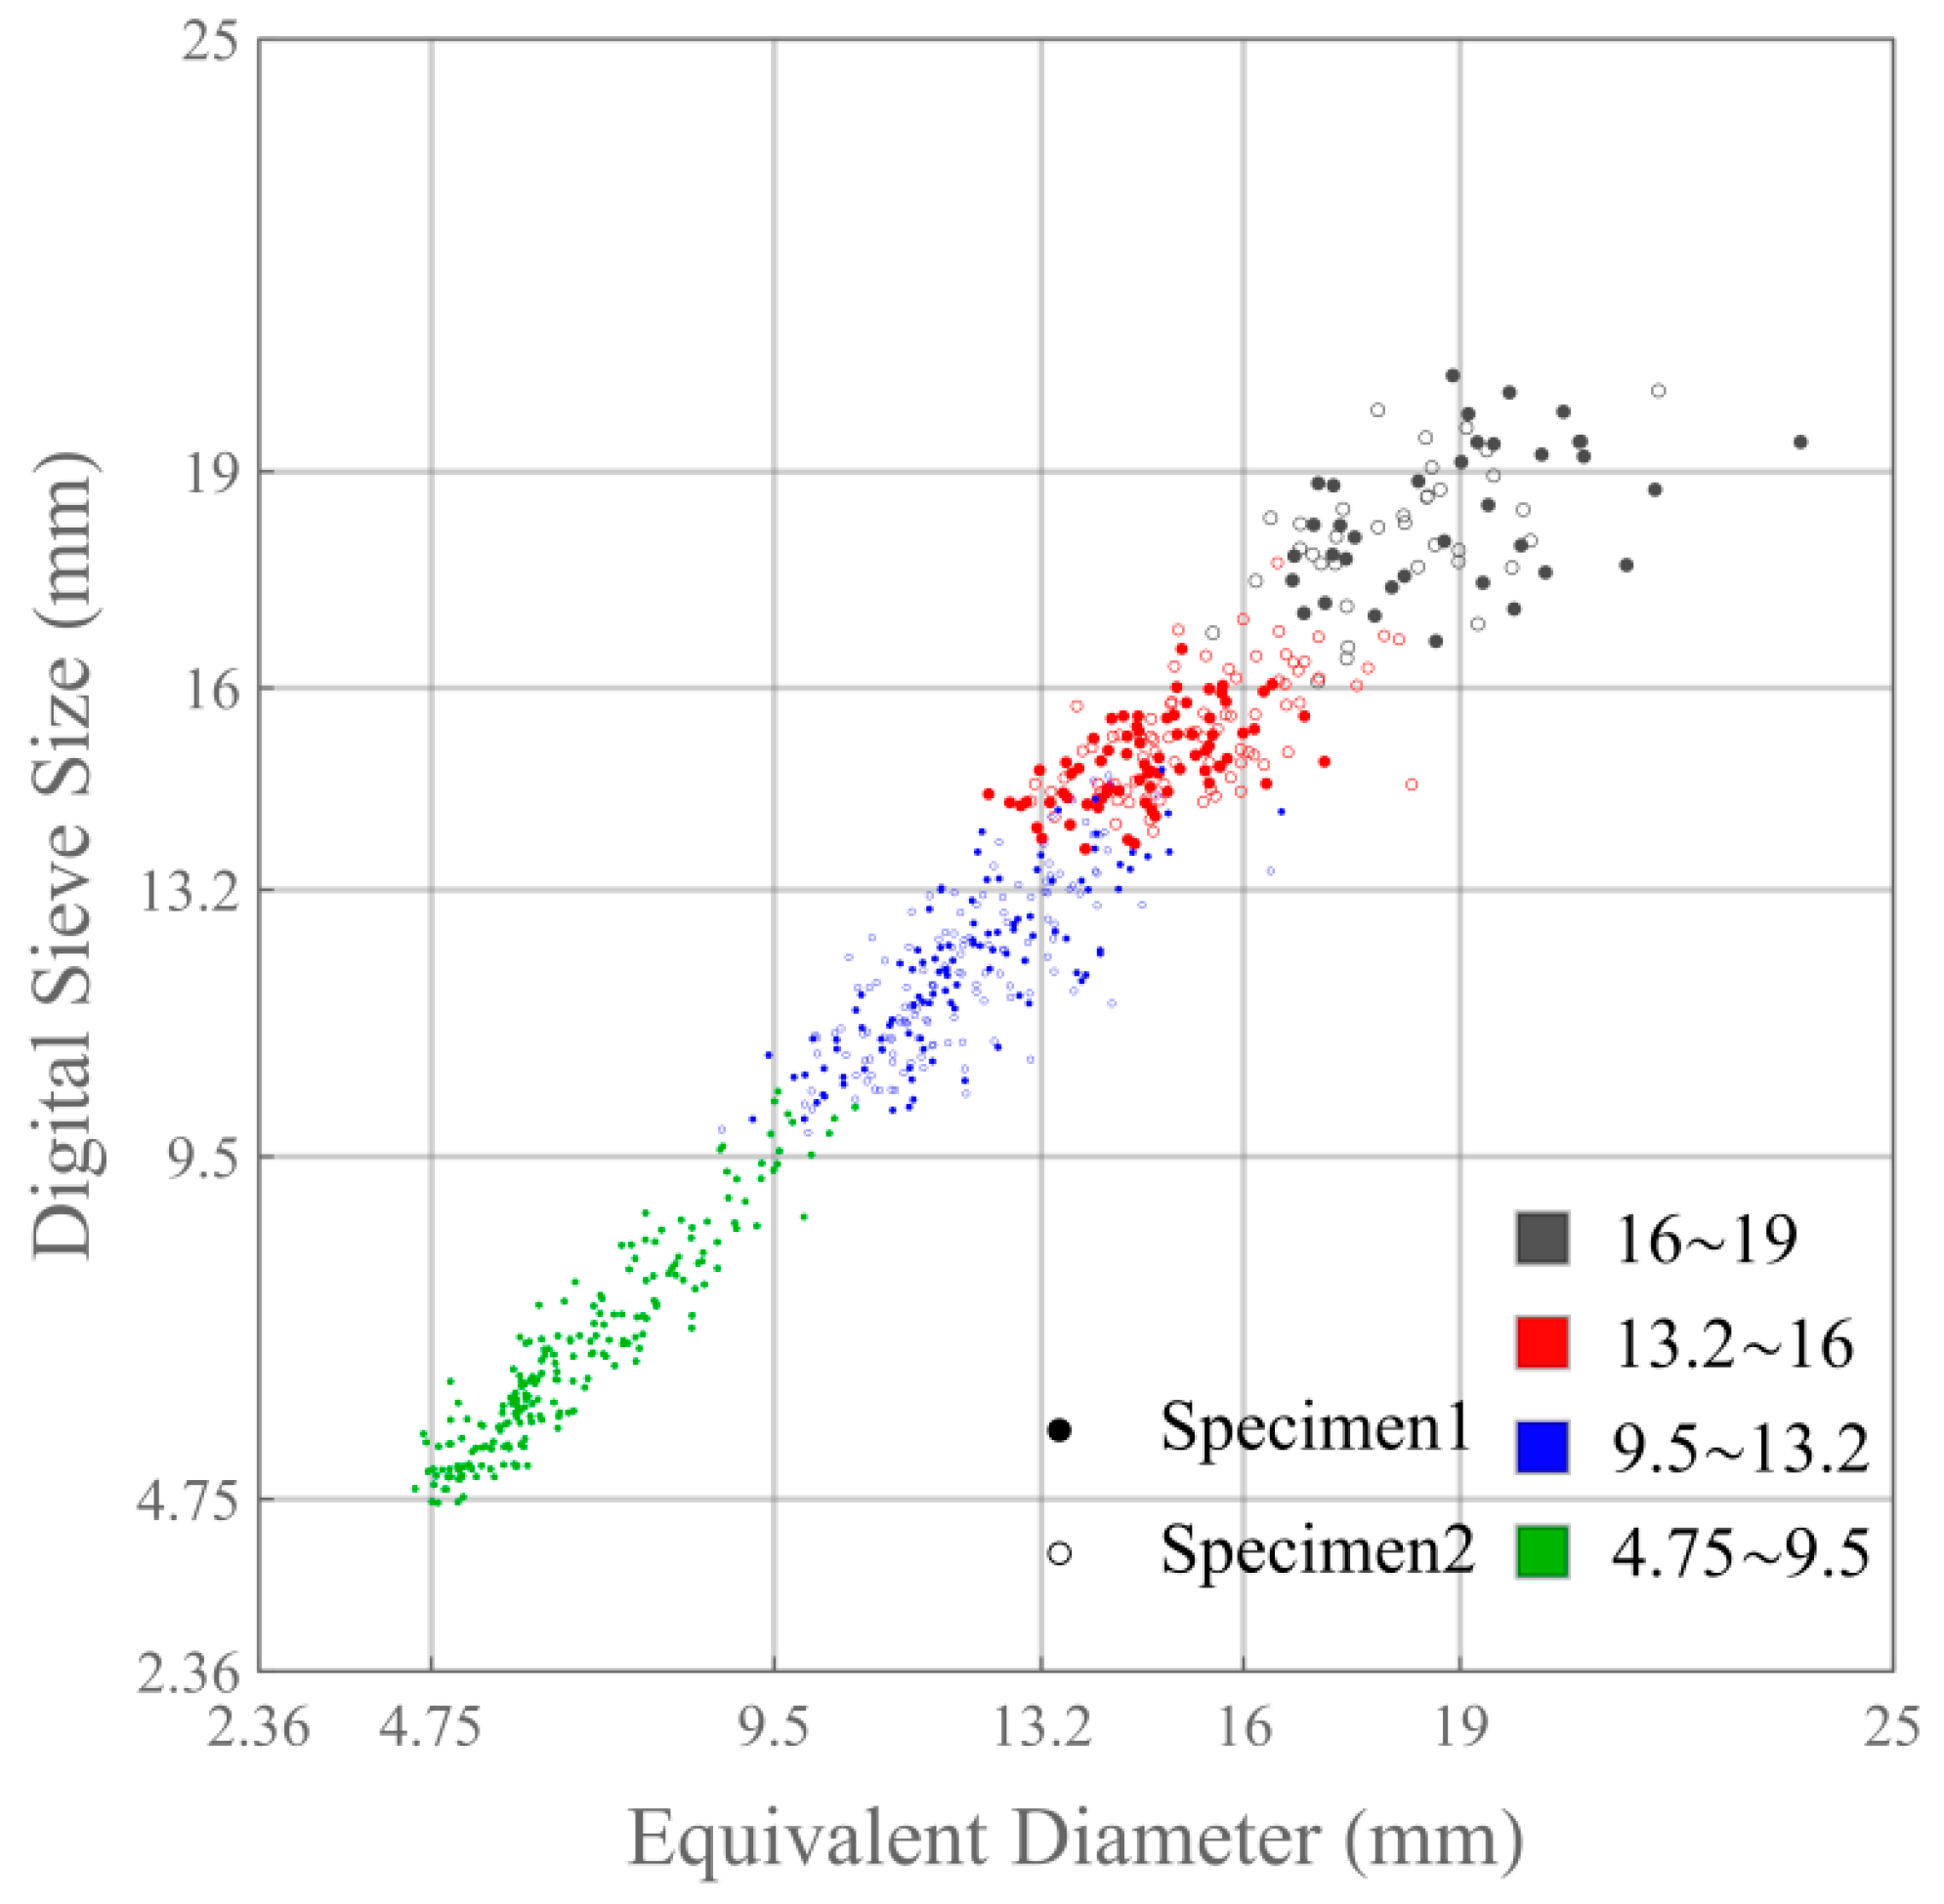
A comparison between un-calibrated DSS and equivalent diameter was also performed, as demonstrated in
Figure 9. The maximum value of absolute difference between DSS and equivalent diameter for Group 1 to Group 4 was 4.272 mm, 3.638 mm, 2.871 mm and 1.398 mm, respectively. As particle size increased, the absolute difference increased. Therefore, estimation of the gradation of the coarse-grained asphalt mixture based on equivalent diameter might lead to significant errors. However, it might be feasible to obtain gradation of the fine-grained mixture based on equivalent diameter with rigorous calibration.
6. Application
The 3D digital sieving technique developed in this paper was adopted to estimate the gradation of two specimens of stone mastic asphalt mixture (SMA-13). The gradation of the asphalt mixture used is listed in
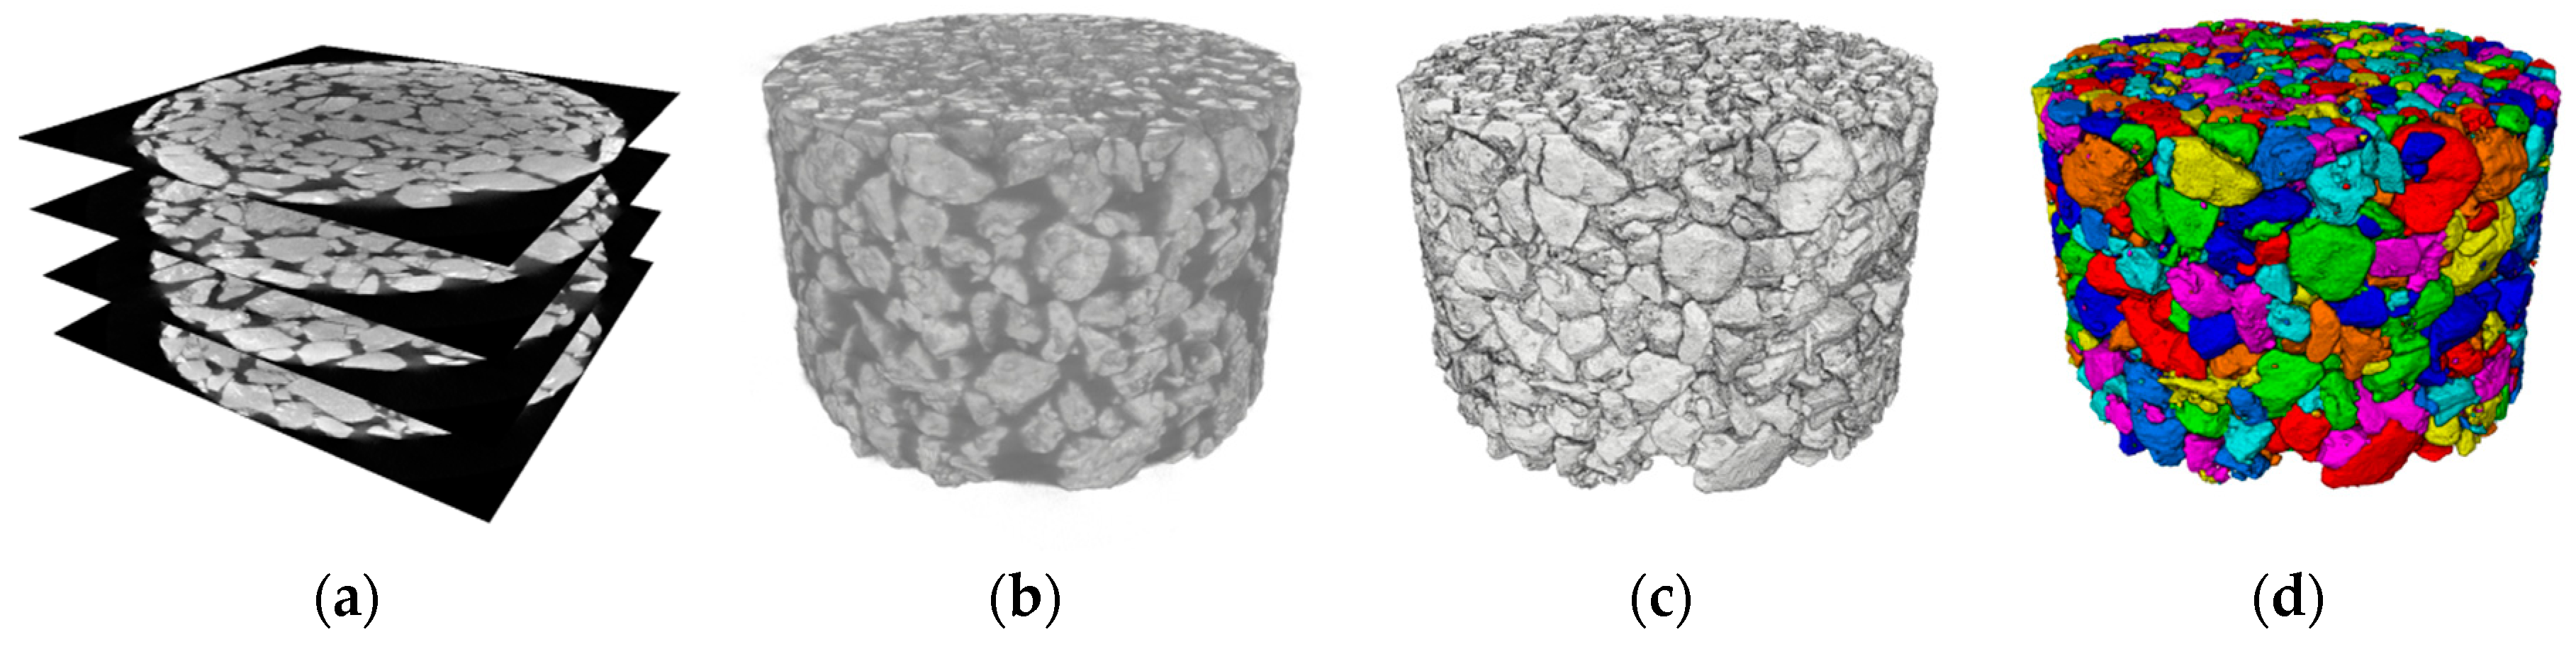
Table 2. The granite aggregates utilized here were from the same construction site (Zhanjiang City) as the granite mentioned in last section, thus the calibration curve can be used directly. The specimens were 101.6 mm (diameter) by 63.5 mm (height) in dimension and were compacted using the Marshall compactor. After demolding, specimens were sent for X-ray CT scanning. The resolutions of the resulting images were approximately 0.0878 mm/pixel in the horizontal and vertical direction. The results of 3D reconstruction are shown in
Figure 10. It was observed that most of clustering coarse aggregates were separated successfully, whereas a certain amount of fine aggregates still adhered to the surface of coarse aggregate. The emphasis of future study should be placed upon the segmentation of aggregates in X-ray CT images. In addition, the aggregate structure (see
Figure 10) can also be used to establish mechanical model for micromechanical behavior analysis. For example, after aggregate and mastic phases are identified from 3D images, triangular surface meshes for each phase can be created, and then finite element meshes can be generated [
21].
Considering the breakage of aggregates during Marshall compaction has an effect on gradation [
22], aggregates were extracted from mixtures by ignition method (T0735-2011 [
23]) after scanning, and laboratory gradations were determined (T0725-2000 [
24]) for further analysis.
To convert the graphical volume-based gradation to a realistic weight-based gradation, it was assumed that all the aggregates in the specimen have the same specific gravity. Thus, the weight-based gradation can be directly estimated from X-ray CT images. After each aggregate was classified into a different standard size range based on their equivalent diameter or DSS, the total volume of the aggregates in each standard size range and the accumulative passing percentage were computed. It is noted that the aggregates smaller than 4.75 mm will not be considered in the calculation, which is acceptable because they are components of asphalt mortar.
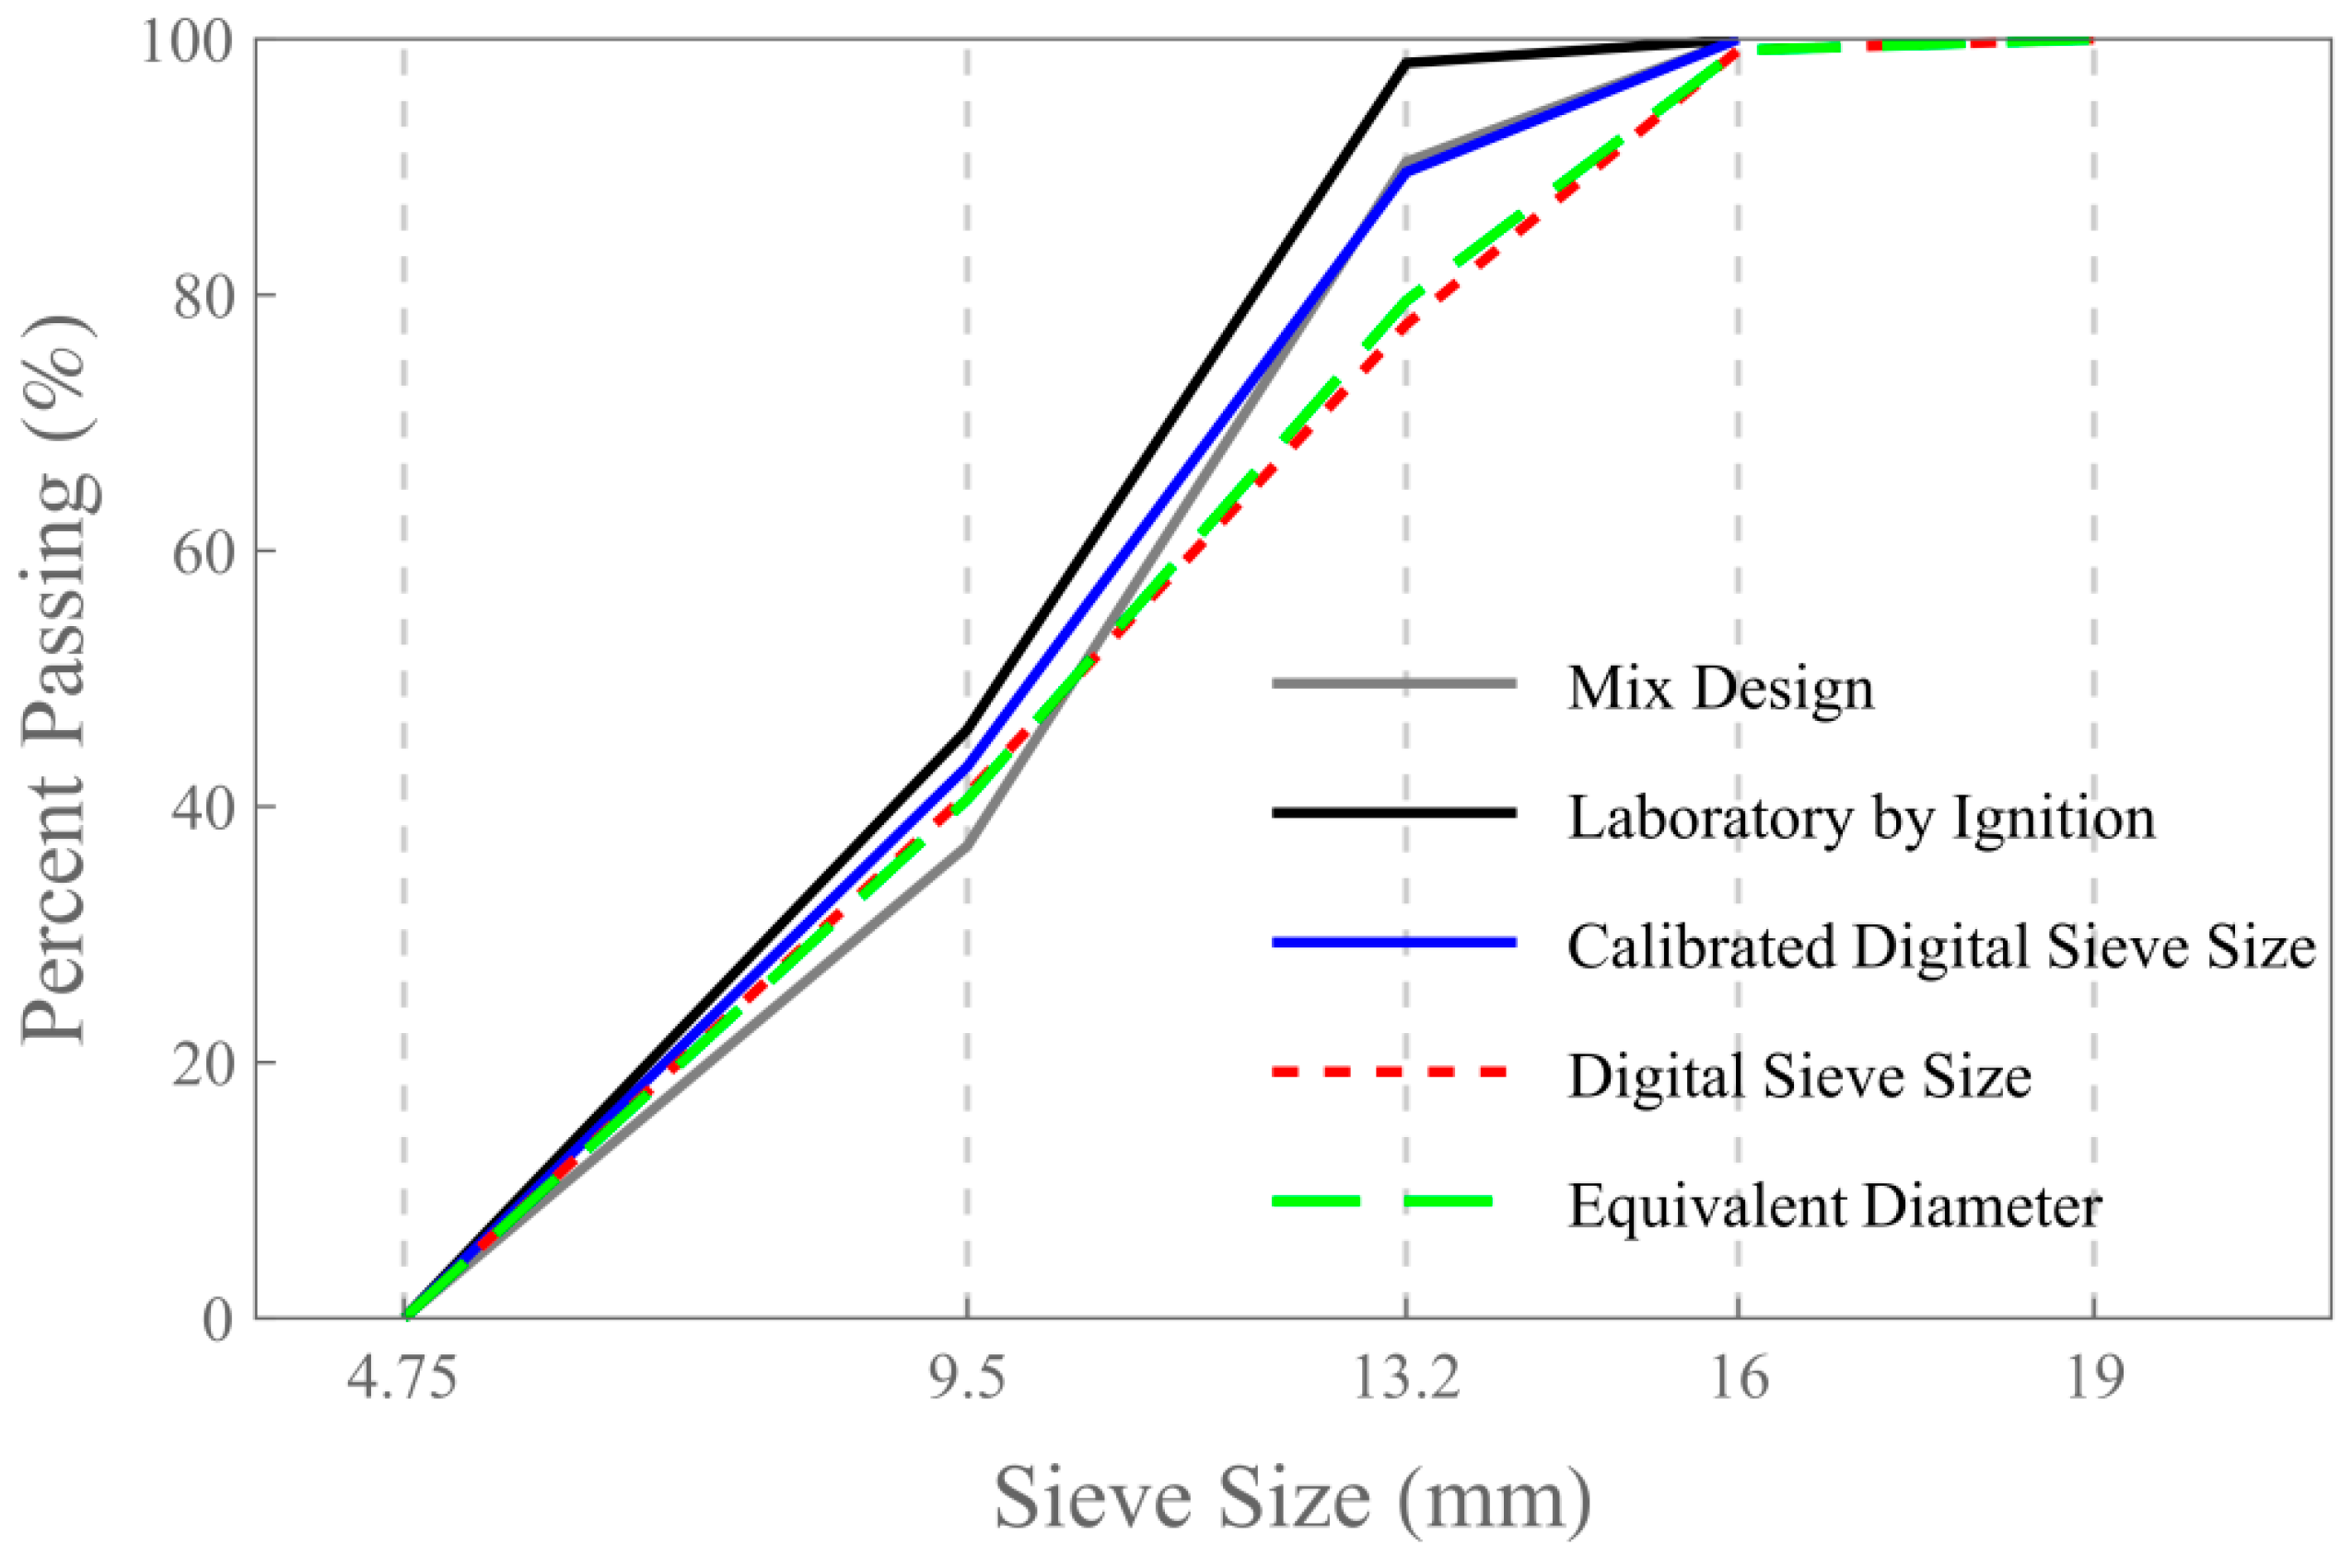
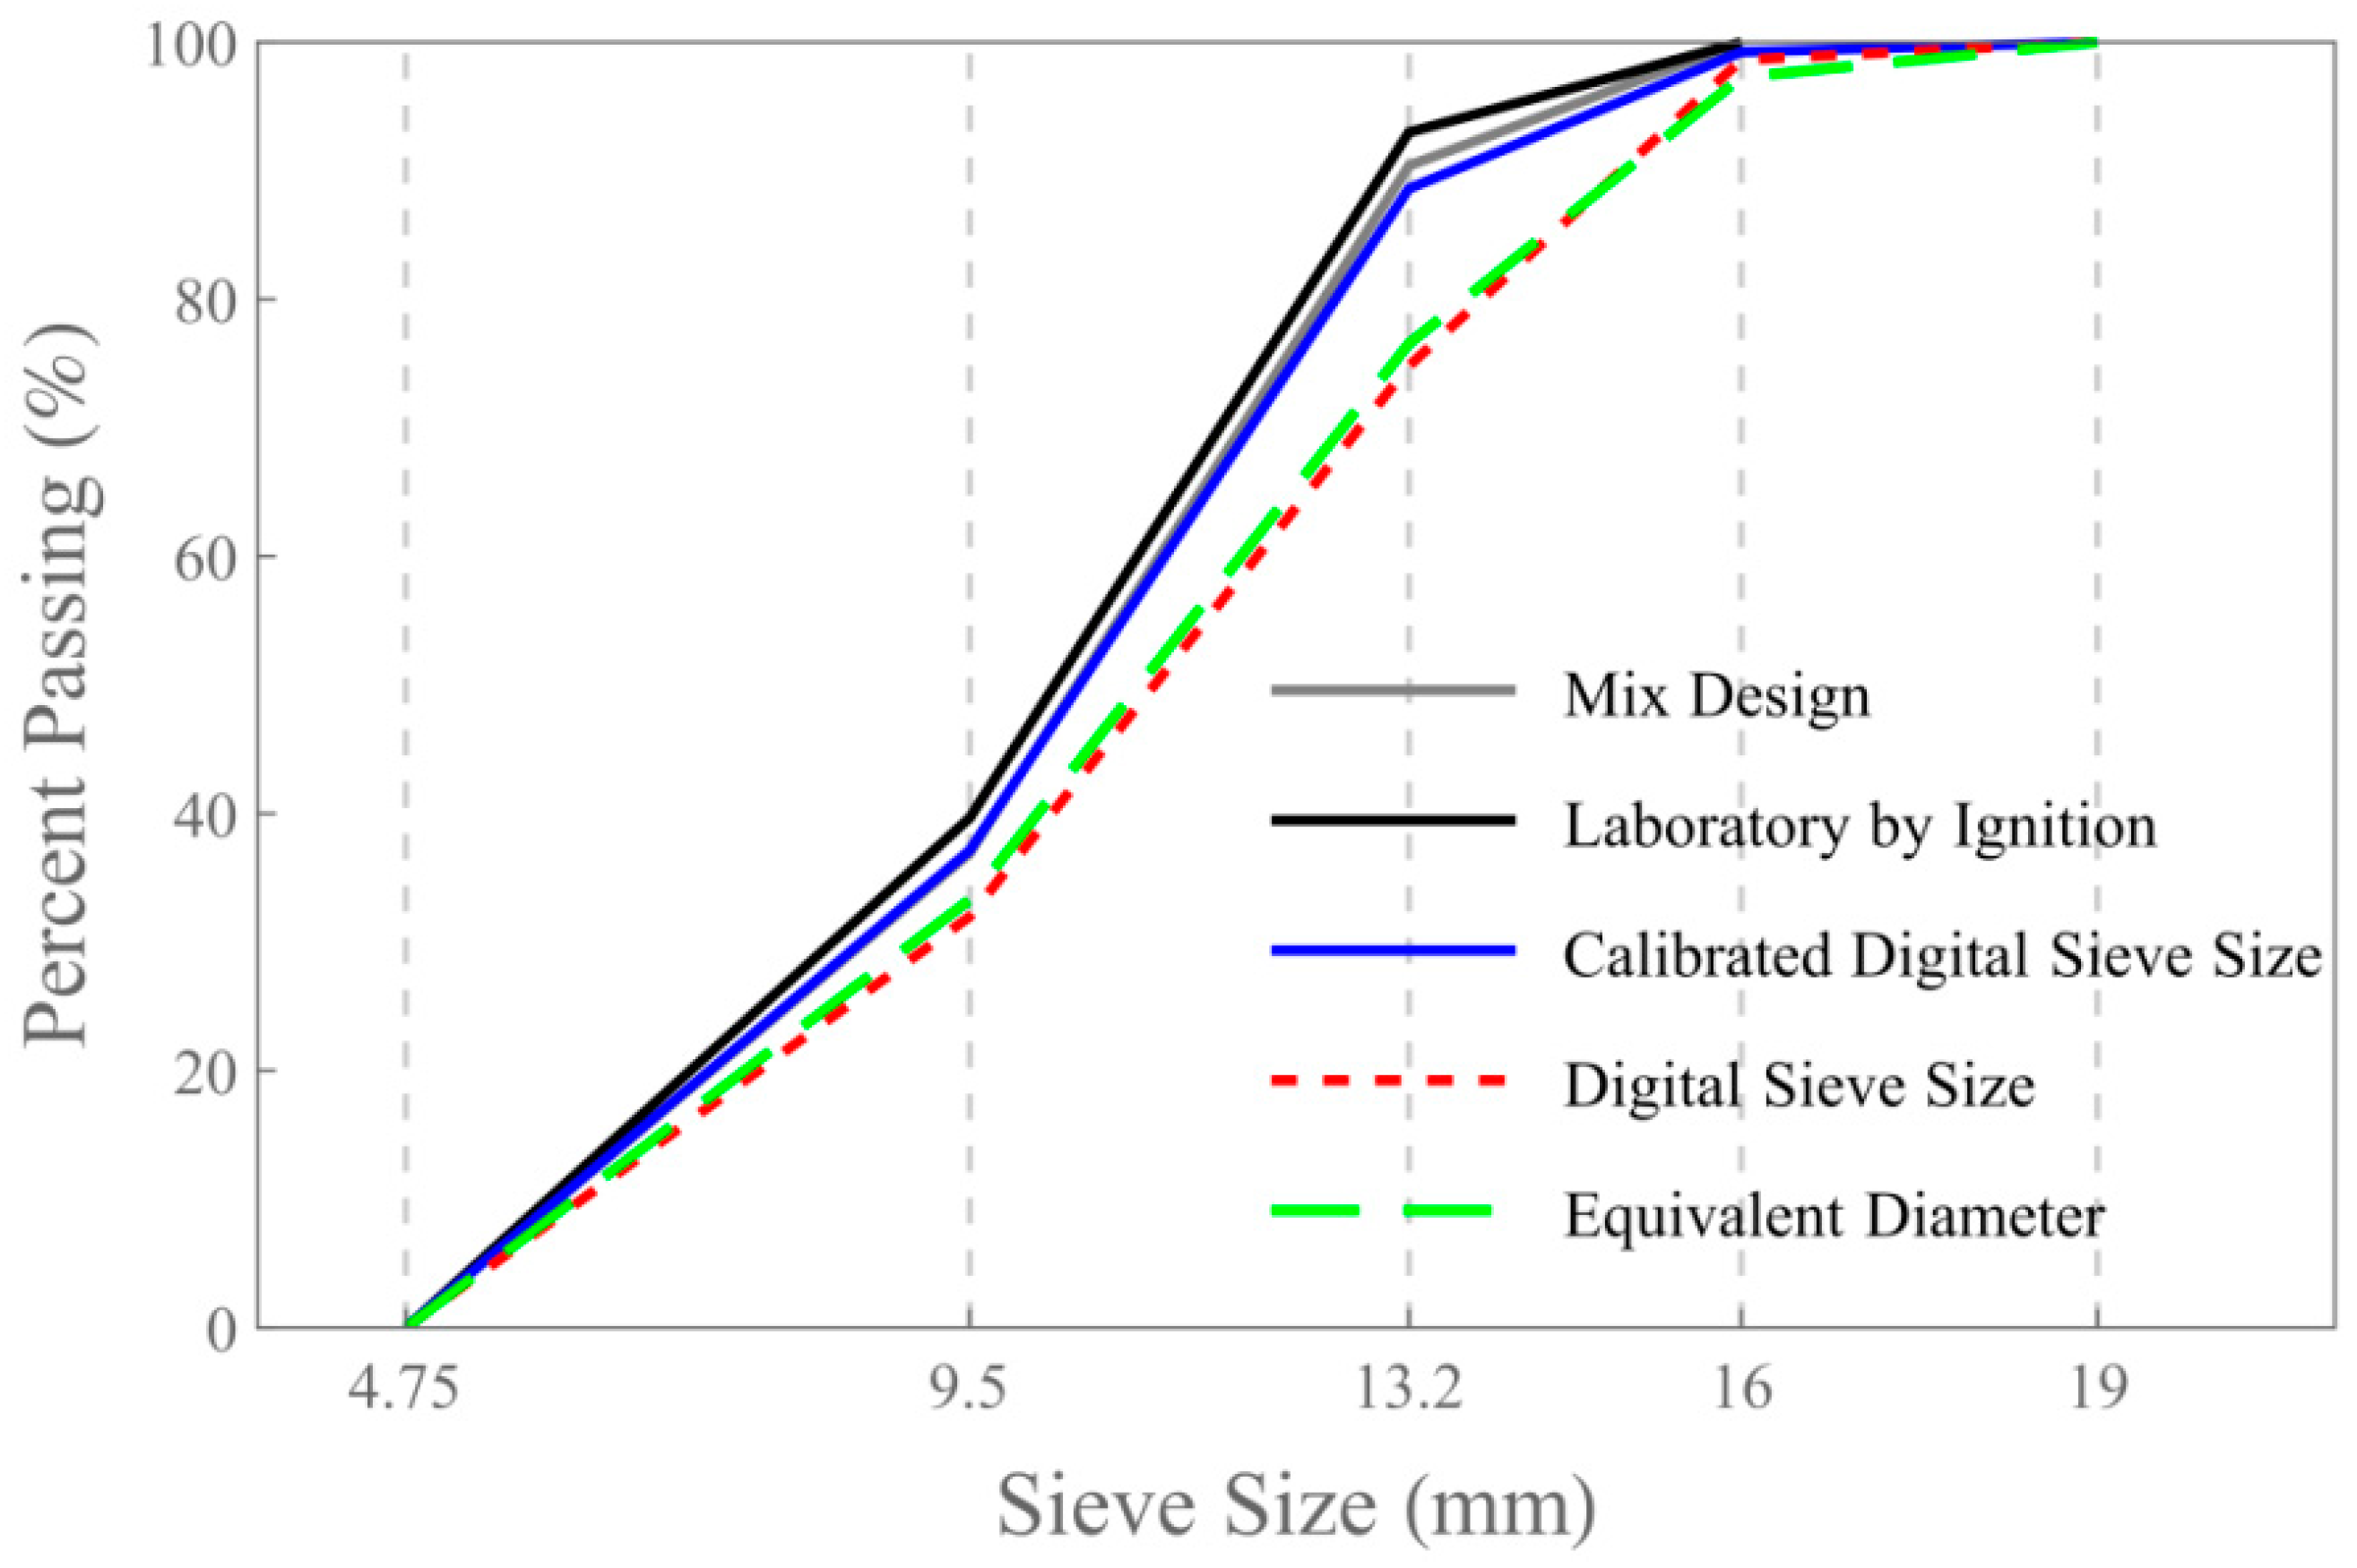
The gradation curves based on different methods are presented in
Figure 11 and
Figure 12.The results showed that the gradation based on calibrated DSS was closer to the laboratory gradation curve than the curve based on DSS or equivalent diameter, indicating the calibration of DSS was necessary. In the case of specimen 1 (see
Figure 11), although a significant difference existed between the mix design and laboratory gradation, the calibrated DSS was able to capture the variability. Moreover, the gradation curves based on DSS and equivalent diameter were quite close. This result was owing to the finding in
Figure 9 that there was a good statistical correlation between these two parameters.
7. Conclusions
The aim of this study was to develop 3D digital sieving technique used to estimate the gradation of asphalt mixture in X-ray CT images. For this purpose, a concept named digital sieve size (DSS) was proposed, which was defined as the minimum length of the minimum bounding squares of all possible orthographic projections of an aggregate. The corresponding numerical method used to obtain DSS was introduced. In order to investigate the difference between mechanical sieve analysis and the digital sieving technique, four groups of epoxy-filled aggregate specimens were scanned and analyzed. As a convex basis lurked in the definition of DSS, there were a certain percent of aggregates in each specimen with their DSS larger than the upper limit of their mechanical size in the result. It was suggested that the concave surface of aggregate was the possible reason for the disparity between DSS and mechanical sieve size. After a linear calibration of DSS was performed for granite, the digital sieving technique was adopted to evaluate the gradation of stone mastic asphalt mixtures. The results showed that the closest proximity of the laboratory gradation curve was achieved by calibrated DSS among the gradation curves based on calibrated DSS, un-calibrated DSS, and equivalent diameter.
Apart from good reliability after calibration and being easy to understand, the major advantage of DSS is that it considers the shape of the aggregate and the square opening of the mechanical sieve, as compared to the equivalent diameter. Although the benefit of DSS for a dense-grained asphalt mixture is weakened by the large quantity and volume summation of aggregates in each standard size range, DSS is promising in capturing size distribution of coarse/medium-grained mixture. Moreover, DSS is much more sensitive to the clustering of coarse aggregates than the equivalent diameter since clustering particles often have strange shapes and large aspect ratios. The gradation curve based on DSS can be used to select the optimum parameters for the segmentation algorithm.


