4.1. Simulation Validation
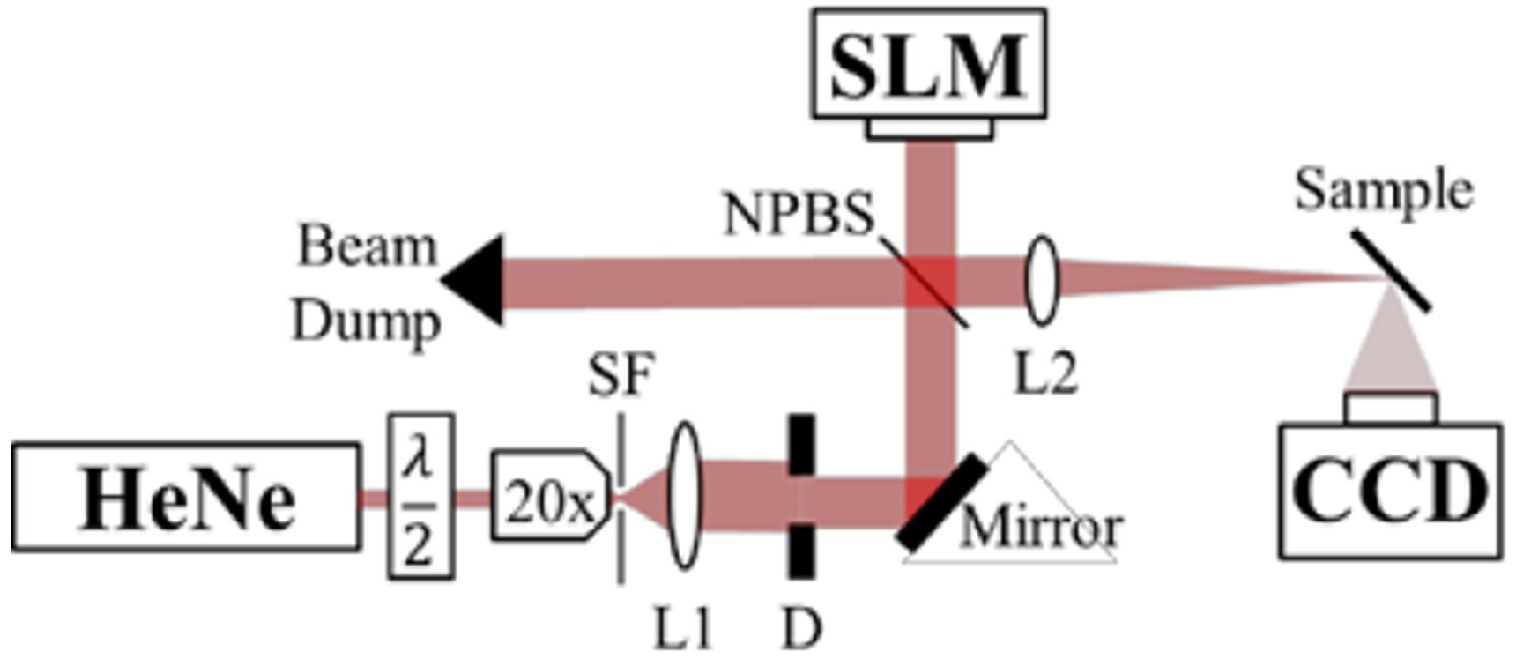
The diffusely-reflecting sample was replaced by a mirror to validate the propagation-based simulation. In the simulation, the mirror is considered a perfect reflector, which eliminates the
term from Equation (
15). Qualitatively, with a mirror positioned at the focus of the positive lens, the creation of a focused spot on the CCD simply requires shifting the focus of the positive lens the distance from the mirror to the CCD. This is accomplished by applying a negative lens phase screen to the SLM. The phase screen for a lens is given by:
Using geometric optics, the focus of the negative lens is given by,
where
is the distance from the SLM to the positive lens,
is the distance from the lens to the mirror and also equal to the focal length of the positive lens and
is the distance from the mirror to the CCD.
The spot produced by the mirror test case was captured by the CCD and compared with the spot simulated using Equation (
15).
Figure 2 shows both the measured and simulated spots and includes the center horizontal cross-sections of each. There was a 20-
m difference between the FWHM diameter of the measured and simulated spots. The difference is attributed to uncertainties in the experimental distances between the SLM, lens, reflector and CCD that result in a small defocus error in the measured spot.
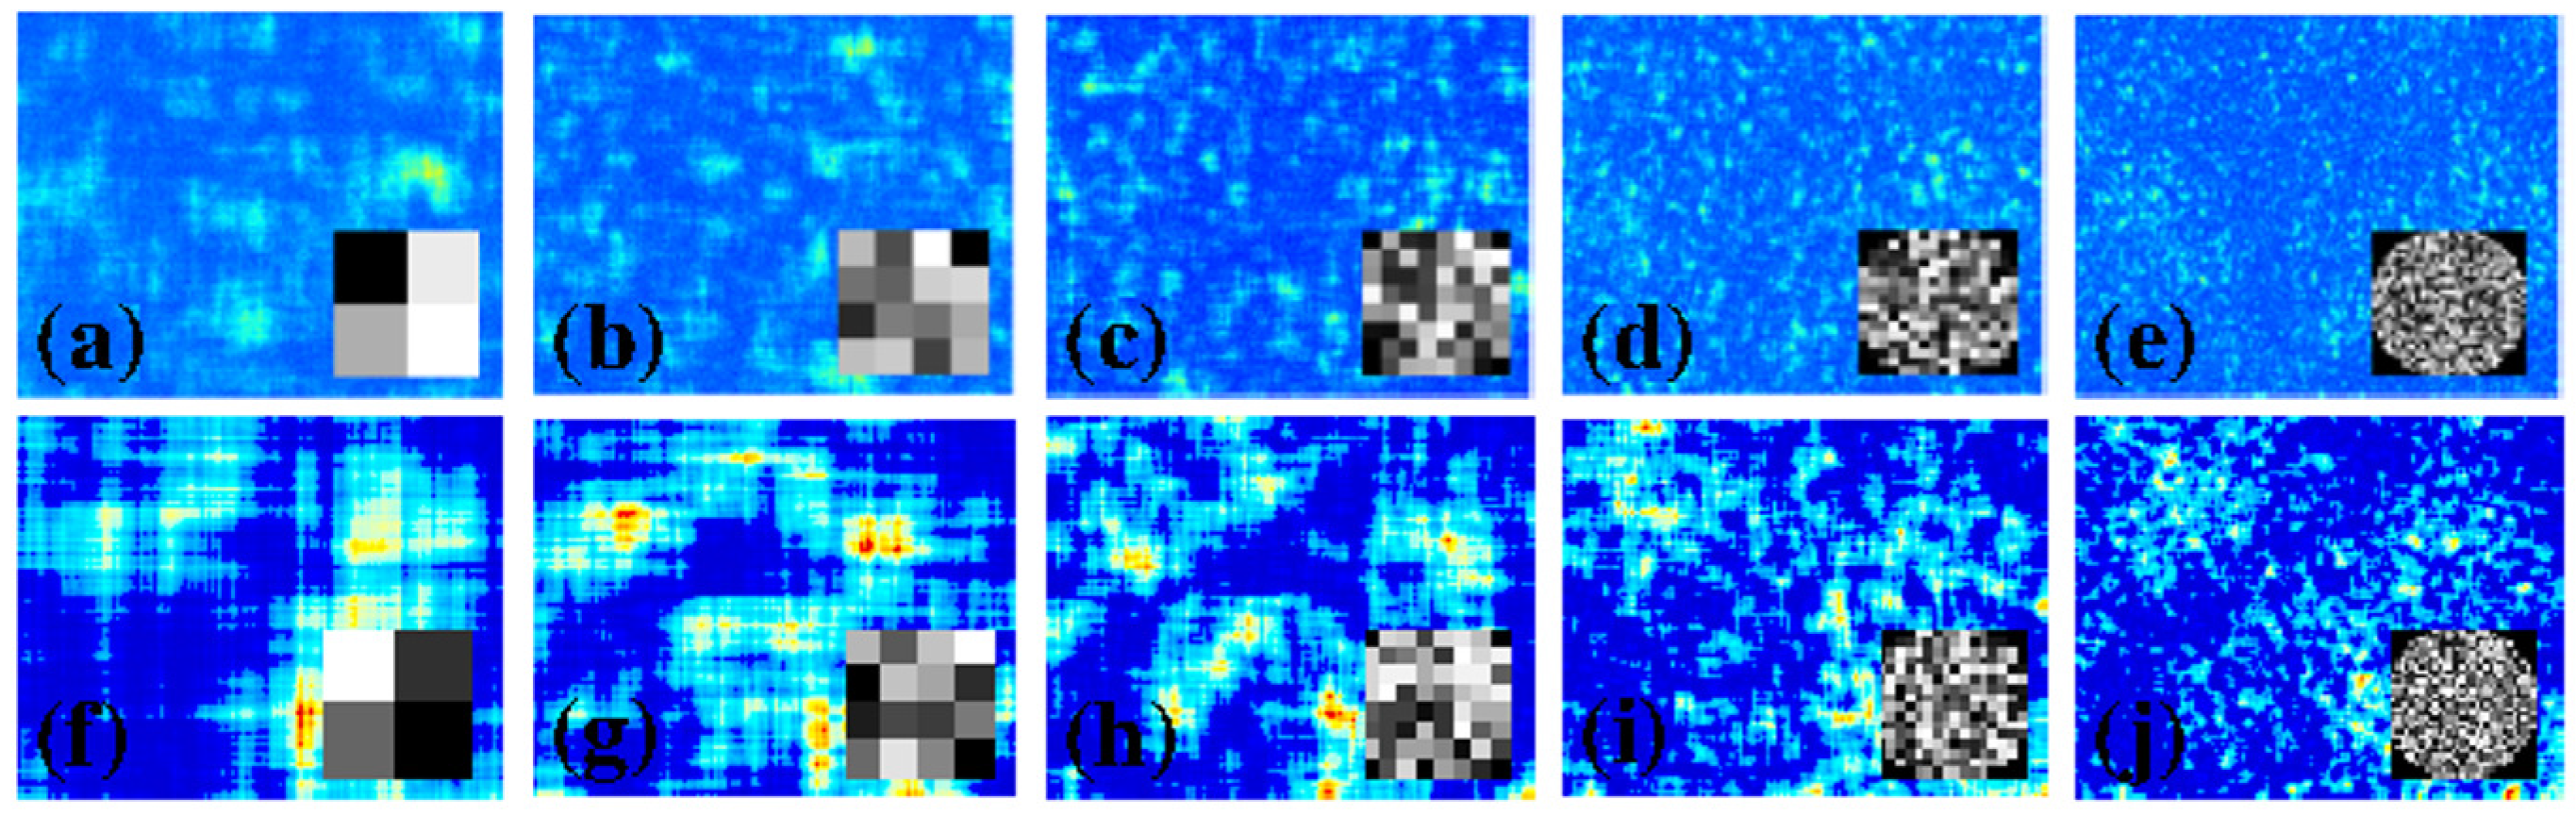
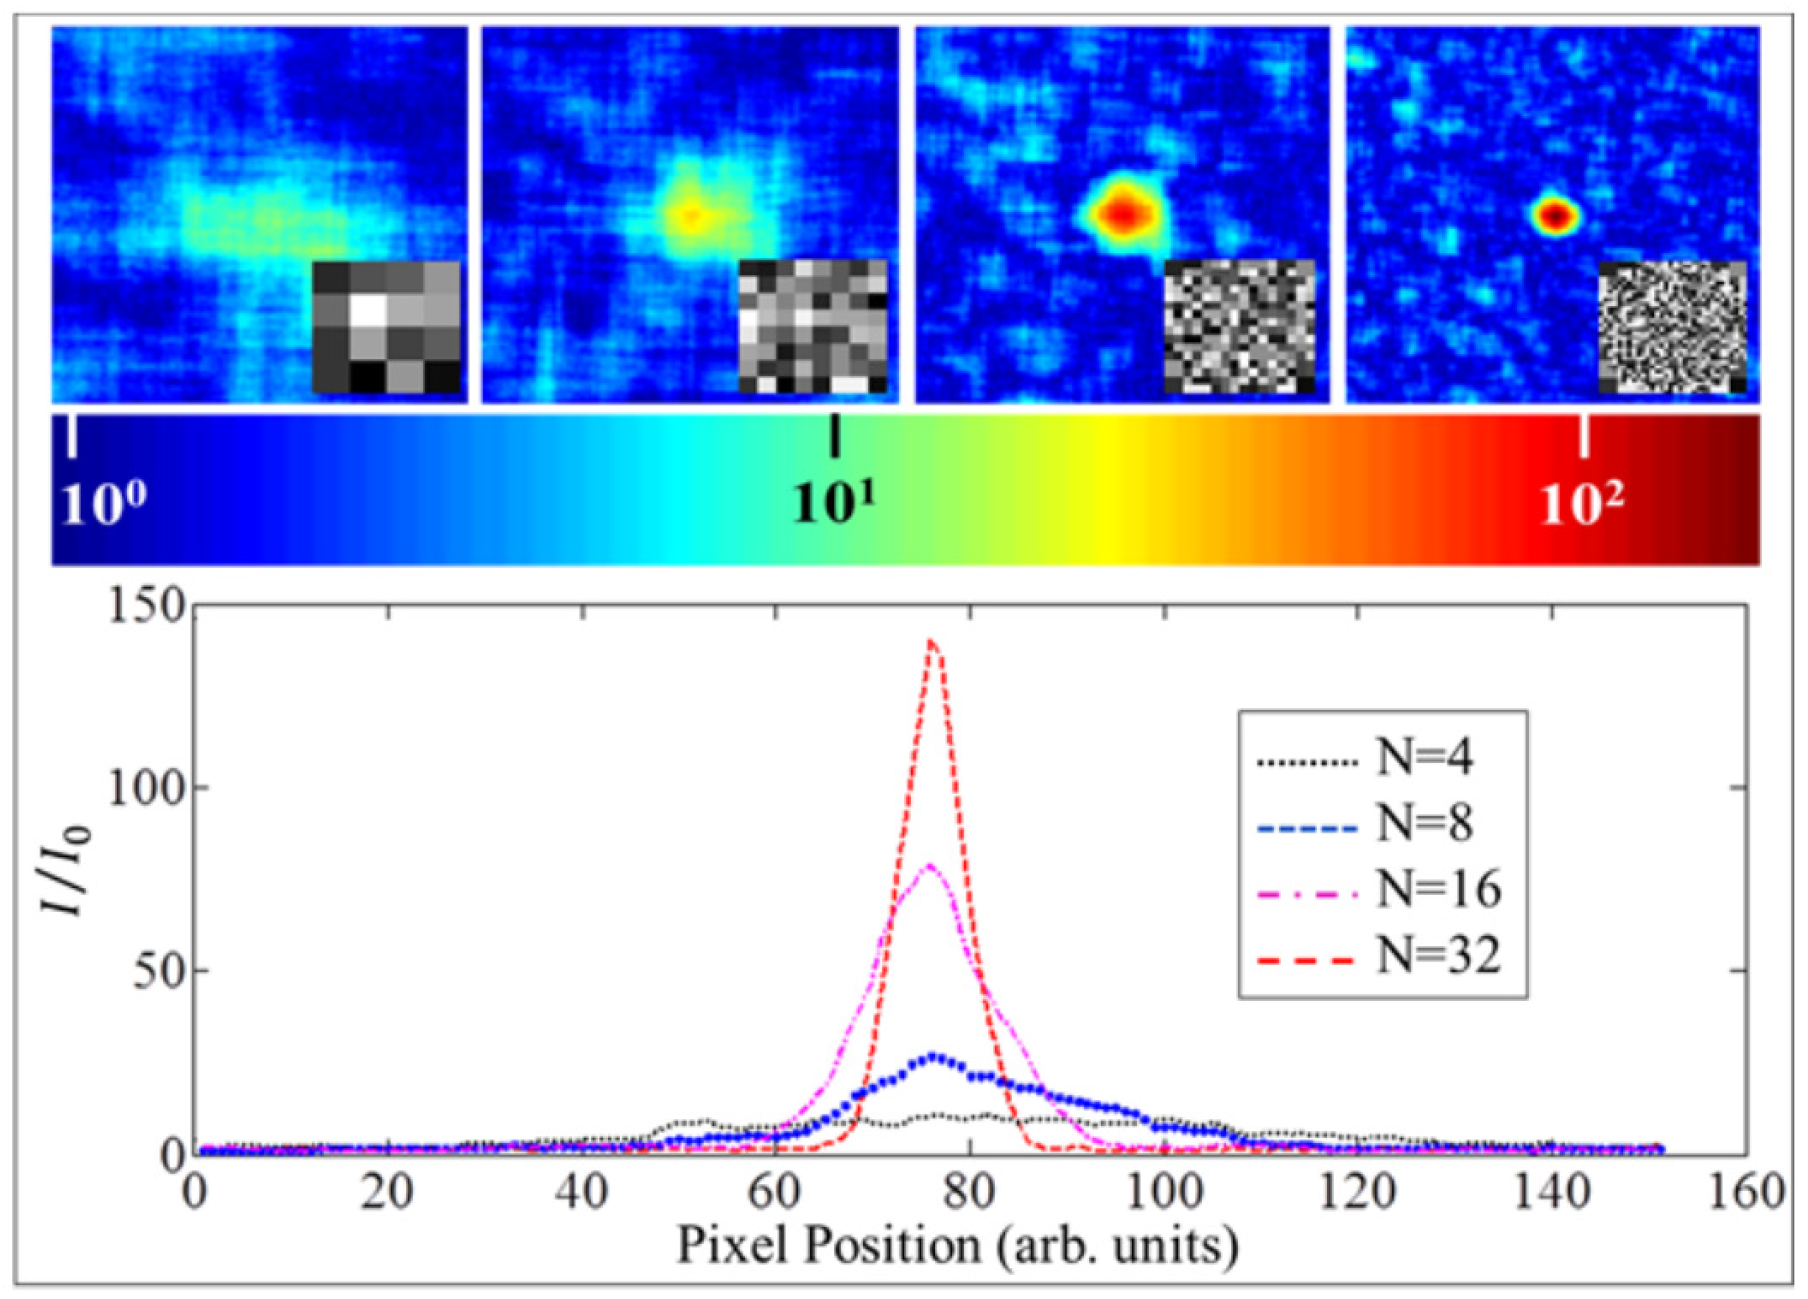
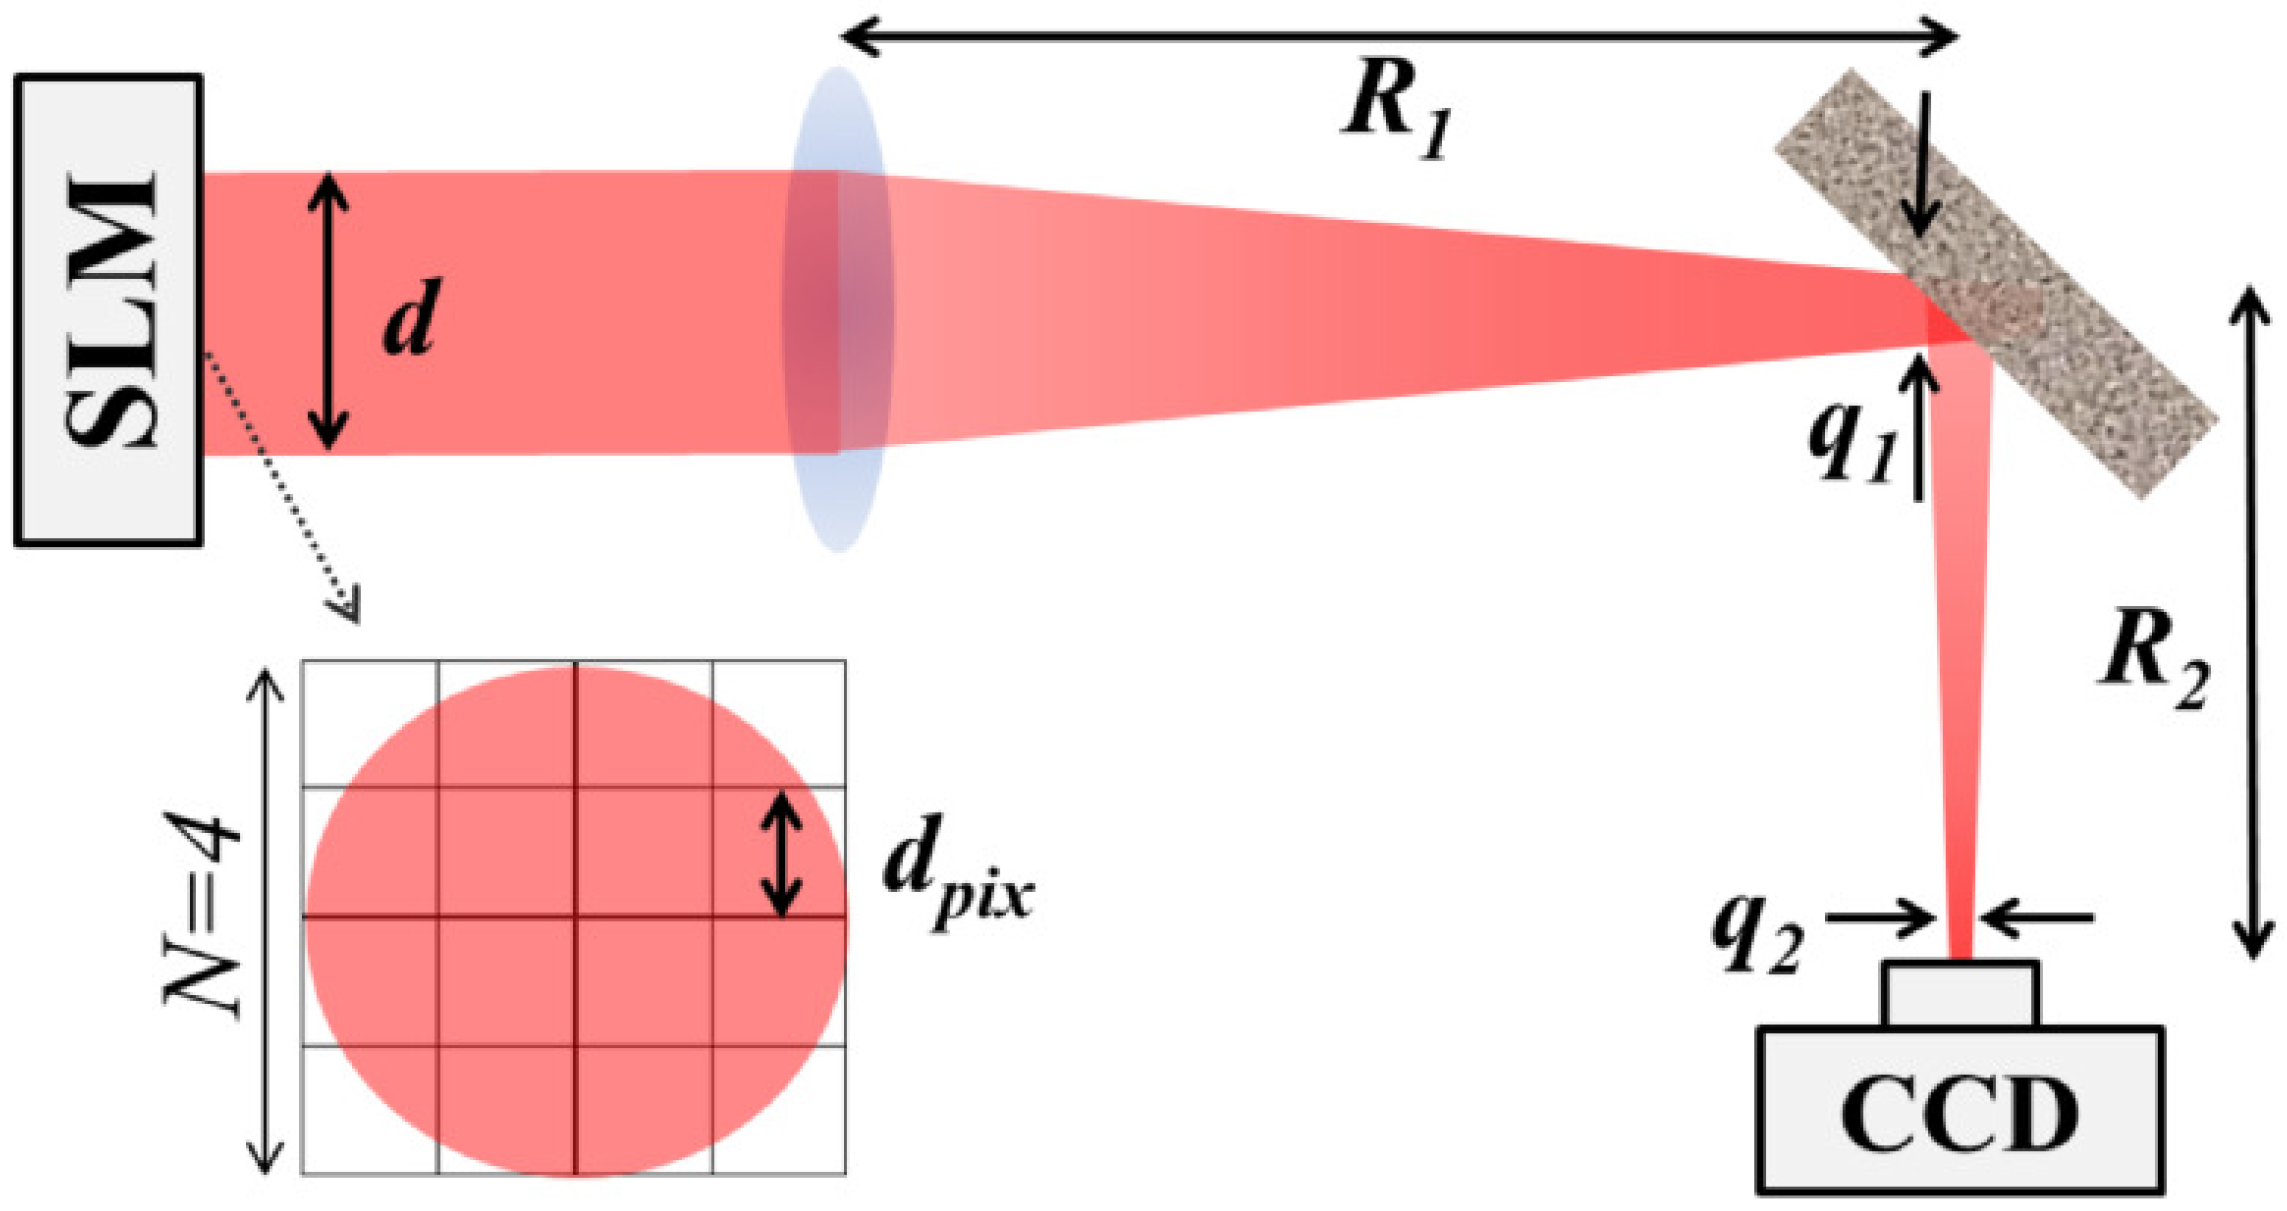
4.2. Speckle Size and Pre-Optimization
The SLM was segmented into
segments, where
, with random phase values applied to each segment and the speckle pattern recorded with the CCD. The speckle patterns in
Figure 3 were produced by the sandblasted aluminum sample and show the variation of speckle pattern size as
N is increased. All of the tested reflector materials showed a similar variation in speckle pattern size with respect to
N. Simulated images are included in
Figure 3 for comparison. They were generated using Equation (
15) with the reflector term,
, modeled as a uniform phase distribution with a magnitude of one. Histograms of the measured and simulated intensity speckle patterns fit a negative exponential probability density function, which is expected for fully-developed speckle [
17]. A transmissive inverse diffusion experiment was conducted based on Vellekoop’s original research and used as a point of comparison. Using a white paint on glass sample as the scattering media, the size of the background speckle did not change with
N. This was due to the imaging optics used and placed closely to the scattering sample.
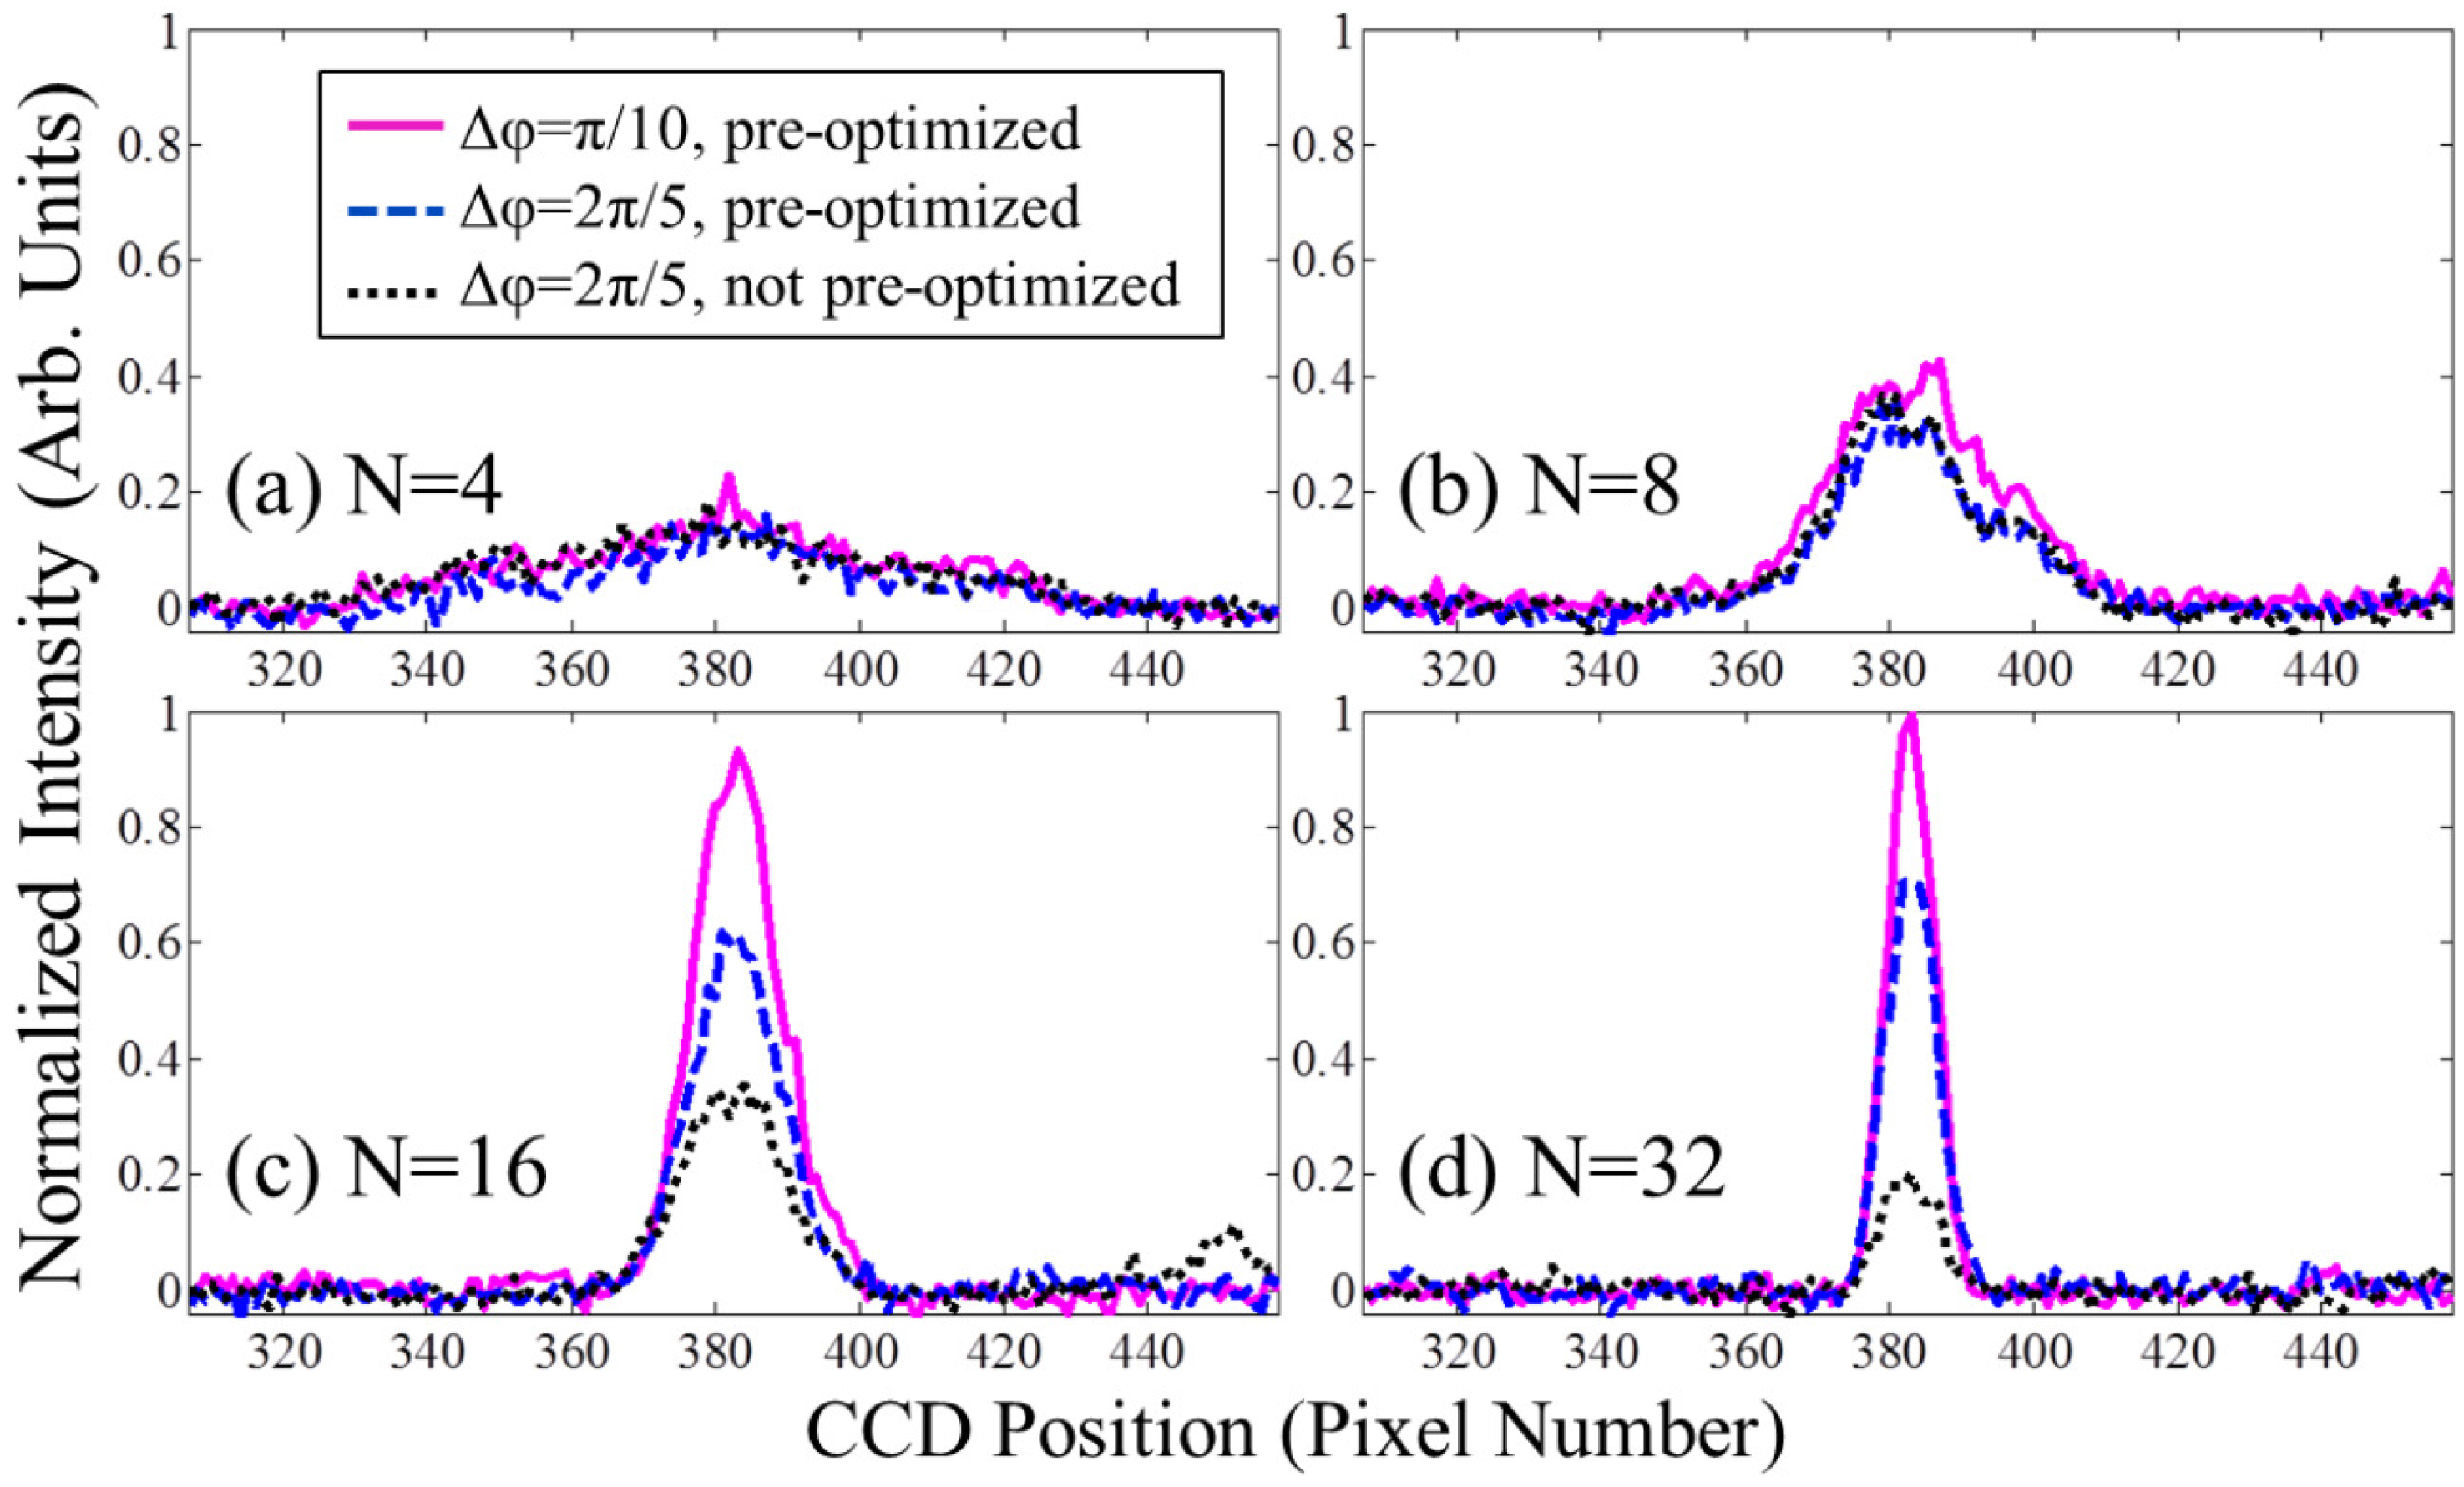
The algorithm sequentially optimized the segments of the SLM to produce a focused spot on the CCD. For cases where , pre-optimization was accomplished, i.e., the SLM was optimized for each previous value of N. After each stage of optimizations, the algorithm proceeds to the next value of N by splitting each segment horizontally and vertically into four, equally-sized, smaller segments. These smaller segments are then individually re-optimized, and the process is repeated until the desired N is reached. The spot intensity produced by a pre-optimized SLM was compared to the spot produced by an SLM that was not pre-optimized. In addition, two different phase modulation step sizes, and , were used for the pre-optimization trials.
The results of pre-optimization for the graphite sample are shown in
Figure 4. Pre-optimization did not appreciably affect the spot intensity for
, but improved spot intensity for
. An increase in peak intensity of approximately 40% is shown in the pre-optimized trial for
. Computer simulations with a uniform phase reflector model showed a more modest effect with only a 5% increase in peak intensity in the pre-optimized trial for
. A decrease in the phase modulation step size from
to
improved spot intensity by 20% for the graphite reflector and by 10% in simulation. Pre-optimization was shown to increase peak intensity for all of the reflector materials for
. The amount of improvement was dependent on the individual material surface properties, such as roughness and correlation length. The exact relationship the material surface properties have on enhancement must be examined in future research.
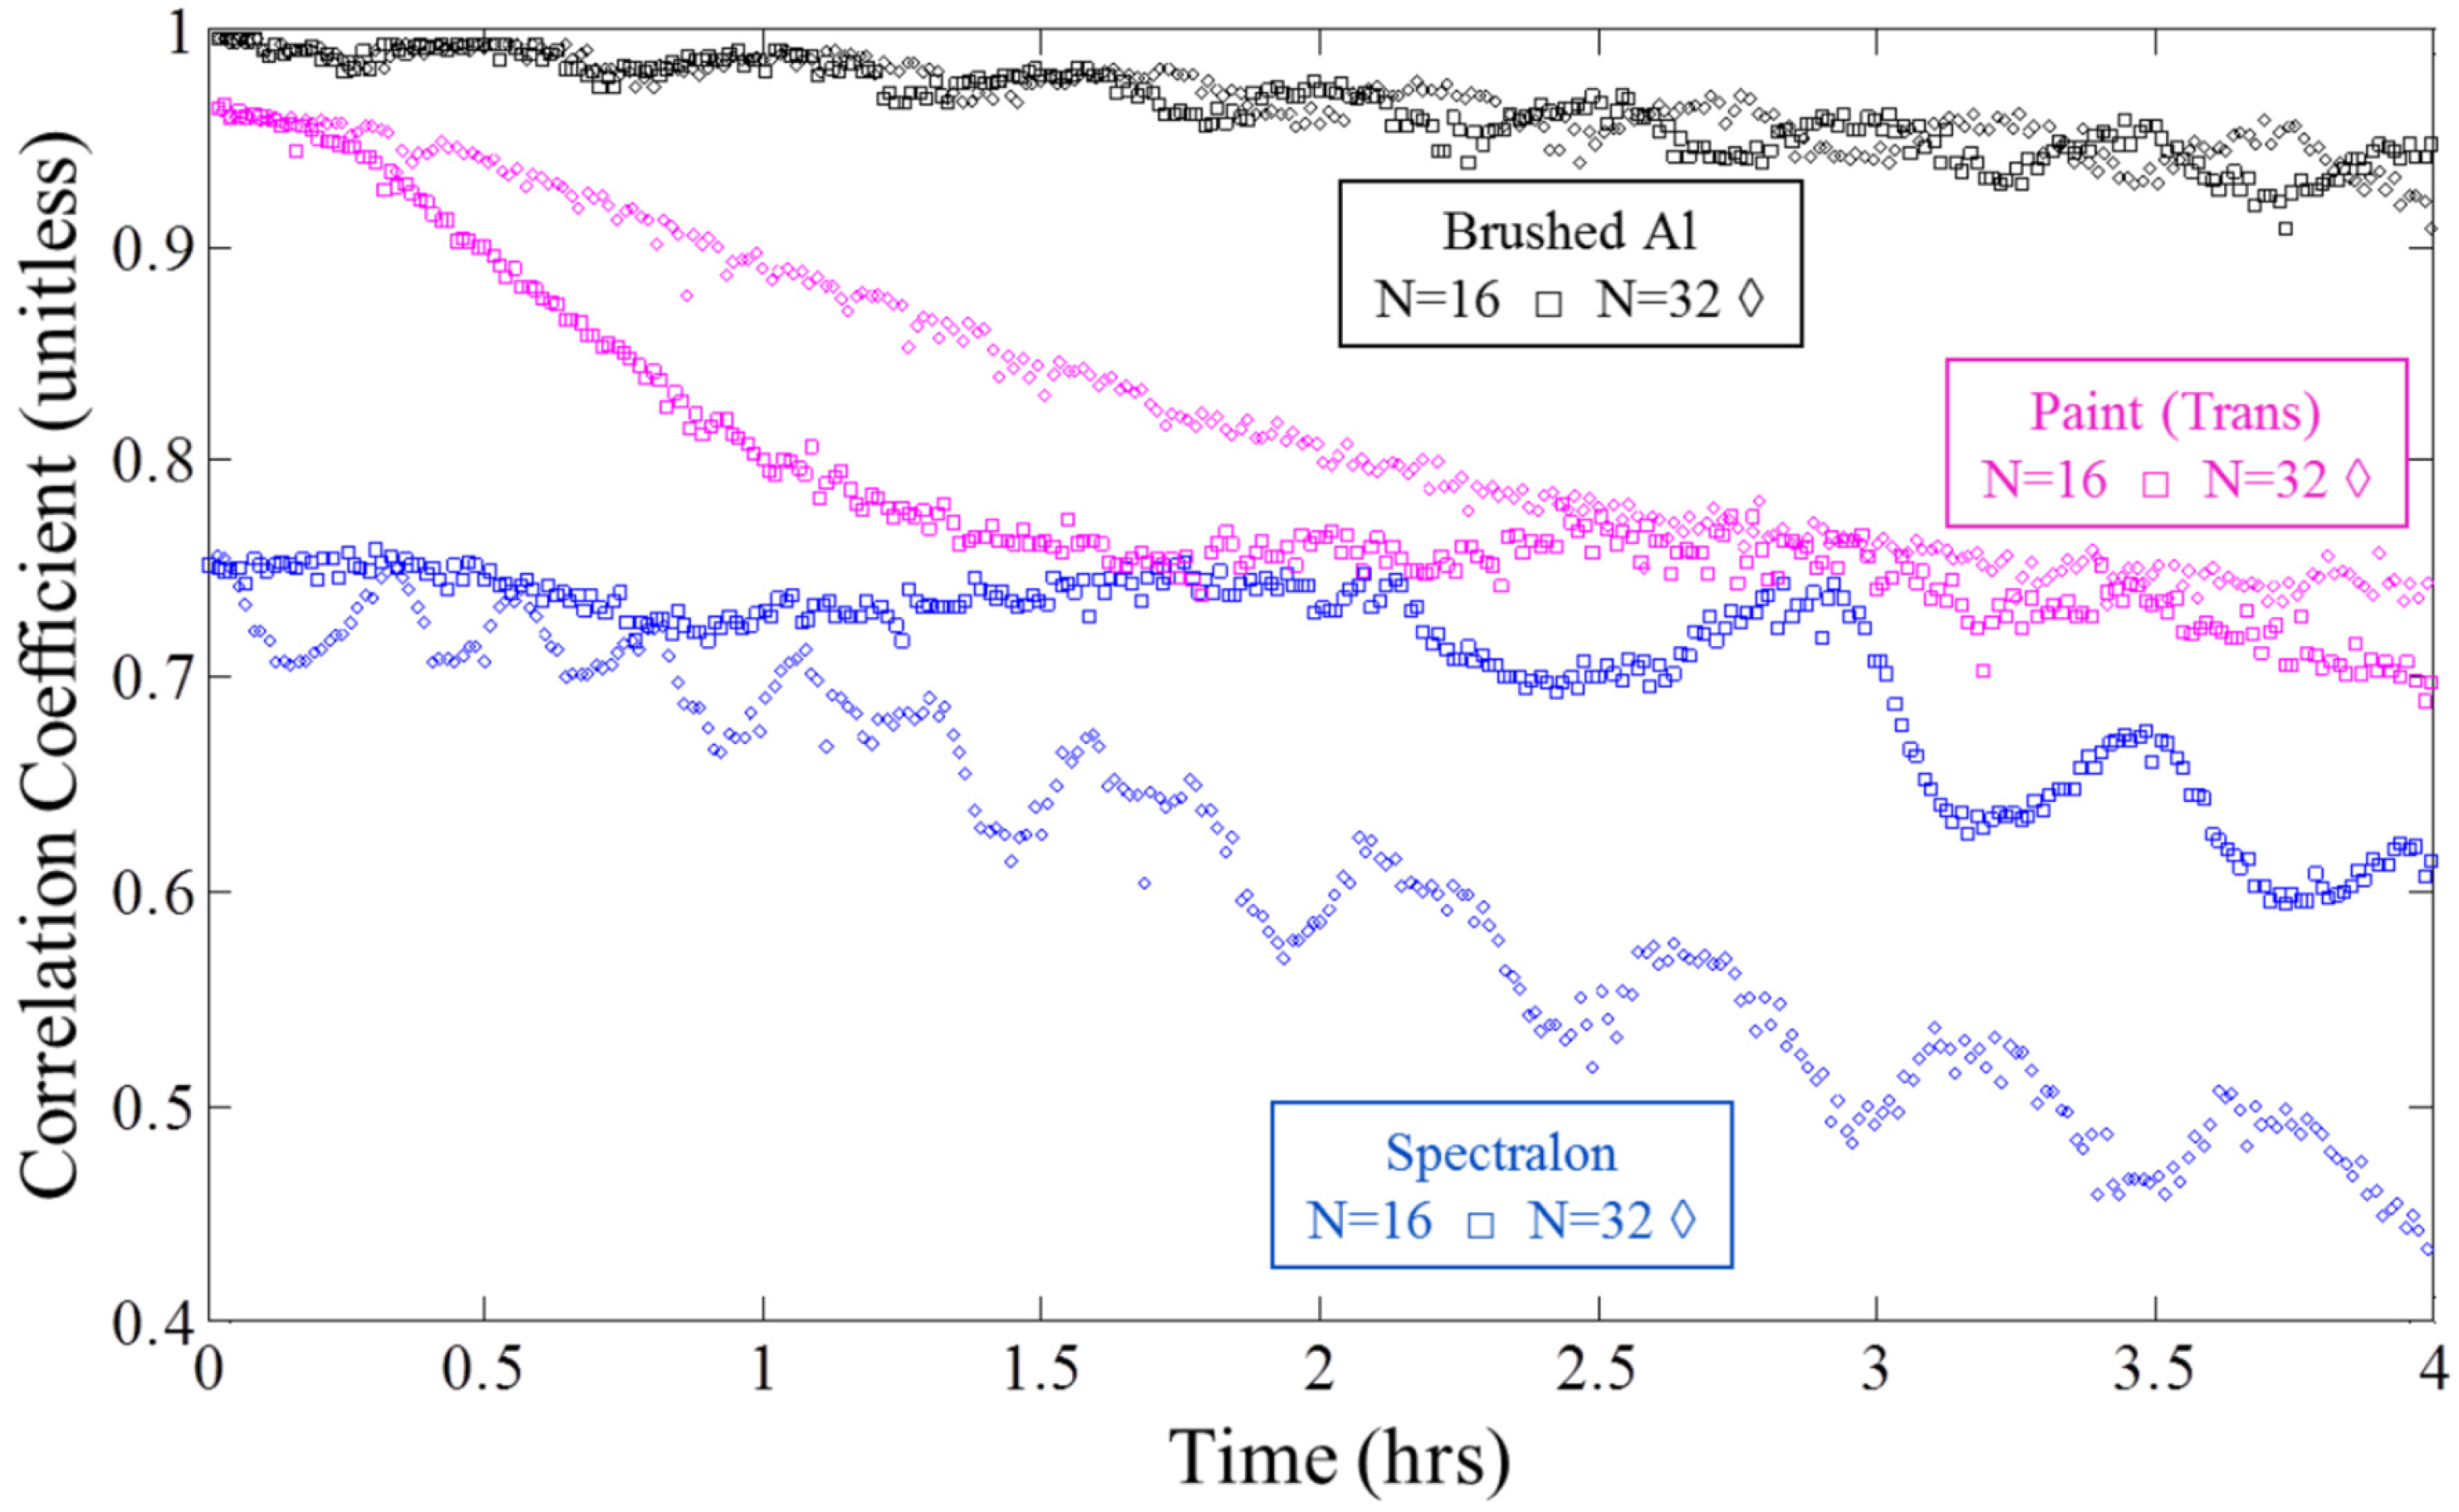
4.3. Speckle Pattern Decorrelation
The speckle pattern produced by a fixed SLM phase map and the diffusely-reflecting sample varied with time. The decorrelation of the speckle pattern is a function of both the material properties of the diffuse reflector and the laboratory test conditions.
Figure 5 shows the correlation coefficient over time for the brushed aluminum, transmissive white paint and Spectralon
® samples. As expected, the metal reflectors maintained a much higher correlation coefficient; thus, most of the decorrelation for the metal reflectors is attributed to the changing environmental conditions of the laboratory, such as temperature, air currents from the laboratory ventilation system, minute mechanical vibrations and device measurement error and noise. Previous work in the transmissive inverse diffusion shows enhancements (
) ranging from 50 to 1000 using both iterative and transmission matrix methods [
3,
4,
6,
9,
20]. The cause of this wide range of enhancement values is still currently being investigated, with some of the disparity likely caused by noise [
20].
The total noise in the system produced small, low frequency oscillations in the correlation coefficients plotted in
Figure 5. The oscillation caused microscopic shifts in the reflector. This affected the correlation of the speckle produced by the volumetric scatterers, such as Spectralon
® and the white paint samples, more than the metal reflectors due to the longer internal path length changes of the material. The depth of penetration of Spectralon
® has been measured at 200
m for HeNe light [
21], which is over 20-times the root mean square (RMS) roughness of any of the metal samples (see
Table 1). The small shifts of the reflector in concert with the larger internal path length changes in the material caused Spectralon
® to initially decorrelate much faster than the other samples. This decorrelation over time adds a degree of uncertainty to the process, where previously-optimized SLM segments are in fact suboptimal by the time the process is complete. These suboptimal segments cause a decrease in the overall spot enhancement. This decorrelation effect was simulated by adding a zero-mean Gaussian-distributed random phase, with a standard deviation between
and
, to the sample each time the intensity pattern was calculated. The standard deviation of the random phase was dependent on the severity of the decorrelation effect of the sample.
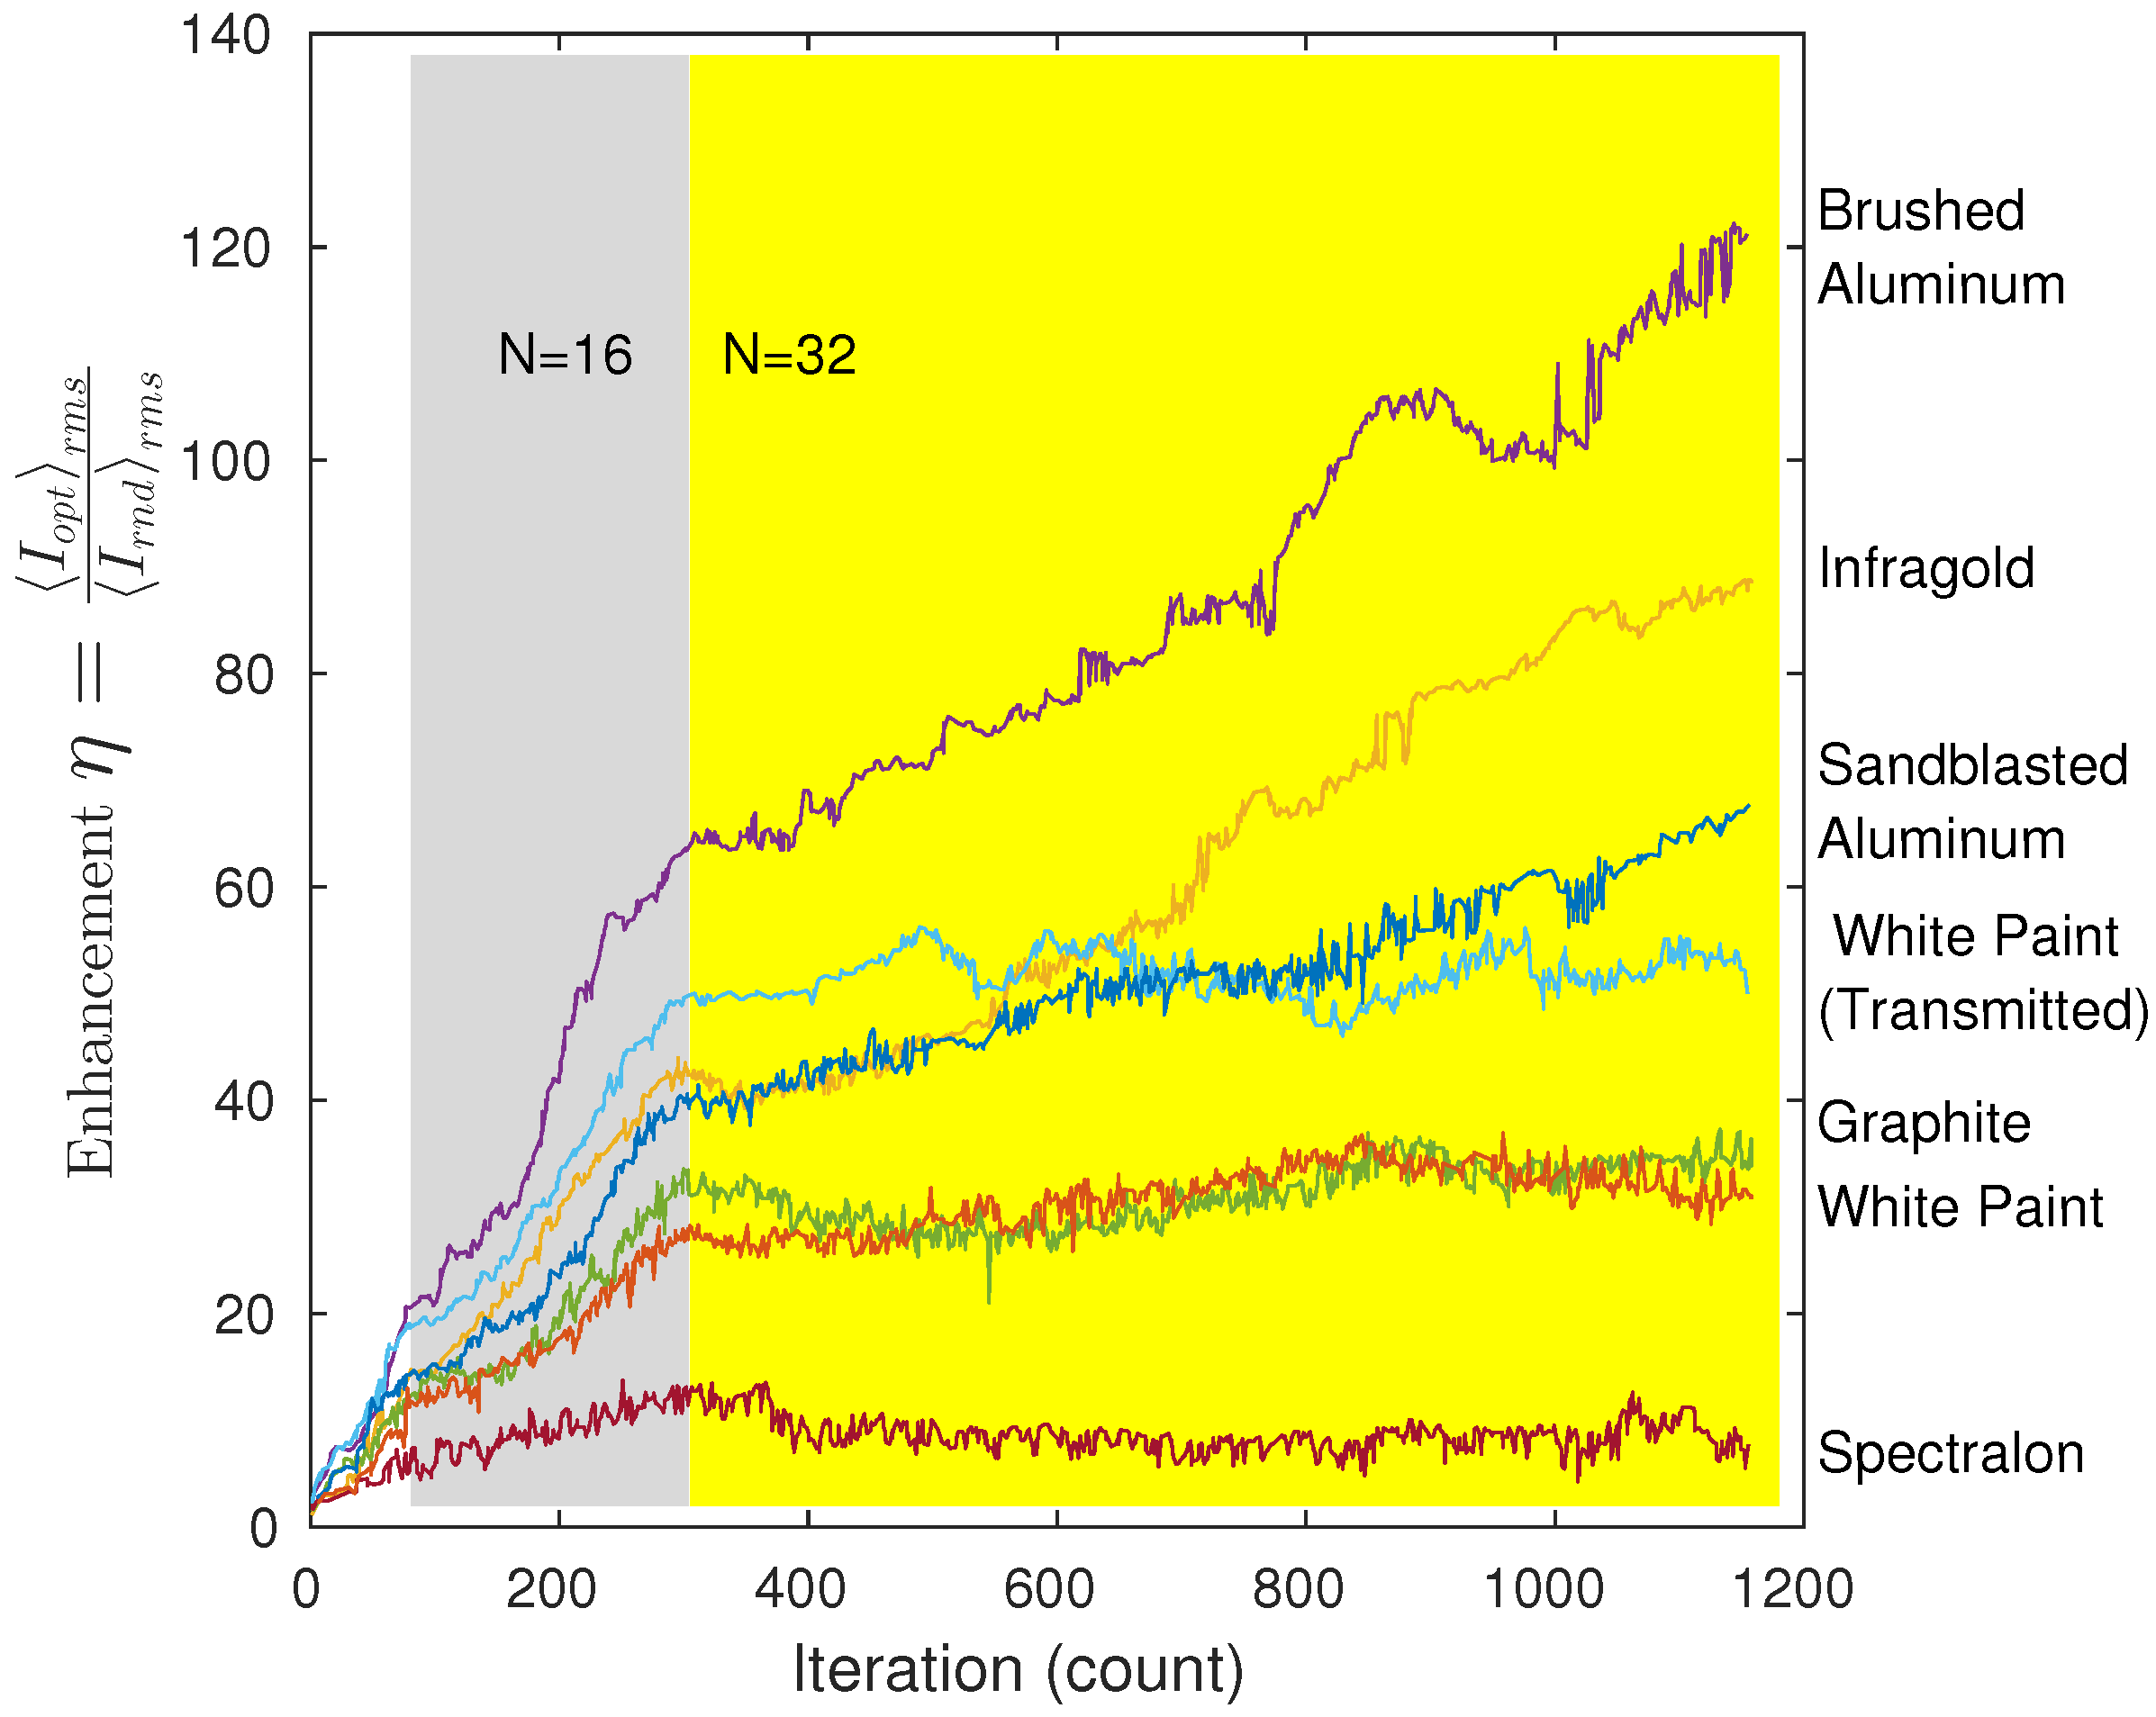
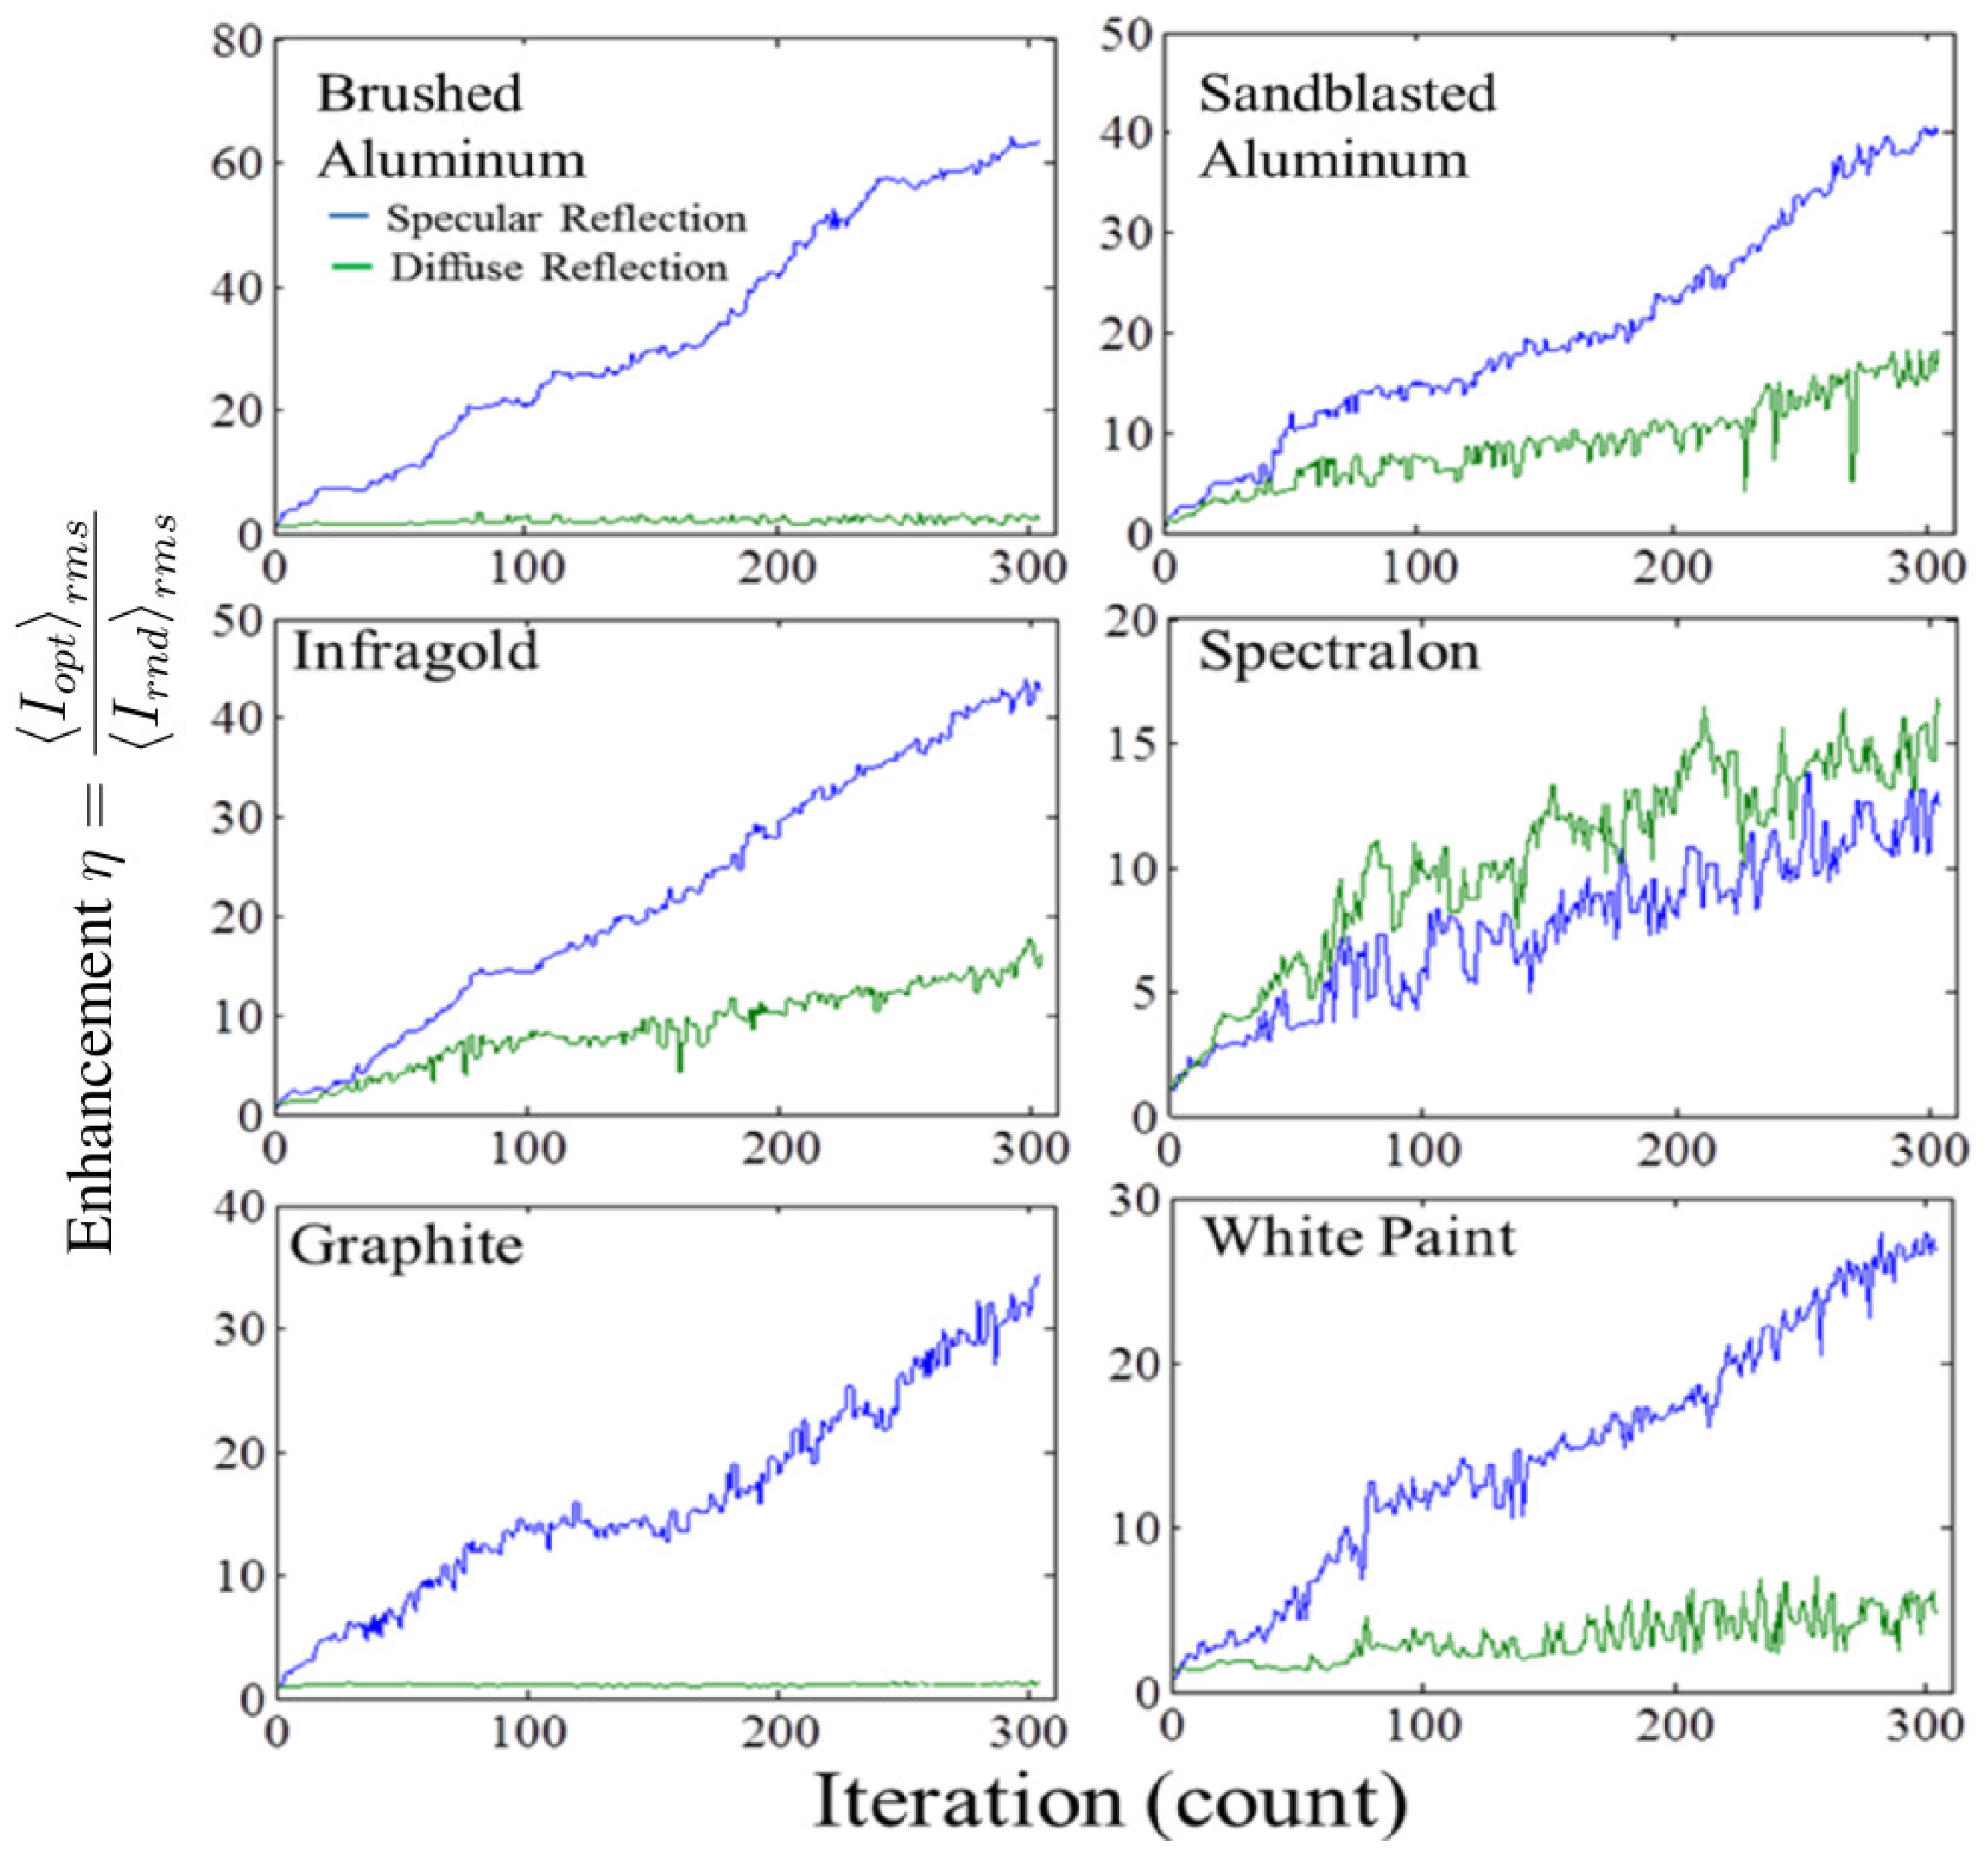
4.4. Reflector Materials
The spot intensity enhancement
, measured surface roughness
and final FWHM spot size are summarized in
Table 1 for each of the reflector materials. The spot intensity is the RMS value of the CCD pixels inside the FWHM radius. The background intensity is the RMS value of the CCD pixels at a radius of three-times the FWHM and beyond.
The algorithm ran with pre-optimization starting with
through
for all six reflector materials. The spot enhancement was calculated after each segment was optimized and is shown in
Figure 6. The smaller optimized segments in the
case produced no improvement compared to the
case for the graphite and Spectralon
® reflectors. The enhancement for the white paint reflector continued to increase slowly during the initial segment optimization of the
stage, but began to decrease midway through the optimization process. At the completion of the
stage, the enhancement for the white paint reflector is only slightly higher than the
enhancement.
Decorrelation is believed to be the cause for the lack of enhancement for the Spectralon
® reflector. As a bulk scatterer rather than a surface reflector, Spectralon
® causes light to undergo multiple scattering events before exiting. Studies have produced penetration depth estimates of 200
m for HeNe light in samples of Spectralon
® [
21]. This depth is approximately 20-times the thickness of the white paint sample used in transmissive inverse diffusion experiments, which indicates that larger internal path length changes occur in the Spectralon
® sample.
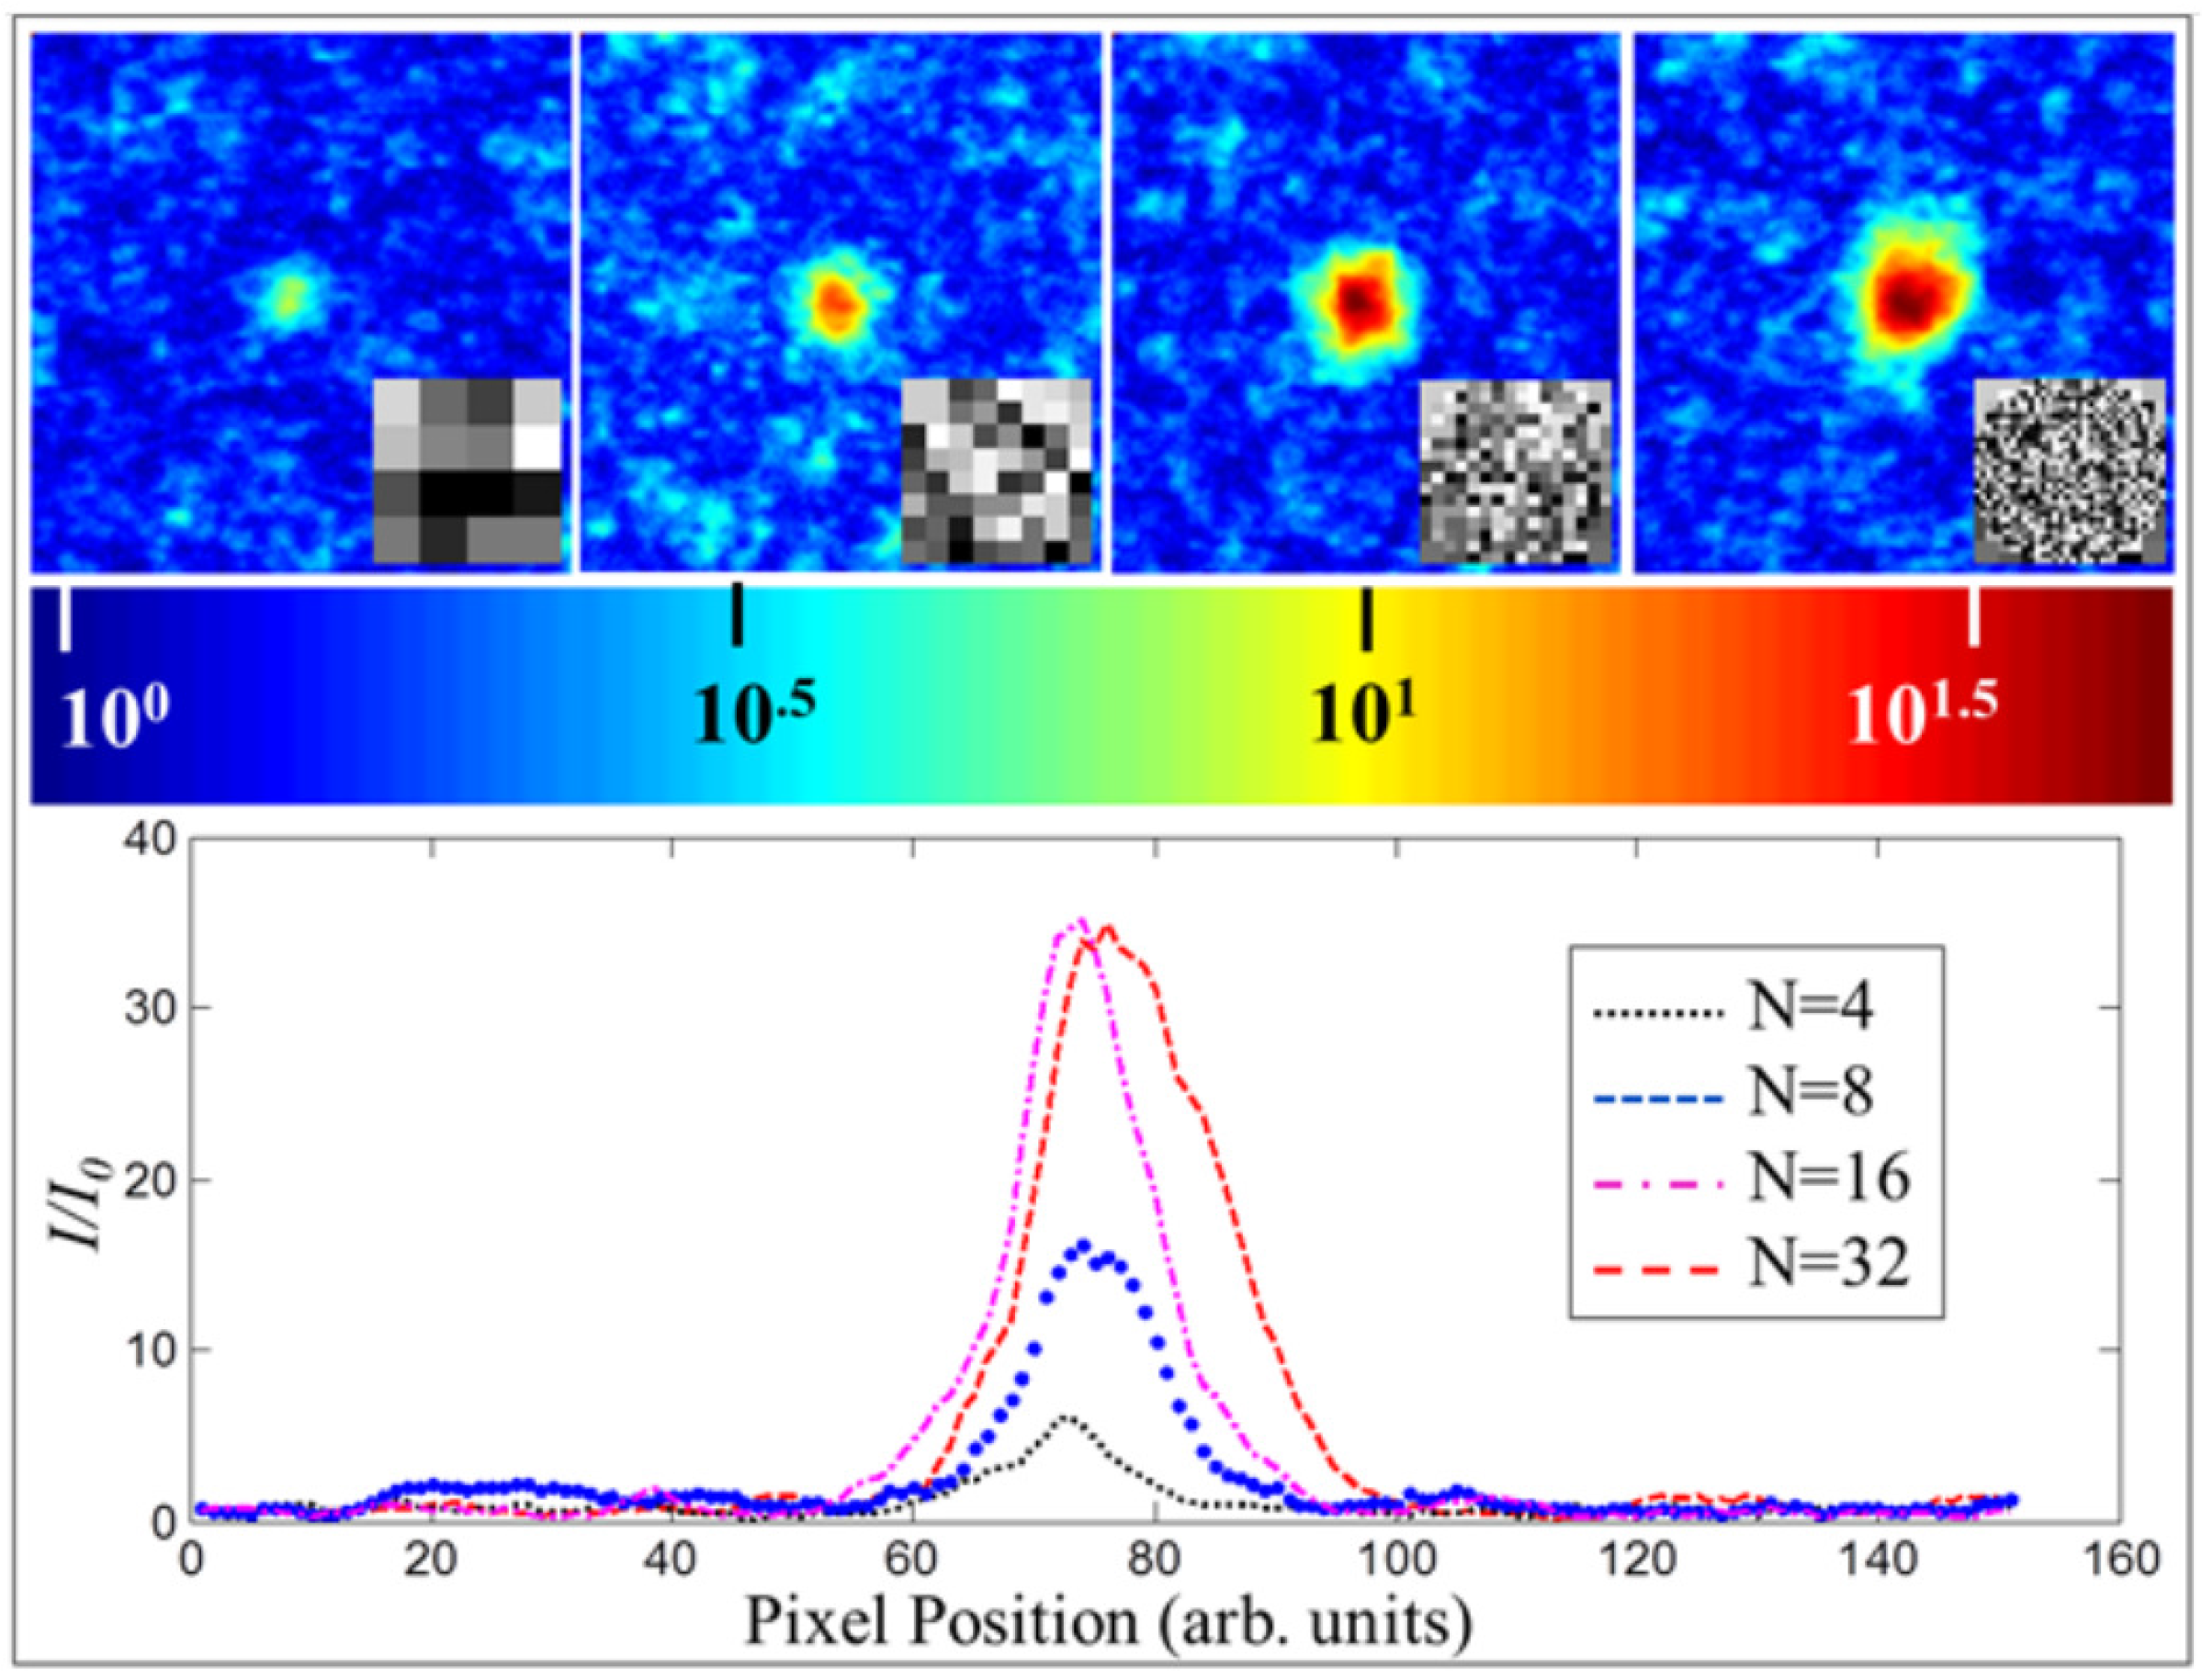
The greatest enhancement was achieved using the brushed aluminum reflector. The spot optimization for the brushed aluminum reflector is shown in
Figure 7 along with the normalized intensity cross-section. The intensity cross-sections are shown as the algorithm completes each stage of
optimizations. The cross-sections are normalized by the RMS intensity produced by a random
phase map applied to the SLM.
A single transmissive inverse diffusion experiment was conducted based on Vellekoop’s experimental setup [
9]. The white paint on glass sample was used for enhancement comparison between transmissive and reflective inverse diffusion. The results of the spot optimization and corresponding intensity cross-section are shown in
Figure 8. In reflection, background speckle size decreased as
N was increased; however, in the transmission trial, the background speckle was relatively constant for all
N. The algorithm failed to produce additional enhancement during the
stage for the baseline white paint transmission trial. Again, this is believed to be due to the decorrelation of the speckle pattern. The spot for the
stage was larger than the previous
spot. Decorrelation of the individual background speckles produced a smearing effect that produced an overall larger target spot.
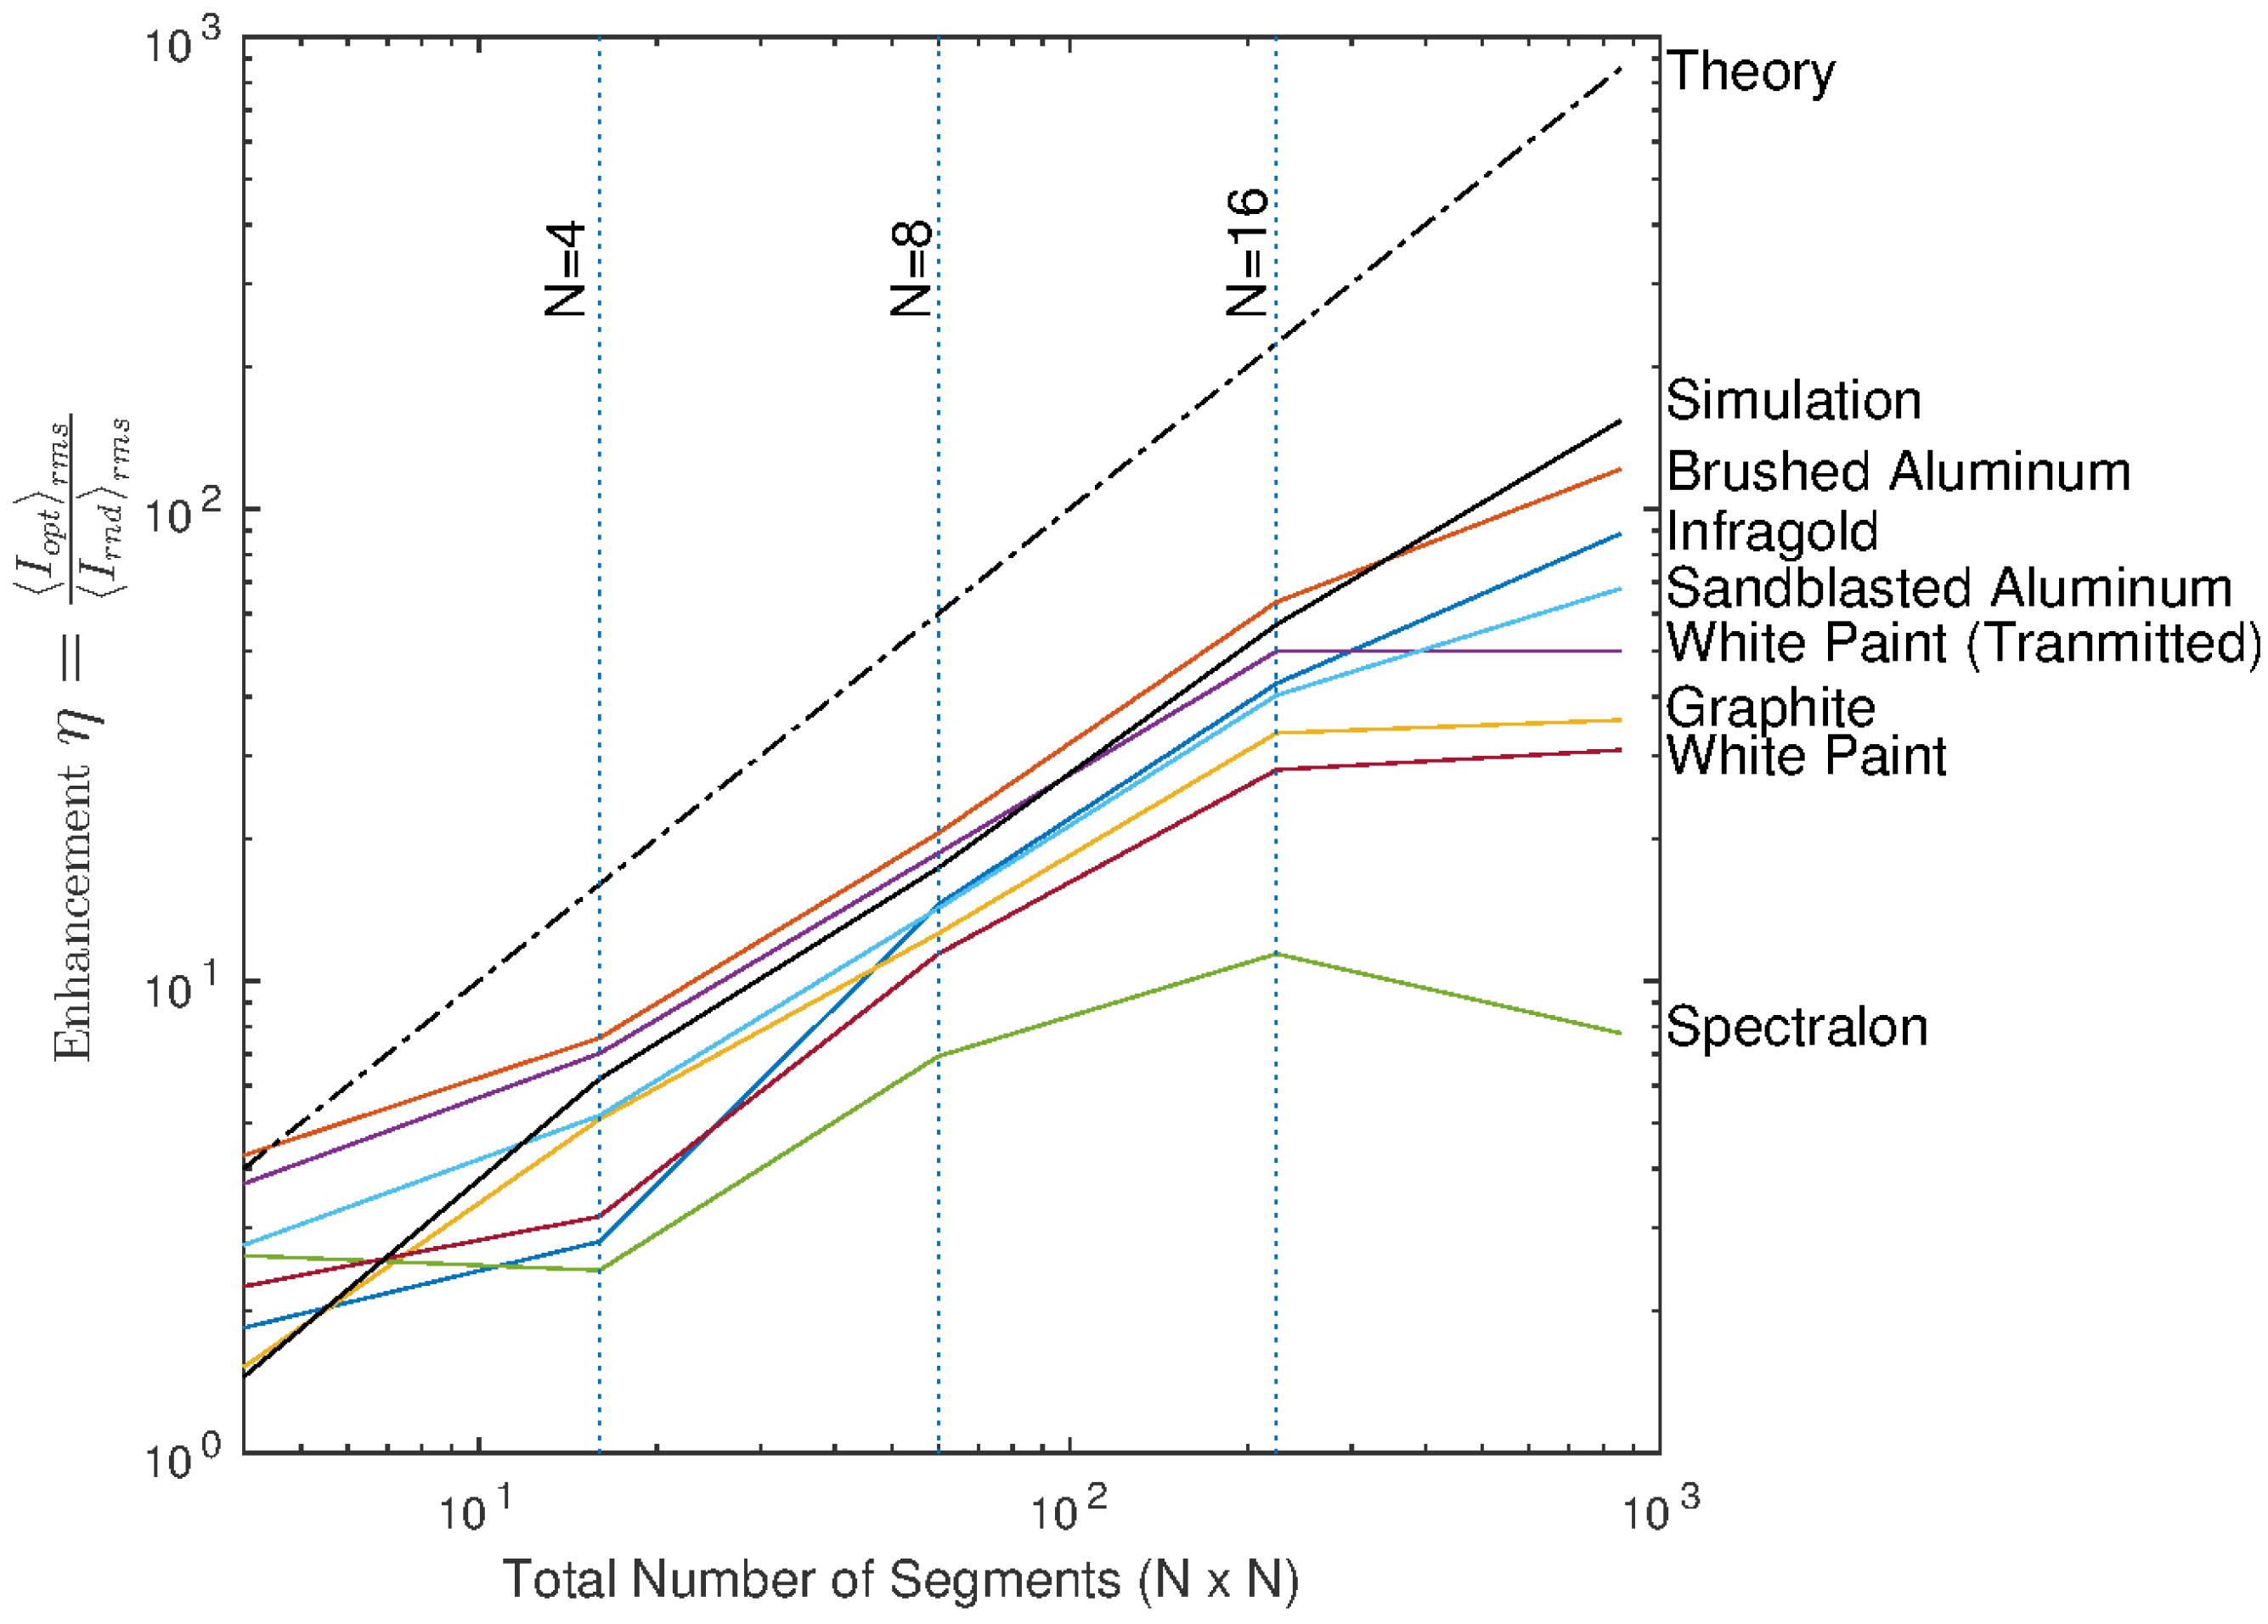
As the algorithm completes each stage of
optimizations, the enhancement is plotted as a function of total optimized SLM segments and compared with Equation (
10). The results of a simulation using a uniformly-distributed random phase reflector model with reflectivity of one are show in
Figure 9 without any added noise or decorrelations effects. The simulation and experimental data show similar trends, but less enhancement than predicted by Equation (
10). This was expected and similar to transmission experiments [
9], since the 21 phase values used for optimization represent an extremely small sample of the total phase space.
The enhancement predicted by the computer simulations corroborates the experimental data. The effects of speckle decorrelation were simulated by adding a zero-mean random Gaussian-distributed phase to the reflector model each time the intensity was calculated. The standard deviation (
) of the random phase fluctuation was dependent on the severity of decorrelation time of the material. Brushed aluminum maintained the highest correlation coefficient over time (see
Figure 5), thus experiencing the lowest amount of enhancement loss attributed to speckle decorrelation. Simulations of the metal samples corresponded to a Gaussian phase fluctuation with standard deviation of
to
. The more diffuse samples, such as graphite and white paint, matched with a standard deviation of
to
.
Figure 10 shows enhancement per iteration for a given standard deviation of the Gaussian phase fluctuation.
Spectralon
®, with its high depth of light penetration and multiple reflections, was considered similar to the random paths experienced by light when transmitted through a scattering medium. Simulations of both the circular Gaussian model from transmissive inverse diffusion and uniform phase model produced similar enhancement with the same phase fluctuation standard deviation deviation of
(see
Figure 10). The enhancement for the uniform phase model does initially rise faster than the circular Gaussian model, which is expected based on the slopes of Equations (
3) and (
10). However, due to the decorrelation effects and limited number of phase values used in the optimization process, neither model was significantly better than the other at simulating the Spectralon
® results.
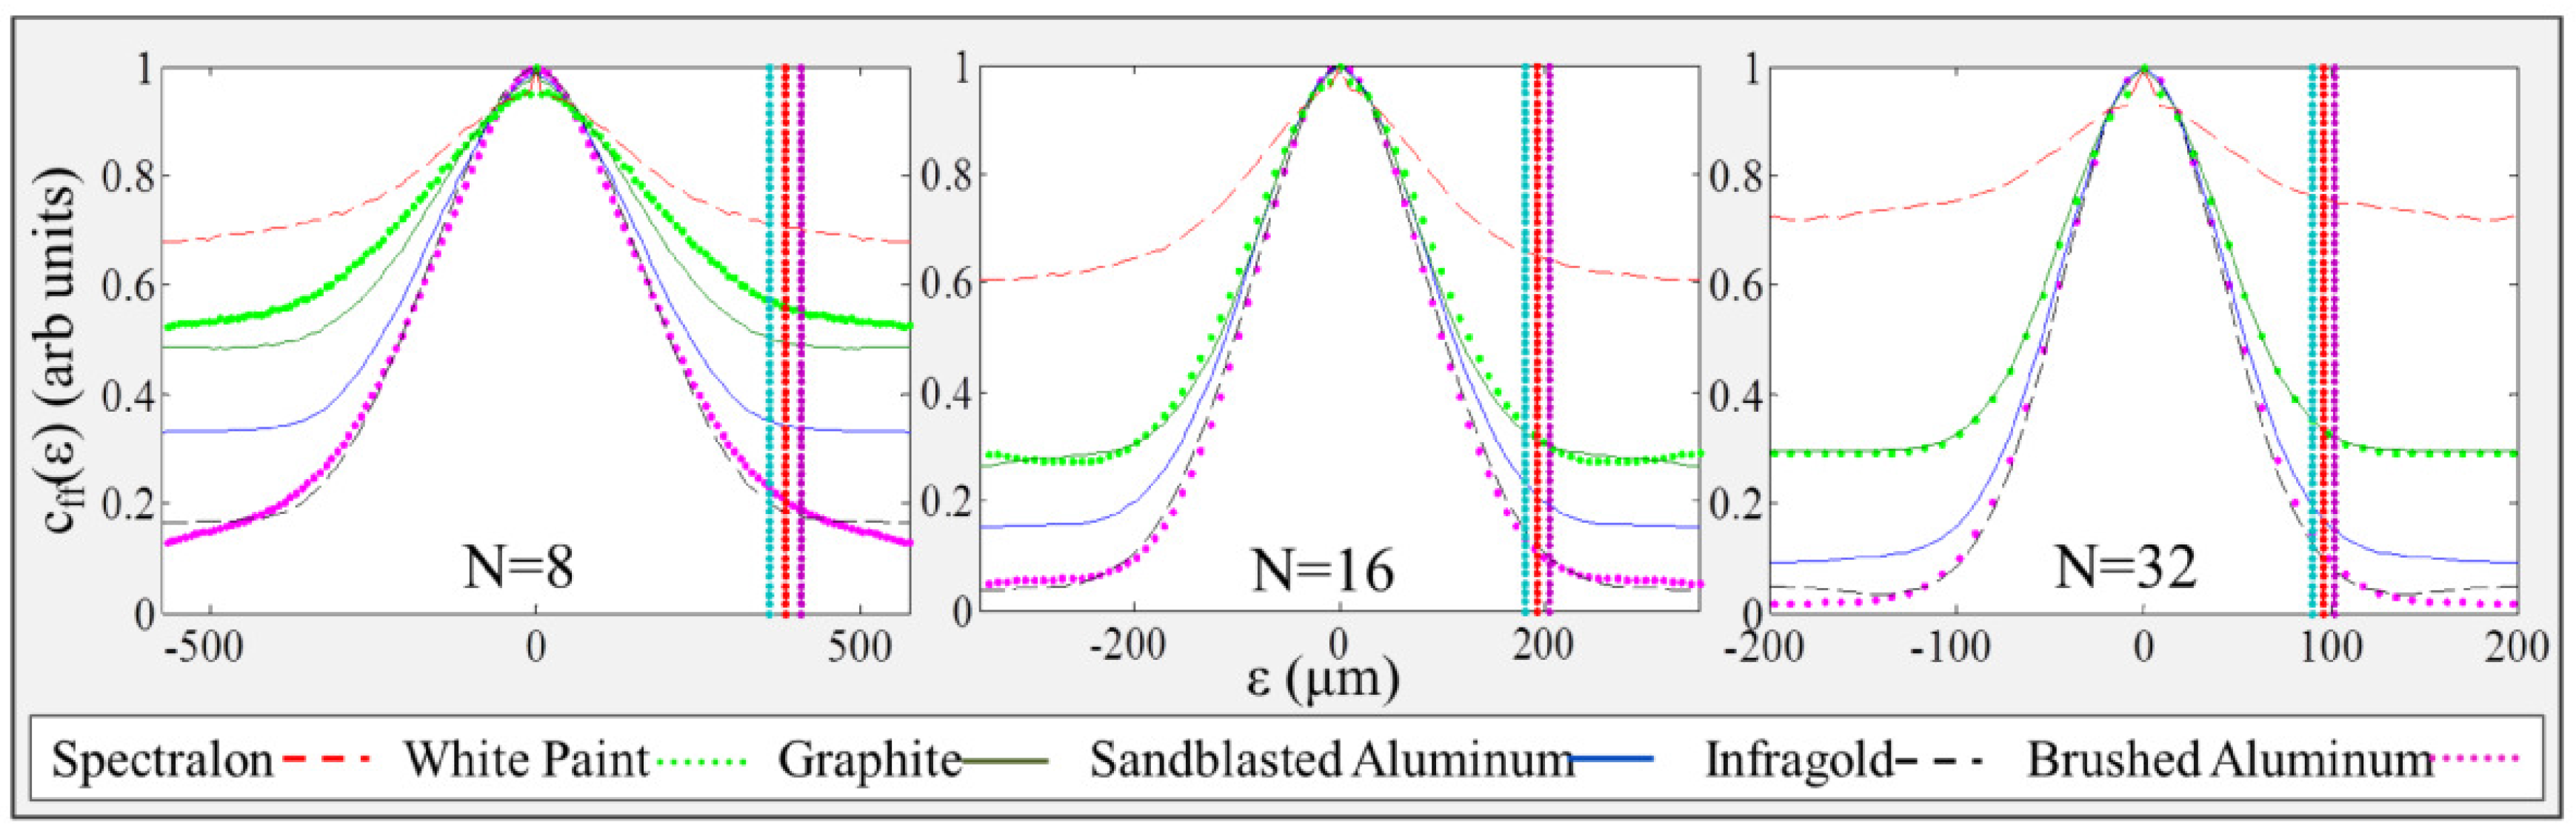
4.5. Spot Size
The relationship between SLM dimension
N and the background speckle size led to a corresponding relationship between
N and the final focused spot size. The final spot size is approximated by applying diffraction theory to the light propagating from an individual SLM segment. The relevant dimensions are shown in
Figure 11. Given that
, the focal length of lens
, the spot size at the reflector is approximated by,
where
is the width of a single square SLM segment. The final spot dimension in the observation plane is approximated by,
where
d is the width of the entire SLM.
The spot size from the CCD was determined by a one-dimensional autocorrelation on the center row of pixels for the
8, 16 and 32 stages. The autocorrelation for each of the reflector materials is shown in
Figure 12. The vertical lines in the figure mark the predicted size in red with upper and lower bounds of the measured spot in cyan and magenta, respectively. The measured full width from the CCD was consistent with the spot sizes predicted by Equation (
19) of 384
m, 192
m and 96
m for
8, 16 and 32, respectively.
4.6. Non-Mechanical Beam Steering
Non-mechanical beam steering, in the context of reflective inverse diffusion, refers to the ability to change the location of the focus spot in the observation plane without any physical modification of the experiment setup; only phase modulation from the SLM was used. The algorithm, with pre-optimization for through 16, sequentially targeted the four corners of the CCD, which represents a deflection angle of . The enhancement of the four target corners was comparable with less than a 15% difference between maximum and minimum enhancement.
The size of a playing card with dimensions of 88 mm × 63 mm represents a maximum deflection angle of horizontally and vertically and was chosen to demonstrate beam steering over a larger angle. The brushed aluminum reflector lost almost 60% of peak spot enhancement when the target location moved the maximum diagonal dimension. The reduction in enhancement corresponds to the focus spot moving from the specular region of the bidirectional reflectance distribution function (BRDF) into the diffuse region.
The spot enhancement from the diffuse region of reflection was measured for each of the reflector materials and compared with its specular reflection results. The specular enhancement was measured using the same setup as described in
Section 3.1, and the algorithm was allowed to run with pre-optimization from
2 through 16. The CCD was then moved to the diagonal displacement of 108.2 mm (
) to approximate the diffuse region of reflection while maintaining a distance of 40 ± 0.5 cm from the reflector. The algorithm was run with pre-optimization from
2 through 16. The results are plotted in
Figure 13. Brushed aluminum achieved a specular enhancement of approximately 60, but only achieved an enhancement of approximately four in the diffuse region. The white paint and graphite reflectors both achieved a specular enhancement of approximately 30 and diffuse enhancements of approximately six and two, respectively. Sandblasted aluminum and Infragold
® both achieved specular enhancements of approximately 40 and diffuse enhancements of 20. Spectralon
® achieved a specular enhancement of 16 and a diffuse enhancement of 12, retaining 75% of its specular enhancement in the diffuse region due to its highly Lambertian reflective properties.


