Article

Self-Seeded RSOA-Fiber Cavity Lasers vs. ASE Spectrum-Sliced or Externally Seeded Transmitters—A Comparative Study

1
Institute of Electromagnetic Fields (IEF), ETH Zurich, 8092 Zurich, Switzerland
2
III-V Lab, a Joint Lab of Alcatel-Lucent Bell Labs France, Thales Research and Technology and CEA Leti, Route de Nozay, 91460 Marcoussis, France
3
Orange Labs, 2 Avenue Pierre Marzin, 22307 Lannion, France
4
Politecnico di Milano, Dipartimento di Elettronica Informazione e Bioingegneria, 20133 Milano, Italy
5
School of Electrical Engineering, University of Belgrade, Belgrade 11000, Serbia
*
Author to whom correspondence should be addressed.
Appl. Sci. 2015, 5(4), 1922-1941; https://doi.org/10.3390/app5041922
Submission received: 12 October 2015 / Revised: 30 November 2015 / Accepted: 3 December 2015 / Published: 17 December 2015
(This article belongs to the Special Issue Fibre Lasers: From Underlying Science and Technology to Applications)

Abstract

:
Reflective semiconductor optical amplifier fiber cavity lasers (RSOA-FCLs) are appealing, colorless, self-seeded, self-tuning and cost-efficient upstream transmitters. They are of interest for wavelength division multiplexed passive optical networks (WDM-PONs) based links. In this paper, we compare RSOA-FCLs with alternative colorless sources, namely the amplified spontaneous emission (ASE) spectrum-sliced and the externally seeded RSOAs. We compare the differences in output power, signal-to-noise ratio (SNR), relative intensity noise (RIN), frequency response and transmission characteristics of these three sources. It is shown that an RSOA-FCL offers a higher output power over an ASE spectrum-sliced source with SNR, RIN and frequency response characteristics halfway between an ASE spectrum-sliced and a more expensive externally seeded RSOA. The results show that the RSOA-FCL is a cost-efficient WDM-PON upstream source, borrowing simplicity and cost-efficiency from ASE spectrum slicing with characteristics that are, in many instances, good enough to perform short-haul transmission. To substantiate our statement and to quantitatively compare the potential of the three schemes, we perform data transmission experiments at 5 and 10 Gbit/s.

Graphical Abstract

1. Introduction

The development of low-cost colorless sources has become a major research topic. They are needed to make the widespread deployment of wavelength division multiplexed passive optical networks (WDM-PONs) practical [1,2]. Relatively new alternatives are self-seeded reflective semiconductor optical amplifier fiber cavity lasers (RSOA-FCLs) [3]. The RSOA-FCLs’ colorless feature emanates from the automatic and passive self-tuning of their emission wavelength by only a WDM filter positioned at a remote node (RN). The colorless feature allows for the mass production and installation of identical upstream devices at all optical network units (ONUs) of a WDM-PON. Having only one common source at the ONUs will lower the cost of WDM-PONs, which has been a burden for widespread deployment [4]. In addition, a passive wavelength allocation by the PON infrastructure simplifies the wavelength management process. Thus, the availability of low-cost colorless sources, such as RSOA-FCLs, allows for the implementation of WDM-PONs that offer high bandwidth. These could, for instance, be used for mobile fronthaul networks (MFHs), which will be discussed in the next subsection [1,5].
Quite a few other colorless transmitter schemes are currently under discussion. The two key contenders are:
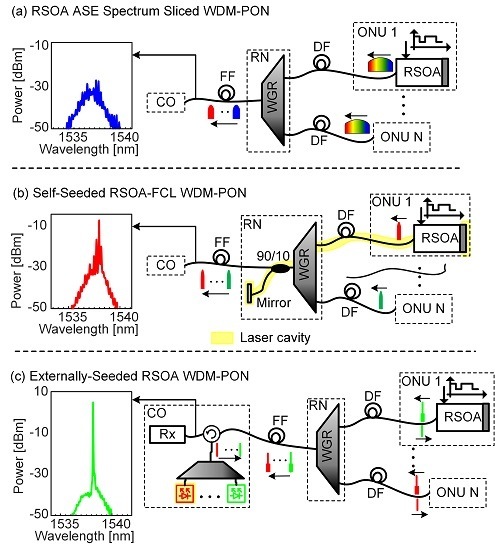
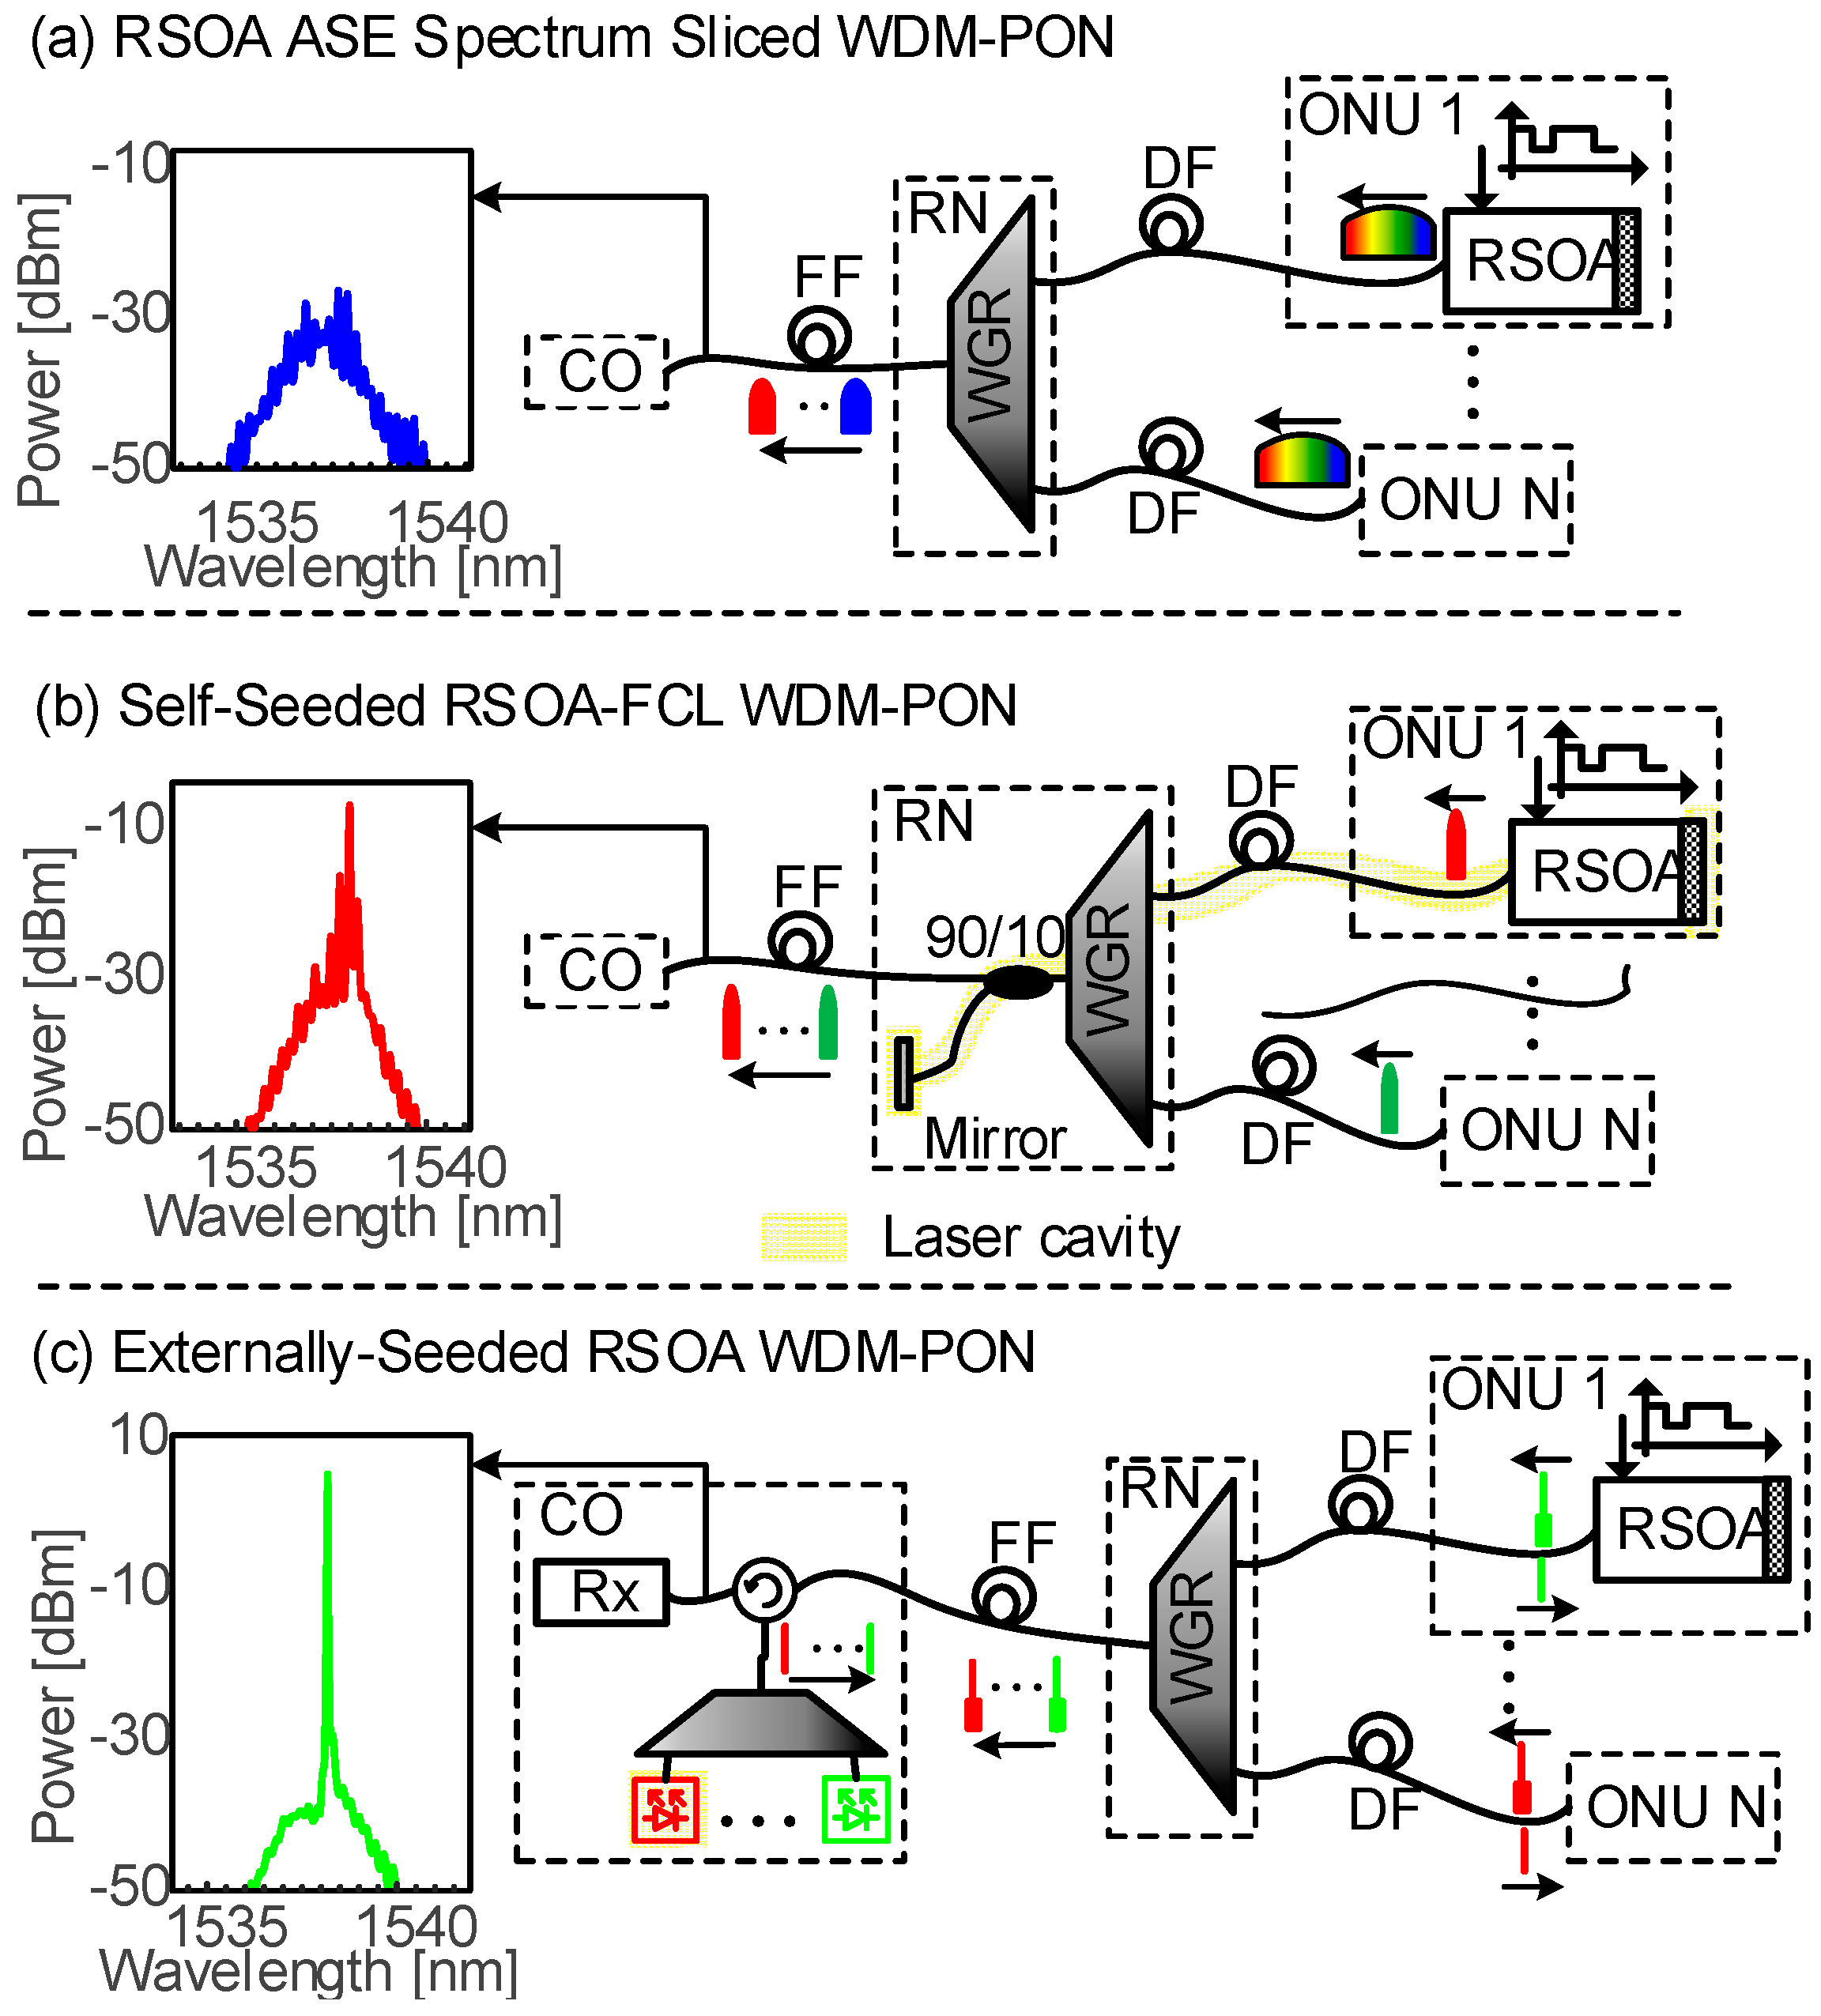
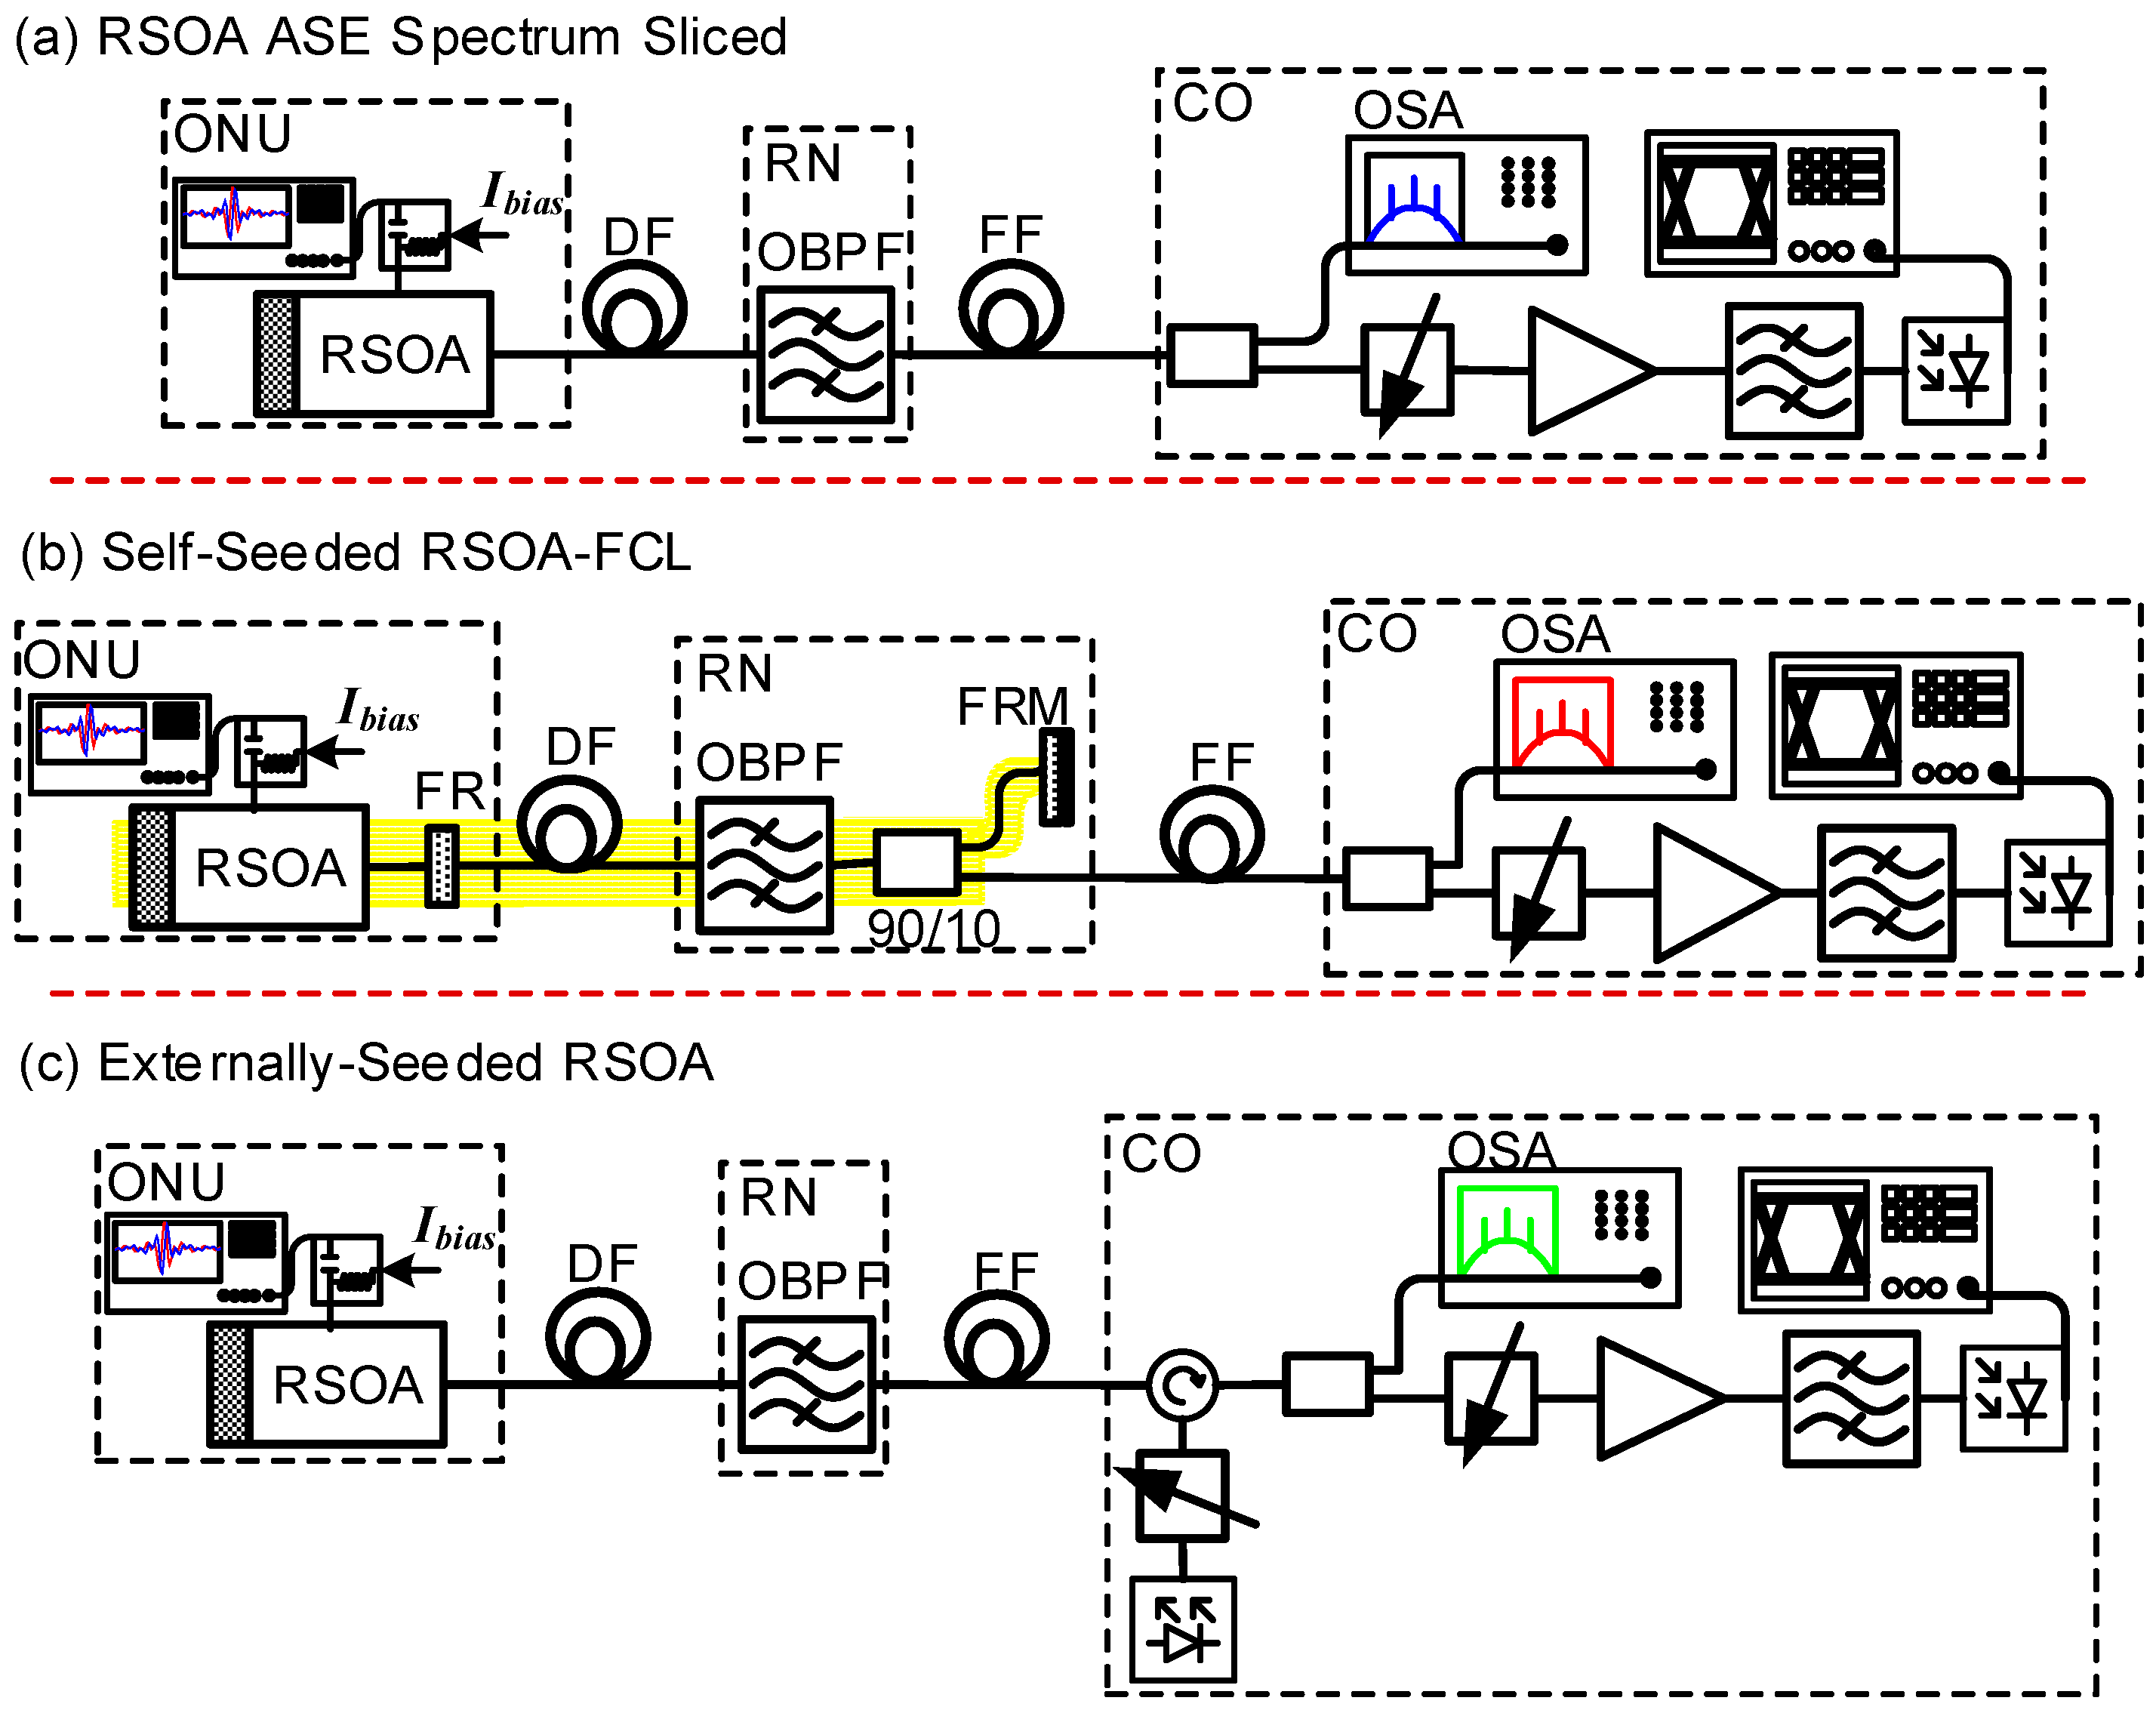
  • Amplified spontaneous emission (ASE) spectrum-sliced schemes: These are the simplest low-cost solutions available. Directly modulated broadband light sources such as light-emitting diodes (LEDs) [6,7,8,9] or RSOAs [10,11] can be used for upstream (US) transmission. As an example, Figure 1a shows an RSOA-based ASE spectrum-sliced WDM-PON. The upstream data is directly encoded onto the broadband ASE of the RSOAs, which are placed at the ONUs. The waveguide grating router (WGR, WDM MuxDeMux) at the RN slices the modulated ASE spectrum and sends a sliced band upstream. The US spectral band from each ONU is determined by the WGR port to which the individual ONUs are connected. Even if the low cost of LEDs and RSOAs make this scheme attractive, their modulation speeds are limited to 1 Gbit/s over less than 10 km of transmission reach. The ASE amplitude noise and thus the high relative intensity noise (RIN) are limiting factors. There is also a high filtering power loss during spectral slicing. In addition, the broad bandwidth of each spectrum slice makes the scheme highly sensitive to chromatic dispersion.
  • Externally seeded RSOA schemes: These offer higher reach and speed at a higher investment. The idea is to use a bank of lasers at the central office (CO), one for each ONU, which send continuous wave (cw) light downstream (DS) to the ONUs, as presented in Figure 1c [12,13,14,15,16]. The WGR splits and distributes the different wavelengths to the respective ONUs. The RSOAs at the ONUs amplify and directly encode data onto the seeding cw light and send them back upstream. The amplification of the DS cw light by the RSOAs compensates the transmission power loss by offering a higher link power budget. The chromatic dispersion penalty for this scheme is also more relaxed than that of the spectrum-sliced scheme. Of course, all the improvement comes at the price of placing relatively expensive lasers at the CO.
Figure 1. Scenarios showing how the three sources would be integrated in a WDM-PON. (a) RSOA ASE spectrum-sliced scheme: An upstream (US) signal can be directly modulated onto the ASE of the RSOAs at the optical network units (ONUs). The waveguide grating router (WGR) slices the ASE into bands and sends them upstream; (b) Self-seeded RSOA-FCL: A lasing resonant cavity, shown by the yellow shading, is formed between the RSOA at the ONU and a mirror at the remote node (RN). The US signal is encoded onto this multimode laser signal; (c) Externally seeded RSOA: A bank of lasers at the central office (CO) send cw light downstream (DS). The WGR distributes the seeding light to the respective ONUs. The RSOAs at the ONU encode data, amplify the light, and send them upstream. The corresponding measured output spectra for each scheme are plotted as insets on the left side. FF: feeder fiber, DF: distribution fiber.
Applsci 05 01922 g001
The question is, then, if there is a colorless transmitter that is more economical than an externally seeded RSOA scheme and still offers a better performance over the ASE spectrum-sliced source. We believe this question is answered with what is called the self-seeded RSOA-FCL transmitter shown in Figure 1b [3,17,18,19,20]. In contrast to the externally seeded scheme, the RSOA-FCL does not need extra laser sources. As the name indicates, the seeding light is the ASE emitted by the RSOA itself. A simple mirror at the RN reflects part of the emitted ASE back to the RSOA. This cuts the cost significantly. The RSOA at the ONU and a mirror at the RN form the resonant cavity that is imbedded in the distribution fiber trunk of the PON. The emission wavelength of the laser is automatically tuned by the port of the WGR to which the ONU is connected. The laser characteristics lead to a narrower spectrum, lower RIN, and a higher power compared to the ASE spectrum-sliced scheme, thus improving the transmission performance.
In this paper, we compare the self-seeded RSOA-FCL with the ASE spectrum-sliced and the externally seeded RSOA schemes, as shown in Figure 1. Both simulation and experimental results show that the RSOA-FCL outperforms the ASE spectrum-sliced scheme. With a simple architecture and low cost, the RSOA-FCL offers more power, lower RIN, narrower spectrum and a ~5 dB more signal-to-noise ratio (SNR). The externally seeded scheme delivers an additional ~5 dB SNR over the RSOA-FCL. However, this is paid for through the expensive extra lasers needed. Finally, we perform 5 and 10 Gbit/s transmission experiments using these schemes. The results show that the RSOA-FCL is a cost-efficient solution with a performance in between of the ASE spectrum-sliced and the externally seeded sources. Thus, the RSOA-FCL is a practical colorless source for short-reach WDM-PONs with transmissions up to 10 Gbit/s.
The paper is organized as follows. First, we use a mathematical model [21] to describe and compare the ASE spectrum-sliced and RSOA-FCL schemes. Next, we experimentally characterize the three schemes by measuring output power, spectrum and RIN. Finally, the performances of the three are compared by measuring their SNR and data transmission up to 10 Gbit/s.

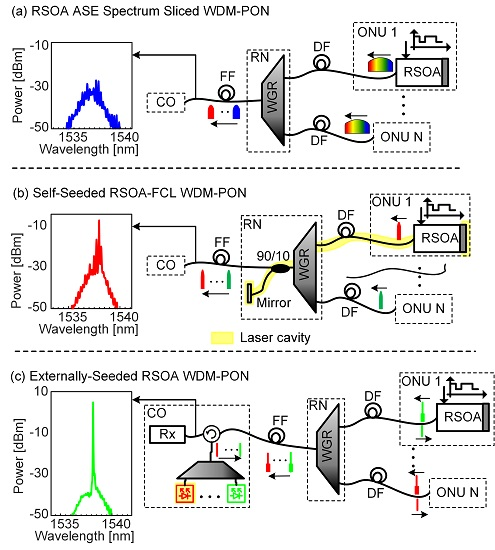
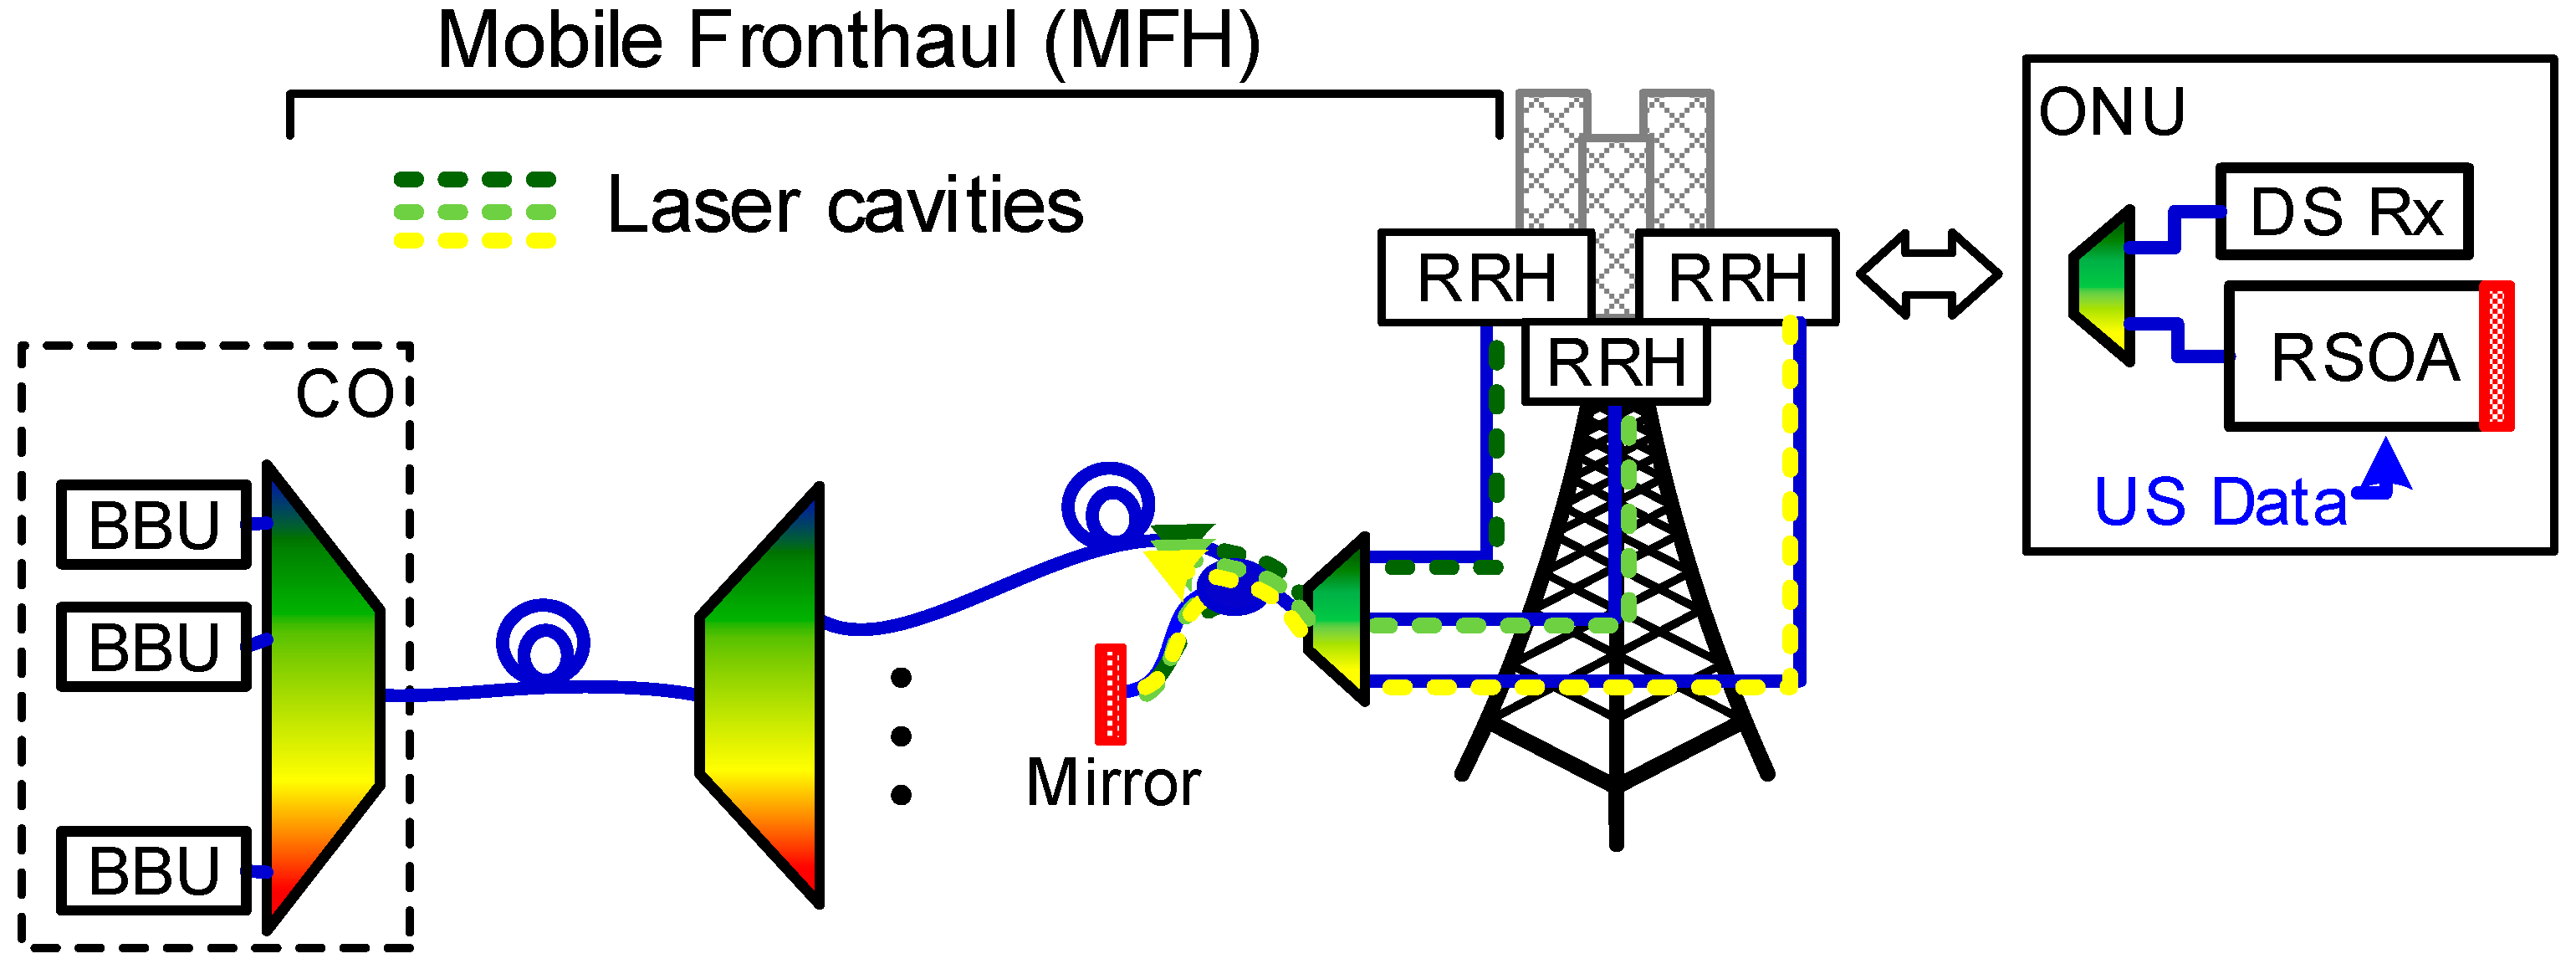
2. Mobile Fronthaul WDM-PON with RSOA-FCL as a Colorless Source

As an example of where low-cost, high-speed PONs are expected to emerge in masses, we discuss the MFH application scenario. The MFH is the fiber network interconnecting the base station antenna with the CO. The MFH is an integral part of the cloud radio access network (C-RAN) architecture [22,23]. In the C-RAN, the signals from various base stations are processed at one location. The remote radio head (RRH) is placed close to the antennae.
The base band units (BBUs), where the digital signal processing takes place, are then located at the central office (CO). Indeed, this scheme requires high data rate links – a MFH – between the RRH and the BBU. As a protocol, C-RAN uses the common public radio interface (CPRI) to transmit a high bitrate digital signal over the MFH [5,24]. The CPRI line rates range from 614.4 Mbit/s for the CPRI option 1 to 10.14 Gbit/s for CPRI option 8 [24]. These line rate requirements of the CPRI are very high compared to the transmitted radio signal bandwidth. This is because, in CPRI, the analog radio signals are sampled at high speed and transmitted as digital signals from the RRH to the BBU. For example, an up-to-10-Gbit/s link is needed to transmit a 20 MHz radio signal [25]. Therefore, a simpler solution would be to transmit signals by WDM-PONs that rely on cost-efficient transmitters, such as self-seeded RSOA-FCLs.
Figure 2 shows a schematic of a MFH link. The CO consists of a cluster of BBUs. The multiple RRHs may be offset by up to 5 km from the CO [1]. A WDM-PON may now be used to build the MFH that links the multiple RRHs to the BBUs at the CO. The ONUs at the RRHs consist of a downstream (DS) receiver (Rx) and an upstream (US) data transmitter. The transmitter comprises a RSOA, which acts as a directly modulated colorless source. Lasing is obtained through the cavity, which extends from one highly reflective facet of the SOA up to another mirror behind a WGR filter. This way the RSOA source within the mirrors forms a long Fabry-Perot laser cavity [1,5,26,27]. The color dashed lines indicate the lasing cavities.
Figure 2. Arrangement of the self-seeded RSOA-FCL in a WDM-PON-based mobile fronthaul (MFH) network as an upstream transmitter. CO: central office, BBU: base band unit, US: upstream, DS: downstream, ONU: optical network unit, RRH: remote radio head.
Applsci 05 01922 g002

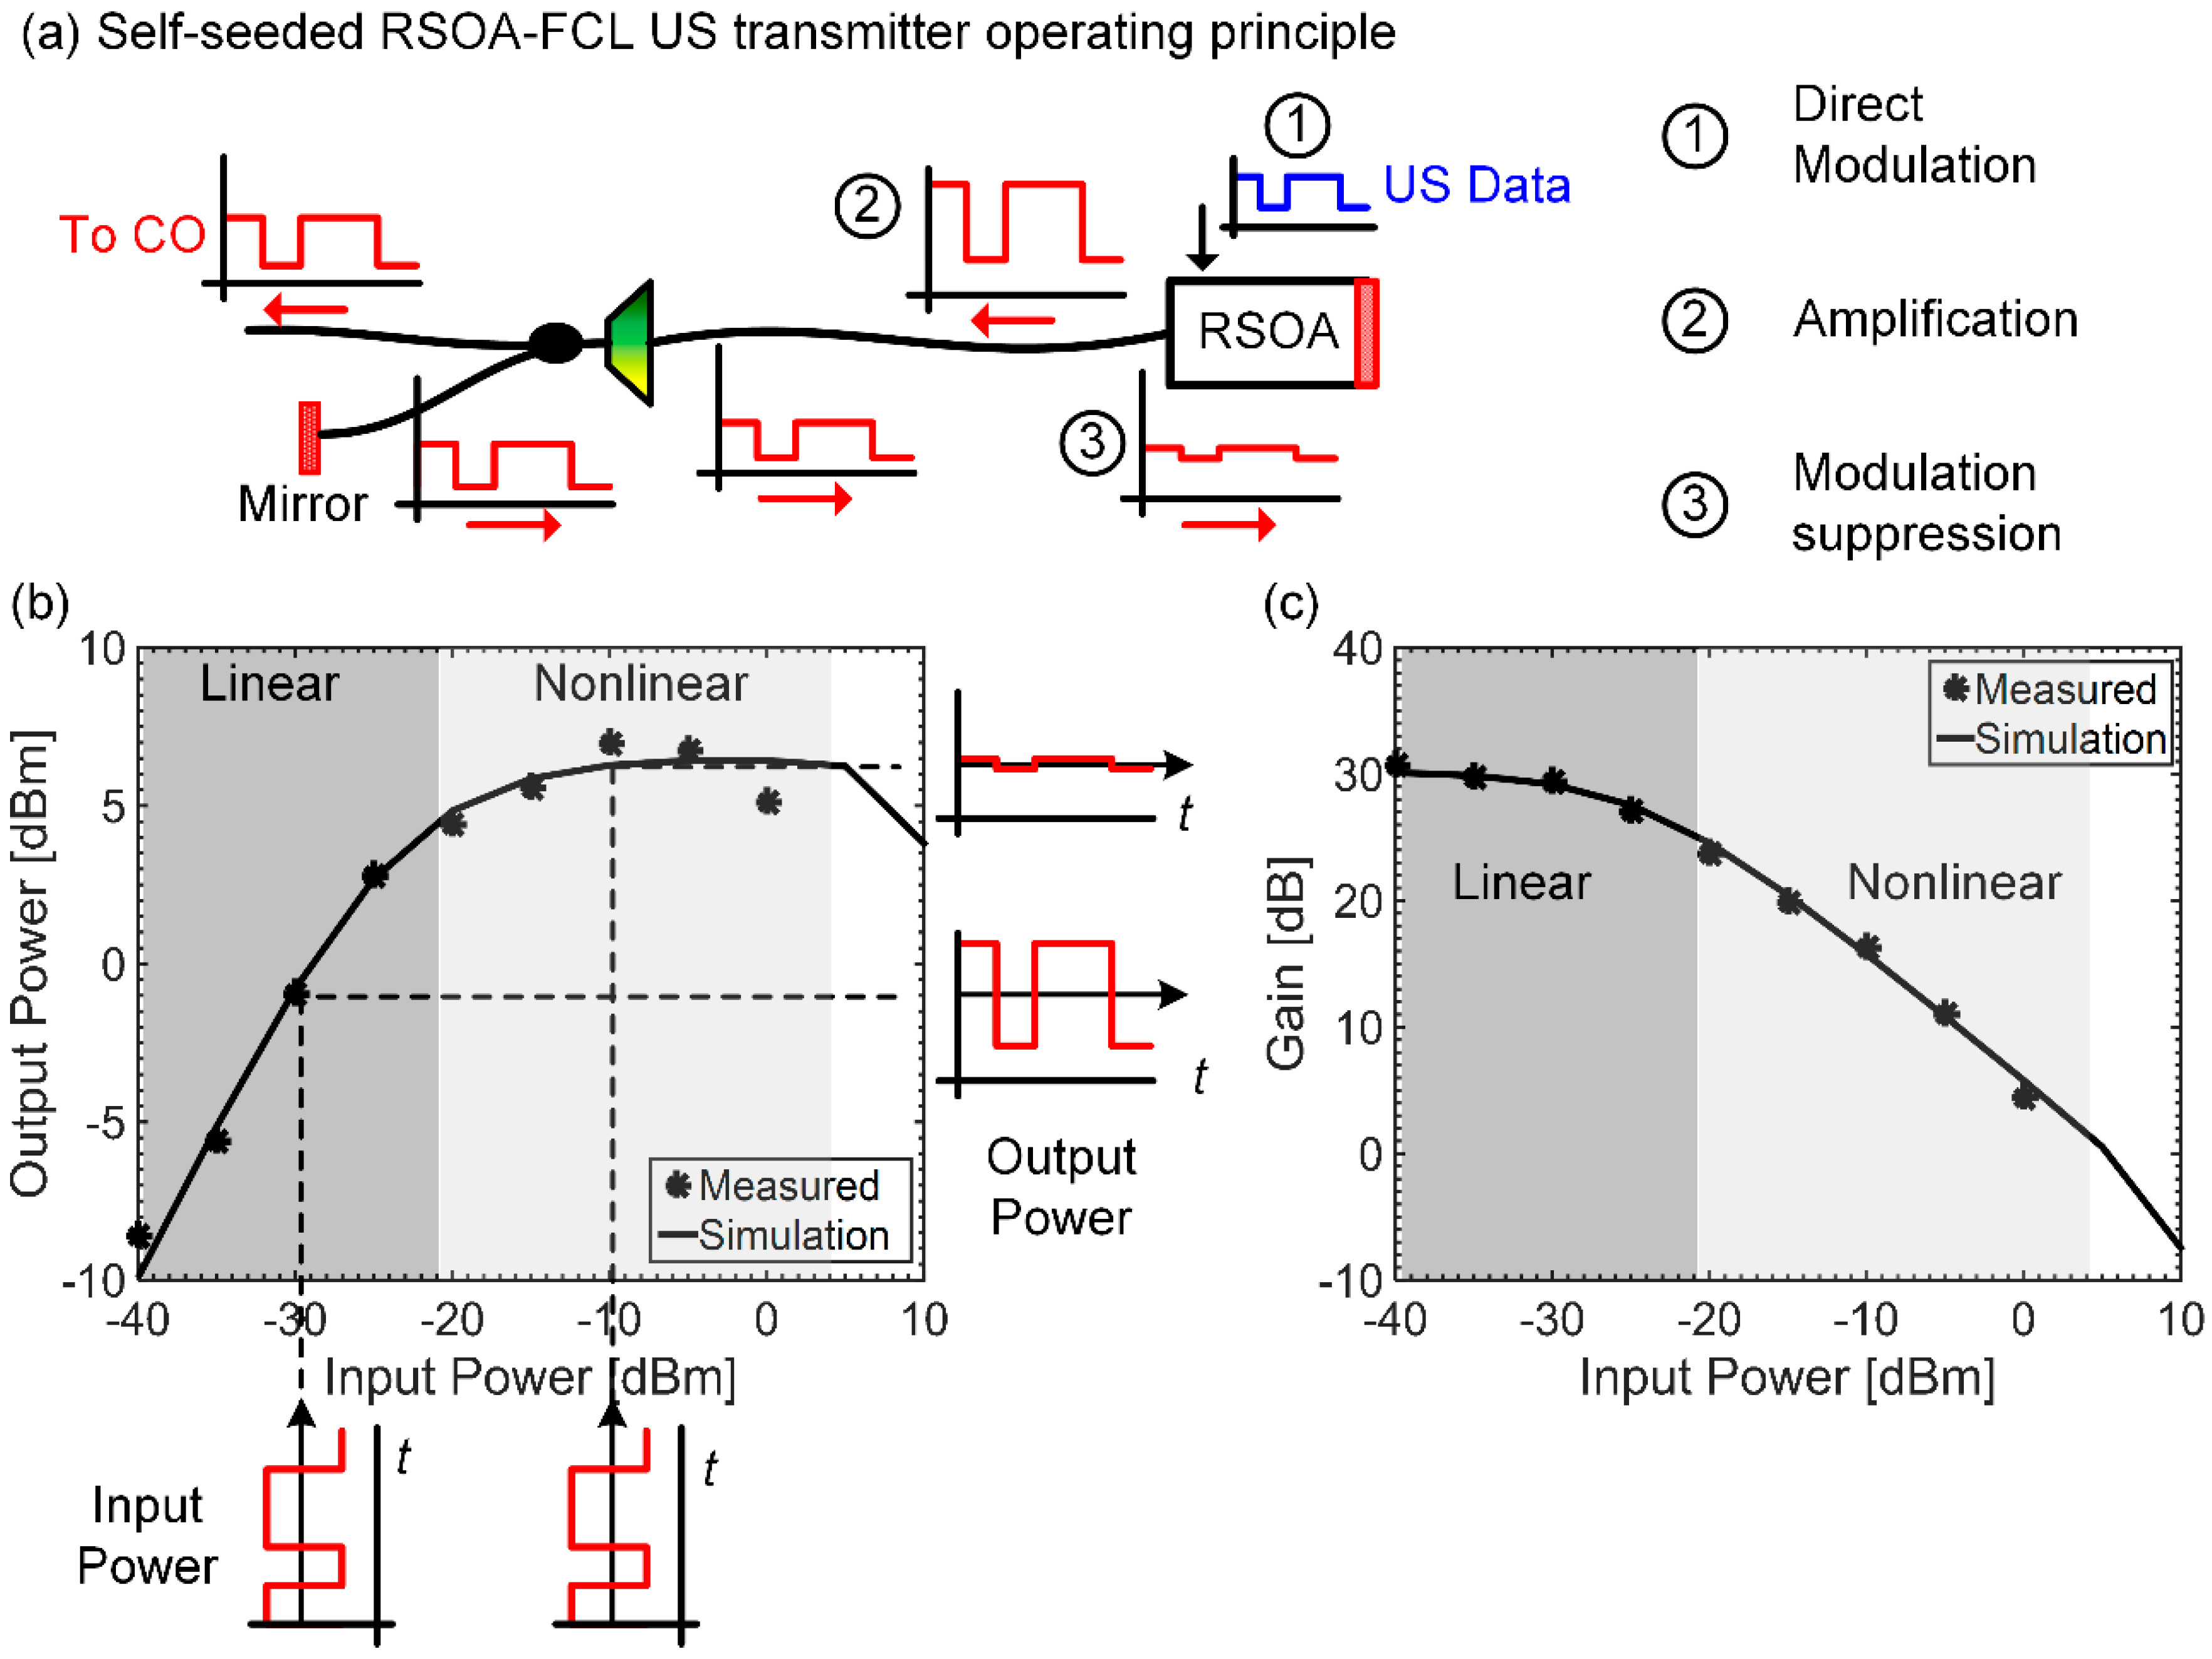
3. Operating Principle of the RSOA-FCL

The operating principle of the RSOA-FCL as an US transmitter in the MFH is depicted in Figure 3a. First, for the RSOA-FCL to be used as a transmitter, the RSOA performs three functionalities simultaneously:
(1)
It is used as a modulator to encode the US data onto the optical field;
(2)
It acts as a gain section of the Fabry-Perot fiber cavity and thus has to compensate for the cavity losses in order to achieve lasing;
(3)
It nonlinearly suppresses the residual reflected modulation on the incoming reflected light.
In the following we are going to explain the nonlinear suppression of the incoming signal in more detail.
We start the discussion with Figure 3b,c, which show plots of the output power and the gain, respectively, of a typical RSOA for varying input power. The shaded regions emphasize the linear and nonlinear operation regions based on the input power. In the linear region, the RSOA provides a relatively constant gain such that the input power and output power have a linear dependence. In the nonlinear region, the gain is decreasing for a larger input power. Figure 3b also shows how an incoming signal is either linearly amplified if its input power is weak, or nonlinearly suppressed if its input power is strong [28]. Thus, for the RSOA-FCL to suppress an input signal, the reflected incoming signal needs to be operated in the nonlinear region of the RSOA.
Figure 3. Operation principle of the RSOA-FCL. (a) RSOA-FCL with the three functions of the RSOA: (1) direct modulation; (2) amplification and (3) modulation suppression; (b) Output power and (c) gain vs. input power for RSOA. The RSOA static characteristics have two regions: a linear region where the input and output powers are linearly related (the gain is flat) and a nonlinear region where the output power does not change for increasing input power (the gain is suppressed for higher input power). Driving the RSOA in the nonlinear region allows operation such that modulation is suppressed.
Applsci 05 01922 g003

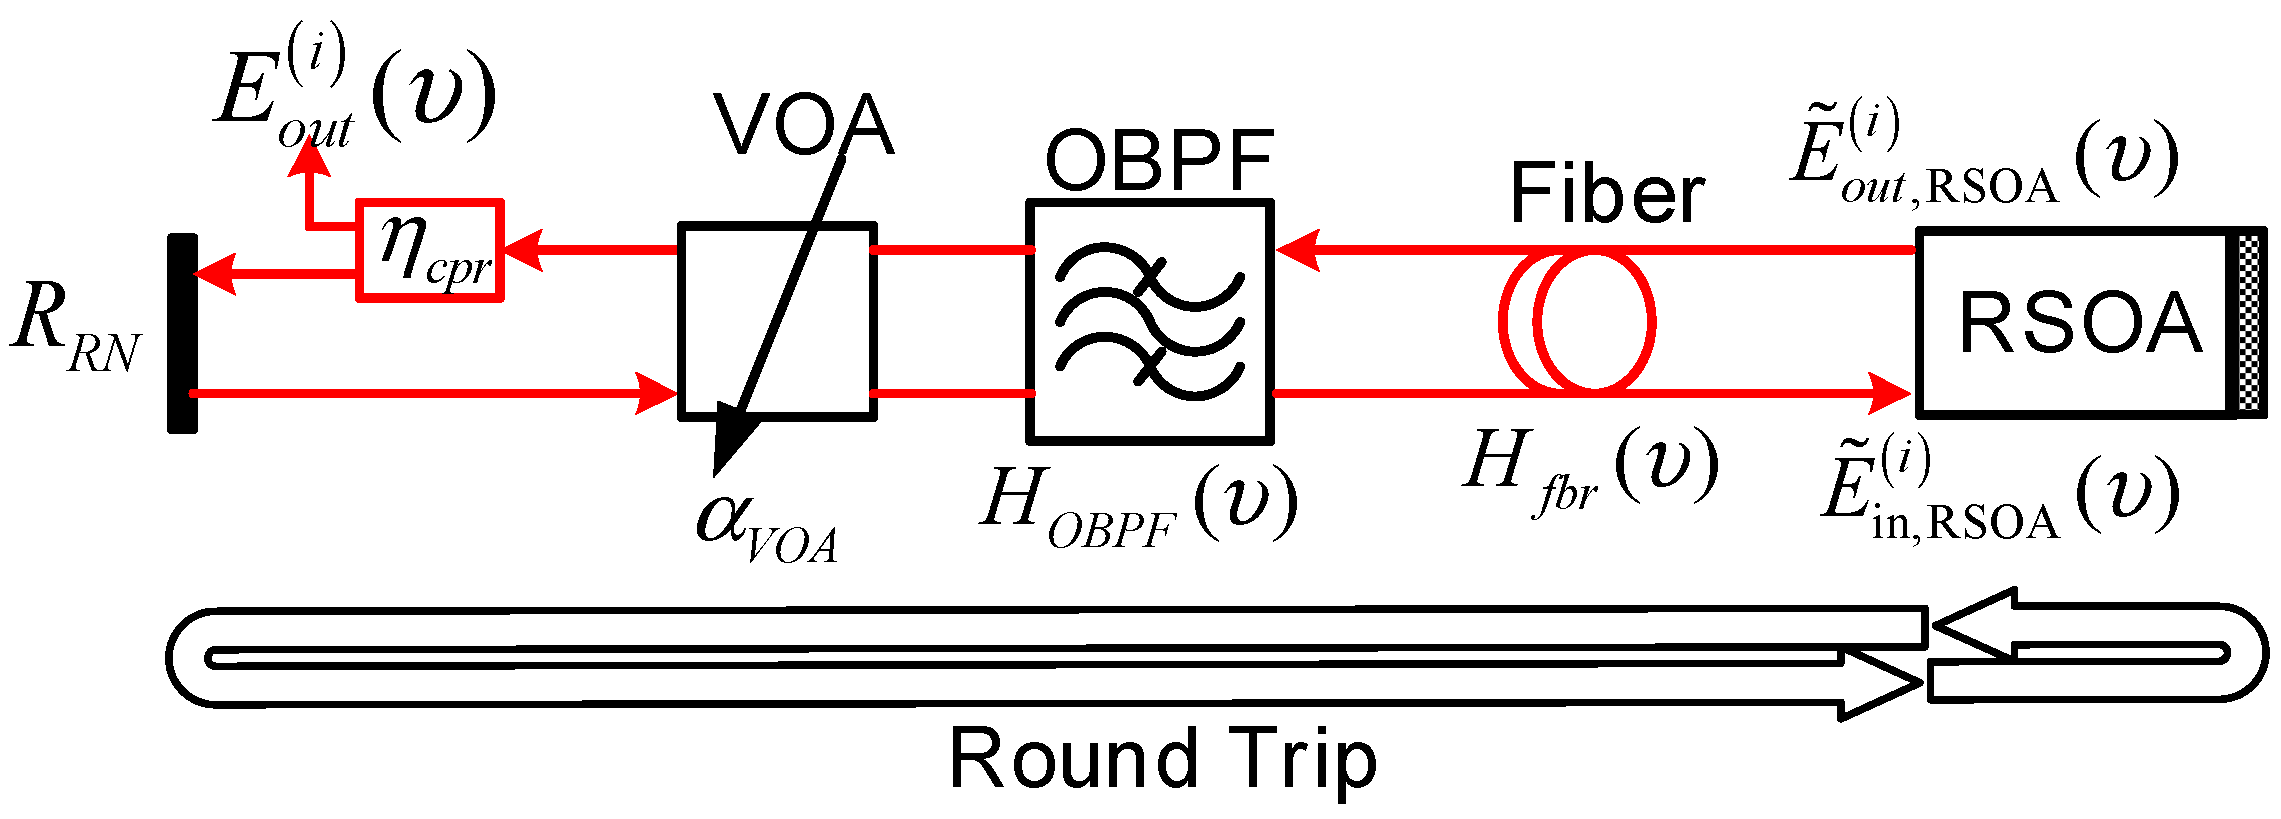
4. Theoretical Modeling of RSOA-FCL
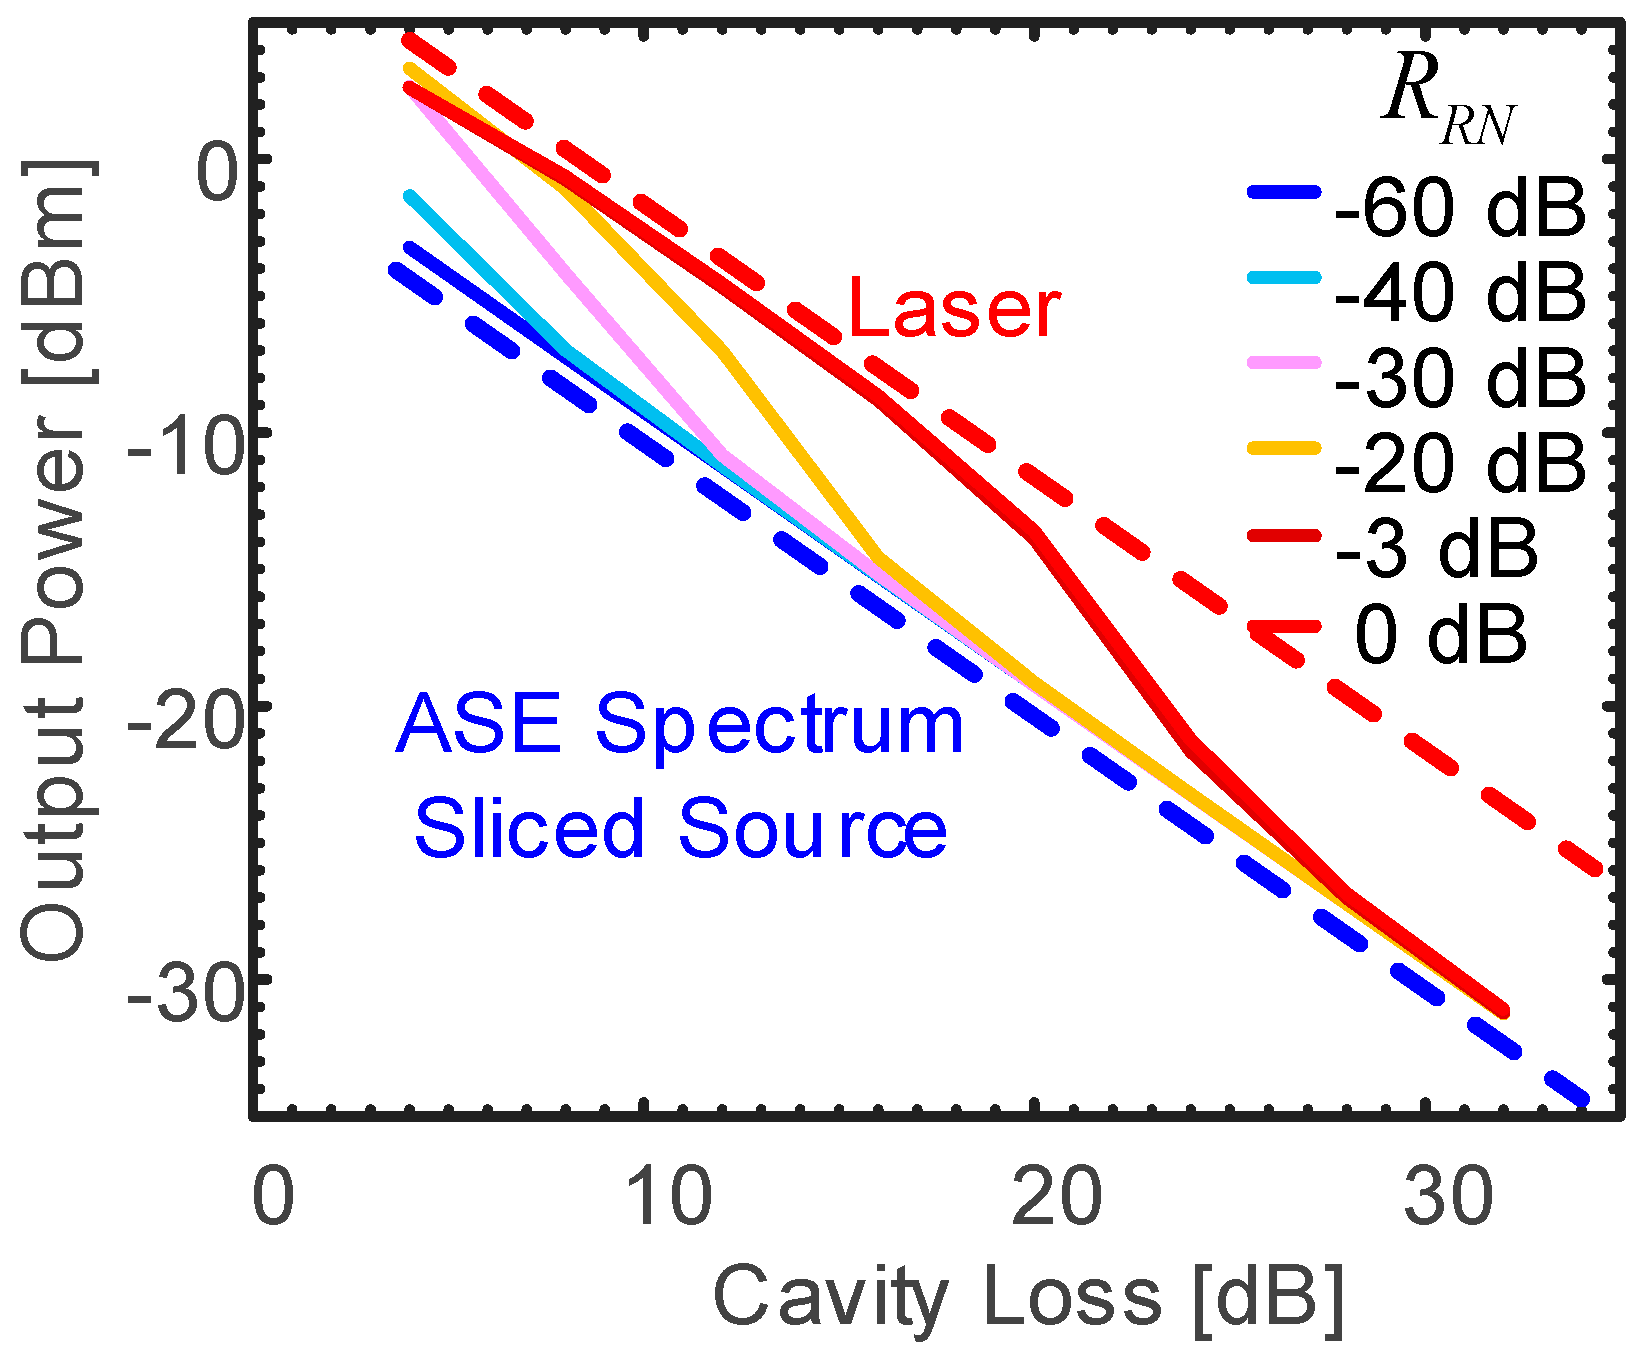
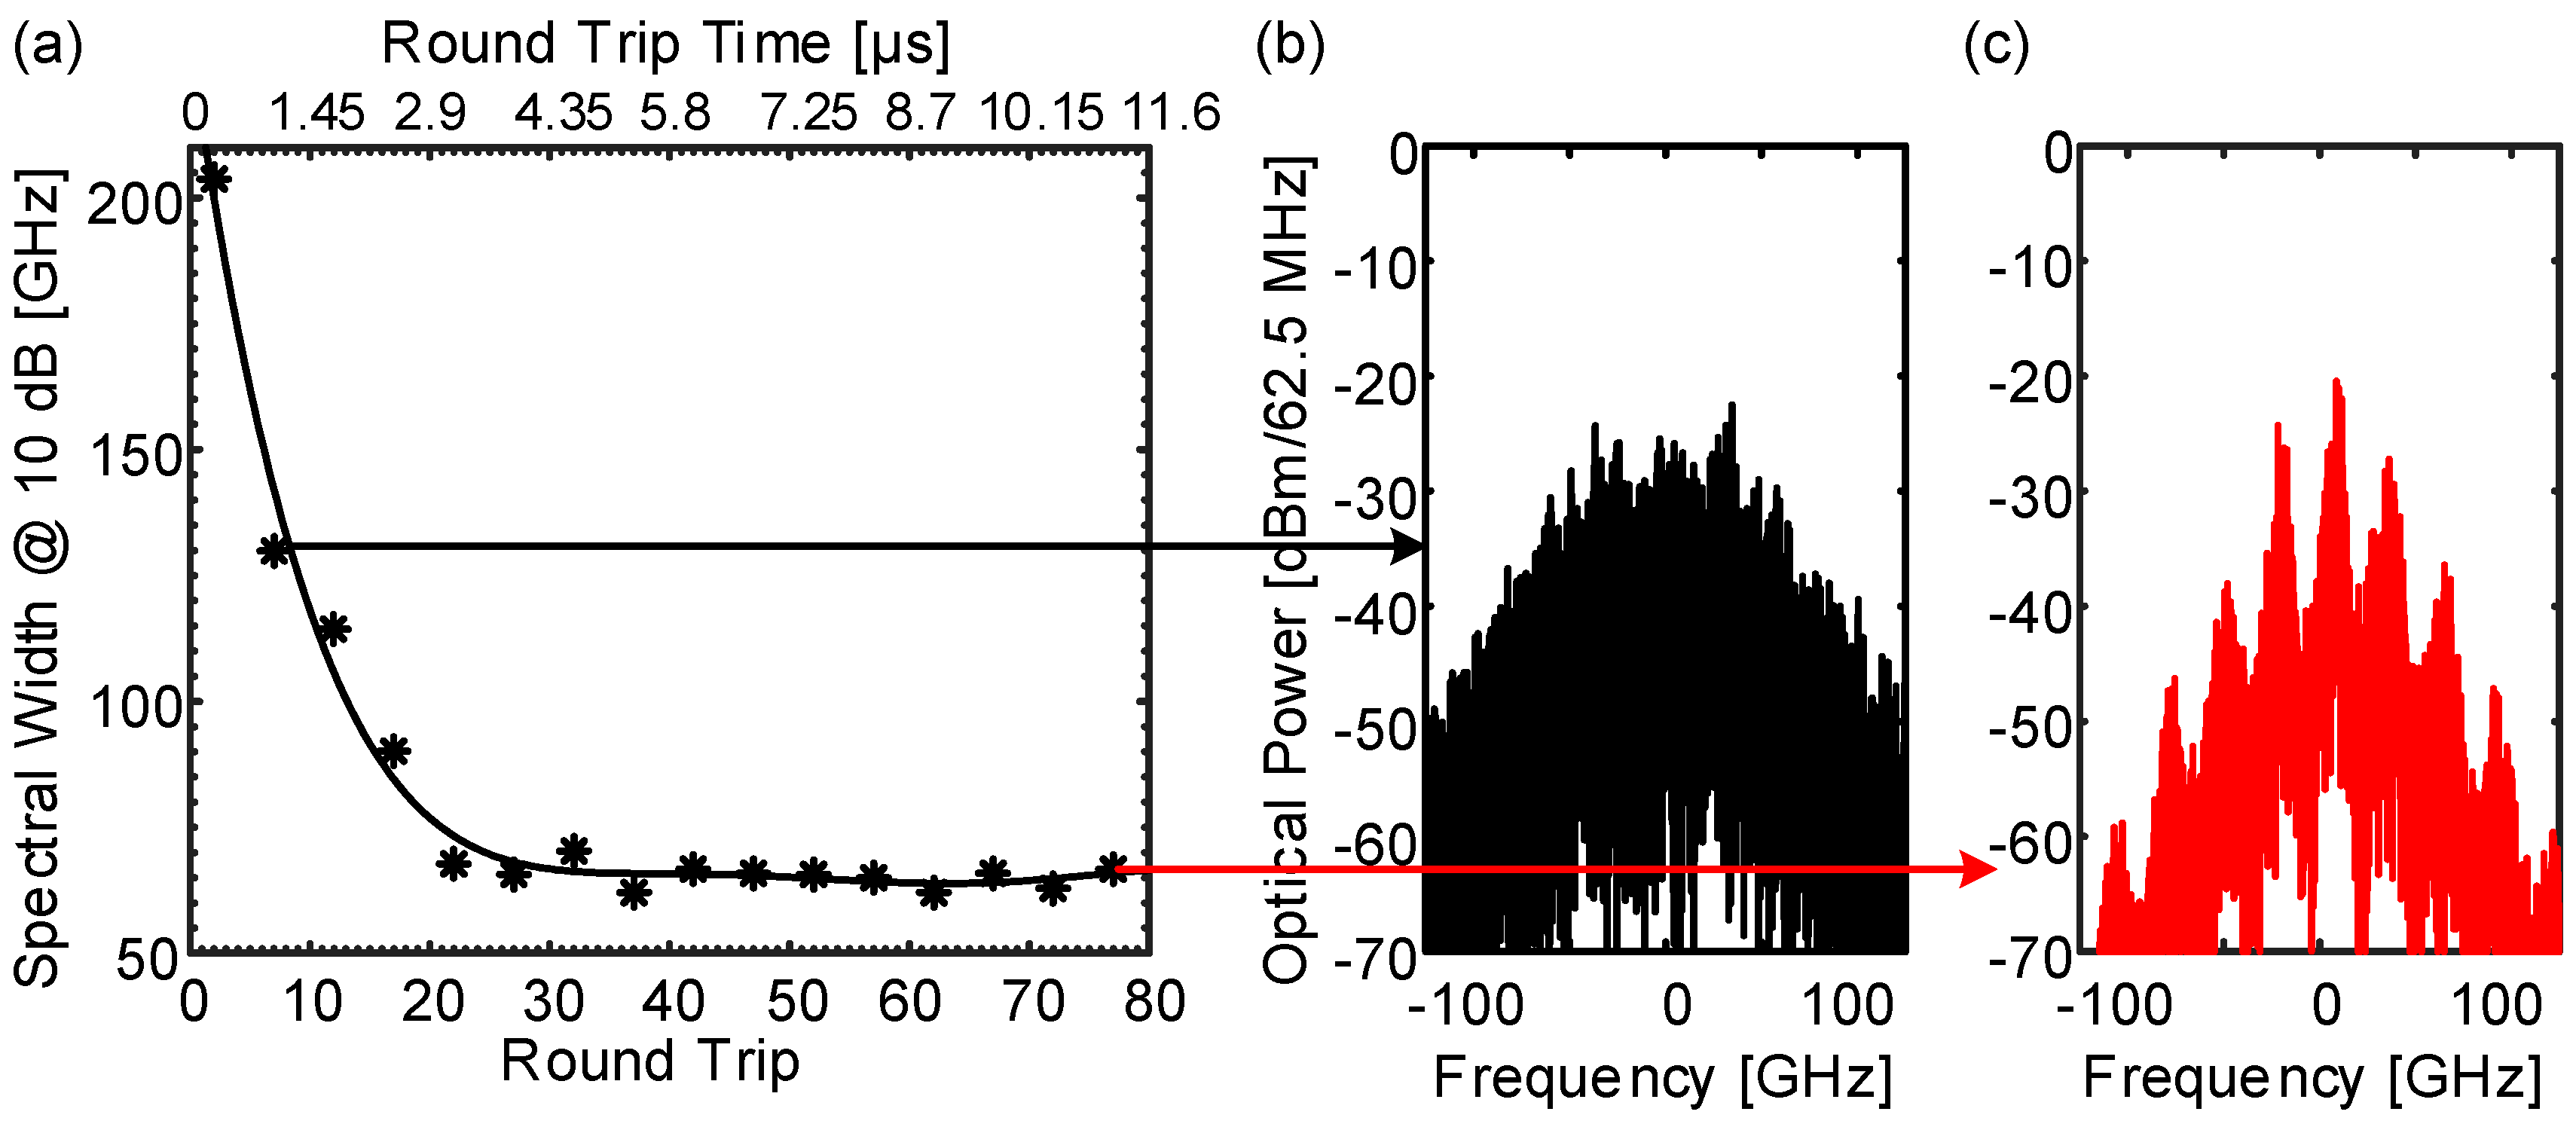
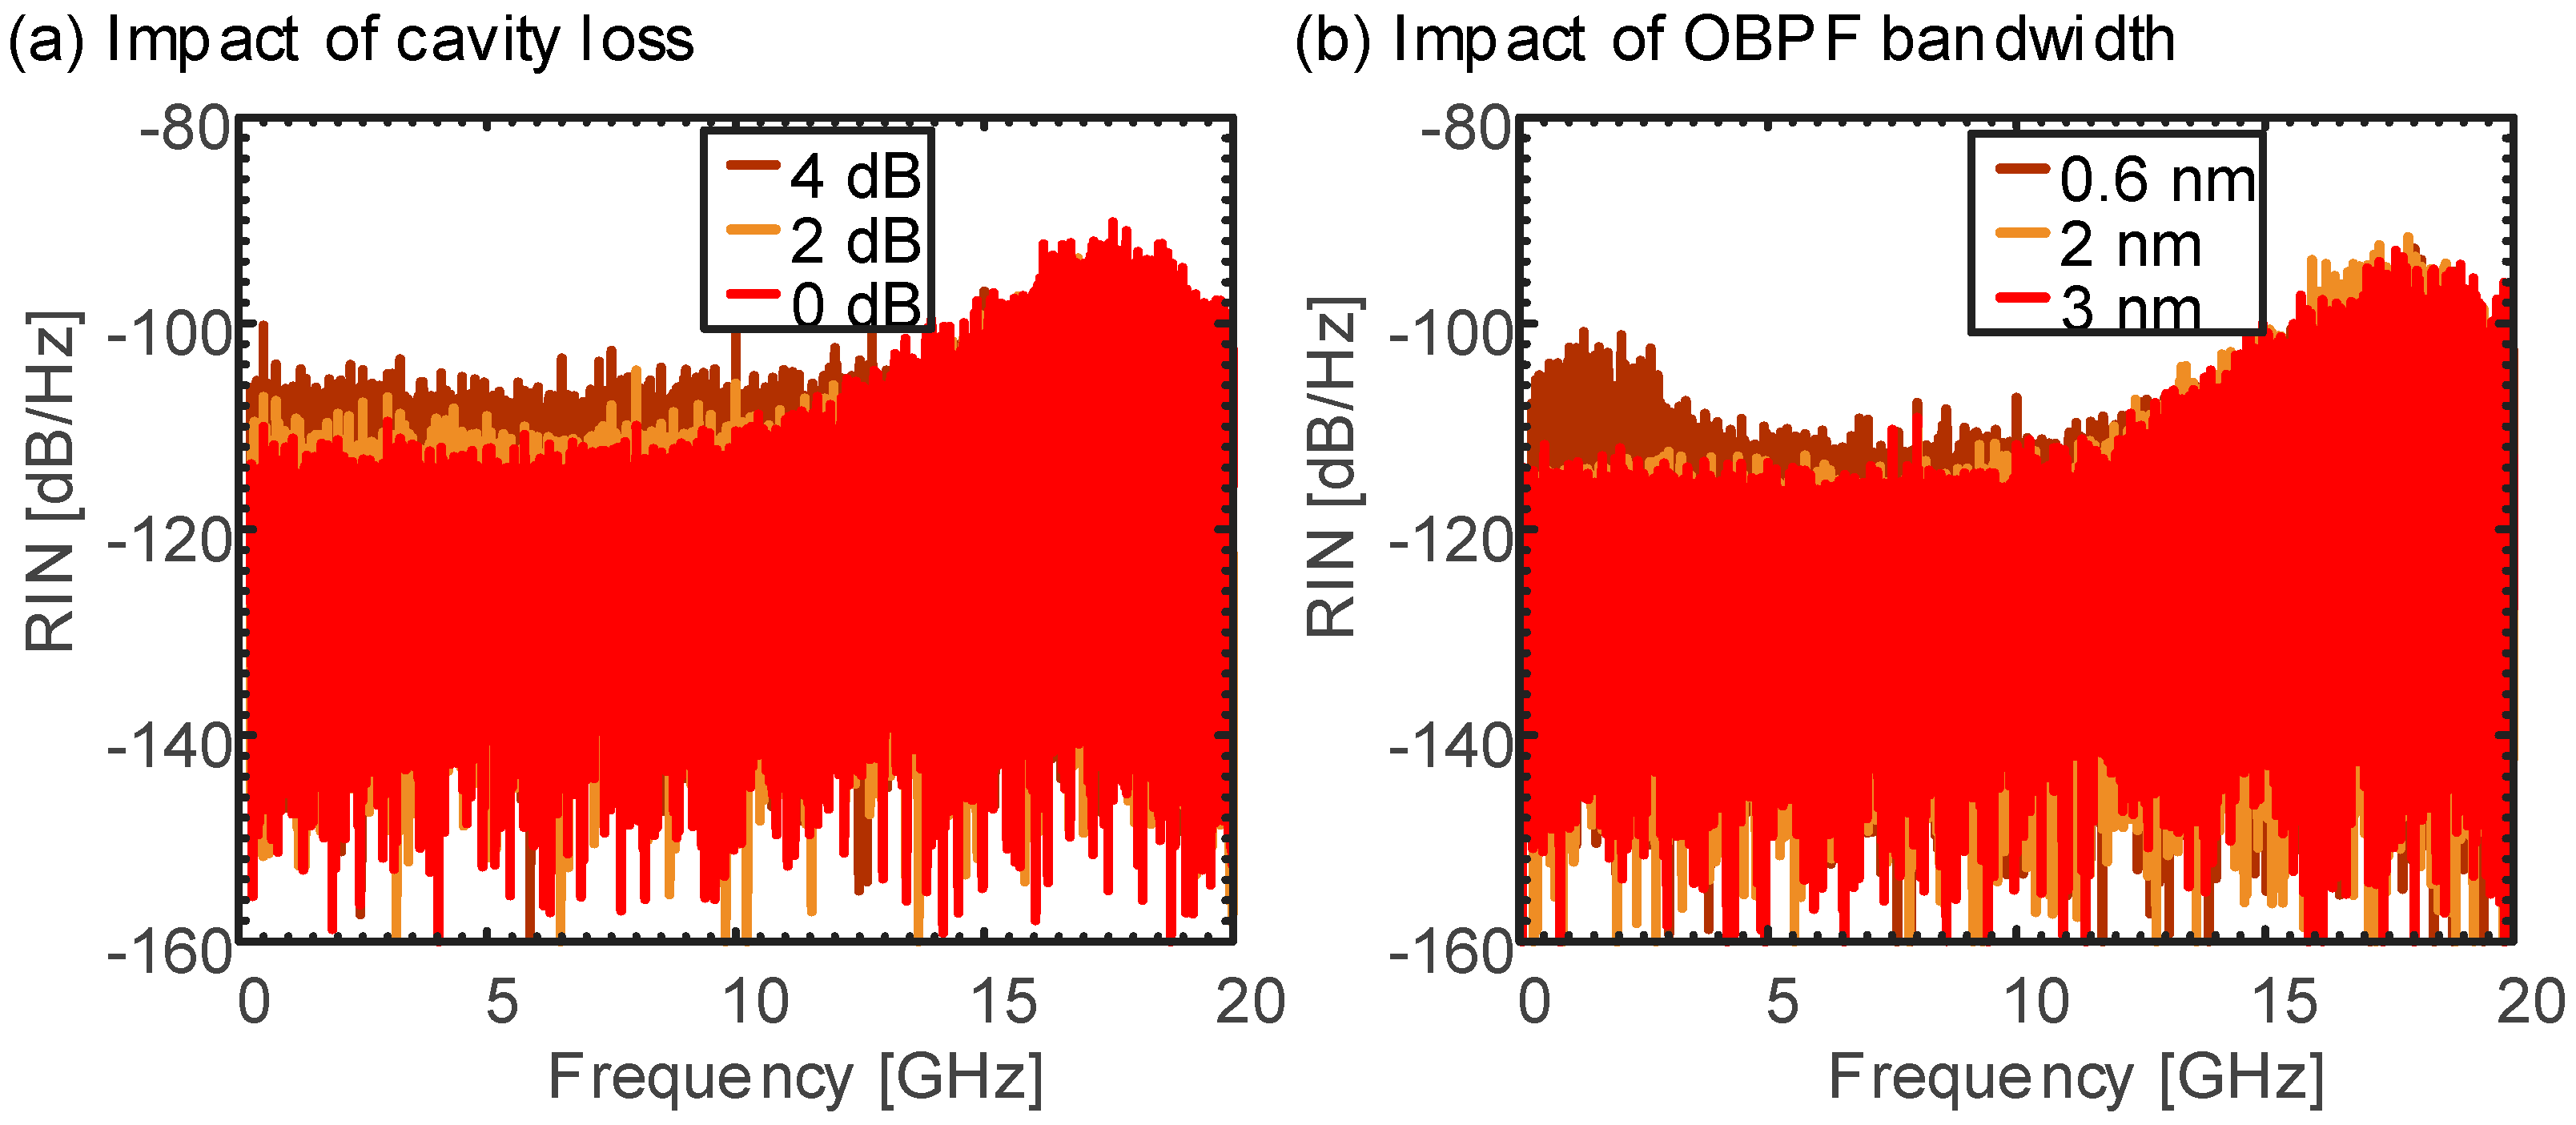
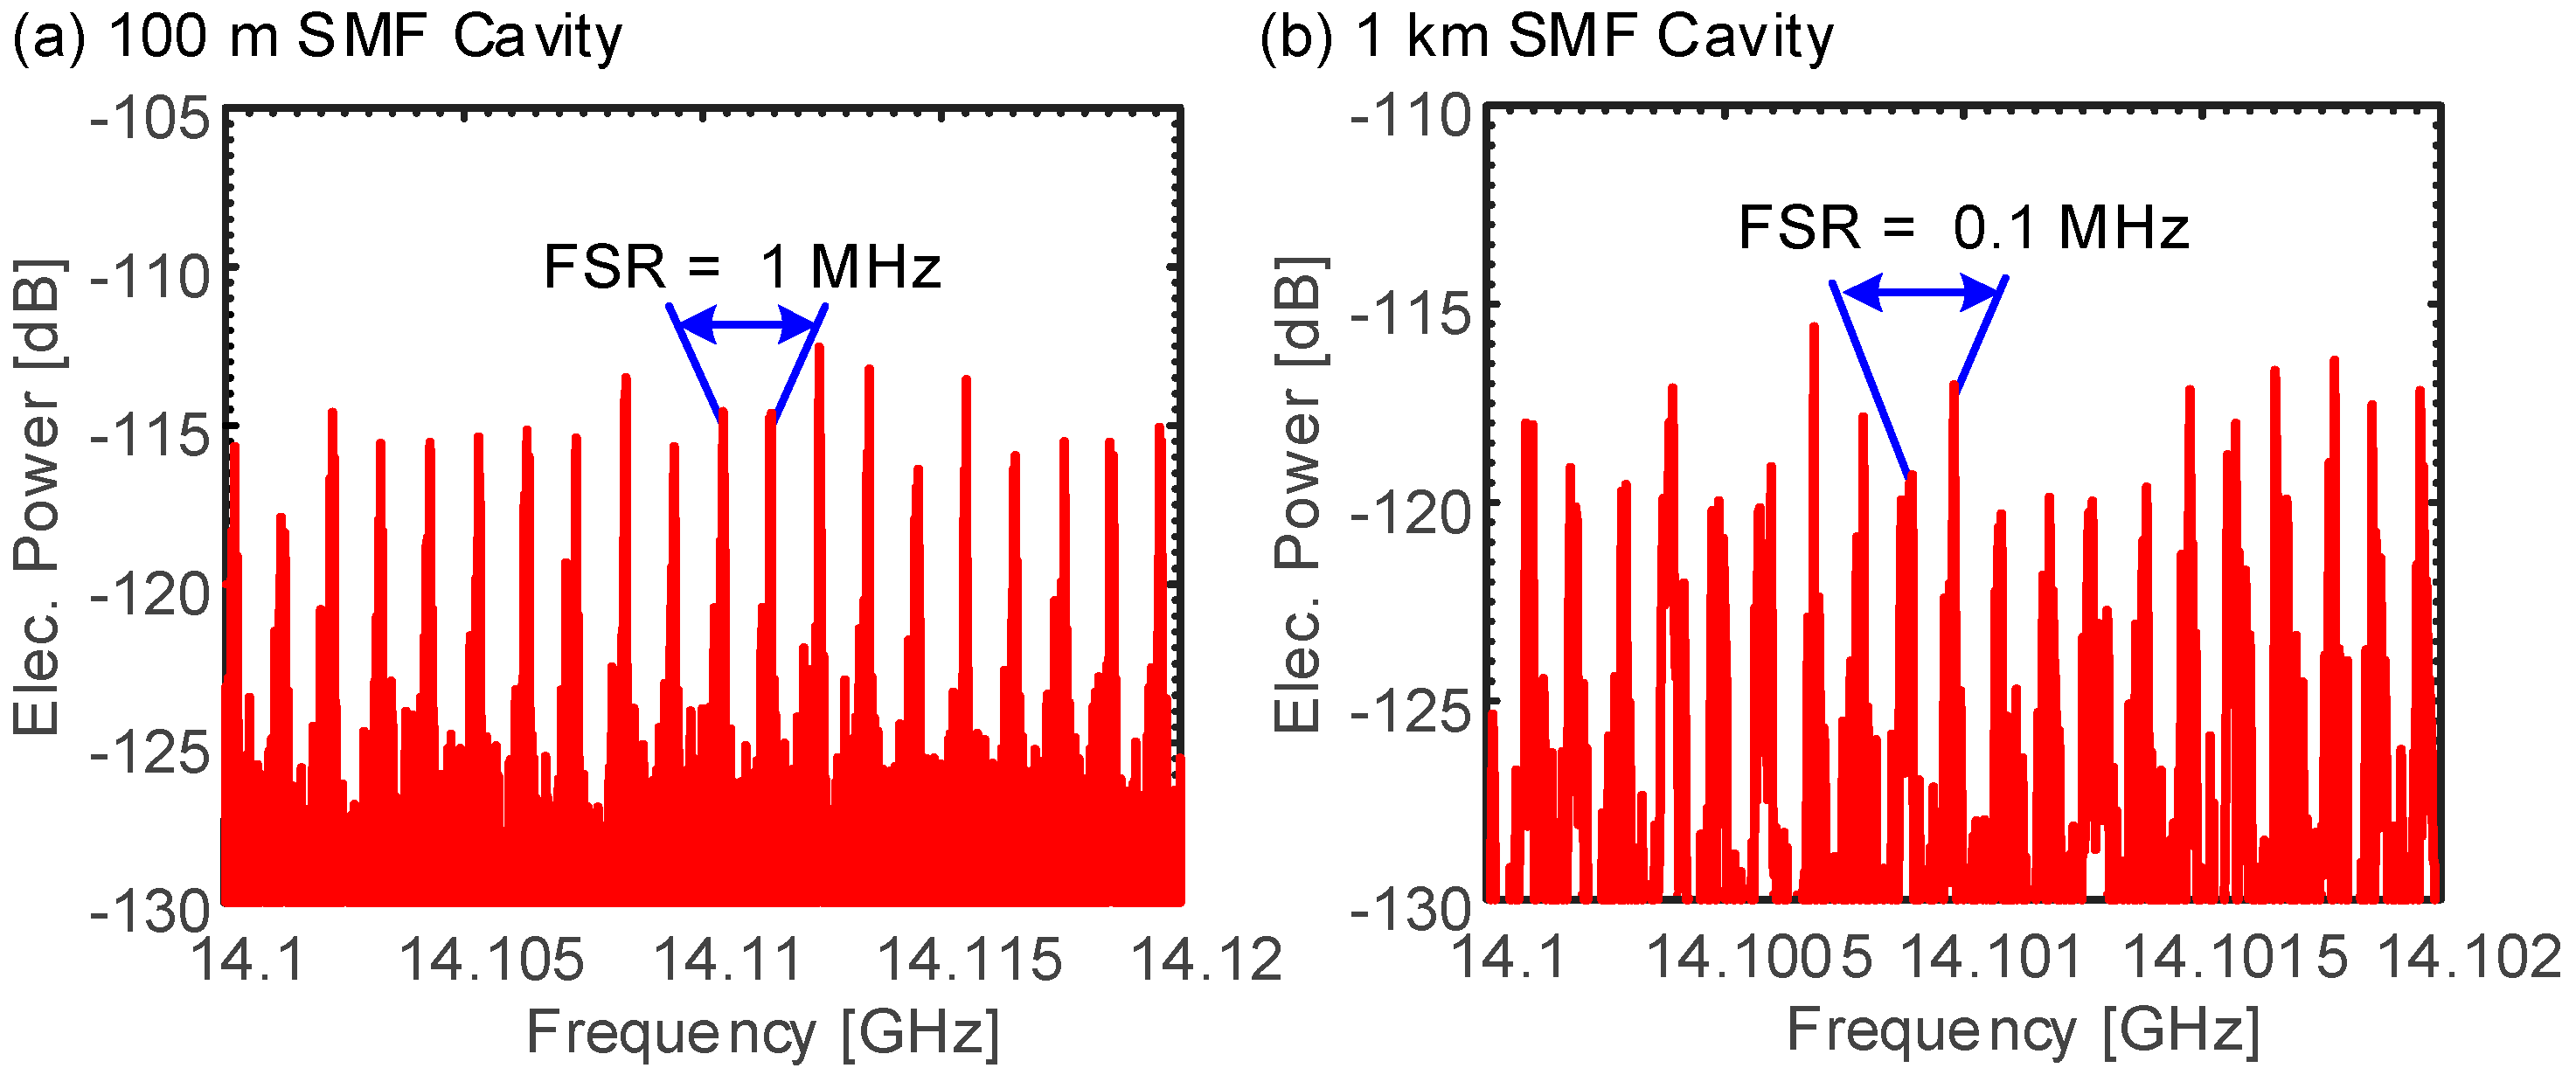
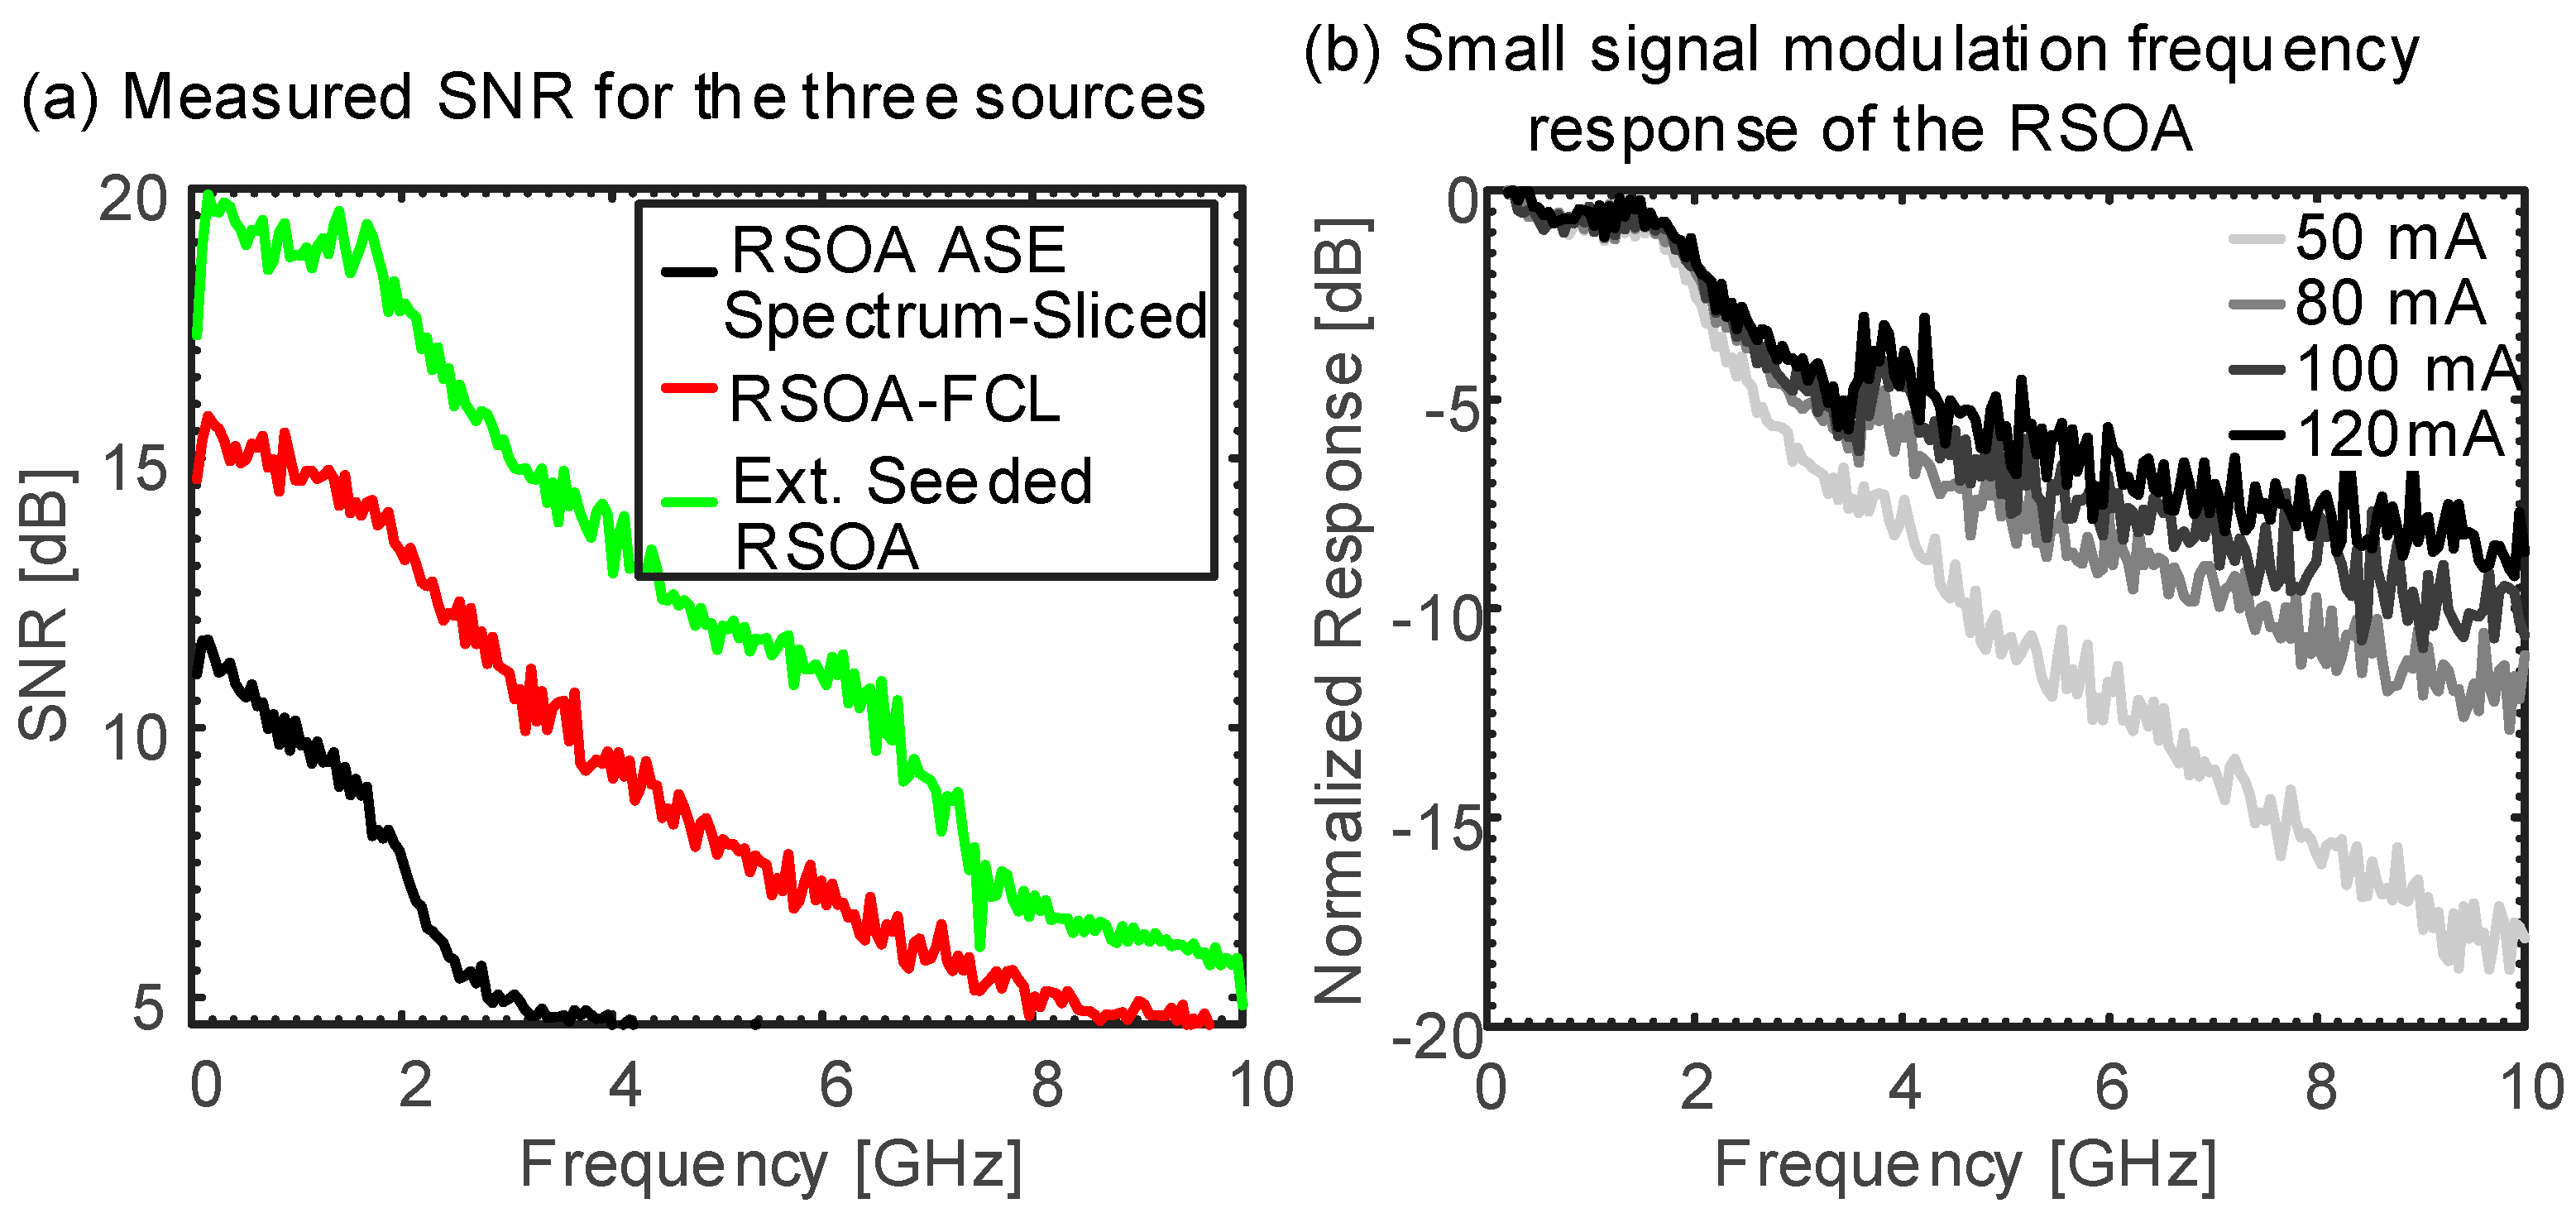
In this section, we use the theoretical model of the RSOA-FCL developed in [21] to understand the improvements brought by an RSOA-FCL compared to an ASE spectrum-sliced source. A simplified simulation schematic is given in Figure 4. The RSOA is modeled as a bidirectional SOA as described in [29,30]. The notations E ˜ out , RSOA ( i ) ( υ ) and E ˜ i n , RSOA ( i ) ( υ ) represent the frequency domain optical field leaving and entering the RSOA, respectively, on the i t h round trip in the long cavity. H fbr ( υ ) is the fiber cavity frequency response that includes both the effects of chromatic dispersion and attenuation, (see [21]). The optical bandpass filter (OBPF) mimics the WGR filter and has a super Gaussian shape. It is given by H OBPF ( υ ) . R RN and η cpr represent the remote node (RN) mirror reflectivity and the coupler output ratio, respectively. The overall cavity loss α VOA is determined by the variable optical attenuator (VOA).
Figure 4. Simplified RSOA-FCL simulation schematics: the RSOA mirror and a remote mirror with reflectivity R RN form the fiber Fabry-Perot resonator cavity. The optical bandpass filter (OBPF) and the variable optical attenuator (VOA) represent the WDM filter and the cavity losses, respectively.
Applsci 05 01922 g004
The optical field output E out ( i ) ( υ ) of a signal emitted from the RSOA on the i t h cavity round trip is given by
E out ( i ) ( υ ) = η cpr α VOA H OBPF ( υ ) H fbr ( υ ) E ˜ out,RSOA ( i ) ( υ )
The reflected seeding optical field is given by
E in,RSOA ( i ) ( υ ) = R RN ( 1 - η cpr ) × ( α VOA × H OBPF ( υ ) × H fbr ( υ ) ) 2 × E ˜ out,RSOA ( i - 1 ) ( υ )
The details of the model have been presented in [21].
Now we use this model in Figure 4 to show how placing a simple mirror behind the OBPF provides a higher power for the RSOA-FCL compared to a simpler ASE spectrum-sliced scheme. In the initial model, we consider the simplest case of a 15 m fiber cavity. We simulated the output power of the RSOA-FCL by varying the RN mirror reflectivity R RN from −60 dB to 0 dB. A R RN of −60 dB reflectivity is very low and thus represents the case of the ASE spectrum slicing (no mirror). Figure 5 plots the output optical power for different values of R RN when the VOA is swept from 5 to 32 dB to mimic different cavity losses.
Figure 5. Impact of RN mirror reflectivity R RN and cavity loss on the optical output power of the RSOA-FCL. Depending on the R RN and the losses, the source could be an ASE spectrum-sliced source (dashed blue line) or a RSOA-FCL laser (dashed red line).
Applsci 05 01922 g005
It is clearly visible that the output power follows one of two lines, either the dashed red or blue line. These two dashed lines represent one of two states of operation: the lasing source state (red), and ASE spectrum-sliced source state (blue), respectively. For R RN = 60 dB (blue solid line), the output power stays close to the blue dashed line. As R RN increases to 0 dB, the optical power increases and reaches the red dashed line that shows lasing. The transition from the ASE source operation to the lasing operation occurs when the RSOA gain is able to compensate for the cavity losses. Therefore, if the source is designed as a RSOA-FCL it will have a power advantage of ~8 dB over an ASE spectrum-sliced source.
Another difference between the RSOA-FCL is in the optical spectrum, which is narrower compared to that of an ASE spectrum-sliced source. To understand this, we followed (in simulation) the output optical field from the time it was launched to the 80th round trip. One round trip time is given by 2nL/c, where L, c and n are the cavity length, the speed of light in a vacuum and the refractive index of standard single mode fiber (SMF). For this initial exemplary case with 15 m cavity, the round trip time is ~0.145 ns. We then plotted the 10 dB spectral width shown in Figure 6a (which is derived from [21]). Initially, the spectral width of the RSOA-FCL is determined by the optical bandpass filter, which has a 3 dB bandwidth of 200 GHz. Gradually, the spectrum narrows down to less than 75 GHz bandwidth. As lasing sets in, a large number of longitudinal modes compete and only a fraction of the modes dominates the lasing process. The resulting narrow spectrum makes the RSOA-FCL more robust against dispersion compared to an ASE spectrum-sliced scheme. Figure 6b,c show sample spectra before and after the spectrum settles. Additional simulated and measured spectral widths for longer cavities are discussed in [21].
Figure 6. Spectral width evolution of an RSOA-FCL. The insets show the simulated spectra before and after the spectrum settles.
Applsci 05 01922 g006
In the same manner we have simulated and plotted the optical power evolution as a function of the round trips in Figure 7a. It is clearly visible that the power requires three to five round trips to reach a steady state for different bias currents [31,32]. Initially, only filtered ASE is emitted when the RSOA bias current is turned on. On the second round trip, the RSOA amplifies and re-emits the reflected light (after passing through the cavity). This step repeats continuously and the power builds up until it reaches a steady state when the RSOA gain saturates.
Figure 7. Evolution of (a) output power and (b) RIN with the number of cavity round trips. The output power builds up within the first few round trips before saturating. The RIN also follows a similar evolution in time before it reaches its minimum value.
Applsci 05 01922 g007
We also followed the change in the RIN as a function of the cavity round trip times, as shown in Figure 7b. For practical reasons we do not plot the RIN as a function of the frequency but give the RIN as an average RIN within a spectral window up to 2.5 GHz. Figure 7b indicates the RIN evolution with the round trip and shows that the RIN follows a similar time scale as the output power to reach steady state. Initially, the RIN is very high as the cavity just emits spectrum-sliced ASE. The dashed lines depict the initial high RIN for 50, 100 and 200 GHz OBPFs. As the power in the cavity builds up, the RIN also goes down. This can be explained by the same concept used in the nonlinear suppression of amplitude modulation in Figure 3b,c. In the same manner, as the optical power of the RSOA-FCL builds up, the RSOA is driven into the nonlinear region and amplitude noise of the seeding ASE is suppressed. This results in a reduction of RIN with each round trip, as is shown in Figure 7b.
Figure 7b also shows that, for wider filter bandwidths, we get lower RINs [33]. This could be accredited to two effects. First, a wider bandwidth means a lower filtering loss of power, and thus the RSOA is driven into the nonlinear region more quickly and leads to stronger noise suppression. Another explanation is related to the mode partition noise of multimode lasers. In [34], it is discussed that, in case of multimode lasers, increasing the number of modes will spread the noise over a broader spectrum, lowering the mode partition noise and the noise spectral density, and thus the RIN. In the same manner, for the larger bandwidth filter in the RSOA-FCL, the number of modes increases and in turn lowers the RIN.

5. Characterization

In this section, we experimentally compare the ASE spectrum-sliced, self-seeded RSOA-FCL, and the externally seeded RSOA colorless sources. We measure their optical output power, spectrum and RIN.

5.1. Experimental Setup

Figure 8 shows the experimental setups for the three schemes under investigation when used as upstream transmitters in the WDM-PON networks shown in Figure 1. A DC bias current I b i a s drives the RSOA at the ONU. The distribution fiber (DF) links the ONU to the OBPF. An OBPF (Koshin Kogaku, Kanagawa, Japan) mimics the WGR WDM filter at the RN. For the case of the RSOA-FCL we use a Faraday rotator mirror (FRM, OZ Optics, Ottawa, ON, Canada) at the RN and a Faraday rotator (FR) in the ONU. The laser cavity is then formed by FRM and the RSOA, as shown in Figure 8b. The FRM and FR are needed, since RSOAs often have a polarization-dependent gain (PDG). With this arrangement the forward and backward propagating signals maintain the polarization state at the RSOA [35]. A 90/10 power splitter sends 10% of the power through the feeder fiber (FF) to the CO. At the CO, the signal is pre-amplified and directly detected with a photodiode. An optical spectrum analyzer (OSA, Yokogawa, Musashino, Japan) is used to measure the power and the optical spectrum. For the externally seeded RSOA scheme shown in Figure 8c, the seeding laser is also positioned at the CO. A circulator (Laser2000, Wessling, Germany) is used to split the DS cw seed and the US signal. We use a variable optical attenuator (VOA) to control the seeding power.
Figure 8. Experimental setups to characterize and compare the three schemes; (a) RSOA ASE spectrum-sliced scheme; (b) self-seeded RSOA-FCL; (c) externally seeded RSOA. In all setups, the transmitter is placed at the optical network unit (ONU) and the receiver is placed at the central office (CO). An optical bandpass filter (OBPF) mimics the WGR WDM filter at the remote node (RN). In (b), a Faraday rotator (FR) and FR-mirror (FRM) are placed at the ONU and the RN, respectively, for polarization control in the RSOA-FCL [35], shown by the yellow shading. The ONU is connected to the RN and the CO through the distribution fiber (DF) and the feeder fiber (FF), respectively.
Applsci 05 01922 g008

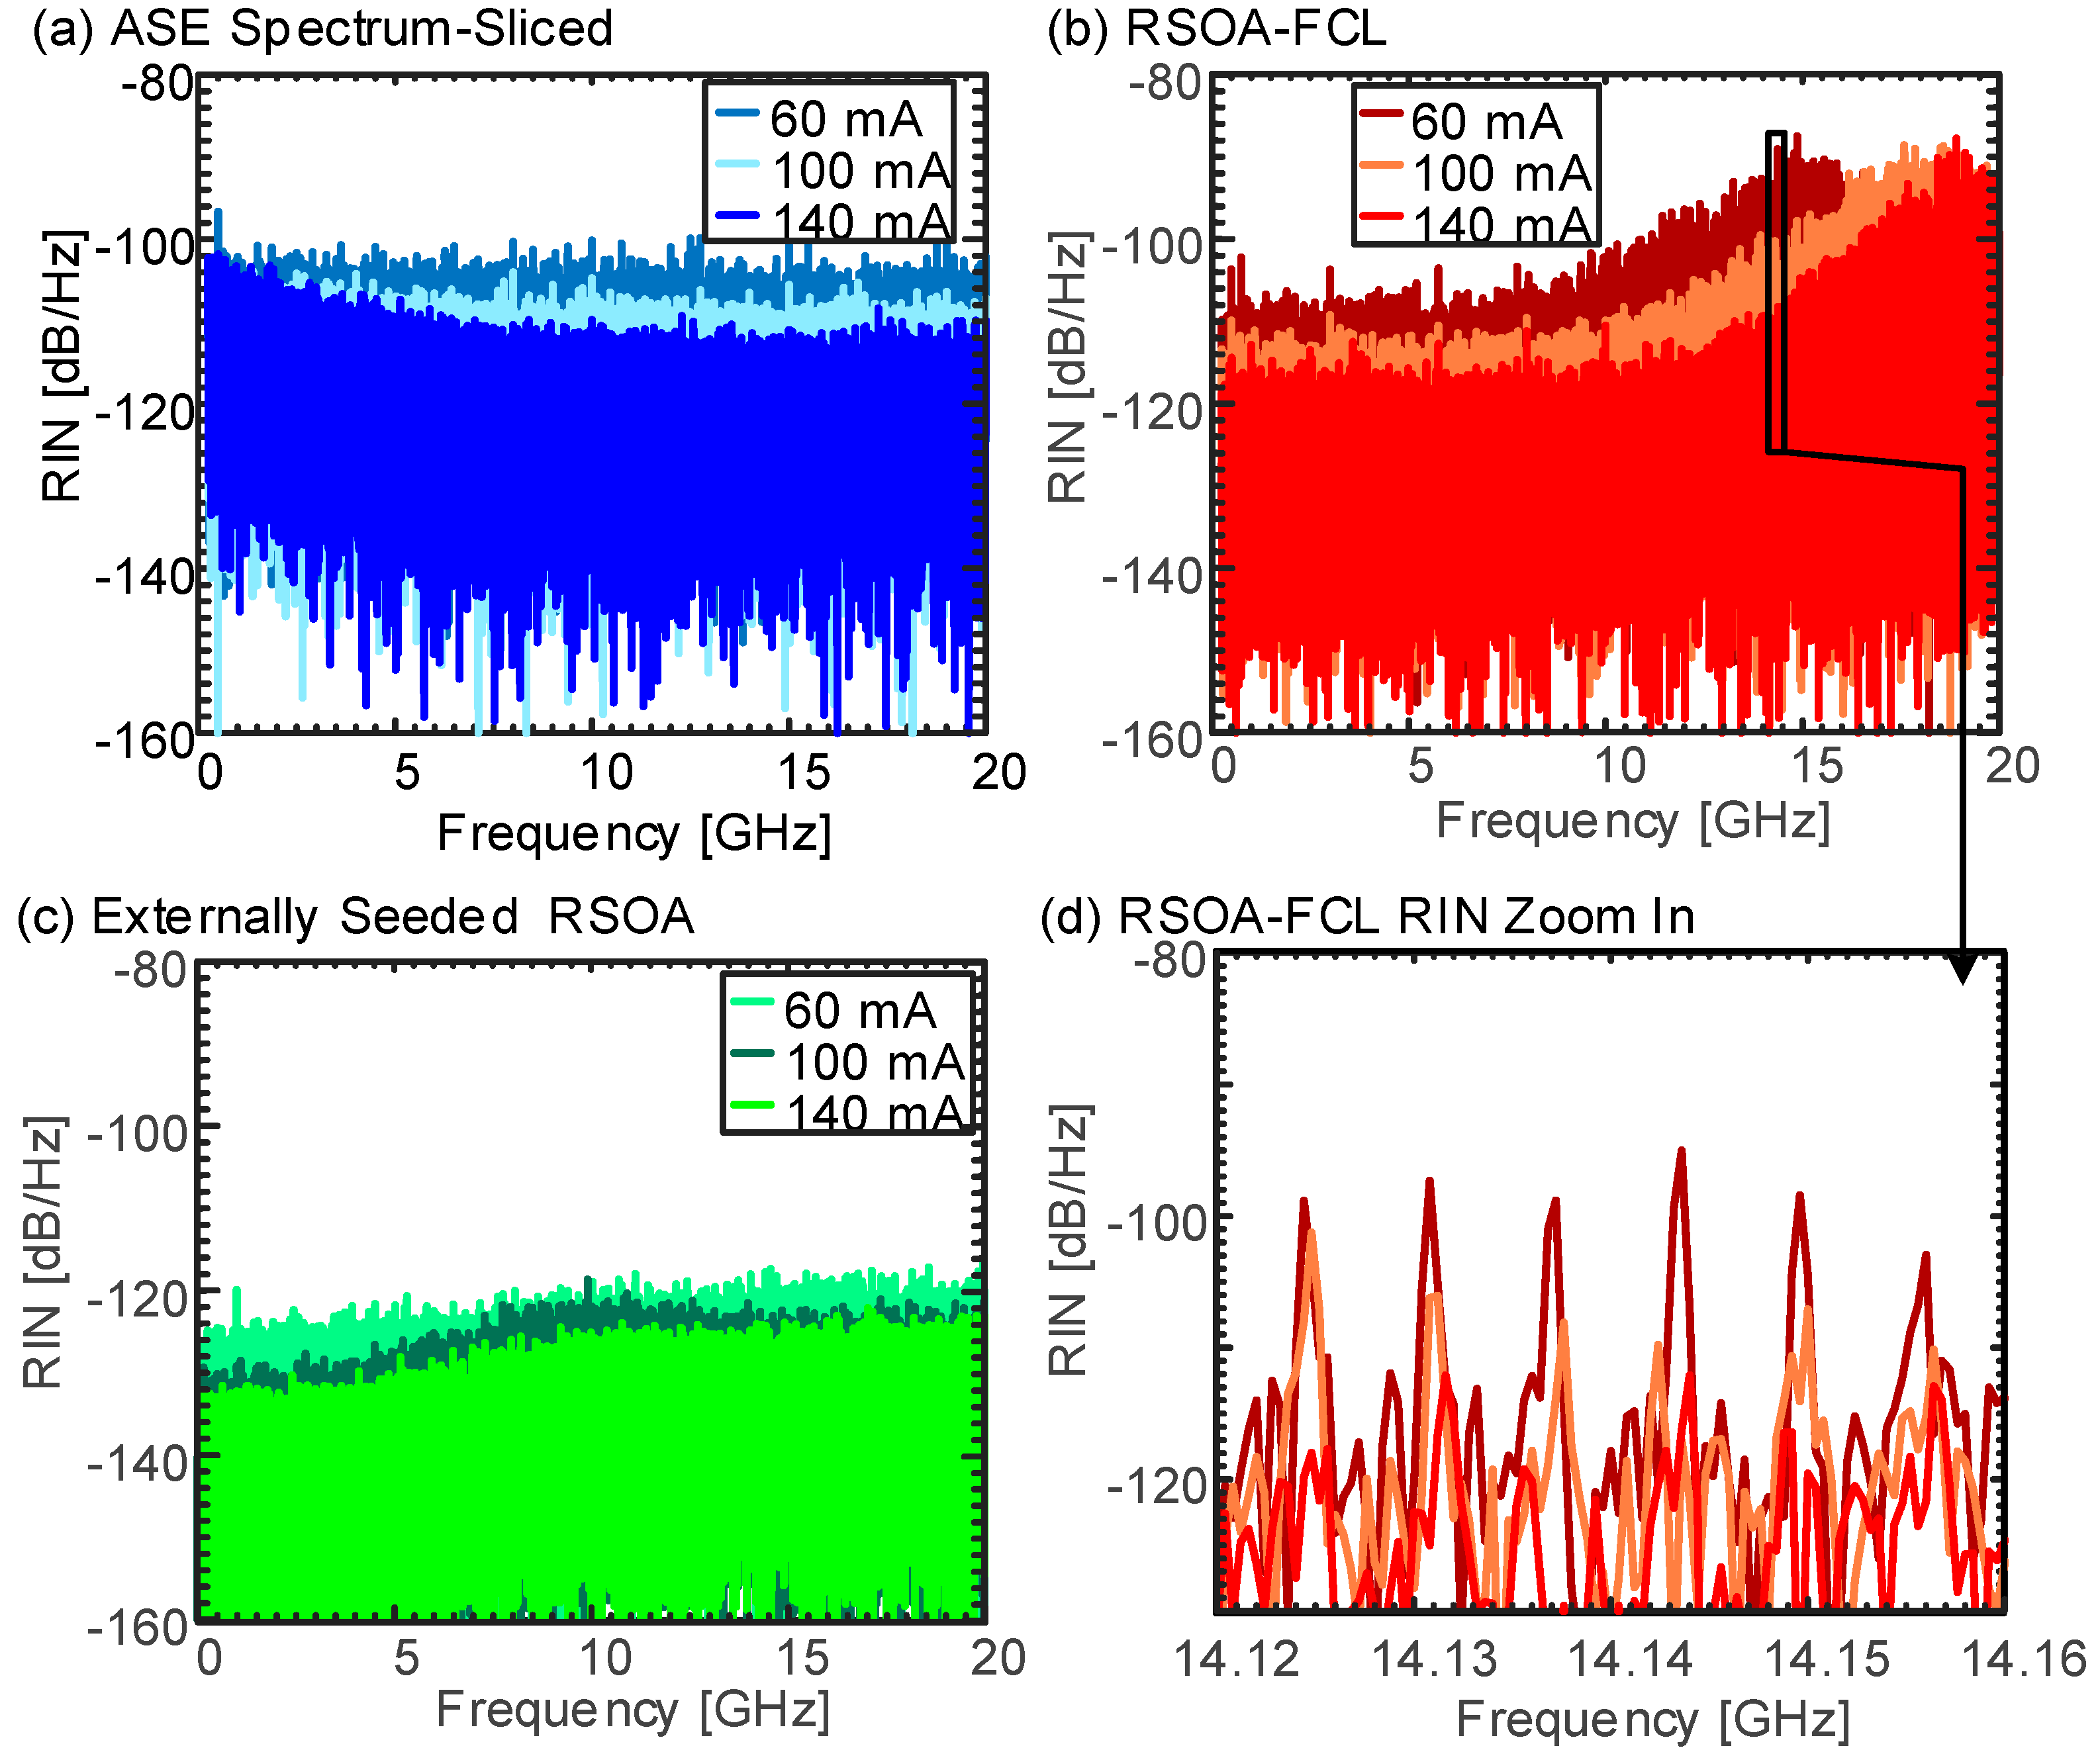
5.2. CW Results and Discussion

First, we measured the output optical power and spectrum of the three sources in Figure 8. Figure 9a plots the powers when the RSOA bias current is swept from 20 to 200 mA for a OBPF bandwidth of 2 nm. The blue and red curves show the measured powers for the ASE spectrum-sliced and the self-seeded RSOA-FCL sources, respectively. The RSOA-FCL delivers power, which is up to 9 dB higher than the power of the ASE spectrum-sliced source. At 100 mA bias current, the spectrum-sliced power and the RSOA-FCL powers are −13 and −3.8 dBm, respectively. The ASE spectrum-sliced source suffers from the high filtering loss of the OBPF. The green curves show the measured power for the externally seeded RSOA. At 100 mA bias current and seeding input powers of −25 and −6 dBm, the measured output powers are −0.9 and 4 dBm, respectively. The corresponding 100 mA spectra for the three cases are plotted in Figure 9b. For comparison, the total RSOA ASE is depicted by the black curve. The ASE sliced spectrum (blue curve) is just a filtered version of the total ASE. However, the RSOA-FCL output shown by the red curve has a narrower spectrum with a stronger peak, as seen in the Figure 9b inset. The spectral shape qualitatively agrees with the simulated spectra in Figure 6c. The peaks are due to the RSOA ripple. The strong mode competition in the RSOA-FCL cavity results in a few modes with the least losses that dominate the spectrum. The green curve shows the single mode spectral output of the externally seeded RSOA.
Figure 9. Experimental characterization: (a) shows measured optical power versus bias current for the ASE spectrum-sliced, the self-seeded RSOA-FCL and the externally seeded RSOA colorless transmitters; (b) shows the corresponding spectrum at a bias current of 100 mA. The inset shows a zoomed-in plot for the three spectra.
Applsci 05 01922 g009
In the next step we have measured the RIN of the three sources. The measurement was done at 60, 100 and 140 mA RSOA bias currents. Figure 10a shows the RIN for the ASE spectrum-sliced source, and one can see that the RIN reduces with higher current. This is related to the increase in optical power with bias current, as shown in Figure 9a. The ASE-ASE beat noise results in a higher RIN at lower frequencies [36]. The RIN for the RSOA-FCL is plotted in Figure 10b. The RIN level is lower by more than 10 dB/Hz compared to that of the spectrum-sliced case, especially at lower frequencies. This is attributed to the reduction of the amplitude fluctuation noise of the seeding ASE by the saturated RSOA [37]. As the bias current is increased, the power in the RSOA-FCL cavity increases, thus strongly saturating the RSOA and improving the noise suppression efficiency. However, this noise suppression efficiency is not constant across the whole spectrum. Due to the slow RSOA gain recovery during amplitude fluctuation suppression, low frequency fluctuations are more efficiently suppressed. Another important point to note is that one can resolve the multiple longitudinal modes of the RSOA-FCL. Figure 10d shows the zoomed section of the RIN in Figure 10b, where modes spaced by free spectral range (FSR) of 6.4 MHz are visible. This relates to a L = 15 m (SMF cavity length) with FSR = c / 2 n L , where c and n are the speed of light in a vacuum and the refractive index of SMF. Finally, the RIN of the externally seeded RSOA case is presented in Figure 10c. At 100 mA, its RIN is around 25 dB/Hz and 15 dB/Hz lower than the RIN of the ASE spectrum-sliced and the RSOA-FCL sources, respectively.
Figure 10. Measured RIN at 60, 100 and 140 mA RSOA bias currents: (a) For the RSOA ASE spectrum-sliced; (b) self-seeded RSOA-FCL; and (c) externally seeded RSOA colorless transmitters. For all cases, the RIN increases for lower bias current. The externally seeded RSOA shows the lower RIN followed by the RSOA-FCL; (d) shows the zoomed in section of (b) where the RIN shows peaks corresponding to the longitudinal modes of a 15 m SMF cavity RSOA-FCL.
Applsci 05 01922 g010
Further, we investigated the impact of the cavity parameters on the RIN of the RSOA-FCL. First, the RIN is measured by adding 0, 2, and 4 dB more loss in the cavity and is plotted in Figure 11a. Initially, the total cavity loss due to the insertion losses of the different components is 7 dB. The RIN increases for higher losses. It is discussed in [37] that the RSOA needs to be in the saturation region to achieve efficient amplitude noise suppression and low RIN. Thus, high loss means the RSOA moves to the linear region and the noise is no more suppressed, resulting in a high RIN. Next, Figure 11b shows the measured RIN when using a 0.6, 2, and 3 nm bandwidth OBPFs in the cavity. The 0.6 nm bandwidth gives relatively higher RIN. This can be related to the higher power loss with narrow band filtering. The 2 and 3 nm bandwidths have similar RIN.
Figure 11. RIN characterization of the RSOA-FCL: (a) The RIN increases when introducing additional loss in the cavity; (b) The impact of the optical bandpass filter (OBPF) bandwidth on the RIN is shown.
Applsci 05 01922 g011
Another interesting point about the RSOA-FCL is the large number of longitudinal modes due to the extra-long cavity. The length of the cavity is determined by the distribution fiber of the PON, which ranges from tens of meters to kilometers. We can resolve these modes in the electrical domain, and the results are plotted in Figure 12. The plots show the exemplary section of an electrical spectrum for 100 m and 1 km SMF cavity RSOA-FCLs. As previously stated, the FSR of the modes is c/2nL. The FSRs for the three cavities are 1 and 0.1 MHz, respectively.
Figure 12. Resolved longitudinal modes of the self-seeded RSOA-FCL for: (a) 100 m and (b) 1 km SMF cavities. FSR = c/2nL, where c, n, L are the speed of light in vacuum, the refractive index and the length of the SMF cavity.
Applsci 05 01922 g012
For a cavity of 1 km length with a FSR of 0.1 MHz and an OBPF filter bandwidth of 2 nm, millions of modes could exist in this source. This highly multimode nature makes it a low-coherence source that is quite susceptible to chromatic dispersion and mode partition noise [21].

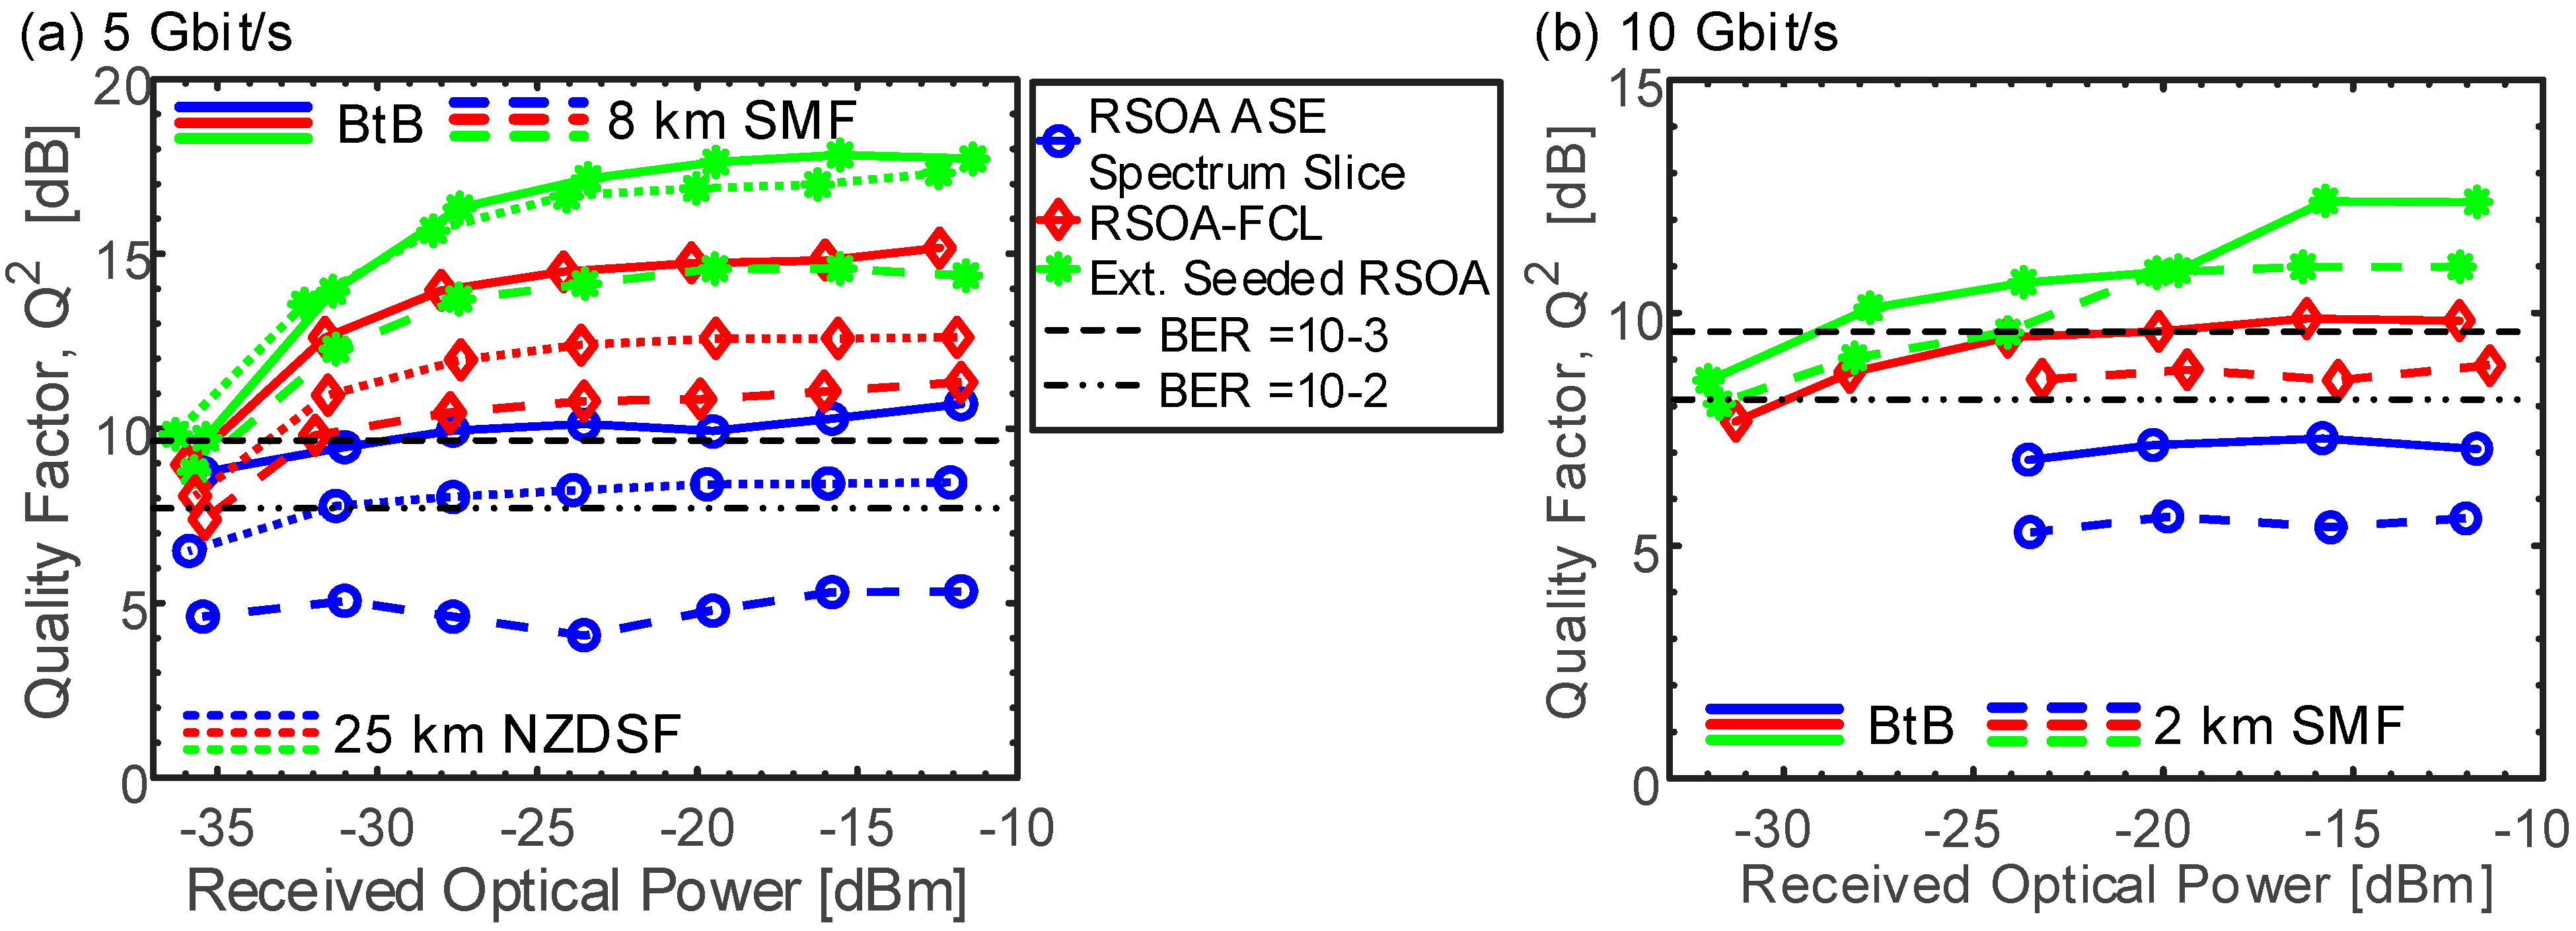
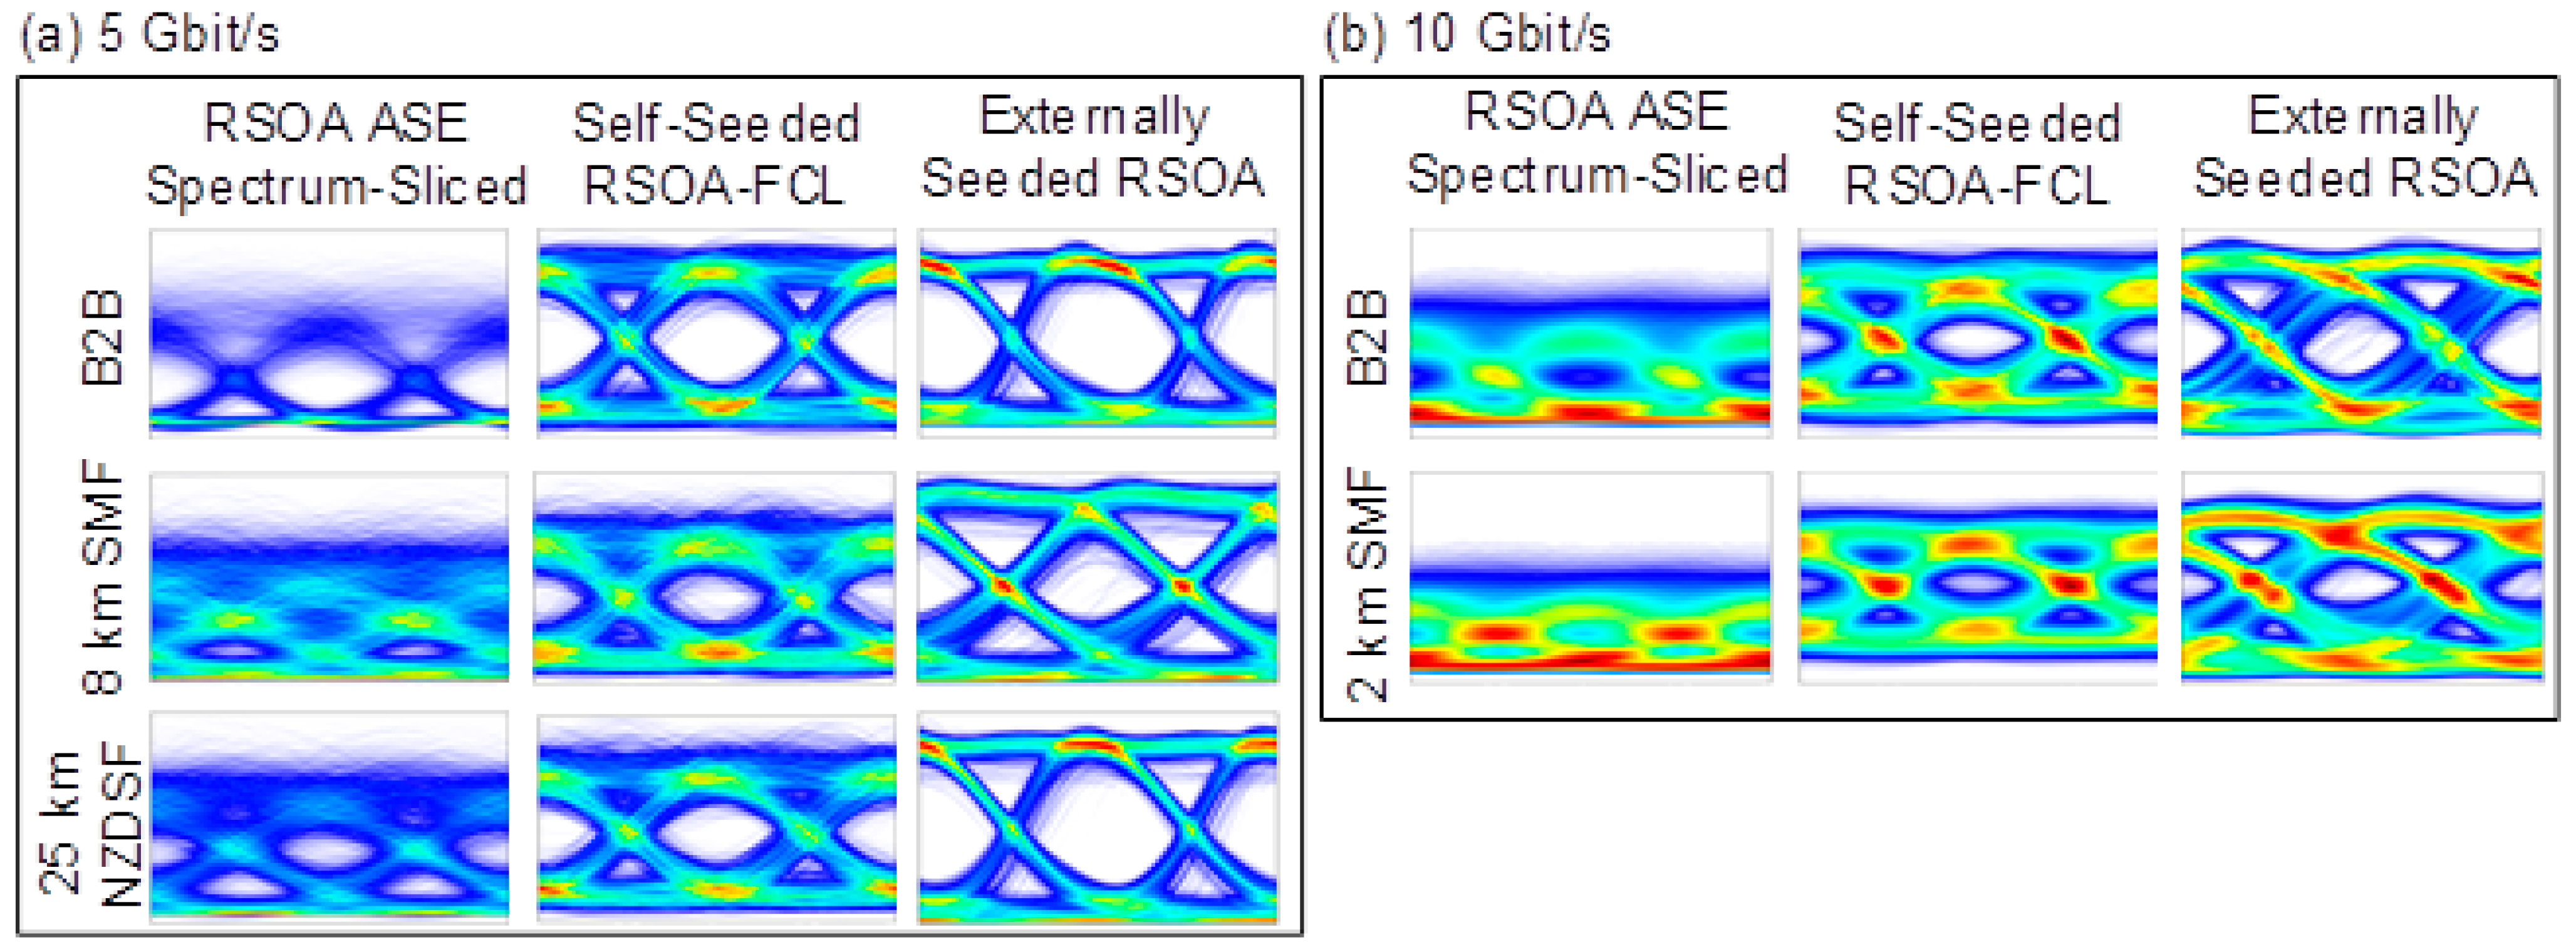
6. Data Transmission Comparison

In this section, we discuss the data transmission performances of the ASE spectrum-sliced, the RSOA-FCL, and externally seeded RSOA schemes in the experimental setups of Figure 8.
First, we are interested in the frequency response of the respective sources. Instead of measuring only the small signal modulation frequency response, we measure the frequency dependence of their SNR. The SNR frequency response is interesting, because it directly relates to the bit-error ratio (BER) and includes effects from both a degradation of the frequency response and also a frequency dependence of the RIN. The frequency-dependent SNR has been measured by transmitting a quadrature phase-shift keying (QPSK) encoded discrete multi-tone (DMT) signal with a pseudorandom binary sequence (PRBS) sequence of 211-1 [13]. In our case, a 256 subcarrier DMT signal within a total bandwidth of 10 GHz has been generated by an arbitrary waveform generator (AWG) to drive the RSOA. The RSOA bias current has been optimized separately for each transmitter. In the case of the externally seeded RSOA scheme, the input seeding power was −4 dBm. After direct detection, we measured the SNR of each subcarrier. The measured SNRs for the three schemes are plotted in Figure 13a. One can see that the RSOA-FCL sits between the spectrum-sliced and the externally seeded RSOA schemes. It has a ~5 dB higher SNR than the former and a ~5 dB lower SNR than the latter. For all cases, the SNR reduction at higher frequency is due to the bandwidth limitation of the RSOA. The small signal modulation frequencies of the RSOA for bias currents from 50 to 120 mA are plotted in Figure 13b. The RSOA has a 3 dB bandwidth of 2.4 GHz at 100 mA.
Figure 13. Measured SNR and small signal frequency response: (a) Measured signal-to-noise ratio (SNR) vs. frequency for the RSOA ASE spectrum-sliced, self-seeded RSOA-FCL and externally seeded RSOA colorless transmitters driven at 100 mA; (b) Small signal modulation frequency response of an RSOA at different bias currents.
Applsci 05 01922 g013
Next, we transmitted 5 and 10 Gbit/s amplitude shift keying (ASK) non-return-to-zero (NRZ) signals with the three schemes. Figure 14 shows plots with measured quality factors Q2 (dB) for a BtB (back-to-back), a 8 km SMF and 25 km non-zero dispersion-shifted fiber (NZDSF) transmission experiment with 5 and 10 Gbit/s NRZ signals. Since the use of forward error correction (FEC) in MFH is a common option, we used the standard BER thresholds of 10−2 and 10−3 as a minimum requirement [38,39]. Then we calculated the Q2 values for each transmitter scheme at various received input powers. We have been using Q2 values rather than BER as a quality metric, because our dominant noise source is the RSOA ASE noise that acts as an almost ideal white Gaussian noise source for not-too-high input powers [40]. The black dashed lines in Figure 14 indicate the Q2 values 7.3 and 9.8 dB which correspond to a BER of 10−2 and 10−3, respectively.
Figure 14. Measured quality factor Q2 (dB) for transmission of (a) 5 Gbit/s and (b) 10 Gbit/s using the ASE spectrum-sliced scheme (blue), the self-seeded RSOA-FCL (red) and the externally seeded RSOA (green) transmitters.
Applsci 05 01922 g014
In Figure 14a, it is shown how all three transmitter schemes can achieve Q2 values above 9.8 dB for a BtB transmission. Of the three schemes, the externally seeded RSOA delivers the highest Q2 with a value of up to 17 dB. The self-seeded RSOA-FCL follows with up a Q2 value of 15 dB. The RSOA ASE spectrum-sliced scheme has the lowest BtB Q2 with a value just above the 9.8 dB limit. For the 8 km SMF transmission, shown by the dashed lines, only the RSOA-FCL and the externally seeded RSOA can achieve a Q2 above 9.8 dB. Chromatic dispersion and chirp interplay reduce the performances in all three schemes. Of course, the penalty is far stronger for the spectrum-sliced source. We also transmitted the 5 Gbit/s signal over 25 km NZDSF with chromatic dispersion of 5 ps/nm·km, depicted by dotted lines in Figure 14a. The transmission over NZDSF was carried out to reduce the impact of chromatic dispersion in order to extend the reach. The ASE spectrum-sliced source can reach Q2 values of 7.3 dB at a −31 dBm received power. The externally seeded RSOA and the RSOA-FCL reach Q2 values of 17 and 12 dB, respectively. The impact of the dispersion of the NZDSF on the externally seeded RSOA scheme is negligible.
Eye diagrams of the 5 Gbit/s transmission experiments for the three schemes at various distances are plotted in Figure 15a. Depending on the transmitter scheme, fiber dispersion impacts the eye diagram opening to a different degree. For the externally seeded RSOA, the 25 km NZDSF eye diagrams are as open as the BtB case. This is due to the relatively narrow optical spectrum of this scheme. Thus, when transmitted through the NZDSF of only ~5 ps/nm·km dispersion, it does not suffer much inter-symbol interference (ISI) at 5 Gbit/s (symbol period of 200 ps). However, due to the broader spectra of the ASE spectrum-sliced and the RSOA-FCL sources, 25 km NZDSF does not offer similar performance as it does for the BtB case. However, due to the relatively broader spectra of the ASE spectrum-sliced and RSOA FSL schemes, the overall dispersion accumulates and the signal quality degrades for 25 km.
Figure 15. Eye diagrams: (a) Measured eye diagram for 5 Gbit/s transmission and (b) 10 Gbit/s transmission with the three transmitter schemes. The measurements were performed at a received power of −12 dBm. The transmission distances are indicated in the figure.
Applsci 05 01922 g015
We also performed 10 Gbit/s transmission experiments. Figure 14b shows that only the externally seeded RSOA and the RSOA-FCL can achieve 10 Gbit/s with a Q2 above 9.8 and 7.3 dB, respectively. The performance limitation at 10 Gbit/s emanates from the limited modulation bandwidth of the RSOA, which was presented in Figure 13, and that causes ISI. This is illustrated by the closing of the 10 Gbit/s eye diagrams plotted in Figure 15b compared to that of the 5 Gbit/s eye diagrams in Figure 15a. In addition, at 10 Gbit/s, the transmission is limited to a 2 km SMF due to the interplay between chirp and chromatic dispersion.
To summarize, it can be seen how the RSOA-FCL in any of the transmission experiments performs midway between the ASE spectrum-sliced and the externally seeded sources. It is thus an alternative source for many instances, where neither ultimate speed nor ultimate transmission distance is needed. Our experiments indicate that the RSOA-FCL is a valid source for transmission of up to 10 Gbit/s in SMF fiber over up to 2 km and up to 5 Gbit/s over 8 km SMF and 25 km of NZDSF. The need for a NZDSF to achieve longer reach may challenge the cost-efficiency of the RSOA. However, such dispersion management can either be obtained by deploying NZDSF or by deploying O-band RSOAs [41,42]. In central offices, electronic chromatic dispersion could also be an option.

7. Conclusions

In this paper, we have demonstrated that self-seeded RSOA-FCL is a viable colorless source for short-reach applications up to 10 Gbit/s. It shares the simplicity and cost-efficiency of an ASE spectrum-sliced colorless source but offers a 5 dB SNR advantage over an ASE spectrum-sliced source. This SNR is only 5 dB below the SNR of a more expensive externally seeded RSOA source. Similarly, the frequency response is halfway between those of ASE and externally seeded sources. Here, we have shown transmission up to 5 and 10 Gbit/s over distances of 25 km NZDSF and 2 km SMF, respectively. Therefore, the RSOA-FCL is an economical alternative as an upstream source for, e.g., WDM-PON based mobile fronthaul networks.

Acknowledgments

This work was supported by the EU FP7 project ERMES grant agreement No. 288542 2012. Sterlite Technologies Ltd. is acknowledged for providing the fiber.

Author Contributions

Simon A. Gebrewold performed the simulation, set up and carried out the experimental work. Simon A. Gebrewold and Romain Bonjour analyzed the data and wrote the paper. Sophie Barbet, Anaelle Maho and Romain Brenot designed and fabricated the RSOA. Simon A. Gebrewold, Romain Brenot, Philippe Chanclou, Marco Brunero, Lucia Marazzi, Paola Parolari, David Hillerkuss, and Juerg Leuthold developed the concept and discussed the system. Angelina Totovic and Dejan Gvozdic discussed the system and proofread the paper. David Hillerkuss, Christian Hafner and Juerg Leuthold designed the experiment, wrote the paper and supervised the work.

Conflicts of Interest

The authors declare no conflict of interest.

References

  1. Saliou, F.; Simon, G.; Chanclou, P.; Pizzinat, A.; Lin, H.; Zhou, E.; Xu, Z. WDM PONs based on colorless technology. Opt. Fiber Technol. 2015, 26, 126–134. [Google Scholar] [CrossRef]
  2. Banerjee, A.; Park, Y.; Clarke, F.; Song, H.; Yang, S.; Kramer, G.; Kim, K.; Mukherjee, B. Wavelength-division-multiplexed passive optical network (WDM-PON) technologies for broadband access: A review (Invited). J. Opt. Netw. 2005, 4, 737–758. [Google Scholar] [CrossRef]
  3. Wong, E.; Ka-Lun, L.; Anderson, T.B. Directly Modulated Self-Seeding Reflective Semiconductor Optical Amplifiers as Colorless Transmitters in Wavelength Division Multiplexed Passive Optical Networks. J. Lightwave Technol. 2007, 25, 67–74. [Google Scholar] [CrossRef]
  4. Horiuchi, Y. Economical Solutions of the WDM-PON system. In Proceedings of the 2012 and the National Fiber Optic Engineers Conference on Optical Fiber Communication Conference and Exposition (OFC/NFOEC), Los Angeles, CA, USA, 4–8 March 2012; pp. 1–3.
  5. Chanclou, P.; Pizzinat, A.; le Clech, F.; Reedeker, T.L.; Lagadec, Y.; Saliou, F.; le Guyader, B.; Guillo, L.; Deniel, Q.; Gosselin, S.; et al. Optical fiber solution for mobile fronthaul to achieve cloud radio access network. In Proceedings of the Future Network Summit, Lisbon, Portugal, 3–5 July 2013; pp. 1–11.
  6. Reeve, M.; Hunwicks, A.; Zhao, W.; Methley, S.; Bickers, L.; Hornung, S. LED spectral slicing for single-mode local loop applications. Electr. Lett. 1988, 24, 389–390. [Google Scholar] [CrossRef]
  7. Chapuran, T.E. Broadband high-density WDM transmission using superluminescent diodes. Electr. Lett. 1990, 26, 696–697. [Google Scholar]
  8. Zirngibl, M.; Joyner, C.H.; Stulz, L.W.; Dragone, C.; Presby, H.M.; Kaminow, I.P. LARnet, a local access router network. IEEE Photonics Technol. Lett. 1995, 7, 215–217. [Google Scholar] [CrossRef]
  9. Jung, O.K.; Shin, S.K.; Woo, H.G.; Chung, Y.C. Wavelength-tracking technique for spectrum-sliced WDM passive optical network. IEEE Photonics Technol. Lett. 2000, 12, 338–340. [Google Scholar] [CrossRef]
  10. Park, S.B.; Jung, D.K.; Shin, D.J.; Shin, H.S.; Yun, I.K.; Lee, J.S.; Oh, Y.K.; Oh, Y.J. Colorless Operation of WDM-PON Employing Uncooled Spectrum-Sliced RSOA. IEEE Photonics Technol. Lett. 2007, 19, 248–250. [Google Scholar] [CrossRef]
  11. Henning, L.F.; Monteiro, P.; de Almeida-Prado-Pohl, A. Comparison of LED and RSOA performance in WDM-PONs. In Proceedings of the 2014 21st International Conference on Telecommunications (ICT), Lisbon, Portugal, 4–7 May 2014; pp. 124–128.
  12. Frigo, N.J.; Iannone, P.P.; Magill, P.D.; Darcie, T.E.; Downs, M.M.; Desai, B.N.; Koren, U.; Koch, T.L.; Dragone, C.; Presby, H.M.; et al. A wavelength-division multiplexed passive optical network with cost-shared components. IEEE Photonics Technol. Lett. 1994, 6, 1365–1367. [Google Scholar] [CrossRef]
  13. Cossu, G.; Bottoni, F.; Corsini, R.; Presi, M.; Ciaramella, E. 40 Gb/s Single R-SOA Transmission by Optical Equalization and Adaptive OFDM. IEEE Photonics Technol. Lett. 2013, 25, 2119–2122. [Google Scholar] [CrossRef]
  14. Buset, J.M.; El-Sahn, Z.A.; Plant, D.V. Experimental demonstration of a 10 Gb/s RSOA-based 16-QAM subcarrier multiplexed WDMPON. Opt. Express 2014, 22, 1–8. [Google Scholar] [CrossRef] [PubMed]
  15. De Valicourt, G.; Violas, M.A.; Wake, D.; van-Dijk, F.; Ware, C.; Enard, A.; Make, D.; Liu, Z.; Lamponi, M.; Duan, G.-H.; et al. Radio-over-Fiber Access Network Architecture Based on New Optimized RSOA Devices with Large Modulation Bandwidth and High Linearity. IEEE Trans. Microwave Theory Tech. 2010, 58, 3248–3258. [Google Scholar] [CrossRef]
  16. Zhang, Q.W.; Hugues-Salas, E.; Ling, Y.; Zhang, H.B.; Giddings, R.P.; Zhang, J.J.; Wang, M.; Tang, J.M. Record-high and robust 17.125 Gb/s gross-rateover 25 km SSMF transmissions of real-time dual-band optical OFDM signals directly modulated by 1 GHz RSOAs. Opt. Express 2014, 22, 6339–6348. [Google Scholar] [CrossRef] [PubMed]
  17. Marazzi, L.; Parolari, P.; Brenot, R.; de Valicourt, G.; Martinelli, M. Network-embedded self-tuning cavity for WDM-PON transmitter. Opt. Express 2012, 20, 3781–3786. [Google Scholar] [CrossRef] [PubMed]
  18. Marazzi, L.; Parolari, P.; Brunero, M.; Gatto, A.; Martinelli, M.; Brenot, R.; Barbet, S.; Galli, P.; Gavioli, G. Up to 10.7-Gb/s High-PDG RSOA-Based Colorless Transmitter for WDM Networks. IEEE Photonics Technol. Lett. 2013, 25, 637–640. [Google Scholar] [CrossRef]
  19. Gebrewold, S.A.; Marazzi, L.; Parolari, P.; Brunero, M.; Brenot, R.; Hillerkuss, D.; Hafner, C.; Leuthold, J. Colorless Self-Seeded Fiber Cavity Laser Transmitter for WDM-PON. In Proceedings of the 2014 Conference on CLEO, San Jose, CA, USA, 8 June 2014; Optical Society of America: San Jose, CA, USA; pp. 1–2.
  20. Duarte, U.R.; Rosolem, J.B.; Penze, R.S.; Romero, M.A. Analysis of ASE-Related Impairments on Wavelength-Reuse WDM-PONs Based on Self-Seeded Reflective SOAs. J. Opt. Commun. Netw. 2014, 6, 773–781. [Google Scholar] [CrossRef]
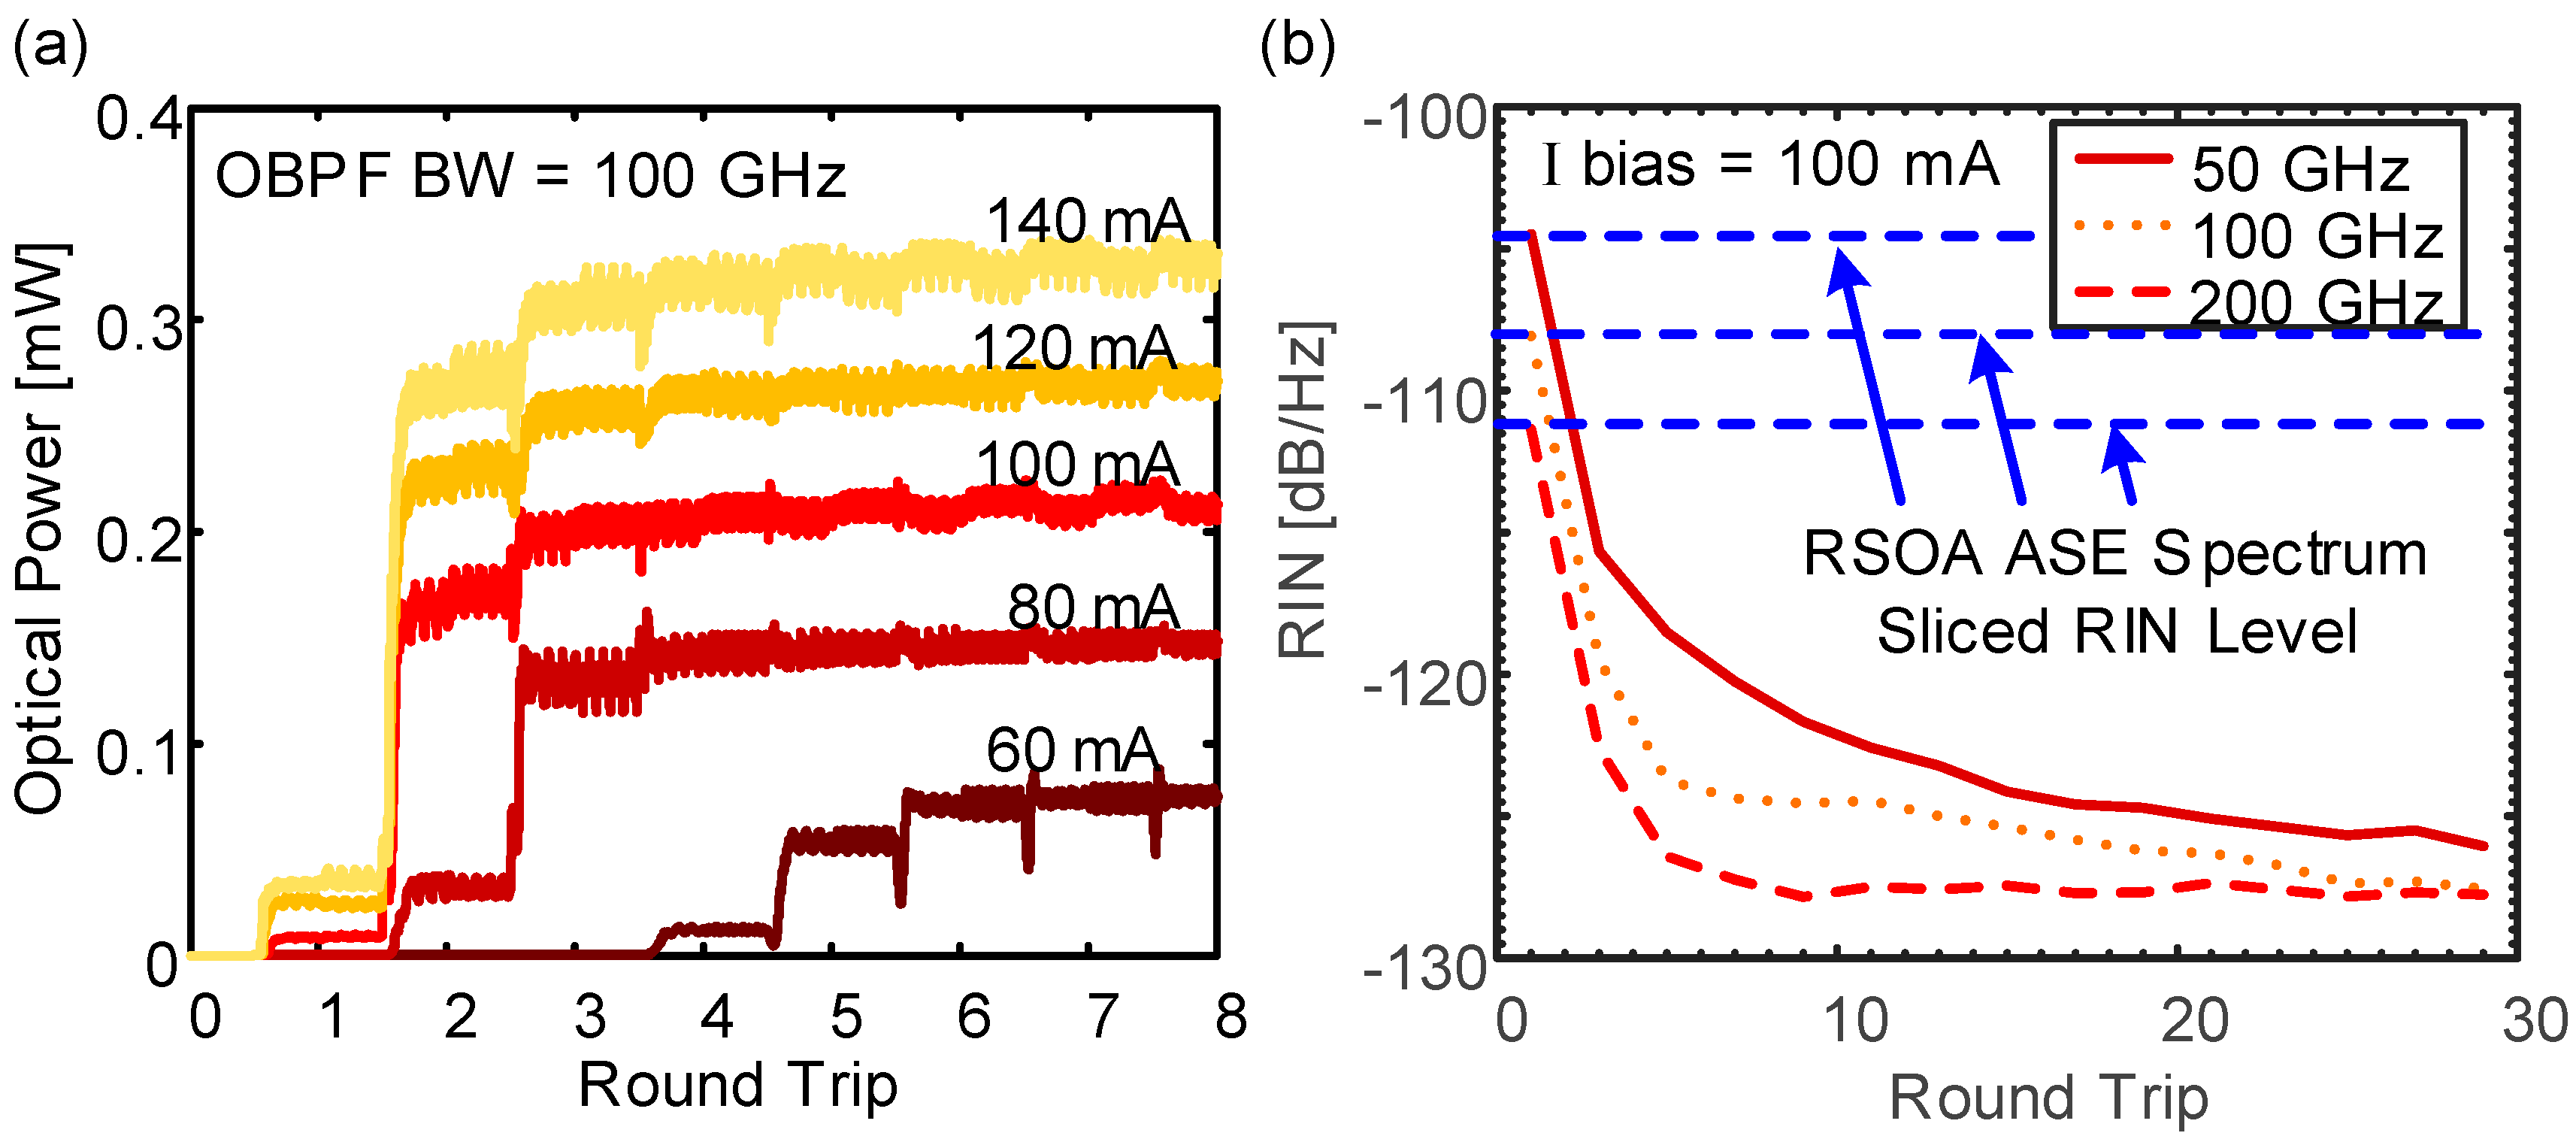
  21. Gebrewold, S.A.; Marazzi, L.; Parolari, P.; Brenot, R.; Duill, S.P.; Bonjour, R.; Hillerkuss, D.; Hafner, C.; Leuthold, J. Reflective-SOA Fiber Cavity Laser as Directly Modulated WDM-PON Colorless Transmitter. J. Sel. Top. Quantum Electr. 2014, 20, 1–9. [Google Scholar] [CrossRef]
  22. Pfeiffer, T. Next Generation Mobile Fronthaul Architectures. In Proceedings of the Conference on OFC, Los Angeles, CA, USA, 22 March 2015; Optical Society of America: Los Angeles, CA, USA; pp. 1–3.
  23. Daewon, L.; Hanbyul, S.; Clerckx, B.; Hardouin, E.; Mazzarese, D.; Nagata, S.; Sayana, K. Coordinated multipoint transmission and reception in LTE-advanced: Deployment scenarios and operational challenges. IEEE Commun. Mag. 2012, 50, 148–155. [Google Scholar]
  24. Common Public Radio Interface (CPRI). Interface Specification V6.1. Available online: http://www.cpri.info (accessed on 30 August 2013).
  25. Zhu, M.; Liu, X.; Chand, N.; Effenberger, F.; Chang, G.-K. High-Capacity Mobile Fronthaul Supporting LTE-Advanced Carrier Aggregation and 8 × 8 MIMO. In Proceedings of the Optical Fiber Communication Conference (OFC), Los Angeles, CA, USA, 22 March 2015; Optical Society of America: Los Angeles, CA, USA; pp. 1–3.
  26. Parolari, P.; Marazzi, L.; Brunero, M.; Martinelli, M.; Brenot, R.; Maho, A.; Barbet, S.; Gavioli, G.; Simon, G.; Le, S.D.; et al. C- and O-Band Operation of RSOA WDM PON Self-Seeded Transmitters up to 10Gb/s (Invited). J. Opt. Commun. Netw. 2015, 7, A249–A255. [Google Scholar] [CrossRef]
  27. Le, S.D.; Deniel, Q.; Saliou, F.; Lebreton, A.; Chanclou, P. 16 × 2.5 Gbit/s and 5 Gbit/s WDM PON based on self-seeded RSOA. In Proceedings of the 2013 15th International Conference on Transparent Optical Networks (ICTON), Cartagena, Spain, 23–27 June 2013; pp. 1–4.
  28. O’Duill, S.; Marazzi, L.; Parolari, P.; Freude, W.; Koos, C.; Leuthold, J. Modulation Cancellation Properties of Reflective SOAs. In Proceedings of the European Conference and Exhibition on Optical Communication, Amsterdam, The Netherlands, 16 September 2012; Optical Society of America: Amsterdam, The Netherlands, 2012; pp. 1–3. [Google Scholar]
  29. Connelly, M.J. Wideband semiconductor optical amplifier steady-state numerical model. IEEE J. Quantum Electr. 2001, 37, 439–447. [Google Scholar] [CrossRef]
  30. Dúill, S.Ó.; Marazzi, L.; Parolari, P.; Brenot, R.; Koos, C.; Freude, W.; Leuthold, J. Efficient modulation cancellation using reflective SOAs. Opt. Express 2012, 20, B587–B594. [Google Scholar] [CrossRef] [PubMed]
  31. Marazzi, L.; Parolari, P.; Brunero, M.; Mellerio, A.; Brenot, R.; Martinelli, M. Build-up analysis of an RSOA-based self-seeded transmitter. In Proceedings of the 2014 European Conference on Optical Communication (ECOC), Cannes, France, 21–25 September 2014; pp. 1–3.
  32. Brunero, M.; Marazzi, L.; Parolari, P.; Maho, A.; Brenot, R.; Martinelli, M. Experimental evaluation of burst-mode operation of a RSOA-based self-seeded transmitter. In Proceedings of the 2014 European Conference on Optical Communication (ECOC), Cannes, France, 21–25 September 2014; pp. 1–3.
  33. Duarte, U.R.; Romero, M.A.; Rosolem, J.B.; Penze, R.S.; Leonardi, A.A. Enhancement of chromatic dispersion and post-filtering effects tolerances on spectrum-sliced WDM-PONs using self-seeded reflective-SOAs. In Proceedings of the 2014 International Telecommunications Symposium (ITS), Sao Paulo, Brazil, 17–20 August 2014; pp. 1–5.
  34. Petermann, K. Noise Characterstics of Solitary Laser Diodes. In Laser Diode Modulation and Noise; Okoshi, T., Ed.; Kluwer Academic Publishers: Dordrecht, The Netherlands, 1998; pp. 152–208. [Google Scholar]
  35. Martinelli, M.; Marazzi, L.; Parolari, P.; Brunero, M.; Gavioli, G. Polarization in Retracing Circuits for WDM-PON. IEEE Photonics Technol. Lett. 2012, 24, 1191–1193. [Google Scholar] [CrossRef]
  36. Yoo, S.-H.; Mun, S.-G.; Kim, J.-Y.; Lee, C.-H. 1.25 Gb/s Broadcast Signal Transmission in WDM-PON Based on Mutually Injected Fabry-Perot Laser Diodes. J. Opt. Soc. Korea 2012, 16, 101–106. [Google Scholar] [CrossRef]
  37. Marazzi, L.; Parolari, P.; Boletti, A.; Gatto, A.; Martinelli, M.; Brenot, R. Highly-nonlinear RSOA RIN compression. In Proceedings of the European Conference on Networks and Optical Communications (NOC), Milan, Italy, 4–6 June 2014; pp. 115–119.
  38. Pfeiffer, T. Next Generation Mobile Fronthaul and Midhaul Architectures (Invited). J. Opt. Commun. Netw. 2015, 7, B38–B45. [Google Scholar] [CrossRef]
  39. Saliou, F.; Chanclou, P.; Charbonnier, B.; le Guyader, B.; Deniel, Q.; Pizzinat, A.; Genay, N.; Xu, Z.; Lin, H. Up to 15km Cavity Self Seeded WDM-PON System with 90 km Maximum Reach and up to 4.9 Gbit/s CPRI Links. In Proceedings of the ECOC, Amsterdam, The Netherlands, 16 September 2012; Optical Society of America: Amsterdam, The Netherlands, 2012; pp. 1–3. [Google Scholar]
  40. Koenig, S.; Bonk, R.; Schmuck, H.; Poehlmann, W.; Pfeiffer, T.; Koos, C.; Freude, W.; Leuthold, J. Amplification of advanced modulation formats with a semiconductor optical amplifier cascade. Opt. Express 2014, 22, 17854–17871. [Google Scholar] [CrossRef] [PubMed]
  41. Simon, G.; Saliou, F.; Chanclou, P.; Deniel, Q.; Erasme, D.; Brenot, R. 70 km external cavity DWDM sources based on O-band Self Seeded RSOAs for transmissions at 2.5 Gbit/s. In Proceedings of the Optical Fiber Communication Conference (OFC), San Francisco, CA, USA, 9 March 2014; Optical Society of America: San Francisco, CA, USA, 2014; pp. 1–3. [Google Scholar]
  42. Parolari, P.; Marazzi, L.; Brunero, M.; Martinelli, M.; Brenot, R.; Maho, A.; Barbet, S.; Gavioli, G.; Simon, G.; Saliou, F.; et al. 10-Gb/s Operation of a Colorless Self-Seeded Transmitter over More than 70 km of SSMF. IEEE Photonics Technol. Lett. 2014, 26, 599–602. [Google Scholar] [CrossRef]

