Article

Key Performance Indicators for Sustainable Stormwater Management in Architectural and Urban Design: Assessment Framework and Application in the Urban Context of Rome

Department of Planning, Design, Technology of Architecture, Sapienza University of Rome, via Flaminia 72, 00196 Rome, Italy
*
Author to whom correspondence should be addressed.
Appl. Sci. 2026, 16(8), 3762; https://doi.org/10.3390/app16083762
Submission received: 8 March 2026 / Revised: 9 April 2026 / Accepted: 10 April 2026 / Published: 12 April 2026

Featured Application

The proposed KPI-based assessment framework supports designers, planners and policymakers in comparing heterogeneous stormwater management solutions and selecting context-appropriate strategies for climate-sensitive urban areas. Its transparent and harmonised scoring system enables rapid benchmarking of green–blue and grey technologies, guiding early-stage design choices and facilitating the integration of multiscale SWM solutions in both new developments and retrofit projects.

Abstract

Urban areas are increasingly exposed to water-related challenges, including flood risk and water scarcity, amplified by climate change, population growth, and extensive soil sealing. Addressing these pressures requires integrated stormwater management (SWM) strategies that balance hydraulic, environmental, and social objectives. This study introduces a novel, replicable Key Performance Indicator (KPI)-based assessment framework for 36 green–blue and grey sustainable stormwater management systems (SWMSs), designed to enable cross-typology, multiscale comparison. Six KPIs, encompassing flood regulation, water consumption, water quality, air quality, environmental amenity, and biodiversity potential, are derived through a critical synthesis and harmonisation of the literature and complemented with new parameters and sub-parameters to address existing methodological gaps. The framework structures evaluations into six analytical tables and one summary table, ensuring transparent, systematic, and comparative assessment of heterogeneous solutions. Application to a pilot project in Rome demonstrates how integrating KPI evaluation with parametric hydraulic modelling provides actionable insights for solution selection. It also facilitates identification of potential synergies between performance dimensions, enhancing its value as a decision-support tool in preliminary design. Overall, the study demonstrates the research value of multi-scalar, performance-based approaches for urban water planning, highlights the transferability of resilient stormwater strategies in climate-sensitive contexts, and identifies promising avenues for future research, including multi-sectoral integration, trade-off analysis, and cross-platform application.

1. Introduction

Historical evidence highlights an enduring interdependence between water availability and socioeconomic development. Over the past century, global freshwater consumption has increased more than sixfold and continues to grow at around 1% annually, driven by population expansion, urbanisation, and evolving consumption patterns [1]. Urban areas are at the core of this escalation: climate change intensifies hydrological variability, while demographic pressure and soil sealing amplify both water scarcity and flood risk. Water insecurity undermines environmental stability, economic development, and human well-being. Despite this, over 25% of supplied water in buildings, construction sites and industrial facilities is wasted [2], exacerbating stress on freshwater ecosystems and increasing energy and greenhouse gas emissions associated with water supply and treatment.
Climate change is already altering and will further intensify and accelerate the global hydrological cycle. More frequent and intense extreme-rainfall events contribute to pluvial flooding, while prolonged dry periods and rising temperatures reduce water availability, groundwater recharge, soil moisture, and surface water quality [1]. In Europe, especially in Mediterranean regions identified as climate change hotspots [3,4], four major water-related risks emerge: stronger and more prolonged heat waves threatening human lives and terrestrial and marine ecosystems; agricultural losses from heat stress and drought; widespread water scarcity in southern Europe, affecting central and western Europe under warming scenarios above +3 °C; and increased frequency and intensity of coastal, riverine, and pluvial floods [4].
Within this complex scenario, cities must rethink stormwater management (SWM) paradigms. Traditional drainage systems discharge stormwater rapidly into the sewerage and are often obsolete or undersized, proving increasingly inadequate to withstand extreme precipitation and support long-term water security. In contrast, ecological and climate-aware approaches emphasise the multifunctional role of water within urban environments, integrating storage, infiltration, reuse, and treatment [5,6]. Ecological systems aim to reduce water consumption and promote circularity through rainwater harvesting, greywater reuse, and smart regulation technologies. Climate-aware systems mitigate flooding and drought impacts by combining green–blue with grey infrastructure and employing flood-proof design strategies and adaptive planning [7]. A truly resilient approach requires the integration of ecological and climate-aware dimensions through adaptive, low-impact, and resource-efficient solutions applied at multiple design scales.
The performance evaluation of stormwater management systems (SWMSs) in architecture remains an open scientific field. Existing studies, ranging from conventional systems to Sustainable Urban Drainage Systems (SUDSs), hybrid conventional–SUDS schemes, and wastewater systems [8], tend to fragment performance assessment into sector-specific metrics, often losing a holistic perspective on water management. Among sustainable solutions, studies tend to focus on SUDS practices, evaluating some typical solutions based on hydrological–hydraulic criteria, treatment capacity, environmental and social benefits, and economic effects [5,9,10,11]. Performance analysis of ecological systems, essentially applied to sewer systems and wastewater treatment plants, follows distinct metrics centred on physical–chemical, environmental, operational, service-quality, and economic indicators [12,13]. Furthermore, only a few recent studies have explored the performance of adaptive construction practices and solutions addressing flood risk [6]. The main gaps in the literature concern the difficulty of integrating indicators addressing water scarcity and reuse potential with flood-related issues, as well as the absence of a truly multi-scalar perspective in the selection and assessment of SWMSs. As a result, designers and decision-makers lack operational instruments to compare alternative solutions across different spatial conditions, especially in Mediterranean contexts characterised by alternating periods of severe drought and intense rainfall. This highlights the need for comprehensive, performance-based evaluation criteria capable of supporting preliminary design.
This study develops an integrated evaluation tool composed of six multidisciplinary Key Performance Indicators (KPIs) suitable for assessing 36 technological solutions for ecological and climate-aware urban SWM identified through the analysis of the technical–scientific literature [5,6,14,15] and innovative case studies [16] and classified according to their multiscale applicability and design strategies [17]. Each KPI includes sub-parameters derived from a systematic literature review and complemented by newly introduced indicators. Heterogeneous data are homogenised through an explicit and replicable methodological process.
This article presents the evaluative component of a broader knowledge-oriented framework previously developed by the authors, which structures objectives, strategies, and design solutions for sustainable SWM through a project-oriented matrix [17]. This matrix was complemented by the development of a parametric tool for sizing storage volumes of SWMSs under extreme stormwater events [7], although it did not address performance evaluation in a comprehensive and systematic manner.
The present study advances this line of research by introducing an original KPI-based assessment framework that enables the comparative evaluation of heterogeneous SWMSs across multiple scales and under varying hydrological conditions. The resulting analytical and summary tables, together with their application to a pilot project in the city of Rome, provide an operational tool to support preliminary design decisions. The research represents an advancement over existing assessment tools, offering a more comprehensive reference framework capable of guiding informed decision-making and design choices, while demonstrating alignment with both mitigation and adaptation objectives.

2. Materials and Methods

2.1. Research Methodology

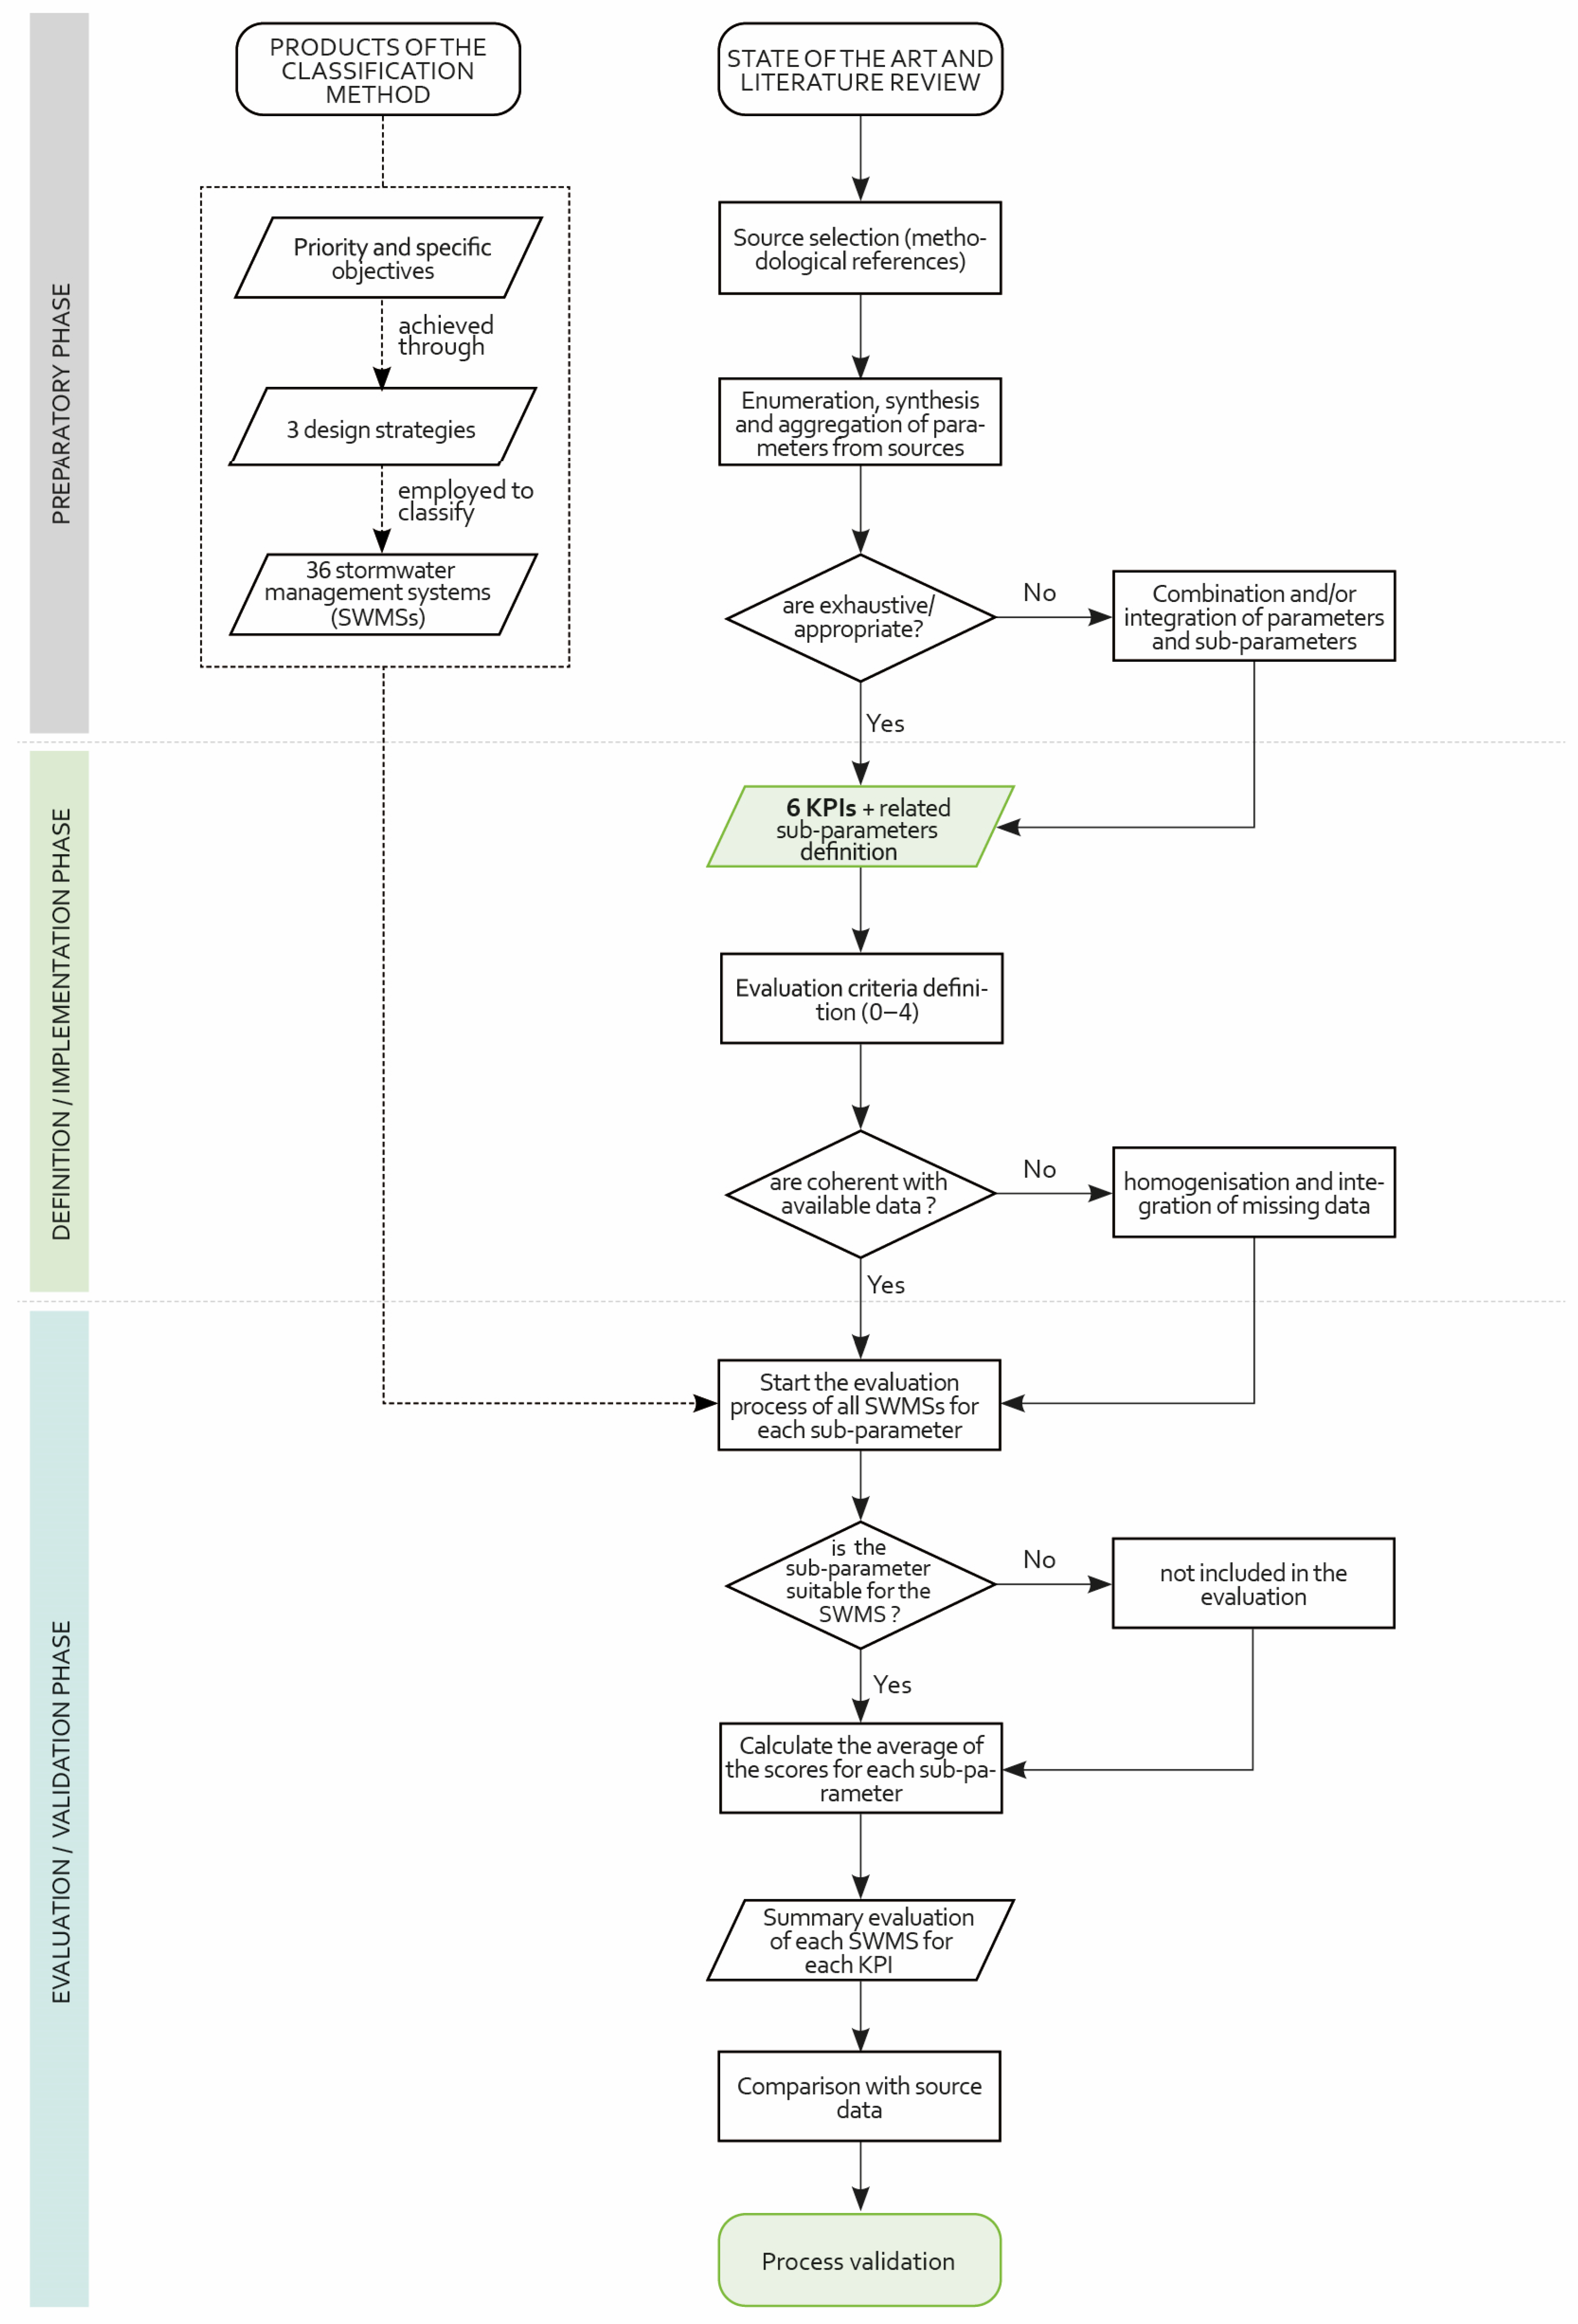
The research adopts a replicable methodology to assess 36 green–blue and grey SWMSs identified and classified by the authors [17], evaluated under both water-excess and water-scarcity conditions, while accounting for their environmental and social co-benefits. The methodological workflow (Figure 1) comprises three macro-phases (preparation, implementation and validation) articulated into five main consequential processes:
  • State of the art and literature review: Systematic collection and critical analysis of performance metrics and indicators from manuals and scientific studies; identification of methodological references and selection of reliable sources.
  • Enumeration, synthesis and aggregation of indicators: Extraction of candidate parameters and sub-parameters across sources; grouping into conceptual clusters (hydraulic, ecological, water quality, air/microclimate, amenity, biodiversity) to verify completeness.
  • Indicator design and harmonisation: Selection of consistent parameters and indicators from sources; critical combination or integration of parameters and sub-parameters; definition of a six-KPI assessment framework.
  • Scoring and evaluation: Establishment of scoring criteria and homogenisation of data across sources; assignment of scores to each solution/sub-parameter; derivation of KPI values as the arithmetic mean of their sub-parameters.
  • Validation and comparison: Cross-checking of resulting rankings with scientific datasets, technical specifications, and project evidence to ensure consistency and coherence.
Among the broad set of consulted sources, two internationally recognised references from Research Institutes emerge as the methodological foundations for the assessment framework, providing evaluation criteria and scoring rules [9,10], and technical data [5], thus ensuring transparency and robustness. The CEREMA Institute evaluates eight ecosystem services provided by 18 vegetated SWMSs [9,10] grouped into “regulatory services”, “cultural services” and “biodiversity”, providing scoring rules through a matrix of parameters and sub-parameters [9]. CIRIA, instead, reorganises similar thematic areas into four broader design principles (water quantity, water quality, amenity and biodiversity), outlining 13 categories of SUDSs together with their performance characteristics [5].
The combined analysis of these sources highlights both areas of overlap (e.g., the joint treatment of water excess and scarcity within single metrics) and areas where explicit criteria are missing, such as the assessment of water consumption as an independent indicator in SWM, the systematic evaluation of flood-risk adaptability in flooding regulation, or the formalisation of pollution prevention as a core contribution in water quality regulation. Moreover, these assessment methods focus on a specific subset of solutions (predominantly vegetated SUDSs) without providing a comparative structure capable of evaluating a wider and more heterogeneous range of SWMSs, thus limiting cross-typology benchmarking.
To address these gaps, the parameters from the main references are reorganised, filtered, and complemented with additional sources: the LiFE Project Toolbox [6] by Baca Architects provides structured criteria for evaluating green–blue and grey solutions’ suitability against low-, medium- and high-flood-risk conditions, thus allowing integration of this core parameter in the KPIs’ formation; the Susdrain platform [14] is employed to refine and cross-check performance scores for specific SUDS components, providing qualitative judgement on 5-point-scale criteria (from poor to high) based on technical documentation [5,15].
Through the synthesis and grouping of parameters and indicators across sources and their subsequent critical comparison aimed at verifying their coherence and completeness against the research objectives, eventually combining or integrating parameters and sub-parameters, a new framework of six KPIs is developed. The selection of the six KPIs is based on both the frequency of parameters reported in the literature and their relevance to evaluating heterogeneous SWMSs, ensuring coverage of hydraulic, environmental, and socio-ecological functions. Each KPI consists of specific sub-parameters (Table 1) derived from the literature review and critically reorganised and supplemented by the authors.
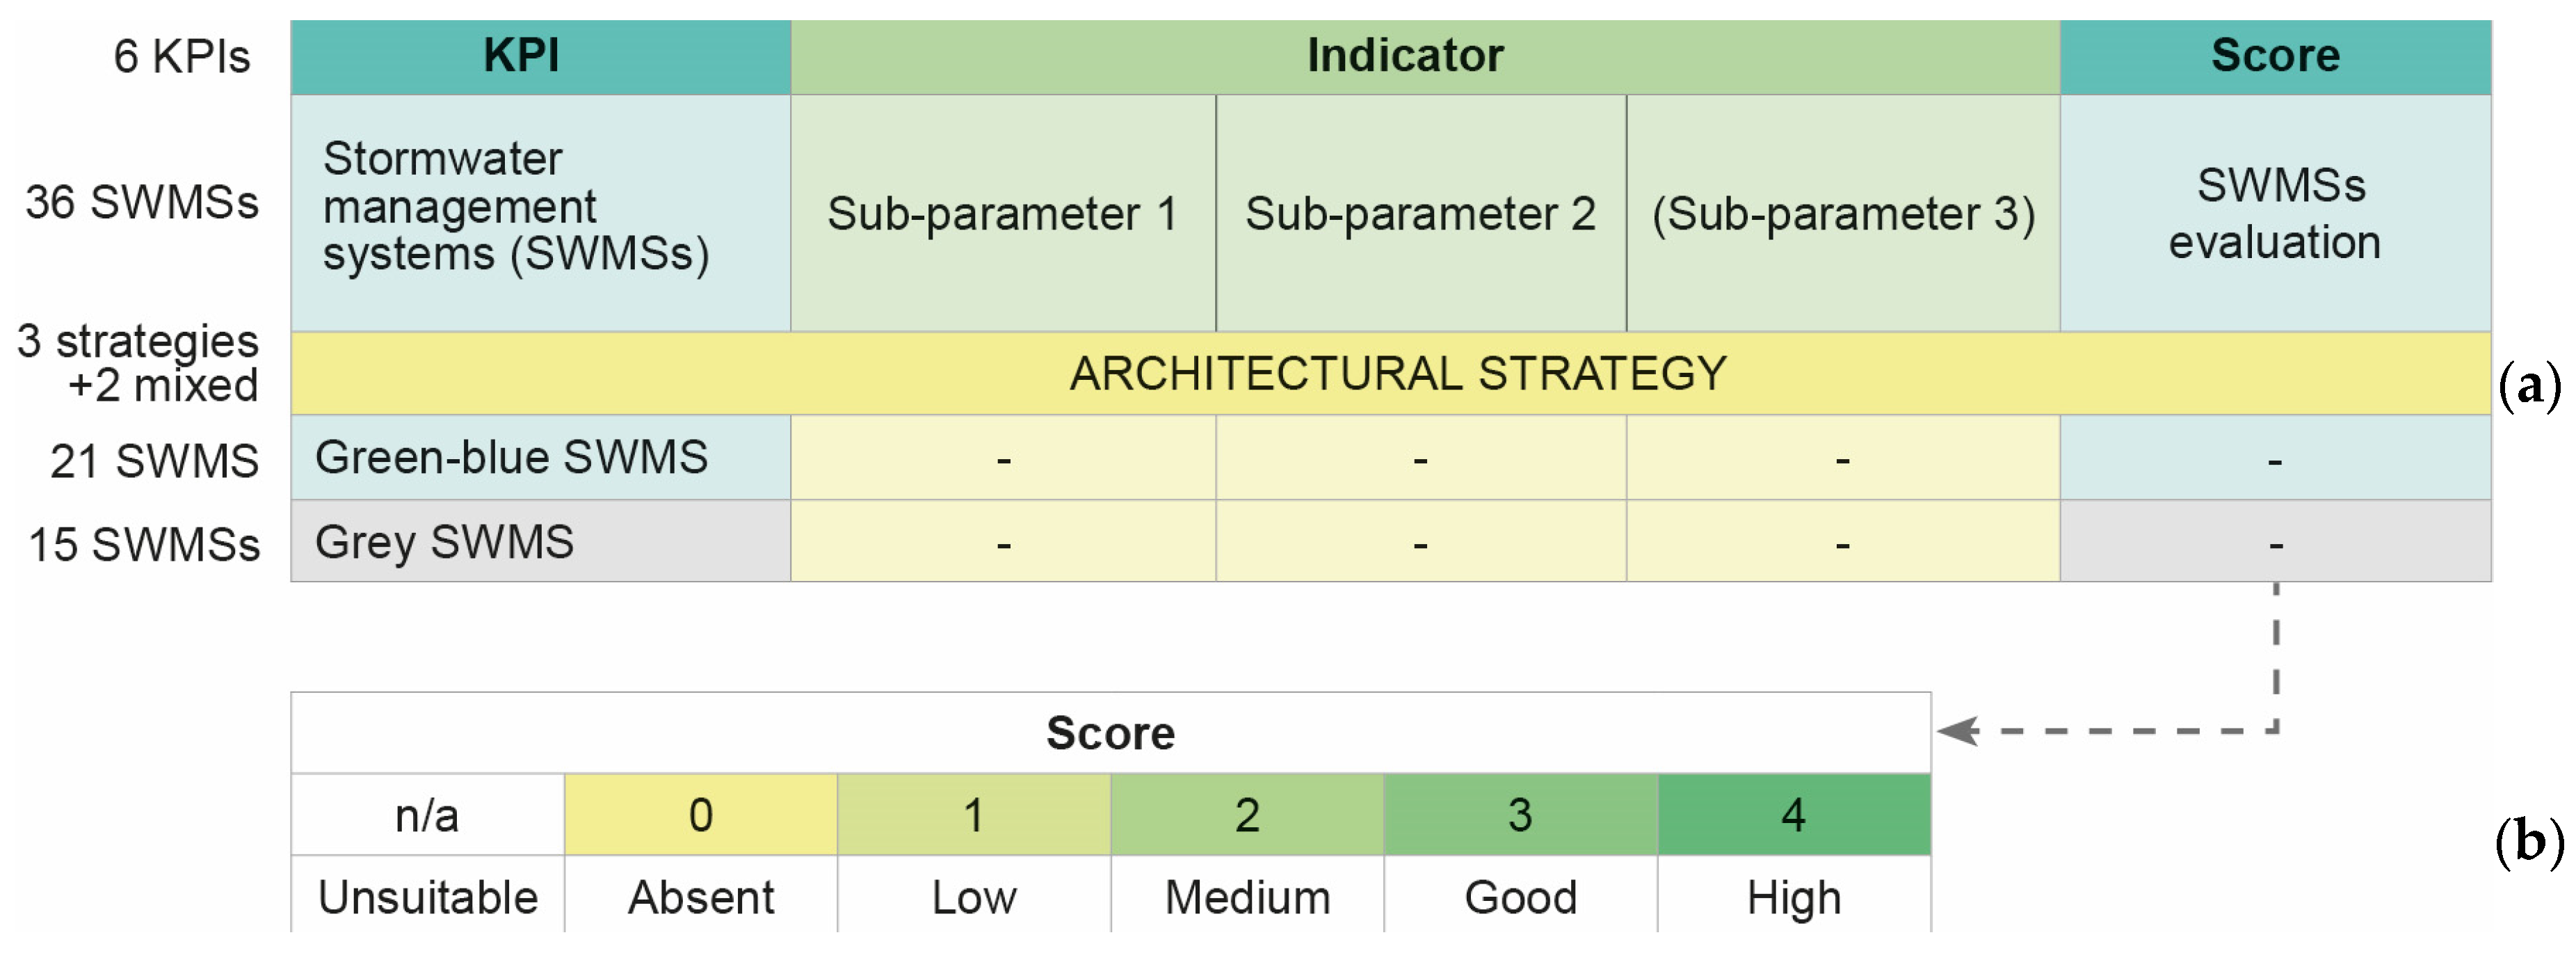
In the evaluation phase, the 36 solutions are assessed first by sub-parameter and then by KPI. Sub-parameters are evaluated by assigning a score on a 0–4 scale representing the relative effectiveness of each SWMS (0 = absent; 1 = low; 2 = medium; 3 = good; 4 = high). The overall evaluation is obtained by calculating the arithmetic mean of the scores assigned to the sub-parameters composing each KPI (Figure 2).
Sub-parameters deemed non-assessable for a specific solution are excluded from the KPI calculation, with the mean computed only over the assessable sub-parameters, so that each KPI score reflects the functions effectively provided by that solution. Accordingly, “assessability” refers to the extent to which a KPI can be evaluated for a given SWMS based on the compatibility between its sub-parameters and the system’s technological characteristics.
An equal-weighting approach is adopted to ensure comparability and avoid the introduction of arbitrary weighting factors. The KPIs represent complementary dimensions of stormwater management performance and are treated as equally relevant within the framework. This approach is consistent with early-stage decision-support tools, where the objective is to enable a balanced comparison among heterogeneous solutions. The full list of the 36 SWMSs evaluated is provided in Table 2.
Scores are assigned starting from the CIRIA and CEREMA studies [5,10] and subsequently integrated through comparison with the additional sources [6,14]. While in [10] scores adopt the same 0–4 rating logic, a harmonisation procedure ensures comparability among the other heterogeneous data. The process is based on logical–mathematical criteria tailored to the different types of data available: for macro- and micro-pollutant mitigation, the pollution mitigation index (0–1) provided in [5] is divided into quartiles and aligned with the 0–4 scale; the five-level qualitative ratings provided by [14] (poor, low, medium, good, high), are condensed to four levels by verifying the overlap between “poor” and “low” categories; flood-risk suitability classes in [6] are cross-referenced with their corresponding hazard levels to derive a 0–4 score.
When a source lacks data, scores are supplemented using technical specifications [5], analogous technological solutions, or evidence from case studies [16]. Analogous solutions are identified based on functional equivalence, design characteristics, and comparable operational mechanisms, while case studies are included according to data availability, relevance to the SWMS category, and contextual comparability. Data supplementation is systematically supported by cross-source verification and conservative attribution criteria in cases of uncertainty.
Although some sub-parameters (e.g., amenity-related indicators) involve qualitative assessment, scoring is grounded in criteria consistently derived from the selected sources. The integration of harmonisation procedures and cross-referencing ensures coherent score attribution, limits subjective bias, and guarantees full coverage of all 36 solutions, thereby supporting transparency, reproducibility, and consistency across the evaluation framework.

2.2. The Six KPIs in Relation to the Scientific Literature

The definition of the six KPIs stems from a comparative analysis of how the methodological references conceptualise the performance of sustainable SWMSs. Each KPI consolidates the hydraulic, environmental and socio-ecological functions consistently identified across the sources, while incorporating parameters and sub-parameters that address the gaps highlighted in Section 2.1. In the following sub-sections (Section 2.2.1, Section 2.2.2, Section 2.2.3, Section 2.2.4, Section 2.2.5 and Section 2.2.6), each KPI is presented in relation to the literature from which it is derived, together with the specific assessment dimensions integrated within its sub-parameters.

2.2.1. KPI 1—Flood Regulation

The first KPI evaluates the capacity of SWMSs to manage flooding events, explicitly separating the two key issues of water scarcity and excess. While the literature often combines these aspects, such as CEREMA’s “flood regulation and groundwater recharge” parameter [9,10] and CIRIA’s “design for water quantity approach” [5], this KPI selects parameters specifically aimed at flood mitigation. Additionally, this study introduces a novel sub-parameter to account for the suitability of solutions under different flood hazard scenarios [6]. Compared to existing frameworks, which primarily evaluate flood regulation in terms of hydrological performance, this sub-parameter explicitly incorporates the relationship between system performance and varying hazard conditions, thereby extending the assessment to a risk-informed perspective. The KPI is structured into three sub-parameters:
  • Stormwater runoff peak flow reduction
Peak flow (m3/s) is the maximum discharge at the outlet during a storm [18]. The outlet flow starts from a base flow, reaches a peak, and recedes, forming a hydrograph. SUDSs reduce peak flows by attenuation, slowing and storing runoff for controlled release [5]. This sub-parameter is evaluated by comparing maximum outlet flow with and without the control system [5,10,14].
  • Stormwater runoff volume reduction
Runoff volume (m3) is the total runoff leaving the site. Attenuation extends the hydrograph, controlling peak flows but potentially increasing duration and sediment transport [5,19]. SUDSs can reduce runoff volume via infiltration, evapotranspiration, and on-site rainwater reuse. Evaluation is based on the volume dispersed through these processes or stored on-site [5,10,14].
  • Flood-risk management suitability
This sub-parameter measures a solution’s adaptability to low, medium, and high flood risks, defined by hazard (flood probability and magnitude, including depth, velocity, duration, debris), exposure of people and assets, and vulnerability (susceptibility and adaptive capacity) [20]. Suitability depends on the solution’s ability to accommodate large volumes and withstand impacts. Practical evaluation follows the LiFE Project Toolkit, combining flood regulations, building codes, safety and planning to assess solutions across risk levels [6]. Solutions performing well under multiple flood hazard scenarios are rated higher.

2.2.2. KPI 2—Water Consumption Regulation

The second KPI is originally defined for this study, based on the analysis of the characteristics of individual technological solutions in the literature [5,15]. While existing indicators typically assess water consumption at the building or household scale [21], integrated urban SWMSs have never been explicitly evaluated for this parameter in the literature, despite their recognised benefits for overall water use. This KPI therefore introduces a new assessment dimension by directly linking stormwater management solutions to water demand reduction and reuse potential, extending the evaluation beyond conventional building-level approaches.
The KPI is structured into three sub-parameters:
  • Storage capacity for rainwater reuse
This sub-parameter quantifies the volume of rainwater (m3) that can be stored on-site for non-potable reuse. It reflects the ecological contribution of SWMSs by promoting water reuse and reducing potable water demand. Scoring reflects the presence, typology and effective size of surface or sub-surface storage elements, as described in [5,15] technical guidance.
  • Potential association with other recovery/filtration devices
This parameter assesses the flexibility of a given solution to be combined with additional recovery or filtration systems, enhancing the overall water recovery potential [21]. Unlike the storage capacity, this sub-parameter applies even to solutions without inherent storage, by evaluating their compatibility with supplementary devices for rainwater collection and treatment [CIRIA].
  • Water demand
This sub-parameter measures the capacity of a solution to minimise water consumption. It considers both the intrinsic water use of the system (e.g., irrigation needs for green infrastructure) and the integration of technologies that limit or optimise water use [21]. Lower water demand corresponds to higher performance in this KPI.

2.2.3. KPI 3—Water Quality Regulation

The third KPI evaluates the capacity of SWMSs to manage urban water pollution and protect surface and groundwater quality. It is structured into three sub-parameters: two address pollution mitigation, as widely recognised in the literature [5,9,10], while the third, pollution prevention, is introduced here as an innovative criterion explicitly addressing preventive strategies. Unlike conventional indicators focused on pollutant removal, this sub-parameter captures upstream design and management measures that reduce pollutant generation and runoff at the source, complementing mitigation-based approaches with a preventive perspective. The KPI is structured into three sub-parameters:
  • Macro-pollutant mitigation
This sub-parameter measures the removal efficiency (%) of total suspended solids and organic matter. Macro-debris in urban runoff includes organic material, large particulates, and animal waste [5,22]. Assessment is based on the solution’s ability to remove these pollutants through physical, chemical, and biological processes, such as filtration, sedimentation, and biodegradation [5,10].
  • Micro-pollutant mitigation
This sub-parameter evaluates the reduction (%) in micro-pollutants, including heavy metals, hydrocarbons, and emerging contaminants. Sources include building materials or biocides from exterior paints [23,24], vehicle emissions and engine leaks [5], combustion processes [25], atmospheric deposition, and litter wash-off [26,27]. The evaluation considers the efficiency of SWMSs in removing these pollutants via physical, chemical, or biological processes [5,10].
  • Pollution prevention
This sub-parameter assesses the capacity to prevent pollutants from entering runoff, through site design, management, and operational measures. Strategies include runoff minimisation via storage and retention devices, reduction in impervious surfaces, good housekeeping, and educational campaigns [5,14]. Performance can be quantified by the reduction in runoff and discharge volumes (m3) associated with the implemented solution [5,10,14].

2.2.4. KPI 4—Air Quality Regulation

The fourth KPI evaluates the capacity of SWMSs to improve urban air quality and microclimate conditions. It integrates two concepts separated in CEREMA’s framework into two indicators (microclimate regulation and air quality regulation) [9,10] and selects, from CIRIA’s broader “design for amenity approach”, only the elements directly related to air quality [5]. Since microclimate regulation is, together with pollutant reduction, a key aspect in defining air quality, it was made a direct sub-parameter of that KPI, which is thus structured into two sub-parameters:
  • Urban Heat Island (UHI) reduction and microclimatic improvements
This sub-parameter measures the capacity of SWMSs to mitigate UHI effects and improve microclimatic comfort. Mechanisms include evapotranspiration, solar radiation reflection, and shading through vegetation and water features, which also regulate relative humidity [5,10]. The benefits of this sub-parameter can be quantified by measuring changes in urban temperature, mean radiant temperature, relative humidity, and thermal comfort indices (e.g., Predicted Mean Vote and Percentage of People Dissatisfied) following the implementation of the SWMS [10,28].
  • Air pollutant absorption/capture capacity
This sub-parameter assesses the ability of vegetation to absorb gaseous pollutants, including nitrogen dioxide (NO2), sulphur dioxide (SO2), and ozone (O3), and capture particulate matter (PM10), improving local air quality and human health [14]. Evaluation is based on the type and density of vegetation implemented within the SWMS [5,10].

2.2.5. KPI 5—Environmental Amenity

The fifth KPI evaluates the contribution of SWMSs in enhancing place quality and supporting social use. It integrates two concepts that CEREMA treats as separate indicators (landscape amenity and recreational/leisure activities) [9,10] and selects, from CIRIA’s broader “design for amenity approach,” only the components directly related to environmental quality and social interaction [5]. The KPI is structured into two sub-parameters:
  • Visual and sensorial pleasure
This sub-parameter assesses the aesthetic and experiential quality of the site, reflecting concepts of beauty and urban liveability. Objective criteria include the presence, type, and arrangement of vegetation, as well as the integration of water as an urban element [5,10]. To ensure consistency in scoring, these aspects are evaluated against recurring criteria identified in the literature, such as diversity of vegetation, spatial configuration, and integration with the built environment, each corresponding to increasing levels of perceived environmental quality.
  • Leisure, multifunctionality, and accessibility potential
This sub-parameter measures the capacity of a solution to support social interaction, multiple uses, and safe human accessibility. The evaluation is based on explicit criteria including accessibility conditions, range of supported uses, and compliance with safety requirements, allowing the attribution of scores according to clearly distinguishable levels of functionality and user interaction.

2.2.6. KPI 6—Biodiversity Potential

The sixth KPI evaluates the capacity of SWMSs to support ecological functions and enhance urban biodiversity. It originates from CEREMA’s indicator “degree of functional similarity with a natural area enabling biodiversity to be hosted and developed” [9,10], which is considered sufficiently comprehensive to encompass all relevant ecological aspects, consolidating into a single evaluative dimension the “design for biodiversity approach” outlined by CIRIA [5]. The KPI is structured around one sub-parameter:
  • Degree of functional similarity to a natural area
This sub-parameter evaluates the extent to which the solution can reproduce natural habitat functions capable of hosting and supporting biodiversity. Key criteria include the presence of vegetated and water-based components enabling ecological processes, as well as the potential to contribute to habitat connectivity when integrated into broader green networks [14]. The assessment considers structural features and specific technological layers designed to enhance ecological potential and favour the establishment of flora and fauna [5,10,14].

2.3. Application of the Evaluation Method

The proposed method has enabled the evaluation of a framework of 36 technological solutions for resilient and climate-neutral urban SWM classified into three architectural strategies: water diversion, (keeping runoff away from buildings and open spaces through conveyance systems); water reception (allowing water to reach or temporarily enter dedicated floodable areas or structures); and source control (managing water near its point of generation to collect, reuse, infiltrate, or return it to nature) [17]. Solutions traceable to multiple design strategies are classified as combined.
The 36 solutions analysed operate across multiple spatial scales (building, site, neighbourhood/district and city) and are selected based on their relevance to water resource management rather than on data availability or uniformity. This approach is intended not only to map existing knowledge, but also to identify scientific and operational gaps that could be addressed with an adequate degree of confidence. Through a multi-scalar and multidisciplinary procedure, a replicable framework is developed in which each solution can be assessed using the six KPIs defined in this study.
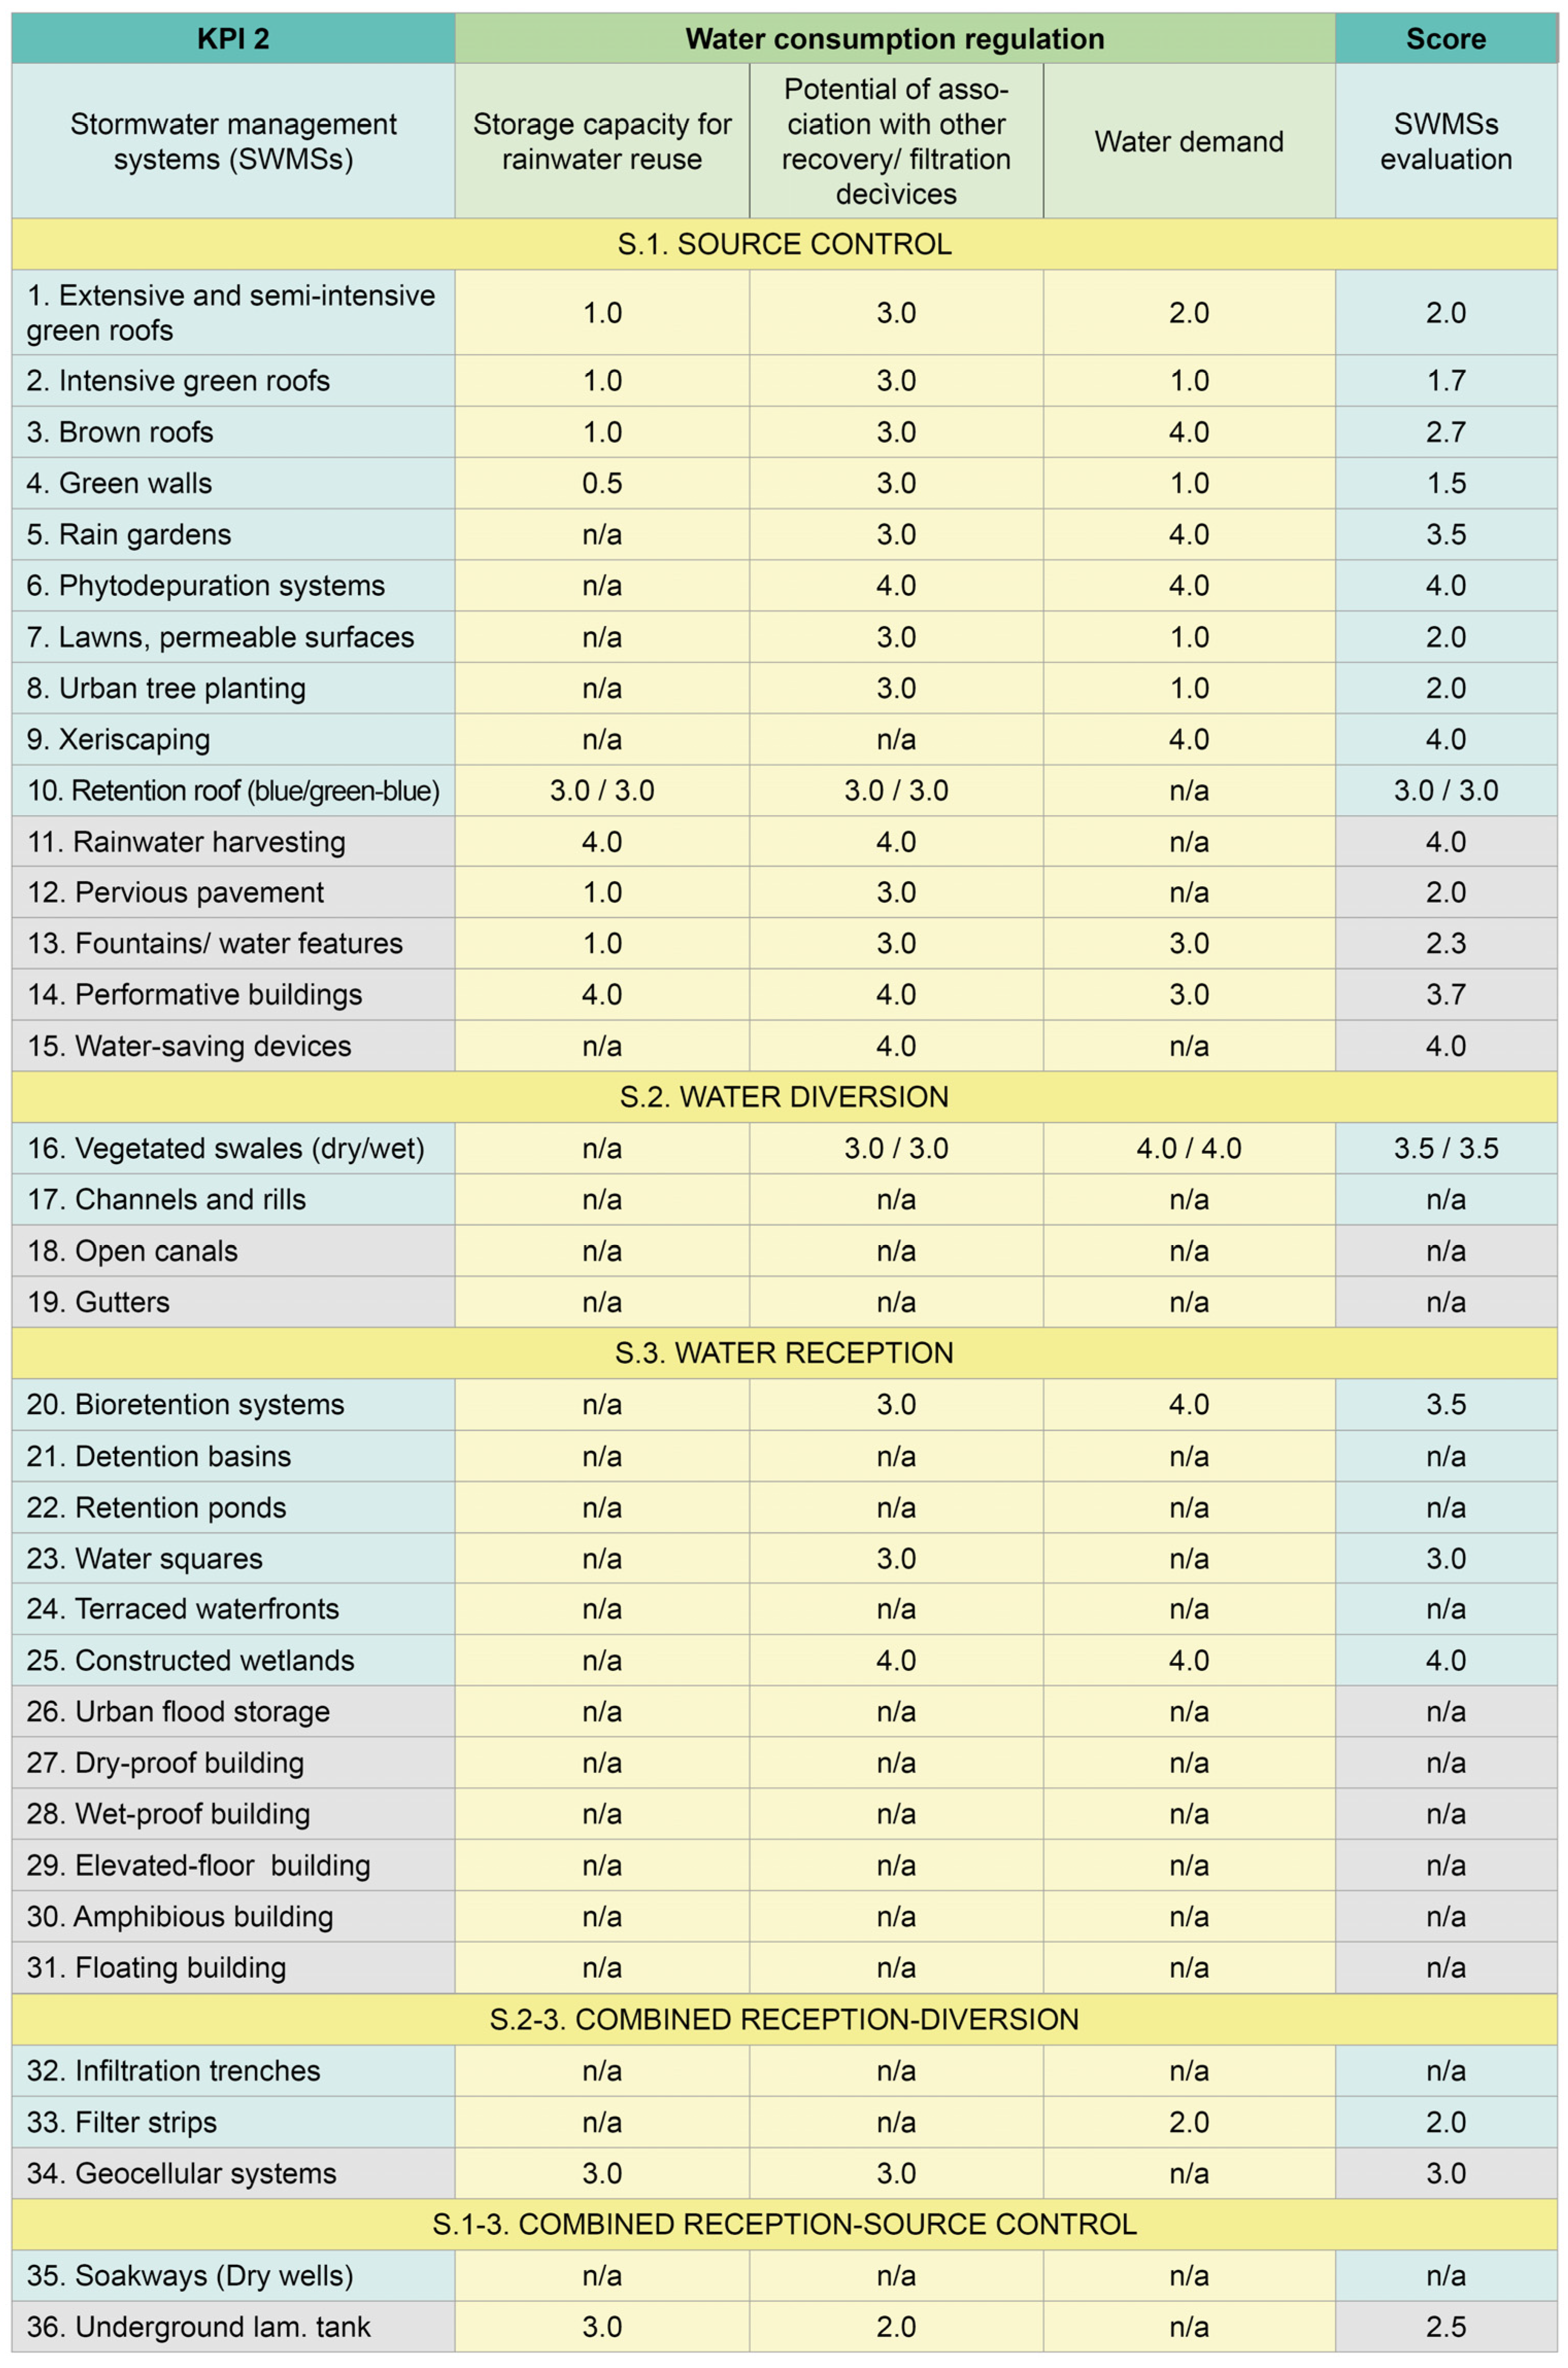
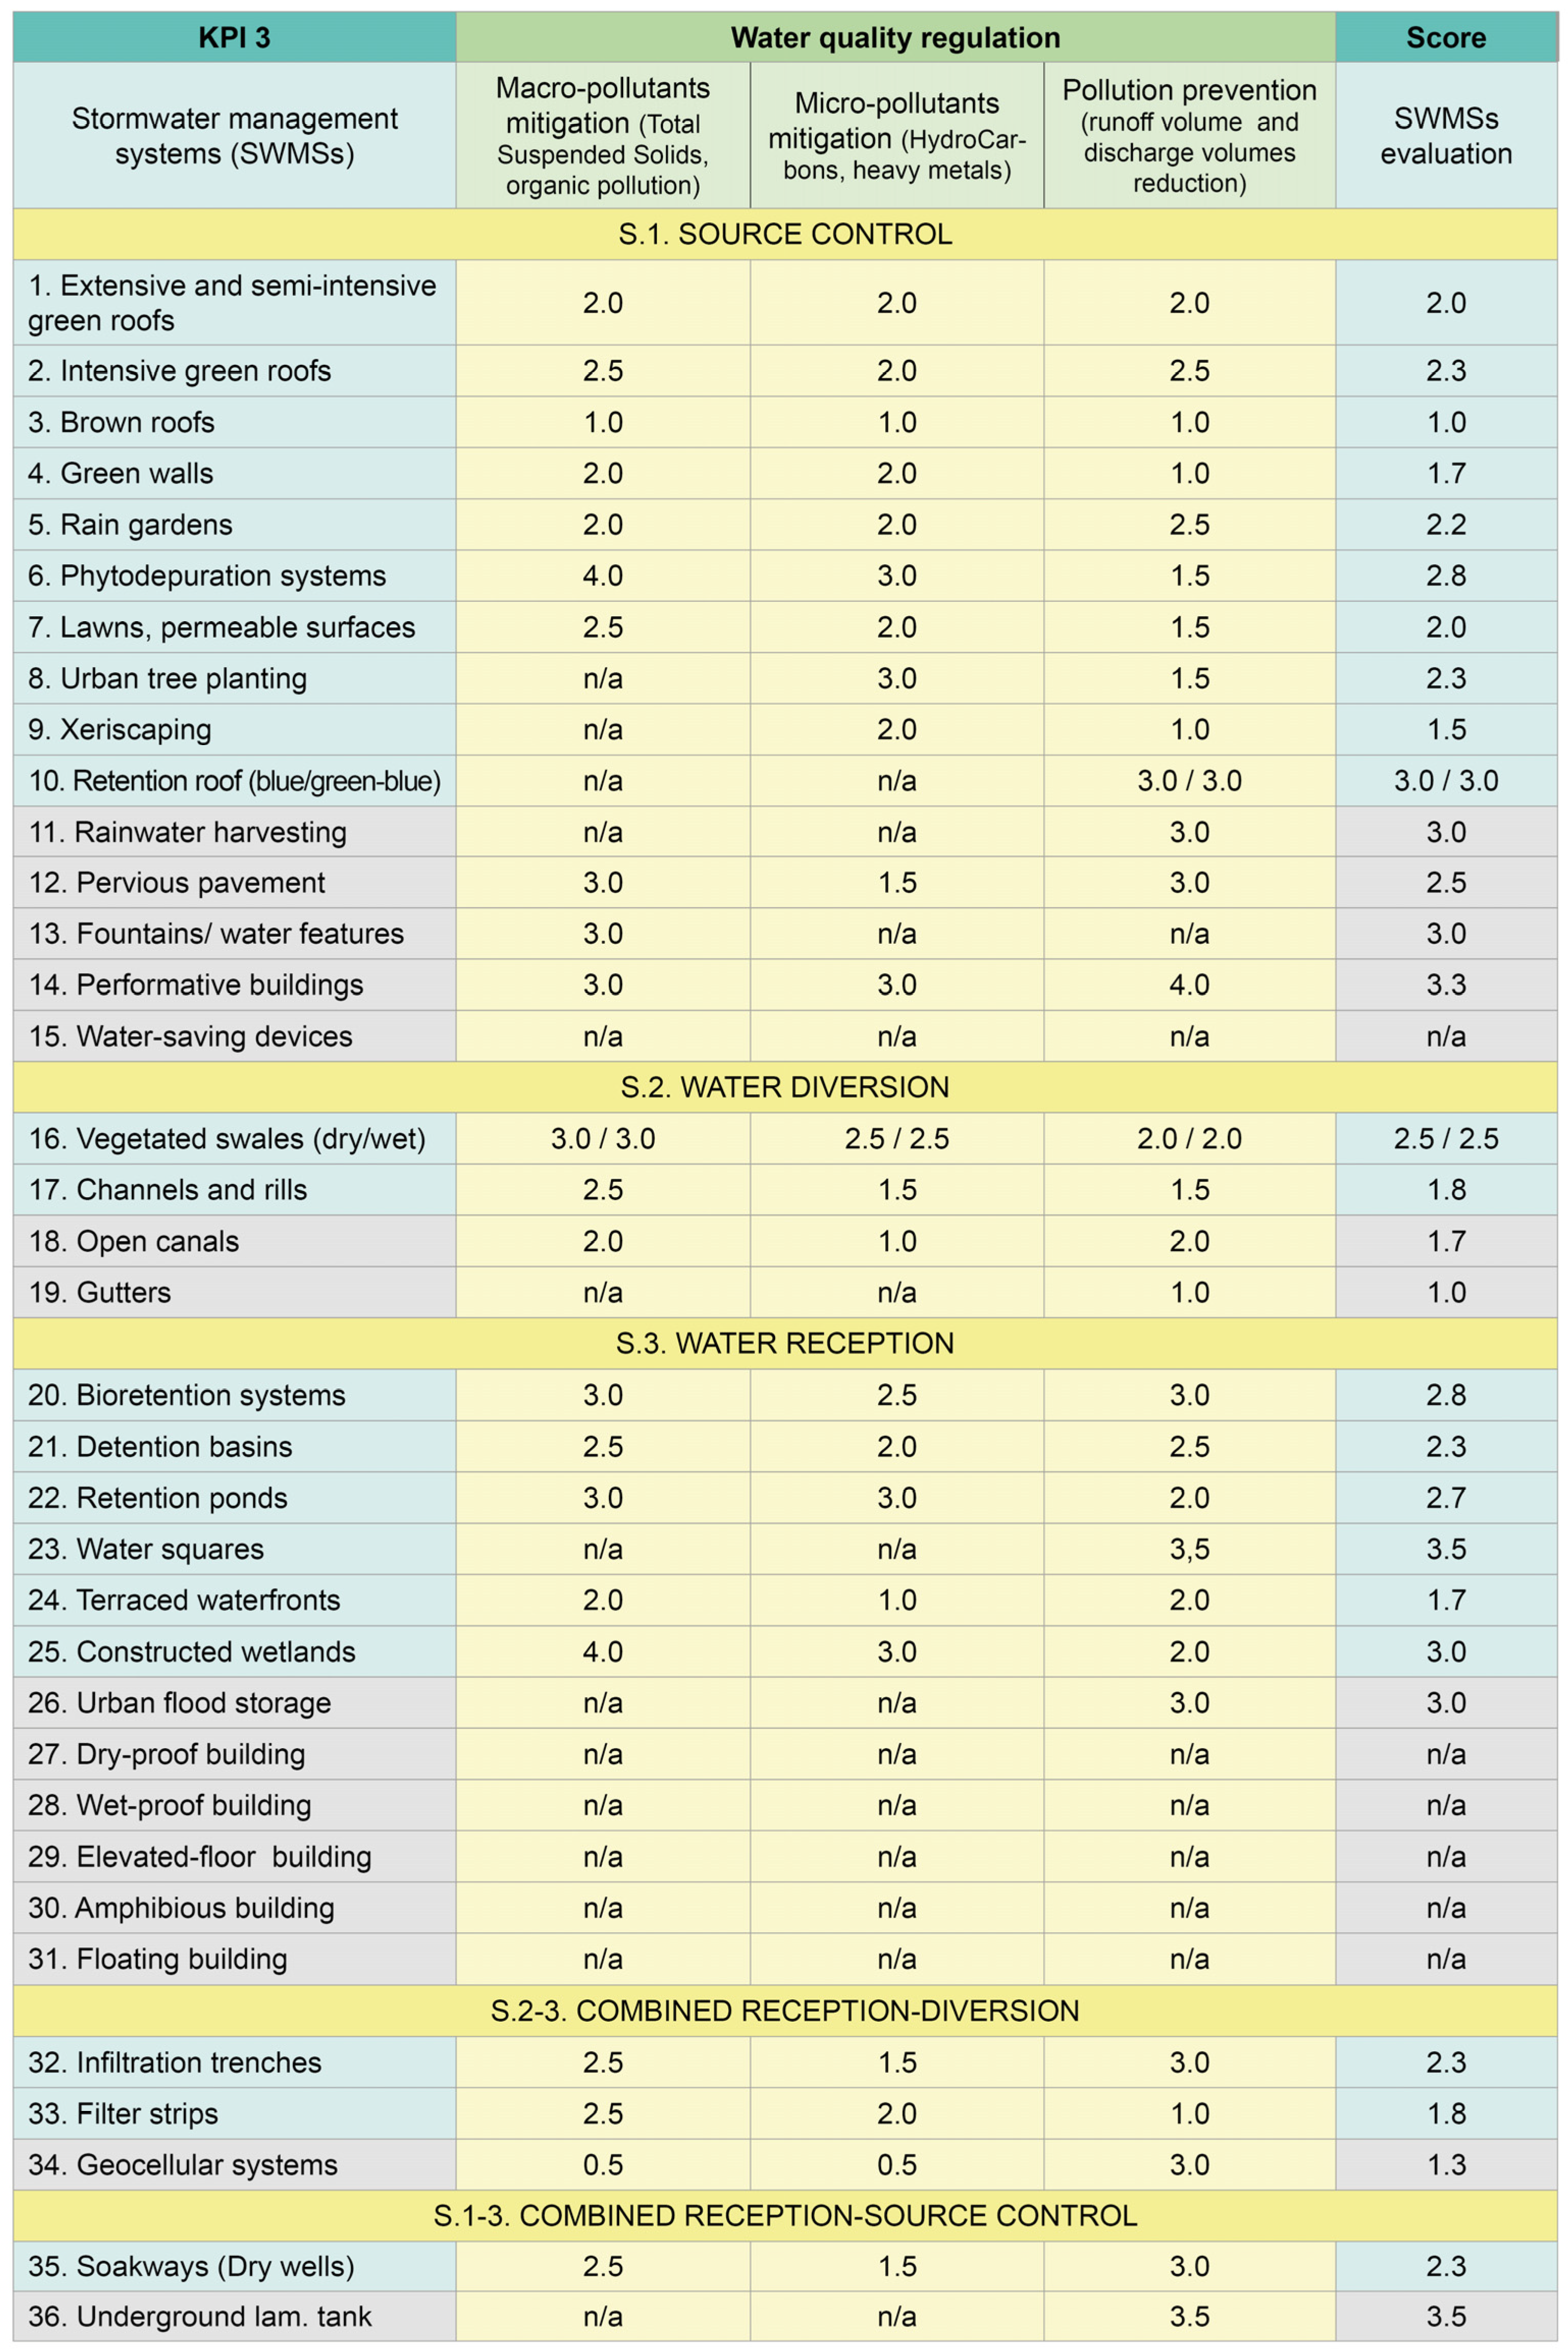
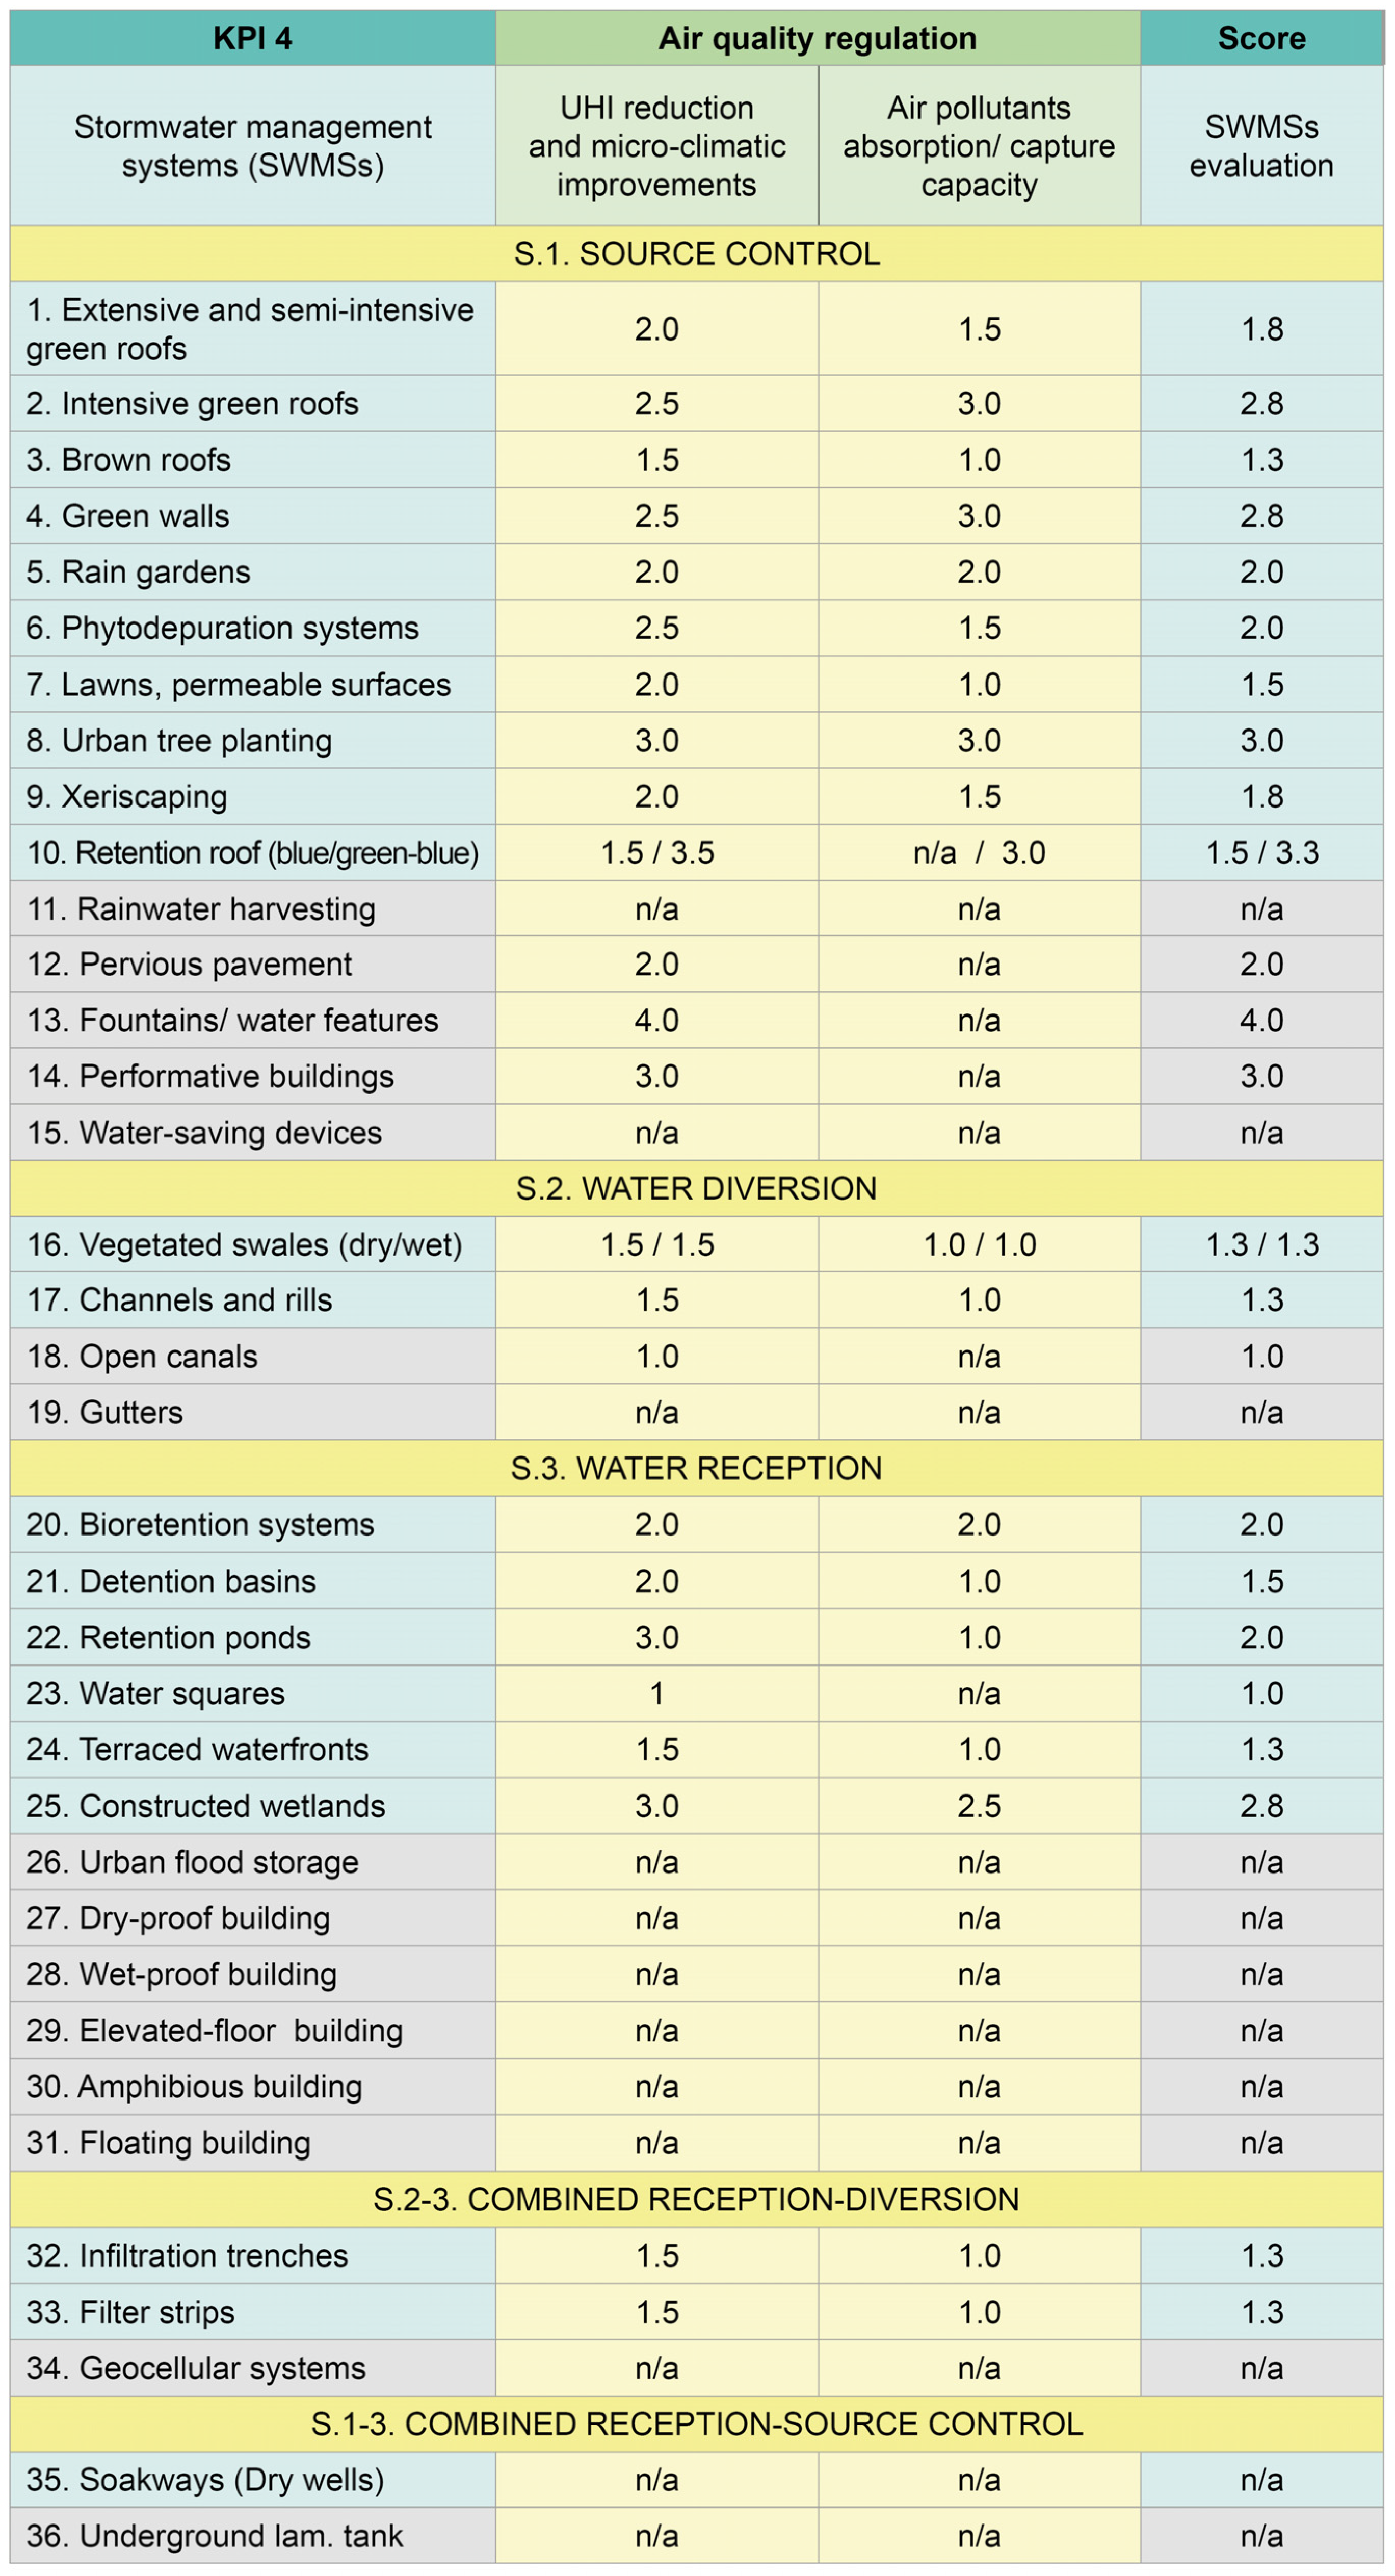
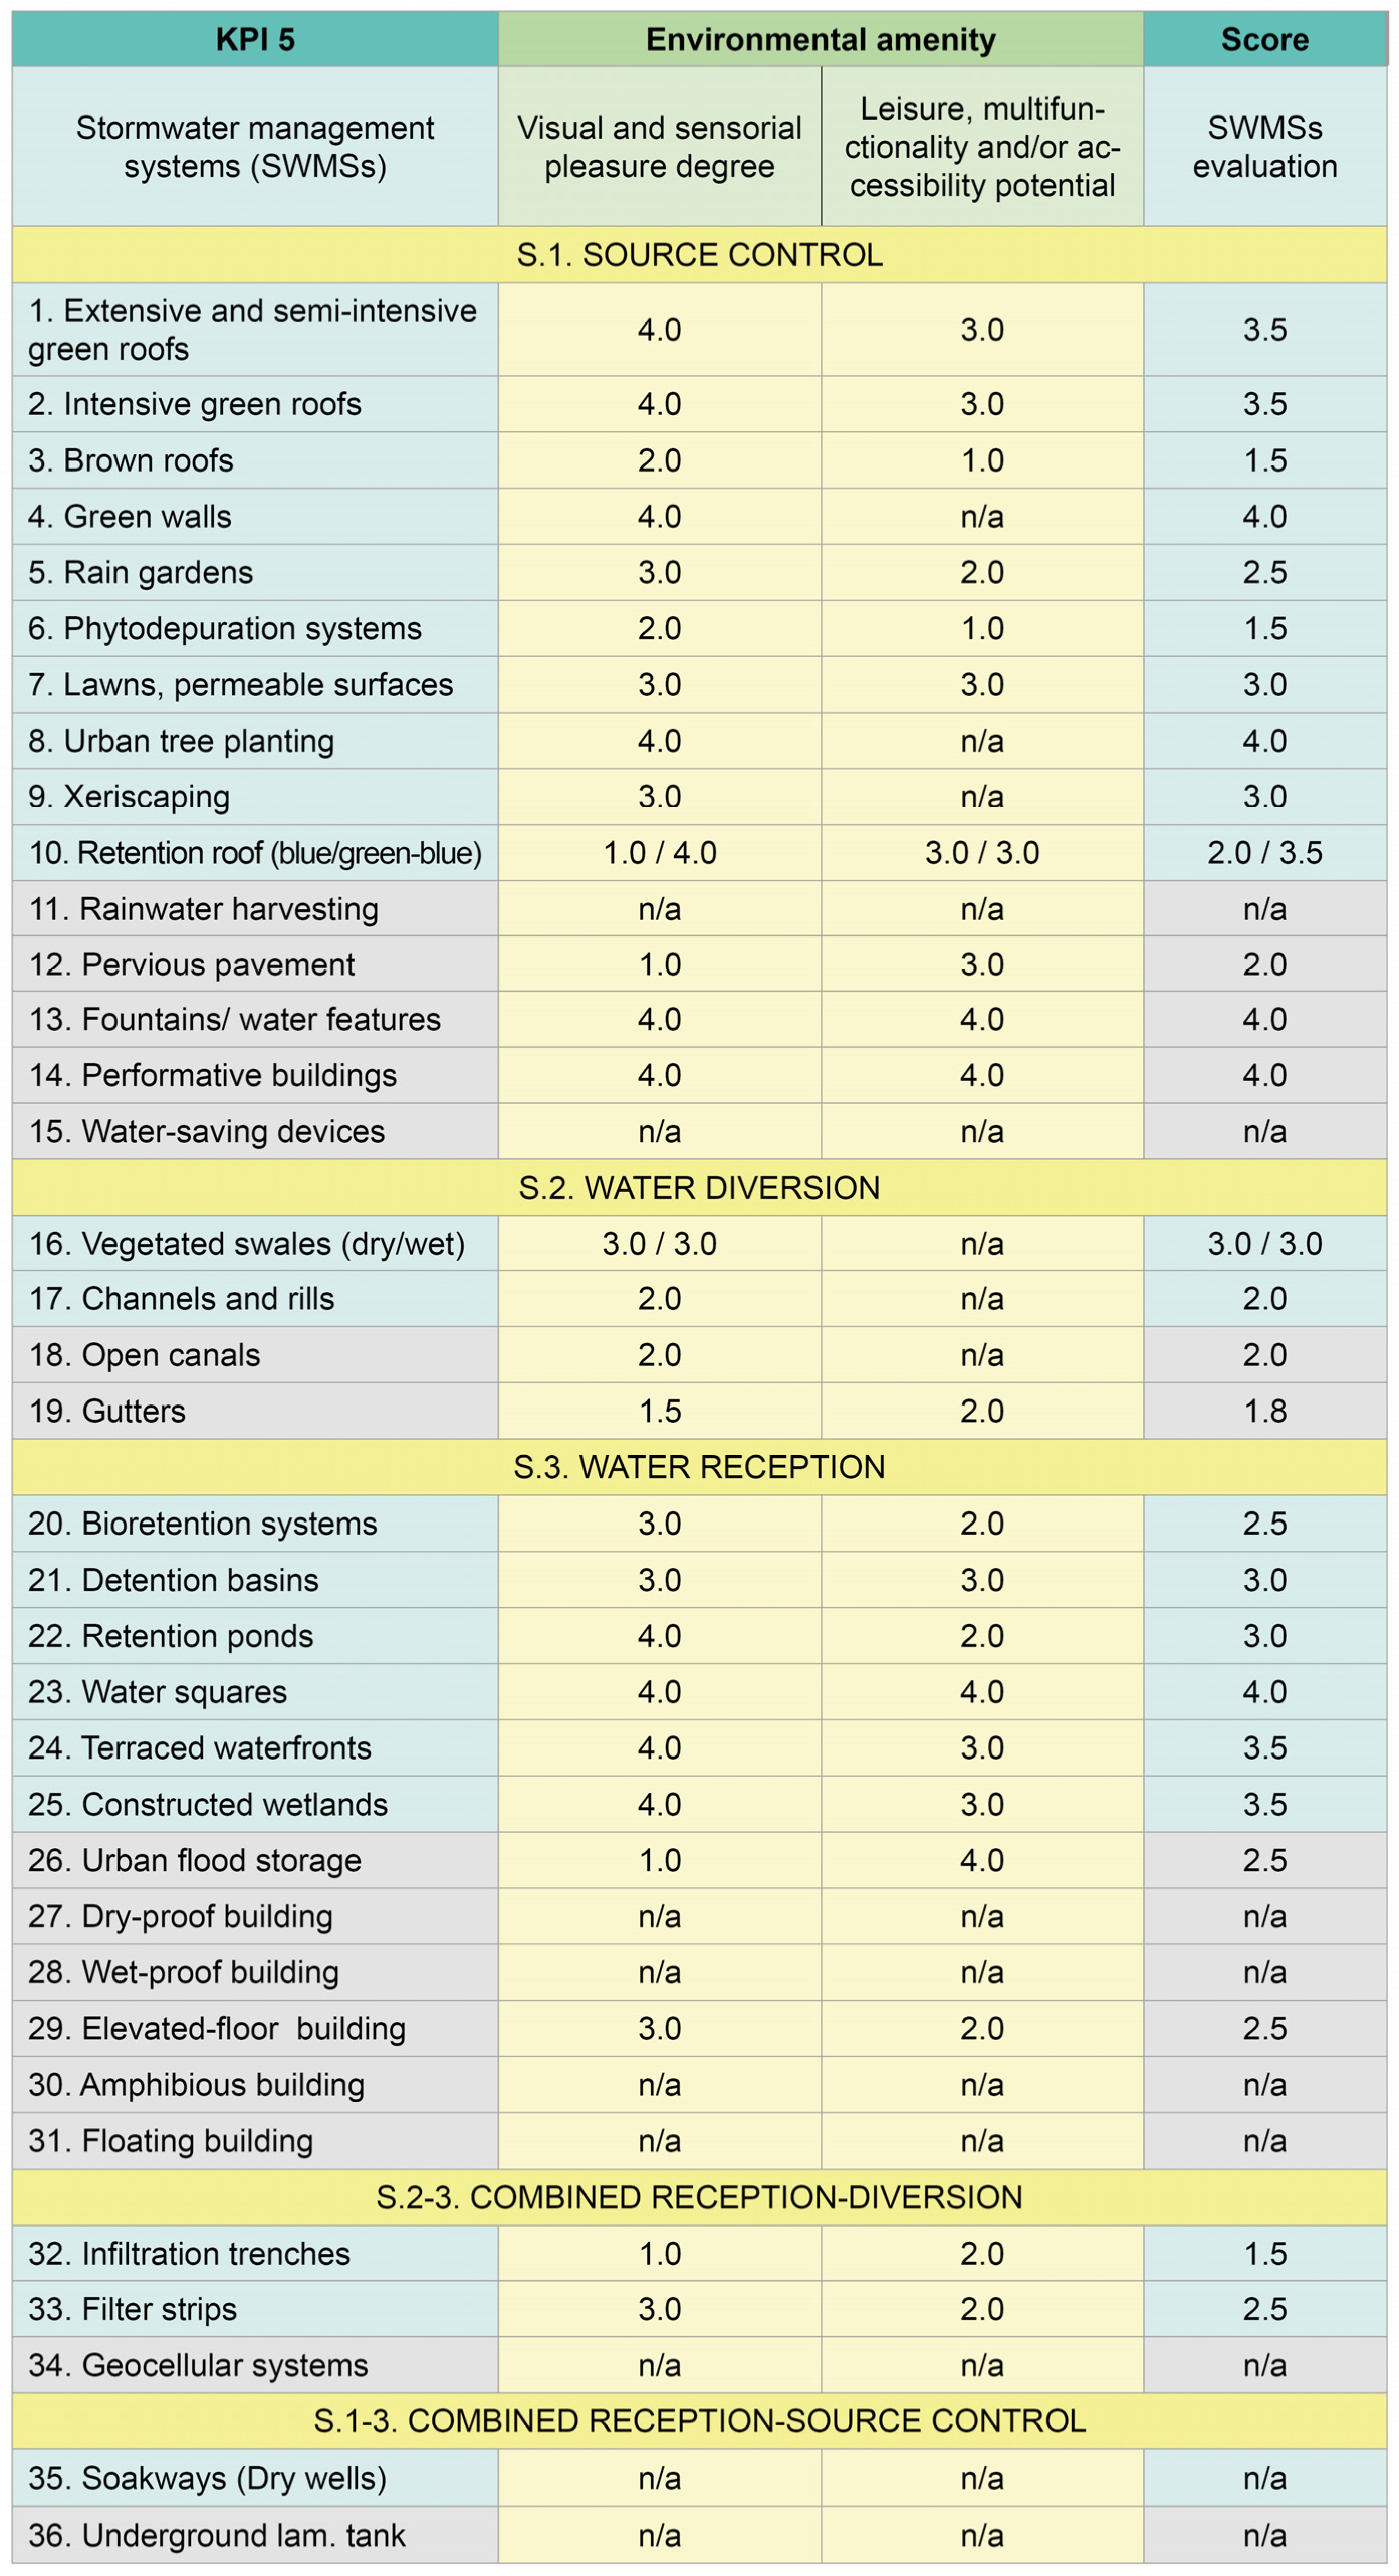
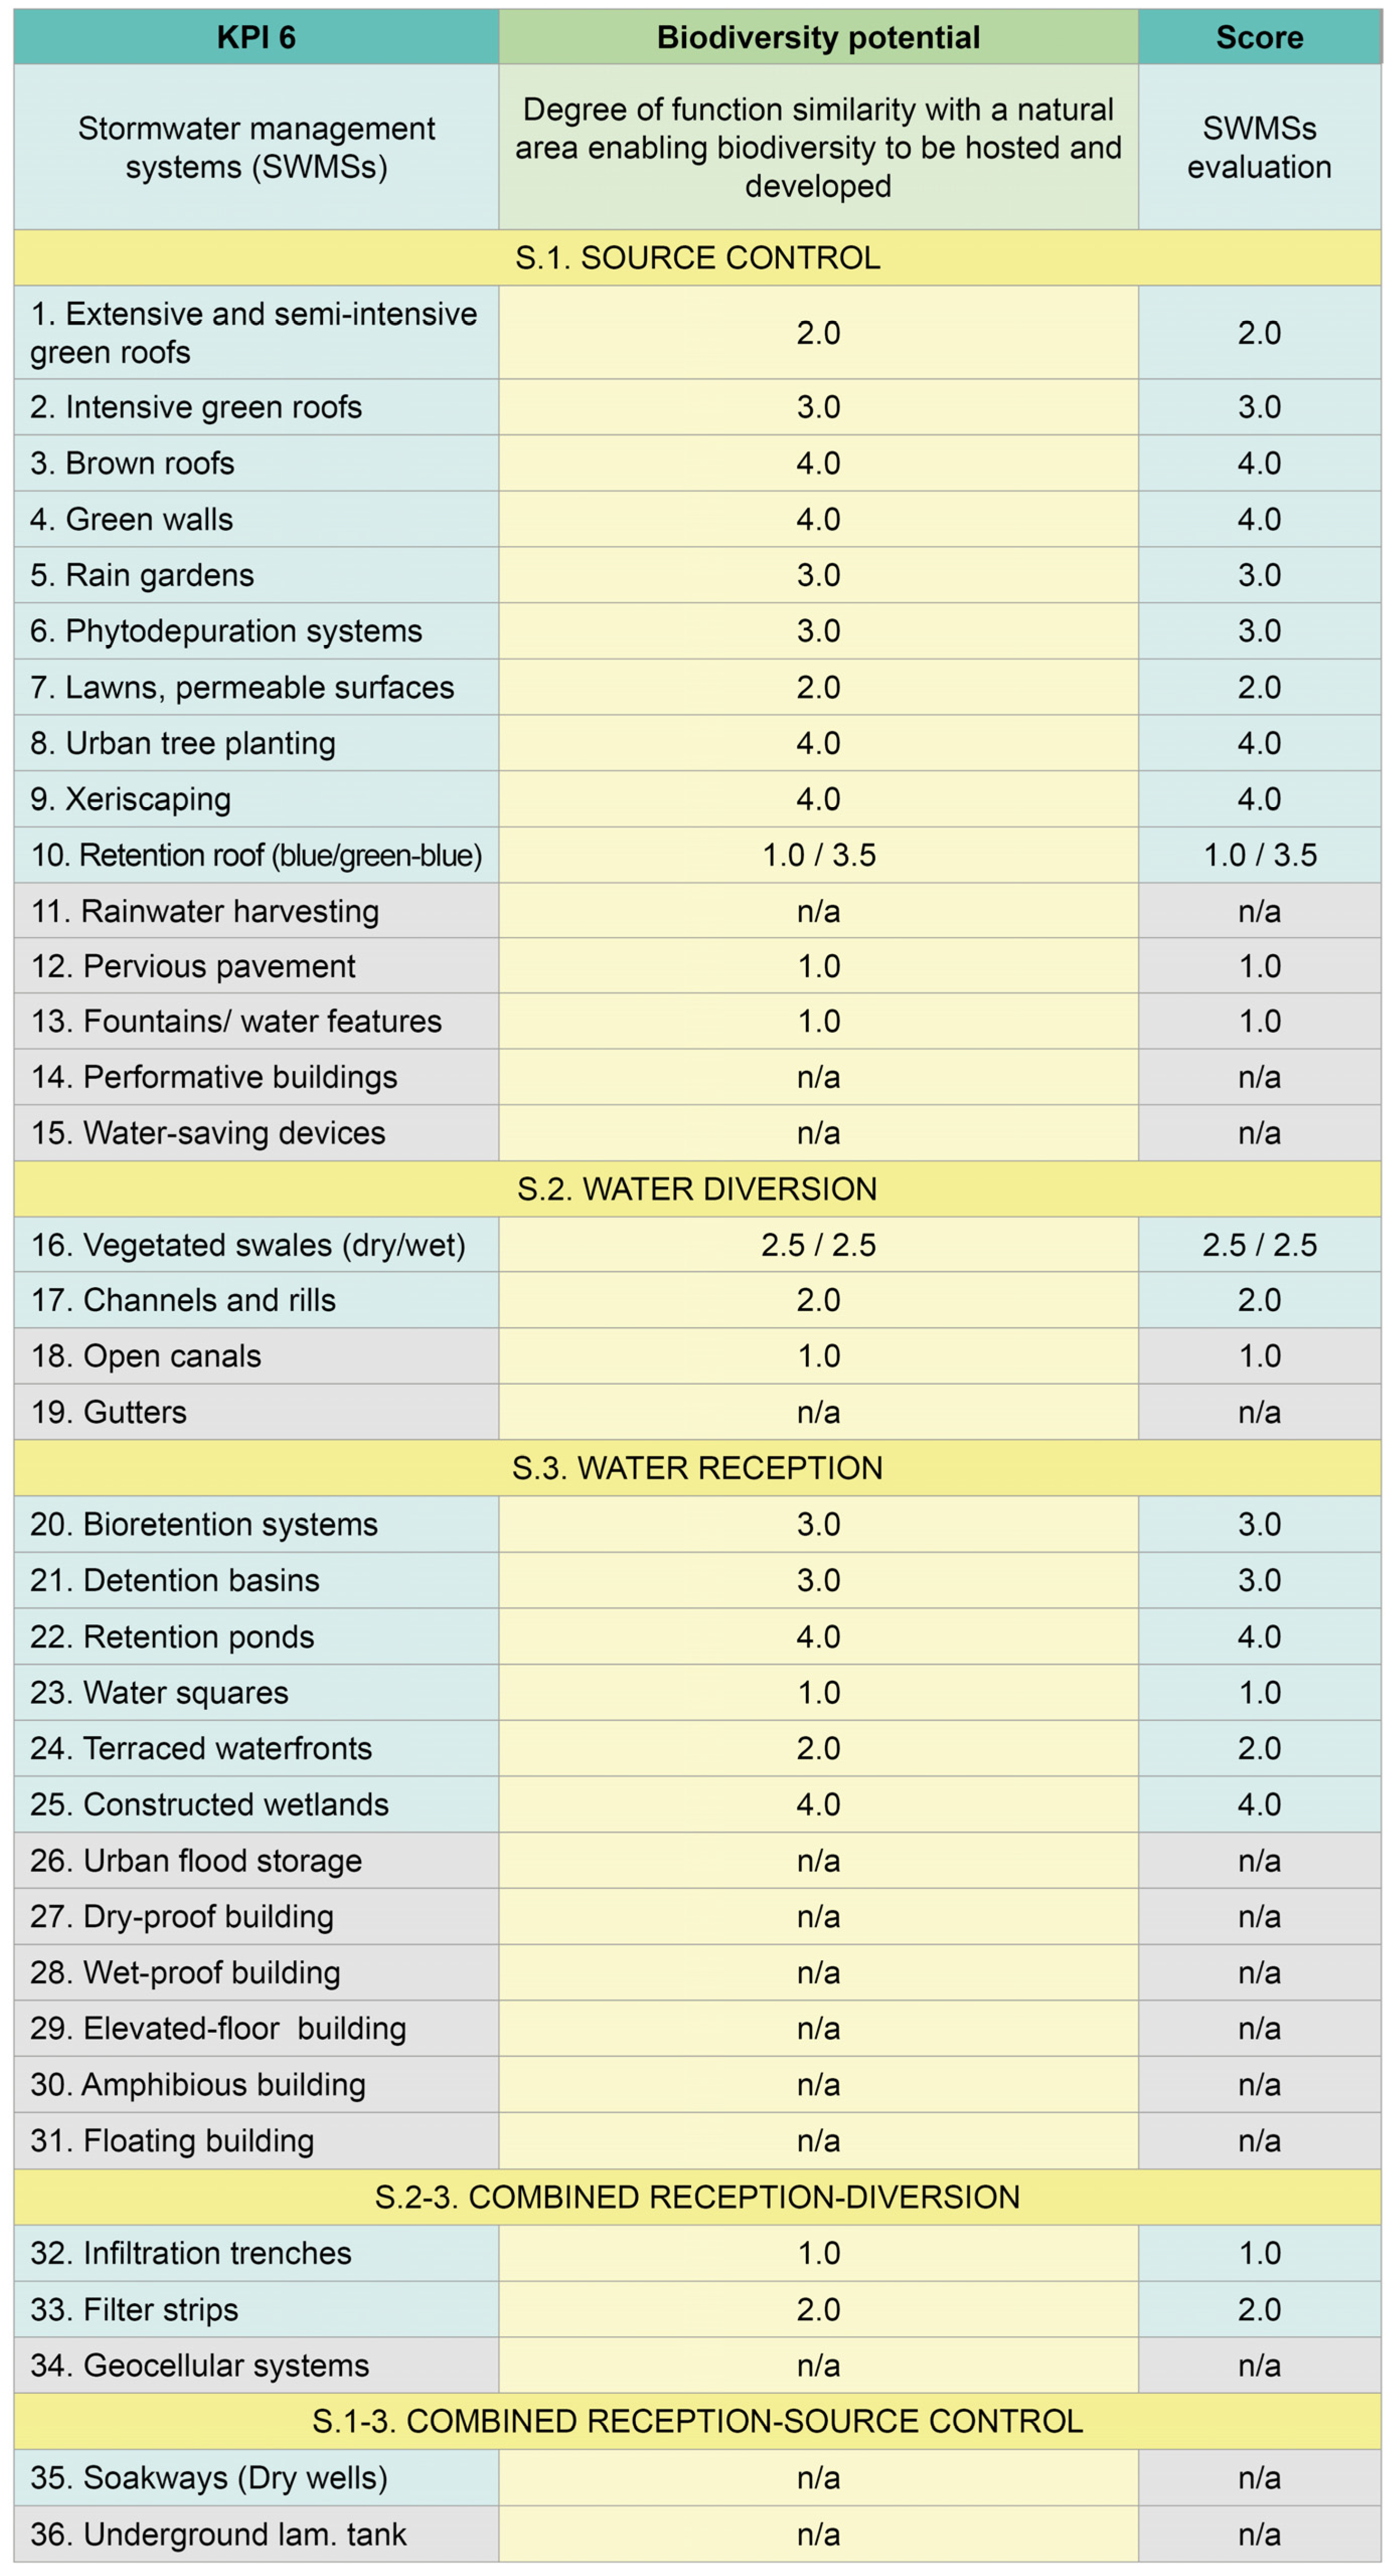
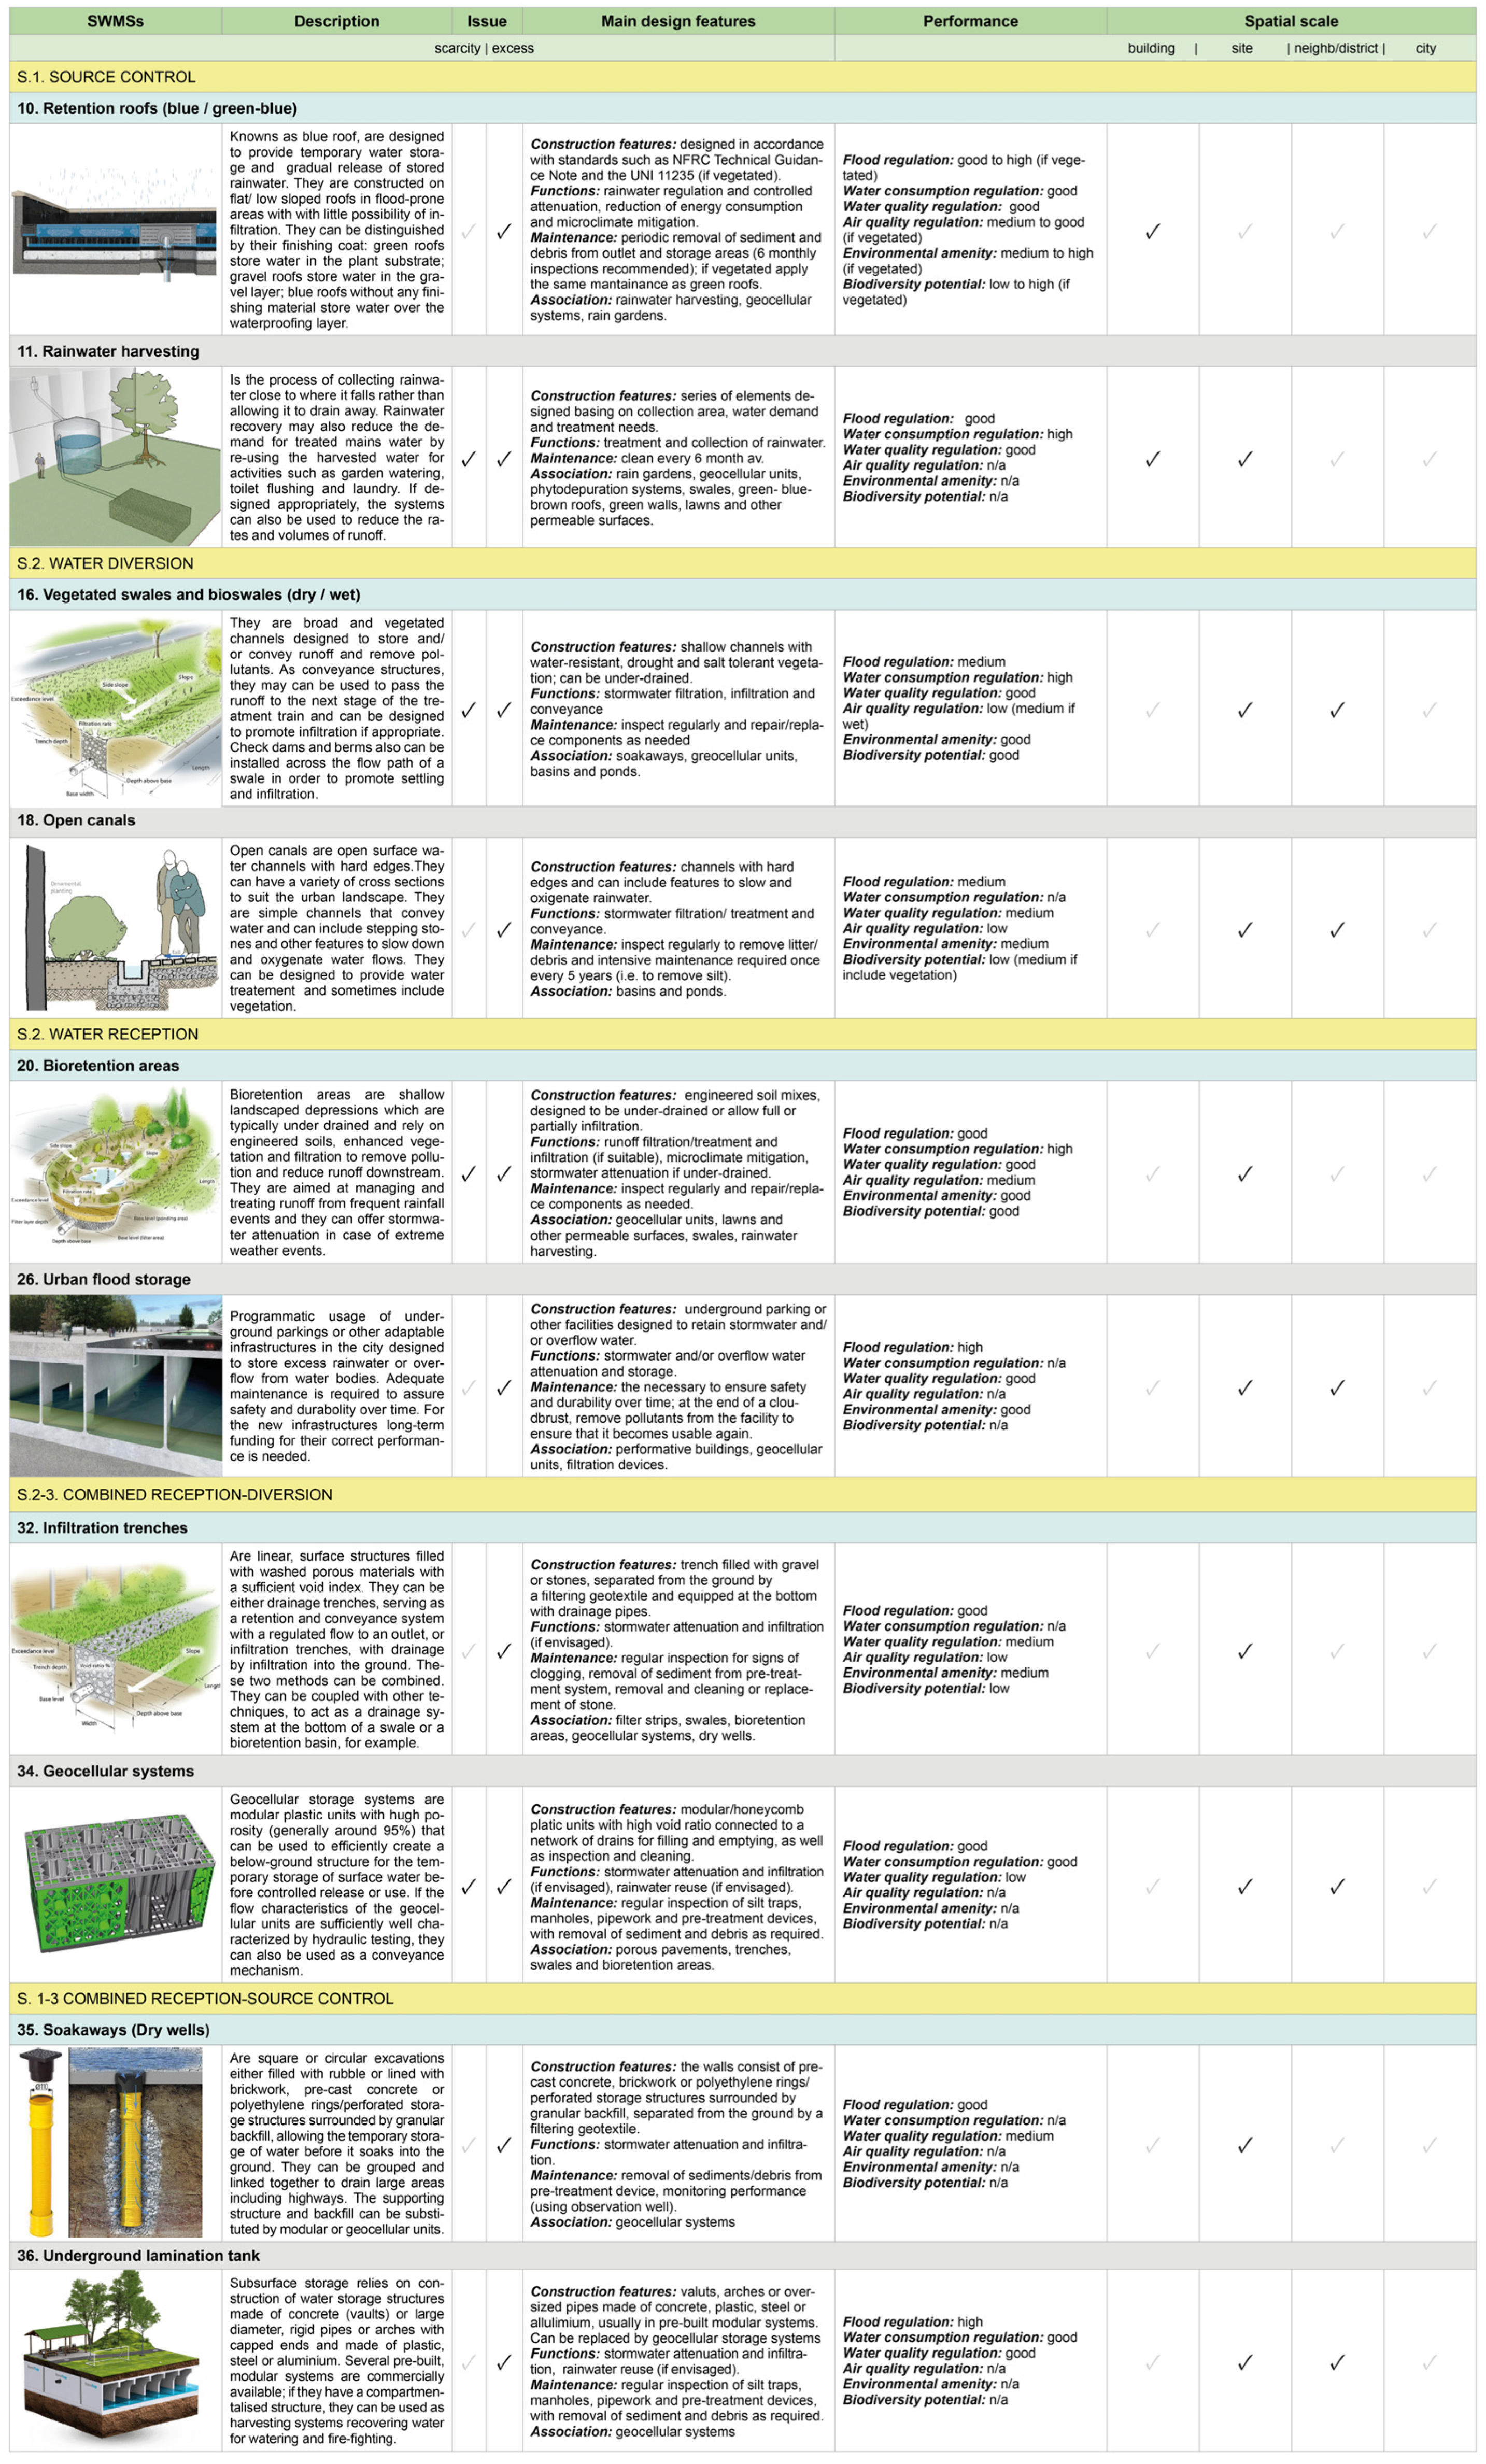
Following the evaluation method, two complementary outputs are produced. The analytical output consists of six dedicated tables (Figure 3, Figure 4, Figure 5, Figure 6, Figure 7 and Figure 8), in which each KPI is scored on a 0–4 scale for all technological solutions, divided according to the design strategy and their green–blue or grey nature. The synthetic output is a summary table reporting (Figure 9), for each solution, the overall score of the six KPIs, calculated as the average of the corresponding sub-parameter scores. This table also includes representative images, concise descriptions, key design characteristics (functions, construction features, maintenance requirements and associative potential), as well as the spatial scale of applicability and the primary water-related issue addressed (scarcity and/or excess).
The purpose of this dual structure is to provide a comprehensive yet accessible decision-support tool, enabling informed comparison among design options and supporting decision-making across different stages of architectural and urban design—particularly during conceptualisation and preliminary design. The validity and operational usefulness of the evaluation framework are subsequently tested through its application within the design development of a pilot project located in Rome (Italy) where the proposed performance indicators are used to inform solution selection.

3. Results

3.1. Synthesis of KPI Evaluation Outcomes

The development of the six analytical evaluation tables and the overall summary table represents a key outcome of the assessment process, enabling a critical analysis of the results obtained for the thirty-six technological solutions in relation to the six-KPI framework. Differences in the number of assessed solutions across KPIs reflect the varying degree of functional applicability of each indicator to different SWMS types.
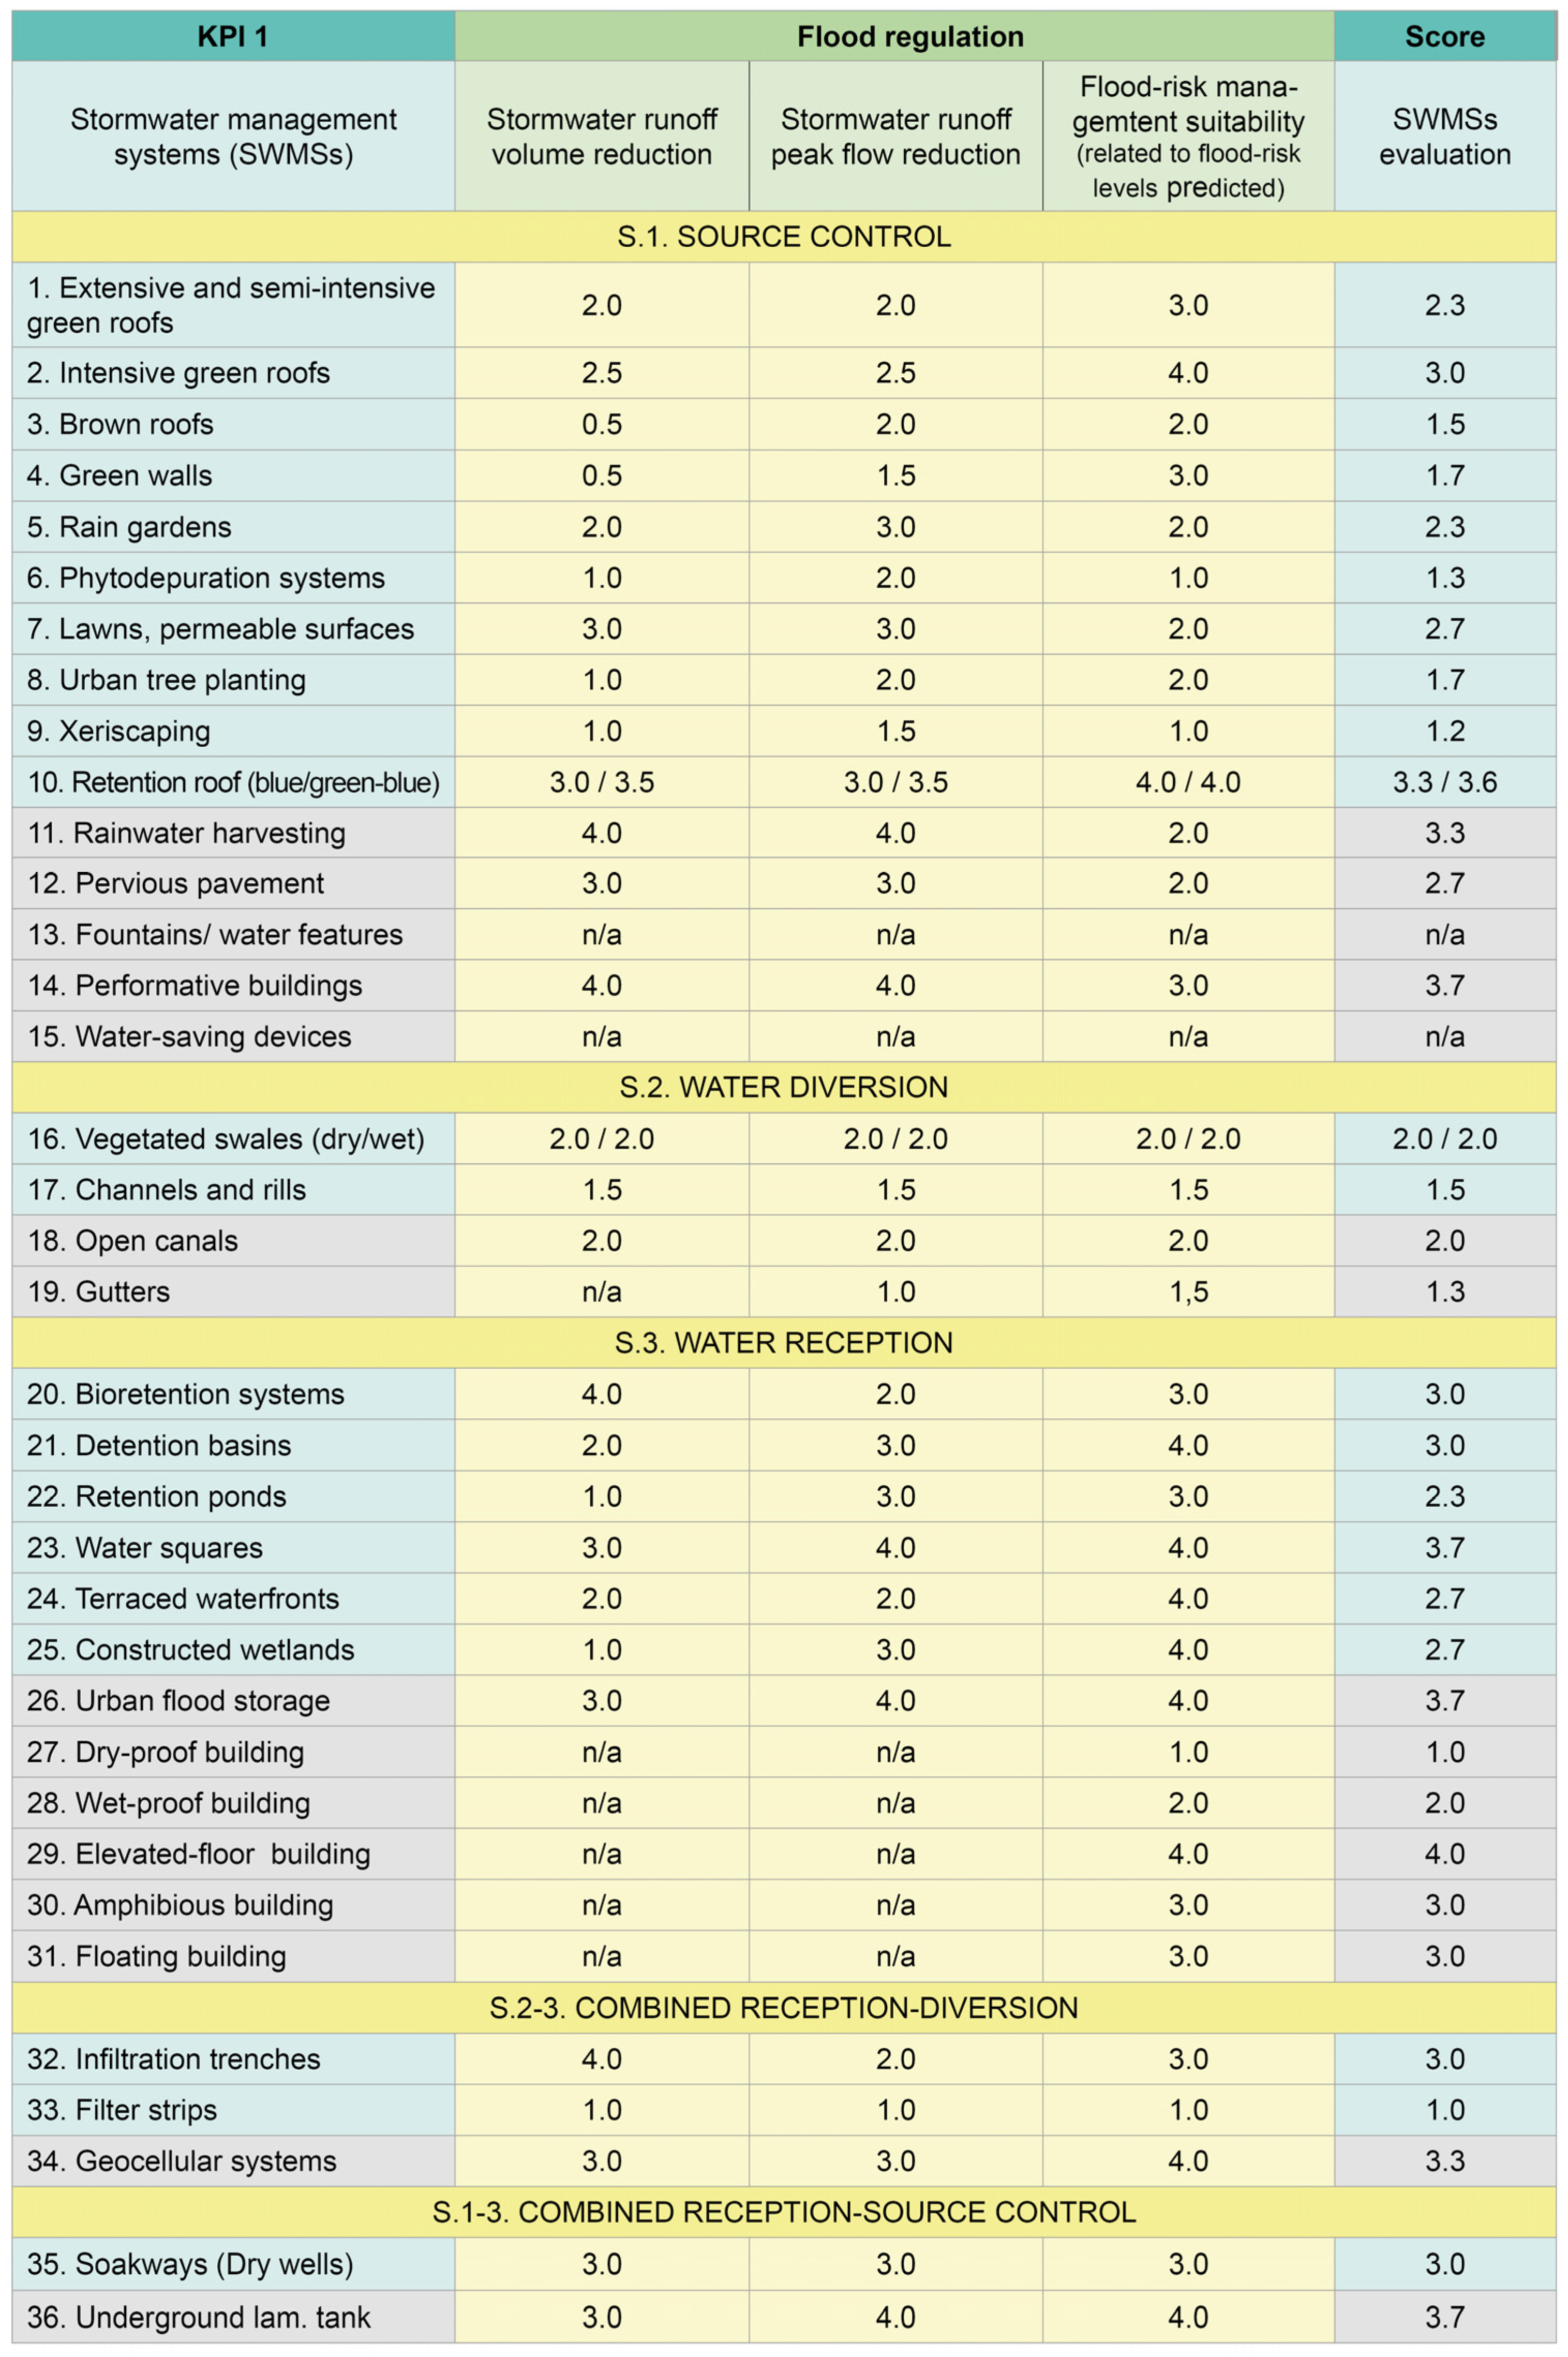
Flood regulation (Figure 3) emerges as the most assessable KPI, with only two solutions excluded. The reduction in runoff volumes proves generally more challenging than peak-flow attenuation, and performance increases proportionally with storage capacity and detention potential. The highest scores (often above 3) correspond to grey or more engineered blue–green solutions, such as retention roofs and water squares, whereas predominantly green systems may face spatial or ecological constraints that limit their hydraulic effectiveness.
Water consumption regulation (Figure 4) is instead the least assessable KPI, with fourteen solutions not evaluated. Difficulties arise from the limited ability of many devices to incorporate storage for reuse directly within their technological configuration. This constraint may be mitigated by coupling solutions with complementary grey recovery systems. Vegetation-related factors (species selection, spatial arrangement and maintenance regimes) also play a decisive role, as they can significantly reduce water demands and consequently improve performance.
Water quality regulation (Figure 5) shows a good degree of evaluability, with six solutions excluded. The highest pollutant-reduction scores are associated with green systems, due to the filtration, absorption and biodegradation processes occurring in vegetated soil layers. Grey devices, conversely, primarily support pollution prevention by limiting runoff generation and discharge volumes rather than providing treatment functions.
Air quality regulation (Figure 6) represents one of the least assessable indicators, with twelve solutions excluded. Performance depends strongly on vegetation structure, density and evapotranspiration potential. When relevant, grey infrastructure contributes only indirectly through microclimatic mitigation mechanisms.
Environmental amenity (Figure 7) shows an intermediate level of evaluability, with nine solutions excluded from scoring. Since it is based on qualitative parameters, ensuring an objective and reproducible evaluation required particular attention. Visual and sensory benefits increase with the presence of vegetation and visible water, while multifunctionality and accessibility depend on usability, safety and compatibility with human activities.
Finally, biodiversity potential (Figure 8) is the second-least assessable KPI, with thirteen solutions excluded. Green and blue SWMSs prevail, with performance depending on each solution’s capacity to recreate engineered ecological conditions capable of sustaining habitat functions comparable to small-scale natural environments.
Overall, the KPI system proves capable of revealing functional complementarities among solutions and supports informed comparison (Figure 9), highlighting how resilient SWM requires a balanced combination of green–blue and grey technologies. The assessment also underscores how performance remains partly dependent on contextual interactions, thereby encouraging the integration of KPI-based evaluation with empirical verification derived from built interventions or modelling environments, as shown in the pilot-project application.

3.2. Application to a Pilot Project

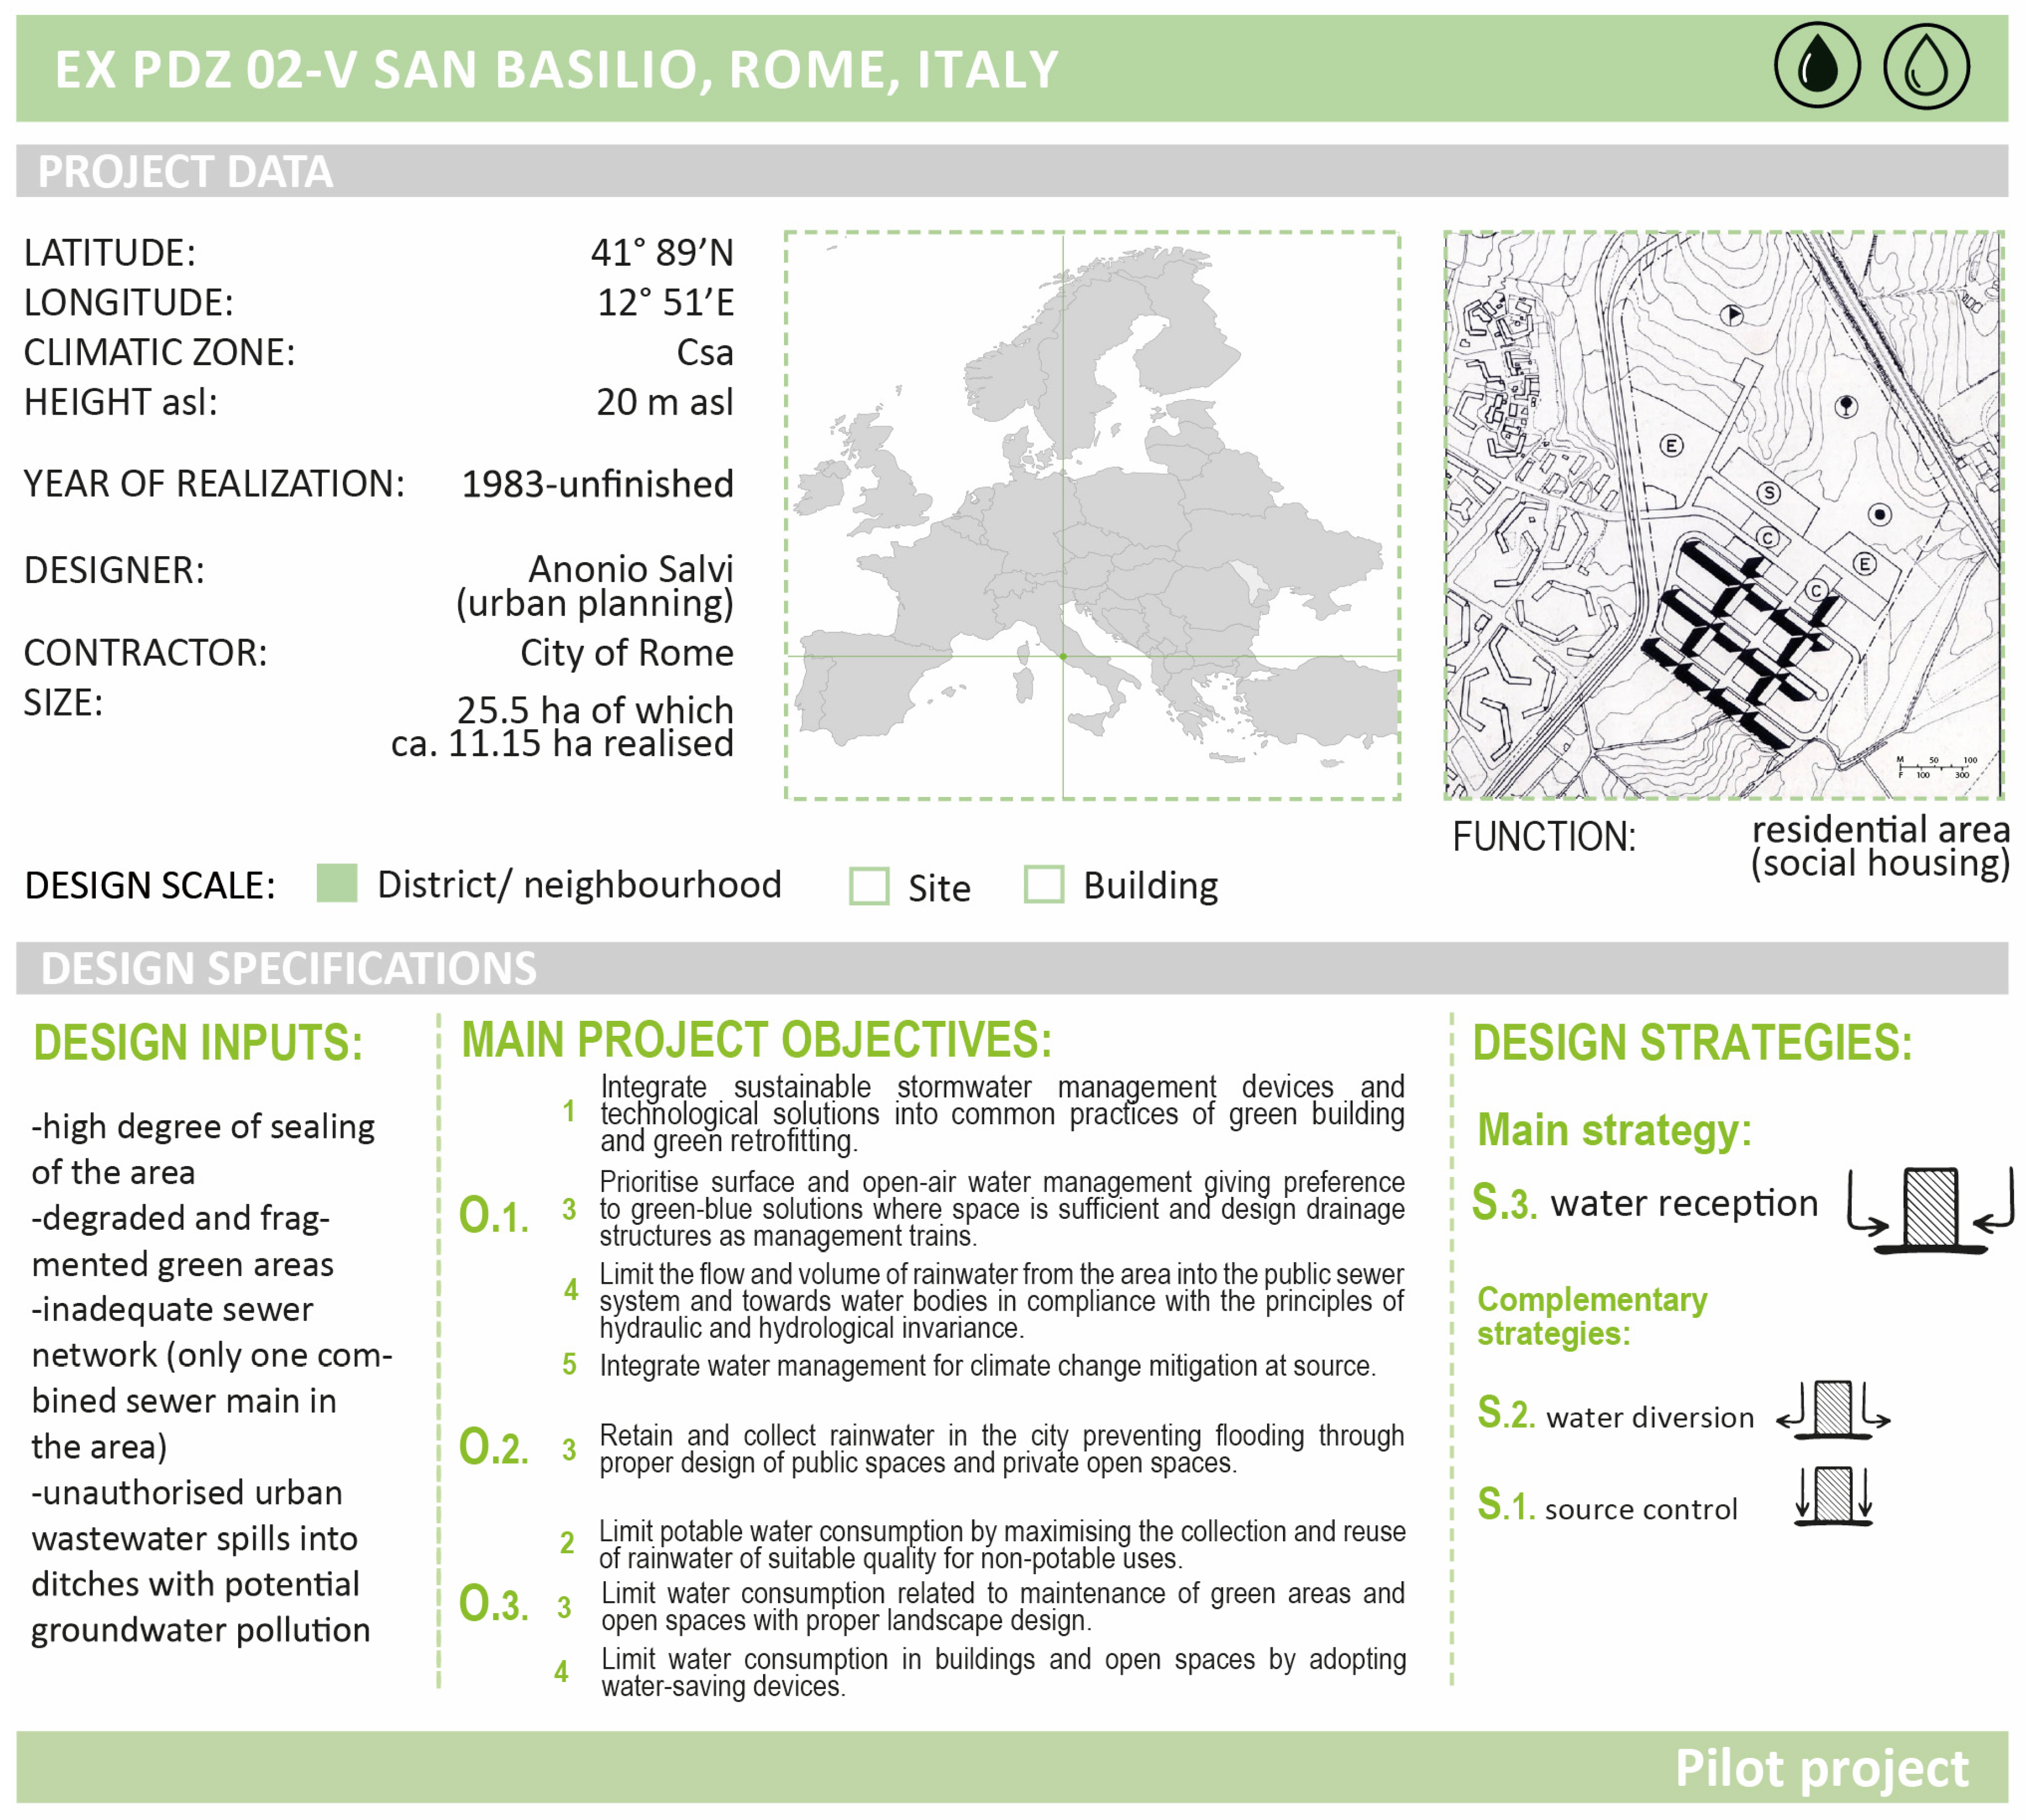
The evaluation framework is applied to a pilot project in the public-housing district of San Basilio (Rome, Italy), an area characterised by severe soil sealing, degraded open spaces, recurrent drainage issues and socio-spatial vulnerabilities. The selection of appropriate SWMS is based on the needs and spatial characteristics of the district and is guided by the objectives–strategies–solutions matrix, ensuring that chosen solutions address both functional priorities and site constraints. The design process integrates an SWMS into a renewed system of courtyards, streets and collective green areas, prioritising water reception as the main macro-strategy and complementing it with source-control and diversion measures (Figure 10).
Out of the 36 technological solutions identified in the framework, 20 are selected and spatially distributed at multiple scales. The KPI-based assessment provides a comparative overview of alternative devices, highlighting their functional features and supporting the selection of configurations that best respond to the project objectives and to the spatial, morphological and operational constraints of the site.
Solutions intended to manage extreme rainfall events are subsequently dimensioned and verified through a parametric modelling tool developed in the integrated Rhino–Grasshopper–Excel environment [29]. The design of stormwater storage volumes is based on the Rainfalls Design Method with a 20-year return period, except for the water squares system, which is evaluated for a 50-year return period. In the absence of site-specific infiltration data, a conservative assumption of zero infiltration is adopted, and a cautious discharge limit of 7 L/s/ha is applied to reflect critical sewer conditions.
In its final configuration, the model integrates all the design parameters associated with the system of water squares, bioswales, vegetated bioretention areas, detention basins and retention roofs.
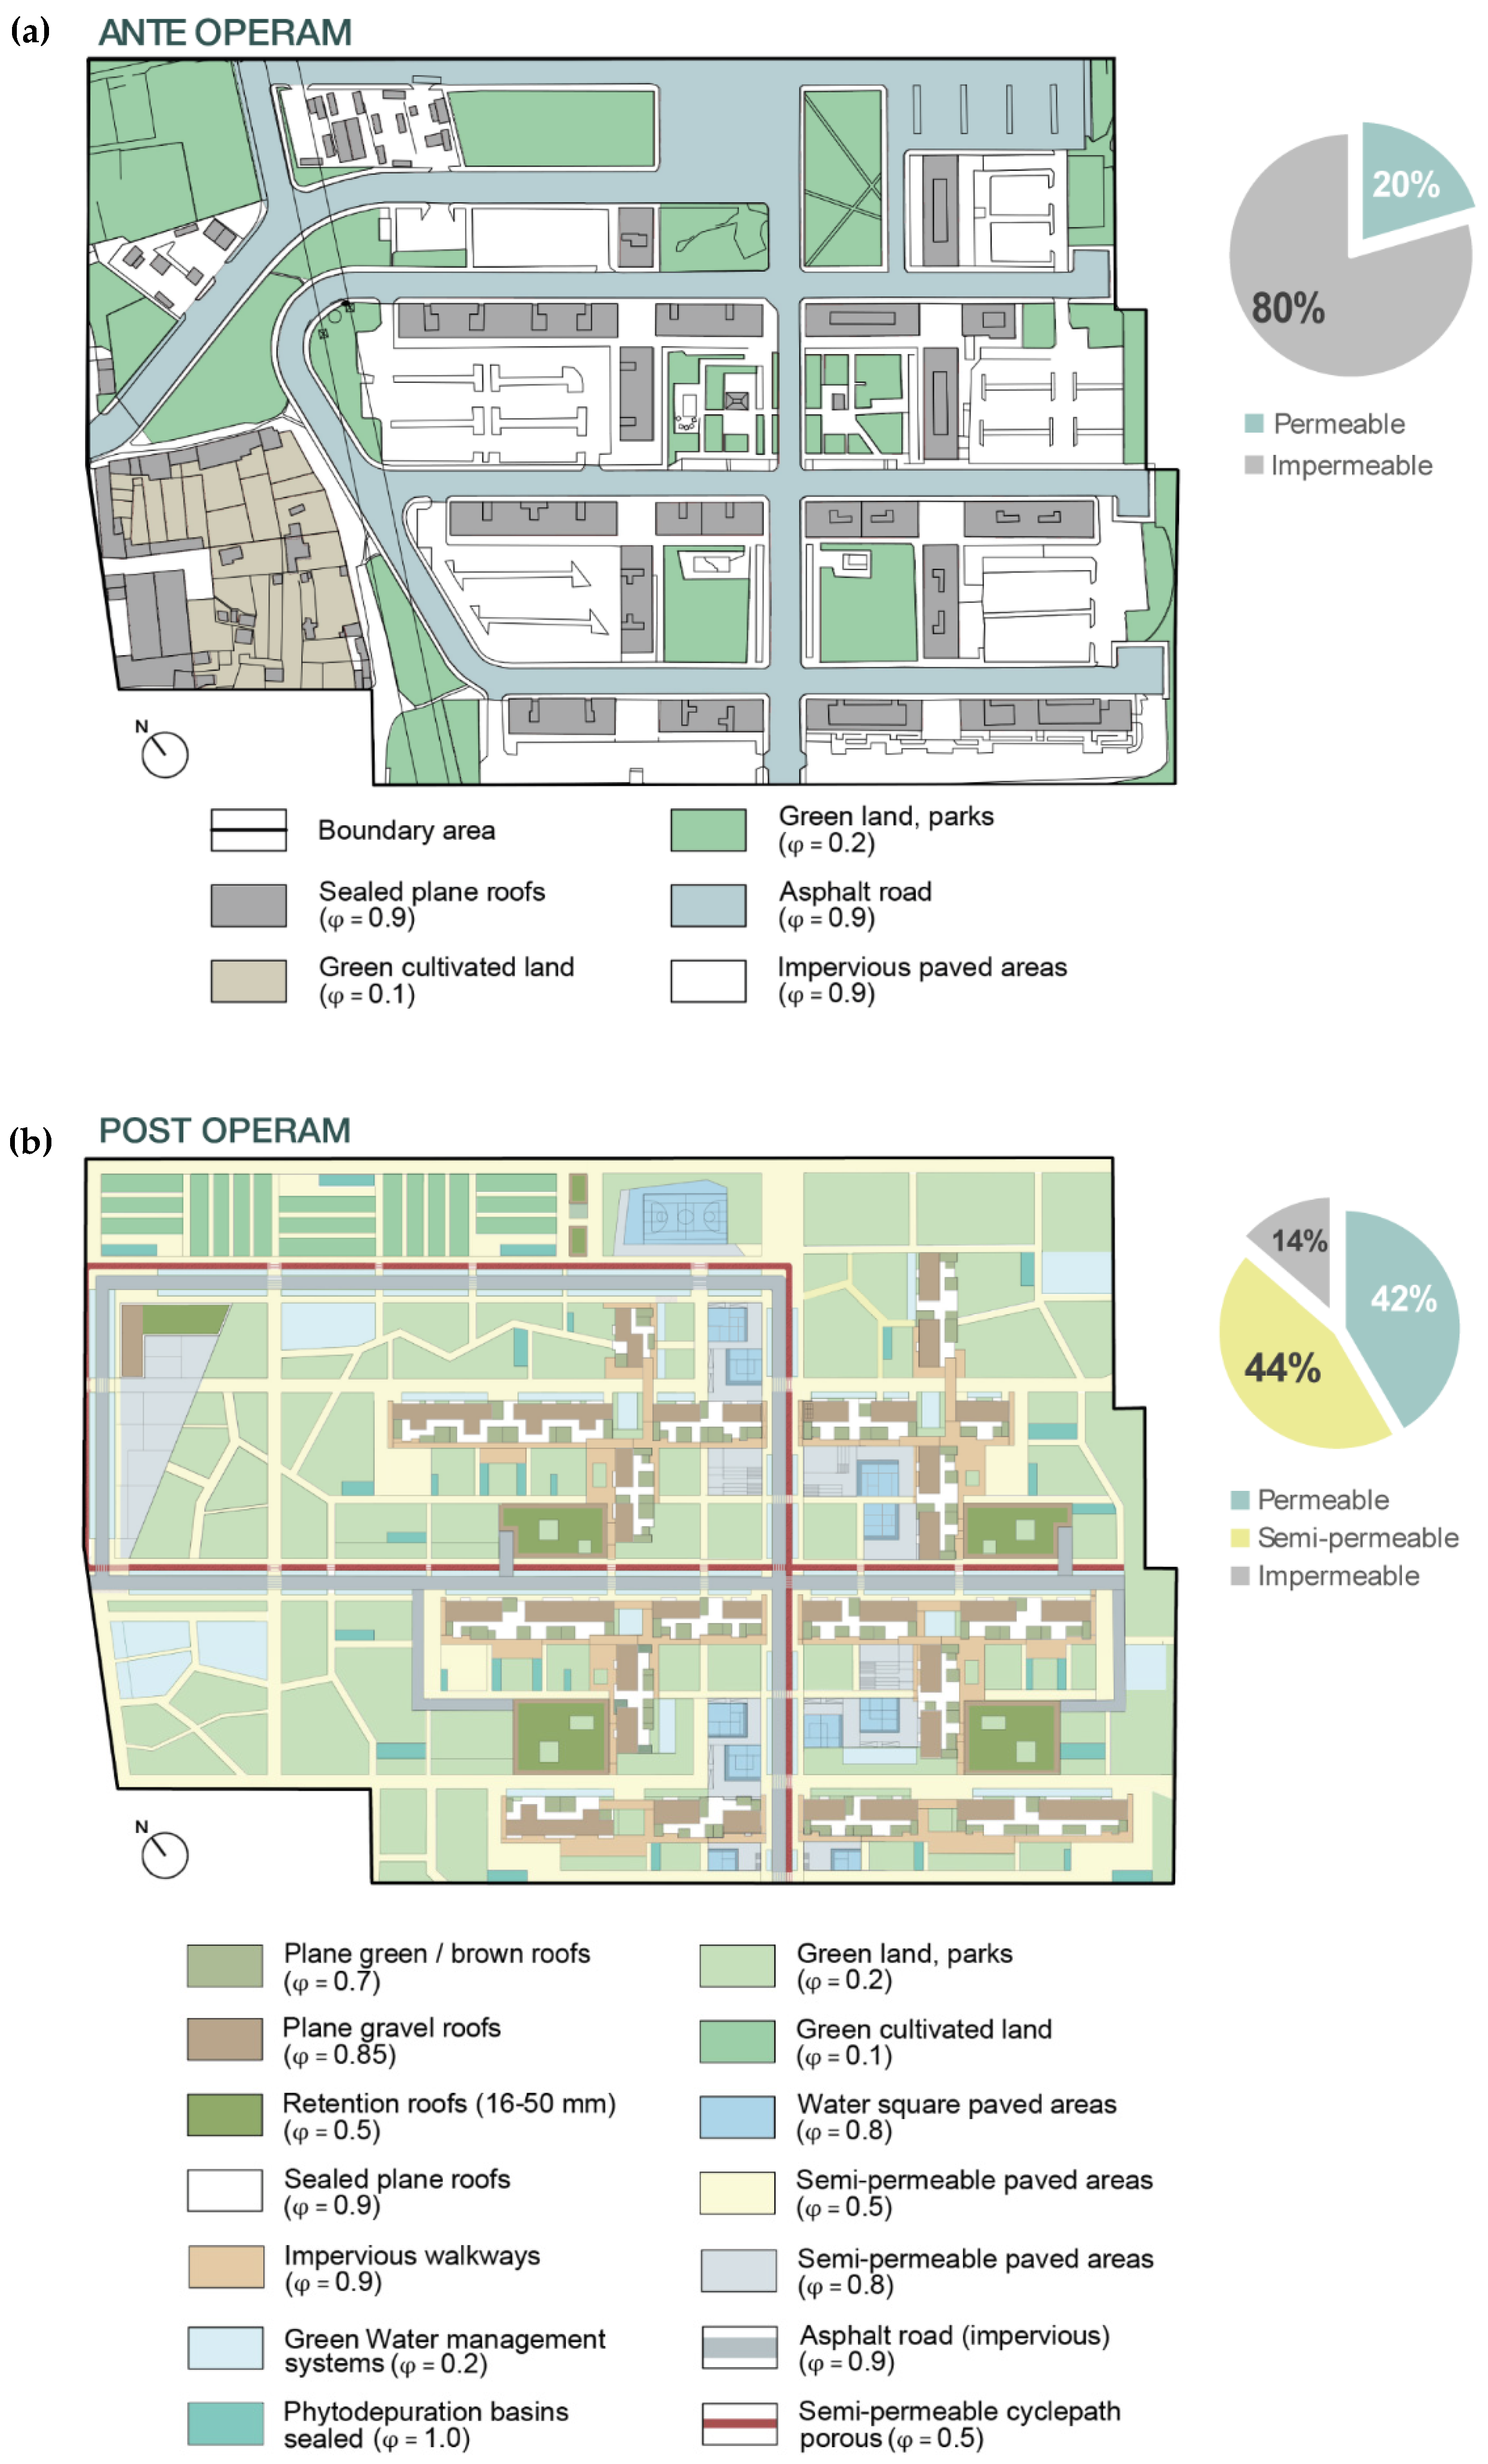
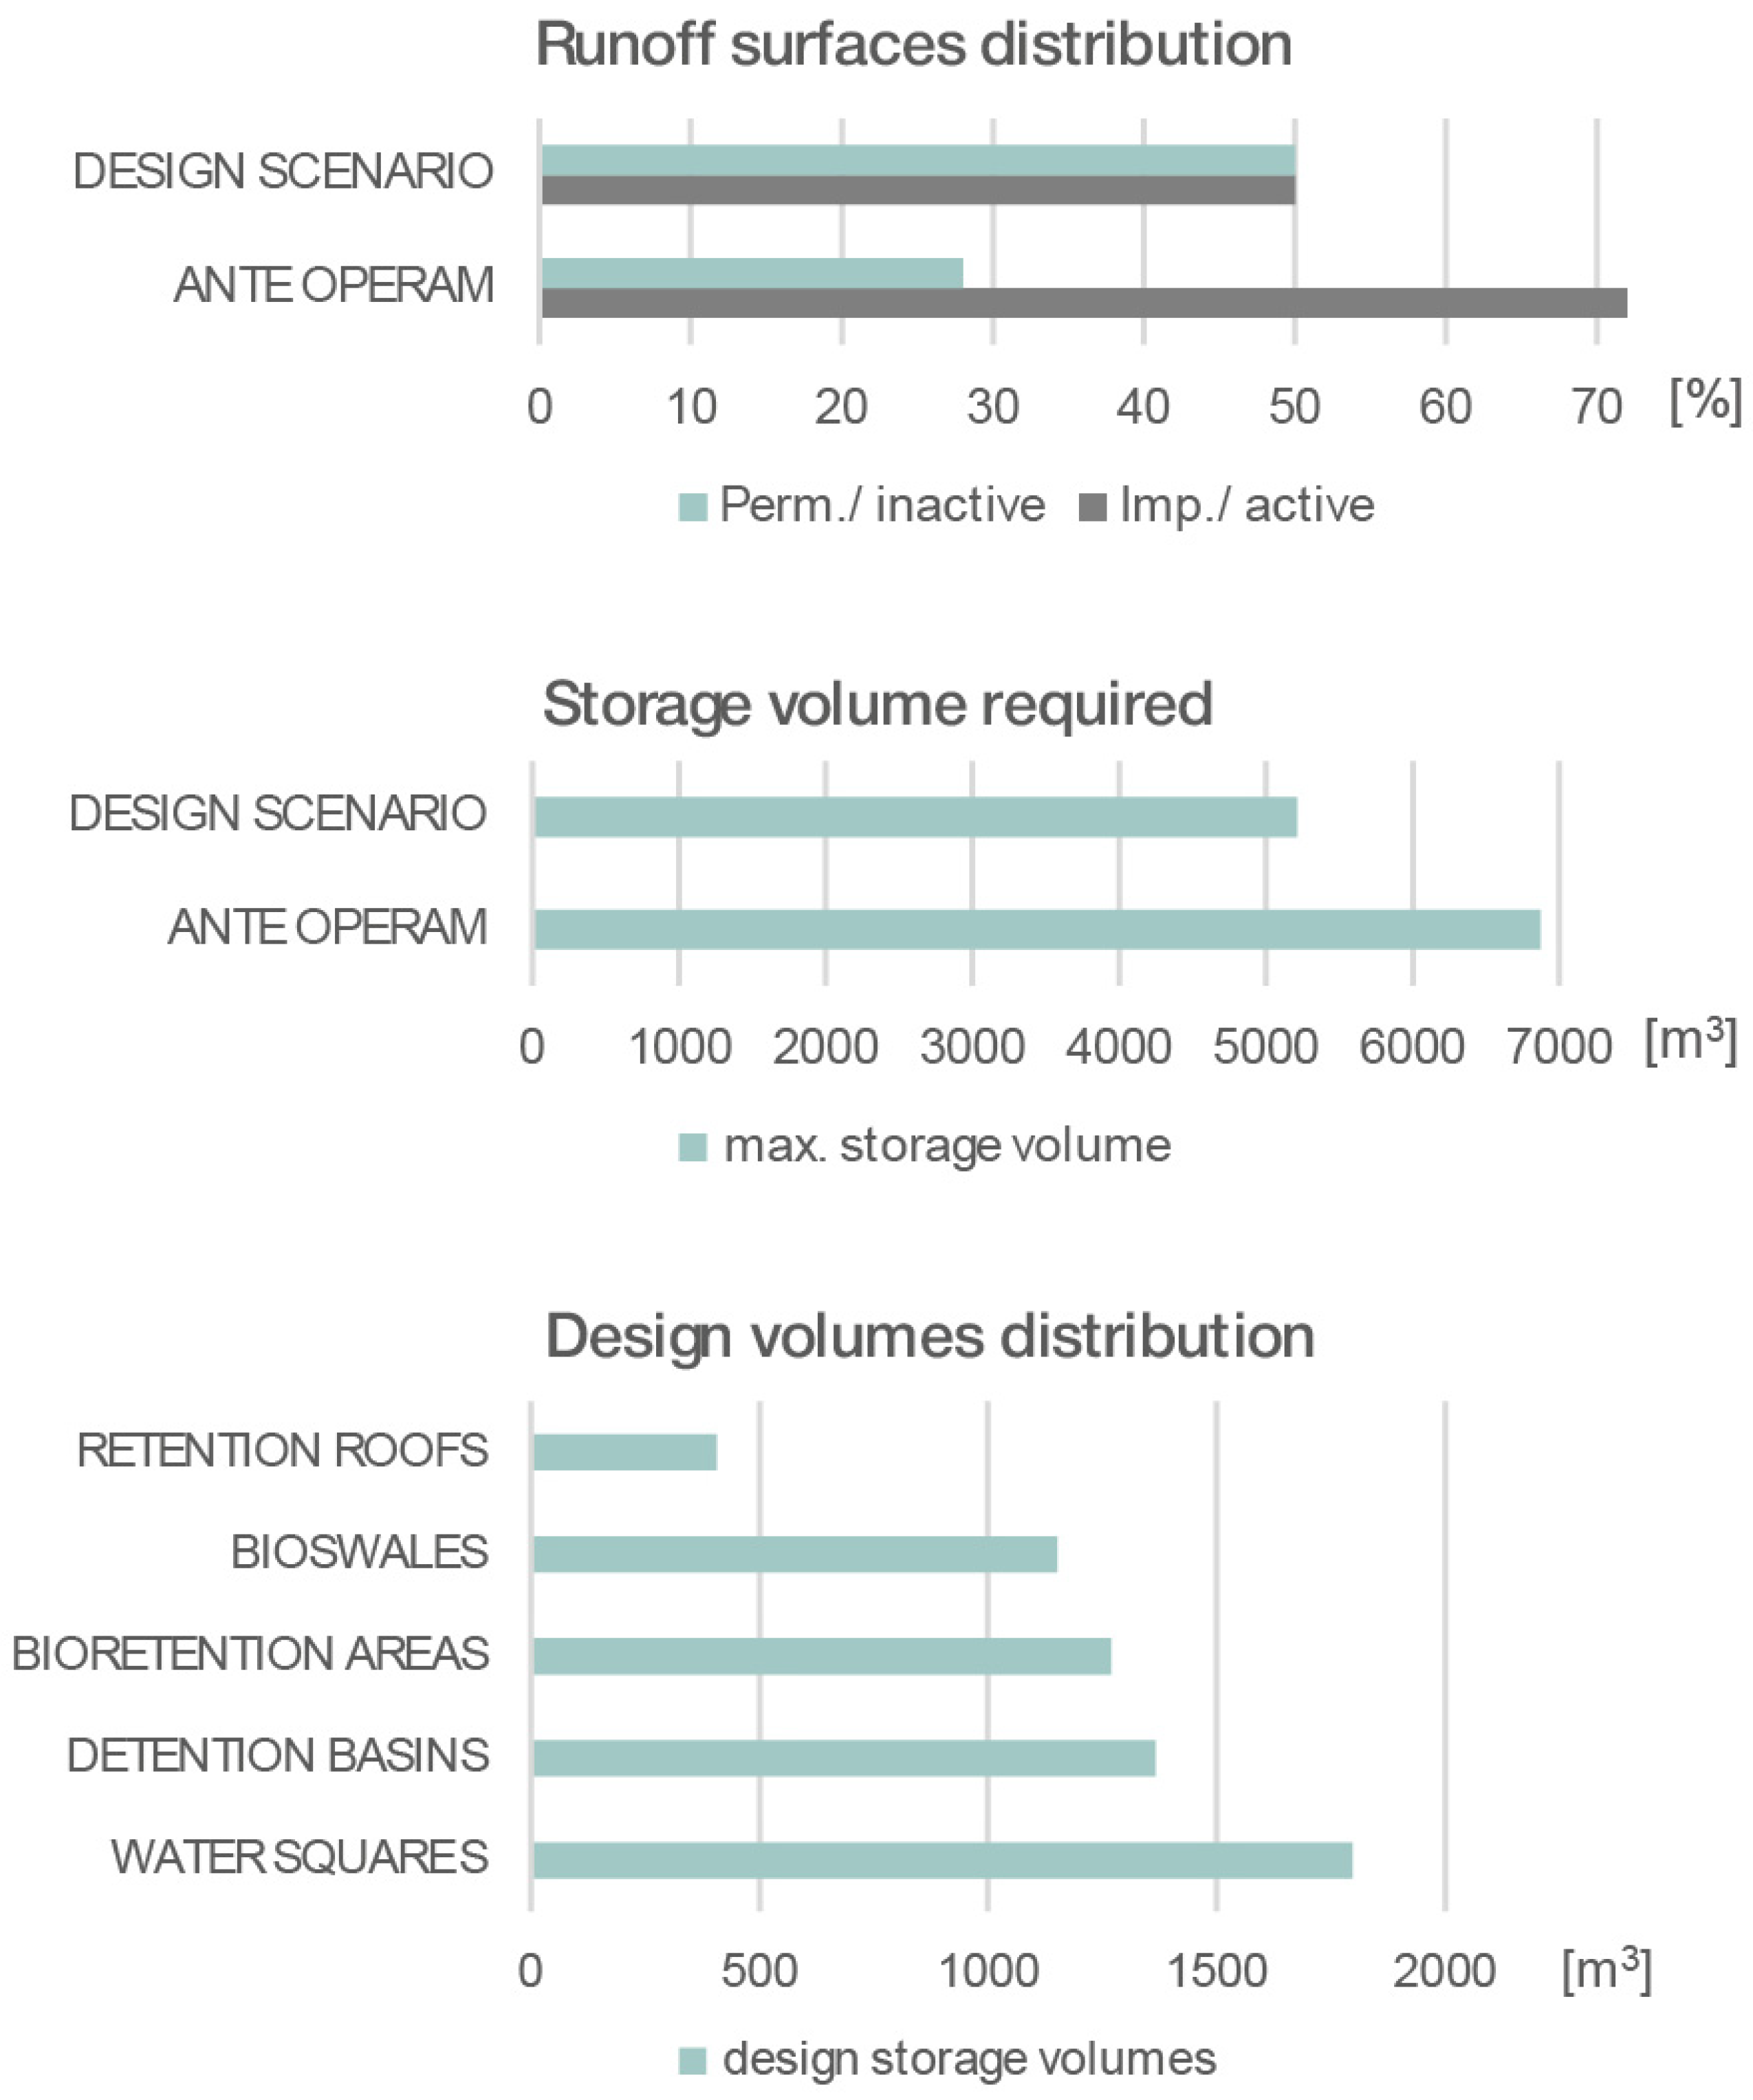
The comparison between the existing and the proposed condition (Figure 11) shows substantial improvements: impermeable surfaces decrease from 80% to 14%, the total runoff coefficient decreases by 31%, and the minimum required stormwater storage volume for a 20-year return-period rainfall event is reduced by 24%, even in the absence of soil infiltration (Figure 12). These outcomes stem from the combined action of solutions with different degrees of intensiveness and spatial extent, whose hydraulic capacity is verified and cross-referenced with their KPI profiles (Table 2).
Detention basins are adopted in an intensive configuration, with six units collectively providing 23% of the total storage volume; they receive runoff from the urban park and adjacent pedestrian areas, offering substantial flood-regulation capacity through large, vegetated depressions with notable amenity and biodiversity potential, although their contribution to water and air quality regulation remains moderate. Water squares operate as a semi-intensive system, draining water from neighbouring green areas, pedestrian courtyards and elevated walkways: ten courtyard devices combined with the larger northern basin contribute around 30% of total storage, and the model confirms their ability to buffer up to 50-year return-period events. Their KPI profiles show excellent flood-regulation and amenity performance, while biodiversity and air quality regulation remain limited due to the prevalence of hard surfaces. Retention roofs capture rainfall directly at source on the five new buildings, contributing 7% of total storage; their vegetated substrate supports high scores in runoff regulation, environmental amenity and biodiversity potential, together with notable resource efficiency, and water quality and air quality benefits. Bioswales, which collect runoff from driveways, pavements and bicycle lanes, represent the most extensive linear system, with 47 units providing 19% of total storage; although their limited depth results in average flood-regulation performance, their soil–vegetation processes ensure good water quality regulation and high water consumption efficiency, confirming their suitability along streets. Finally, the 17 bioretention areas intercept roof runoff and water from adjacent paved surfaces, accounting for 21% of total storage; their greater retention and filtration capacity yields higher flood-regulation performance than bioswales, together with consistently good results in water quality, water consumption, amenity and biodiversity.

Summary and Implications

The application of the KPI-based evaluation framework to the San Basilio pilot project demonstrates its effectiveness in guiding the selection and spatial distribution of SWMS. The combined analysis of parametric modelling results and KPI profiles confirms that the proposed solutions substantially reduce runoff volumes, enhance flood regulation, and improve environmental and social co-benefits. Intensive and semi-intensive devices, such as detention basins and water squares, provide significant flood mitigation, while linear and rooftop systems contribute to water quality regulation, biodiversity, and amenity.
Overall, the KPI assessment allows for a quantitative comparison of alternative configurations, enabling designers to prioritise interventions according to both functional performance and site-specific constraints. This structured approach ensures that the selected SWMSs achieve hydraulic invariance, optimise environmental outcomes, and offer social benefits, highlighting the potential of the framework to support evidence-based decision-making in urban stormwater management. It also facilitates the preliminary identification of potential synergies among solutions, supporting configuration adjustments according to project-specific priorities. The results further highlight opportunities for future integration with advanced environmental-modelling tools to refine design solutions and enhance resilience in urban contexts.

4. Discussion and Conclusions

The assessment framework developed in this study provides a structured and replicable methodology for comparing heterogeneous SWMSs through six coherent KPIs and associated evaluation tables, derived from a critical synthesis and harmonisation of the literature and enriched with novel parameters and sub-parameters to address existing methodological gaps. Beyond serving as a design-support tool, it establishes an operational link between urban water planning principles and measurable performance outcomes, enabling informed decisions across multiple scales and facilitating the integration of sustainable SWMSs in both new developments and retrofit projects.
By encompassing hydraulic, environmental, and resource-efficiency dimensions within a single evaluative structure, the framework supports interdisciplinary dialogue, provides a common language for designers, planners, and policymakers, and highlights the multifunctional role of nature-based and hybrid infrastructure, whose value extends beyond hydraulic compliance to broader ecosystem and socio-spatial benefits. Compared to established frameworks such as CEREMA and CIRIA, the proposed approach extends evaluation to a wider and more heterogeneous set of solutions, explicitly integrating context-specific aspects such as flood risk and water scarcity while consolidating hydraulic, environmental, and socio-ecological dimensions into a coherent assessment.
Application to the San Basilio public housing district in Rome demonstrates the framework’s practical relevance: combining KPI evaluation with parametric modelling enables the quantitative assessment of both hydraulic performance and environmental co-benefits, offering evidence-based guidance for appropriate solution selection. The framework addresses extreme-rainfall events and water scarcity in an integrated, synergistic manner, providing support for adaptation to multiple climate-related pressures and reinforcing its role as an innovative, decision-support tool. The implementation of high-quality SWMSs contributes not only to effective runoff control but also to mitigating flood risks and preventing potential impacts on infrastructure and the environment, highlighting the broader protective and preventive benefits of well-designed SWMSs.
While demonstrating robustness and applicability, the framework has limitations that define the boundaries of the current study. Qualitative indicators may involve inherent subjectivity despite harmonised scoring procedures and cross-referencing among sources. The framework has been applied and validated in a Mediterranean urban context; its transferability to non-Mediterranean climates may require contextual adjustments. The impact of long-term operation and maintenance on KPI performance has not been explicitly assessed. In addition, while a full quantitative analysis of trade-offs among KPIs has not been conducted, the framework inherently facilitates the identification of potential synergies and compromises between different performance dimensions. Recognising these limitations helps define the boundaries of the current study while guiding future refinements.
Promising directions for future research include systematic exploration of KPI trade-offs, empirical monitoring of existing SWMSs, and advanced environmental simulations. Scenario-based sensitivity analyses could evaluate the influence of indicator weighting under different hydrological conditions, including flood-prone and water-scarce areas, while differentiated weighting schemes could reflect stakeholder preferences or site-specific priorities. Integration of the objectives–strategies–solutions matrix, KPI-based assessment framework, and parametric modelling tool into a unified workflow could support design and policy processes more effectively, potentially interacting with multilevel platforms such as digital twins, microclimatic and environmental simulation tools, Geographic Information Systems (GIS), and open urban data. Such developments would enhance predictive capacity, transferability, and applicability across European urban contexts increasingly exposed to climate-related pressures, reinforcing the framework’s contribution to evidence-based, resilient urban water planning.

Author Contributions

Conceptualisation, F.T., L.M.G. and G.R.; methodology, F.T., L.M.G. and G.R.; validation, F.T. and G.R.; formal analysis, L.M.G. and G.R.; investigation, L.M.G. and G.R.; data curation, F.T., L.M.G. and G.R.; writing—original draft preparation, L.M.G. and G.R.; writing—review and editing, F.T. and G.R.; visualisation, L.M.G.; supervision, F.T. and G.R.; project administration, F.T. All authors have read and agreed to the published version of the manuscript.

Funding

The present work has been funded by the National Recovery and Resilience Plan (PNNR), Mission 4 Component 2 Investment 1.5—Call for tender No. 3277 of 30 December 2021 of the Italian Ministry of University and Research, funded by the European Union—NextGenerationEU.

Institutional Review Board Statement

Not applicable.

Informed Consent Statement

Not applicable.

Data Availability Statement

All data are available from the authors upon reasonable request.

Acknowledgments

The research is part of the broader project conducted by the Department of Planning, Design, and Technology of Architecture (PDTA) at ‘Sapienza’ University of Rome, under the PNRR Rome Technopole Project, spoke 3, CUP: B83C22002820006, funded by the National Recovery and Resilience Plan (NRRP), Mission 4—Component 2—Investment 1.5—RM TECH—Flagship Project No. 2, where Fabrizio Tucci serves as P.I. Specifically, the research was developed within Thematic Line 1, “New project models of green and smart Net Zero Energy Buildings (NZEBs) for energy transition, resource circularity, and decarbonisation in construction, towards Climate Neutrality and Positive Energy behaviour, also aimed at the design of the new campus and headquarters of the Rome Technopole”, for which the same Fabrizio Tucci acts as Co-P.I.

Conflicts of Interest

The authors declare no conflicts of interest. The funders had no role in the design of the study; in the collection, analysis, or interpretation of data; in the writing of the manuscript; or in the decision to publish the results.

Abbreviations

The following abbreviations are used in this manuscript:
SWMStormwater Management
SWMSsStormwater Management Systems
SUDSsSustainable Urban Drainage Systems
UHIUrban Heat Island
GISGeographic Information Systems
KPIsKey Performance Indicators

References

  1. UNESCO. The United Nations World Water Development Report 2024: Water for Prosperity and Peace; UNESCO Publishing: Paris, France, 2024; Available online: https://unesdoc.unesco.org/ark:/48223/pf0000388948 (accessed on 9 April 2026).
  2. WINT. The Carbon Emissions Impact of Water: A WINT White Paper; WINT: New York, NY, USA, 2022; Available online: https://wint.ai/wp-content/uploads/2022/02/White-paper-Carbon-Impact-of-Water-Consumption-Final.pdf (accessed on 9 April 2026).
  3. EEA. European Climate Risk Assessment—Executive Summary; EEA Report 01/2024; Publications Office of the European Union: Luxembourg, 2024; pp. 5–15. [Google Scholar] [CrossRef]
  4. IPCC. Europe. In Climate Change 2022: Impacts, Adaptation and Vulnerability. Contribution of Working Group II to the Sixth Assessment Report of the Intergovernmental Panel on Climate Change; Cambridge University Press: Cambridge, UK; New York, NY, USA, 2022; pp. 1817–1927. [Google Scholar] [CrossRef] [Scilit]
  5. Woods-Ballard, B.; Wilson, S.; Udale-Clarke, H.; Hillman, S.; Scott, T.; Ashley, R.; Kellagher, R. The SUDS Manual; CIRIA: London, UK, 2015; Available online: https://www.ciria.org/CIRIA/Books/Free_publications/C753F.aspx (accessed on 9 April 2026).
  6. Barker, R.; Coutts, R. Life Integrating Design with Water. In Acquatecture; RIBA Publishing: Newcastle upon Tyne, UK, 2016; pp. 48–105. [Google Scholar]
  7. Giannini, L.M. Ecological and Climate-Aware Water Management Systems: A WMs Evaluation and Operational Tool for Resilience in Architectural and Urban Stormwater Management. Ph.D. Thesis, University of Rome La Sapienza, Rome, Italy, 2025. Available online: https://hdl.handle.net/11573/1740737 (accessed on 9 April 2026).
  8. Santos, L.F.; Galvão, A.; Cardoso, M. Performance Indicators for Urban Storm Water Systems: A Review. Water Policy 2019, 21, 221–244. [Google Scholar] [CrossRef] [Scilit]
  9. Salmon, D.; Degrave, M.; Saulais, M. Gestion Intégrée de L’eau en Milieu Urbain. Fiche n°1—Méthode D’évaluation des Services Écosystémiques Rendus par les Aménagements Végétalisés de Gestion des eaux Pluviales; Centre D’Études et D’Expertise sur les Risques, L’Environnement, la Mobilité et L’Aménagement: Margny-lès-Compiègne, France, 2020. Available online: https://doc.cerema.fr/doc/SYRACUSE/16355/gestion-integree-de-l-eau-en-milieu-urbain-fiche-n-1-methode-d-evaluation-des-services-ecosystemique (accessed on 9 April 2026).
  10. Salmon, D.; Degrave, M.; Saulais, M. Gestion Intégrée de L’eau en Milieu Urbain. Fiche n°2—Évaluation des Services Écosystémiques Rendus par Différentes Techniques Alternatives Végétalisées; Centre D’Études et D’Expertise sur les Risques, L’Environnement, la Mobilité et L’Aménagement: Margny-lès-Compiègne, France, 2020; ISSN 2552-884X 2020/07. Available online: https://doc.cerema.fr/Default/doc/SYRACUSE/16356/gestion-integree-de-l-eau-en-milieu-urbain-fiche-n-2-evaluation-des-services-ecosystemiques-rendus-p (accessed on 9 April 2026).
  11. Cherqui, F.; Granger, D.; Métadier, M.; Fletcher, T.; Barraud, S.; Lalanne, P.; Litrico, X. Indicators Related to BMP Performances: Operational Monitoring Propositions. In Proceedings of the 8th Conference NOVATECH, Lyon, France, 23–27 June 2013; Available online: https://hal.science/hal-03303448/document (accessed on 9 April 2026).
  12. Collivignarelli, M.C.; Todeschini, S.; Abbà, A.; Ricciardini, P.; Miino, C.C.; Torretta, V.; Randa, E.C.; Conti, F.; Cillari, G.; Calatroni, S.; et al. The Performance Evaluation of Wastewater Services: A Protocol Based on Performance Indicators Applied to Sewers Systems and Wastewater Treatment Plants. Environ. Technol. 2022, 43, 3426–3443. [Google Scholar] [CrossRef] [Scilit]
  13. EBC. Learning from International Best Practices: 2016 Water and Wastewater Benchmark. Public Report of European Benchmarking Co-operation; EBC: Frick, Switzerland, 2016; Available online: https://www.waterbenchmark.org/document/IB2016-Public-Report-/2301 (accessed on 9 April 2026).
  14. Susdrain. Available online: https://www.susdrain.org/ (accessed on 30 November 2025).
  15. McCloy, A.; Bray, B.; Barton, K. The SuDS Design and Evaluation Guide; Robert Bray Associates and McCloy Consulting: London, UK, 2018; Available online: https://www.mccloyconsulting.com/suds-design-and-evaluation-guide/ (accessed on 9 April 2026).
  16. IBGE. Eaux de Pluie, un Atout Pour L’espace Public: Etude Présentant des Projets Innovants en Matière de Gestion des Eaux Pluviales sur L’espace Public et en Voirie; Fontaine, F., Peeters, R., Eds.; Institut Bruxellois pour la Gestion de l’Environnement: Bruxelles, Belgium, 2014; Available online: https://document.environnement.brussels/opac_css/elecfile/STUD_EaudePluie_EspacePublic_FR.pdf (accessed on 9 April 2026).
  17. Giannini, L.M.; Romano, G.; Tucci, F. Multi-Scale Approach to Integrated Water Resource Management for Architectural and Urban Resilience in the European Context. In Proceedings of the Beyond All Limits Conference 2025: 3rd International Conference on Sustainability in Architecture, Planning and Design, Ankara, Turkey, 16–17 October 2025; pp. 684–696. Available online: https://beyondalllimits.cankaya.edu.tr/wp-content/uploads/sites/6/2025/10/BAL2025_PROCEEDINGSBOOK_251014-1.pdf (accessed on 9 April 2026).
  18. Lu, Y.; Xie, J.; Yang, C.; Qin, Y. Control of Runoff Peak Flow for Urban Flooding Mitigation. Water 2021, 13, 1796. [Google Scholar] [CrossRef] [Scilit]
  19. Negretto, V.; Giacomello, E.; Gava, B.; Romanato, N. Linee Guida per il Drenaggio Urbano Sostenibile: Tecniche e Principi per la Pianificazione Urbanistica; CORILA: Venezia, Italy, 2021; ISBN 9788889405345. Available online: https://air.iuav.it/handle/11578/314522 (accessed on 9 April 2026).
  20. National Research Council. Methods for Assessing Flood Risk. In Tying Flood Insurance to Flood Risk for Low-Lying Structures in the Floodplain; National Research Council of the National Academies: Washington, DC, USA; The National Academies Press: Washington, DC, USA, 2015. [Google Scholar] [CrossRef] [Scilit]
  21. Donatello, S.; Dodd, N.; Cordella, M. Level(s) Indicator 3.1: Use Stage Water Consumption User Manual: Introductory Briefing, Instructions and Guidance; (Publication Version 1.1); European Commission: Brussels, Belgium, 2021. Available online: https://susproc.jrc.ec.europa.eu/product-bureau/sites/default/files/2021-01/UM3_Indicator_3.1_v1.1_31pp.pdf (accessed on 9 April 2026).
  22. Winston, J.R.; Witter, J.D.; Tirpak, R.A.; Sester, L.; Jenkins, H.; Lillard, V. Abundance and Composition of Anthropogenic Macrolitter and Natural Debris in Road Runoff in Ohio, USA. Water Res. 2023, 239, 120036. [Google Scholar] [CrossRef] [Scilit] [PubMed]
  23. Burkhardt, M.; Zuleeg, S.; Vonbank, R.; Bester, K.; Carmeliet, J.; Boller, M.; Wangler, T. Leaching of Biocides from Façades under Natural Weather Conditions. Environ. Sci. Technol. 2012, 46, 5497–5503. [Google Scholar] [CrossRef] [Scilit] [PubMed]
  24. Kloepfer, A.; Jekel, M.; Reemtsma, T. Occurrence, Sources, and Fate of Benzothiazoles in Municipal Wastewater Treatment Plants. Environ. Sci. Technol. 2005, 39, 3792–3798. [Google Scholar] [CrossRef] [Scilit] [PubMed]
  25. Callen, M.S.; López, J.M.; Iturmendi, A.; Mastral, A.M. Nature and Sources of Particle Associated Polycyclic Aromatic Hydrocarbons (PAH) in the Atmospheric Environment of an Urban Area. Environ. Pollut. 2013, 183, 166–174. [Google Scholar] [CrossRef] [Scilit] [PubMed]
  26. Chevreuil, M.; Garmouma, M.; Teil, M.J.; Chesterikoff, A. Occurrence of Organochlorines (PCBs, Pesticides) and Herbicides (Triazines, Phenylureas) in the Atmosphere and in the Fallout from Urban and Rural Stations of the Paris Area. Sci. Total Environ. 1996, 182, 25–37. [Google Scholar] [CrossRef] [Scilit] [PubMed]
  27. Roder Green, A.L.; Putschew, A.; Nehls, T. Littered Cigarette Butts as a Source of Nicotine in Urban Waters. J. Hydrol. 2014, 519, 3466–3474. [Google Scholar] [CrossRef] [Scilit]
  28. Tucci, F.; Cecafosso, V.; Giampaoletti, M.; Giannini, L.M. Il Progetto della Mitigazione Climatica verso la Neutralità Carbonica: Sperimentazioni Applicate ad Architetture e Distretti Urbani. In Verso la Neutralità Climatica di Architetture e Città Green: Approcci, Indirizzi, Strategie, Azioni; Tucci, F., Cecafosso, V., Altamura, P., Turchetti, G., Eds.; FrancoAngeli: Milano, Italy, 2023; pp. 175–235. ISBN 9788835150459. [Google Scholar] [CrossRef] [Scilit]
  29. Marin, P.; Giannini, L.M.; Tucci, F. Gestione Resiliente delle Acque Meteoriche. Uno Strumento a Supporto della Progettazione|Resilient Management of Stormwater. A Tool to Support Design. Agathón Int. J. Archit. Art Des. 2025, 18, 196–211. [Google Scholar] [CrossRef]
Figure 1. Flowchart illustrating the methodological process adopted to develop the six Key Performance Indicators (KPIs) and to assess the 36 sustainable stormwater management systems (SWMSs).
Applsci 16 03762 g001
Figure 2. Evaluation process of the 36 SWMSs, classified by architectural strategy and by green–blue or grey nature: (a) Structure of the six analytical tables developed through the assessment of each solution by sub-parameter and KPI; (b) adopted evaluation system based on a 0–4 scale.
Applsci 16 03762 g002
Figure 3. Analytical evaluation of the 36 SWMSs in relation to the flood regulation KPI. Sub-parameters not applicable to specific solutions (n/a) are excluded from the assessment. Where two variants of a solution are possible, values are reported in the form (x/y). Cell colors identify SWMS nature (blue: green-blue systems; grey: grey systems), while intermediate sub-parameter scores are highlighted in light yellow.
Applsci 16 03762 g003
Figure 4. Analytical evaluation of the 36 SWMSs in relation to the water consumption regulation KPI. Sub-parameters not applicable to specific solutions (n/a) are excluded from the assessment. Where two variants of a solution are possible, values are reported in the form (x/y). Cell colors identify SWMS nature (blue: green-blue systems; grey: grey systems), while intermediate sub-parameter scores are highlighted in light yellow.
Applsci 16 03762 g004
Figure 5. Analytical evaluation of the 36 SWMSs in relation to the water quality regulation KPI. Sub-parameters not applicable to specific solutions (n/a) are excluded from the assessment. Where two variants of a solution are possible, values are reported in the form (x/y). Cell colors identify SWMS nature (blue: green-blue systems; grey: grey systems), while intermediate sub-parameter scores are highlighted in light yellow.
Applsci 16 03762 g005
Figure 6. Analytical evaluation of the 36 SWMSs in relation to the air quality regulation KPI. Sub-parameters not applicable to specific solutions (n/a) are excluded from the assessment. Where two variants of a solution are possible, values are reported in the form (x/y). Cell colors identify SWMS nature (blue: green-blue systems; grey: grey systems), while intermediate sub-parameter scores are highlighted in light yellow.
Applsci 16 03762 g006
Figure 7. Analytical evaluation of the 36 SWMSs in relation to the environmental amenity KPI. Sub-parameters not applicable to specific solutions (n/a) are excluded from the assessment. Where two variants of a solution are possible, values are reported in the form (x/y). Cell colors identify SWMS nature (blue: green-blue systems; grey: grey systems), while intermediate sub-parameter scores are highlighted in light yellow.
Applsci 16 03762 g007
Figure 8. Analytical evaluation of the 36 SWMSs in relation to the biodiversity potential KPI. Sub-parameters not applicable to specific solutions (n/a) are excluded from the assessment. Where two variants of a solution are possible, values are reported in the form (x/y). Cell colors identify SWMS nature (blue: green-blue systems; grey: grey systems), while intermediate sub-parameter scores are highlighted in light yellow.
Applsci 16 03762 g008
Figure 9. Extract of the summary table. The 36 green–blue and grey SWMSs are organised by architectural strategy and evaluated against the six KPIs. Additional information relevant to project development is also provided. Sub-heading cell colors identify SWMS nature (blue: green-blue systems; grey: grey systems), while architectural strategies are highlighted in yellow.
Applsci 16 03762 g009
Figure 10. Pilot project area in San Basilio, Rome: A Summary of project data, inputs, and results from applying the objectives–strategies–solutions matrix for sustainable stormwater management (SWM). Design strategies are represented using icons defined by the Authors; the direction of the arrows indicates the adopted water management approach. The original urban plan included areas designated for residential buildings (E), public services (S), commercial functions (C), and park areas (tree symbol), as shown in the figure, which were never implemented.
Applsci 16 03762 g010
Figure 11. Soil permeability analysis: Comparison between ex ante (a) and ex post (b) scenarios of the pilot project.
Applsci 16 03762 g011
Figure 12. Comparative evaluation between ex ante and ex post scenarios of the pilot project resulting from the application of the design-support tool in Rhino–Grasshopper.
Applsci 16 03762 g012
Table 1. The six KPIs and the evaluation sub-parameters adopted to analyse the 36 green–blue and grey sustainable urban SWMSs.
KPI 1
Flood Regulation
KPI 2 *
Water Consumption Regulation
KPI 3
Water Quality Regulation
Stormwater runoff volume reductionStorage capacity for rainwater reuseMacro-pollutant mitigation
(total suspended solids)
Stormwater runoff peak flow
reduction
Potential association with other
recovery/ filtration devices
Micro-pollutant mitigation
(hydrocarbons, heavy metals, organic pollution)
Flood-risk management suitability *Water demand Pollution prevention *
KPI 4
Air Quality Regulation
KPI 5
Environmental Amenity
KPI 6
Biodiversity Potential
Urban Heat Island (UHI) reduction and microclimatic improvementsVisual and sensorial
pleasure degree
Degree of functional similarity to a natural area that enables biodiversity to be hosted and developed
Air pollutant absorption/ capture
capacity
Leisure, multifunctionality and/or
accessibility potential
* Parameters and sub-parameters critically complemented by the authors to address methodological and conceptual gaps in the literature.
Table 2. Summary of the SWMSs employed in the pilot project, cross-referenced with the results obtained from the application of the KPI-based assessment framework.
SWMSsPresence Score KPI 1KPI 2KPI 3KPI 4KPI 5KPI 6
S1. Source control Green–blue1. Extensive/semi-intensive green roofs •••2.32.02.01.83.52.0
2. Intensive green roofs Applsci 16 03762 i0013.01.72.32.83.53.0
3. Brown roofs••1.52.71.01.31.54.0
4. Green walls••1.71.51.72.84.04.0
5. Rain gardensApplsci 16 03762 i0012.33.52.22.02.53.0
6. Phytodepuration systems•••1.34.02.82.01.53.0
7. Lawns, permeable surfaces•••2.72.02.01.53.02.0
8. Urban tree planting•••1.72.02.33.04.04.0
9. Xeriscaping••1.24.01.51.83.04.0
10. Retention roof (blue/green–blue)••3.3/3.63.0/3.03.0/3.01.5/3.32.0/3.51.0/3.5
Grey11. Rainwater harvesting •••3.34.03.0n/an/an/a
12. Pervious pavement•••2.72.02.52.02.01.0
13. Fountains/water featuresApplsci 16 03762 i001n/a2.33.04.04.01.0
14. Performative buildings•••3.73.73.33.04.0NA
15. Water-saving devices•••n/a4.0n/an/an/an/a
S2. Water diversionGreen–blue16. Vegetated swales/bioswales (dry/wet) •••2.0/2.03.5/3.52.5/2.51.3/2.03.0/3.02.5/2.5
17. Channels and rillsApplsci 16 03762 i0011.5n/a1.81.32.02.0
Grey18. Open canalsApplsci 16 03762 i0012.0n/a1.71.02.01.0
19. Gutters••1.3n/a1.0n/a1.8n/a
S3. Water reception Green–blue20. Bioretention systems•••3.03.52.82.02.53.0
21. Detention basins•••3.0n/a2.31.53.03.0
22. Retention pondsApplsci 16 03762 i0012.3n/a2.72.03.04.0
23. Water squares•••3.73.03.51.04.01.0
24. Terraced waterfrontsn/a2.7n/a1.71.33.52.0
25. Constructed wetlands•••2.74.03.02.83.54.0
Grey26. Urban flood storageApplsci 16 03762 i0013.7n/a3.0n/a2.5n/a
27. Dry-proof buildingn/a1.0n/an/an/an/an/a
28. Wet-proof buildingn/a2.0n/an/an/an/an/a
29. Elevated-floor buildingApplsci 16 03762 i0014.0n/an/an/a2.5n/a
30. Amphibious buildingn/a3.0n/an/an/an/an/a
31. Floating buildingn/a3.0n/an/an/an/an/a
S2–3. CombinedGreen–blue32. Infiltration trenchesApplsci 16 03762 i0013.0n/a2.31.31.51.0
33. Filter strips1.02.01.81.32.52.0
Grey34. Geocellular systems3.33.01.3n/an/an/a
S1–3. CombinedGreen–blue35. Soakways (dry wells)Applsci 16 03762 i0013.0-2.3n/an/an/a
Grey36. Underground lamination tankApplsci 16 03762 i0013.72.53.5n/an/an/a
Scores for solution presence are assigned as follows: (Applsci 16 03762 i001) = absent; (•) = low; (••) = medium; (•••) = high. KPI values are given on a 0–4 scale (0 = absent; 1 = low; 2 = medium; 3 = good; 4 = high). When a solution has two variants, both values are reported as (x/y). Indicators not applicable to a solution are indicated as n/a.
Disclaimer/Publisher’s Note: The statements, opinions and data contained in all publications are solely those of the individual author(s) and contributor(s) and not of MDPI and/or the editor(s). MDPI and/or the editor(s) disclaim responsibility for any injury to people or property resulting from any ideas, methods, instructions or products referred to in the content.