Article

Optimization Design and Experimental Testing of Sound Insulation Performance for Silent Cabins

1
Ningbo Research Institute of Northwestern Polytechnical University, Ningbo 315048, China
2
College of Energy and Power, Jiangsu University of Science and Technology, Zhenjiang 212100, China
*
Author to whom correspondence should be addressed.
Appl. Sci. 2026, 16(6), 2996; https://doi.org/10.3390/app16062996
Submission received: 9 February 2026 / Revised: 10 March 2026 / Accepted: 17 March 2026 / Published: 20 March 2026
(This article belongs to the Special Issue Novel Advances in Noise and Vibration Control)

Abstract

This study investigates the sound insulation performance of an anechoic chamber, exploring the influence patterns of different multilayer material combinations on wall sound insulation characteristics. Based on sound transmission theory, a predictive model for multilayer material wall sound insulation was established. The finite element method was employed to simulate the sound propagation characteristics of walls and glass doors with various material combinations. After validating the simulation results through a double-room method experiment, the material combination scheme for the anechoic chamber walls and glass doors was optimized. Based on this, a 1000 mm × 1000 mm × 2300 mm soundproof room prototype was designed and constructed. Its sound insulation performance under reverberant conditions was tested using the insertion loss method and compared with simulation data. Simultaneously, a hybrid calculation method combining low-frequency finite element analysis with high-frequency statistical energy analysis enabled precise and efficient prediction of the overall sound insulation performance of the soundproof room. Research revealed that single-pane glass with thicknesses between 5 and 20 mm conformed to the mass law, with sound insulation increasing by an average of 0.8 dB per additional millimeter. The 10 mm single-pane glass emerged as the optimal choice for the soundproof room’s glass door due to its ideal thickness and excellent low-to-mid-frequency sound insulation. The optimized wall structure featured compact thickness, outstanding low-frequency sound insulation, and balanced mid-to-high-frequency performance. Simulation and experimental results for the core frequency range of 63–1000 Hz showed high consistency, which validates the reliability of the theoretical model and simulation methodology within this frequency band. The deviation of simulation results from experimental data in the frequency range above 1000 Hz is mainly caused by acoustic leakage due to experimental sealing defects, and the high-frequency simulation results are only used for trend analysis rather than conclusion support. This study identifies the optimal multi-layer material combination for soundproof rooms, providing practical material strategies for acoustic design. It also reveals the sound insulation mechanisms of multi-layer composite structures. The findings offer significant reference for optimizing soundproofing materials and structures in architectural acoustics and transportation noise control.

1. Introduction

Noise pollution has evolved into a significant environmental problem impacting both the quality of life and human health, and with the accelerated pace of urbanization and ongoing development of transportation infrastructure, there is a growing urgency for high-performance sound-insulating materials and structural solutions. Currently, research on sound-insulating materials is transitioning from traditional materials to multifunctional composites, while theoretical studies are evolving from classical sound insulation theory towards multi-physics coupling analysis, and testing methodologies are shifting from laboratory measurements to integrated approaches combining in situ monitoring with numerical simulation. Amid the accelerated pace of modern life and increasingly noisy urban environments, numerous specific activities and operations, including audio testing and recording, industrial testing and R&D, telemarketing, as well as individual study and work, face the challenge of being difficult to conduct effectively in noisy settings. It is in this context that the silent cabin has emerged, providing a quiet space for these activities.
In fundamental research on sound-insulating materials, glass, as a commonly used sound-insulating component, has seen the establishment of a relatively comprehensive research system. Elstner [1] systematically expounded the fundamental principles and key design considerations for glass sound insulation. Ding [2] systematically elaborated on the principles of glass sound insulation and its influencing factors. Granzotto [3] investigated the influence of window structural parameters on acoustic performance and established a prediction model. Cai [4] experimentally investigated the influence of parameters such as glass configuration and window frame profiles on the sound insulation performance of single-glazed windows. Zhu [5] systematically investigated the influence mechanisms of glass thickness and air layer coupling effects on sound insulation performance, based on which optimized glass configurations targeting full-frequency, low-frequency, and high-frequency noise were proposed. Hu [6] investigated the impact response characteristics of PVB laminated glass using near-field dynamic approach. Yu [7] employed additive engineering to construct a porous structure within PVB films, significantly enhancing their mid-to-low frequency sound insulation performance and mechanical properties. Liu [8] systematically evaluated the acoustic performance of sound-insulating PVB interlayer laminated glass, confirming that its transmission loss is markedly superior to that of ordinary tempered glass and conventional PVB laminated glass due to the damping energy dissipation mechanism of the intermediate layer. Cui [9] designed a flexible metamaterial curtain composed of perforated PVC membranes, utilizing acoustic cavity resonance between the membranes to achieve broadband sound insulation. Jang [10] designed a flexible soundproof panel that achieves efficient sound insulation through coupled anti-resonance between the frame and the vibrating membrane.
In recent years, significant progress has been made in sound insulation research across theoretical modeling, numerical simulation, and experimental validation, demonstrating a clear trend toward deep integration and collaborative innovation of multiple methodologies. Wang [11] developed a dedicated analytical model for multi-layer lightweight composite structures and tested the sound insulation performance of various structural configurations. Wyngaert [12] addressed double-leaf walls with flexible frames, proposing a hybrid deterministic–statistical energy analysis model that achieves both high accuracy and efficiency in predicting sound insulation performance. Guo [13] established and validated a theoretical model for the coupling between periodic double-layer sandwich panels and acoustic cavities, investigating various factors influencing sound insulation performance. Xia [14] established a sound transmission loss calculation model using the Transfer Matrix Method and experimentally validated it, while systematically analyzing the influence patterns of structural parameters. Wang [15] developed an equivalent thin-plate method suitable for multilayer structures. Both approaches validated the accuracy of their respective methods through comparative studies. Peng [16] proposed a Finite Element–Boundary Element Method that equivalently models laminated plates as single-layer plates. Based on a residual minimization method, Nowoswiat [17] systematically compared the prediction errors of multiple theoretical models and constructed a reverberation time correction model applicable to non-diffuse sound fields. Huang [18] developed a hybrid FTMM-SEA prediction model for vacuum glass windows in high-speed trains.
While theoretical research continues to deepen, research outcomes are gradually extending to practical engineering applications. Martellotta [19] systematically discussed the research progress in composite sound-insulating materials, emphasizing that materials must balance broadband performance with the requirements of real-world applications, thereby providing market-oriented guidance for the optimization of sound insulation cabin design. Garg [20] focused on multi-layer laminated partition boards and masonry structures, employing the reverberation room experimental method to systematically evaluate the sound insulation performance of composite materials such as gypsum boards and high-damping synthetic insulation membranes. Yue [21] found through comparative experiments that light steel stud walls provide better sound insulation performance than wood stud walls. Li [22] conducted an experimental investigation on commercial silence cabins using the sound insulation measurement method based on a reverberation chamber, revealing the influence patterns of material structure and frequency band characteristics on their sound insulation performance. Hongisto [23] conducted a study on the acoustic performance of silence cabins in office scenarios in accordance with the ISO 23351-1 standard, confirming the effective attenuation of speech noise in reverberant environments by high-grade sound insulation cabins, and clarified the core requirements for mid-to-low frequency sound insulation performance of silence cabins in practical application scenarios. These studies have not only deepened the understanding of the performance of various sound-insulating materials, but also provided effective analytical methods and design guidance for engineering applications, demonstrating a clear developmental trajectory from single materials to composite multilayer systems, from empirical design to numerical simulation, and from static analysis to dynamic response.
This study focuses on the core mid-to-low frequency range of 63–1000 Hz to address the sound insulation requirements for soundproof cabins. It systematically investigates the sound insulation performance of layered structures composed of different material combinations and thoroughly examines the variation patterns in sound insulation characteristics from single-layer materials to multi-material configurations. Using experimental data as the primary basis, supplemented by finite element numerical simulation results in the 63–1000 Hz frequency band for auxiliary analysis, the layered structure configuration was optimized. Based on the optimized multi-layer material composition, a silent cabin prototype was designed and fabricated. Its sound insulation performance was tested in a reverberation environment, with comparative analysis conducted against numerical simulation results and experimental data from commercially available silent cabins, thereby assessing the sound insulation advantages of the optimized solution across the low, medium, and high frequency ranges. This study provides both a scientific basis and practical solutions for the design of multilayer materials aimed at suppressing indoor noise, thereby holding significant implications for advancing noise control technologies.

2. Theory and Methodology

2.1. Fundamentals of Sound Insulation in Layered Structures

This study focuses on passive sound insulation mechanisms to analyze the principles of layered structure sound insulation. The core of sound insulation lies in weakening sound propagation through multiple physical effects, primarily encompassing three mechanisms: absorption, reflection, and transmission loss. First, the absorption principle primarily utilizes porous materials to absorb sound wave energy, reducing reflection and propagation. Second, the reflection principle employs acoustically impermeable materials to reflect incident sound waves, preventing their transmission through the structure. Additionally, structural design measures such as increasing wall thickness or employing double-wall construction can effectively enhance resistance to sound propagation, thereby improving transmission loss and achieving sound insulation. The mass law states that materials with greater surface density effectively block sound propagation, forming one of the core theoretical foundations of passive sound insulation. Through the aforementioned passive sound insulation methods, sound transmission efficiency can be effectively reduced, achieving the goal of sound insulation.
For the experimental testing of sound insulation in layered structures, the two-room method employing a combined reverberation chamber and anechoic room approach was adopted; this represents a standardized test method used to measure the sound insulation performance of building or structural components such as walls, windows and doors. The method evaluates the sound insulation effectiveness of building materials or components by measuring the attenuation of sound transmission between two acoustically isolated rooms—the source room and the receiving room.
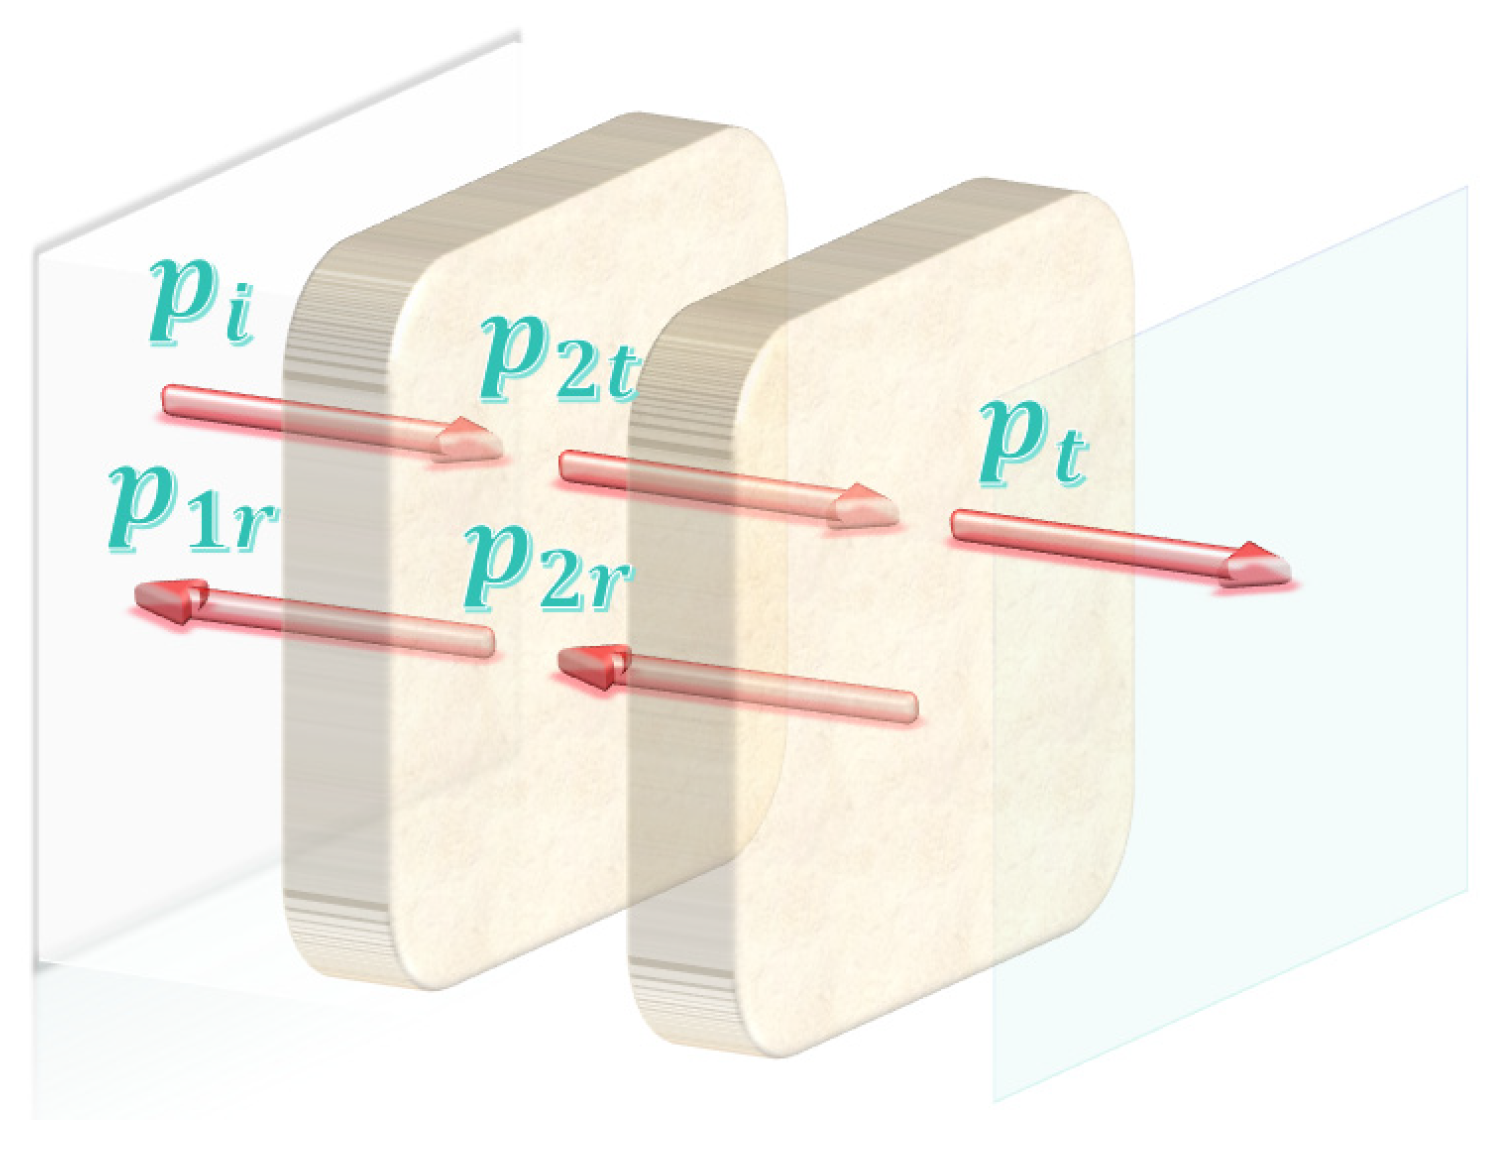
In the sound insulation process of a single-layer partition structure, sound waves generated by an external acoustic source are transmitted through a medium to the partition. Upon contacting the structural surface, a portion of the sound waves is reflected, while another portion penetrates through the partition. The variation in sound pressure between the incident and transmitted sound waves represents the sound insulation performance of the partition structure as shown in Figure 1.
Transmitted wave expression form:
p t = p t a e j [ ω t k 1 ( x H ) ] , v t = v t a e j [ ω t k 1 ( x H ) ] .
where H denotes the thickness of the partition structure, and ω denotes the sound wave angular frequency k 1 = ω c 1 .
The magnitudes of reflection and transmission are determined by applying the acoustic boundary conditions at x = 0 , x = H respectively. At x = 0 , the continuity conditions of acoustic pressure and normal particle velocity yield
p i a + p 1 r a = p 2 t a + p 2 r a , v i a + v 1 r a = v 2 t a + v 2 r a .
At x = H , the continuity conditions of acoustic pressure and normal particle velocity yield
p 2 t a e j k 2 H + p 2 r a e j k 2 H = p t a , v 2 t a e j k 2 H + v 2 r a e j k 2 H = v t a .
where k 2 = ω c 2 .
The sound wave propagates as a plane wave, velocity of particles along the normal direction of the sound wave in each section:
v t a = p 2 t a Z 2 , v r a = p 2 r a Z 2 ; v 2 t a = p 2 t a Z 2 , v 2 r a = p 2 r a Z 2 ; v t a = p t a Z 1 .
By combining Equations (1)–(3), the acoustic pressure ratio is obtained:
τ = p t a p i a = 2 [ 4 cos 2 k 2 H + ( Z 12 + Z 21 ) 2 sin 2 k 2 H ] 1 / 2
where Z 1 , Z 2 represent the acoustic impedances of different media, Z 12 = Z 2 Z 1 , Z 21 = Z 1 Z 2 . τ directly reflects the proportion of incident sound energy transmitted through the sound insulation structure, serving as the fundamental raw parameter for calculating sound insulation performance.
From Equation (5), the sound intensity transmission coefficient is obtained as
τ = W t W = I t I = p t a 2 / 2 ρ 1 c 1 p i a 2 / 2 ρ 2 c 2 = 4 4 cos 2 k 2 H + ( Z 12 + Z 21 ) 2 sin 2 k 2 H
The sound insulation capability is described by the reciprocal of the transmission coefficient, and the transmission loss quantitatively characterizes a sound-insulating structure’s ability to attenuate transmitted sound waves. Higher values indicate superior sound insulation performance. It is calculated using the following formula:
T L = 10 lg 1 τ
When the wall thickness satisfies k 2 H = 2 π H λ 2 < 0.5 , the expression may be approximated as
T L = 10 lg 1 + 1 4 Z 12 2 ( k 2 H ) 2 = 10 lg 1 + ω M 2 2 Z 1 2
where M 2 = ρ 2 H 2 represents the surface density of the partition structure.
For a multilayer structure, the expression may be approximated as
T L = 10 lg 1 + ω M 2 Z 1 2
Here, M = M 1 + M 2 + + M n , where M 1 , M 2 , , M n represent the mass per unit area of the multilayer structure. And ρ = ρ 1 + ρ 2 + + ρ n , where ρ 1 , ρ 2 , , ρ n represent the densities of the materials in each layer of the multilayer structure. Similarly, H = H 1 + H 2 + + H n , where H 1 , H 2 , , H n represent the thicknesses of the materials in each layer of the multilayer structure.
When the condition ω M 2 Z 1 1 is satisfied, the expression can be further simplified to
T L = 20 lg M + 20 lg f 42
The applicability of this equation is predicated on an infinitely large homogeneous elastic plate and holds only within the mid-to-low frequency range—specifically, frequencies above the structure’s fundamental resonance frequency and below the plate’s critical frequency.
The fundamental principle of sound insulation in multi-layer partition structures is analogous to that of single-layer partitions, involving both reflected and transmitted waves. However, due to material diversity and the specific structural configurations of layered design combinations, the sound insulation process becomes considerably more complex. For instance, in hollow sandwich configurations, the internal air-filled cavity forms a reflective chamber where multiple internal reflections dissipate acoustic energy, thereby achieving sound insulation. Alternatively, the inclusion of sound-absorbing medium materials within the structure can effectively absorb acoustic energy, reduce sound wave reflection, and attenuate sound transmission intensity.

2.2. Calculation Principles for Sound Insulation in Silent Cabins

The insertion loss method for calculating sound insulation involves taking the difference between the sound pressure levels in the source room and receiving room to directly determine the sound insulation value. It is defined as the difference in sound power levels measured at a specific location at a certain distance from the sound source before and after the installation of the sound insulation structure, commonly used for evaluating the acoustic performance of on-site noise control measures such as acoustic enclosures and barriers. The loss quantity is obtained by calculating with unweighted sound power levels:
D i = L W P 1 L W P 2
where L W P 1 represents the sound power level measured before installation of the acoustic enclosure, and L W P 2 denotes the sound power level measured after installation of the acoustic enclosure.
Sound insulation test results from different laboratories or manufacturers must be based on a uniform speech spectrum to enable comparative analysis, thus avoiding data incompatibility caused by discrepancies in acoustic sources. By calculating the residual speech sound power level after sound insulation, the sound insulation performance of components is thereby quantified.
Speech Spectrum Correction:
L W S 2 = L W S 1 D i
where L W S 1 represents the standardized speech sound power level, and L W S 2 denotes the corrected speech sound power level.
After selecting the frequency range, the results are typically converted into 1 / 1 octave band data. The corresponding A -weighting corrections can be directly applied, and the A -weighted sound power level is obtained through summation of exponential terms:
L W S A 2 = 10 log 10 i = 1 n 10 L W S 2 + A i / 10
where n represents the number of frequency points.
Formula for calculating sound insulation value with superimposed A -weighting corrections:
L W S A 1 i = L W S 1 i + A i
D A = L W S A 1 L W S A 2
where D A represents the corrected loss value, which is the actual measured sound insulation performance. This value corresponds to the measured transmission loss under standardized test conditions and serves as the core parameter for evaluating actual measurements and simulations in this study.

3. Analysis and Optimization of Layered Structure Configurations

3.1. Simulation of Sound Insulation Performance for Glass Door Layered Structures

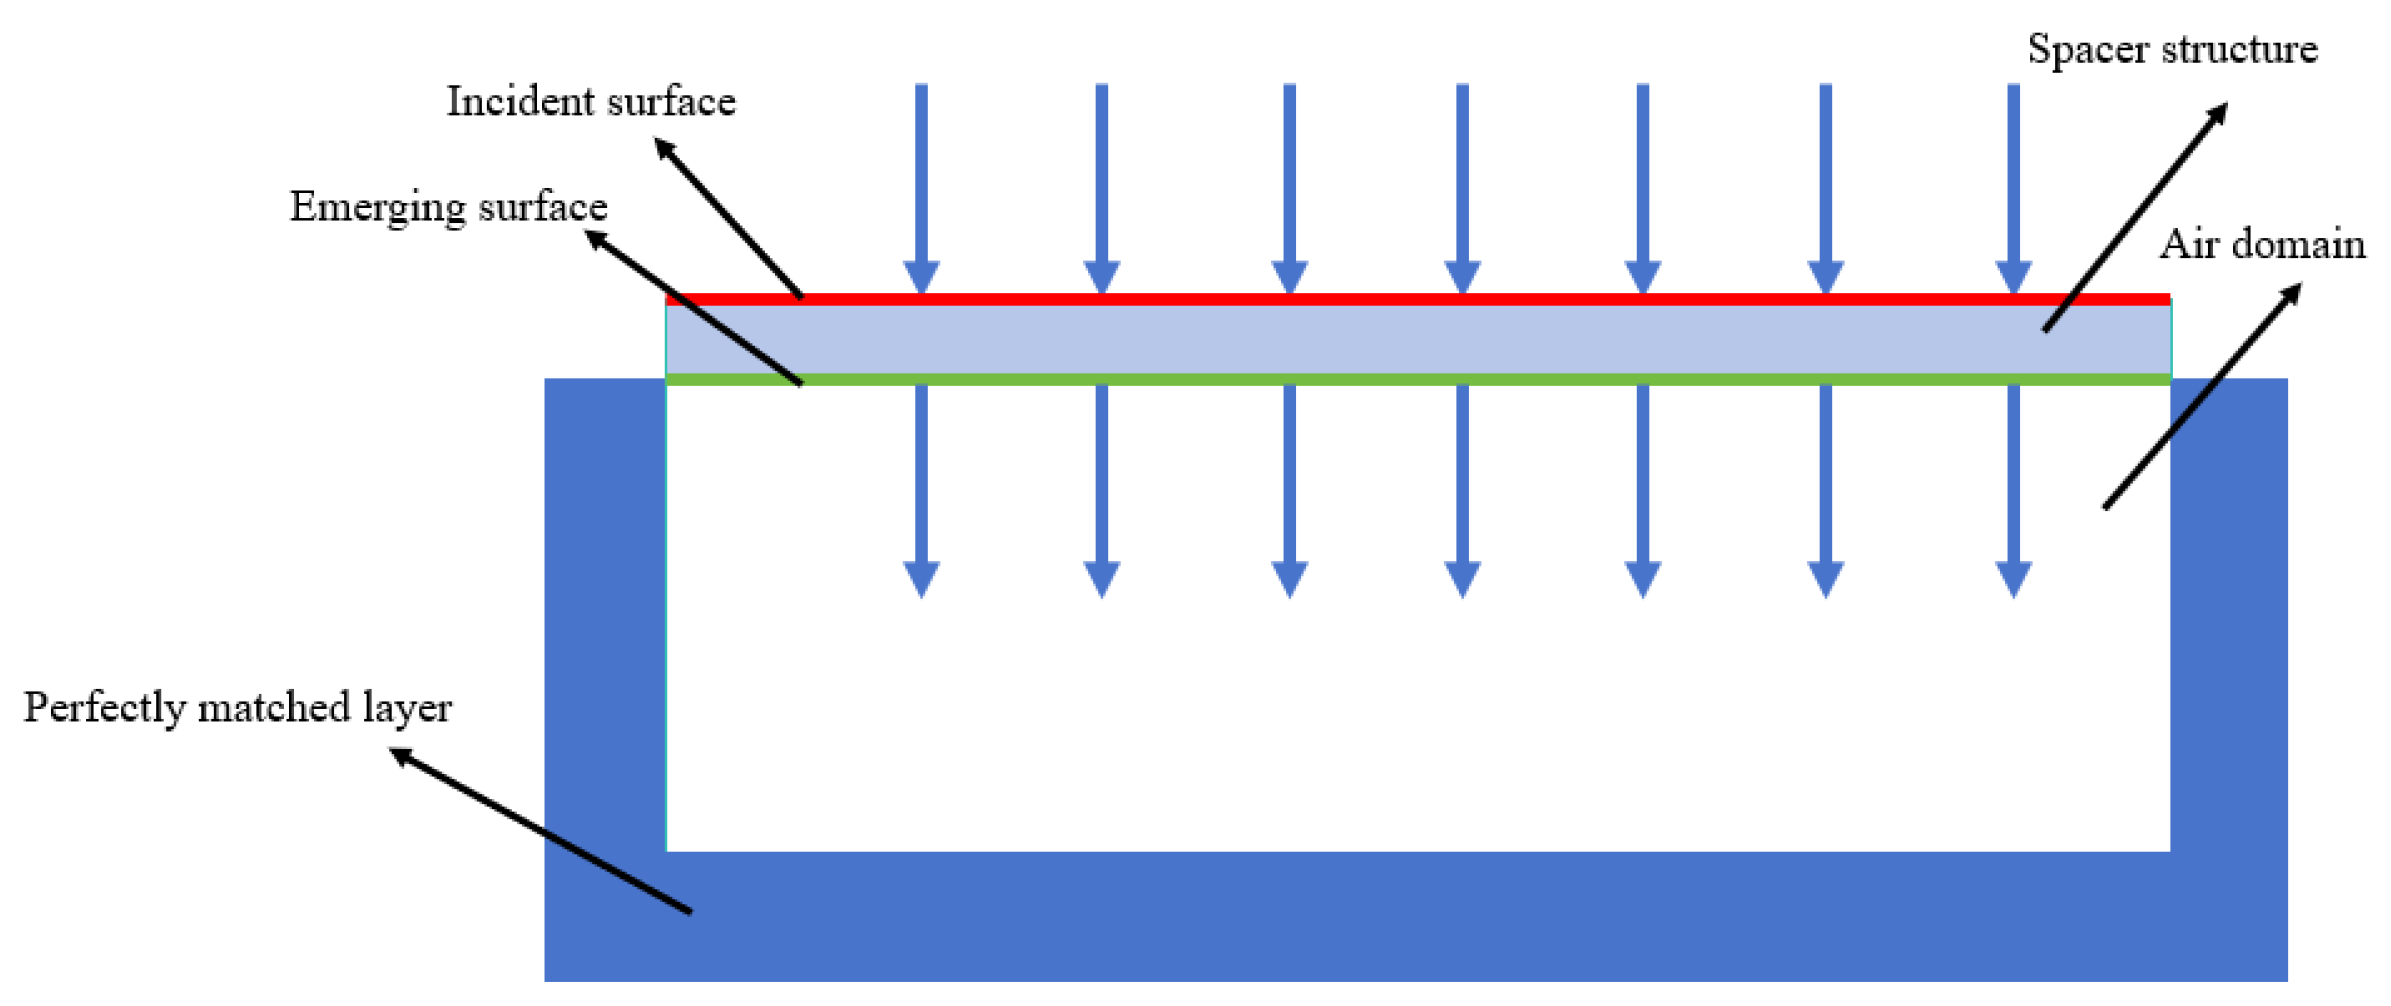
The sound insulation principle of layered structures was simulated and experimentally validated using the two-room method. The layered structure was modeled based on the arrangement of material layers, with the sound source side configured as an ideal diffuse field and the opposite side established as an anechoic chamber bounded by a Perfectly Matched Layer.
The layered structure model was established based on conventional dimensions. While multilayer solid or dense materials can be simulated using infinite-size models for sound insulation analysis, the inclusion of non-dense materials, hollow interlayers, or liquid-filled interlayers would lead to computational errors and yield unrealistically high sound insulation results. Therefore, this study exclusively employs finite-size models, and when non-dense materials are present, they must be fully encapsulated or bounded by rigid boundaries on both sides. The modeling of multi-layer partition structures follows a similar approach to that of single-layer materials, with the primary differences lying in the number of layers and dimensional variations. The configuration is illustrated in Figure 2.
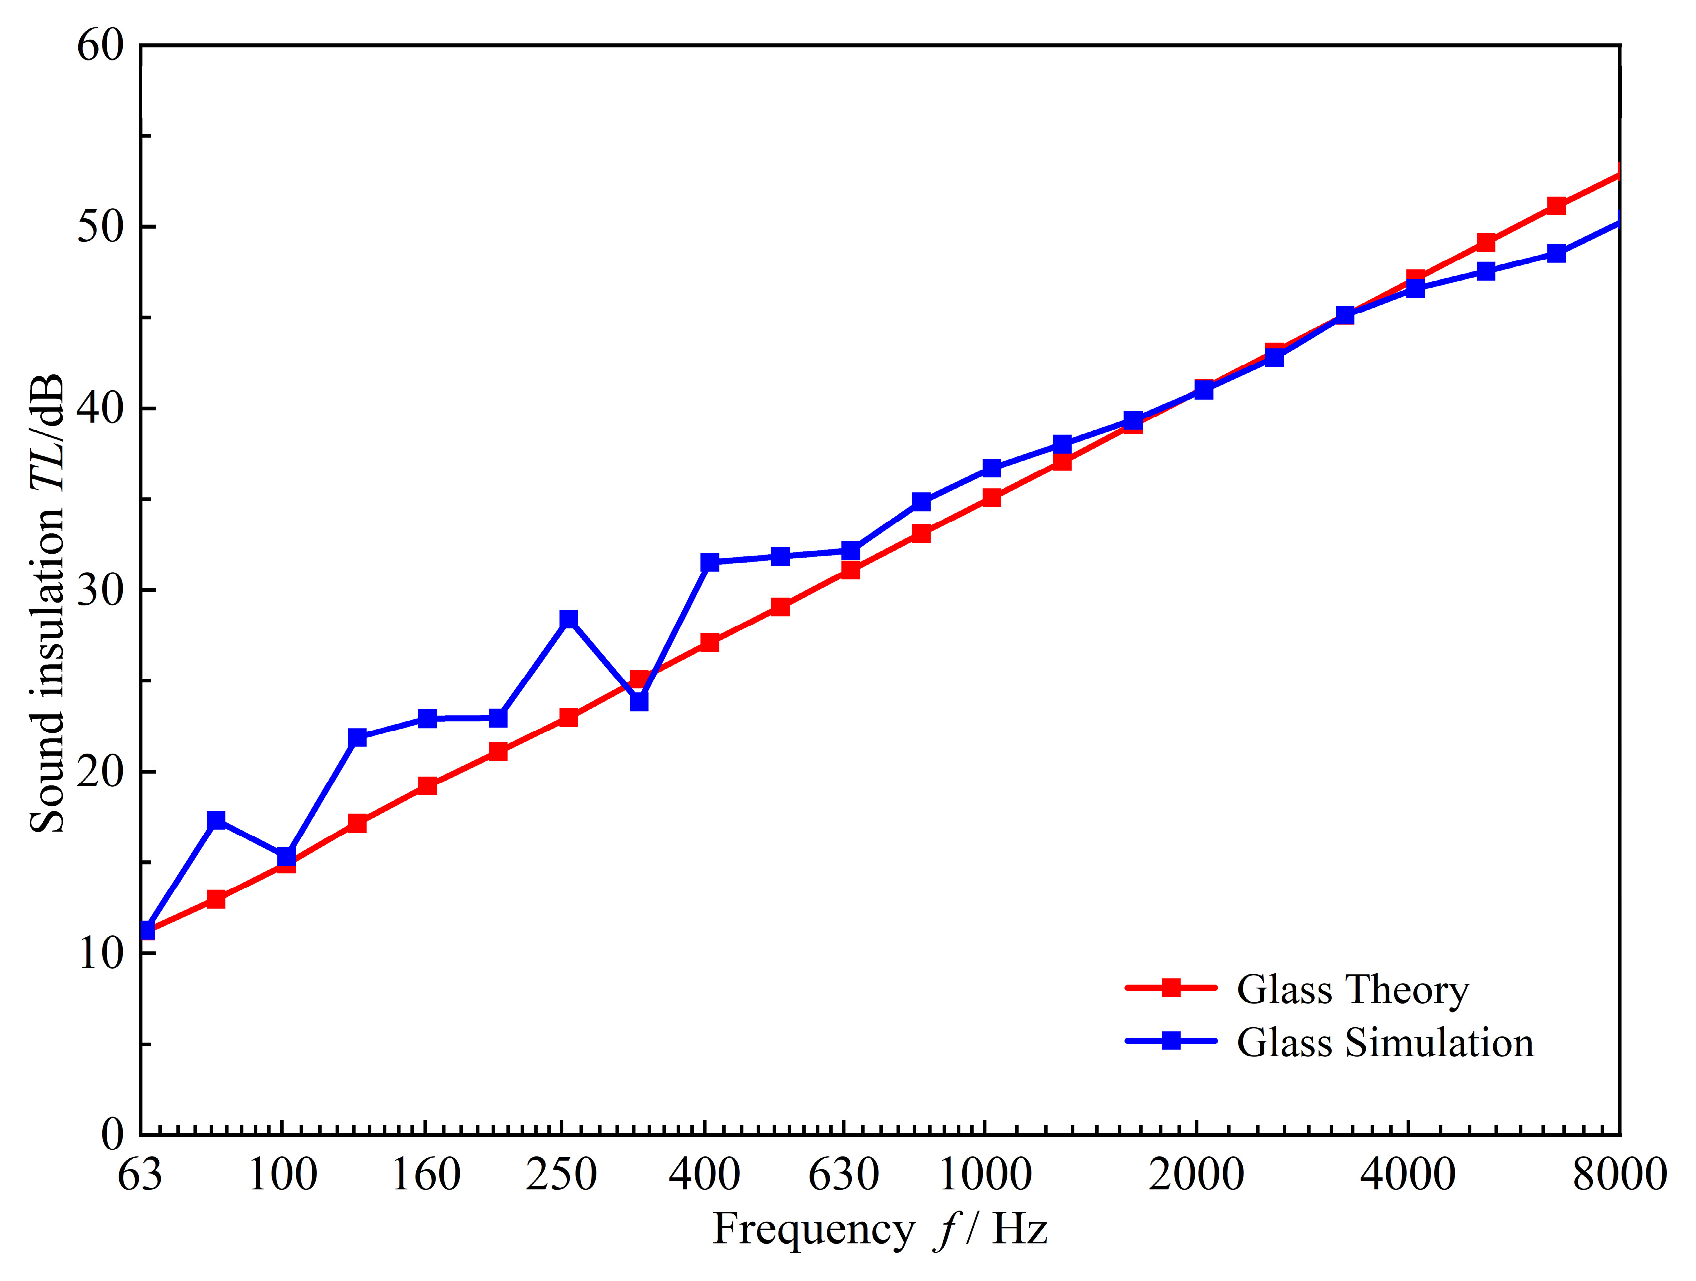
A 10 mm thick glass partition structure was established, and the reliability of the finite element model was verified by comparing numerical simulation results with theoretical calculations. The comparative results are shown in Figure 3.
The core analysis frequency band of this study is the mid-to-low frequency range of 63–1000 Hz. The research subjects are 10 mm single-layer homogeneous glass and multi-layer composite walls. The critical frequency of 10 mm single-layer glass is significantly higher than 1000 Hz, calculated to be approximately 2500 Hz, while its fundamental resonance frequency is significantly below 63 Hz, calculated to be approximately 20 Hz. Consequently, the core analysis frequency range of this study falls precisely within the applicability range of Equation (9). The use of this equation for theoretical calculations and simulation model validation is thus rigorously justified. As shown in Figure 3, the numerical simulation results for the sound insulation value of the 10 mm single-layer glass demonstrate general consistency with the theoretical calculations obtained using the mass law. The finite element simulation results exhibit an identical trend to the theoretical calculations with minor deviations in sound insulation values within the 63–1000 Hz frequency band, thus demonstrating the reliability of the finite element model and validating the effectiveness of the simulation methodology for the core research frequency range of this study.
An analysis of the sound insulation performance of layered structures was first conducted for glass doors. Starting with glass panels of varying thicknesses, the study investigated the influence patterns of thickness parameters on the sound insulation value of single-pane glass. The material parameters and structural configurations are detailed in Table 1 and Table 2.
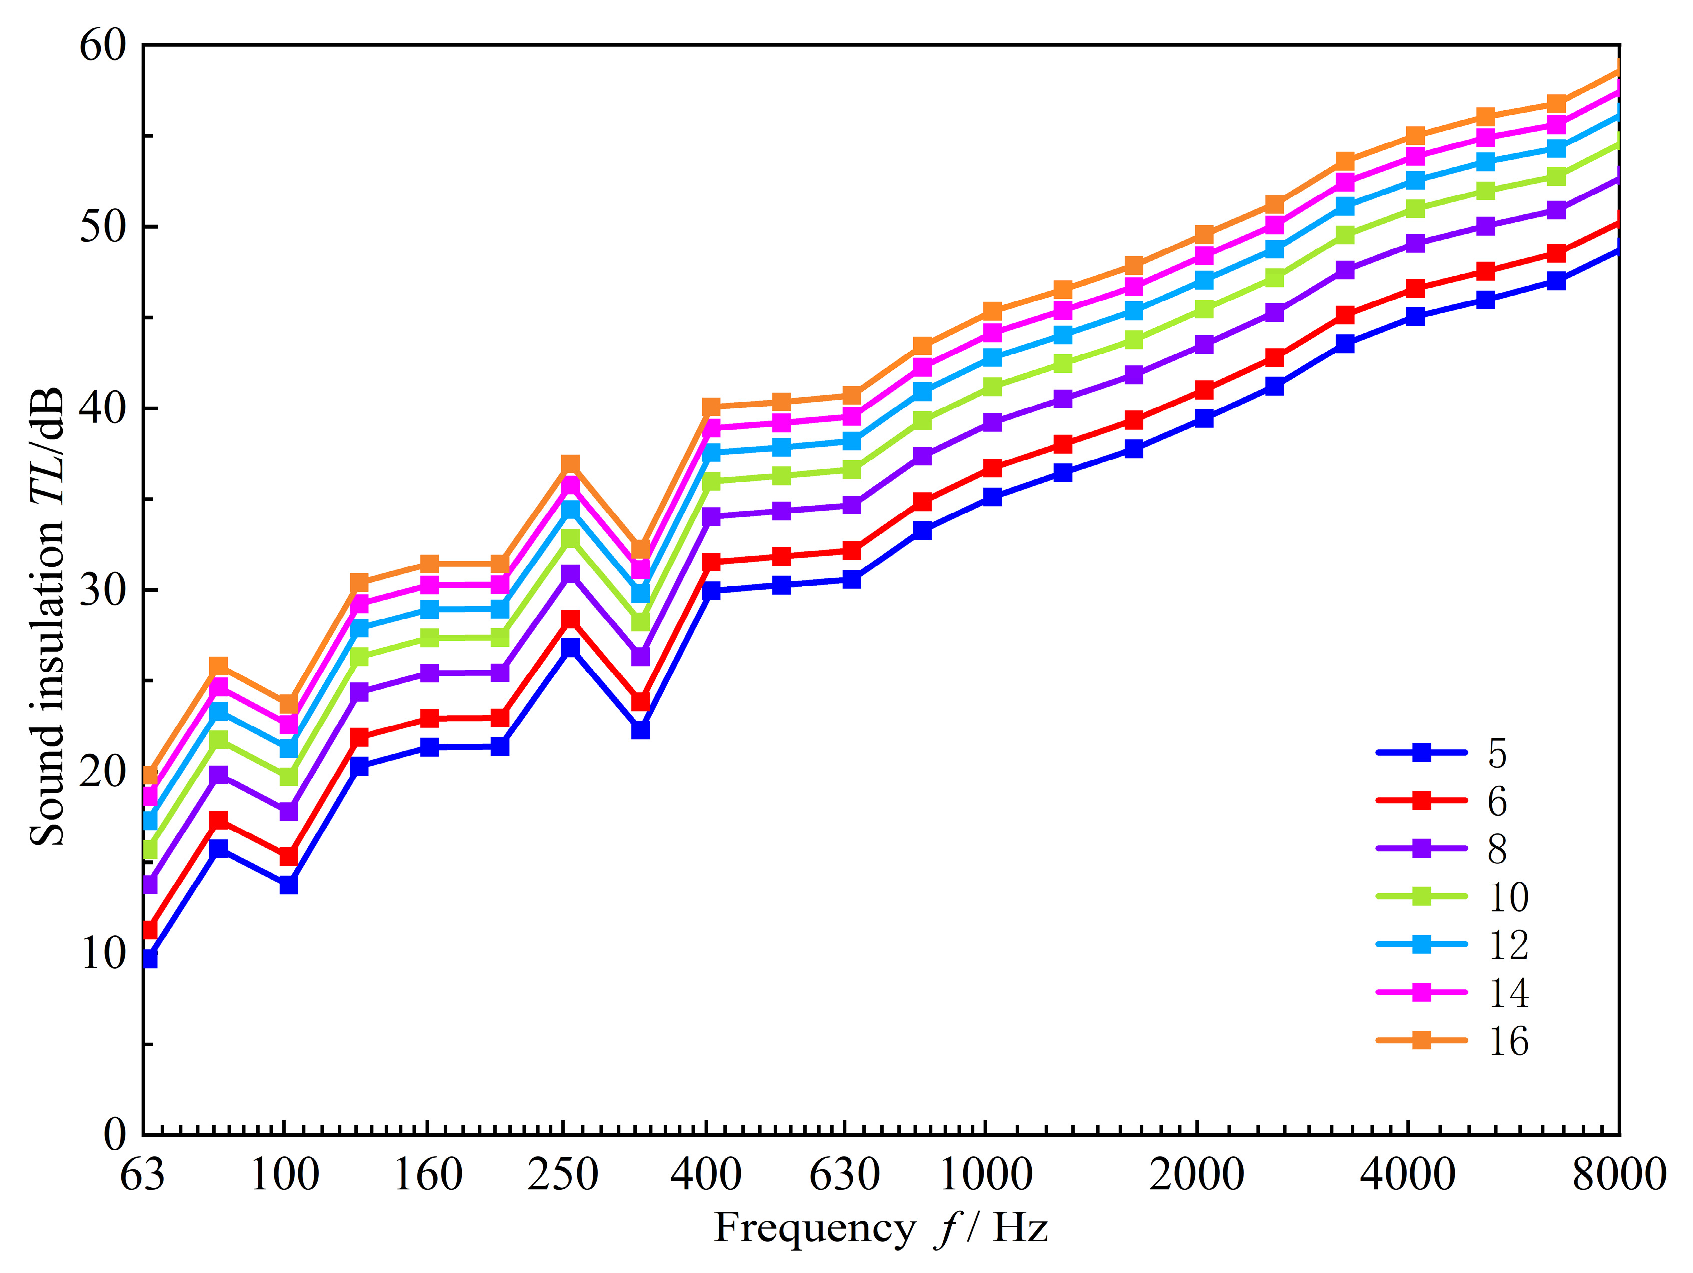
As shown in Figure 4, the comparison of simulation results for sound insulation values of glass partition structures with different thicknesses indicates that the sound insulation performance gradually improves with increasing glass thickness. Within the thickness range of 5–20 mm, the sound insulation value exhibits an average increase of approximately 0.8 dB per 1 mm increment in glass thickness.
Sound insulation performance is governed by factors such as material thickness and density. While increasing thickness generally enhances acoustic performance, practical constraints prevent the exclusive reliance on thicker glass to achieve optimal sound insulation. Therefore, alternative approaches must be explored to achieve the specified sound insulation performance within constrained thickness requirements. Consequently, the design of laminated glass is proposed to address the need for additional thickness to achieve the target sound insulation effect.
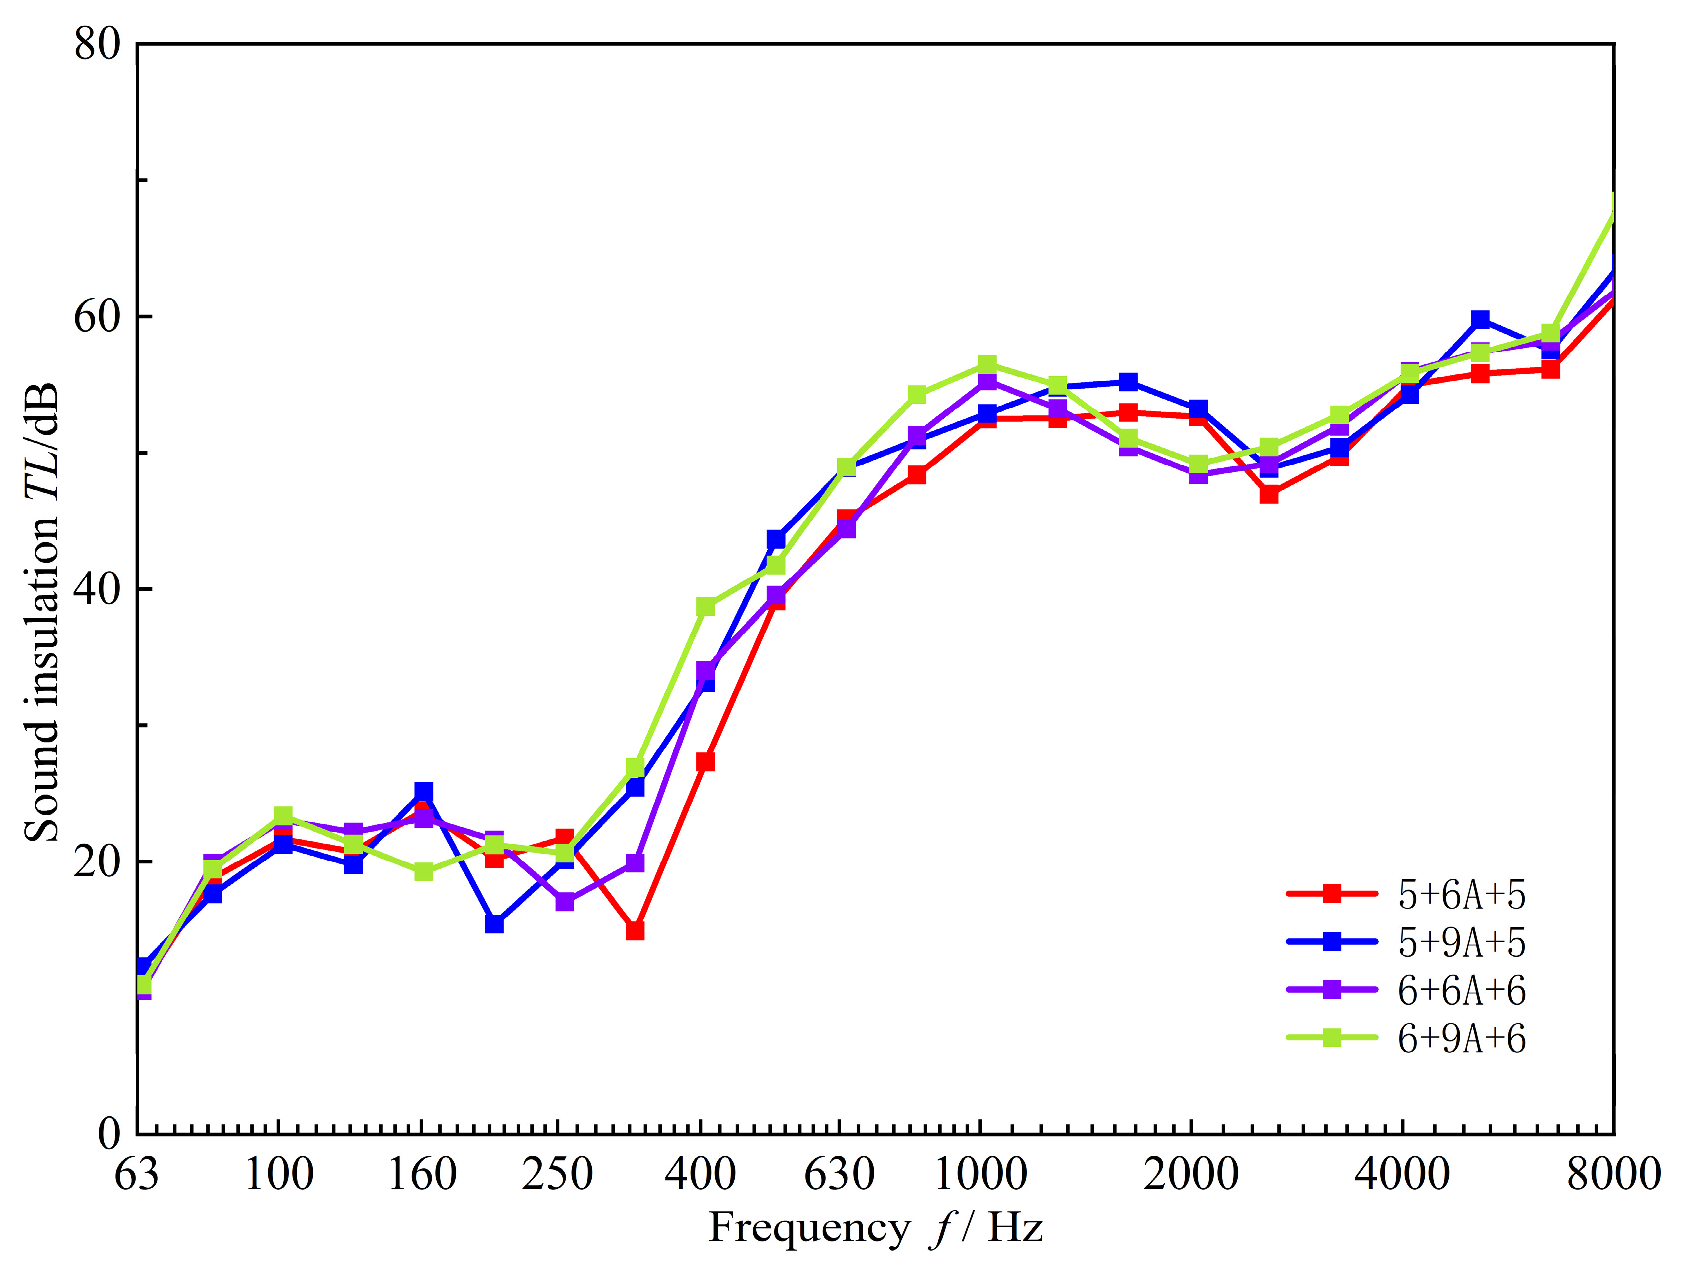
As shown in Figure 5, both the glass thickness and the air layer thickness exert certain influences on the sound insulation value; greater glass thickness results in higher sound insulation performance, while increased air layer thickness generally enhances the overall sound insulation capacity. Unlike single-pane glass, the sound insulation value of double-pane insulating glass demonstrates an overall increasing trend, though fluctuations with observable dips occur at specific frequencies, which can be attributed to structural resonance induced by the introduction of an air layer.
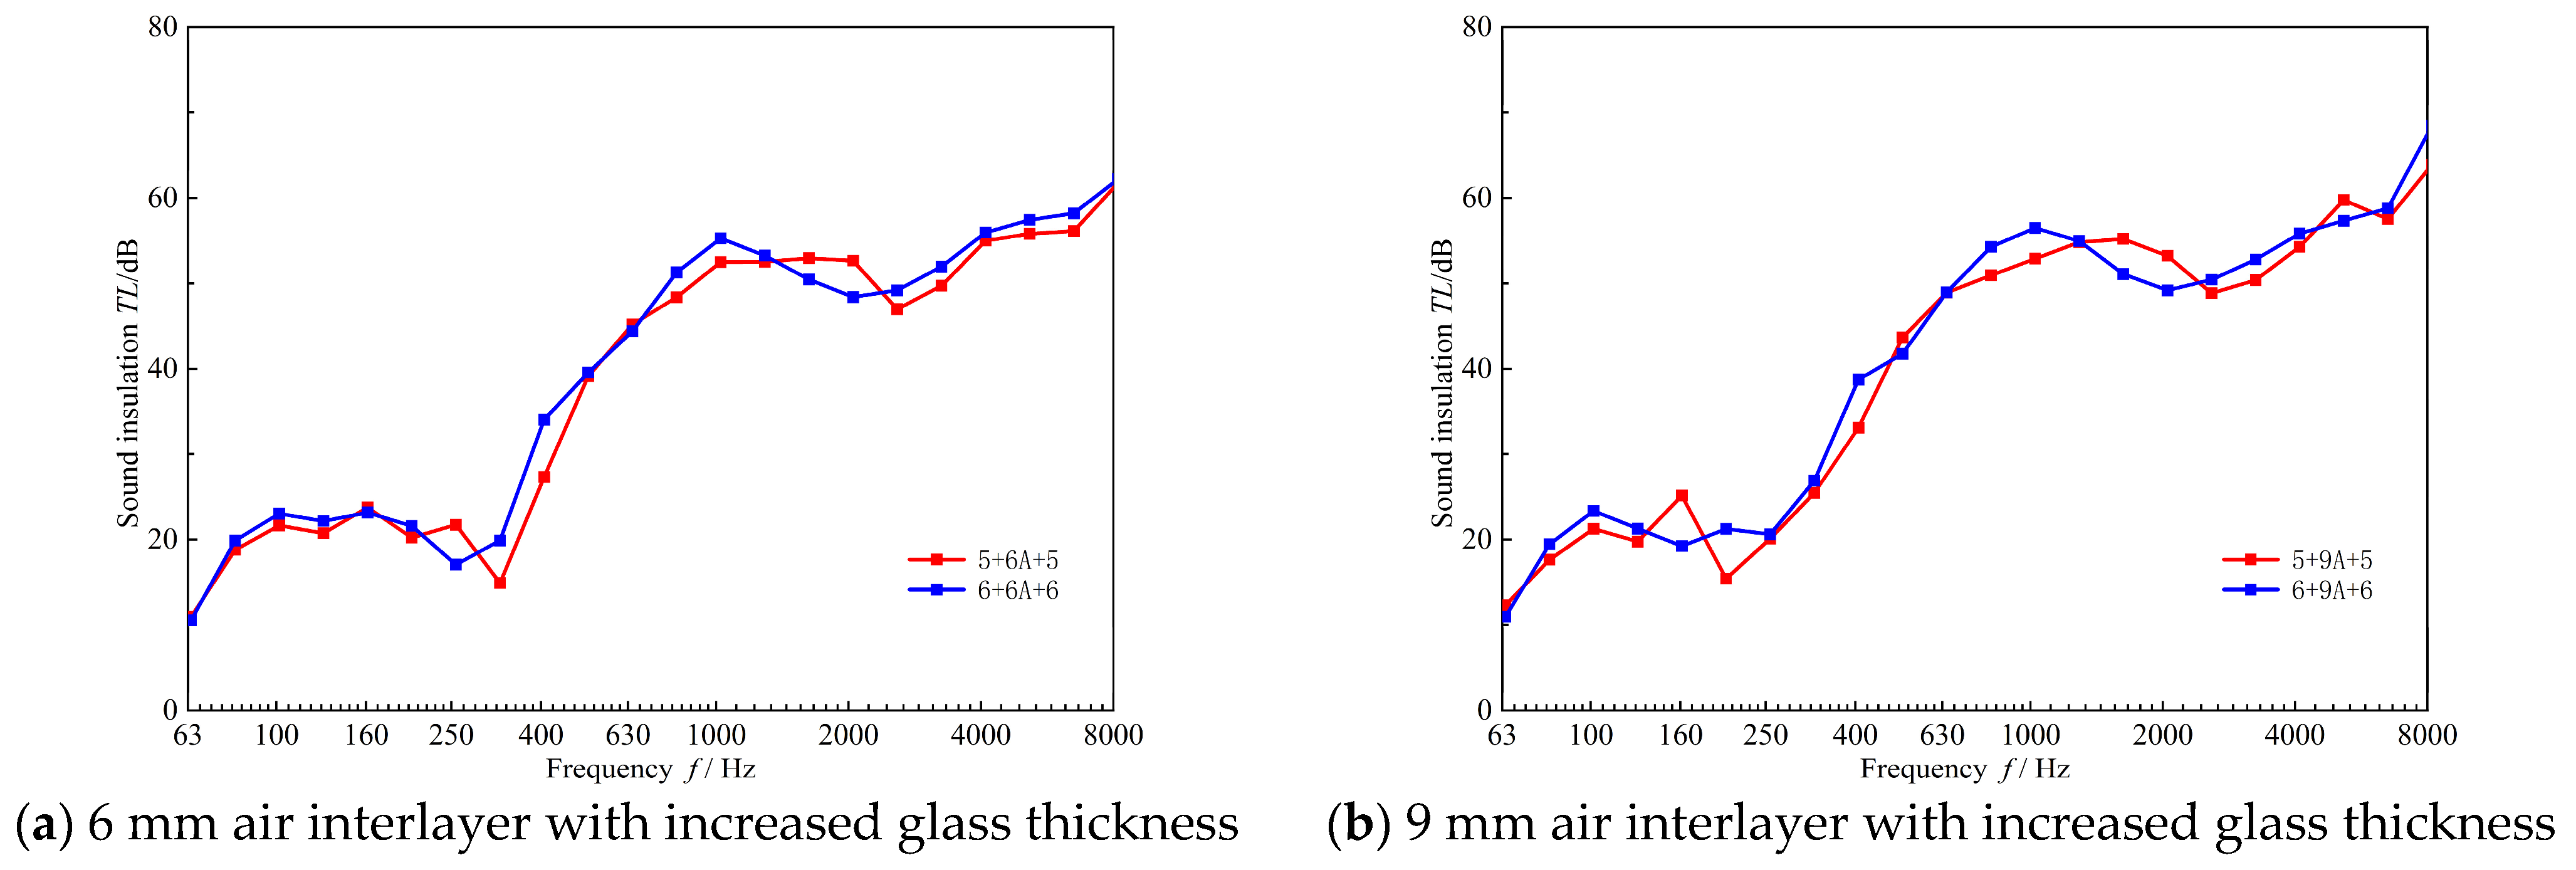
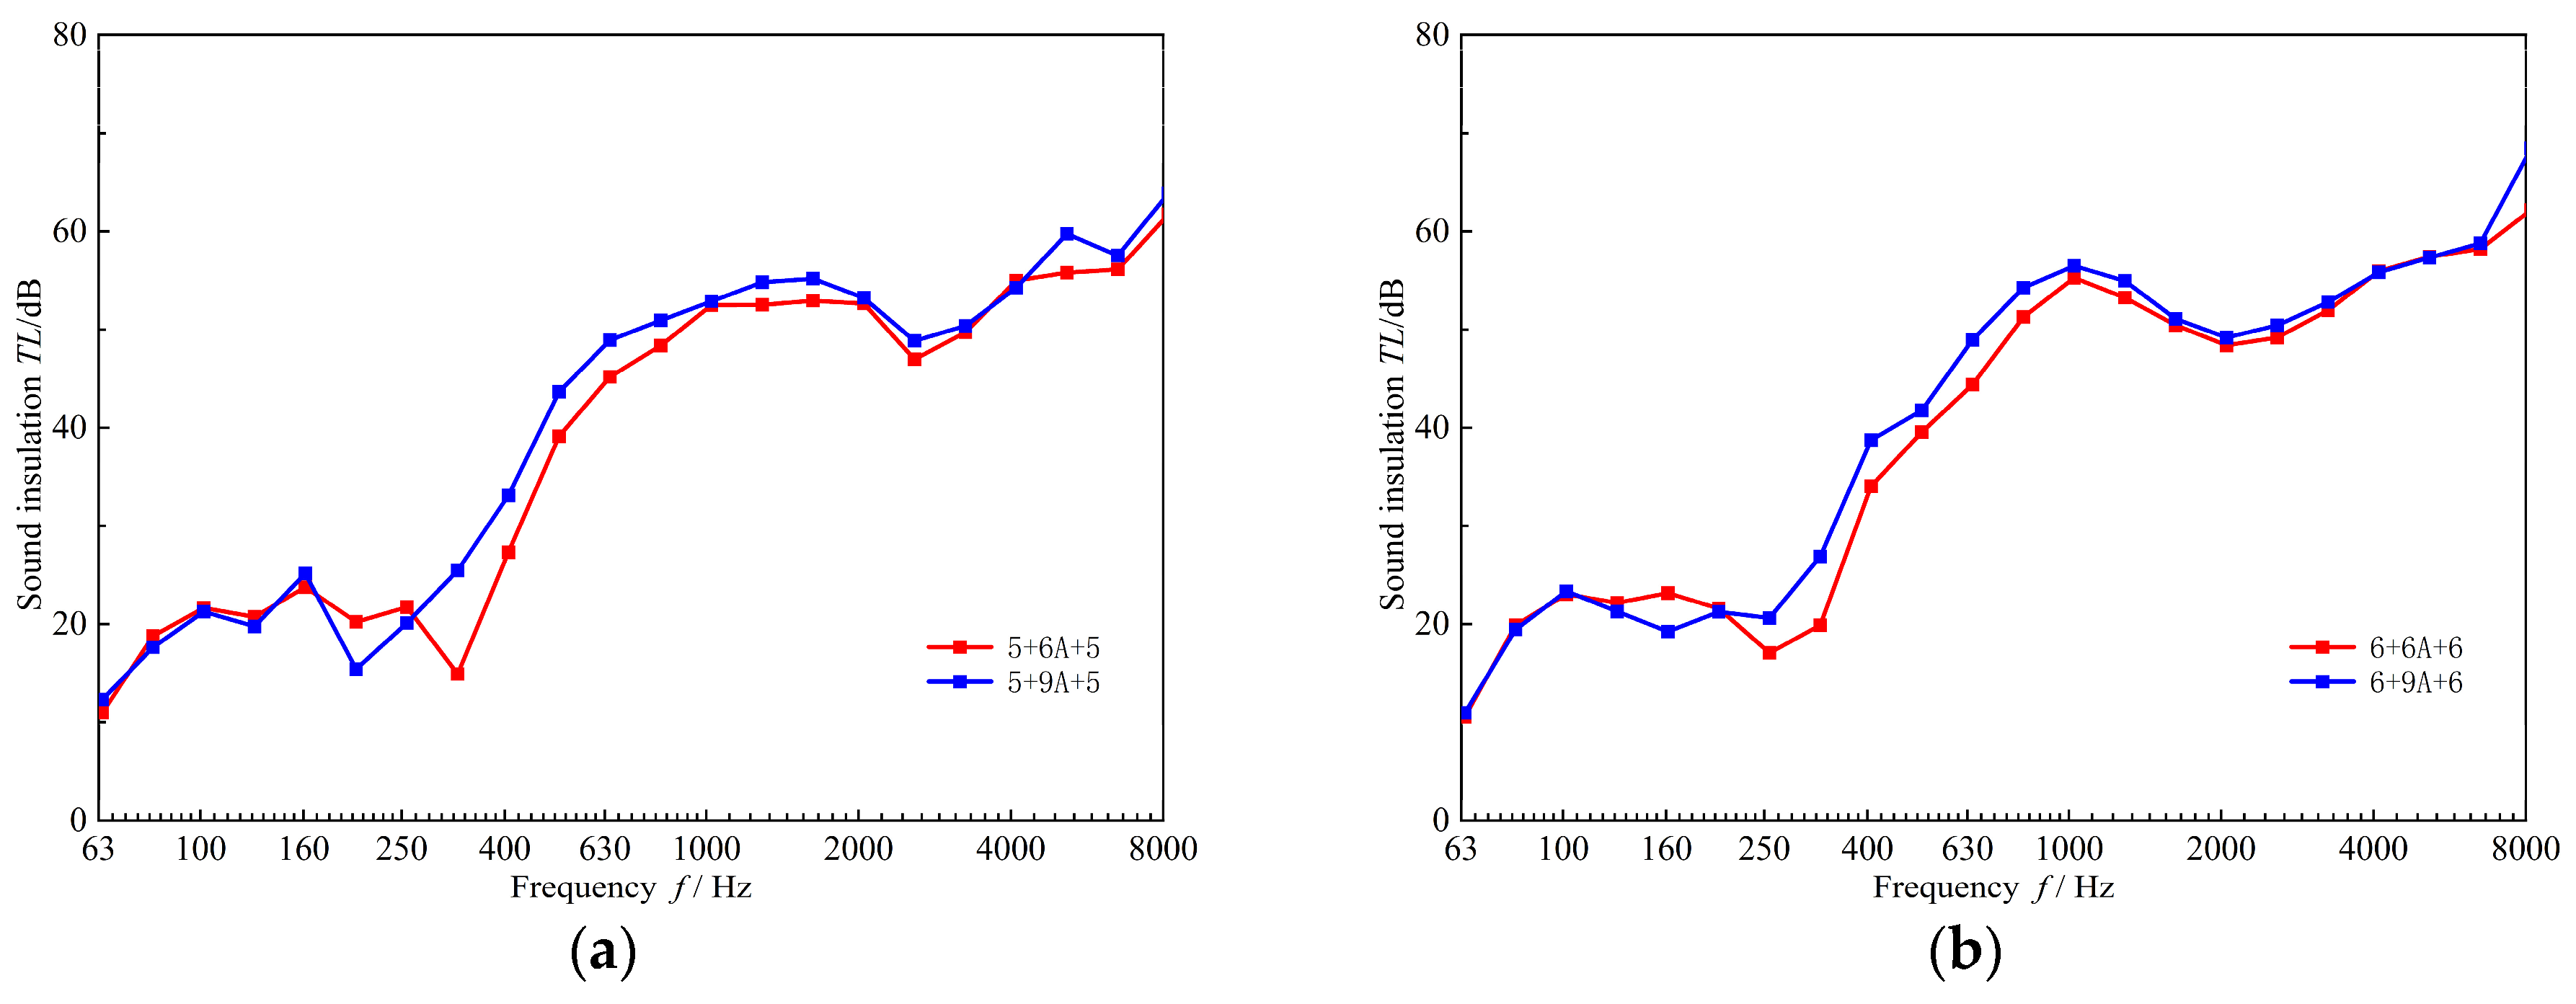
To investigate the respective effects of increasing interlayer thickness versus glass thickness on sound insulation performance, dimensional variations were subdivided into two categories: exclusively increasing glass thickness and exclusively increasing interlayer thickness. A comparative analysis of the corresponding results is presented in Figure 6 and Figure 7.
Figure 6 demonstrates that with increasing glass thickness, the sound insulation value of double-pane insulating glass generally improves, although it decreases in certain frequency bands. This variation, however, does not significantly alter the overall trend of the sound insulation curve.
As shown in Figure 7, with increasing air layer thickness, the sound insulation value of double-pane insulating glass generally improves, although it slightly decreases in the low-frequency range. Similarly, this variation does not significantly alter the overall trend of the sound insulation curve. To further reduce thickness, laminated glass with reduced thickness was selected for sound insulation performance analysis.
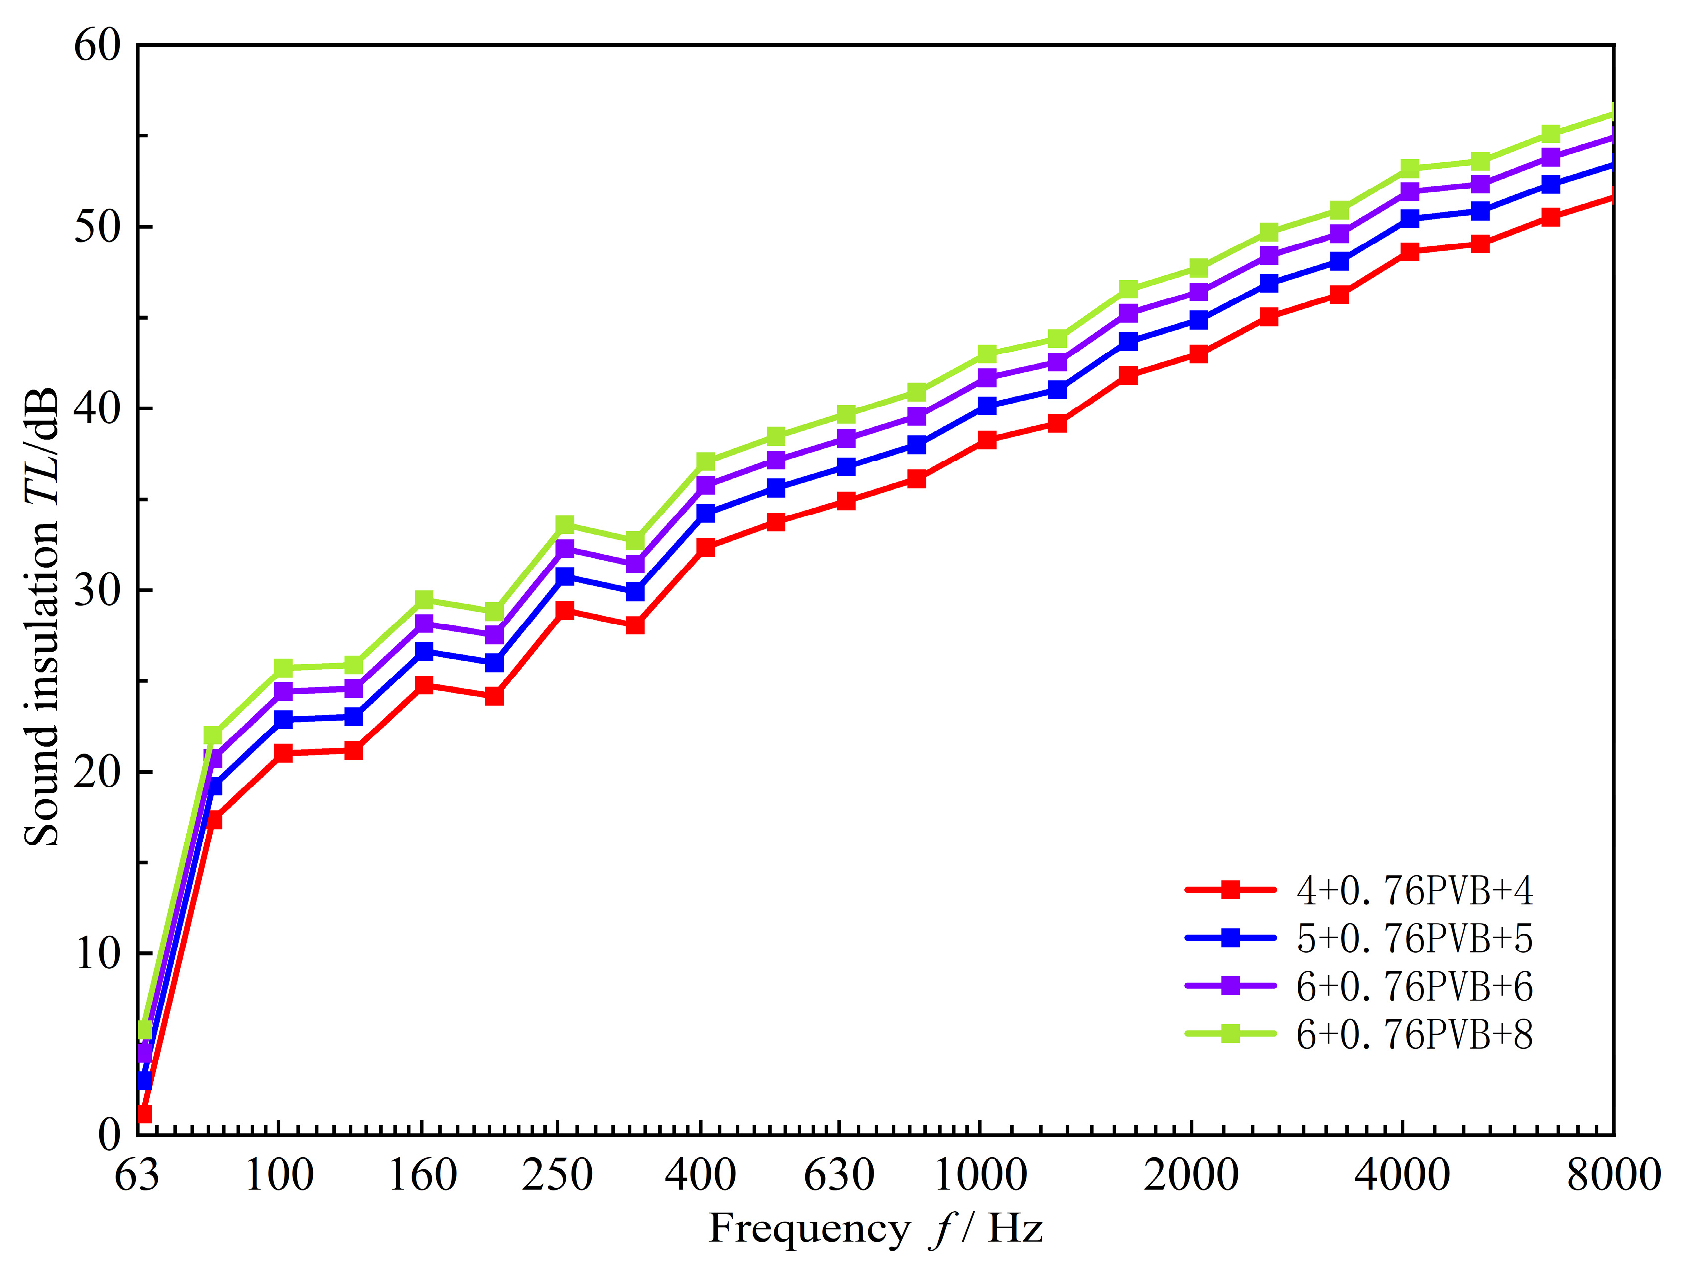
As shown in Figure 8, the sound insulation curve of double-pane laminated glass exhibits characteristics similar to that of single-pane glass, with the sound insulation value gradually increasing as the glass thickness increases. Within the thickness range of 8–14 mm, each 1 mm increase in thickness results in an average sound insulation improvement of approximately 0.8 dB.
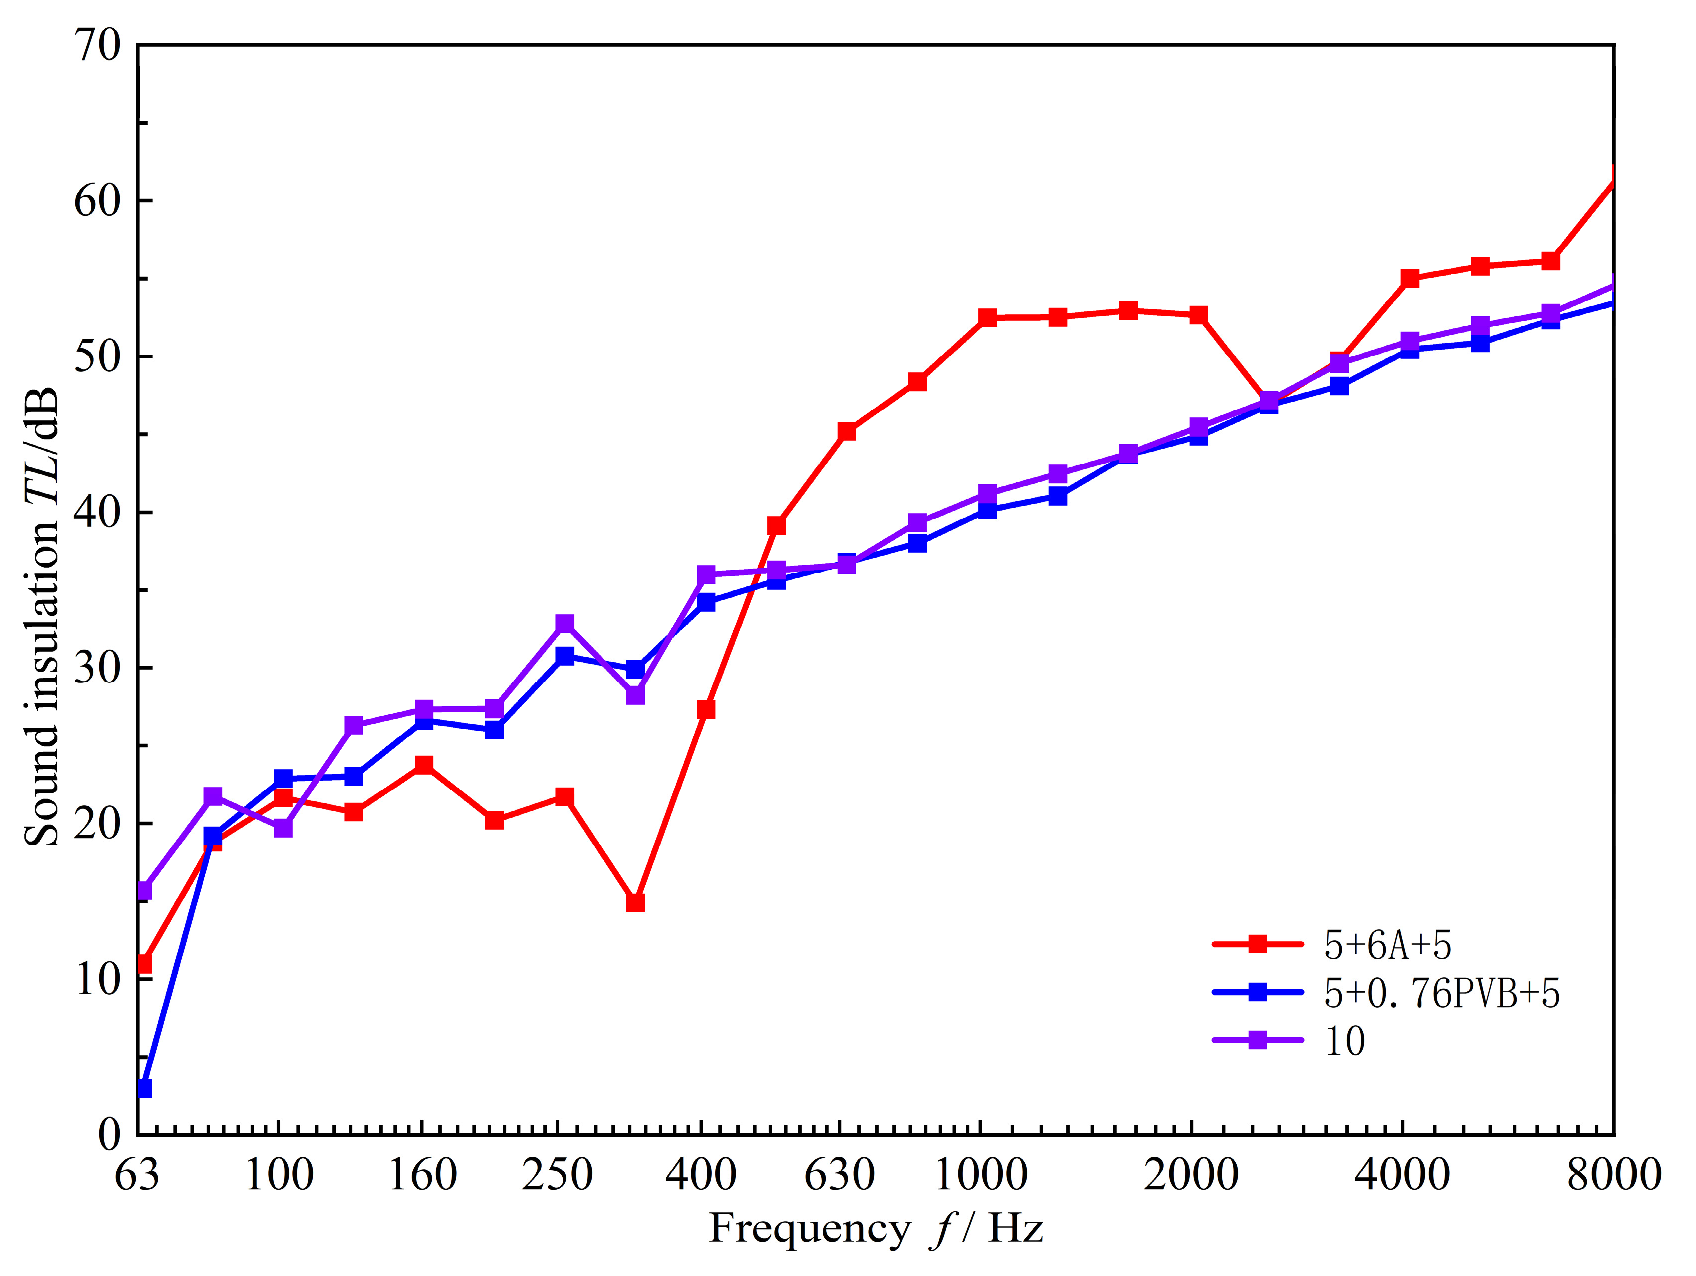
According to design requirements, the overall thickness of the glass door must be effectively controlled to align with the lightweight and compact structural design of the soundproof cabin. This prevents engineering issues such as excessive door frame load-bearing and installation compatibility caused by overly thick glass. The total thickness of homogeneous glass materials shall not exceed 10 mm. Comparison results indicate that thicker homogeneous glass provides better sound insulation performance; hence, 10 mm glass was selected for comparative analysis. As shown in Figure 9, the sound insulation spectra of single-pane glass and double-pane laminated glass are essentially identical, while double-pane insulating glass exhibits superior sound insulation performance above 500 Hz but demonstrates inferior acoustic attenuation in the frequency range of 100 Hz to 500 Hz. The simulation patterns of sound insulation performance for different glass thicknesses shown in Figure 4 and the comparative configuration diagram of 10 mm core thickness glass in Figure 9 both provide clear research directions for subsequent experimental verification of glass specimens. The relationship between thickness and sound insulation performance derived from the simulation in Figure 4 applies to the 63–1000 Hz frequency range. Combining this with the conclusion from Figure 9 that 10 mm single-pane glass represents the optimal solution, corresponding glass samples underwent actual sound insulation performance measurements using the double-chamber method. The experimental results ultimately served as the basis for determining the optimal glass configuration.

3.2. Sound Insulation Performance of Wall Layered Structures

The evaluation of sound insulation performance in wall layered structures requires consideration of multiple factors, including the physical properties of materials, stacking sequence of layers, and dimensional parameters of the partitions. Structural modifications and recombination of existing composite panel configurations were carried out to develop composite panels with superior sound insulation performance. The composite panels are formed through the superposition and combination of materials, with the relevant material parameters provided in Table 3 and the designed structural configuration parameters listed in Table 4.
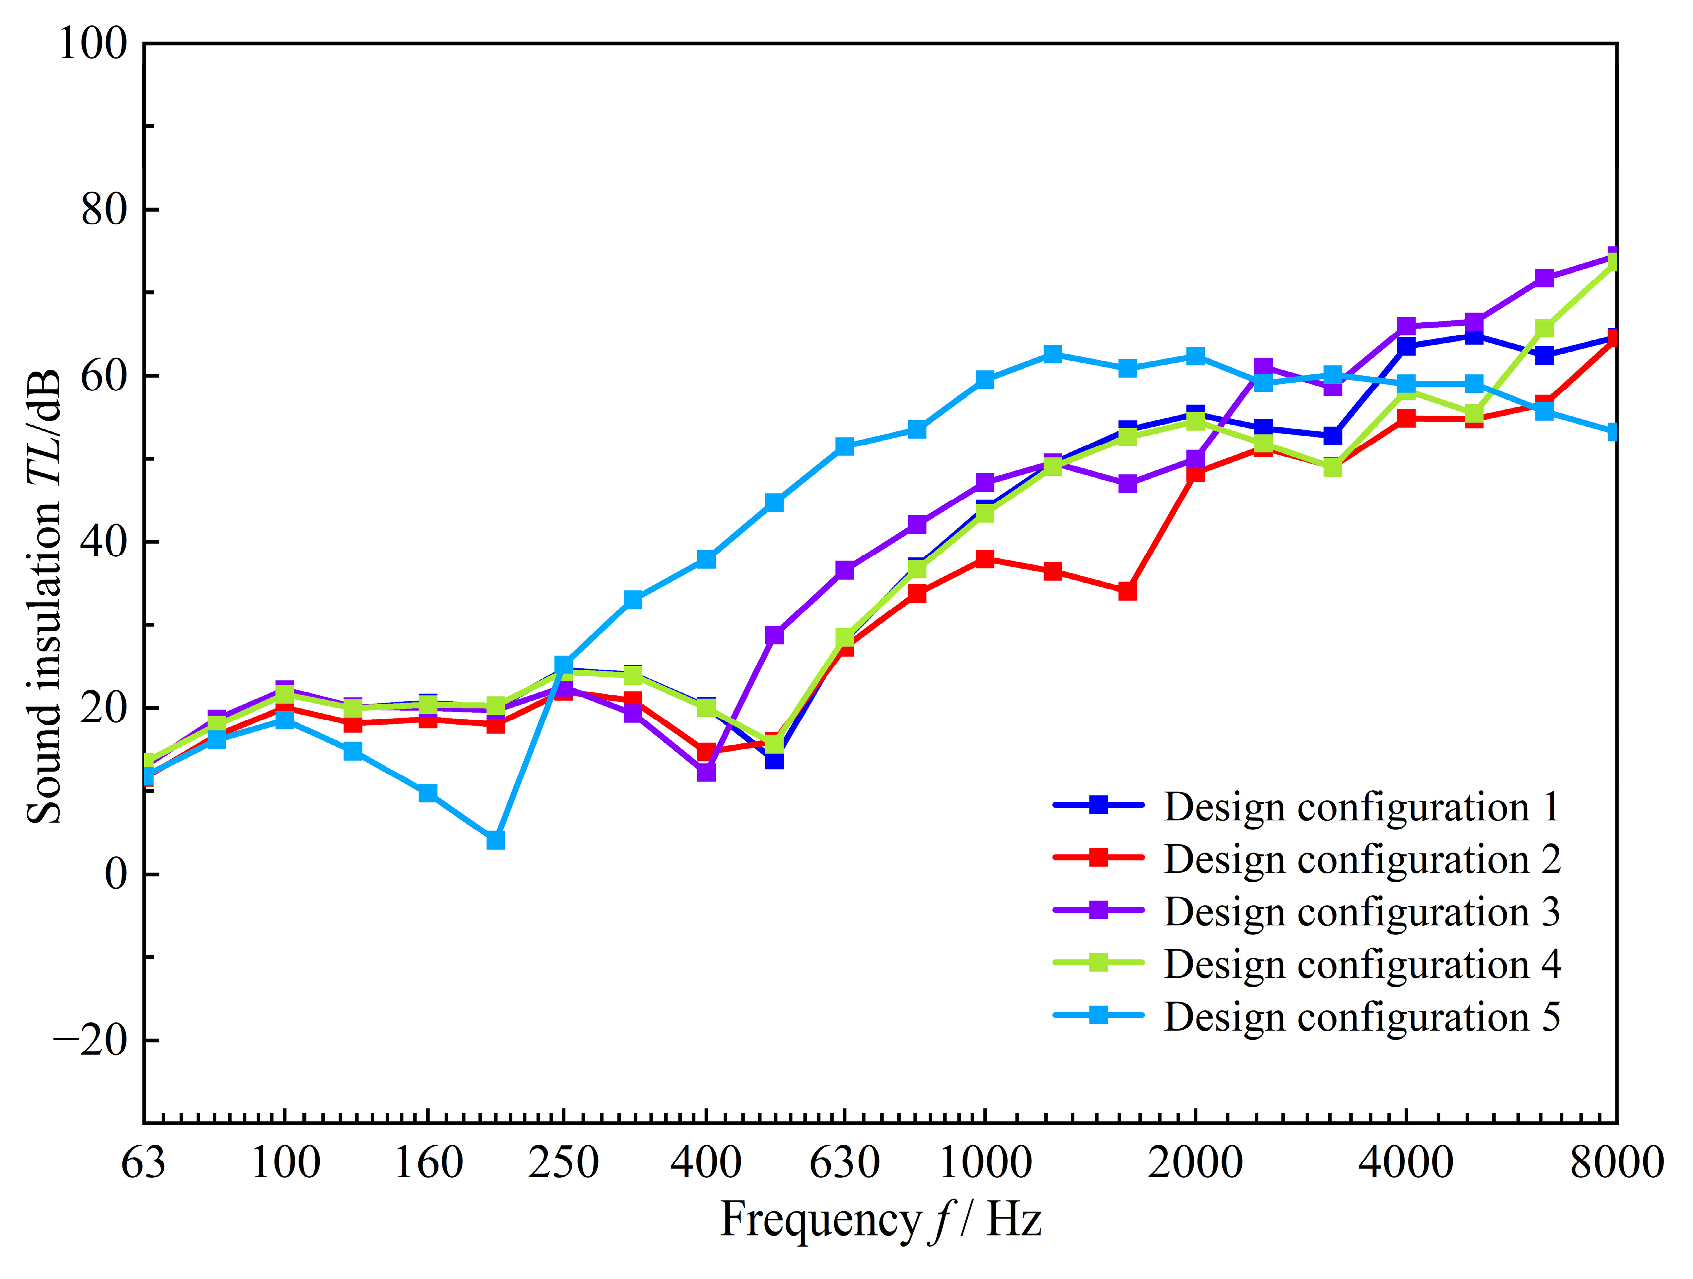
To develop sound-insulating wall structures with enhanced acoustic performance and reduced thickness, five composite panel configurations were designed. The structural parameters of these composite panels are detailed in Table 4, with comparative results presented in Figure 10.
As shown in the comparison results of Figure 10, the performance variations across different configurations within the 250 Hz–2000 Hz frequency band reflect the resonance effects of the multi-layer composite wall. Simulation results are reliable within the 250–1000 Hz range, while results above 1000 Hz are intended solely for trend analysis. In this study, the resonance frequencies of each homogeneous substrate in the wall structure are significantly higher than 2000 Hz. When multiple layers of heterogeneous materials are stacked, the stiffness, acoustic impedance, and vibration characteristics of each layer couple together, inducing localized micro-scale resonance effects. This results in a weak resonance valley with a broad frequency range and low amplitude, manifesting as a slowdown in the increase in sound insulation performance. It can be observed that Design Configuration 5 exhibits relatively poor sound insulation performance in the low-frequency range, while demonstrating more prominent performance in the mid-to-high frequency range. In contrast, Design Configurations 1, 3, and 4 display relatively balanced sound insulation characteristics, with effective performance in the low-frequency range, though their performance in the 250 Hz to 2000 Hz frequency band is inferior to that of Design Configuration 5. Design Configuration 2 performs somewhat more poorly compared to the other three configurations. However, since the required sound insulation frequency range for the silent cabin primarily lies in the low-frequency region, Design Configurations 1, 3, and 4 are identified as the suitable combinations for the sound-insulating walls. Design Configurations 3 demonstrates superior performance in the mid-to-low frequency range of 63–1000 Hz. Based on design requirements and comparative analysis of simulation results within the 250–1000 Hz frequency band against other solutions, Design Proposal 3 has been preliminarily identified as the optimal solution. The final conclusion will be validated through subsequent experimental testing.

3.3. Experimental Study on Sound Insulation Performance of Wall Layered Structures

In this study, the insertion loss method is not employed to determine the sound insulation values of individual building components such as glass doors or walls. The values for these components are measured using the double-room method. The wall experiments employed the reverberation room-hemi-anechoic chamber two-room method, with testing conducted according to the ISO 10140-1 standard [24] for result calculation. Prior to testing, the reverberation time method is used to determine the sound absorption coefficient α of the receiving room. The total sound-absorbing area is calculated using the following formula:
S a = α S
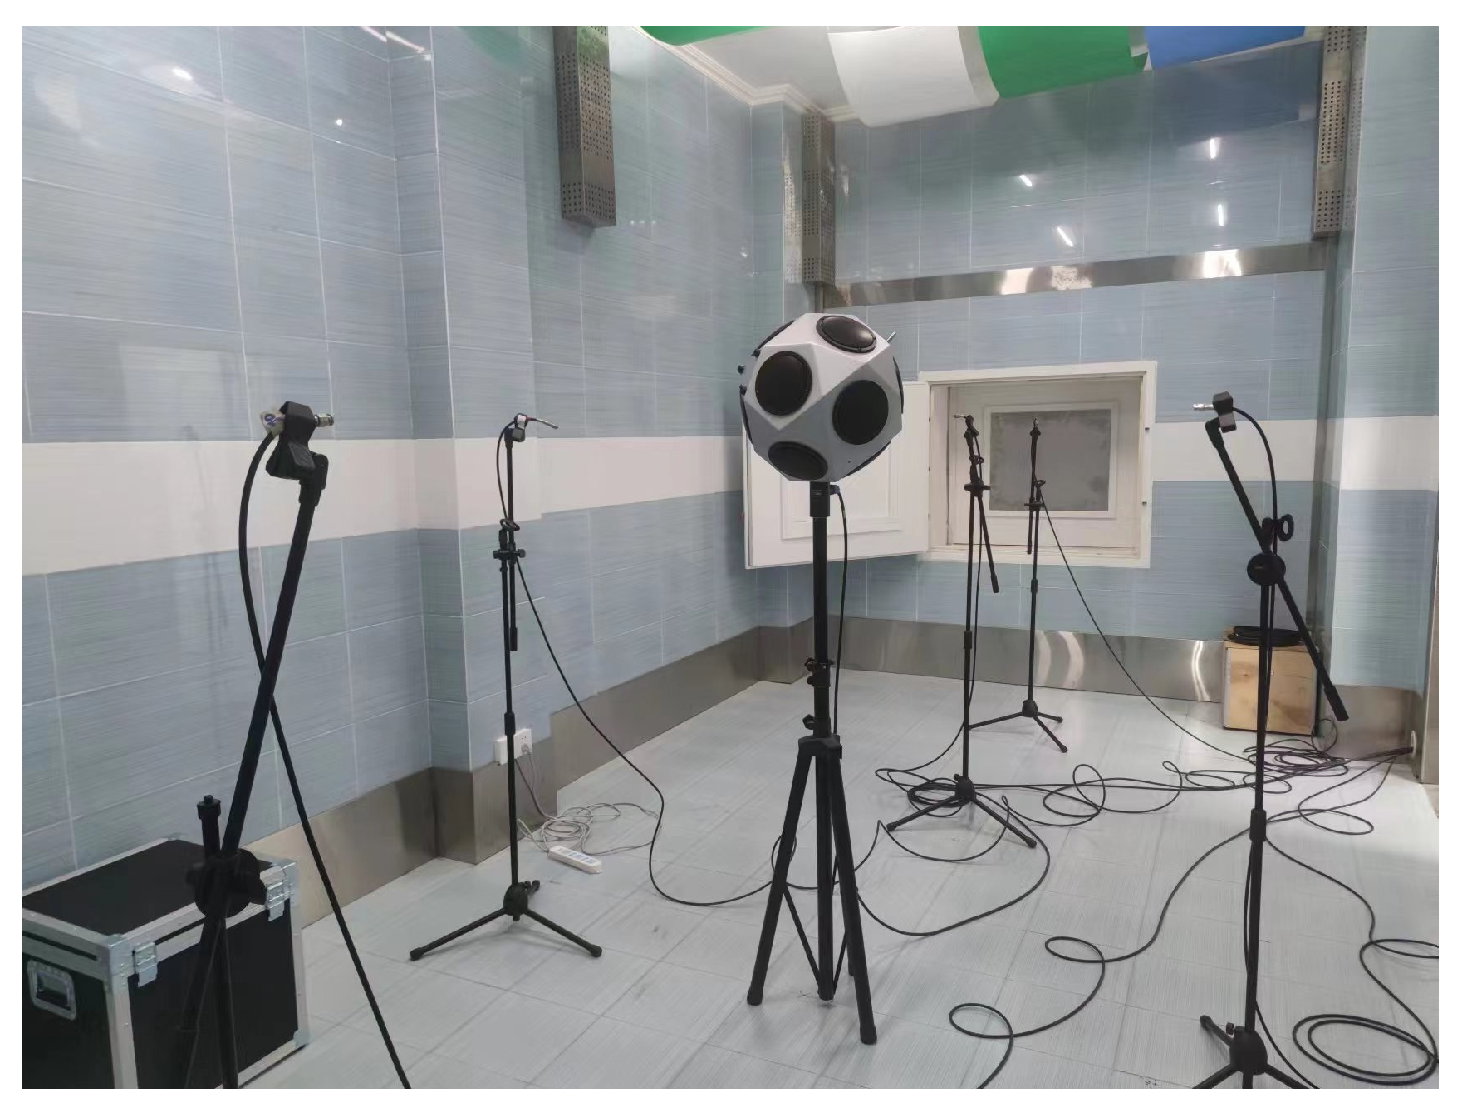
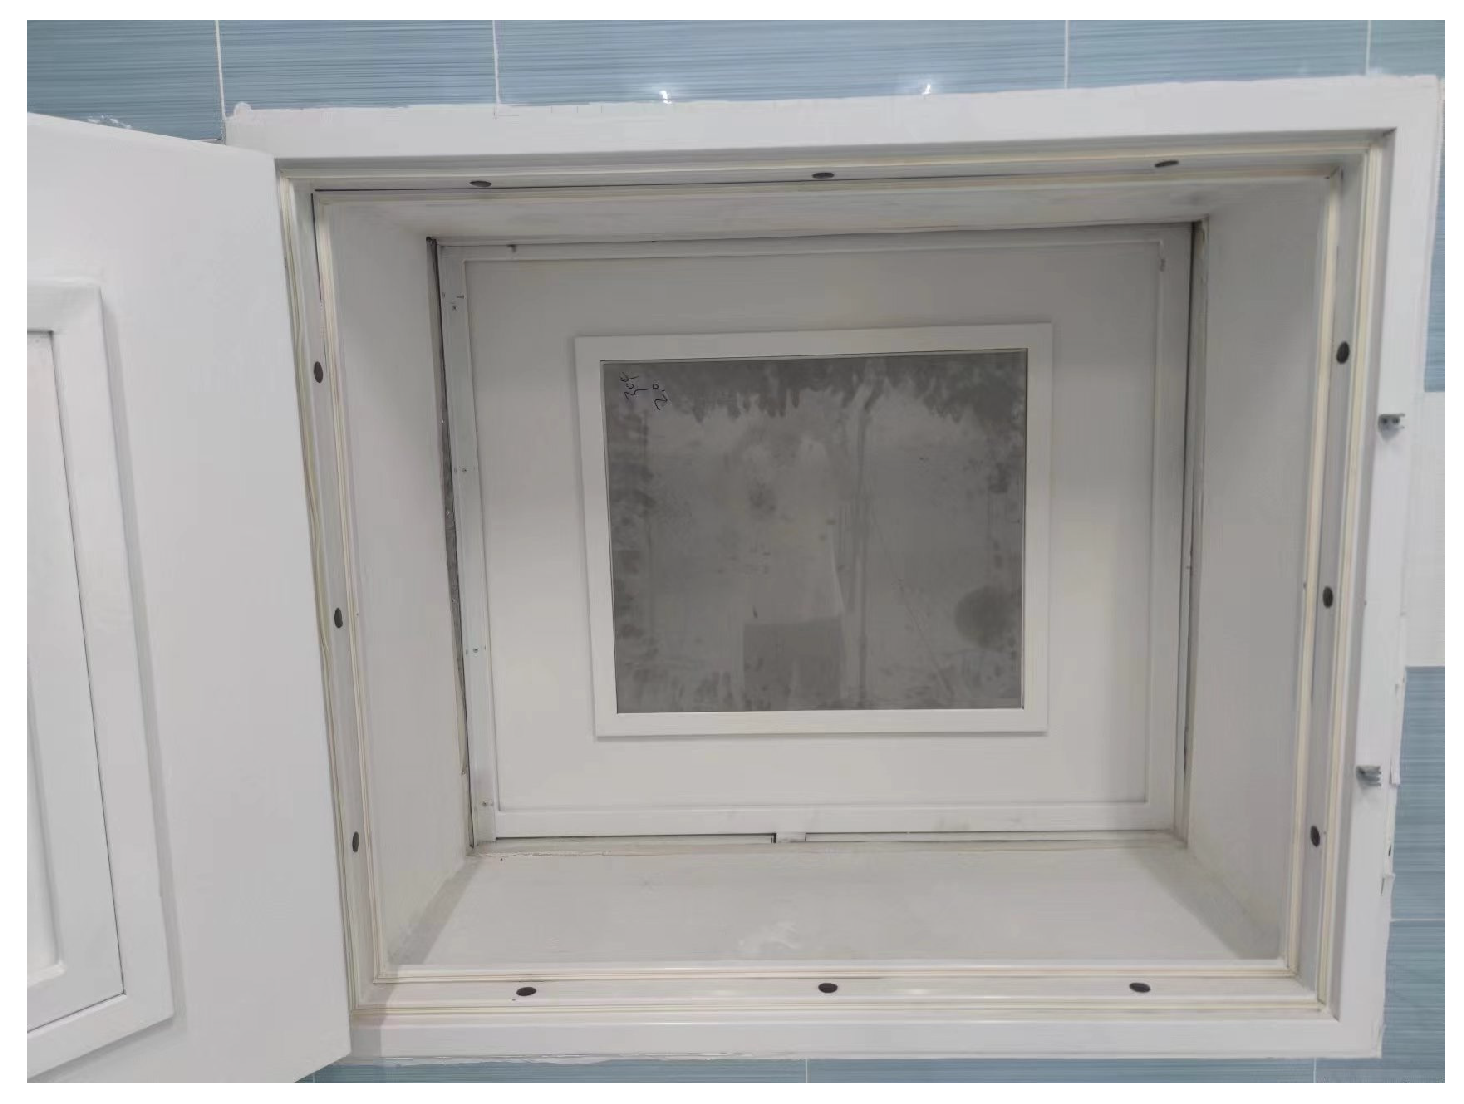
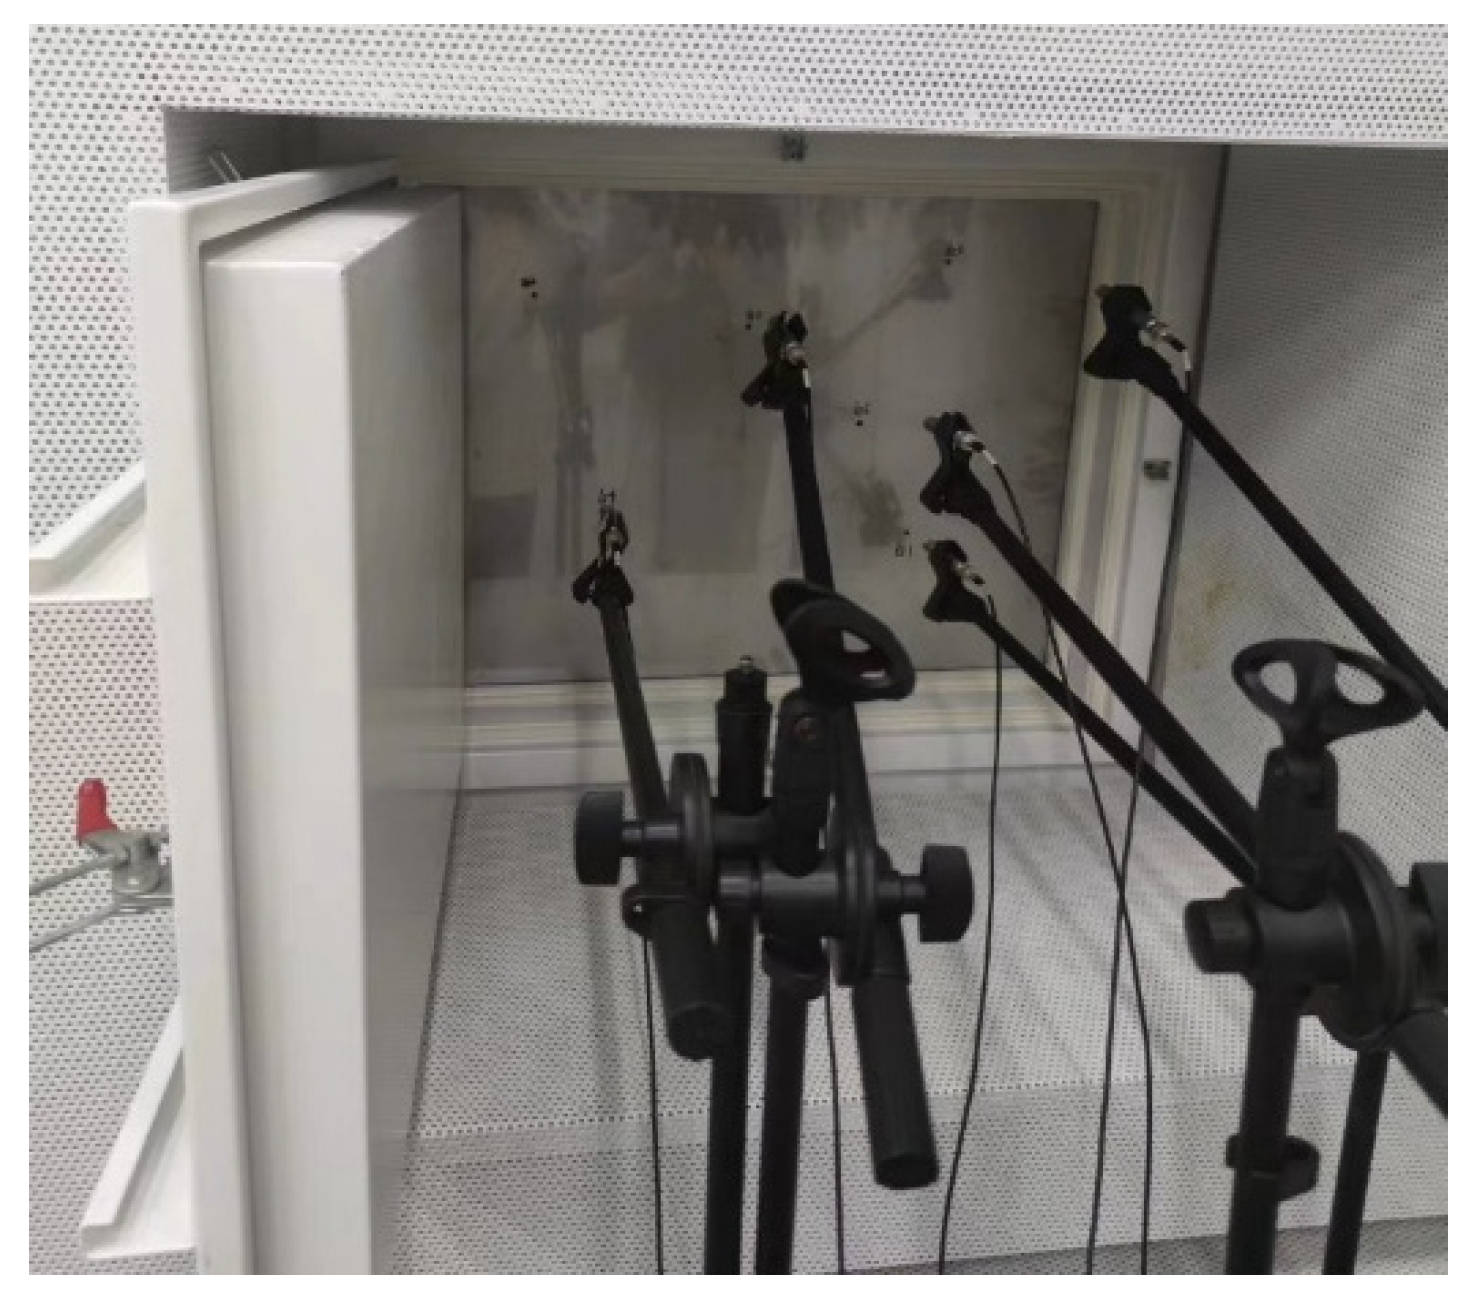
where S a represents the total sound-absorbing area of the receiving room, and S denotes the total internal surface area of the receiving room. The measurement frequency must align with the 1/3-octave band frequency range used in the sound insulation test. The experimental setup is illustrated in Figure 11, Figure 12 and Figure 13.
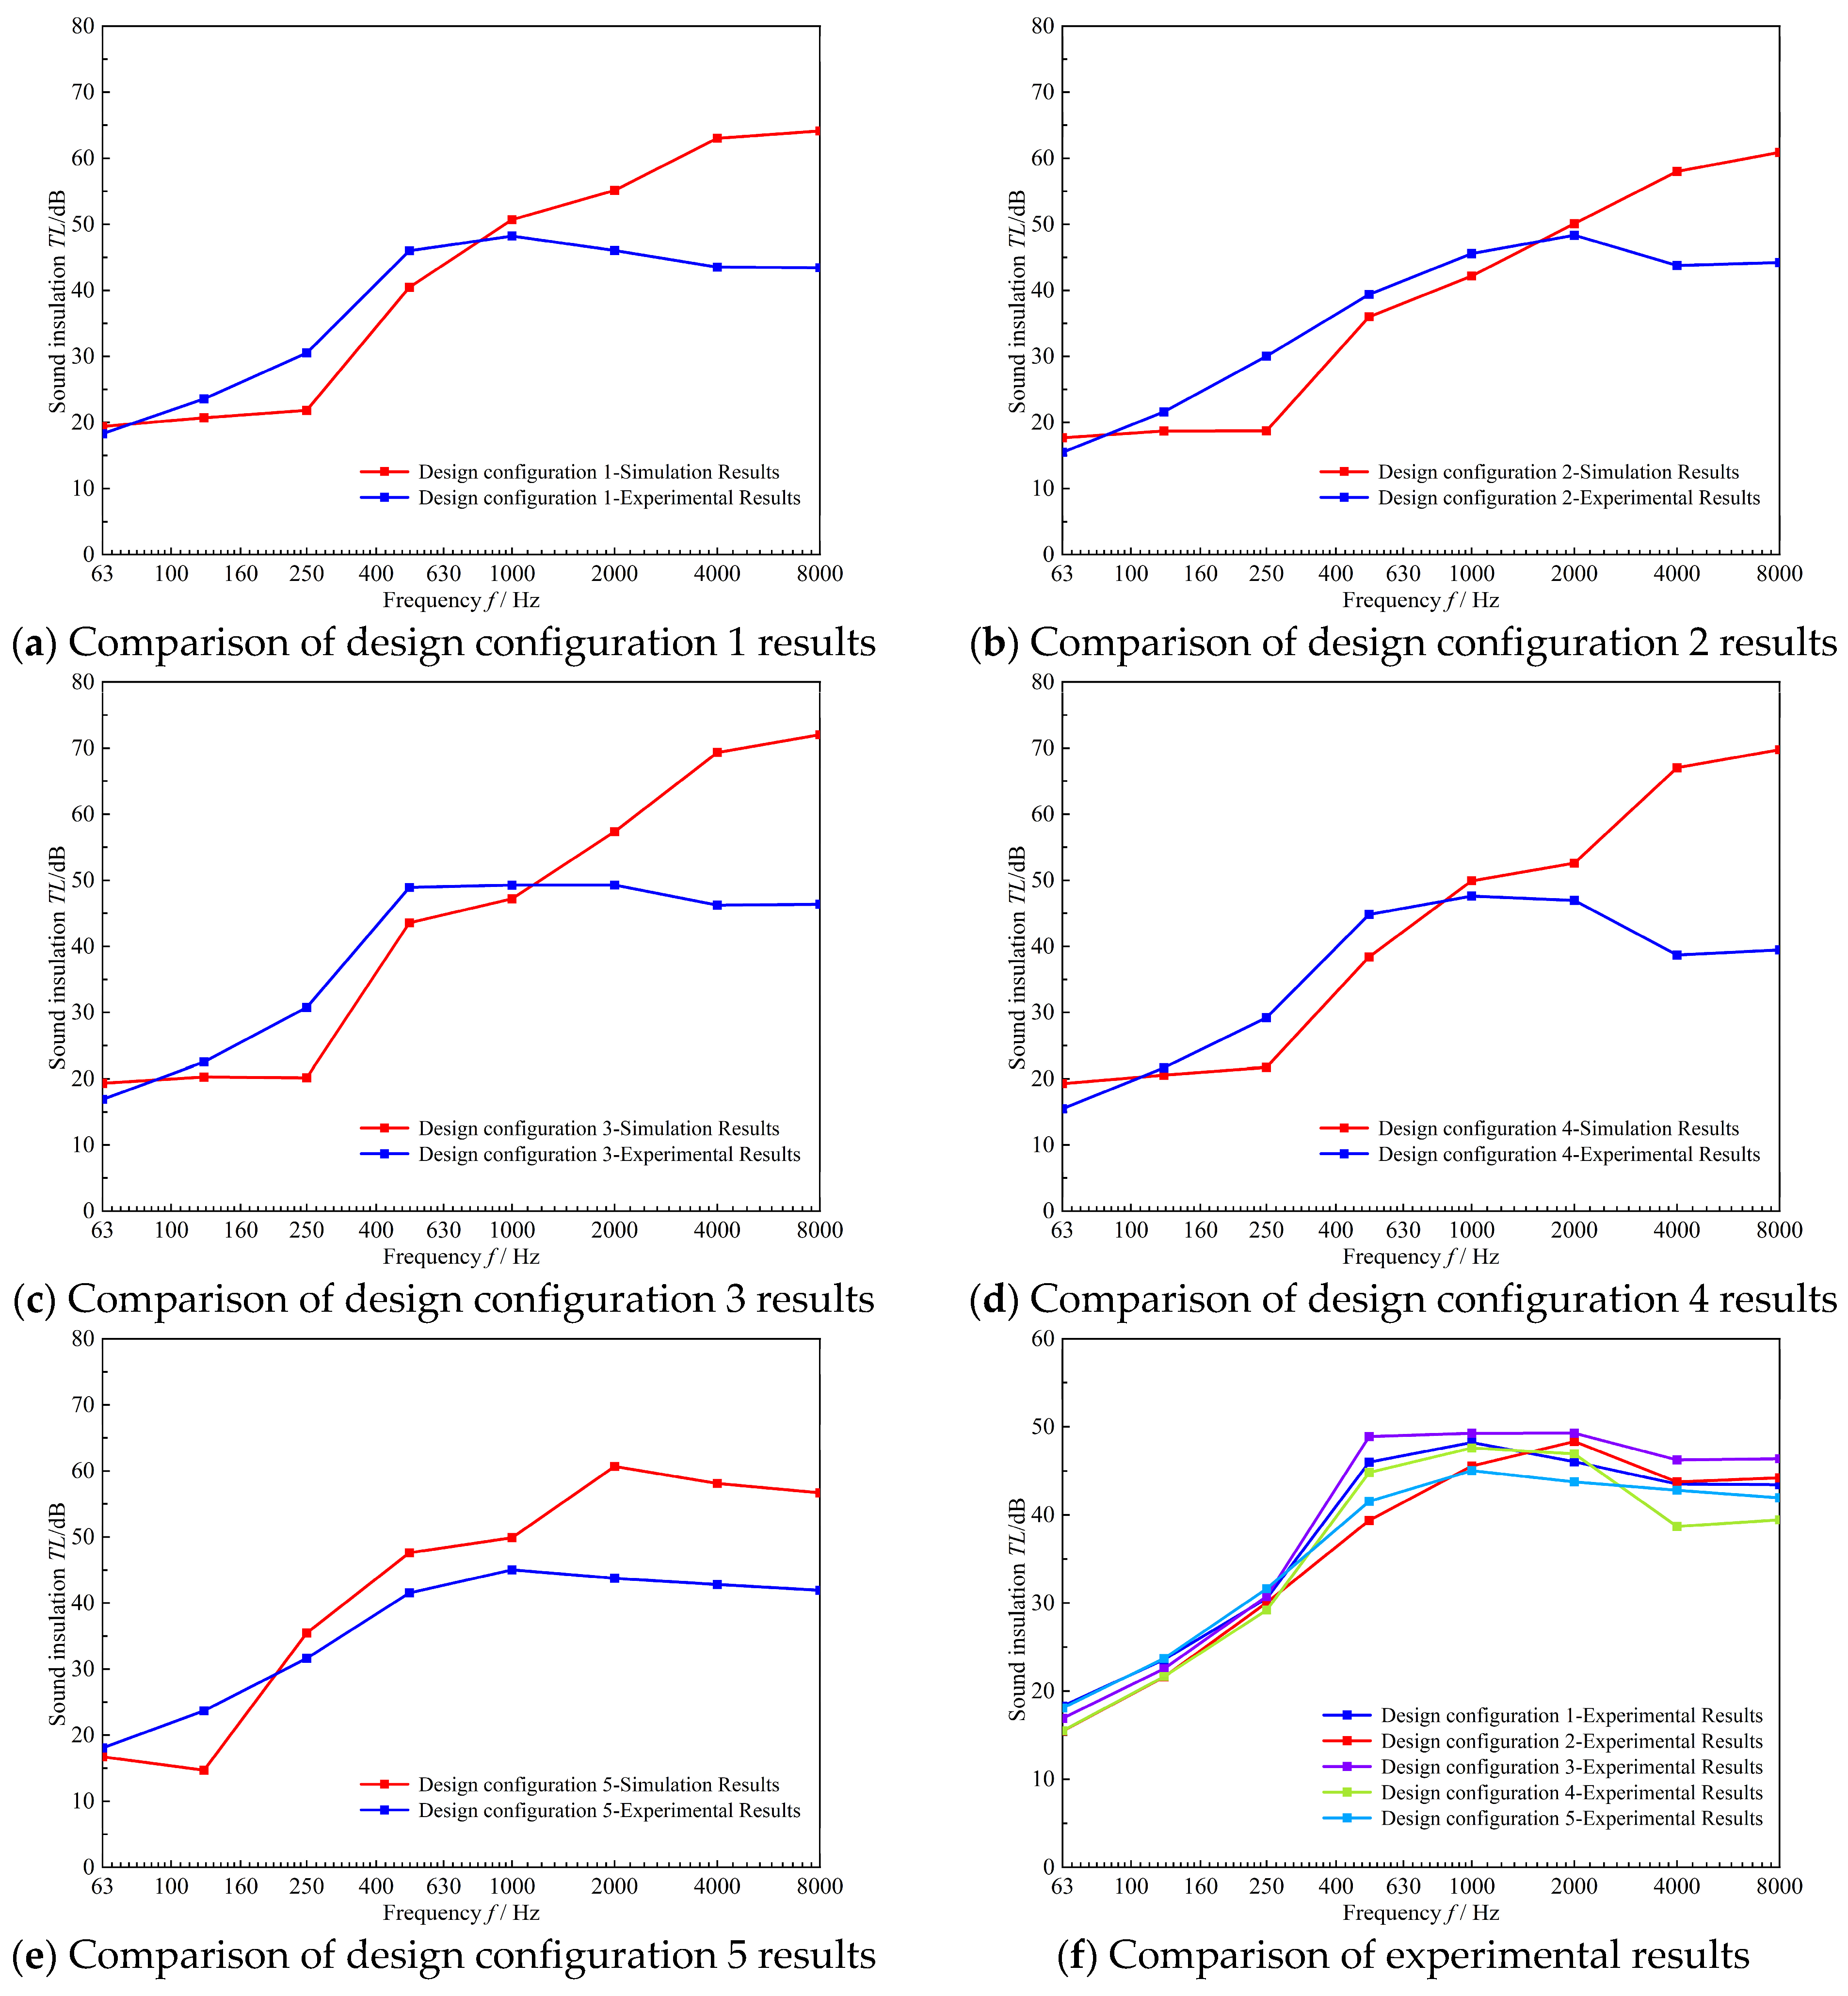
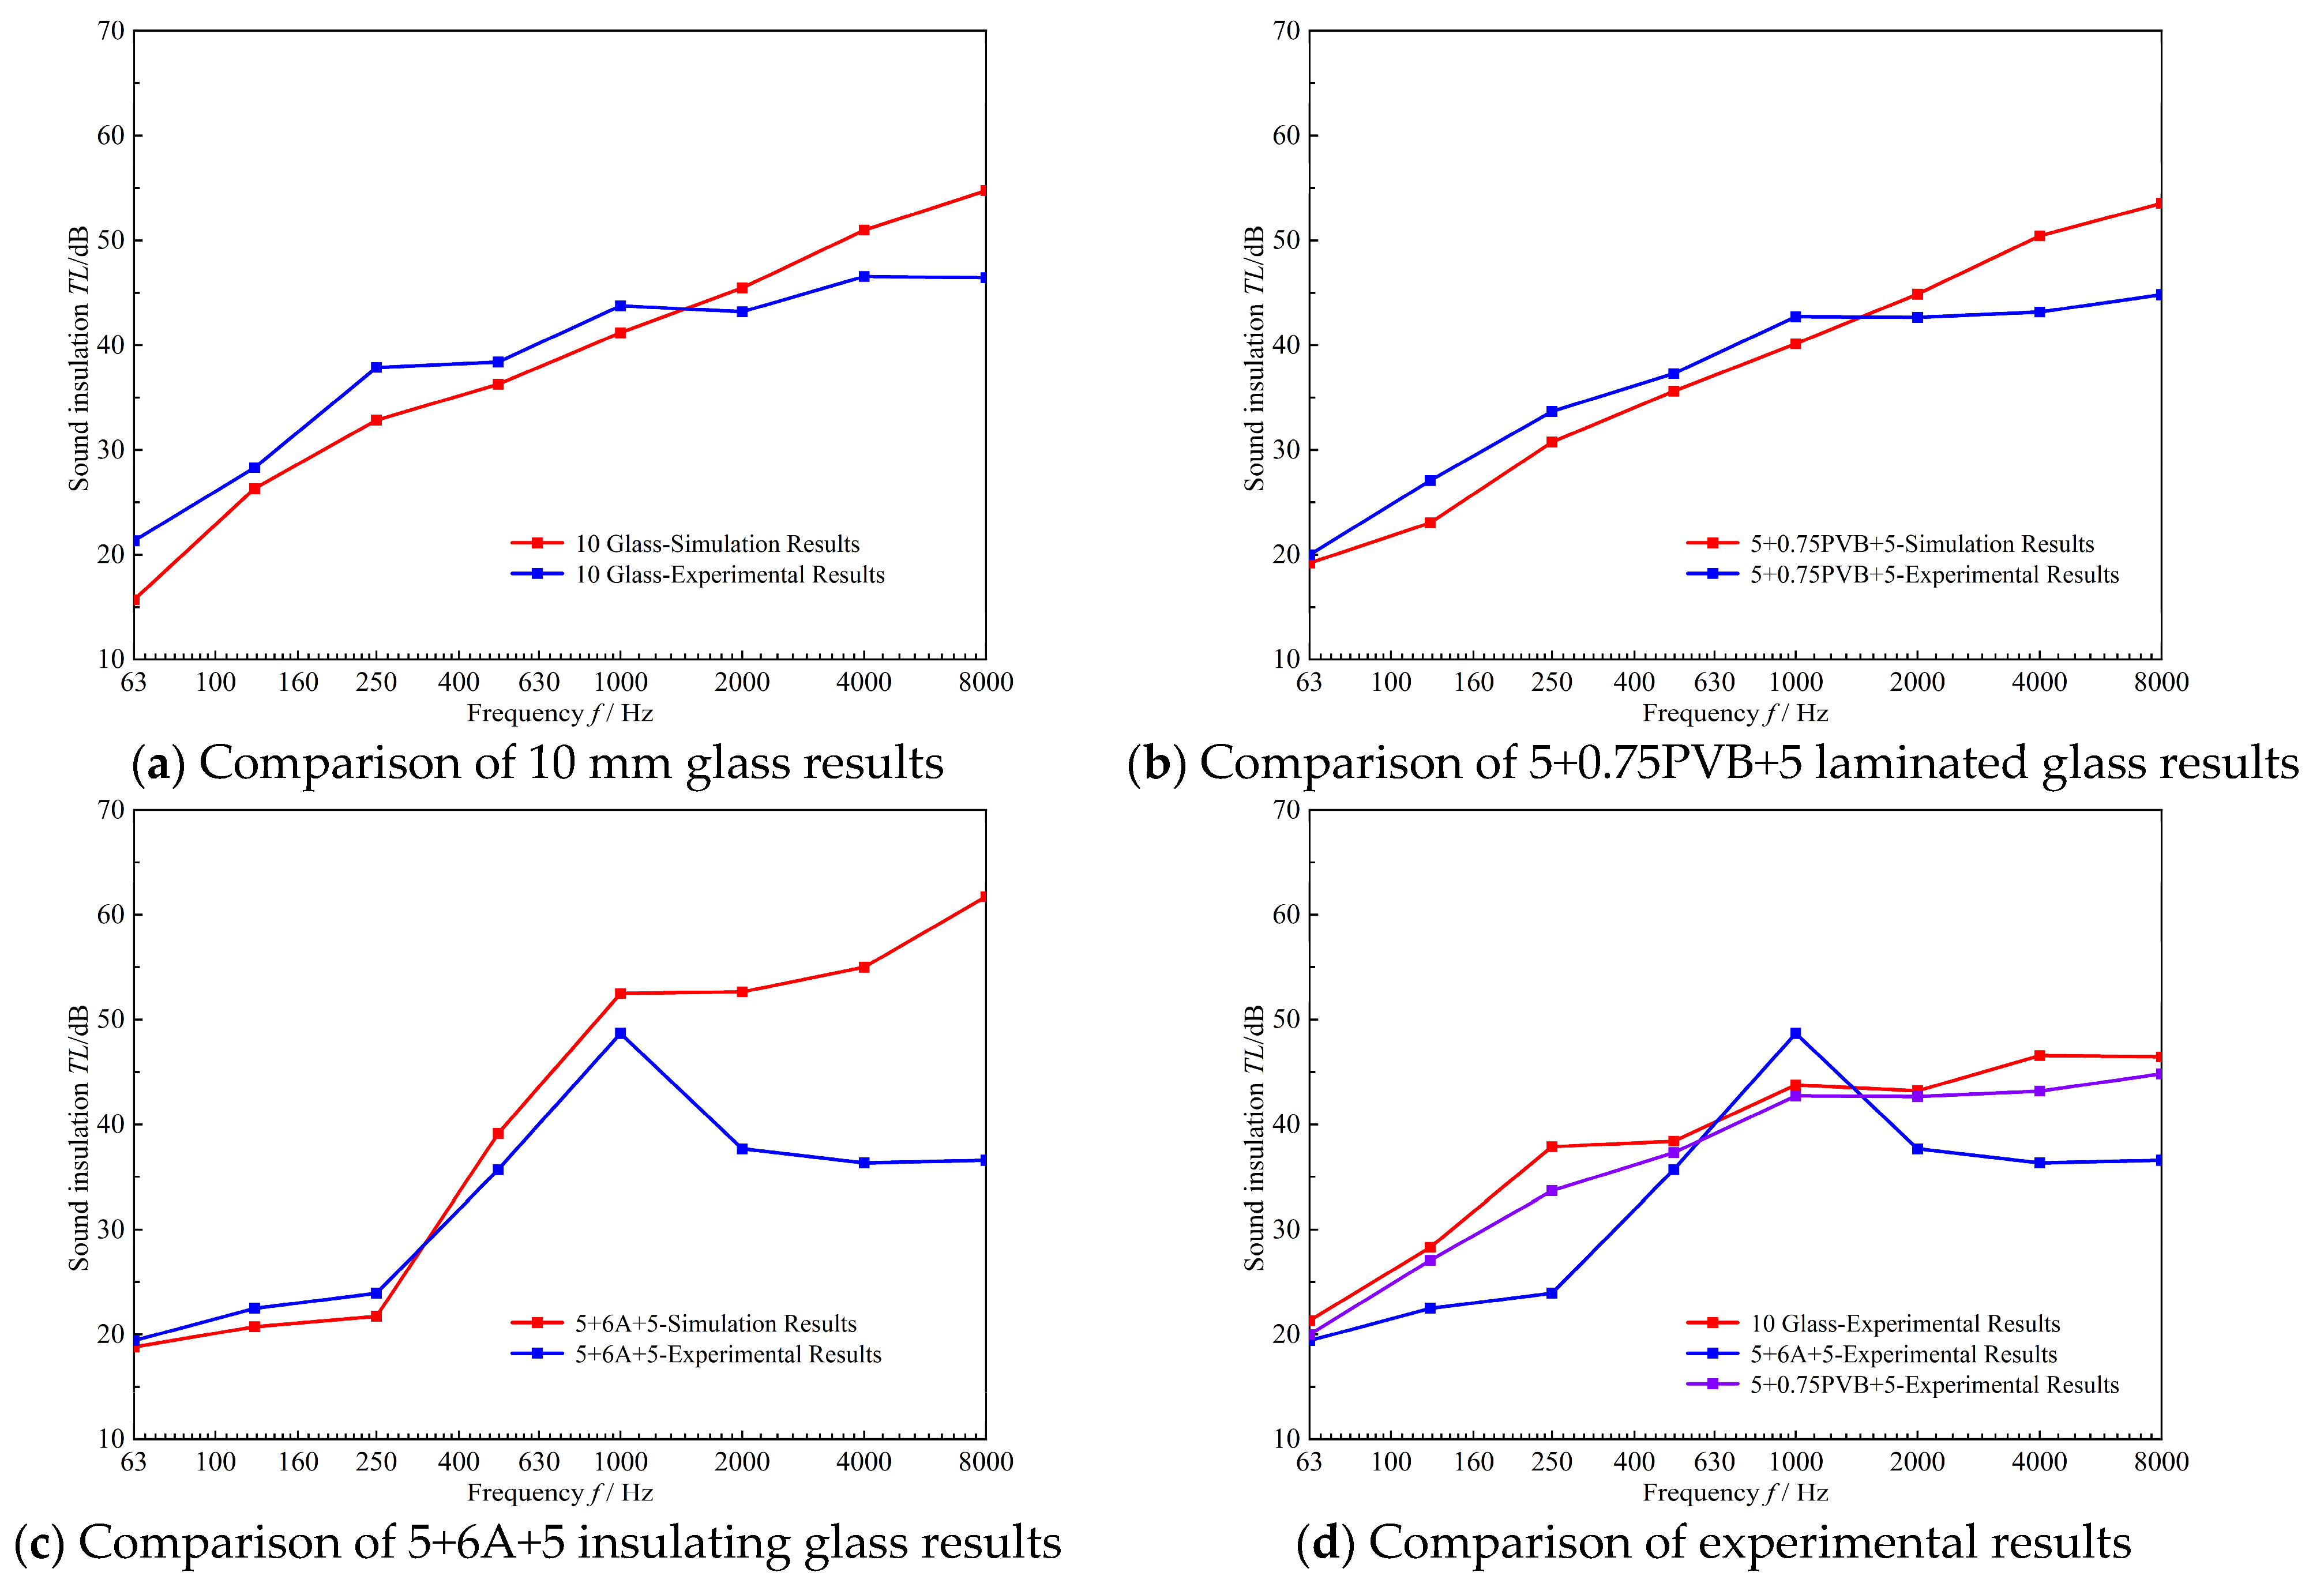
Experimental tests were conducted on the sound insulation performance of glass doors and wall layered structures to validate simulation reliability and assess actual acoustic performance, with separate experimental evaluations performed for two types of wall configurations. Simulation results indicate that single-layer 10 mm glass, compared to other glass configurations, is more suitable for meeting the mid-to-low frequency sound insulation requirements of silent cabin glass doors. The specific experimental results are shown in Figure 14.
The experiment has certain limitations. Insufficient fixation and sealing during sample installation caused acoustic leakage in the high-frequency range, resulting in significant deviations between simulation results and experimental data at these frequencies. This deviation aligns with the characteristics of wave propagation-based simulation methods in high-frequency calculations. Since this study primarily focuses on the mid-to-low frequency range of 63–1000 Hz, these high-frequency deviations do not affect the final performance evaluation. As shown in the comparison results of Figure 14, the experimental data in the mid-to-low frequency range of 63–1000 Hz generally aligns with the simulation results, further validating the reliability of the simulation model within this frequency band. The experimental comparison results are consistent with the conclusions drawn from the simulation analysis. Ultimately, based primarily on the experimental findings, 10 mm glass was selected as the final solution for the soundproof chamber’s glass door.
The simulation results Indicated that Design Configurations 3, 4, and 5 exhibited sound insulation performance meeting the expected requirements. Experiments were conducted specifically to validate the sound insulation of these three design configurations, verifying their actual acoustic performance through testing. The comparison results are shown in Figure 14.
Conducting identical wall experiments, and due to experimental constraints, only mid-to-low frequency results were considered. As shown in Figure 15, the test results and simulation results show high consistency in the 63–1000 Hz frequency band, demonstrating the reliability of the simulation. The experimental results indicate that the low-frequency sound insulation of Design Configuration 3 is comparable to the remaining design configurations. At frequencies above 250 Hz, it consistently outperforms all other combinations, achieving a maximum sound insulation value of 50 dB and demonstrating a significant improvement in sound insulation. Therefore, based on the experimental results as the final core basis, Design Configuration 3 was selected as the sound insulation wall for the silent cabin. This structure can be applied to scenarios such as industrial soundproof booths, recording studios, and office soundproof booths where the low-to-mid frequency noise control is the core demand.

4. Sound Insulation Performance of the Silent Cabin Within Reverberation Chamber

4.1. Simulation of Sound Insulation Performance for the Reverberation Chamber Silent Cabin

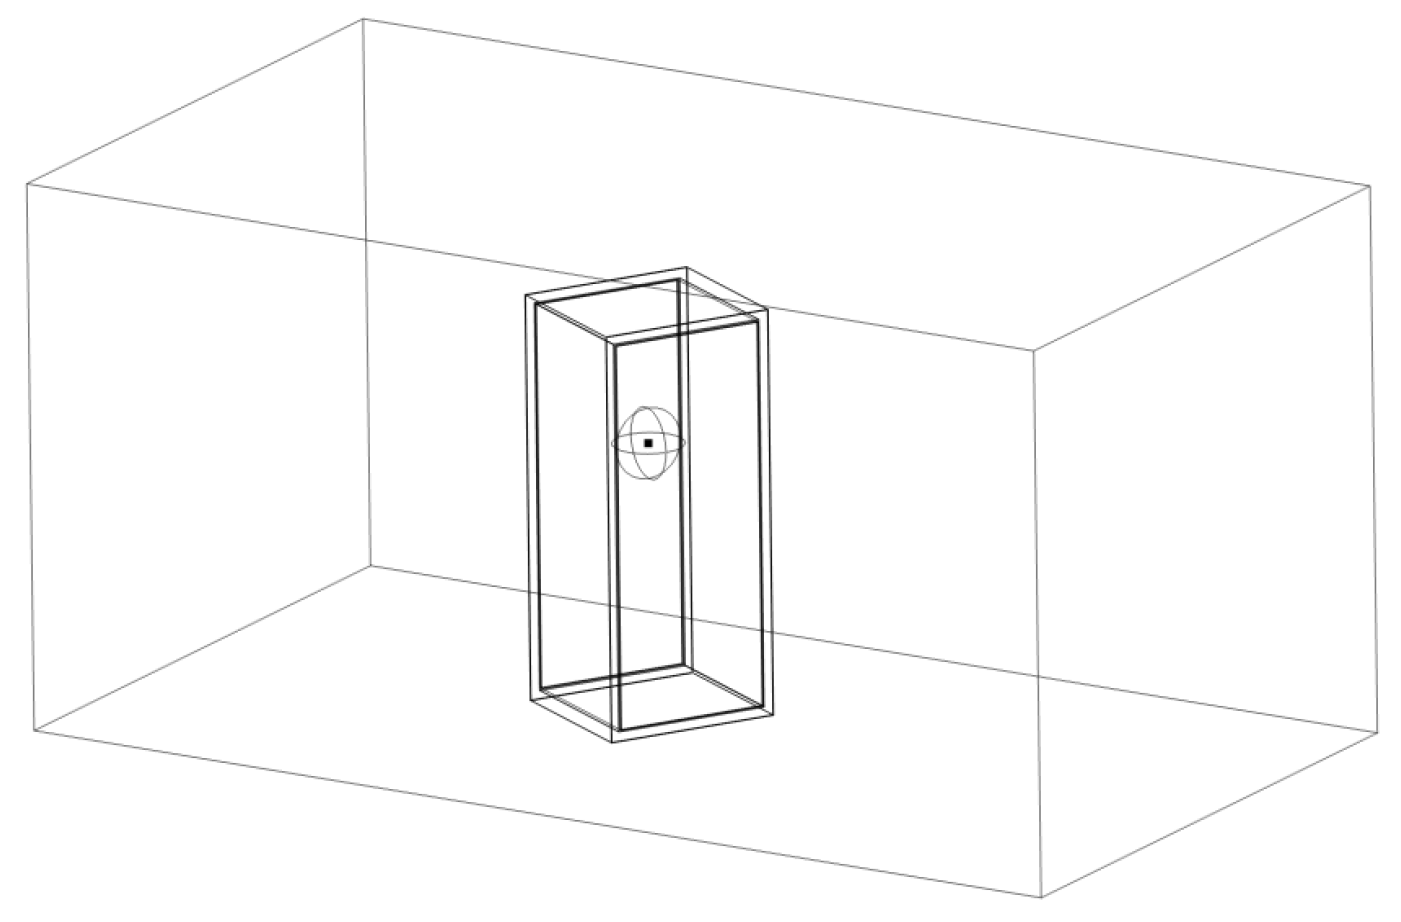
Based on the selected glass door and sound-insulating wall components, a double-door silent cabin model was designed to further investigate its sound insulation performance when placed in a reverberant environment. A simulation model of the silent cabin within reverberation chamber was established with cabin dimensions of 1000 mm × 1000 mm × 2300 mm. The double glass doors on both sides utilize 10 mm thick single-pane glass, while the other wall surfaces employ Design Configuration 3 sound-insulating walls. An omnidirectional sound source is positioned inside the cabin at a height of 1.5 m with a unit magnitude. The silent cabin is placed within a reverberation chamber measuring 6400 mm × 3500 mm × 3100 mm. The simulation model is illustrated in Figure 16.
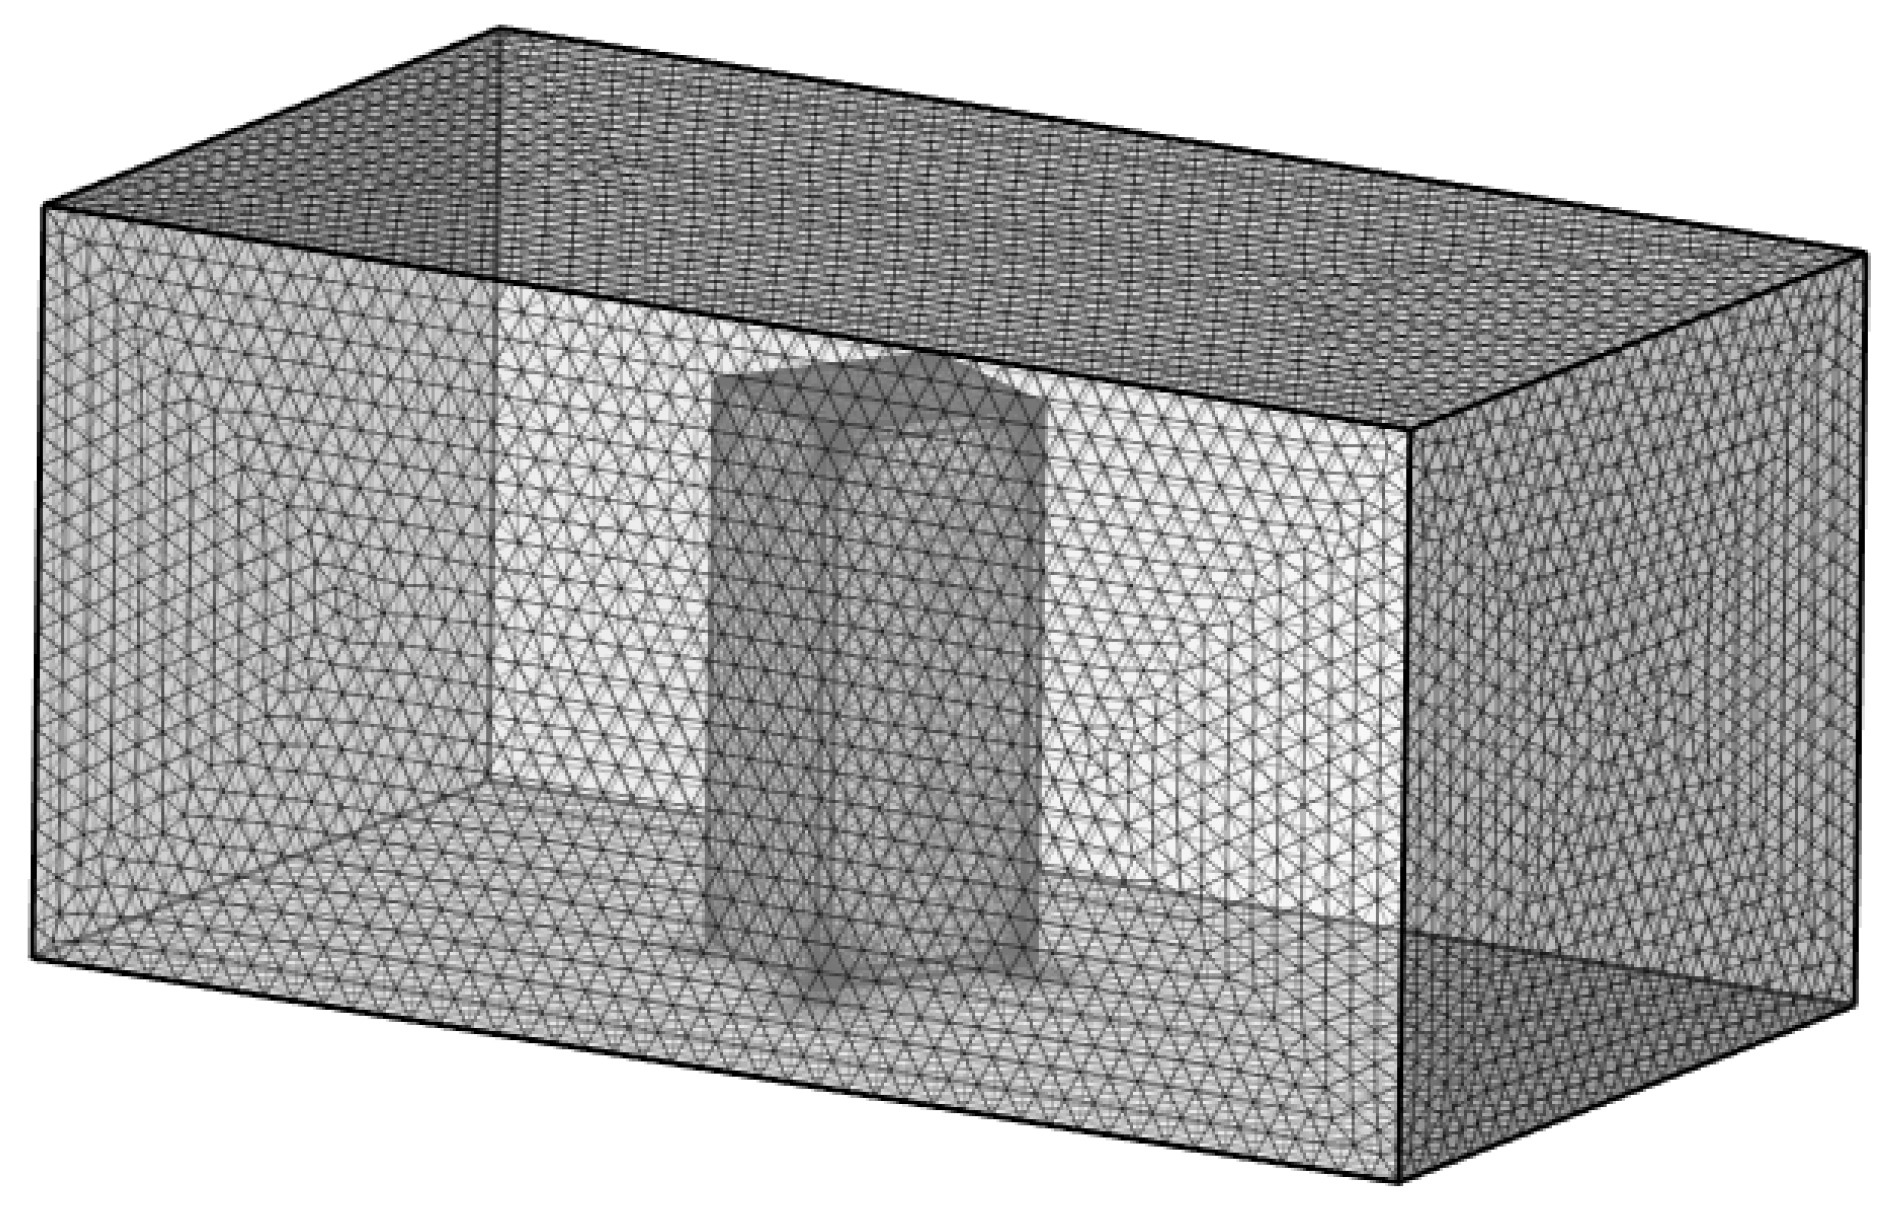
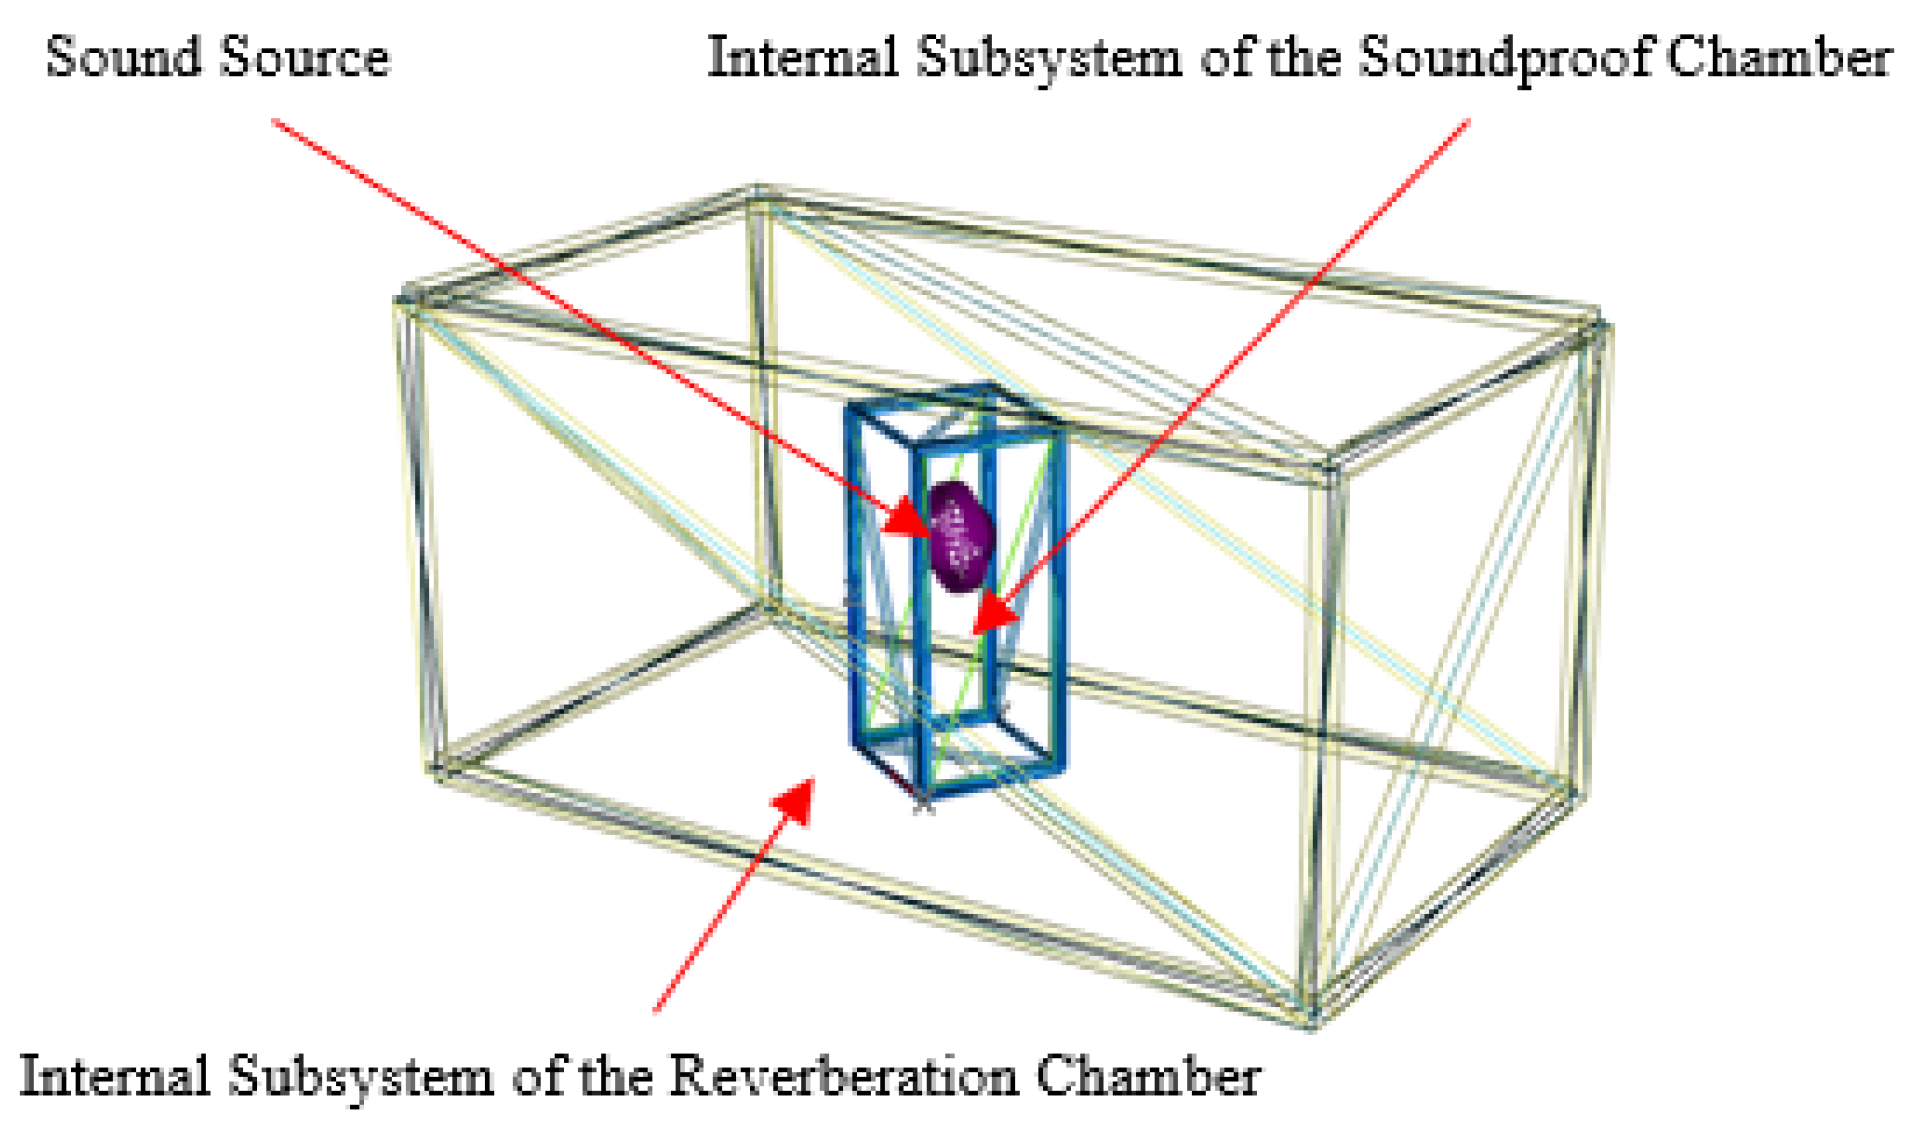
Due to the large model dimensions and high computational frequencies, uniformly applying the finite element method requires extremely fine mesh discretization, leading to excessive computational burden that is unsuitable for this model. In contrast, statistical energy analysis does not encounter such issues and demonstrates high computational efficiency; however, this method yields inaccurate results for low-frequency calculations. Therefore, it is necessary to employ different computational approaches for distinct frequency bands. For frequency bands below 500 Hz, the finite element method was employed for calculations, with the acoustic mesh discretized at one-sixth of the wavelength. For frequencies exceeding 500 Hz, statistical energy analysis was adopted, which does not require consideration of mesh generation. The energy flow is accomplished through coupling between the silent cabin’s internal subsystems and the reverberation chamber’s internal subsystems. The FEM computational mesh configuration is illustrated in Figure 17, while the subsystem coupling model is shown in Figure 18.
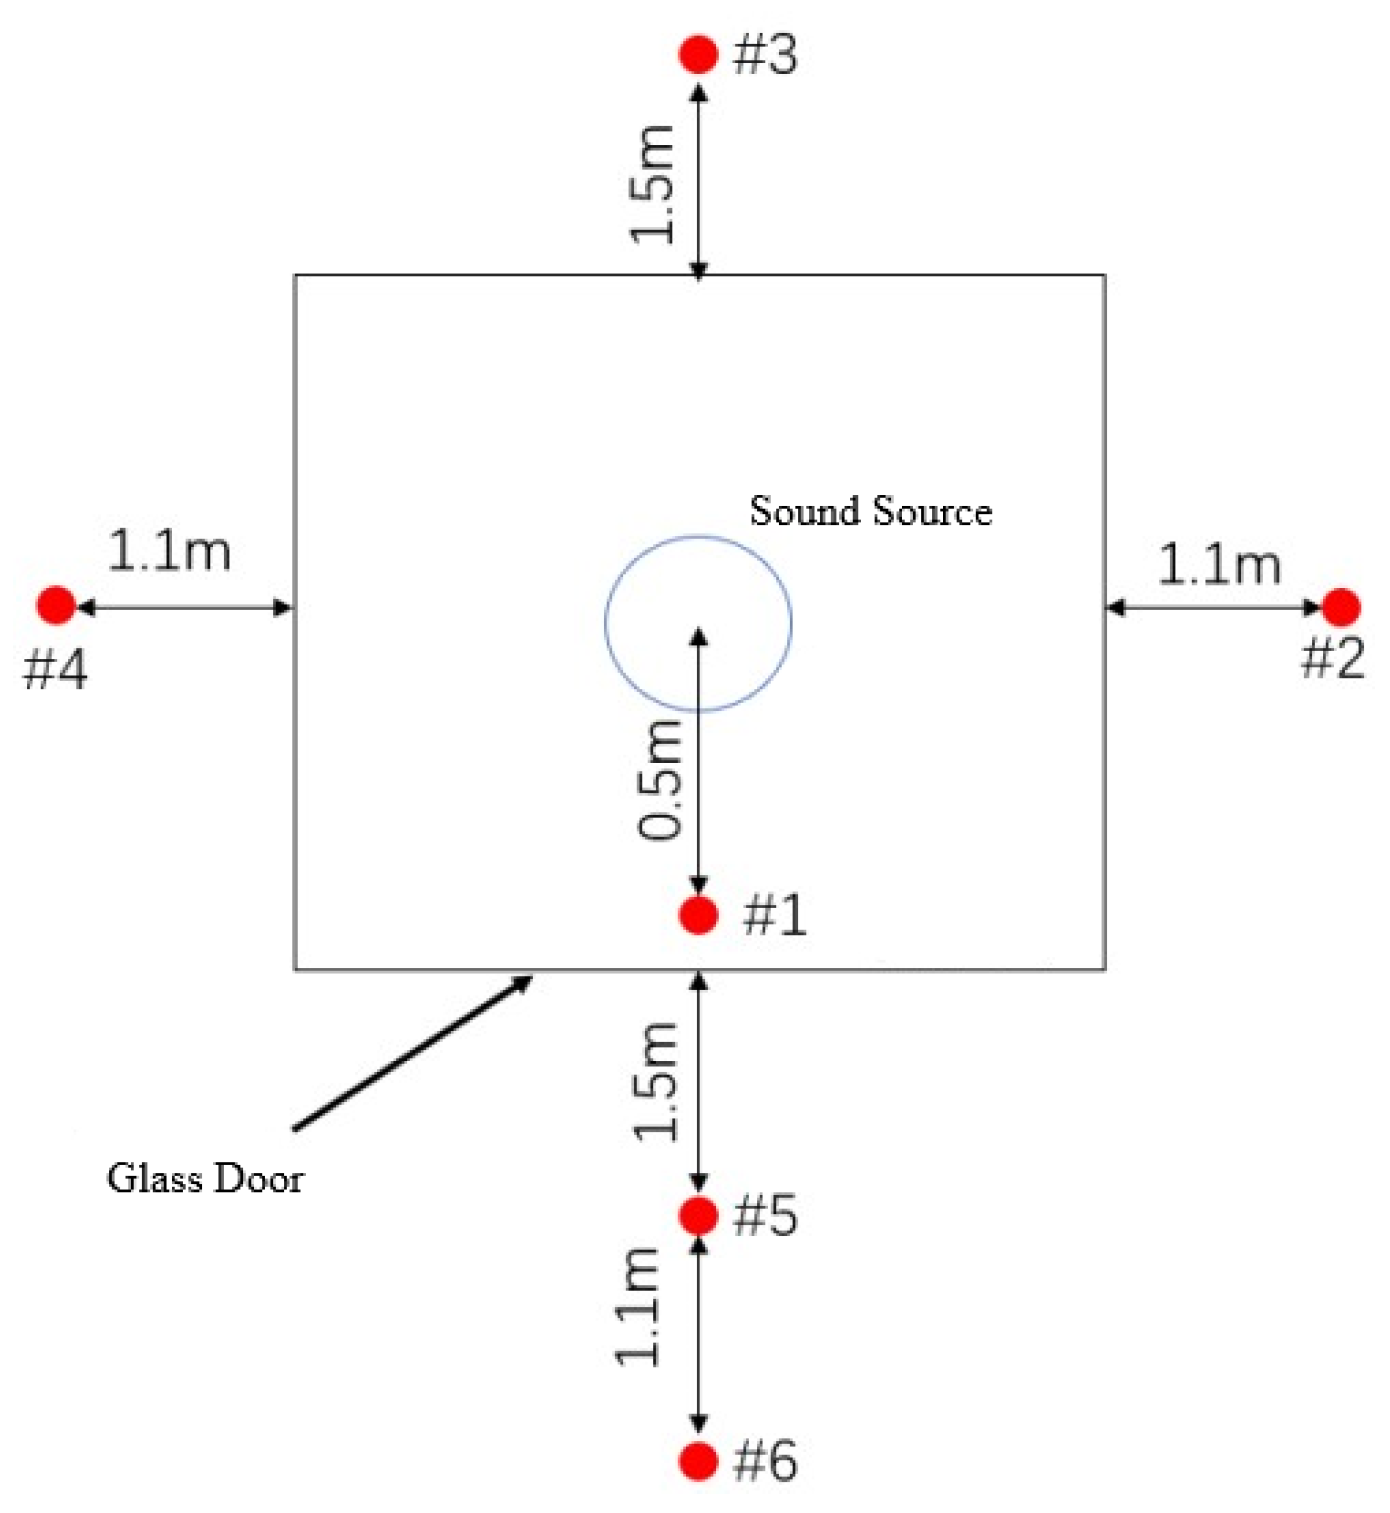
The sound insulation calculation method aligns with the test method, both employing the insertion loss method. The corresponding measurement point layout is shown in Figure 19.

4.2. Experimental Study on Sound Insulation Performance of Reverberation Chamber Silent Cabin Layered Structures

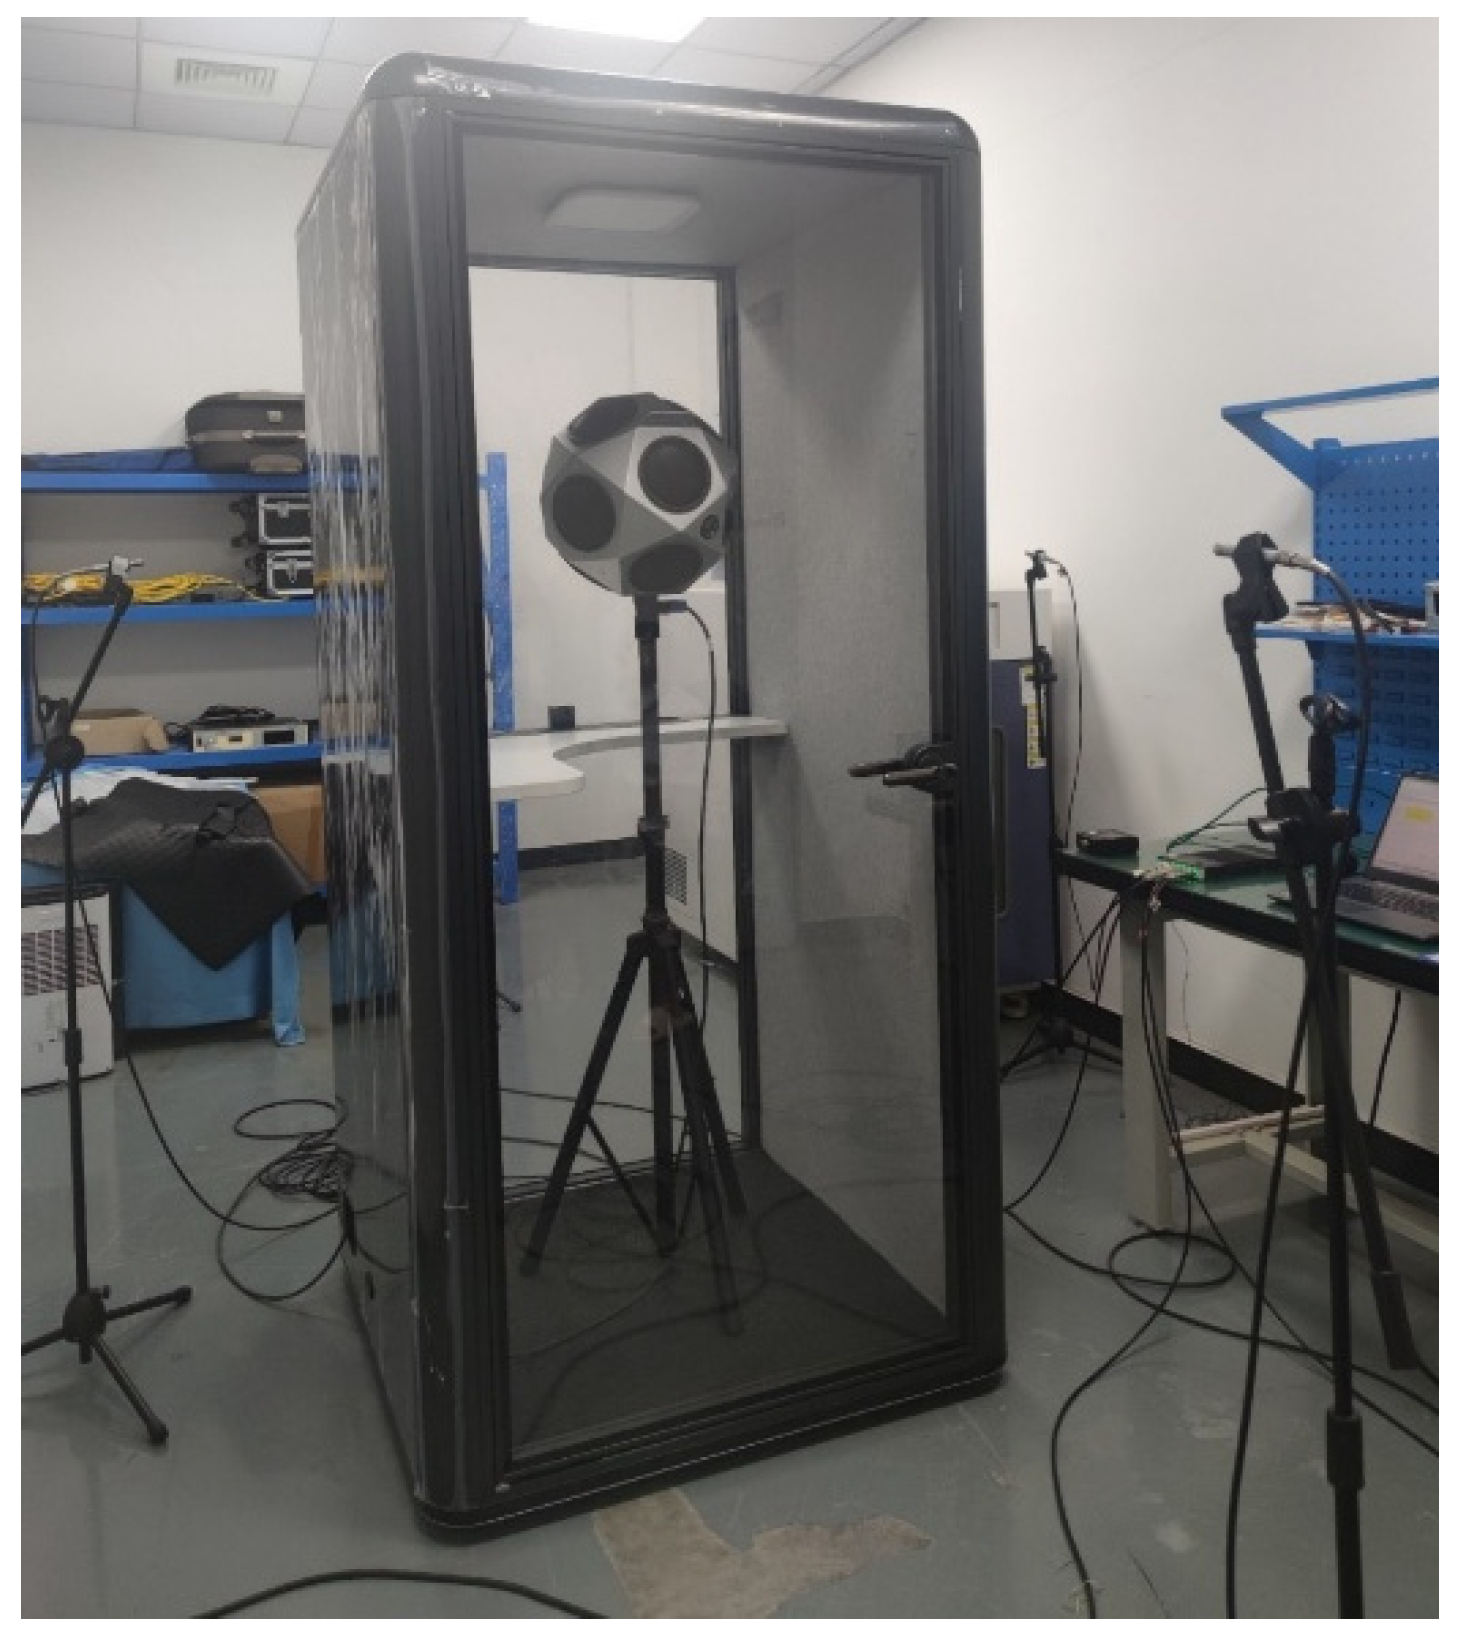
The silent cabin testing simulates industrial application scenarios in a laboratory environment. By replicating the reverberation conditions encountered in actual use of soundproof rooms within a laboratory reverberation chamber, the test results reflect the comprehensive sound insulation performance of the soundproof room as a commercial acoustic enclosure product in real-world applications. This test does not constitute a laboratory measurement of the sound insulation performance of individual building components. The reverberation chamber silent cabin experiment employed the insertion loss method, with testing conducted according to the ISO 23351-1 standard [25] for result calculation. The measurement point arrangements were identical to those used in the simulations. The experimental setup included two configurations: without acoustic enclosure and with acoustic enclosure, with specific arrangements shown in Figure 11 and Figure 20.
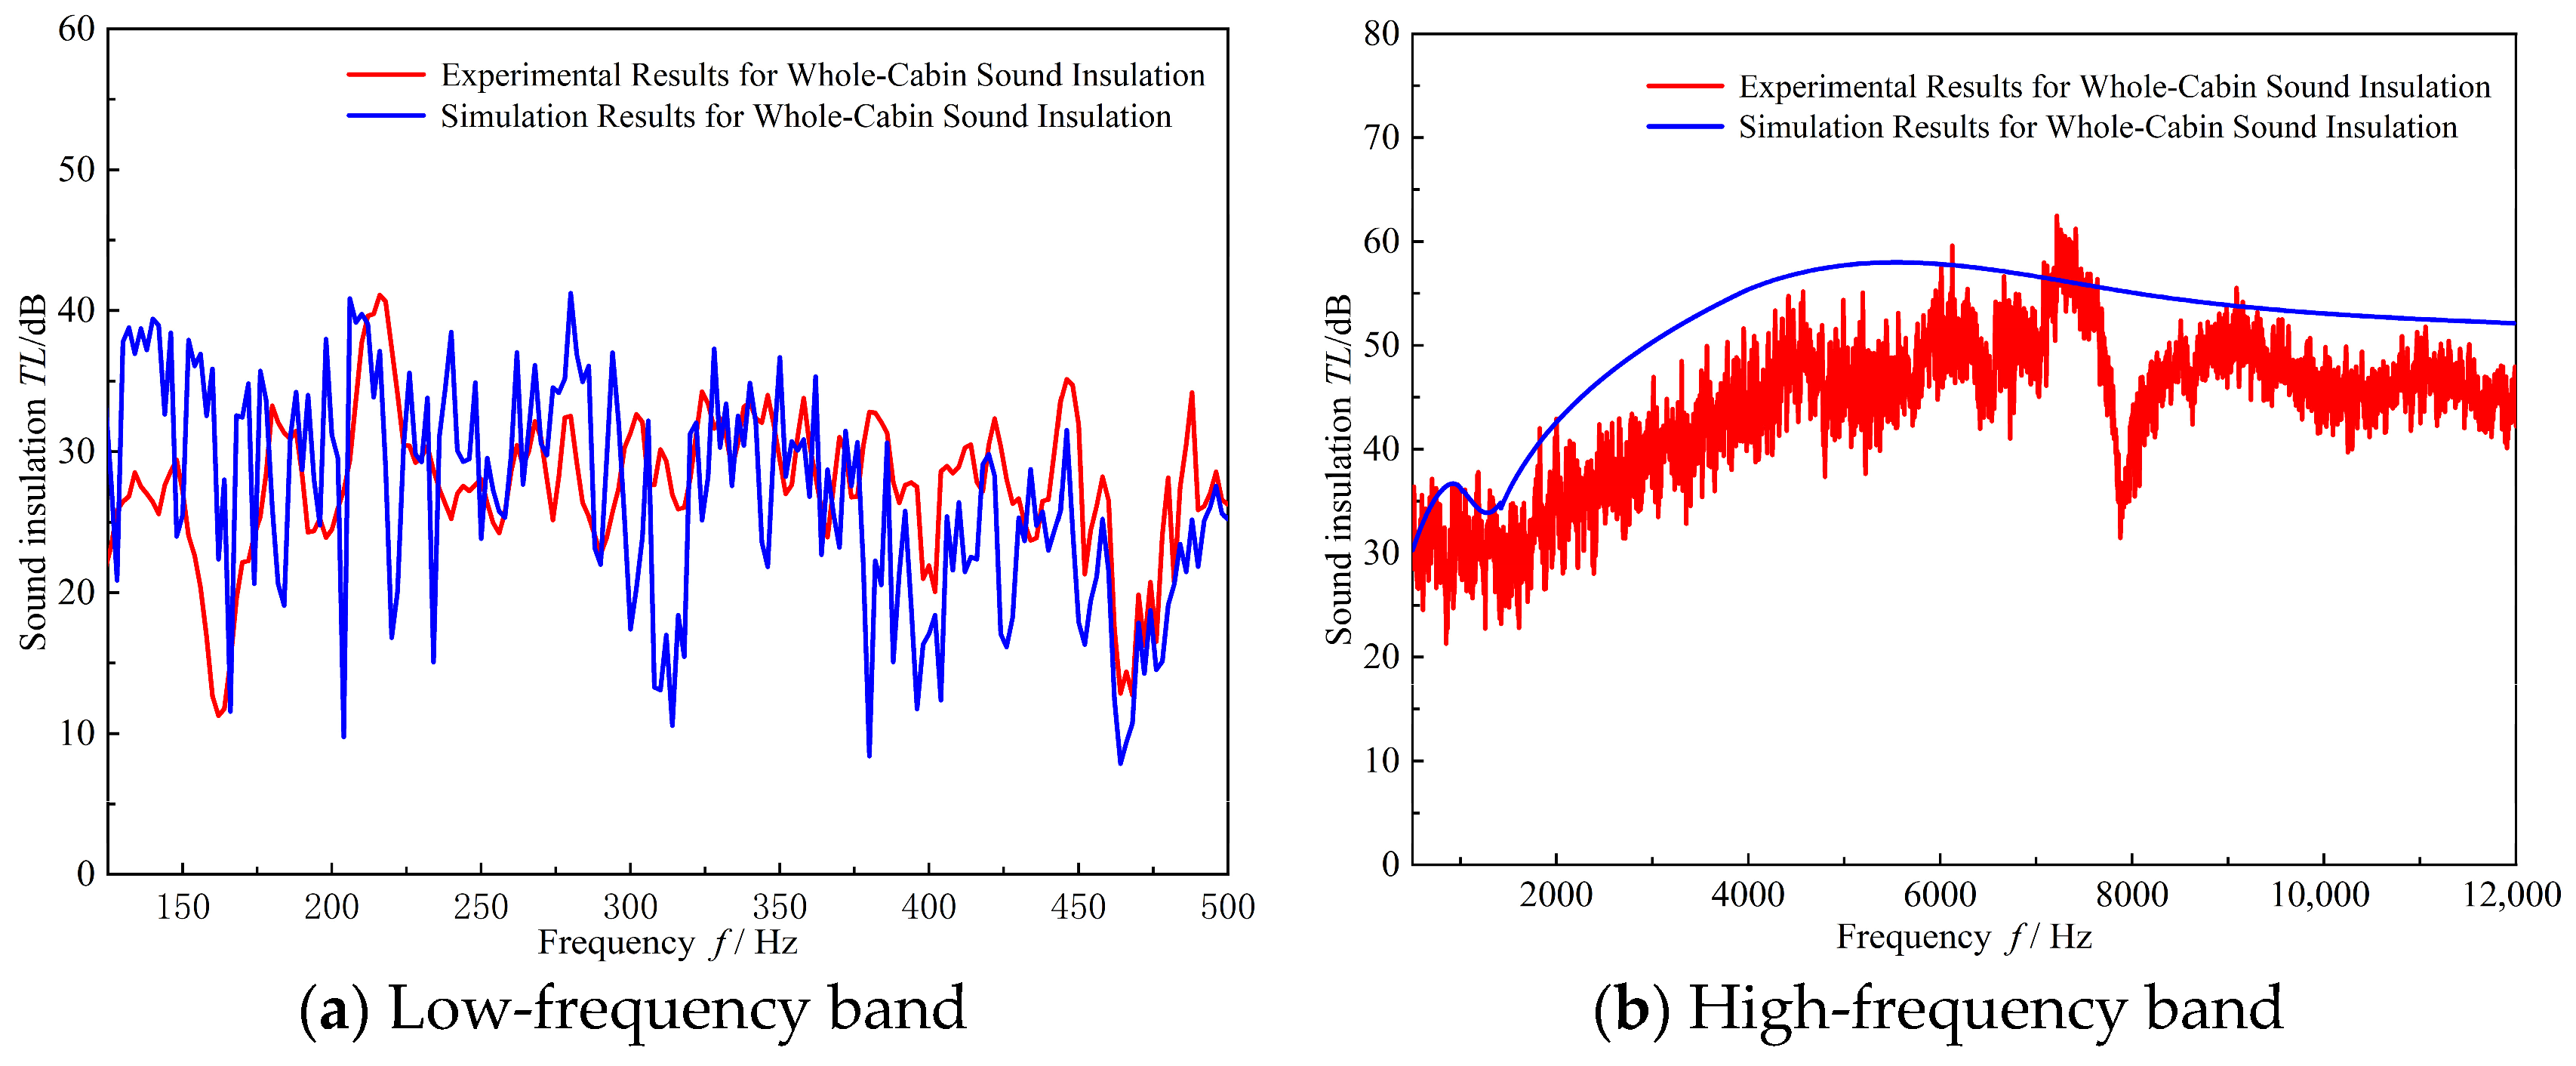
The cut-off frequencies for the two simulation approaches were set at 500 Hz for the low-frequency band and 12,000 Hz for the high-frequency band. The amplitude of variations in the low-frequency results remained largely comparable, with a comparative analysis of the simulation outcomes presented in Figure 21.
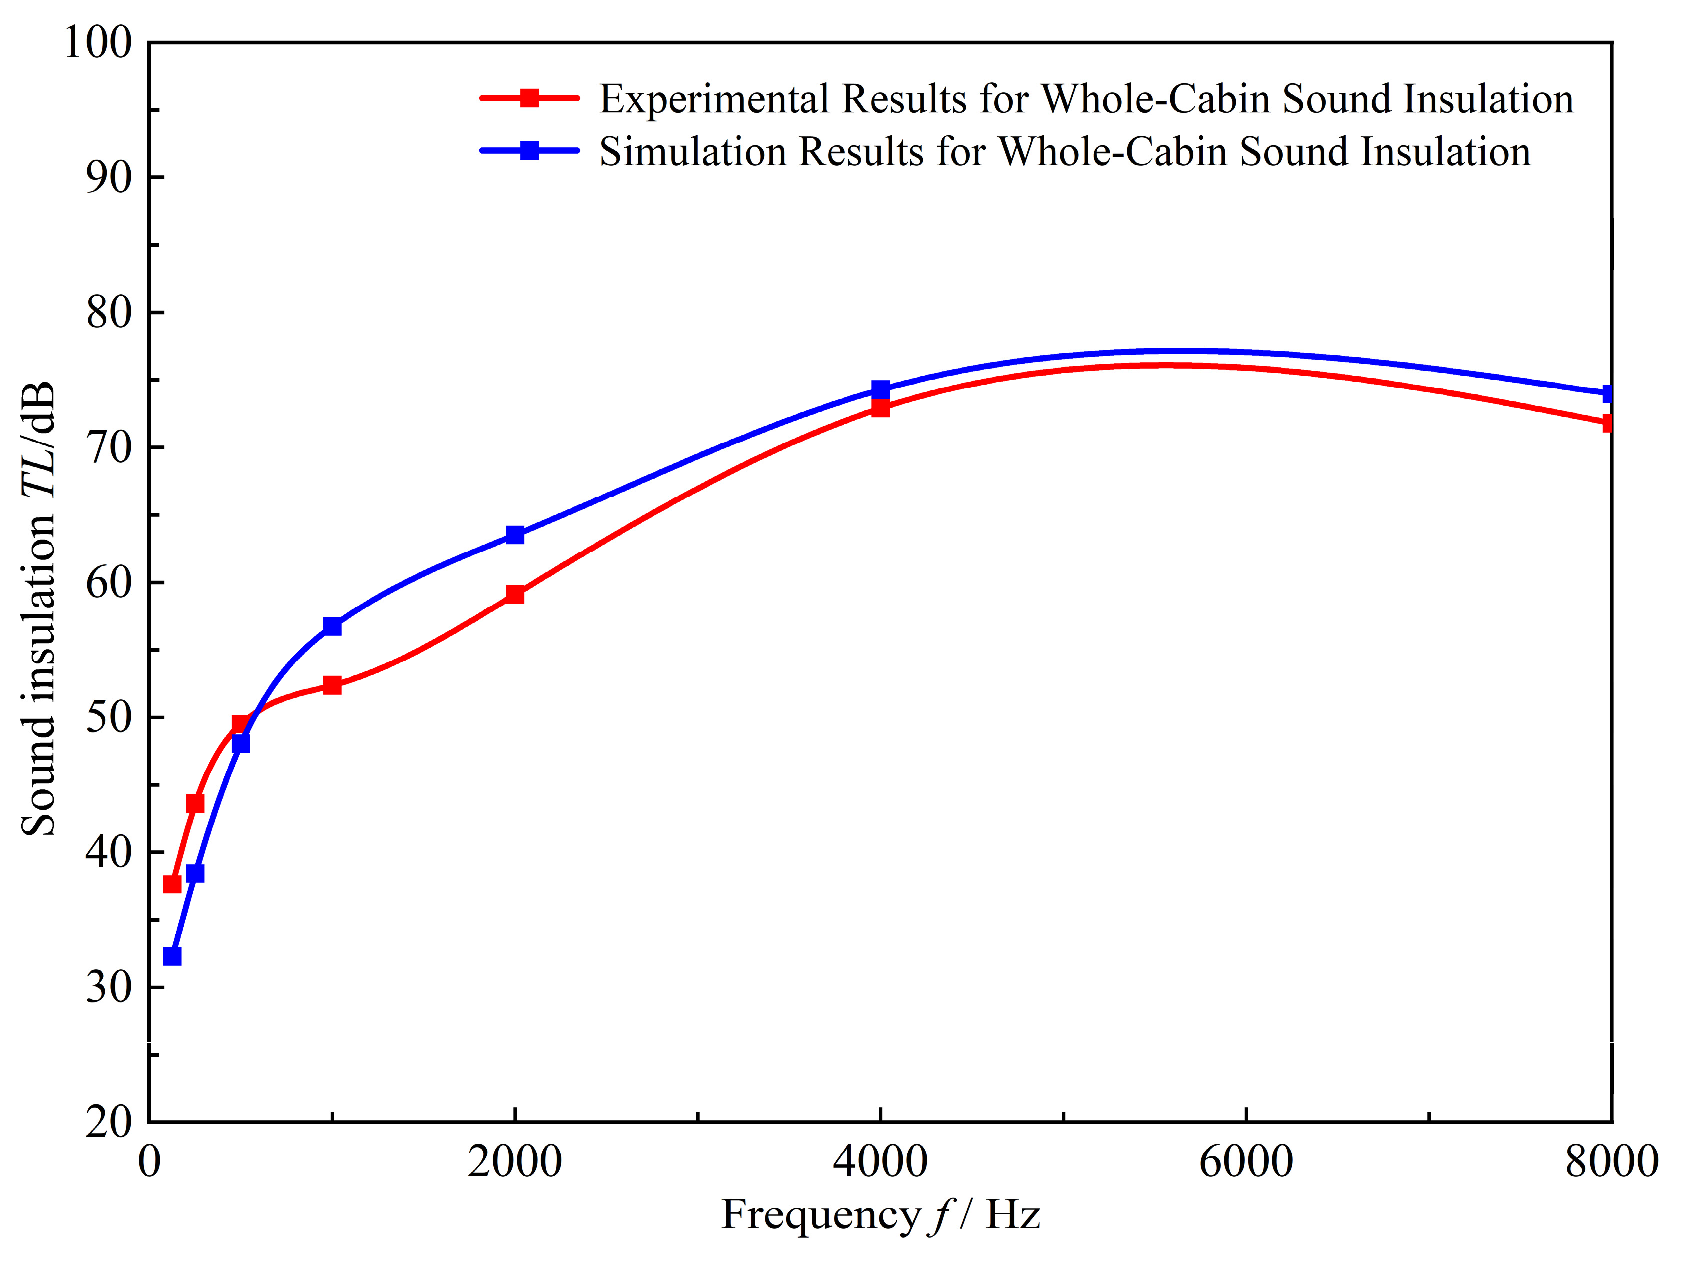
The spectral data from both methods were merged and processed into octave band format for comparison between simulation and experimental data. The experimental results and simulation trends showed fundamental consistency, thereby verifying the reliability of the sound insulation value calculations. The comparative results are presented in Figure 22.

5. Conclusions

Through systematic investigation of sound insulation mechanisms, structural optimization, and performance verification, this study comprehensively employed multiple research approaches including theoretical modeling, numerical simulation, and experimental measurements to conduct in-depth analysis and comparative evaluation of the acoustic characteristics of single-layer and multi-layer sound insulation structures, leading to the following key conclusions:
(1) The study confirms that the sound insulation performance of single-layer glass conforms to the mass law, with an average increase in sound insulation value of approximately 0.8 dB per 1 mm thickness increment within the 5–20 mm range. Through comparative analysis of finite element simulations and experimental measurements, the reliability of the numerical model within the core mid-to-low frequency range of 63–1000 Hz was validated. Deviations between simulation and experimental results above 1000 Hz primarily stemmed from acoustic leakage caused by experimental sealing defects. Simulation results in this frequency band were used solely for trend analysis. For multilayer structures, double-pane insulating glass demonstrates excellent performance in high-frequency ranges but exhibits fluctuations in mid-to-low frequencies, while double-pane laminated glass maintains a performance growth trend similar to that of single-layer glass. Comprehensive comparison reveals that 10 mm single-layer glass demonstrates optimal comprehensive performance in the mid-to-low frequency range.
(2) Through simulation analysis and experimental validation of various material combinations, wall structures with superior sound insulation performance were successfully identified. Design Configuration 3 demonstrates prominent low-frequency sound insulation effectiveness, exhibits balanced performance in mid-to-high frequencies, and achieves optimal overall performance. This configuration ensures effective sound insulation while achieving a relatively compact structural profile.
(3) A hybrid computational approach combining the finite element method and statistical energy analysis was employed to address sound insulation analysis in mid-to-low and high-frequency bands respectively, while maintaining computational accuracy and improving efficiency. The silent cabin model was experimentally validated, with simulations demonstrating close agreement with measured results, thereby confirming the effectiveness of the computational methodology.
Although this study identified the optimal design scheme for the soundproof booth’s laminated structure and established an effective performance prediction method, providing a scientific basis for acoustic barrier design, several limitations and research gaps remain due to constraints in study conditions and scope, awaiting further refinement: First, the study focused solely on a small soundproof booth measuring 1000 mm × 1000 mm × 2300 mm and conducted tests exclusively in conventional indoor reverberation environments. The conclusions and structural solutions have not been validated in large-scale soundproof booths or under special complex acoustic conditions such as high temperature and humidity, or strong vibration, limiting their applicability across diverse scenarios. Second, the core research focused on the mid-to-low frequency range of 63–1000 Hz, with relatively insufficient investigation into sound insulation for ultra-low frequencies below 63 Hz and high frequencies above 8000 Hz. Material selection primarily relied on conventional sound-insulating materials like glass, polyester fiber, and aluminum plates, without in-depth exploration of the sound insulation performance of novel smart acoustic materials such as piezoelectric composites and shape memory alloy structures.

Author Contributions

Conceptualization, Z.G.; Methodology, Y.L., M.S., Z.G. and B.L.; Software, Y.L., M.S., Z.G. and B.L.; Formal analysis, Y.L. and B.L.; Investigation, Y.L., M.S., Z.G. and B.L.; Resources, L.T., M.S. and Z.G.; Data curation, L.T., Z.G. and B.L.; Writing—original draft, L.T. and Y.L.; Writing—review & editing, L.T. and Y.L.; Visualization, L.T.; Supervision, M.S., Z.G. and B.L.; Project administration, M.S. All authors have read and agreed to the published version of the manuscript.

Funding

This research received no external funding.

Data Availability Statement

The original contributions presented in this study are included in the article. Further inquiries can be directed to the corresponding author.

Conflicts of Interest

The authors declare no conflict of interest.

References

  1. Elstner, M.; Ing, M.B.D.; Schäfer, S. Sound insulation with glass. Stahlbau 2013, 82, 303–325. [Google Scholar] [CrossRef]
  2. Ding, J.; Wang, X. Sound Insulation and Noise Reduction of Glass. Glass 2006, 6, 49–53+64. [Google Scholar]
  3. Granzotto, N. Energy and Acoustic Performances of Windows and Their Correlation. Energy Build. 2017, 136, 189–198. Available online: https://xueshu.baidu.com/ndscholar/browse/detail?paperid=60324a7d2463ac376138d64f39c25274 (accessed on 10 February 2026). [CrossRef]
  4. Cai, L.; Zhu, J.; Chen, Y. Test Analysis of Sound Insulation Performance for Single-Pane Windows with Different Structural Types and Parameters. Noise Vib. Control. 2018, 38, 171–176. [Google Scholar]
  5. Zhu, X. Simulation Study on Sound Insulation Performance of Double-Pane Insulated Glass. Noise Vib. Control 2022, 42, 256–262. [Google Scholar] [CrossRef]
  6. Hu, X.; Qi, X. Numerical Simulation of Drop-Weight Impact on PVB Laminated Glass Based on Near-Field Dynamics. Build. Struct. 2023, 53, 90–97. [Google Scholar] [CrossRef]
  7. Yu, L.; Wang, Y.; Lin, Y. Sound insulation enhancement of PVB film by additive engineering. Polymer 2024, 290, 126540. [Google Scholar] [CrossRef]
  8. Liu, Y.; Han, H. Experimental Determination of Sound Transmission Loss in Side Window Laminated Glass with Sound-Insulating PVB Interlayer and Research on Vehicle Noise Reduction. Times Automob. 2018, 4, 121–124. [Google Scholar]
  9. Cui, X.; Liu, C.; Shi, J. A Flexible Meta-Curtain for Simultaneous Soundproofing and Ventilation. Symmetry 2022, 14, 2348. [Google Scholar] [CrossRef]
  10. Jang, D.; Kang, S.; Kim, J. Development and Characterization of a Flexible Soundproofing Metapanel for Noise Reduction. Appl. Sci. 2024, 14, 8833. [Google Scholar] [CrossRef]
  11. Wang, Z. Study on Sound Insulation Characteristics of Multi-Layer Lightweight Composite Sound Insulation Structures. Master’s Thesis, Jiangsu University of Science and Technology, Zhenjiang, China, 2022. [Google Scholar] [CrossRef]
  12. Van Den Wyngaert, J.C.E.; Schevenels, M.; Reynders, E.P.B. Predicting the sound insulation of finite double-leaf walls with a flexible frame. Appl. Acoust. 2018, 141, 93–105. [Google Scholar] [CrossRef]
  13. Guo, T. Study on Sound Insulation Properties of Periodic Double-Layer Sandwich Panel Structures. Master’s Thesis, Northeast Electric Power University, Jilin, China, 2023. [Google Scholar] [CrossRef]
  14. Xia, Z.; Wu, X.; Yang, Q. Analysis and Experimental Study on Sound Insulation Performance of Composite Sound Insulation Structures. Noise Vib. Control 2023, 43, 129–134+141. [Google Scholar]
  15. Wang, P. Analysis of Sound Insulation Performance for Infinitely Thick Multilayer Plywood. Noise Vib. Control. 2021, 41, 210–213. [Google Scholar] [CrossRef]
  16. Peng, T.; Qi, Z. Sound Insulation Performance of Laminated Panels Based on the Equivalent FE-BEM Method. J. Aeronaut. Eng. 2024, 39, 14–21. [Google Scholar] [CrossRef]
  17. Nowoświat, A.; Olechowska, M. Estimation of Reverberation Time in Classrooms Using the Residual Minimization Method. Arch. Acoust. 2017, 42, 609–617. [Google Scholar] [CrossRef][Green Version]
  18. Huang, L.; Xiao, X. Prediction and Analysis on Sound Insulation Characteristics of Vacuum Glass Windows for High-speed Trains Based on Hybrid FTMM-SEA Method. J. China Railw. Soc. 2024, 46, 89–96. [Google Scholar] [CrossRef]
  19. Martellotta, F. Innovative Composite Materials for Sound Absorption and Insulation: Where We Are and Where We Are Going. Materials 2021, 14, 1954. [Google Scholar] [CrossRef] [PubMed]
  20. Garg, N.; Gautam, C.; Devi, A. Airborne Sound Insulation of Sandwich Partition Panels and Masonry Constructions for Noise Control. Mapan 2023, 38, 729–743. [Google Scholar] [CrossRef]
  21. Yue, K.; Cheng, X.; Zhang, Y.; Wu, P.; Shi, X.; Guo, H. Investigation of Airborne Sound Insulation Performance in Timber Structure Walls. For. Sci. 2024, 60, 104–115. [Google Scholar] [CrossRef]
  22. Li, G.; He, M.; Chen, S. Acoustic performance testing and analysis of sound isolation chamber. China Meas. Test 2024, 50, 229–233. Available online: https://sycs.cbpt.cnki.net/portal/journal/portal/client/paper/abb32d573c30b84c5ebc76bbf86cce6c (accessed on 16 January 2026).
  23. Hongisto, V.; Keränen, J.; Rantanen, E. Class A booth reduces stress due to office noise. In Proceedings of the 11th Convention of the European Acoustics Association Forum Acusticum/EuroNoise 2025, Málaga, Spain, 23–26 June 2025; European Acoustics Association: Madrid, Spain, 2025; pp. 3801–3804. Available online: https://dael.euracoustics.org/confs/landing_pages/fa2025/000203.html (accessed on 5 March 2026).
  24. ISO 10140-1:2021; Acoustics—Laboratory Measurement of Sound Insulation of Building Elements—Part 1: Application Rules for Specific Products. ISO: Geneva, Switzerland, 2021.
  25. ISO 23351-1:2020; Acoustics—Measurement of Speech Level Reduction of Furniture Ensembles and Enclosures—Part 1: Laboratory Method. ISO: Geneva, Switzerland, 2020.
Figure 1. Schematic diagram of the fundamental principle of sound insulation.
Applsci 16 02996 g001
Figure 2. Schematic diagram of the sound insulation simulation model.
Applsci 16 02996 g002
Figure 3. Comparison of one-third octave band sound insulation values for the 10 mm glass partition structure.
Applsci 16 02996 g003
Figure 4. Comparison of sound insulation values for glass panels with different thicknesses.
Applsci 16 02996 g004
Figure 5. Comparison of sound insulation values for double-pane insulating glass with different thicknesses.
Applsci 16 02996 g005
Figure 6. Effect of exclusively increasing glass thickness on sound insulation value.
Applsci 16 02996 g006
Figure 7. Effect of exclusively increasing interlayer thickness on sound insulation value. (a) 5 mm glass on both sides with increased interlayer thickness. (b) 6 mm glass on both sides with increased interlayer thickness.
Applsci 16 02996 g007
Figure 8. Comparison of sound insulation values for double-pane laminated glass with different thicknesses.
Applsci 16 02996 g008
Figure 9. Comparison of 10 mm sound insulation structures with different glass types.
Applsci 16 02996 g009
Figure 10. Comparison results of designed configurations.
Applsci 16 02996 g010
Figure 11. Layout of sound source and microphones in the reverberation chamber.
Applsci 16 02996 g011
Figure 12. Installation diagram of the test specimen.
Applsci 16 02996 g012
Figure 13. Layout of microphones in the hemi-anechoic chamber.
Applsci 16 02996 g013
Figure 14. Comparison of experimental results.
Applsci 16 02996 g014
Figure 15. Comparison of sound insulation performance in wall experiments for design configurations.
Applsci 16 02996 g015
Figure 16. Silent cabin within reverberation chamber model.
Applsci 16 02996 g016
Figure 17. Finite element method model mesh discretization.
Applsci 16 02996 g017
Figure 18. Subsystem coupling models.
Applsci 16 02996 g018
Figure 19. Measurement point locations.
Applsci 16 02996 g019
Figure 20. Experimental setup.
Applsci 16 02996 g020
Figure 21. Comparison of experimental sound insulation performance in different frequency bands for the overall silent cabin.
Applsci 16 02996 g021
Figure 22. Comparison of experimental sound insulation performance for the full cabin.
Applsci 16 02996 g022
Table 1. Material parameters.
Serial NumberNameDensity kg/m3Remark Code
1Glass2500
2PVB adhesive1070PVB
3Air1A
Table 2. Glass door layered structure configuration parameters.
Serial NumberNameSpecificationSurface Density kg/3Total Thickness mm
1Single-pane glass512.55
2615.06
3820.08
41025.010
51230.012
61435.014
71640.016
8Double-pane insulating glass5+6A+525.016
95+9A+525.019
106+6A+630.018
116+9A+630.021
12Double-pane laminated glass4+0.76PVB+420.88.76
135+0.76PVB+525.810.76
146+0.76PVB+630.812.76
156+0.76PVB+835.814.76
Table 3. Material parameters for each layer of the composite wall design.
Serial NumberNameDensity kg/m3Remark Code
1Polyester fiber180J
2Medium density fiberboard650M
3Acoustic insulation wool35X
4Carbon fiber board650T
5Perforated panel2700C (Porosity: 0.019, Pore diameter: 0.5 mm)
6Steel plate7830G
7Aluminum plate2700L
Table 4. Composite panel design structural parameters.
Serial NumberNameSpecificationSurface Density kg/m2Total Thickness mm
1Design configuration 19J+5T+30X+15T15.759.0
2Design configuration 29J+1.5C+50X+1.2G16.861.7
3Design configuration 39J+1.5L+50X+1.2G16.861.7
4Design configuration 41.5C+9J+5T+50X+1.2G20.066.7
5Design configuration 59J+5T+30A+15T14.659.0
Disclaimer/Publisher’s Note: The statements, opinions and data contained in all publications are solely those of the individual author(s) and contributor(s) and not of MDPI and/or the editor(s). MDPI and/or the editor(s) disclaim responsibility for any injury to people or property resulting from any ideas, methods, instructions or products referred to in the content.