Hardware System and Preliminary Testing of Frequency Division Multiplexing Electrical Resistivity Tomography(FDM-ERT) Instrument

 , ,
, ,
Abstract
1. Introduction
2. Materials and System Design (Data and Hardware)
2.1. Principles of FDM-ERT
2.2. Overall Research Methodology Model
2.3. Transmitter Hardware Architecture
2.3.1. Integrated Hardware Architecture of the Transmitter System
- (1)
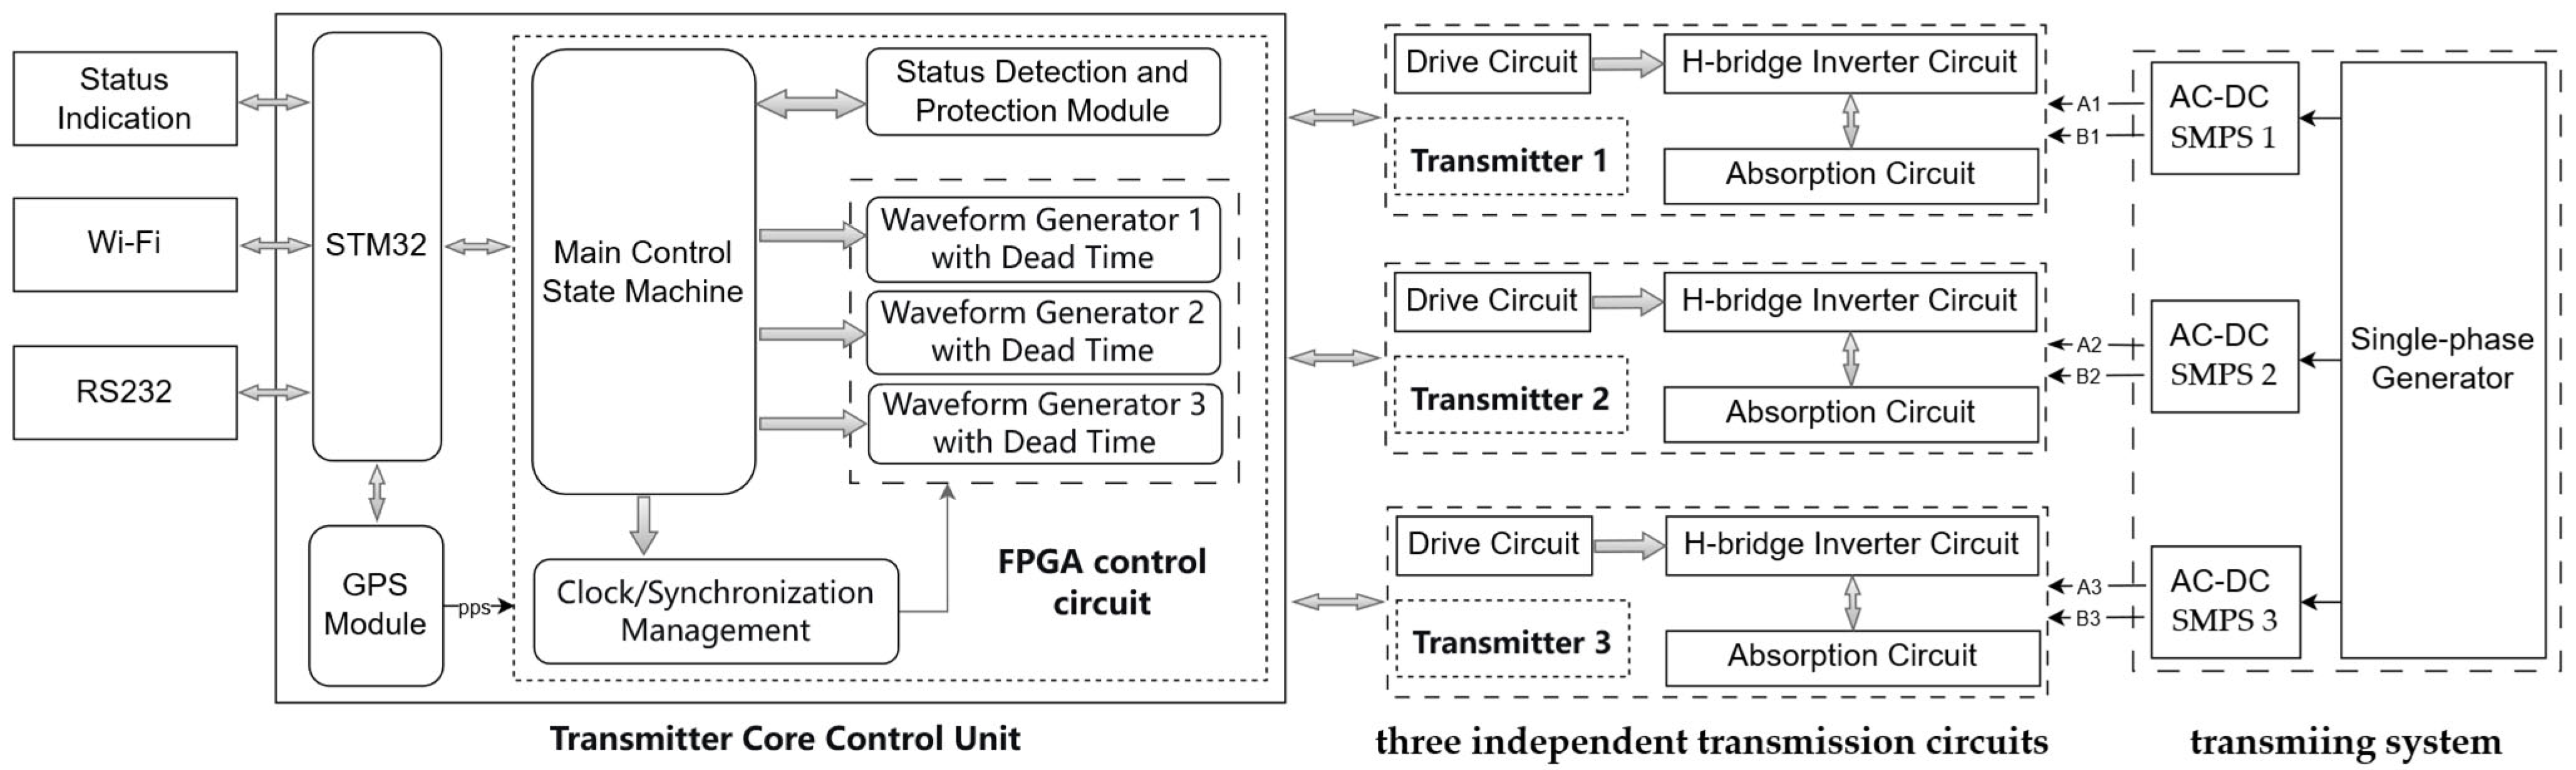
- The transmitter is controlled by the host software (version 1.0), with which the STM32 core controller interacts via RS232 or Wi-Fi. The selection of the STM32 as the primary control chip is based on its robust processing performance and extensive peripheral interface resources, enabling it to simultaneously manage the operation of communication protocol stacks and the precise execution of real-time control tasks. The primary responsibilities of the STM32 are as follows:
- Waveform and Parameter Control: It receives and parses waveform control parameters (such as square wave selection and transmission frequencies for each channel) and transmits them to the FPGA via the SPI interface.
- High-Precision GPS Synchronization: It parses the serial data from the GPS module to obtain the lock status and timing information, which is then transmitted back to the host software in real-time. One second prior to the scheduled synchronization time, the STM32 outputs a synchronization signal to trigger the FPGA to generate precise waveform control signals.
- Status Monitoring and Interaction: It retrieves status data from the FPGA through the SPI interface and drives LED indicators via GPIO to provide a real-time display of the system status.
- (2)
- To achieve synchronization of the three-channel drive signals and ensure a rapid response to high-voltage faults, the system employs an FPGA as the core controller. Its parallel data stream processing mechanism enables the simultaneous generation of multi-channel signals and status monitoring within the same clock cycle. Combined with programmable timing logic, this ensures the output stability and operational safety of the transmitter. Its core functions can be summarized into the following four parts:
- Communication and Command Parsing: The main control state machine interacts with the STM32 via the SPI interface to parse the frequency and waveform parameters for each transmission source while returning system status in real-time.
- Precision Drive Generation: The main control state machine drives the square wave generator to output the target waveforms. These waveforms are processed by a dead-time module to provide drive pulses with safety protection intervals for the IGBTs.
- Multidimensional Monitoring and Protection: The status detection and protection module monitors overvoltage, overcurrent, and over-temperature signals in real-time, triggering protection mechanisms to ensure the safety of the power circuitry.
- Clock and Synchronization Management: It contains a synchronization control module and a DCM clock management module. The synchronization control module calibrates the time base of the drive waveforms based on the 1PPS signal to meet the requirements for transceiver synchronization. The DCM module handles clock synthesis and domain synchronization, enhancing system operational stability through frequency synthesis technology.
- (3)
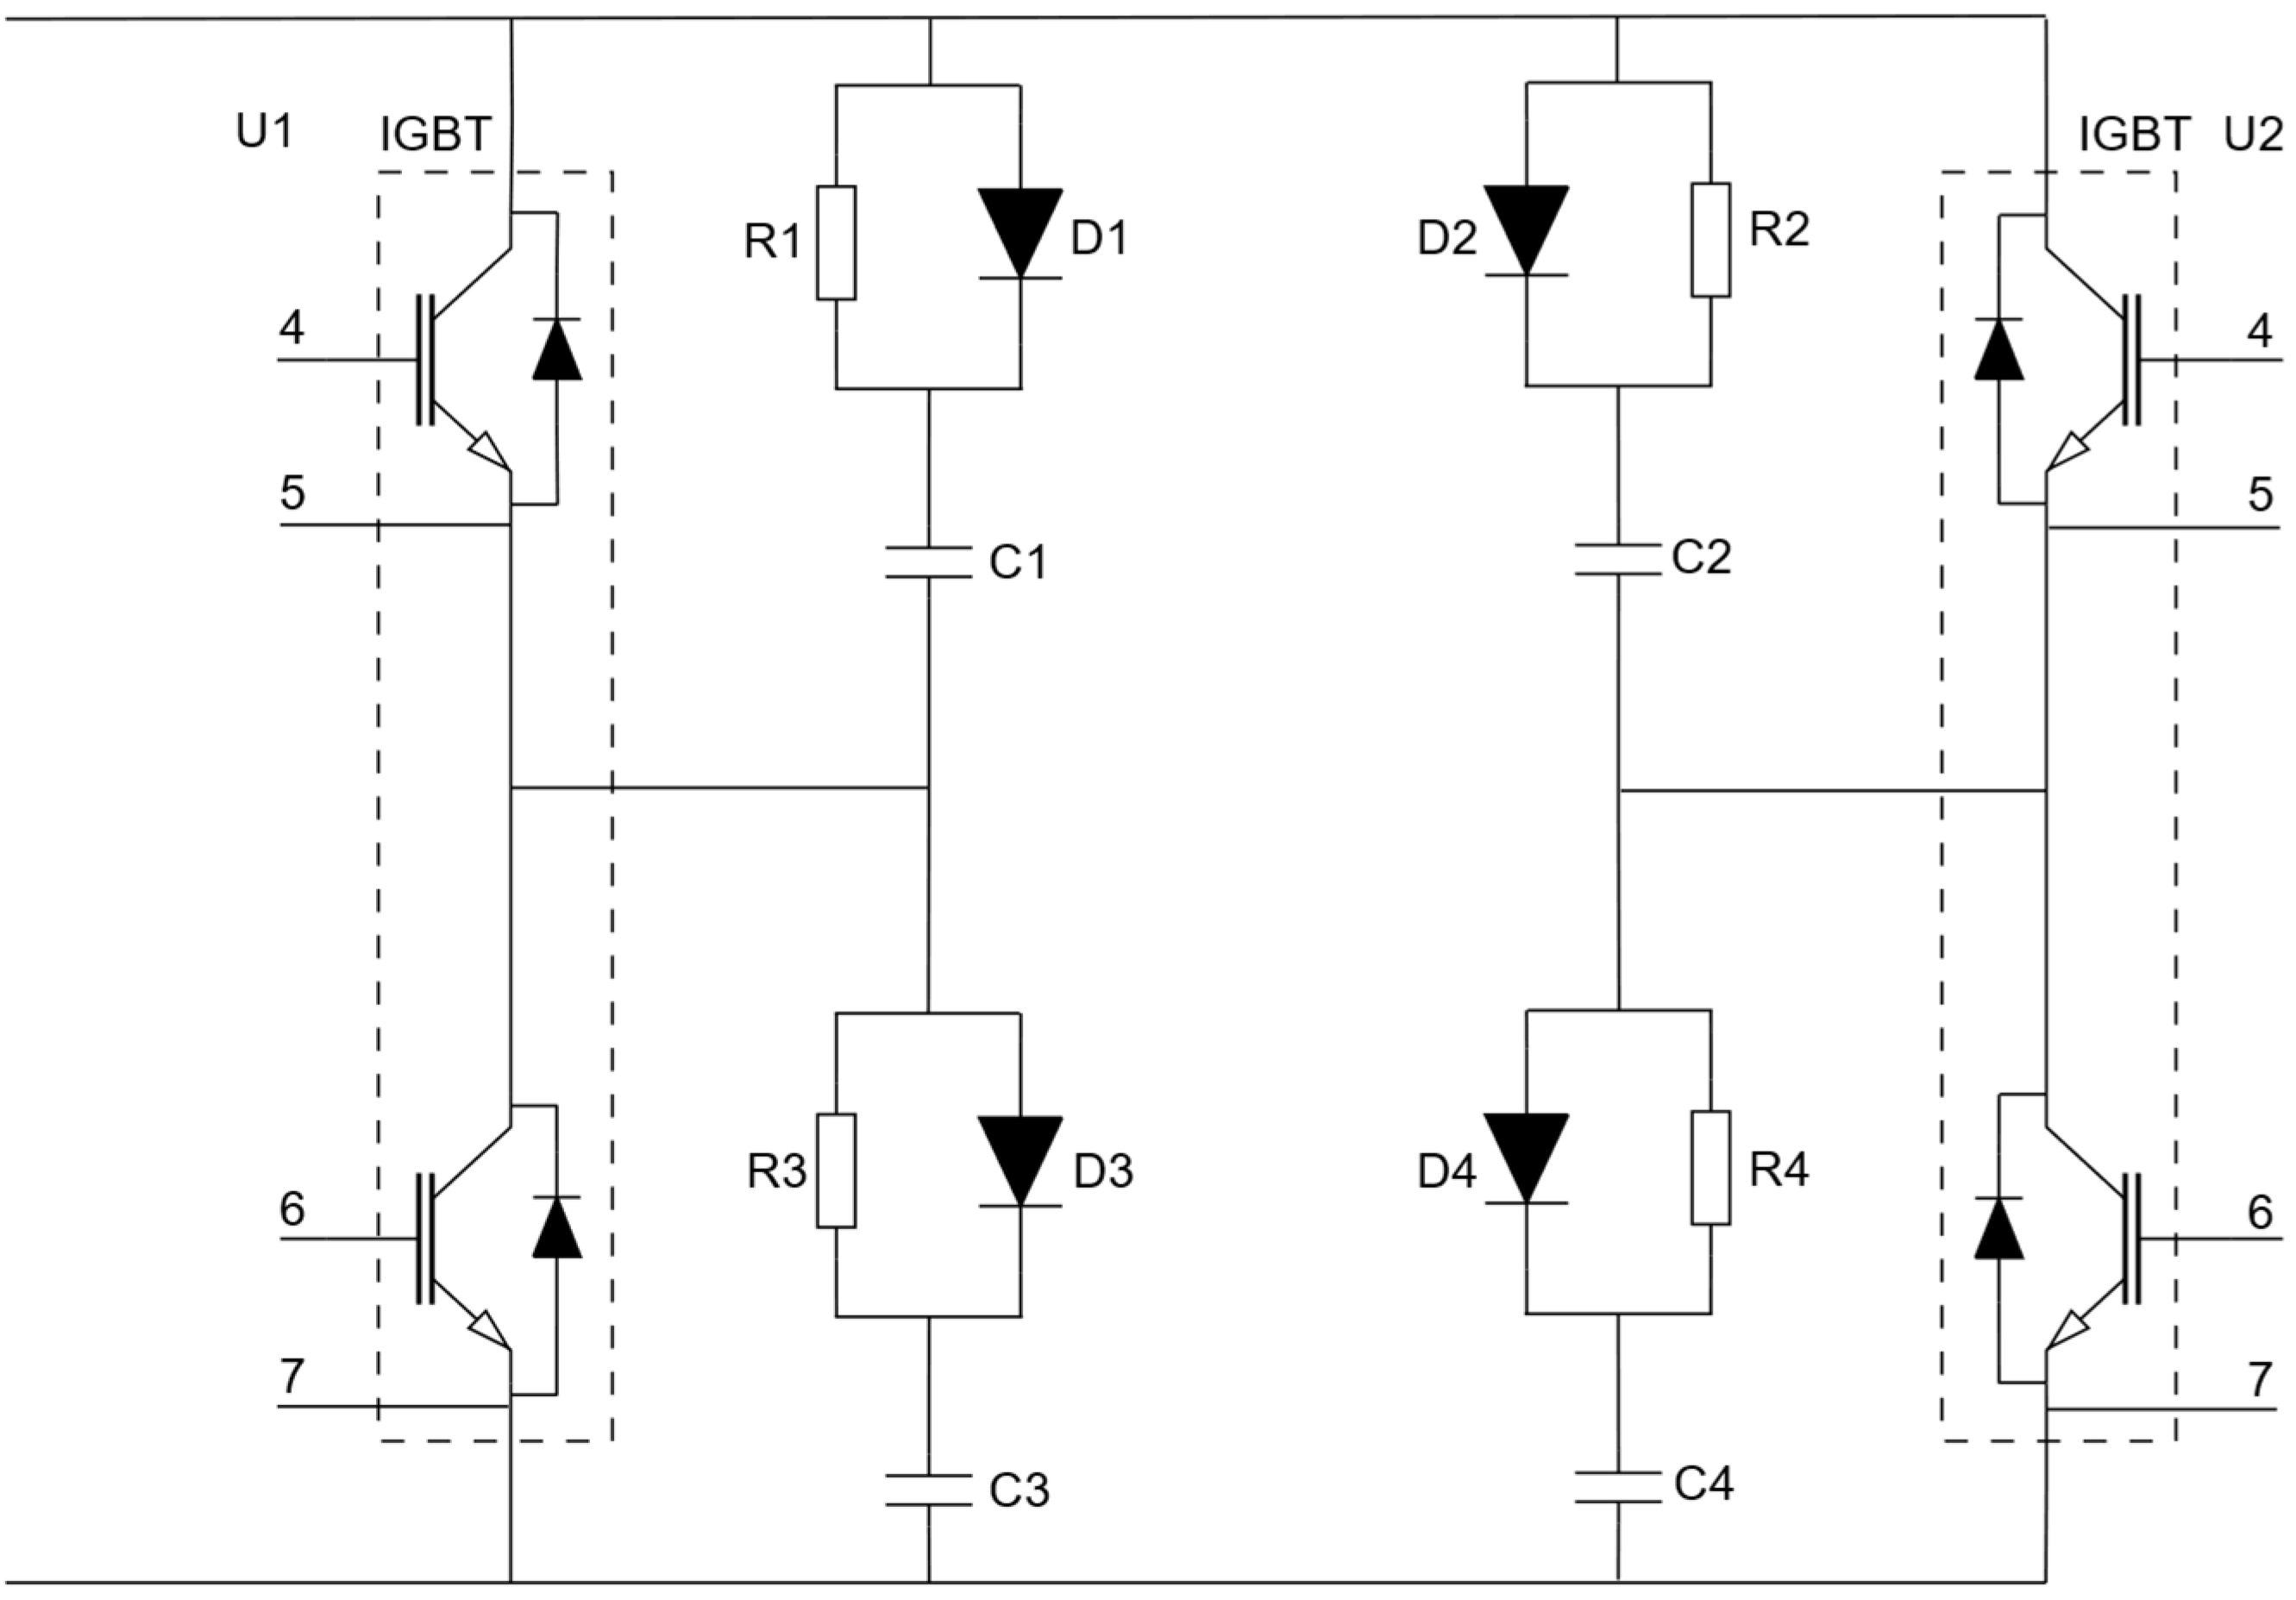
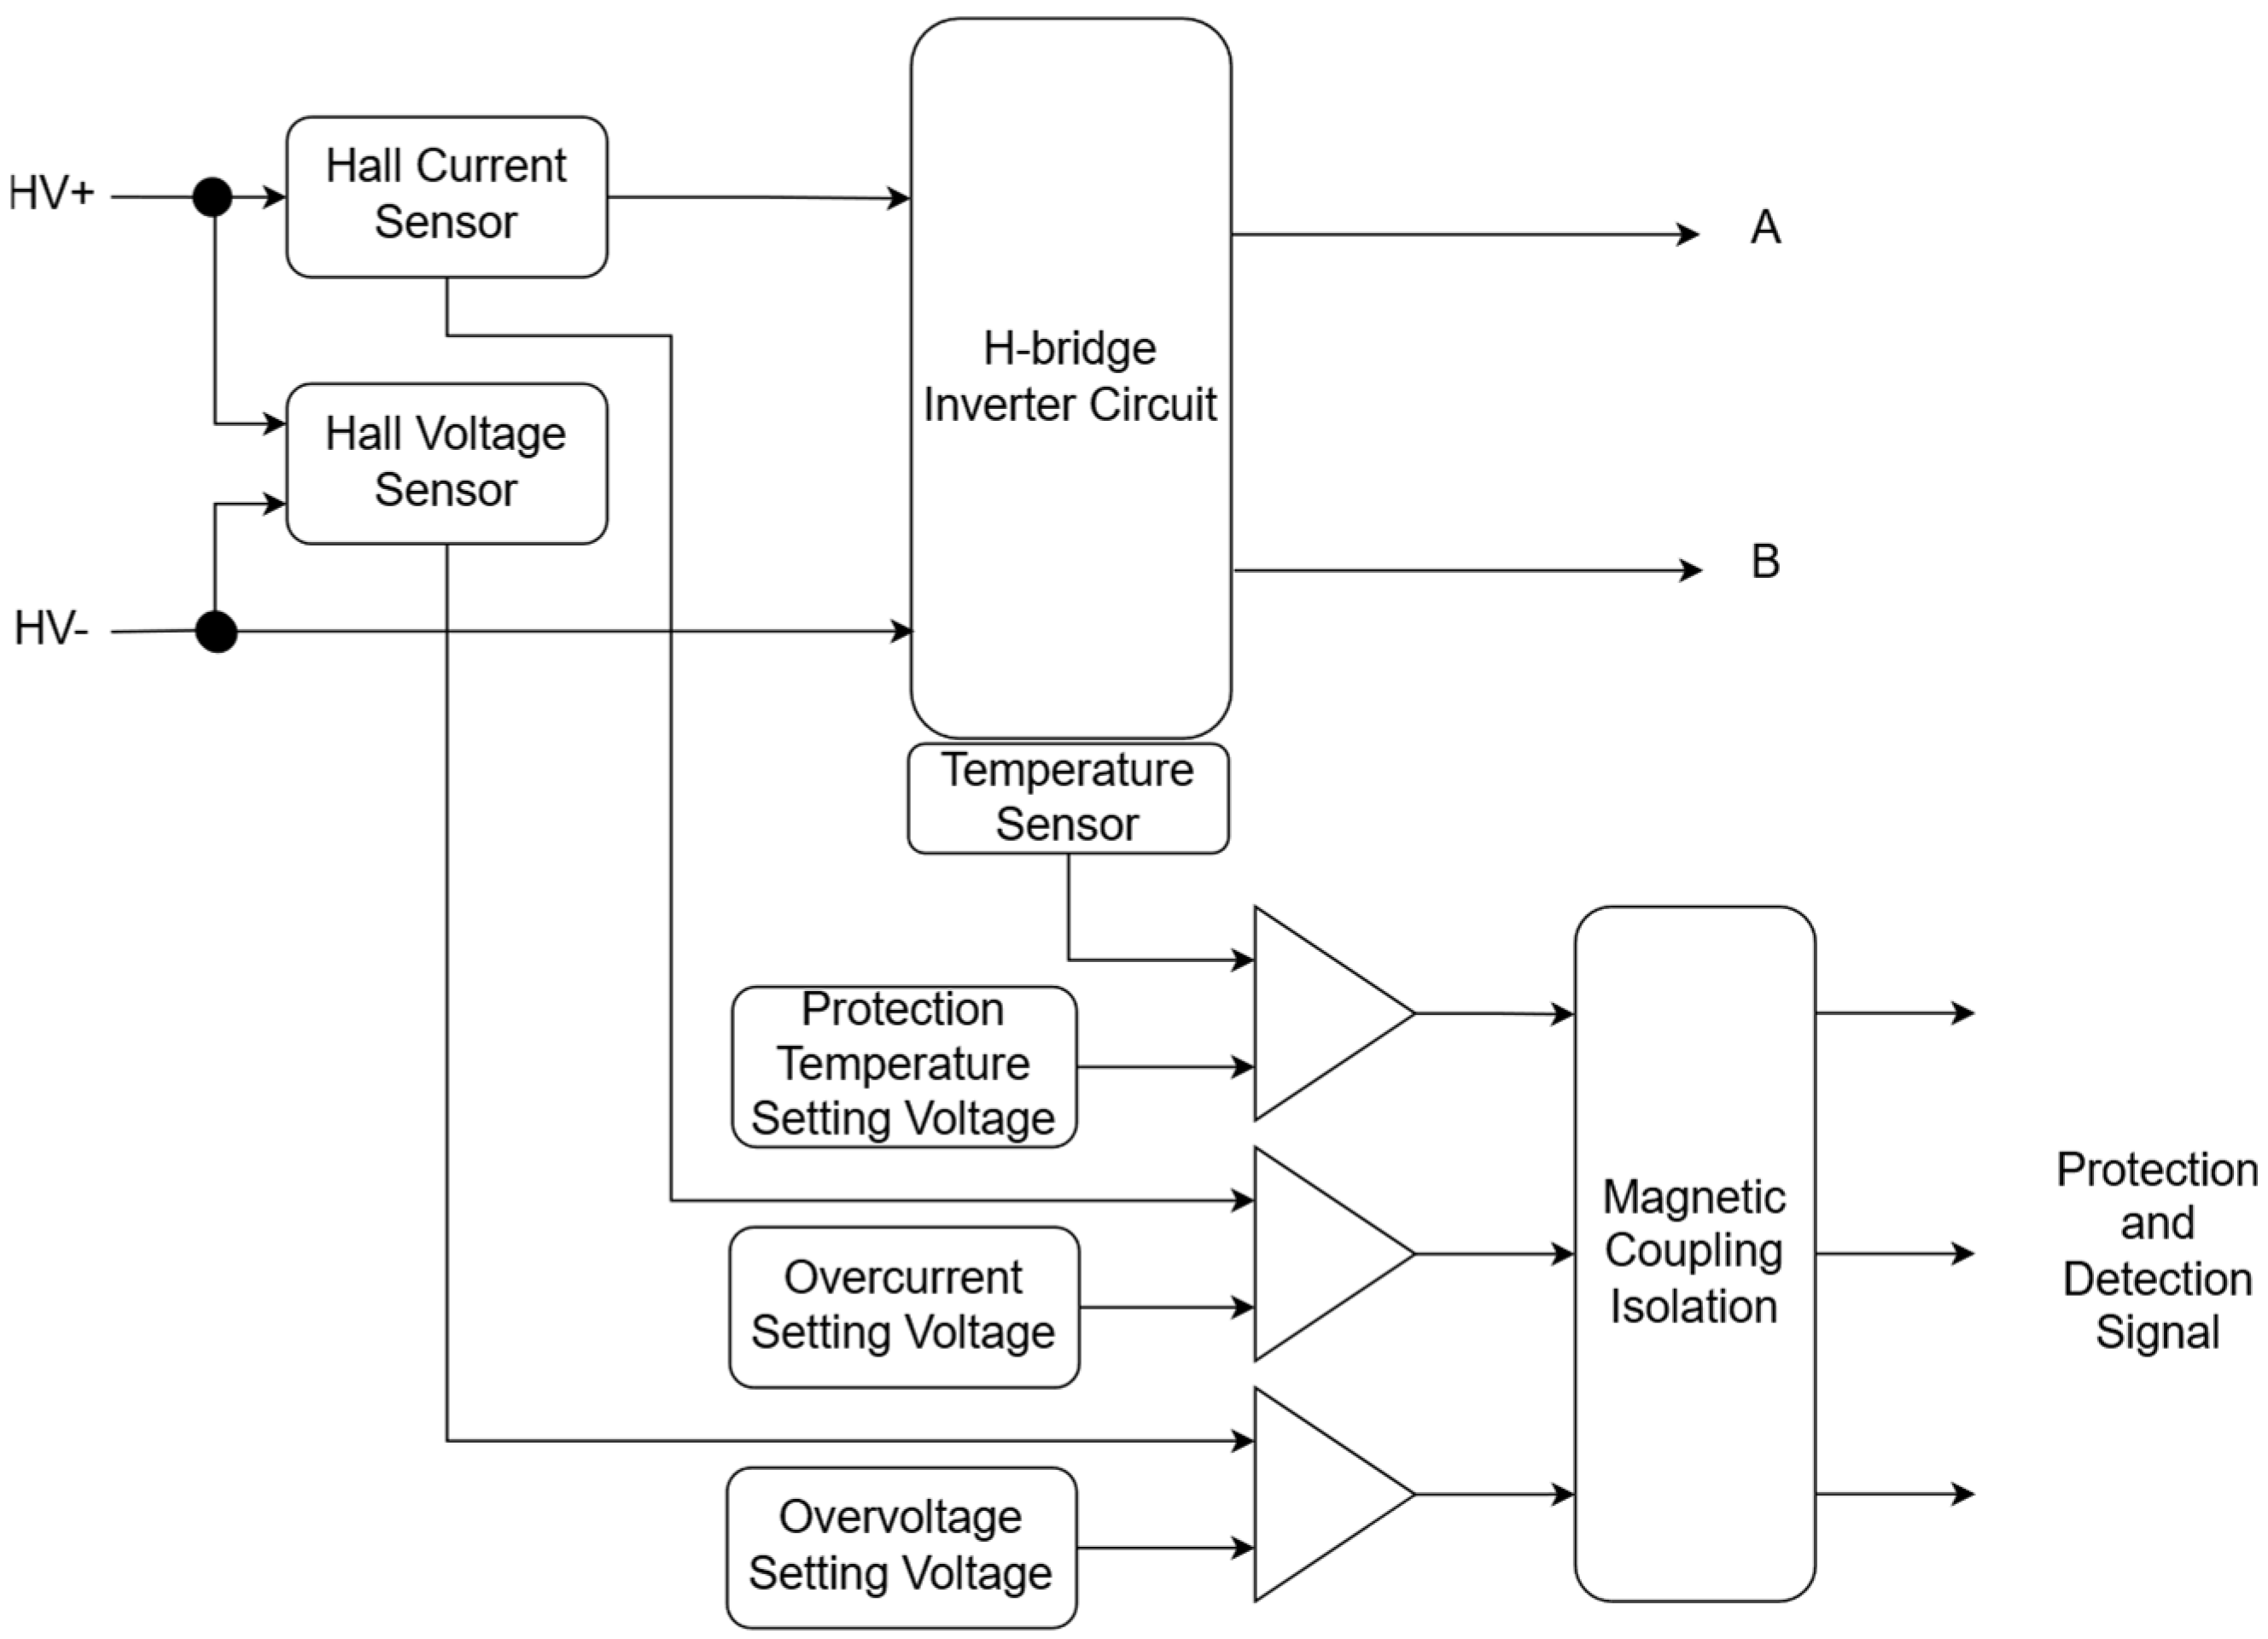
- Three-Channel Transmission Circuits: The synchronous drive signals generated by the FPGA are fed into three parallel transmission channels. Each channel comprises a gate drive circuit, an H-bridge inverter circuit, and a snubber circuit. The H-bridge inverter utilizes robust IGBT modules to modulate high-voltage DC into AC square-wave signals at the target frequencies. The snubber circuit is designed to suppress voltage spikes generated when disconnecting inductive loads to a certain extent. Finally, the AC excitation signals of various frequencies are synchronously injected into the subsurface through the corresponding power electrode pairs (A1–B1, A2–B2, A3–B3).
2.3.2. H-Bridge Inverter Circuit and Absorption Circuit
2.3.3. Protection and Detection Circuit
2.3.4. Transmitter Specifications
2.4. Receiver Hardware Architecture
- (1)
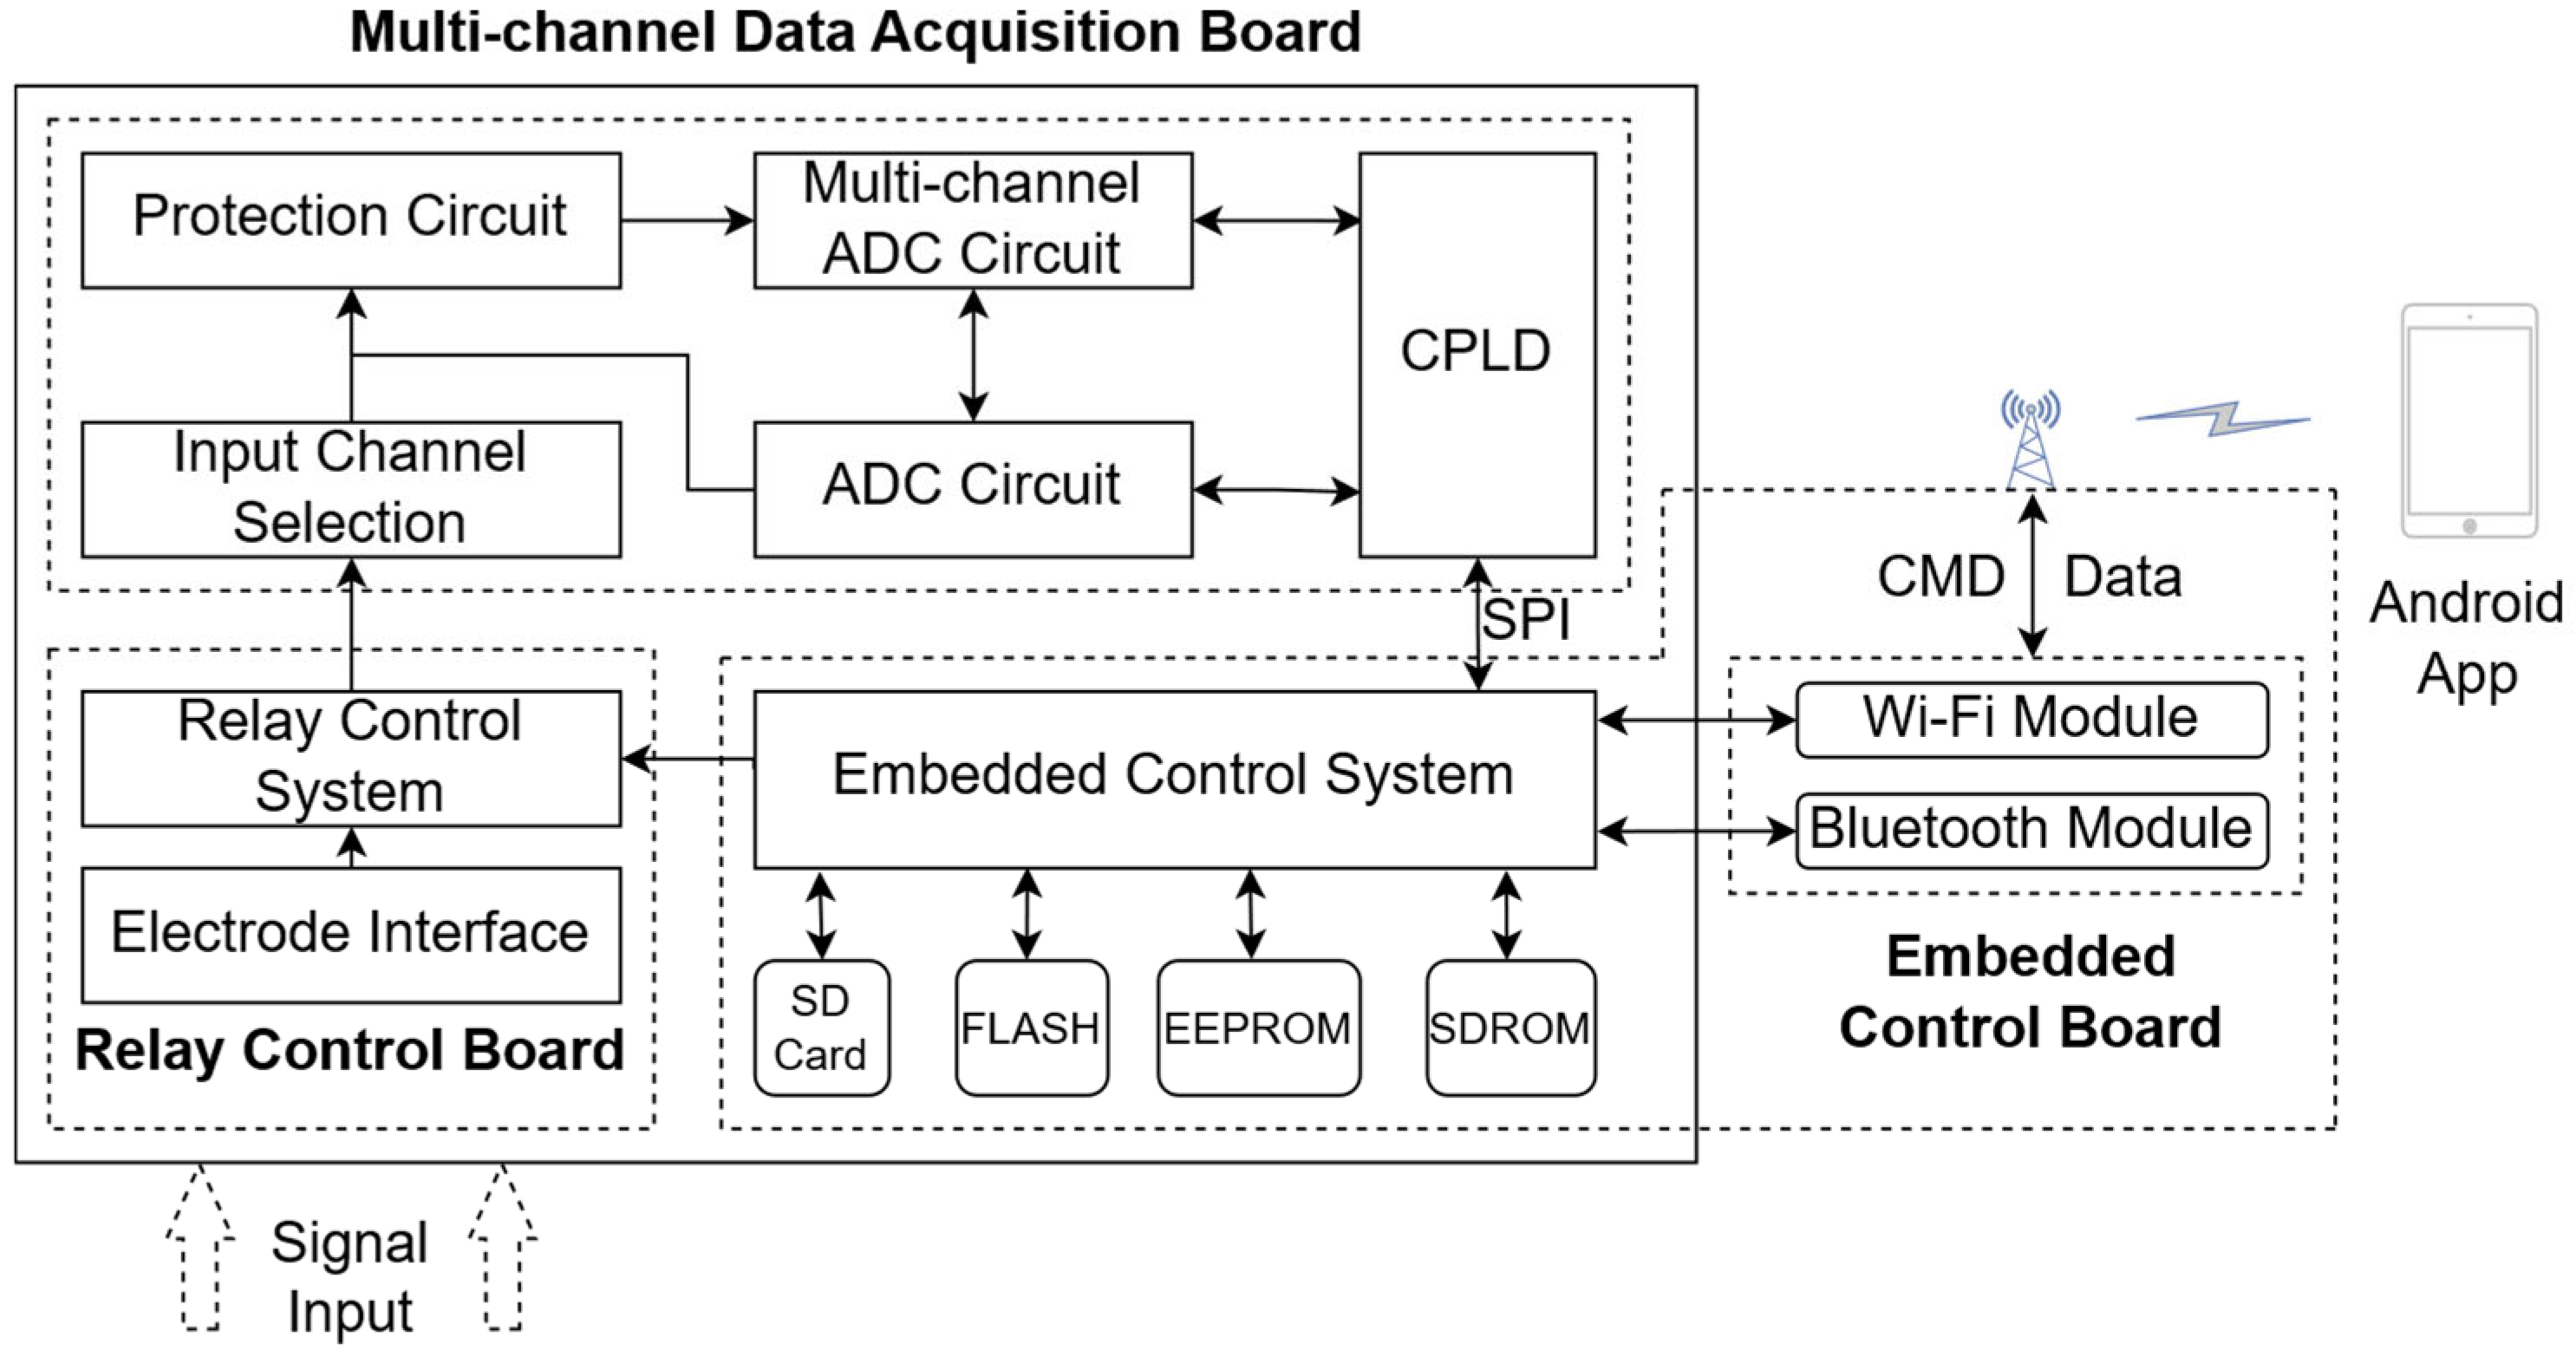
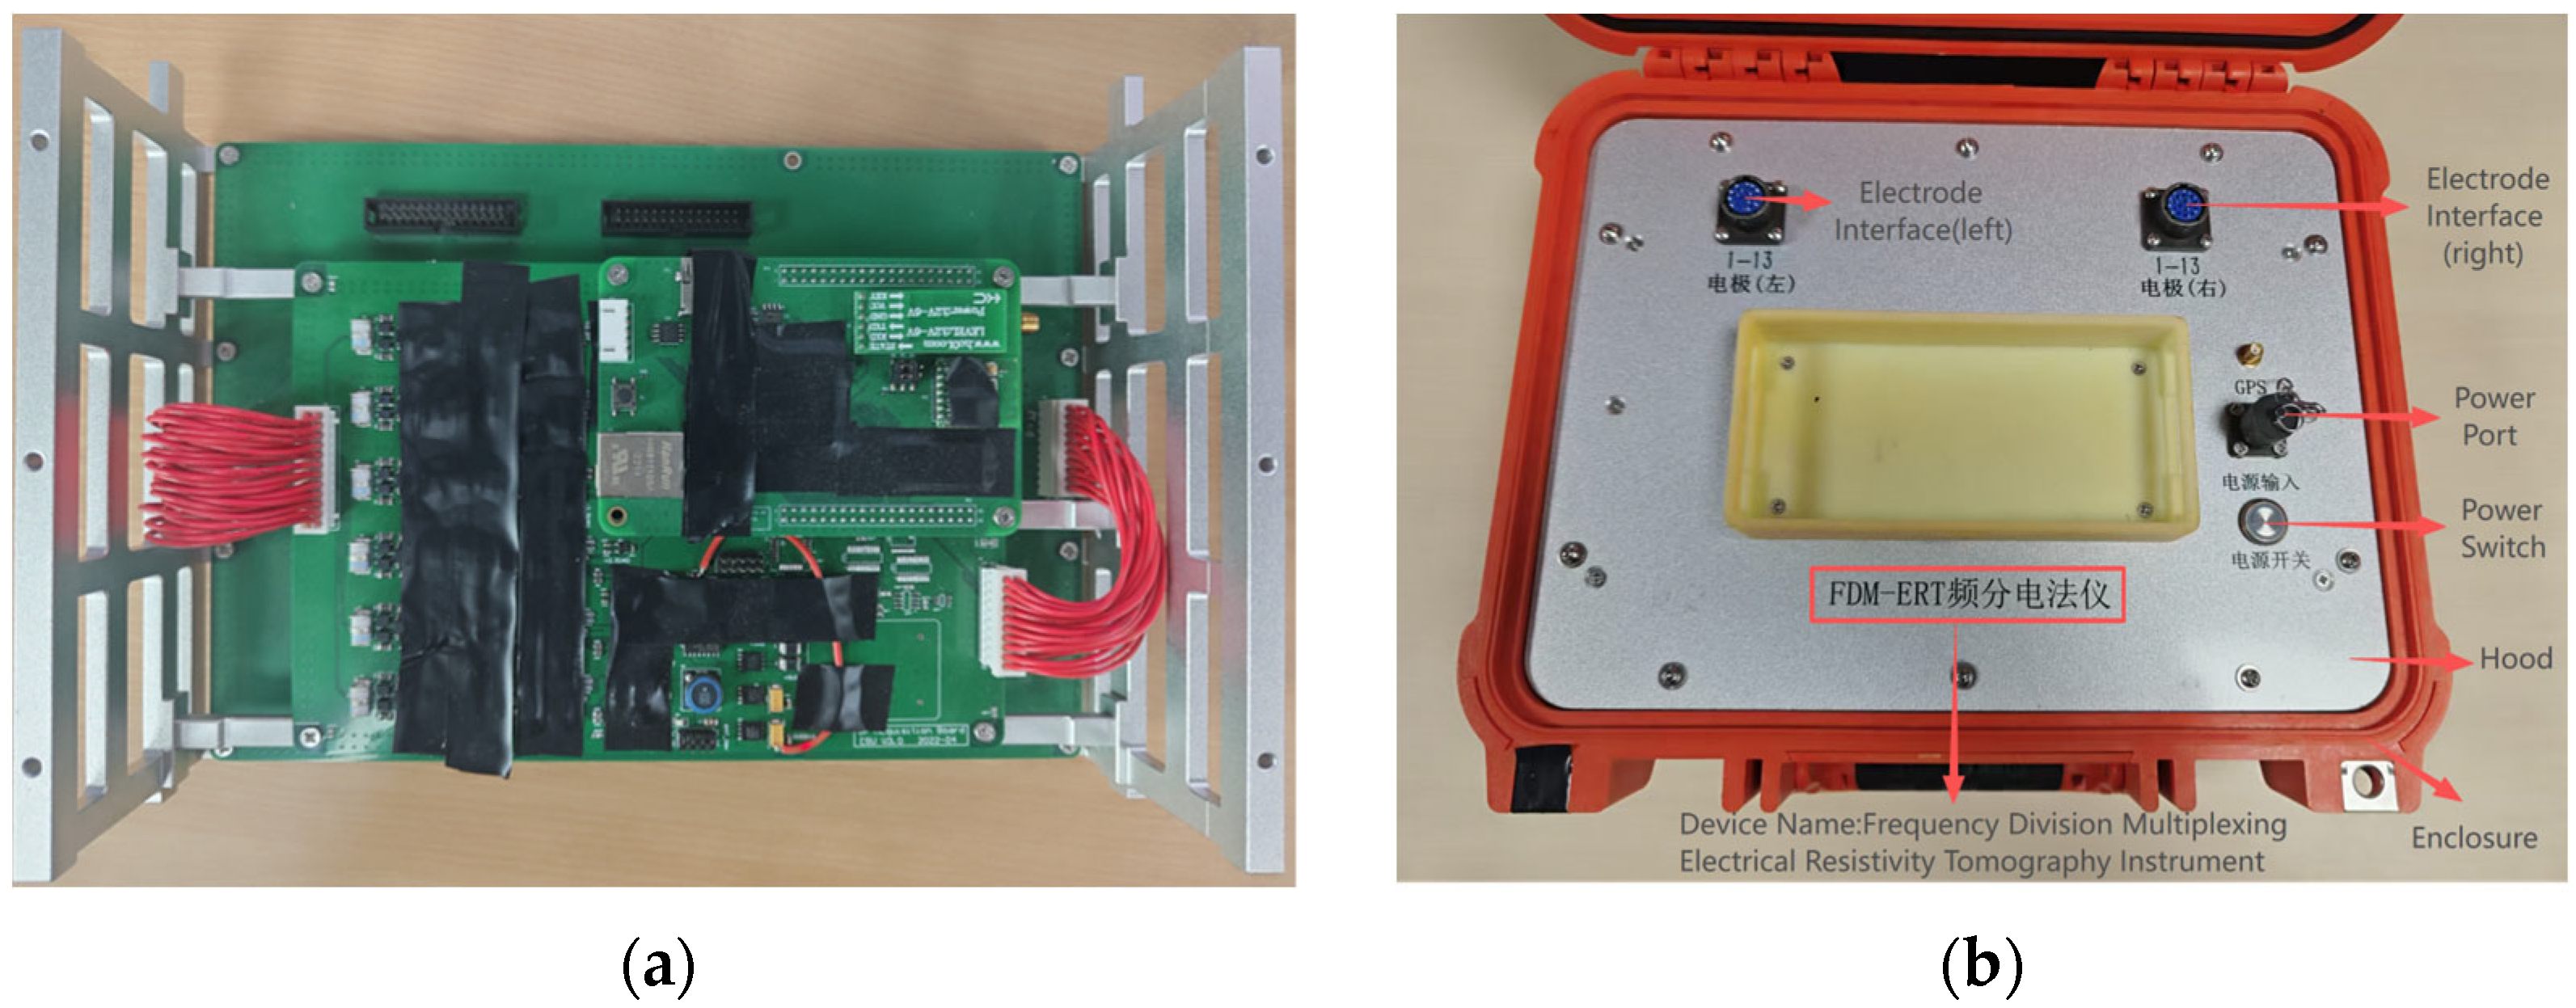
- Relay Control Board (Channel Switching): A single receiver is capable of connecting 25 measurement electrodes, thereby forming 24 channels for measurement. Prior to data acquisition, the embedded system manages the relay array to select 6 channels from the 24 available analog signals, which serve as input signals for the subsequent parallel acquisition unit.
- (2)
- Multi-channel Data Acquisition Board (Signal Processing): To meet the requirements for real-time performance and flexibility in multi-channel synchronous acquisition and preprocessing, this module adopts the Lattice MachXO2 series CPLD as its core. Leveraging its flexible programmable I/Os, low-latency parallel processing capabilities, and integrated on-chip memory and PLL resources, the CPLD executes preprocessing tasks such as parallel sampling and buffering of multi-channel data. Simultaneously, it facilitates data interaction with the embedded control board via the SPI bus protocol.
- (3)
- Embedded Control Board (Main Control Hub): Serving as the communication core that connects the lower-layer acquisition hardware with the Android mobile terminal, its primary functions include:
- Receiving and parsing configuration parameters and acquisition instructions from the Android terminal involves issuing control signals to the data acquisition module. This process ensures that the data acquisition module operates efficiently and accurately, facilitating the collection of necessary data for analysis.
- Data management involves receiving monitoring data uploaded by the acquisition module. This process includes sequentially performing frame header verification, data buffering, local SD card storage, and protocol encapsulation. Ultimately, the data is transmitted back to the Android terminal in real time.

2.4.1. Data Acquisition System Design
- (1)
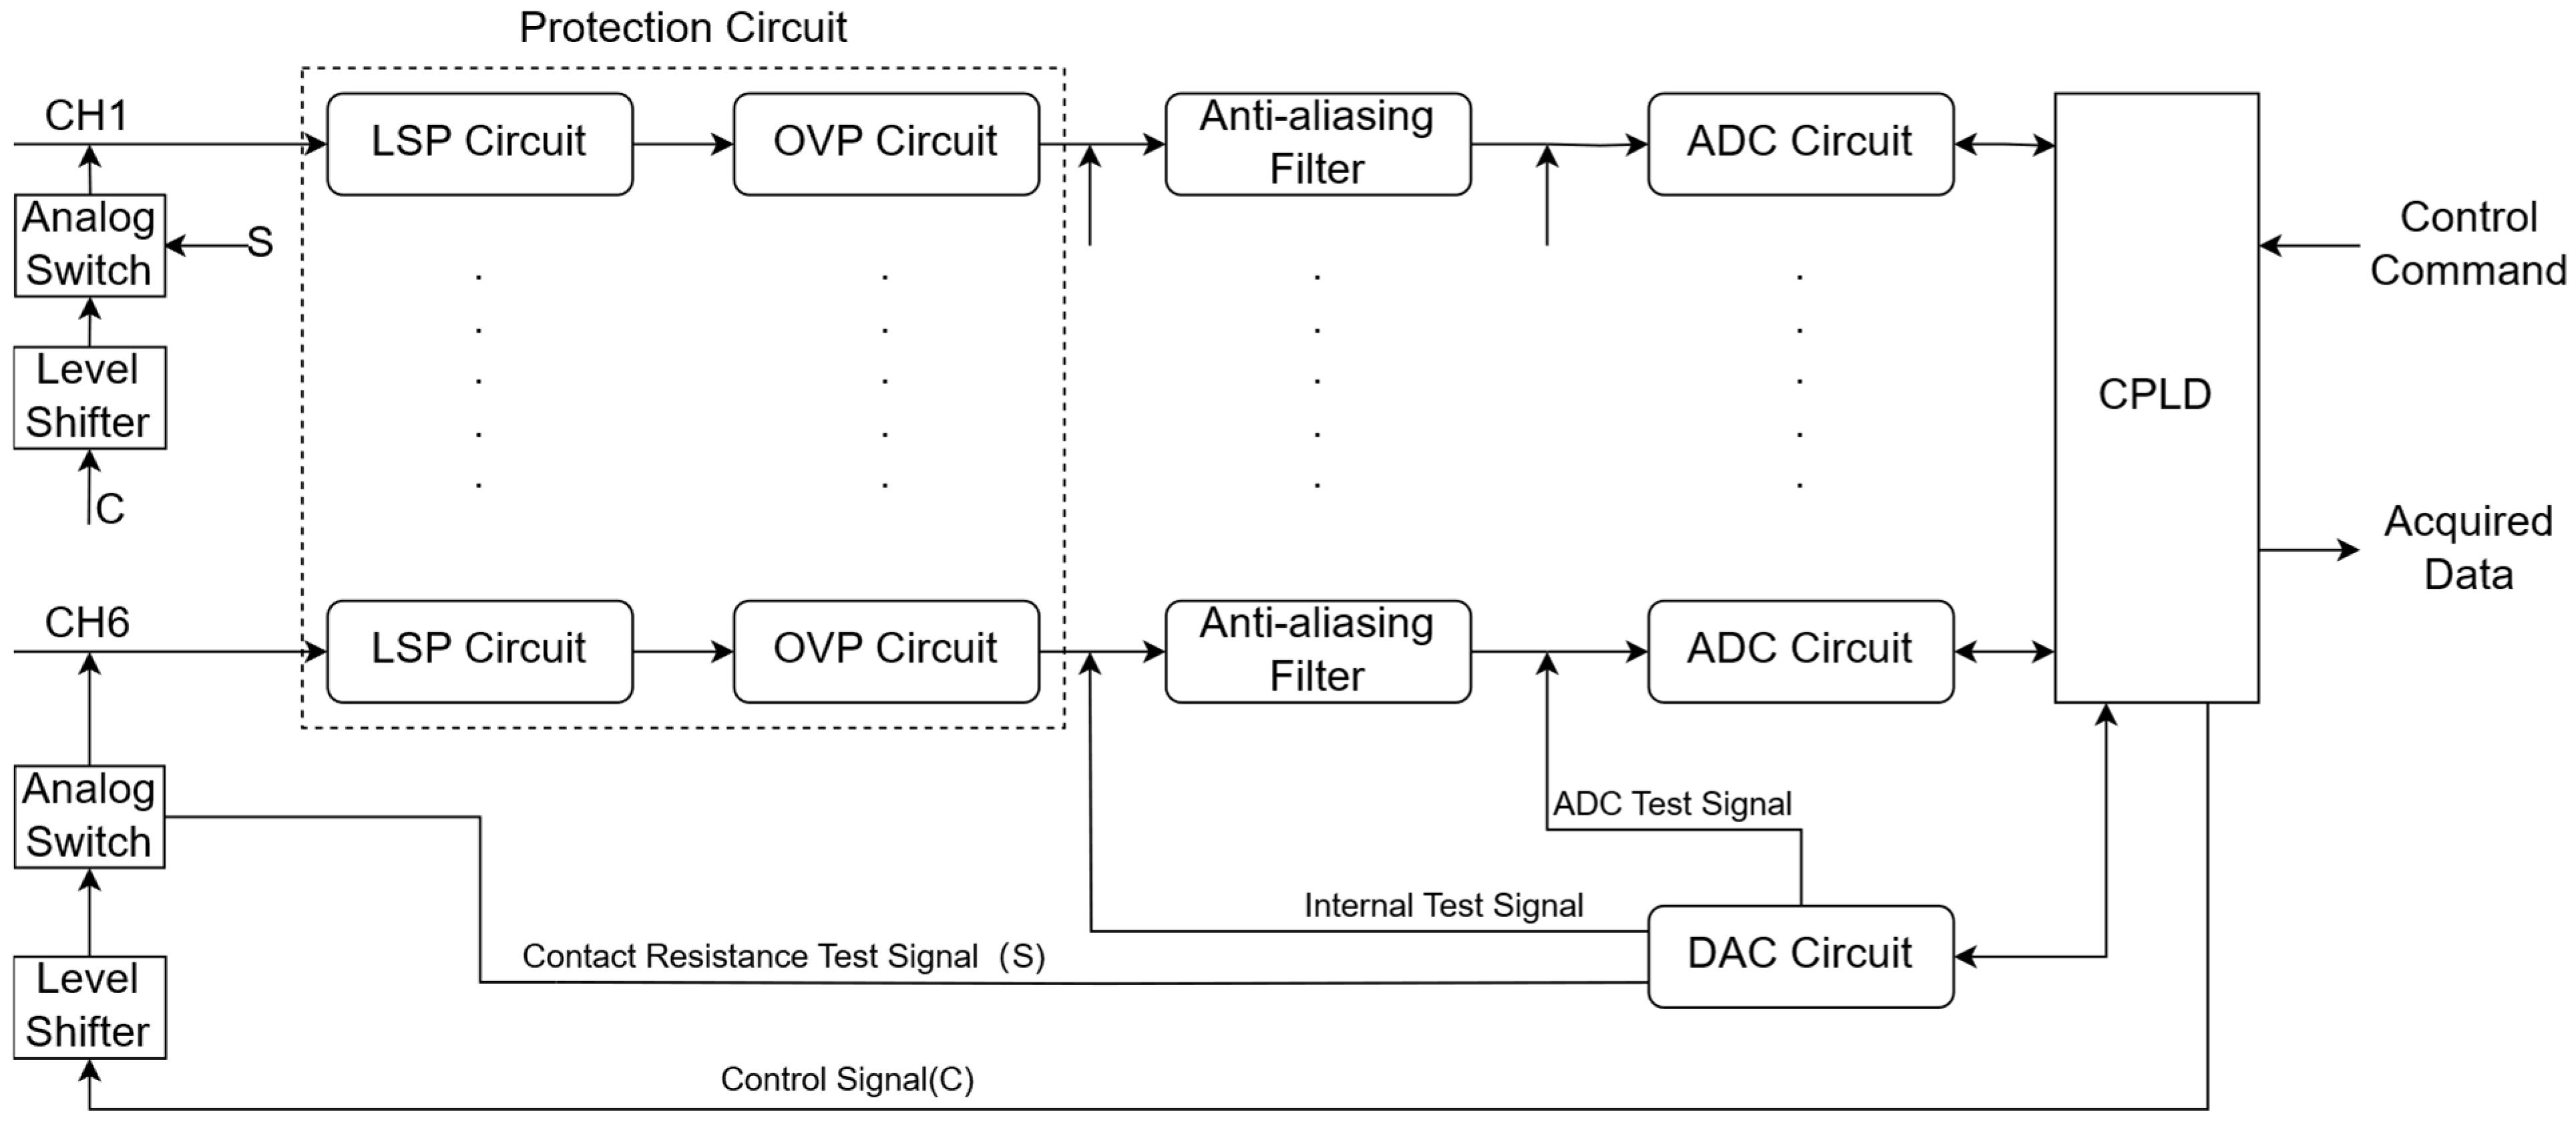
- Protection Circuit: Considering the energy levels of transient overvoltages and the requirements for response speed, a Gas Discharge Tube (GDT) is selected to handle the primary discharge of high-current surges. Complementing this, a Transient Voltage Suppressor (TVS) diode is responsible for the rapid suppression of residual voltage and electrostatic pulses. Together, they construct a multi-stage protection scheme capable of quickly discharging transient overvoltages caused by lightning or static electricity, thereby effectively suppressing surge impacts.
- (2)
- Anti-aliasing Filter: Based on the Nyquist sampling theorem, high-frequency components exceeding the folding frequency must be filtered out prior to analog-to-digital conversion to prevent aliasing distortion and ensure signal integrity. The anti-aliasing filter is selected for its sharp transition band and sufficient stopband attenuation, which strictly limit the input signal bandwidth to satisfy sampling requirements, thereby avoiding signal distortion caused by spectral overlapping.
- (3)
- ADC Circuit: FDM-ERT signals require high resolution to distinguish the minute potential differences across various frequency points. The ADS1282 not only provides 32-bit no-missing-code resolution, but its integrated low-noise Programmable Gain Amplifier (PGA) and sharp digital filters can effectively filter out out-of-band noise. This is crucial for ensuring the data purity of each frequency point during multi-frequency parallel acquisition.
- (4)
- DAC Circuit: Performs dual functions: (1) Self-test: Generates high-precision signals to calibrate the performance of the acquisition circuit. (2) Automated Contact Detection: Replaces manual measurement to enable rapid compliance verification of the contact resistance for each channel.
- (5)
- CPLD Circuit: The CPLD circuit functions as the core logic unit of the acquisition board, receiving instructions from the embedded control board and synchronously driving six ADCs to perform parallel sampling.
2.4.2. Embedded Control Board Design
- (1)
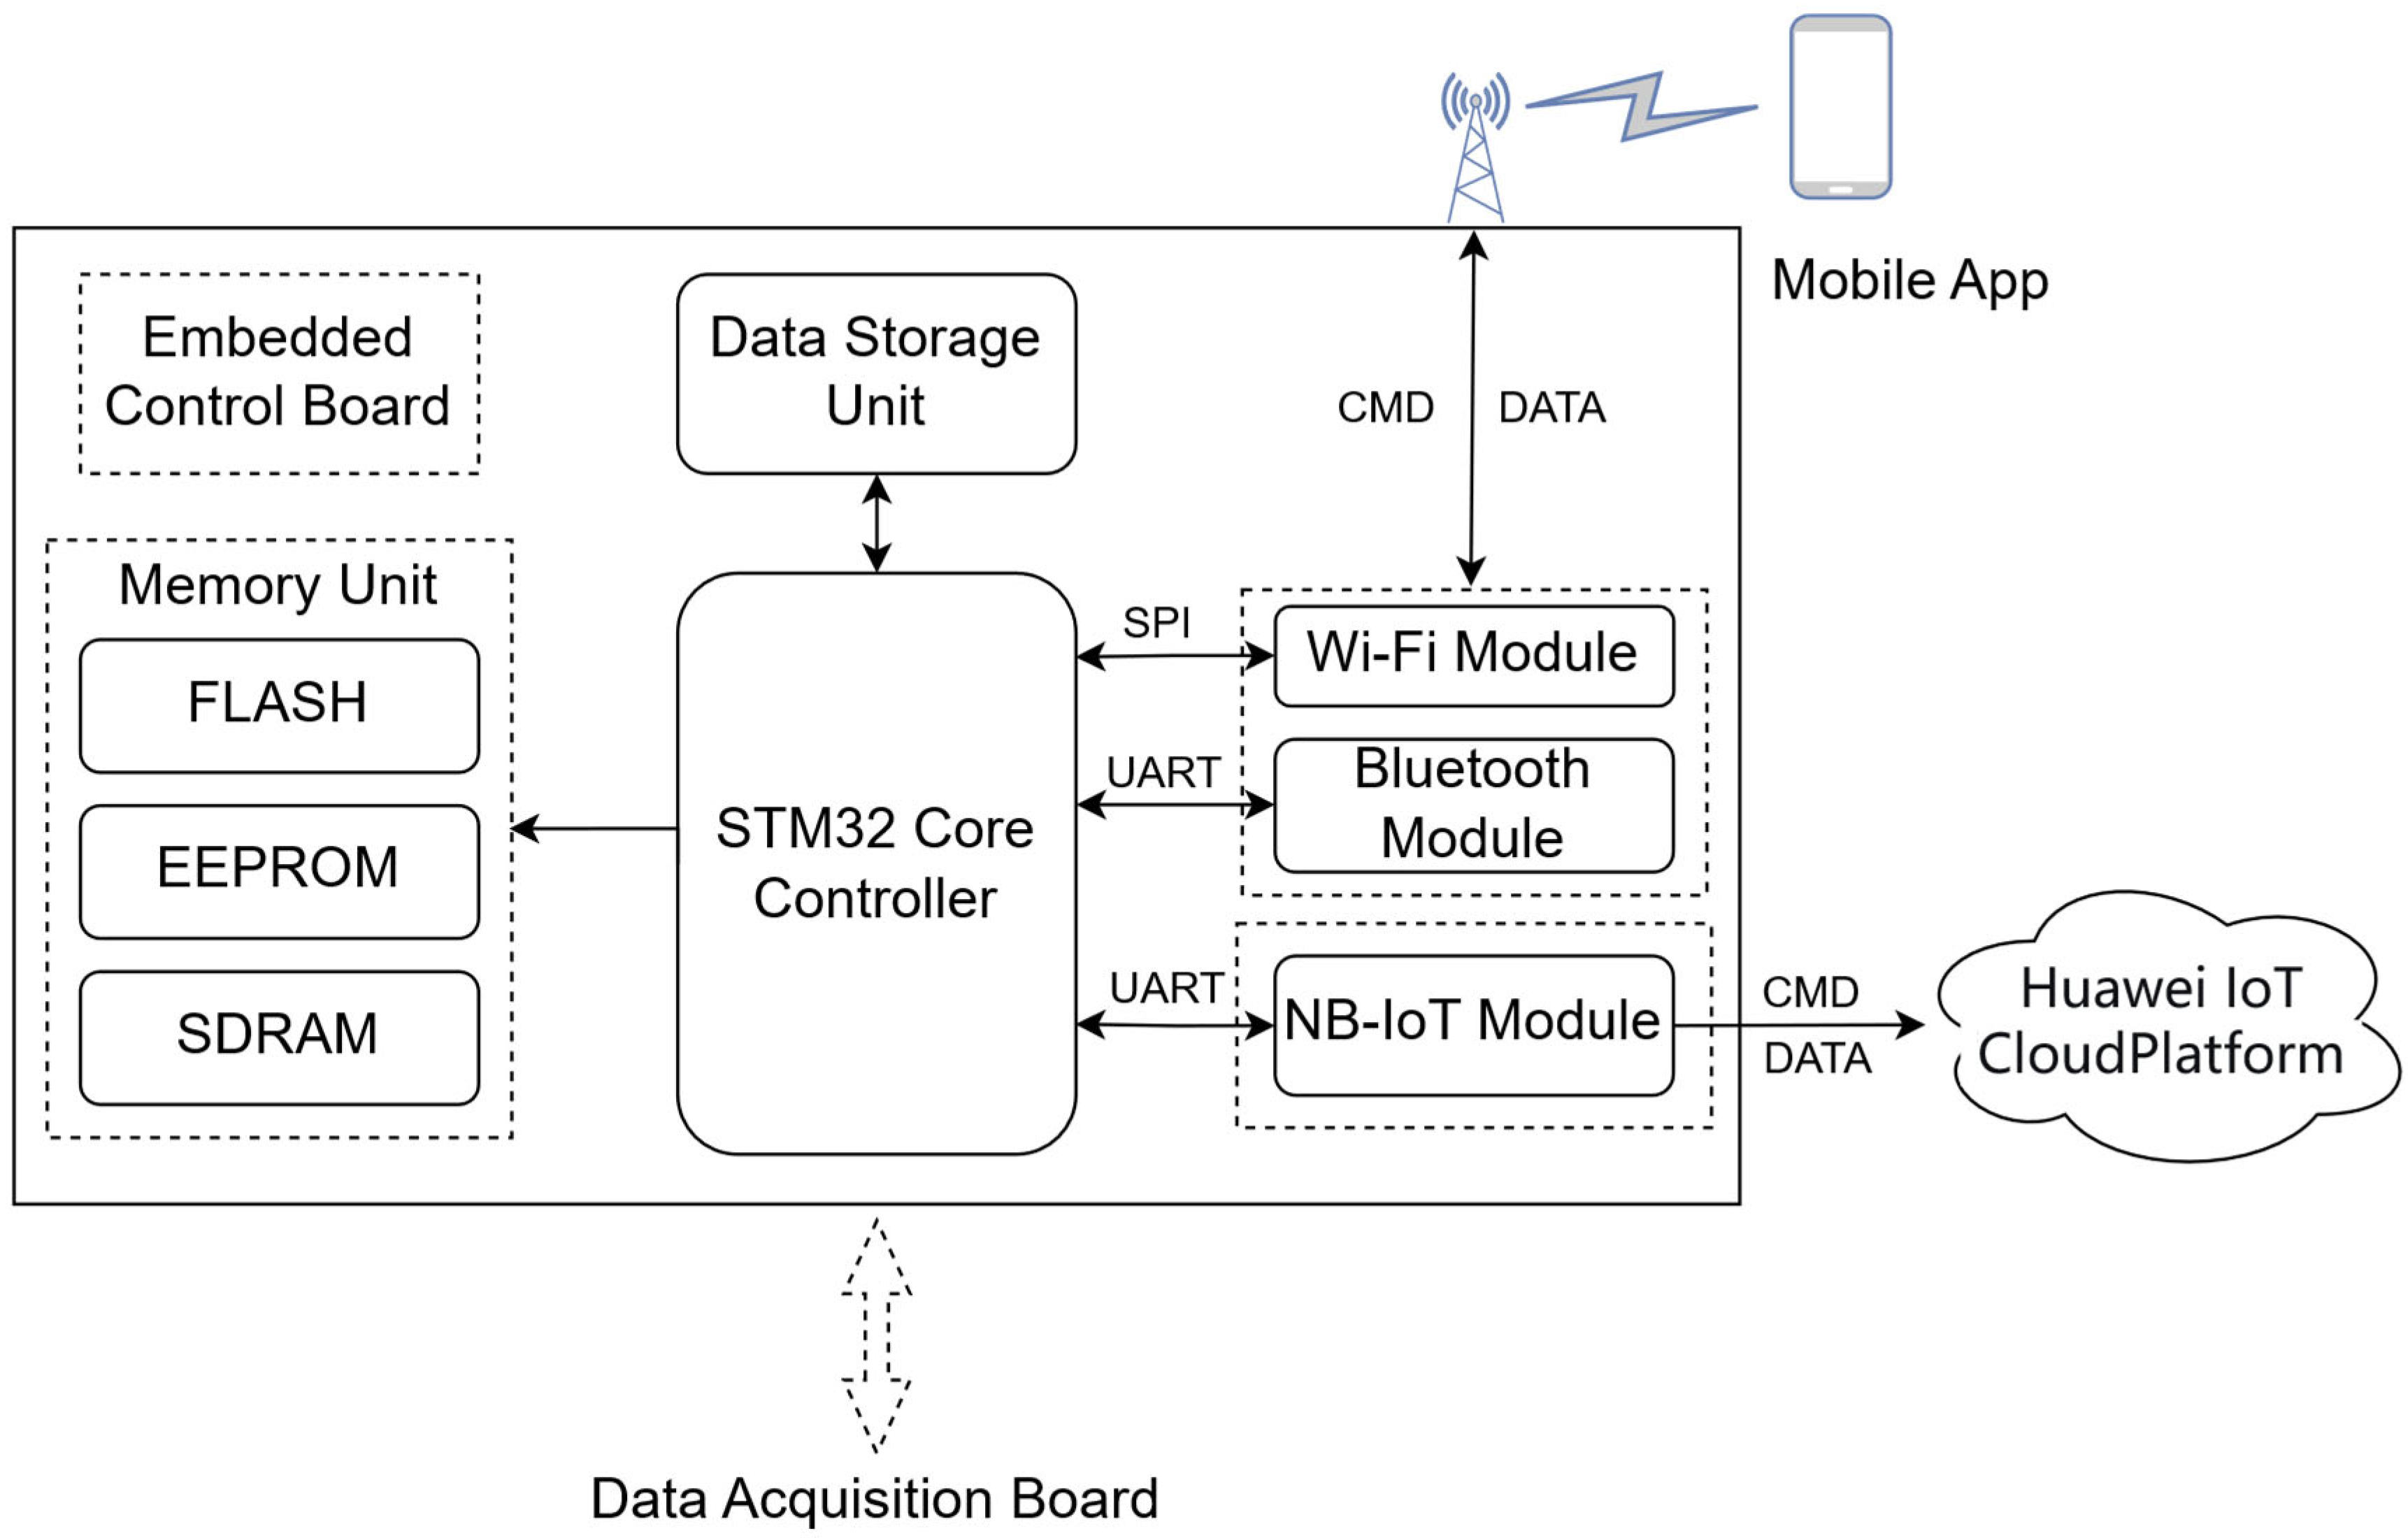
- STM32 Core Controller: A high-performance, low-power STM32F429 microcontroller, manufactured by STMicroelectronics (Geneva, Switzerland), is selected as the control core of the embedded board. This series offers a balance of computational performance, extensive peripheral interface resources, and flexible power management modes. It efficiently coordinates multi-module tasks and satisfies real-time control requirements, taking primary responsibility for task scheduling, logic control, and data processing across the entire system.
- (2)
- Storage Unit: Utilizes an SD card as the non-volatile storage medium. Its characteristics of compact size, high capacity, and data retention meet the requirements for high-volume cyclic reading and writing of field acquisition data.
- (3)
- Memory Unit: Consists of FLASH, EEPROM, and SDRAM, which work synergistically to ensure the stable operation of the program and real-time data buffering.
- (4)
- Wireless Wi-Fi Communication Module: Considering that Wi-Fi offers high physical layer throughput and relatively extensive coverage, it is selected to address the high-speed transmission requirements for large volumes of data between the embedded system and the host software.
- (5)
- Wireless Bluetooth Communication Module: Leveraging the technical advantages of Bluetooth Low Energy (BLE) and rapid connection, this module establishes connectivity with mobile terminals to primarily facilitate the real-time interaction of control commands.
- (6)
- NB-IoT Module: It provides access to the Huawei Cloud IoT Platform through the NB-IoT network, enabling users to issue remote commands and retrieve data via 5G/4G networks on an Android client.
2.4.3. Receiver Specifications
2.5. Materials for Validation
- (1)
- Signal Generator: A Rigol DG1022U dual-channel arbitrary function generator (maximum output frequency: 25 MHz; sampling rate: 100 MSa/s) was employed to generate sinusoidal excitation signals for receiver testing.
- (2)
- Oscilloscope: A Tektronix TBS1202C digital storage oscilloscope was used (bandwidth: 200 MHz; 2 analog channels; sampling rate: 1 GS/s; rise time: 1.75 ns; vertical resolution: 8-bit).
- (3)
- Resistors and Capacitors: In the resistive voltage divider tests, six 1 kΩ metal film resistors (UNI-ROYAL, ±1% precision) were connected in series. For the RC model tests, six parallel RC units were constructed using 1 kΩ metal film resistors (same model as above) and 10 μF capacitors (Dersonic, ±10% tolerance).
- (4)
- Data Acquisition: All voltage measurements were performed using the FDM-ERT receiver prototype. The cutoff frequency of the hardware anti-aliasing filter was set to 20 Hz. The sampling rate was fixed at 250 Hz, and the internal Programmable Gain Amplifier (PGA) of the 32-bit ADS1282 ADC was uniformly configured with a gain of 1. Acquired data were transmitted via Wi-Fi to an Android device and simultaneously stored on an SD card.
- (5)
- Current Measurement: In the transmitter tests, the output current was sensed by a GSTI-HS0010 Hall-effect current sensor (sensitivity: 62.5 mV/A). The sensor output was recorded by an independent current acquisition station and transmitted wirelessly to the Android terminal.
3. Methodology
3.1. Laboratory Calibration Protocol
3.1.1. Transmitter Test Scheme
3.1.2. Receiver Test Scheme
- (1)
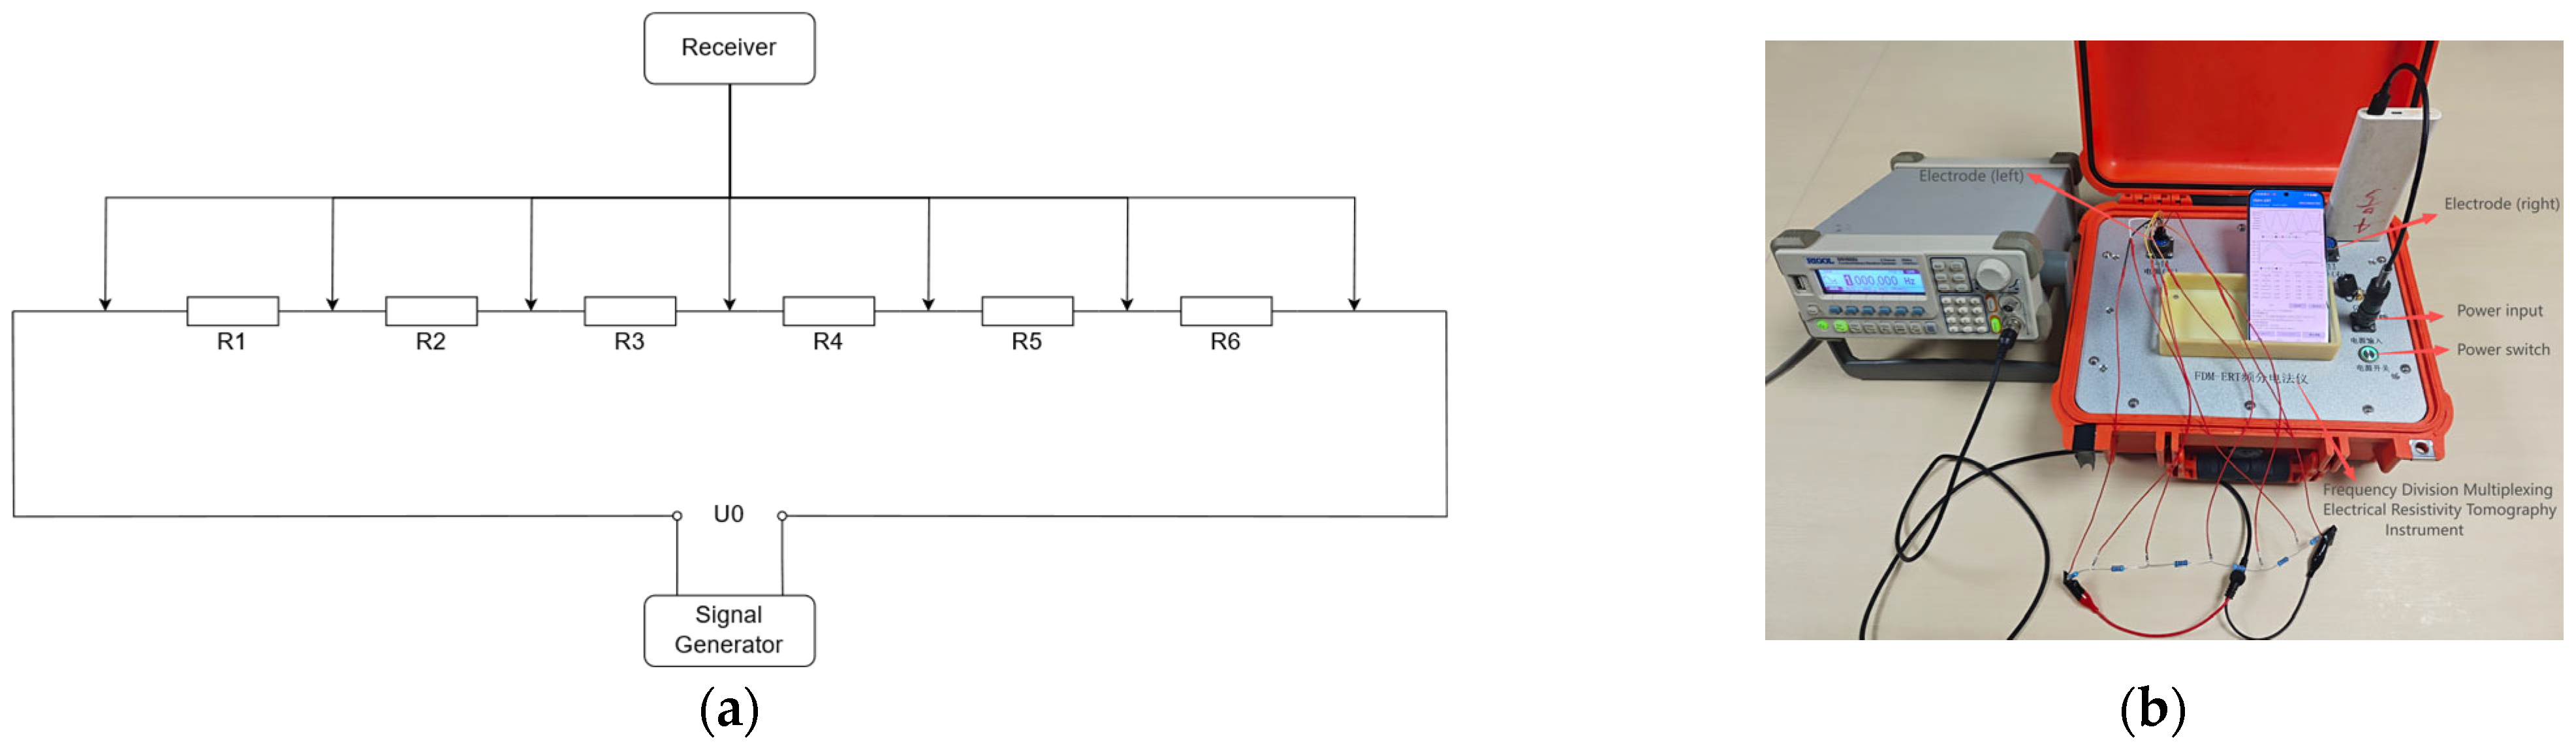
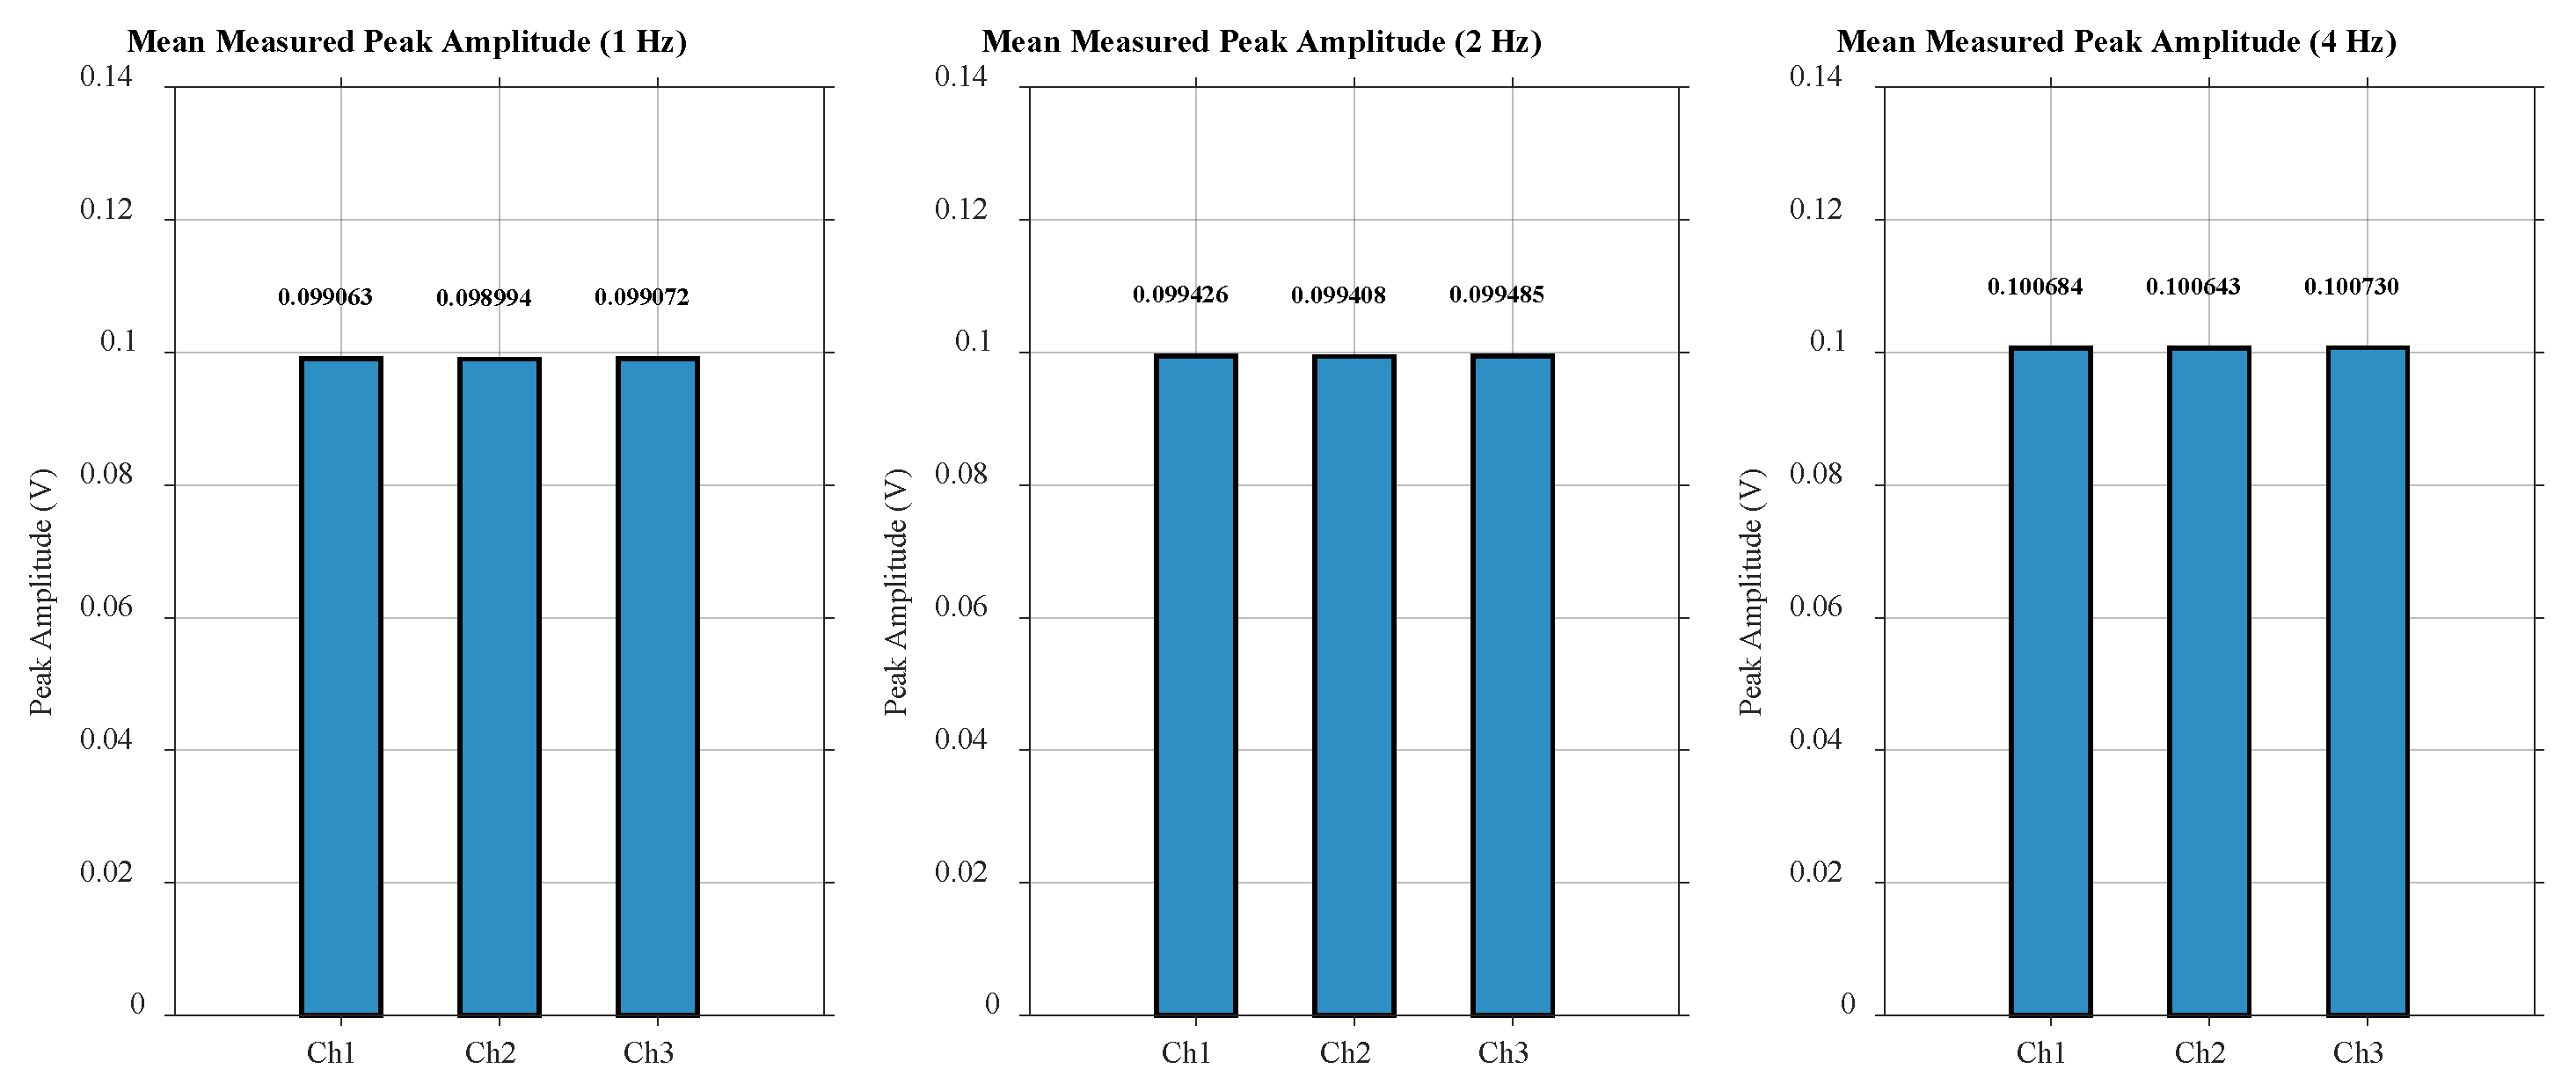
- Resistance-only Model: Six resistors of the same model (Resistance: 1 ; Accuracy: 1%) were connected in series to construct the test model. Signals at different frequencies were input at both ends of the model, and the receiver was used to acquire voltage data across each resistor. The schematics of the resistor model test setup and photographs of the test site are shown in Figure 11a,b, respectively.
- (2)
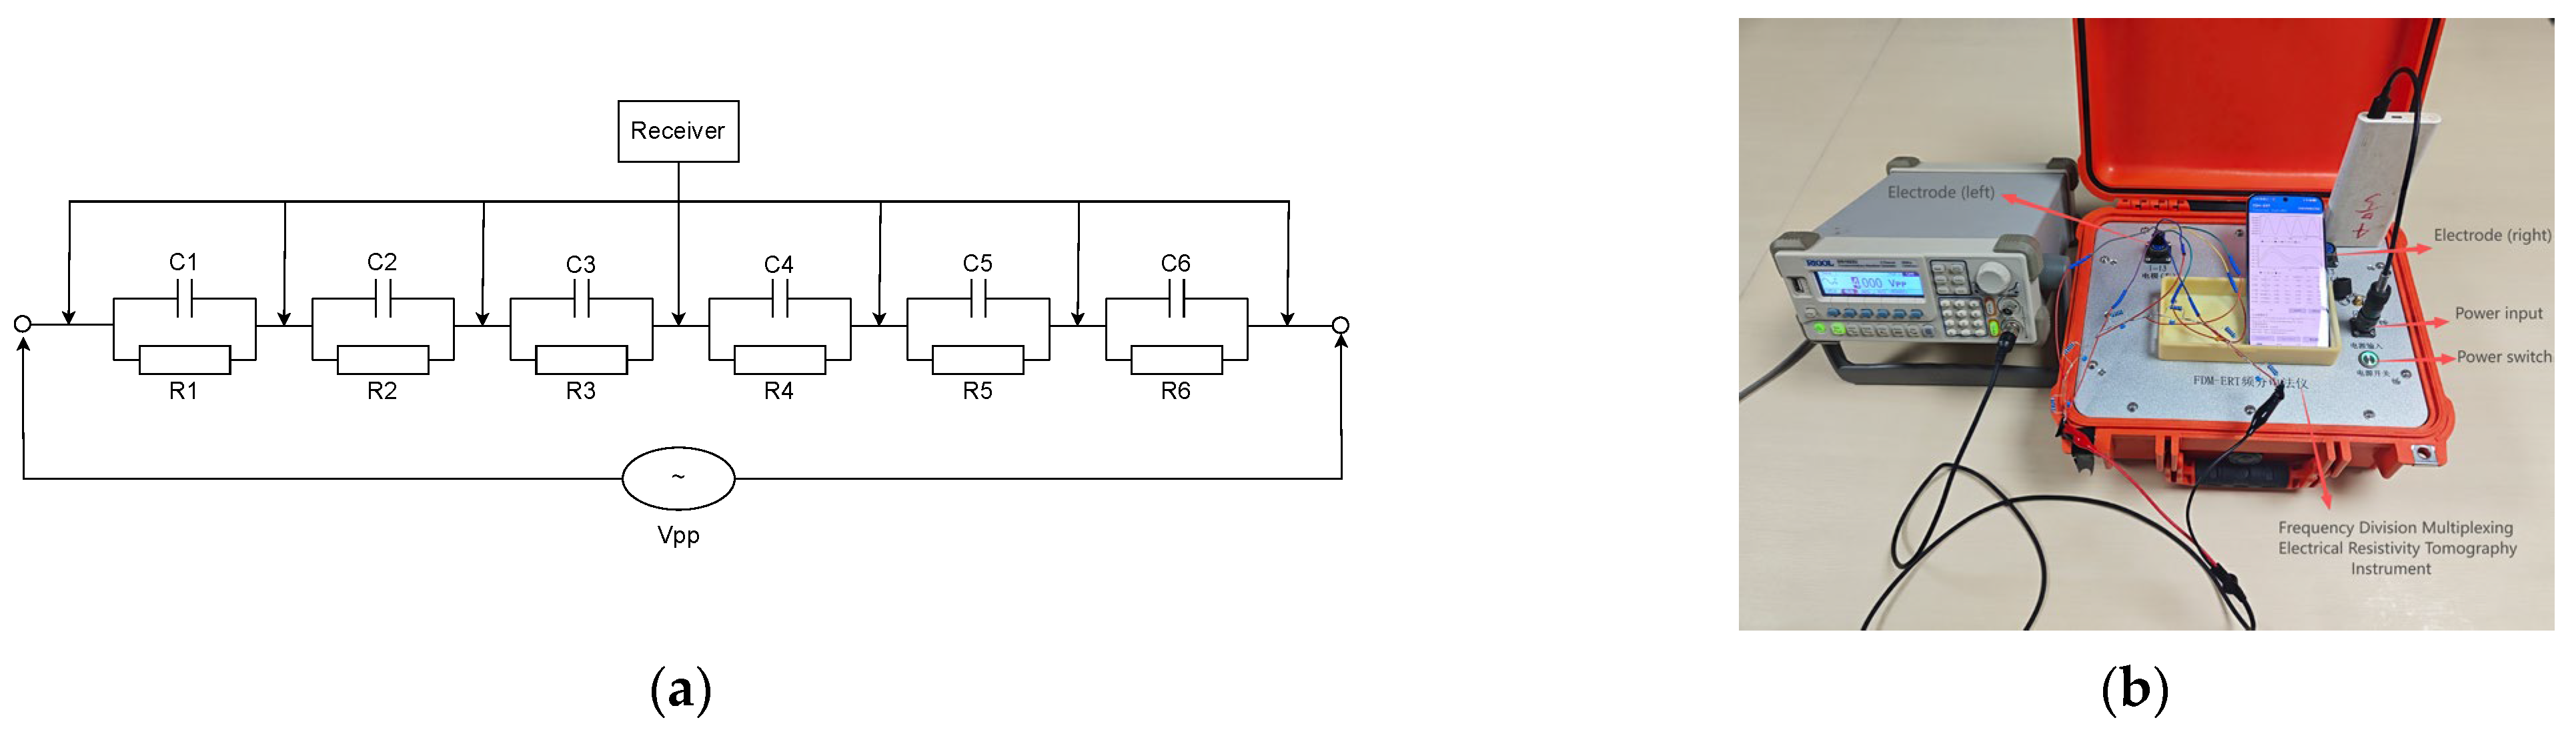
- RC Model: An RC model was constructed by connecting a resistor (Resistance: 1 ; Accuracy: 1%) in parallel with a capacitor (Capacitance: 10 μF; Accuracy: 10%). Six identical RC models were then connected in series to form the RC test model required for this test. Signals at different frequencies were input at both ends of the RC model, and the receiver was used to acquire voltage data across each RC unit. The schematics of the RC model test setup and photographs of the test site are shown in Figure 12a,b, respectively.
3.1.3. Power Supply Test Scheme
3.2. Field Experimental Design
3.2.1. Field Test Site and Conditions
- (1)
- Geological Conditions: Based on general soil resistivity reference data, the Quaternary alluvial layers (primarily silty clay and fine sand) along the Xiangjiang River typically exhibit resistivities ranging from 20 to 300 Ω·m under natural moisture conditions.
- (2)
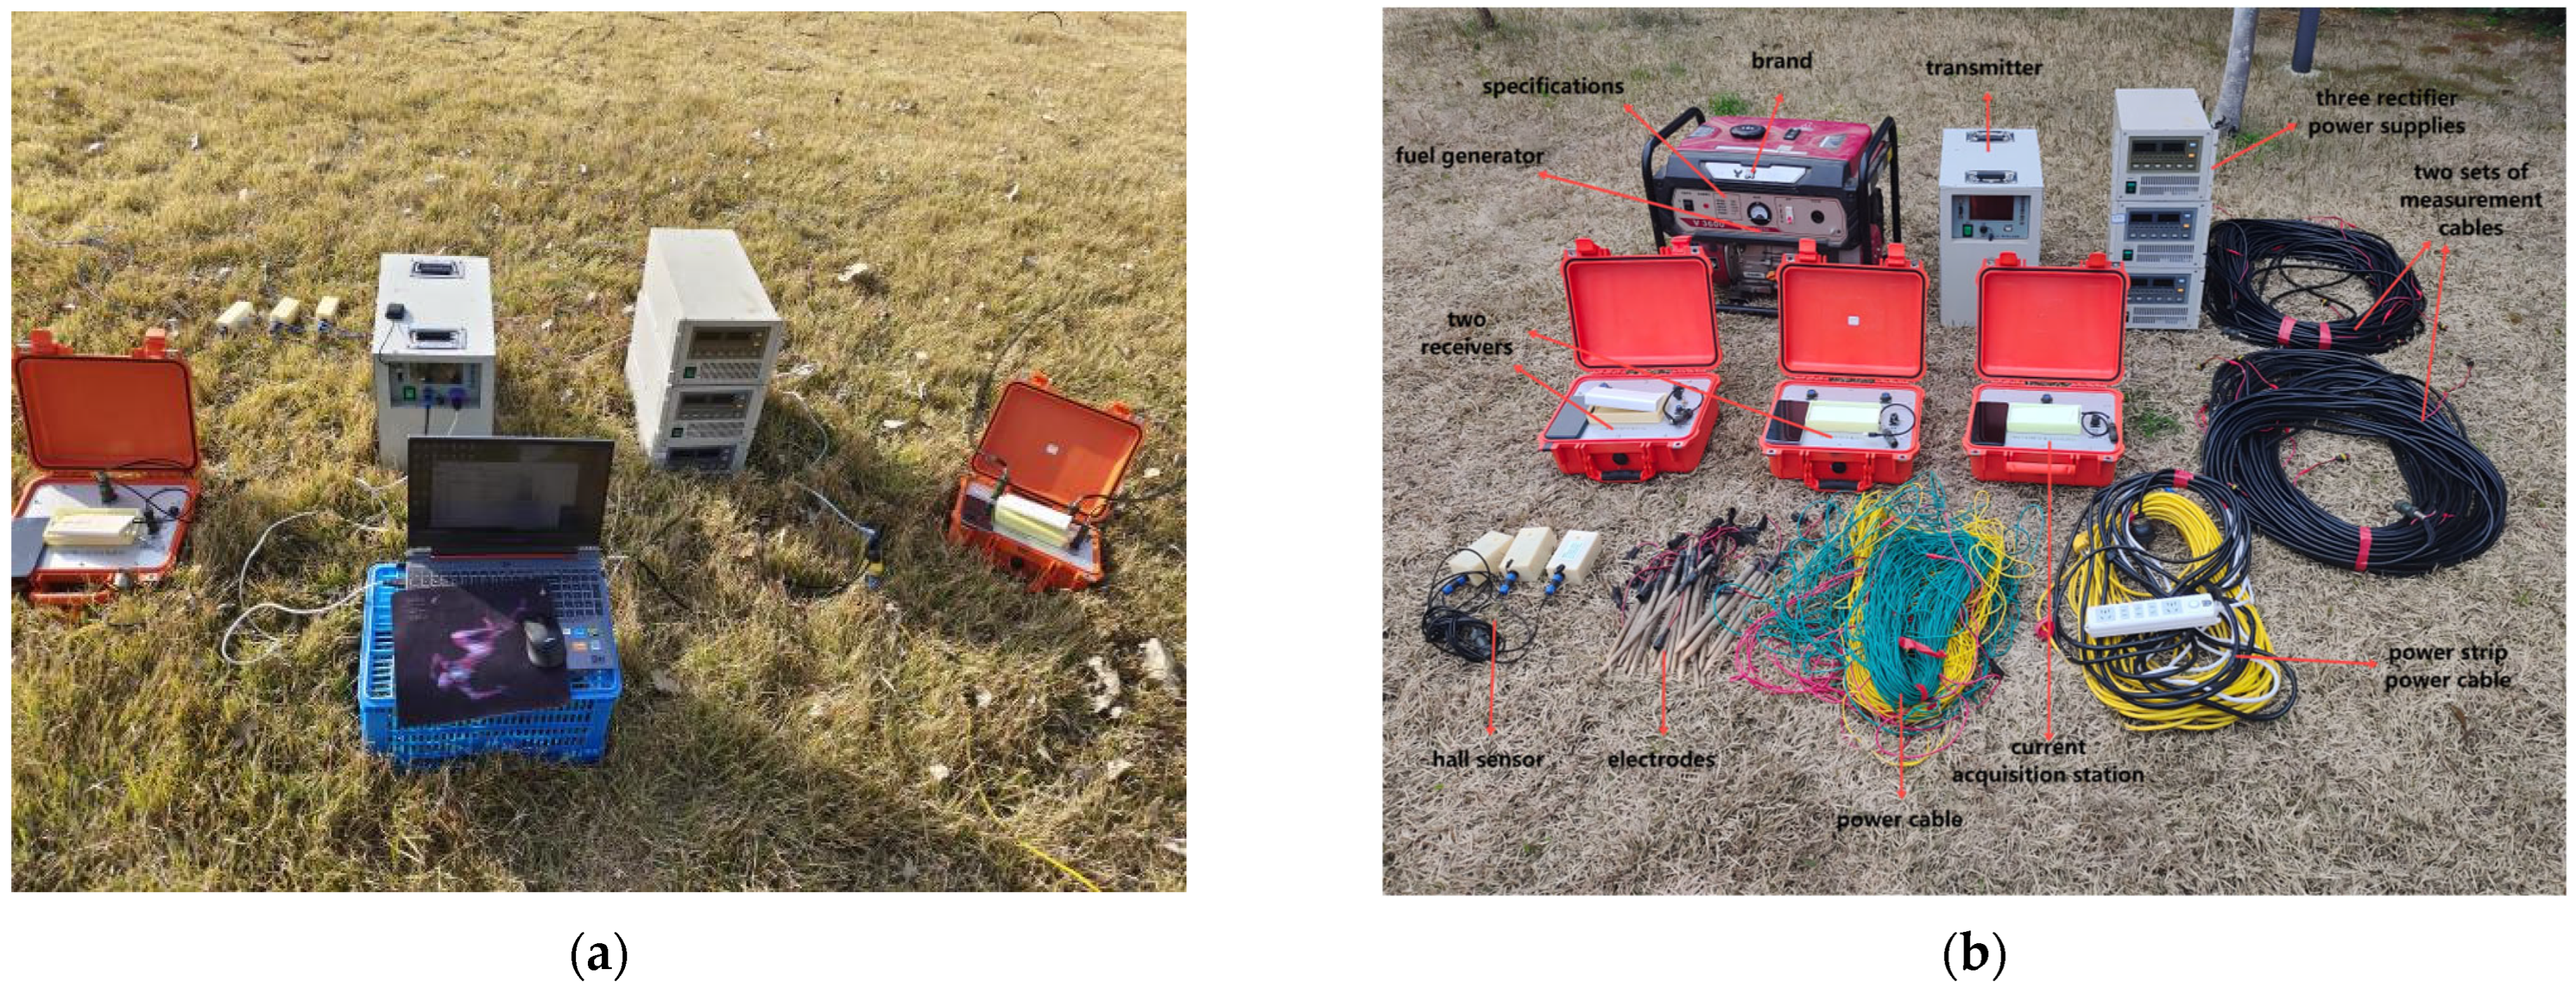
- Electrode Array: Along the survey line, two receivers were deployed, with a total of 50 measurement electrodes. The two measurement electrodes at the connection point between the two receivers are considered as a single measurement point, resulting in a total of 49 measurement points (i.e., 48 acquisition channels). The spacing between any two adjacent measurement electrodes is 1 m. Starting 20 m from the nearest measurement electrodes on the same horizontal line on both sides of the survey line, three pairs of current injection electrodes were arranged (three on each side, with a spacing of 20 m between adjacent electrodes).
- (3)
- Electrodes: Aluminum rods (diameter: 22 mm; length: 35 cm) driven approximately 25 cm into the ground were used as power electrodes, while copper rods (diameter: 10 mm; length: 30 cm) driven 20 cm deep served as potential electrodes. To improve electrical contact, a small amount of saline solution was poured around each electrode prior to measurement.
- (4)
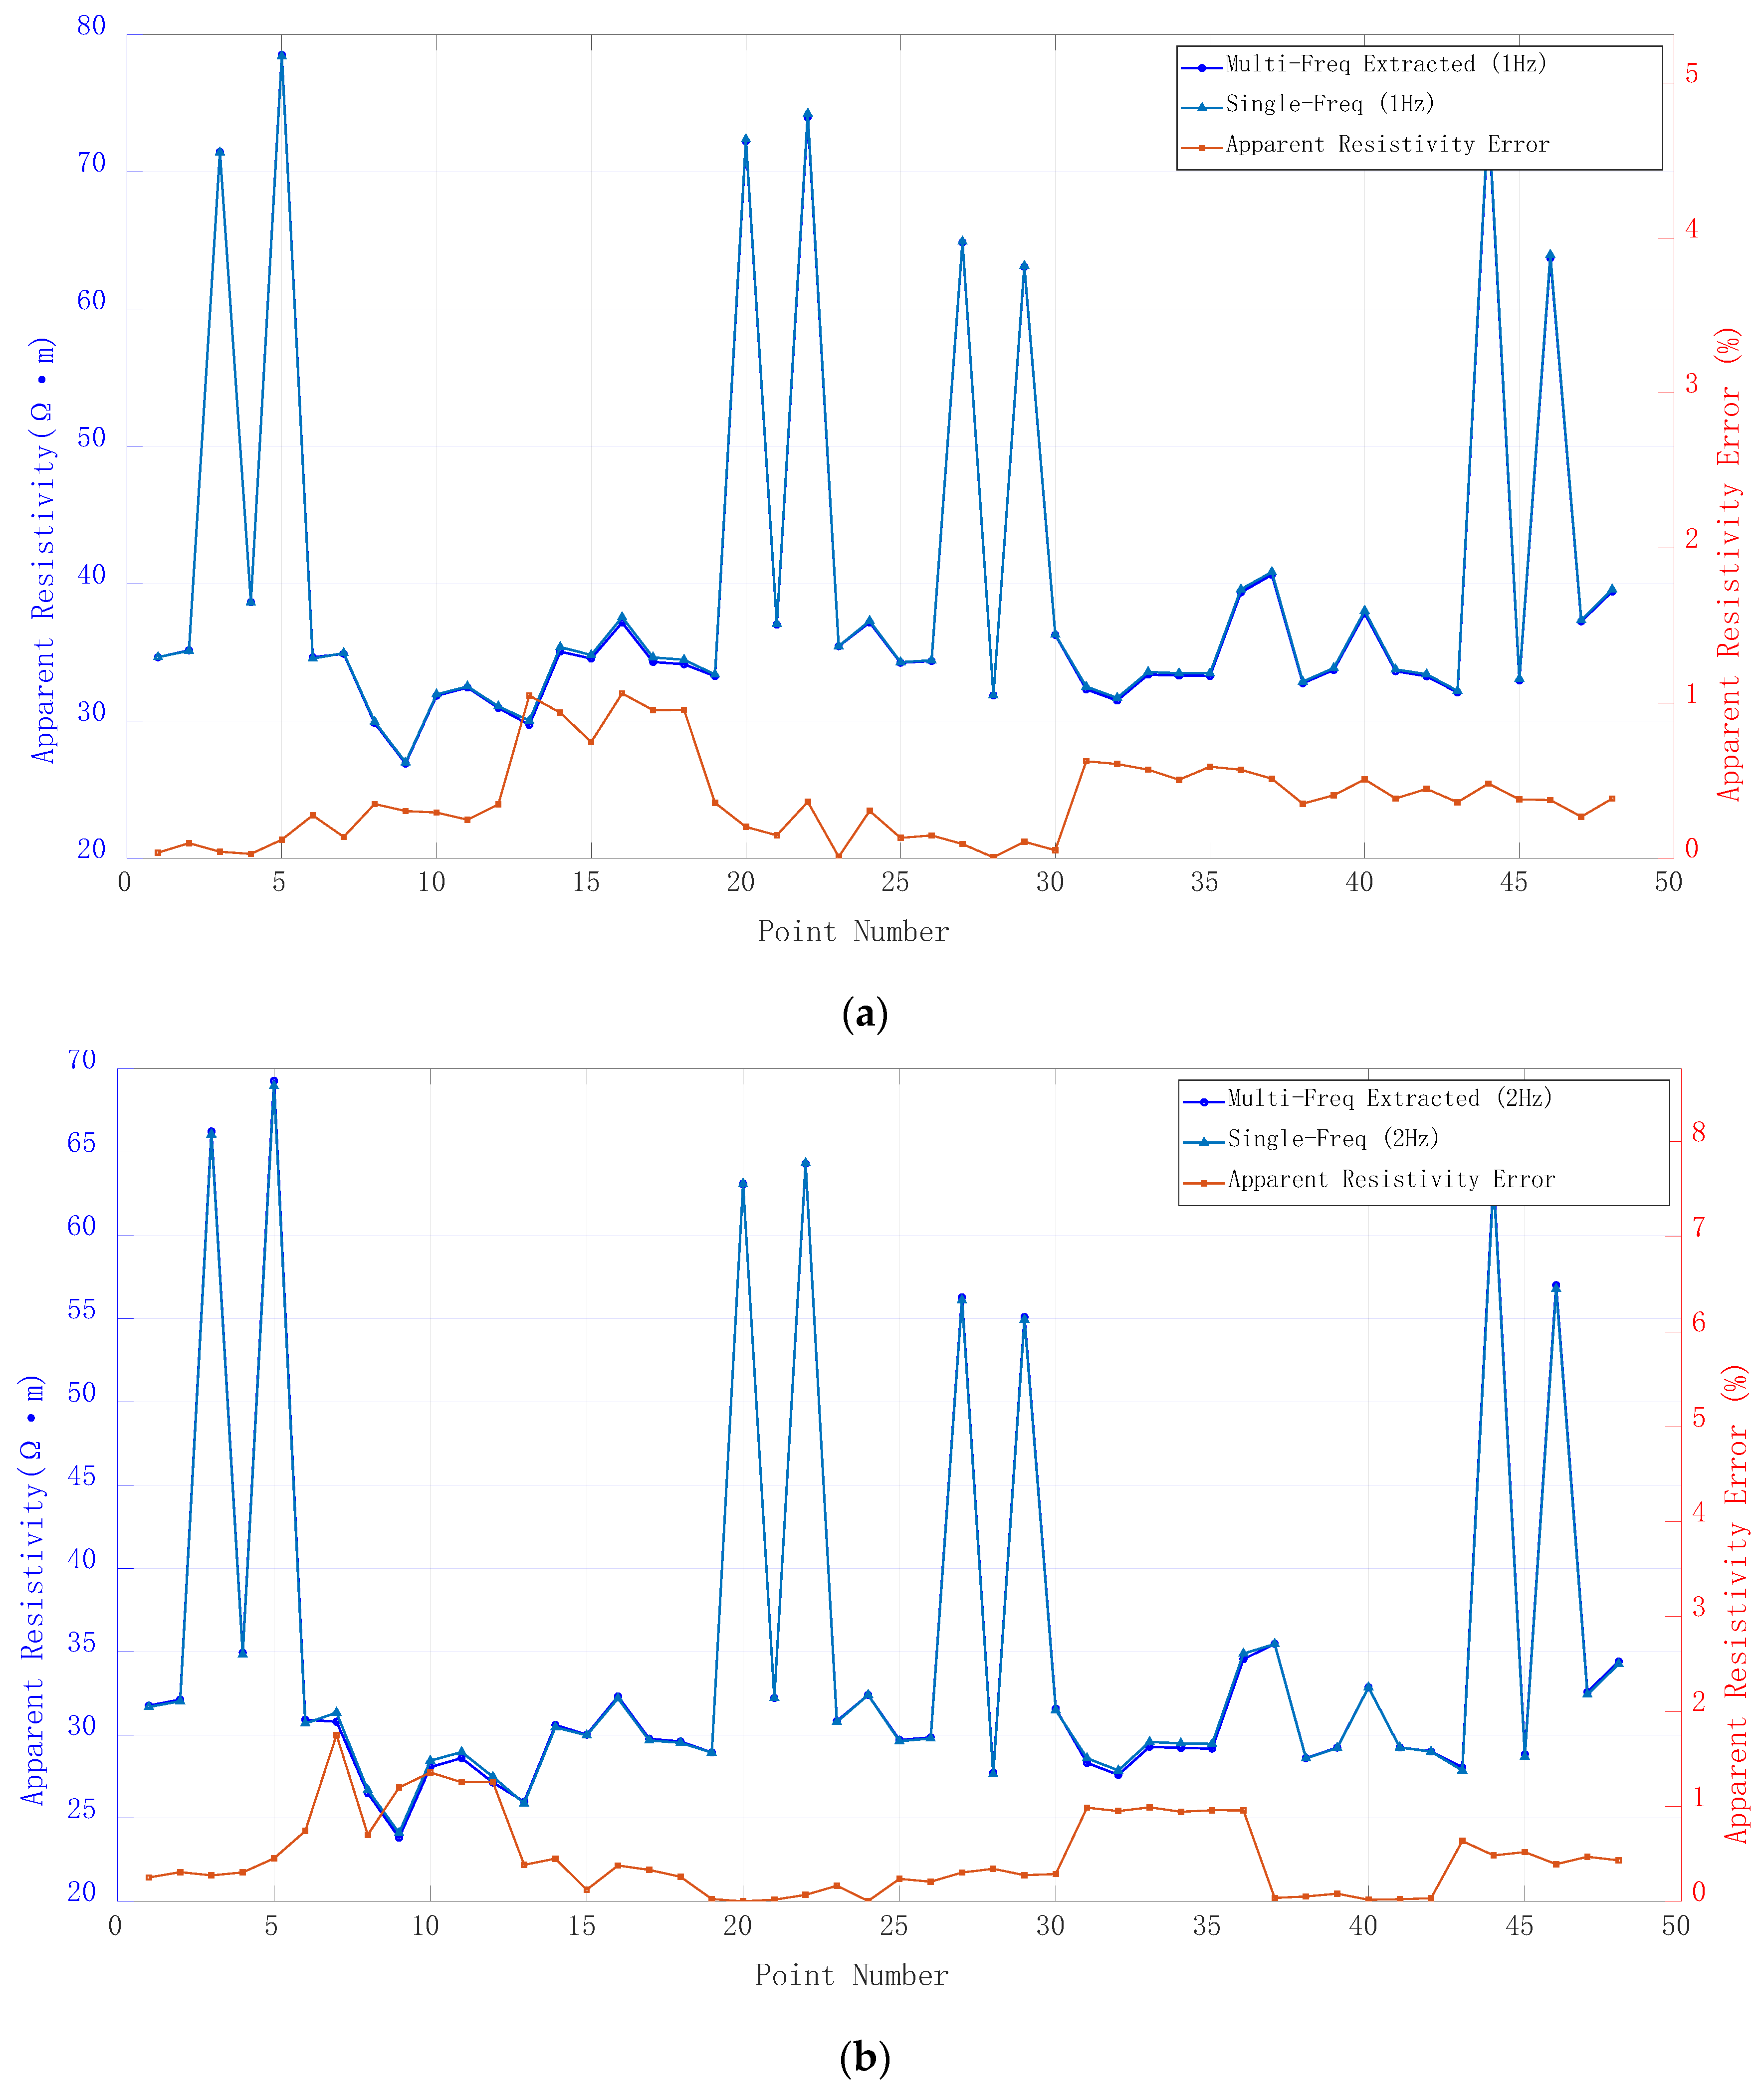
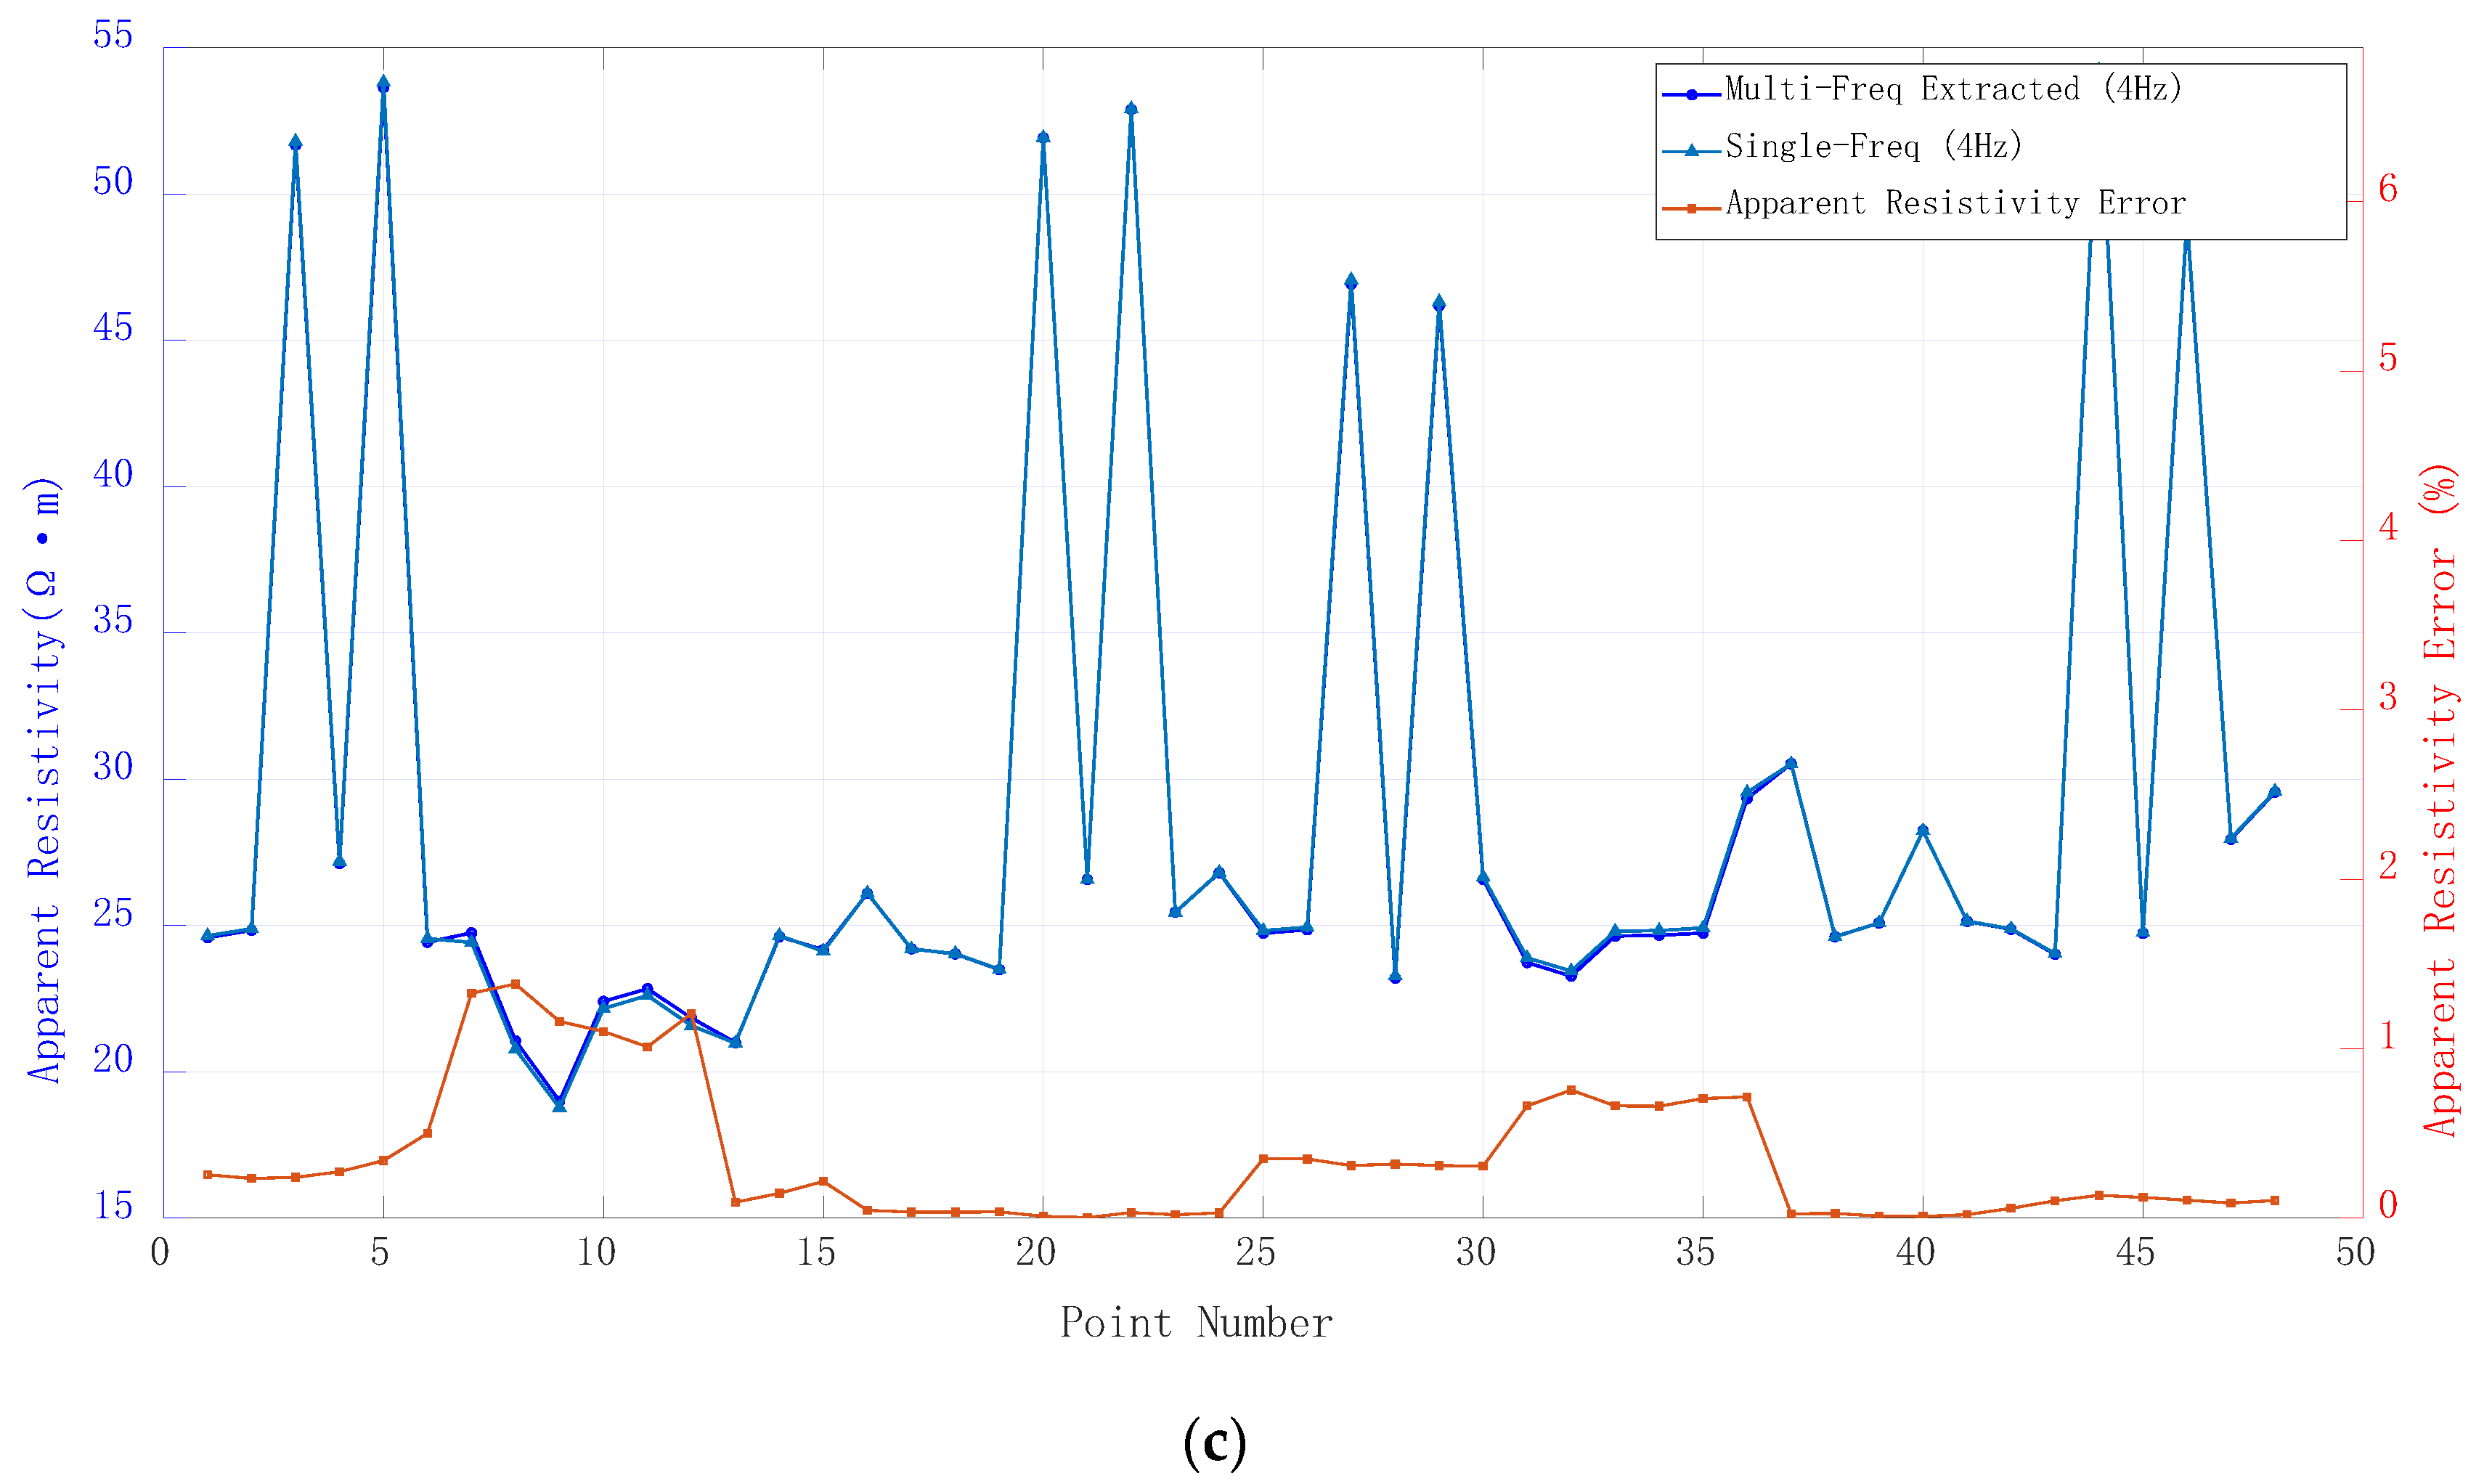
- Reference Measurements: To evaluate the feasibility and accuracy of multi-frequency testing, three rectifier power supplies were first used to simultaneously transmit signals at three frequencies, followed by the sequential transmission of single-frequency signals at 1 Hz, 2 Hz, and 4 Hz under the same conditions to serve as a reference baseline for the multi-frequency test results.
- (5)
- Environmental Conditions: Testing was conducted on 26 December 2025, under clear skies, with ambient temperatures ranging from a high of approximately 11 °C to a low of 2 °C.
3.2.2. Field Ground Resistance Testing
3.2.3. Design Scheme
3.3. Data Processing and Inversion
4. Results
4.1. Transmitter and Receiver Lab Performance
4.1.1. Transmitter Lab Performance
4.1.2. Receiver Lab Performance
4.1.3. Power Supply Test Results
4.2. Field Acquisition Metrics
4.3. Inversion Outcomes
5. Discussion
5.1. Analysis of Data Fidelity
5.2. Compared with Traditional ERT Instruments
5.3. Evaluation of Signal Separation
5.3.1. Statistical Validation of Software Signal Separation and Its Corroboration of Hardware Robustness
5.3.2. Analysis of System Spectral Characteristics, Crosstalk, and Expected Signal-to-Noise Ratio
- (1)
- Avoidance of Square-Wave Harmonic Interference
- (2)
- Actual Performance of Inter-Frequency Crosstalk
- (3)
- Expected SNR Evaluation for Each Frequency Band
5.4. Technical Limitations and Future Challenges
5.4.1. Technical Limitations
- (1)
- Constraints of Hardware Resources on Exploration Capabilities
- (2)
- High Power Consumption
- (3)
- Adaptability Challenges in High-Contact-Impedance Environments
5.4.2. Future Challenges
5.5. Quantitative Evaluation of System Design
6. Conclusions
- (1)
- The electrode layout scheme separates the power electrodes from the potential electrodes. Once the potential electrodes are installed, switching between operating modes only requires adjusting the positions and spacing of the power electrodes. In practical operations, this significantly enhances the flexibility of field wiring.
- (2)
- Hardware-Software Collaborative Multi-frequency Synchronous Transceiver System: At the hardware level, to address high-impedance urban environments, the system increases the maximum single-channel transmission power to 3 kW. Compared to conventional commercial equipment with an internal power of approximately 250 W, its signal injection capability has been enhanced. On this basis, the system executes Fast Fourier Transform (FFT) via a self-developed Android application to achieve frequency-domain separation of the multi-frequency mixed signals. This architecture, which couples decoupled underlying hardware acquisition with high-level software algorithms, effectively ensures the quality of the final data.
- (3)
- Quantitative verification of the system’s measurement stability and high efficiency: Five independent repetitive tests in the laboratory demonstrate that the amplitude standard deviation of the transceiver link is strictly controlled at the microvolt level (<100 μV). Statistical analysis of field measurement data further confirms that the error standard deviation of the FDM frequency-domain decoupling algorithm is maintained within 1.0%. Under the premise of ensuring high-quality data (relative error of apparent resistivity at each frequency point < 2%, and an inversion RMS error of only 0.4%), the system theoretically reduces the field signal acquisition time for three frequency bands by approximately 66.7%.
Author Contributions
Funding
Institutional Review Board Statement
Informed Consent Statement
Data Availability Statement
Acknowledgments
Conflicts of Interest
References
- Qian, D.Z. Application of Electrical Resistivity Tomography (ERT) in Highway Engineering Geological Investigation. Transp. World 2022, 23, 75–77. [Google Scholar]
- Cheng, Q.; Chen, X.; Tao, M.; Binley, A. Characterization of karst structures using quasi-3D Electrical Resistivity Tomography. Environ. Earth Sci. 2019, 78, 285. [Google Scholar] [CrossRef] [Scilit]
- Robert, T.; Dassargues, A.; Brouyère, S.; Kaufmann, O.; Hallet, V.; Nguyen, F. Assessing the contribution of electrical resistivity tomography (ERT) and self-potential (SP) methods for a water well drilling program in fractured/karstified limestones. J. Appl. Geophys. 2011, 75, 42–53. [Google Scholar] [CrossRef] [Scilit]
- Huang, S.K.; Ouyang, Y.F. Application of High Density Electrical Method to Karst Exploration. Chin. J. Eng. Geophys. 2009, 6, 720–723. [Google Scholar]
- Yue, M.; Wang, X.; Gu, H. Enhanced Boulder Detection in Subway Construction through 3D Cross-Hole Electrical Resistivity Tomography. Appl. Sci. 2024, 14, 6749. [Google Scholar] [CrossRef] [Scilit]
- Li, N.; Dong, Z.; Liu, Z.; Yan, B.; Wang, K.; Nie, L.; Lin, C.; Shen, J.; Ma, Z.; Zhang, Y. Synthetic Study of Boulder Detection Using Multi-Configuration Combination of Cross-Hole ERT and Its Field Application in Xiamen Metro, China. Appl. Sci. 2021, 11, 11860. [Google Scholar] [CrossRef] [Scilit]
- Brunet, P.; Clément, R.; Bouvier, C. Monitoring soil water content and deficit using Electrical Resistivity Tomography (ERT)—A case study in the Cevennes area, France. J. Hydrol. 2010, 380, 146–153. [Google Scholar] [CrossRef] [Scilit]
- Camarero, P.L.; Moreira, C.A.; Pereira, H.G. Analysis of the Physical Integrity of Earth Dams from Electrical Resistivity Tomography (ERT) in Brazil. Pure Appl. Geophys. 2019, 176, 5363–5375. [Google Scholar] [CrossRef] [Scilit]
- Carrasco-García, P.; Herrero-Pacheco, J.L.; Carrasco-García, J.; Porras-Sanchiz, D. Electrical Resistivity Tomography and 3D Modeling for Groundwater Salinity Assessment in Volcanic Islands: A Case Study in Los Cristianos (Tenerife, Spain). Appl. Sci. 2025, 15, 11215. [Google Scholar] [CrossRef] [Scilit]
- Liu, H.Y. The Application of DC Resistivity to Shallow Marine Engineering Exploration. Geophys. Geochem. Explor. 2013, 37, 756–760. [Google Scholar]
- Cuong, L.P.; Van Tho, L.; Juzsakova, T.; Rédey, Á.; Hai, H. Imaging the movement of toxic pollutants with 2D electrical resistivity tomography (ERT) in the geological environment of the Hoa Khanh Industrial Park, Da Nang, Vietnam. Environ. Earth Sci. 2016, 75, 286. [Google Scholar] [CrossRef] [Scilit]
- Rucker, D.F.; Fink, J.B.; Loke, M.H. Environmental monitoring of leaks using time-lapsed long electrode electrical resistivity. J. Appl. Geophys. 2011, 74, 242–254. [Google Scholar] [CrossRef] [Scilit]
- He, W.G.; Deng, W. Research on the Application of High Density Electrical Method in Monitoring Landfills. Sci. Technol. Innov. 2025, 16, 26–29. [Google Scholar]
- De Carlo, L.; Perri, M.T.; Caputo, M.C.; Deiana, R.; Vurro, M.; Cassiani, G. Characterization of a dismissed landfill via electrical resistivity tomography and mise-à-la-masse method. J. Appl. Geophys. 2013, 98, 1–10. [Google Scholar] [CrossRef] [Scilit]
- Isobe, Y.; Ishimori, H. Continuous Electrical Resistivity Tomography Monitoring in Waste Landfill Sites with Different Properties and Visualization of Water Channels. Appl. Sci. 2025, 15, 6920. [Google Scholar] [CrossRef] [Scilit]
- Alam, M.J.; Ahmed, A.; Alam, M.Z. Application of Electrical Resistivity Tomography in Geotechnical and Geoenvironmental Engineering Aspect. Geotechnics 2024, 4, 399–414. [Google Scholar] [CrossRef] [Scilit]
- Li, W.; Liu, H.; Yang, S.; Zhu, D.; Zhao, Y.; Luo, M.; Zeng, B.; Xiao, X. Prediction of Spatial Distribution of Soil Heavy Metal Pollution Using Integrated Geochemistry and Three-Dimensional Electrical Resistivity Tomography. Appl. Sci. 2025, 15, 10969. [Google Scholar] [CrossRef] [Scilit]
- Zhang, Z.B.; Song, P.B.; Han, W.Y.; Zhao, H.C.; Li, H.L.; Wang, K. Application of High-Density Electrical Method in Urban Underground Piping Investigation. Geotech. Eng. 2025, 39, 131–133, 149. [Google Scholar]
- Chang, X.L. Research on Application of High Density Electrical Method in Highway Engineering Geological Survey. Henan Sci. Technol. 2020, 23, 102–103. [Google Scholar]
- Kundu, S.K.; Saha, A.; Dey, A.K. Electrical resistivity tomography to check compaction control of road embankment made of partially saturated soil. Innov. Infrastruct. Solut. 2024, 9, 283. [Google Scholar] [CrossRef] [Scilit]
- Jiang, Q.K. Application of High-Density Electrical Method in Highway Landslide Exploration. Value Eng. 2024, 43, 139–141. [Google Scholar]
- Li, H.; Wang, F.; Tang, J.; Liu, Y.; Wang, G.; Jia, X. Study on Detection Technology for High-Speed Railway Slope Sliding Surface Based on Complex Observation of Electrical Resistivity Tomography. Appl. Sci. 2025, 15, 9091. [Google Scholar] [CrossRef] [Scilit]
- Xiao, S.; Yang, J.; Ma, C.; Li, P.; Zhang, Z.; Cheng, L.; Tong, F. Nondestructive testing of seepage in check dams using electrical resistivity tomography based on laboratory test. Constr. Build. Mater. 2024, 411, 134265. [Google Scholar] [CrossRef] [Scilit]
- Fang, N.F.; Zeng, Y.; Ni, L.S.; Shi, Z.H. Estimation of sediment trapping behind check dams using electrical resistivity tomography. J. Hydrol. 2019, 568, 1007–1016. [Google Scholar] [CrossRef] [Scilit]
- Li, F.; Ouyang, Y.C. Visual Expression of Soil Layers Based on Electrical Resistivity Imaging Technology. West. Explor. Eng. 2021, 33, 122–125. [Google Scholar]
- Pelton, W.; Rijo, L.; Swift, C., Jr. Inversion of two-dimensional resistivity and induced polarization data. Geophysics 1978, 43, 788–803. [Google Scholar] [CrossRef] [Scilit]
- Petrick, W.R., Jr.; Sill, W.R.; Wards, S. Three-dimensional resistivity inversion using alpha centers. Geophysics 1981, 46, 1148–1162. [Google Scholar] [CrossRef] [Scilit]
- Jaysaval, P.; Hammond, G.E.; Johnson, T.C. Massively parallel modeling and inversion of electrical resistivity tomography data using PFLOTRAN. Geosci. Model Dev. 2023, 16, 961–976. [Google Scholar] [CrossRef] [Scilit]
- Blanchy, G.; Saneiyan, S.; Boyd, J.; McLachlan, P.; Binley, A. ResIPy, an intuitive open source software for complex geoelectrical inversion/modeling. Comput. Geosci. 2020, 137, 104423. [Google Scholar] [CrossRef] [Scilit]
- Zhao, M.; Jia, M.; Yang, L.; Suo, K.; Lu, Y.; Wei, Q.; Zhang, Y. Correction methods and applications of ERT in complex terrain. MethodsX 2024, 13, 103012. [Google Scholar] [CrossRef] [Scilit]
- Wan, T.L. Three-Dimensional DC Resistivity Inversion Study Based on Supervised Descent Method. Ph.D. Thesis, Jilin University, Changchun, China, 2025. [Google Scholar]
- Ren, Z.Y.; Qiu, L.W.; Tang, J.T.; Zhou, F.; Chen, C.J.; Chen, H.; Hu, S.G. 3D modeling of direct-current anisotropic resistivity using the adaptive finite-element method based on continuity of current density. Chin. J. Geophys. 2018, 61, 331–343. [Google Scholar]
- Xu, Z.F.; Xiong, X.R.; Xiong, B.; Shi, J.; Lu, Y.G.; Li, M.S. Three-dimension resistivity forward for anisotropic media basedon scalar Green’s function. Chin. J. Geophys. 2025, 68, 4005–4011. [Google Scholar]
- Xia, X.; Pan, Y.-Y.; Liu, X.-L.; Jia, Y.-G. Hierarchical Electrode Switching Device Design for Distributed Single-Channel Electrical Resistivity Tomography System. Appl. Sci. 2021, 11, 5746. [Google Scholar] [CrossRef] [Scilit]
- Urruela, A.; Rivero, L.; Casas, A.; Garcia-Artigas, R.; Sendrós, A.; Lovera, R.; Himi, M. Improving the resolution of investigation using ERT instruments with a reduced number of electrodes. J. Appl. Geophys. 2021, 186, 104239. [Google Scholar] [CrossRef] [Scilit]
- Park, K.; Lee, H.; Kuchenbecker, K.J.; Kim, J. Adaptive Optimal Measurement Algorithm for ERT-Based Large-Area Tactile Sensors. IEEE/ASME Trans. Mechatron. 2022, 27, 304–314. [Google Scholar] [CrossRef] [Scilit]
- Wiranata, L.F.; Putra, N.K.; Kurniadi, D. Embedded System for Image Reconstruction in Electrical Resistance Tomography. In Proceedings of the 2023 8th International Conference on Instrumentation, Control, and Automation (ICA), Bandung, Indonesia, 9–11 August 2023; pp. 42–47. [Google Scholar] [CrossRef] [Scilit]
- Chen, R.J.; Tang, D.C.; Liu, C.M.; Wang, X.Y.; Shen, R.J.; Yao, H.C.; Liu, Z.T.; Chen, X.S.; Wang, Z.H. Development of Frequency Division Multiplexing (FDM) 3D Electrical Resistivity Tomography (ERT) Instrument. In Proceedings of the China Geoscience Union Academic Annual Meeting, Chongqing, China, 18 October 2020. [Google Scholar]
- Wu, L.L.; Jia, H. Discussion on the Exploration Depth of IP Intermediate Gradient Array. Heilongjiang Sci. Technol. Inf. 2015, 8, 87. [Google Scholar]
- Frankowski, P.K.; Majzner, P.; Mąka, M.; Stawicki, T.; Chady, T. Magnetic Non-Destructive Evaluation of Reinforced Concrete Structures—Methodology, System, and Identification Results. Appl. Sci. 2024, 14, 11695. [Google Scholar] [CrossRef] [Scilit]












| Performance Parameters | Specifications |
|---|---|
| Transmitted Waveform | Square Wave |
| Frequency Range | 1/256 Hz–256 Hz |
| Transmission Channels | 3 Channels |
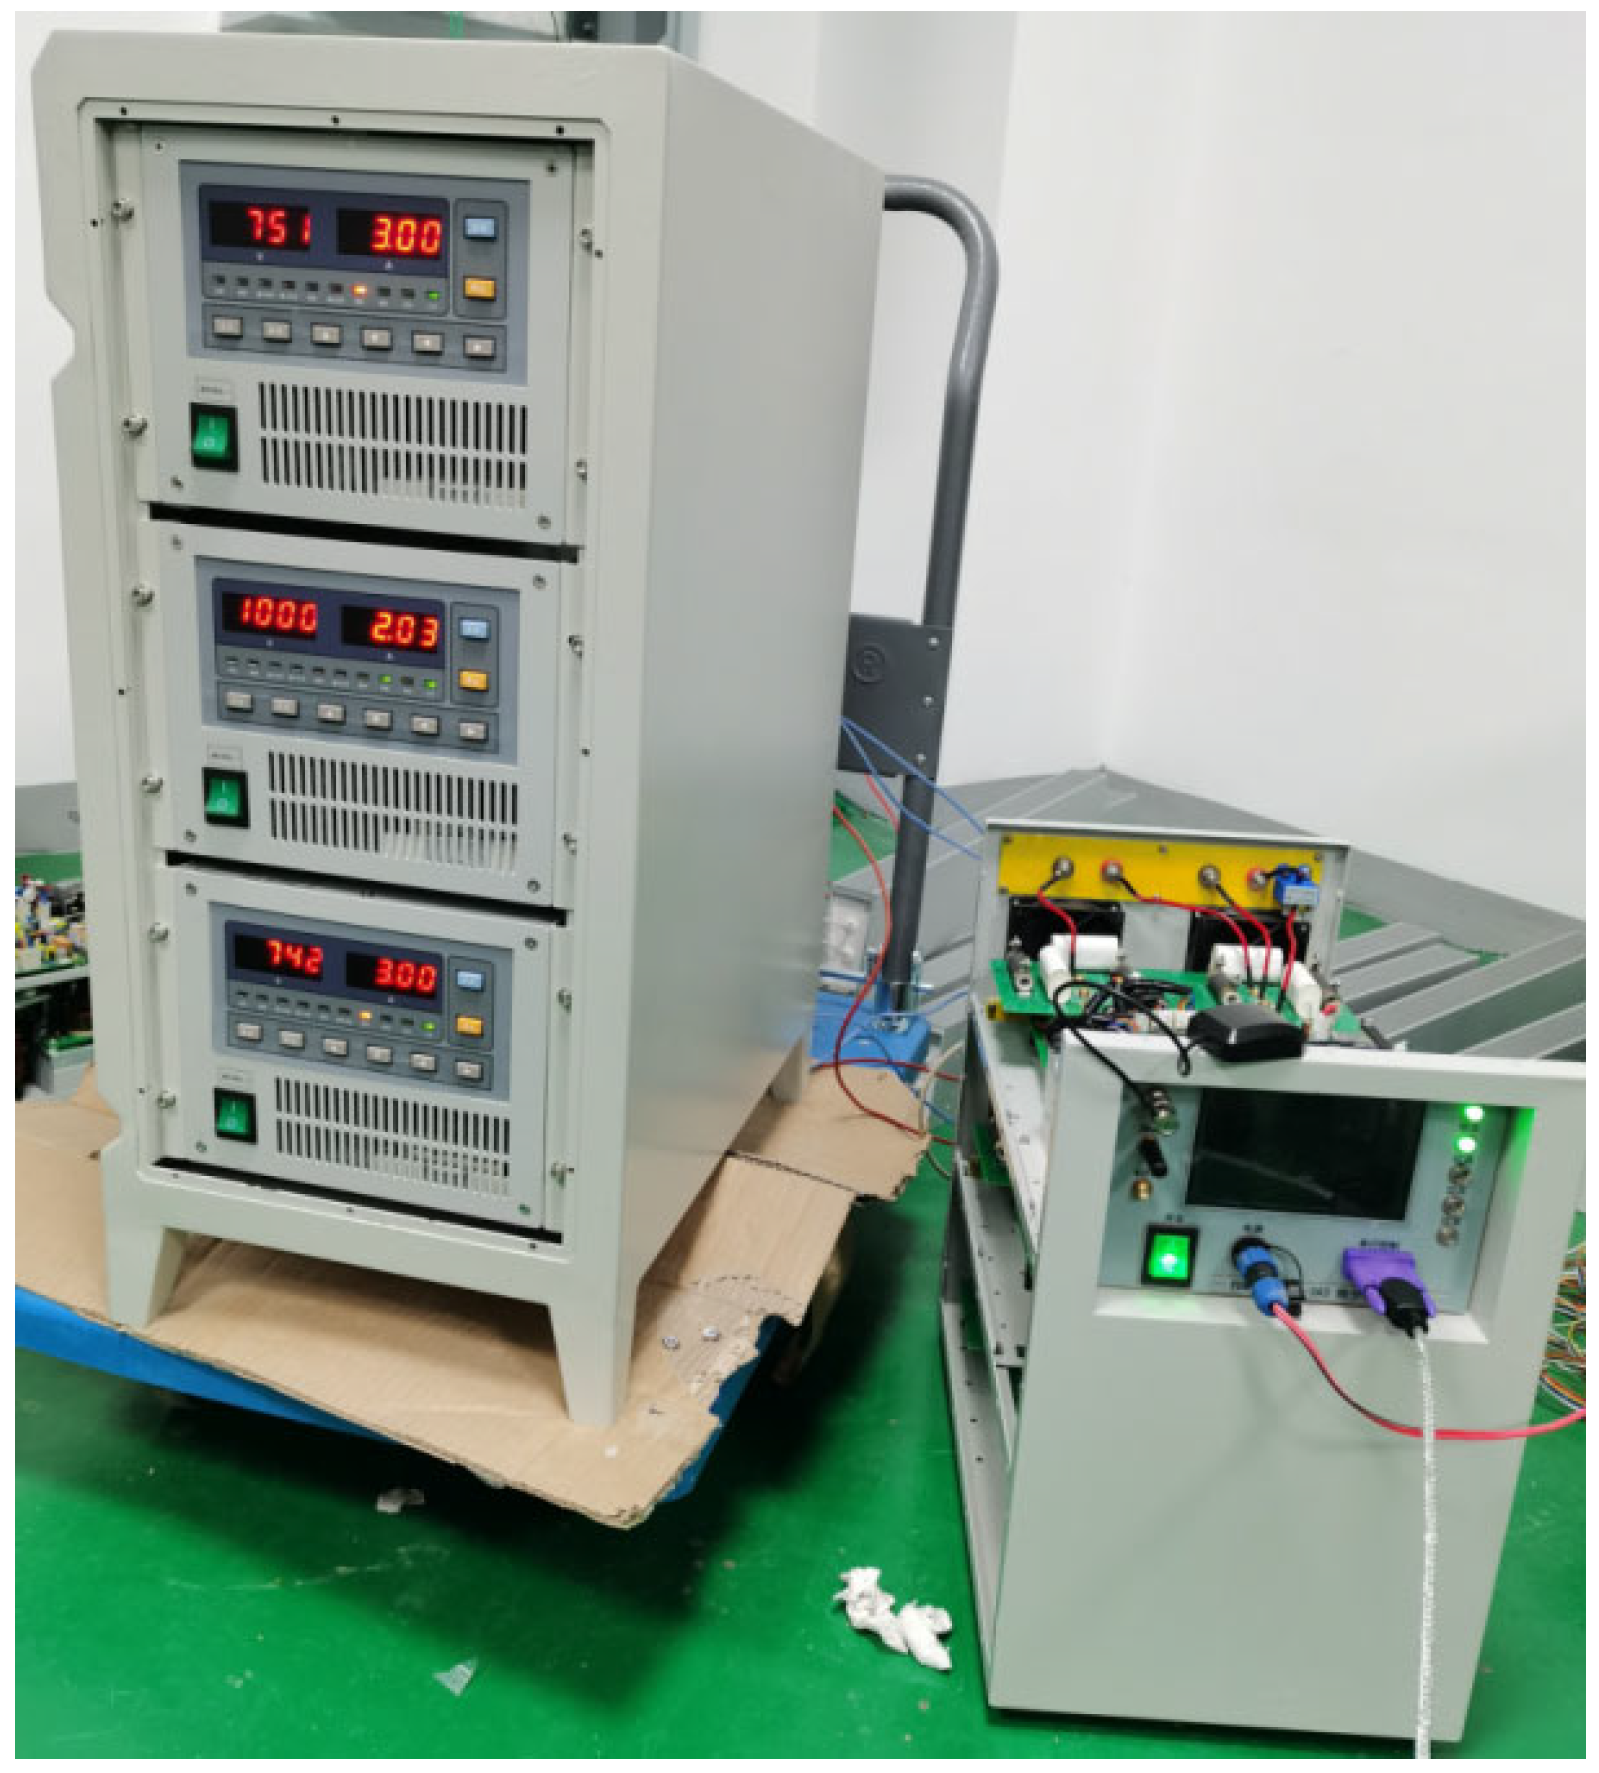
| Transmit Power | 3 kW/channel @ 1000 V & 3 A |
| Transmission Voltage | 0–1000 V/channel |
| Transmission Current | 0–3 A/channel |
| Control Mode | RS232, Wi-Fi |
| Synchronization Mode | GPS Synchronization |
| Protection Functions | Overvoltage, Overcurrent, Overtemperature, Phase Loss, Undervoltage, Short Circuit |
| Performance Parameters | Specification |
|---|---|
| Number of Channels | 6 |
| Sampling Rate | 250 Hz |
| ADC | 32-bit resolution * |
| Noise Floor | 2 μV (RMS) |
| SNR | >120 dB |
| Communication Interface | Wi-Fi, Bluetooth |
| Operating Temperature | −40 °C to +60 °C |
| Frequency (Hz) | Vref (V) | Channel | Measured Mean (V) | Standard Deviation | Mean Error (%) |
|---|---|---|---|---|---|
| 1 Hz | 0.0990 | 1 | 0.099063 | 0.000048 | 0.06 |
| 2 | 0.098994 | 0.000046 | 0.01 | ||
| 3 | 0.099072 | 0.000042 | 0.07 | ||
| 2 Hz | 0.0990 | 1 | 0.099426 | 0.000016 | 0.43 |
| 2 | 0.099408 | 0.000009 | 0.41 | ||
| 3 | 0.099485 | 0.000014 | 0.49 | ||
| 4 Hz | 0.0990 | 1 | 0.100684 | 0.000034 | 1.70 |
| 2 | 0.100645 | 0.000049 | 1.66 | ||
| 3 | 0.100730 | 0.000051 | 1.75 |
| Frequency (Hz) | U0 (V) | Vref (V) | Channel | Measured Mean (V) | Standard Deviation
| Mean Error (%) |
|---|---|---|---|---|---|---|
| 1 Hz | 2 V | 0.333333 | 1 | 0.330956 | 0.000006 | 0.71 |
| 2 | 0.329904 | 0.000006 | 1.03 | |||
| 3 | 0.328693 | 0.000006 | 1.39 | |||
| 2 Hz | 1 V | 0.166667 | 7 | 0.165555 | 0.000007 | 0.67 |
| 8 | 0.165029 | 0.000006 | 0.98 | |||
| 9 | 0.164422 | 0.000007 | 1.35 | |||
| 2 Hz | 0.25 V | 0.041667 | 13 | 0.041316 | 0.000013 | 0.84 |
| 14 | 0.041185 | 0.000012 | 1.16 | |||
| 15 | 0.041033 | 0.000012 | 1.52 | |||
| 4 Hz | 0.5 V | 0.083333 | 19 | 0.083210 | 0.000025 | 0.15 |
| 20 | 0.082946 | 0.000025 | 0.46 | |||
| 21 | 0.082641 | 0.000025 | 0.83 |
| Frequency (Hz) | U0 (V) | Vref (V) | Channel | Measured Mean (V) | Standard Deviation
| Mean Error (%) |
|---|---|---|---|---|---|---|
| 1 Hz | 2 V | 0.333333 | 1 | 0.332136 | 0.000064 | 0.36 |
| 2 | 0.330509 | 0.000106 | 0.85 | |||
| 3 | 0.330010 | 0.000086 | 1.00 | |||
| 2 Hz | 1 V | 0.166667 | 7 | 0.165971 | 0.000015 | 0.42 |
| 8 | 0.165185 | 0.000017 | 0.89 | |||
| 9 | 0.164907 | 0.000014 | 1.06 | |||
| 2 Hz | 0.25 V | 0.041667 | 13 | 0.041254 | 0.000004 | 0.99 |
| 14 | 0.041055 | 0.000004 | 1.47 | |||
| 15 | 0.040990 | 0.000003 | 1.62 | |||
| 4 Hz | 0.5 V | 0.083333 | 19 | 0.083927 | 0.000002 | 0.01 |
| 20 | 0.082889 | 0.000009 | 0.53 | |||
| 21 | 0.082747 | 0.000006 | 0.70 |
| Parameter Specifications | IRIS Syscal Pro (France) | ABEM Terrameter LS 2 (Sweden) | FDM-ERT System |
|---|---|---|---|
| Channels | 10 | 12 | 24 |
| Transmission Mode | Single Frequency | Single Frequency | Multiple Frequencies |
| Receiving Mode | Multi-channel Parallel Acquisition | Multi-channel Parallel Acquisition | Multi-channel Parallel Acquisition |
| Maximum Transmission Power | 250 W (Built-in) | 250 W (Built-in) | 3 kW/Single-channel |
| Maximum Transmission Voltage | 2000 V | 600 V | 1000 V/Single-channel |
| Theoretical Resolution/Noise Floor | 3 nV |
| Frequency (Hz) | Mean Relative Error (%) | Standard Deviation
| 95% Confidence Interval (Bootstrap Method) |
|---|---|---|---|
| 1 Hz | 0.15 | 0.0006 | [0.03%, 0.17%] |
| 2 Hz | 4.42 | 0.0060 | [4.21%, 4.63%] |
| 4 Hz | 9.30 | 0.0100 | [8.95%, 9.65%] |
| Performance Evaluation | Conventional Instruments | FDM-ERT |
|---|---|---|
| Data Acquisition Efficiency | Sequential Measurement (3T) | Parallel Acquisition (T) |
| Data Acquisition Method | Sequential data acquisition | Multi-frequency signal acquisition within a single measurement cycle |
| Transmission Power | Portable instruments typically have a built-in power output of around 250 W. | Maximum 3 kW per channel (1000 V, 3 A) |
| Portability | Most are equipped with a built-in power supply, making them easy to carry | Using a single-phase generator makes it relatively cumbersome |
Disclaimer/Publisher’s Note: The statements, opinions and data contained in all publications are solely those of the individual author(s) and contributor(s) and not of MDPI and/or the editor(s). MDPI and/or the editor(s) disclaim responsibility for any injury to people or property resulting from any ideas, methods, instructions or products referred to in the content. |
© 2026 by the authors. Licensee MDPI, Basel, Switzerland. This article is an open access article distributed under the terms and conditions of the Creative Commons Attribution (CC BY) license.
Share and Cite
Yu, D.; Chen, R.; Liu, C.; Shen, R.; Chun, S.; Liu, Z.; Yu, K. Hardware System and Preliminary Testing of Frequency Division Multiplexing Electrical Resistivity Tomography(FDM-ERT) Instrument. Appl. Sci. 2026, 16, 2935. https://doi.org/10.3390/app16062935
Yu D, Chen R, Liu C, Shen R, Chun S, Liu Z, Yu K. Hardware System and Preliminary Testing of Frequency Division Multiplexing Electrical Resistivity Tomography(FDM-ERT) Instrument. Applied Sciences. 2026; 16(6):2935. https://doi.org/10.3390/app16062935
Chicago/Turabian StyleYu, Donghai, Rujun Chen, Chunming Liu, Ruijie Shen, Shaoheng Chun, Zhitong Liu, and Kai Yu. 2026. "Hardware System and Preliminary Testing of Frequency Division Multiplexing Electrical Resistivity Tomography(FDM-ERT) Instrument" Applied Sciences 16, no. 6: 2935. https://doi.org/10.3390/app16062935
APA StyleYu, D., Chen, R., Liu, C., Shen, R., Chun, S., Liu, Z., & Yu, K. (2026). Hardware System and Preliminary Testing of Frequency Division Multiplexing Electrical Resistivity Tomography(FDM-ERT) Instrument. Applied Sciences, 16(6), 2935. https://doi.org/10.3390/app16062935