1. Introduction
The impact of climate change on building design standards has become increasingly evident, especially during extreme weather events such as the Winter Storm URI in Houston, Texas, which occurred in February 2021. This storm caused significant damage to awnings, highlighting the vulnerability of existing design codes to unexpected weather phenomena. Climate change is altering the frequency and intensity of weather events, prompting designers to reconsider traditional load combinations in their designs. This study investigates the consequences of such extreme weather events and offers recommendations for improving the design of awnings and other structures in regions with minimal- or no-snow-load zones. The findings emphasize the importance of accounting for unexpected freezing conditions in existing design codes.
Recent research has highlighted that climate change is increasingly affecting structural actions such as snow, wind, thermal loads, and ice accretion, challenging the long-standing assumption of climatic stationarity in structural design. In response, the second generation of the Structural Eurocodes explicitly incorporates climate change considerations through the introduction of climate change factors or scaling approaches, allowing characteristic actions and reliability formats to be adjusted over the design working life of structures [
1,
2]. This approach aims to maintain target safety levels while acknowledging the evolving nature of climatic loads across Europe.
Recent studies have provided the methodological and reliability basis for this development. Reliability-based investigations have demonstrated that projected changes in snow, wind, and thermal actions can lead to non-negligible reductions in safety margins for structures designed using historical climate data, thereby justifying the adoption of climate-adjustment factors within the Eurocode framework [
1,
3]. In particular, climate-induced shifts in extreme cold events and precipitation patterns have been shown to affect regions traditionally classified as low- or zero-snow-load zones, underscoring the need for revised action models and complementary design guidance for vulnerable structural components.
Recent studies have shown that atypical cold-weather events and non-standard loading mechanisms, such as rain-on-snow processes and subsequent ice accumulation, can induce indirect and unanticipated loads on lightweight and ancillary structural systems [
4]. These mechanisms have been identified as increasingly relevant under climate change, particularly in regions traditionally classified as low- or zero-snow-load zones, where retained or refrozen precipitation can significantly amplify structural demand beyond conventional design assumptions.
Recent probabilistic investigations within the Eurocode framework indicate that uncertainties associated with roof geometry, wind exposure, and shape coefficients can result in roof snow loads with exceedance probabilities and magnitudes that differ significantly from those implicitly assumed in conventional deterministic design provisions [
5,
6]. Such findings highlight the limitations of stationary climatic action models and reinforce the need for enhanced design provisions and climate-adjustment approaches within future structural codes.
In this context, Larsson Ivanov et al. (2022) examined the impact of climate change on snow loads in northern Europe, noting that colder areas may experience increased snow loads while warmer regions may see a decrease. These shifts in snow loads create significant challenges for designers, especially in regions where climate change affects the intensity and duration of precipitation [
7]. Similarly, Li et al. (2022) simulated the performance of single-tube frames (LASF) and reinforced frames (RLASF) for Chinese solar greenhouses under snow loads. They found that RLASF performed better, being both stronger and using 16.1% less steel than LASF, providing a safer and more cost-effective option for greenhouse construction [
8].
Croce et al. (2021) proposed an updated method for assessing roof snow loads, showing that the new model in prEN1991-1-3:2020 offers more accurate and conservative results compared to the current Eurocode. This study highlights the need for updates to existing design standards [
6]. In a similar vein, Al-Rubaye et al. (2022) reviewed the evolution of snow load design in ASCE 7 standards, emphasizing the shift toward reliability-targeted design loads in response to climate change. They highlighted the need to adjust design practices to account for the effects of climate change on future snow load predictions [
9].
In addition, Coll-Hidalgo et al. (2022) studied the moisture contribution from oceanic sources during storm SC93, which intensified due to inputs from the North Atlantic and Gulf of Mexico, further demonstrating the role of climate change in increasing the severity of storms [
10].
In response to such risks, Sandy (2025) developed an affordable sensor system for monitoring roof slopes in real time to prevent collapses due to snow loads. This system, depending on sensor accuracy and material properties, offers a technological solution to the increased risks posed by extreme weather events [
11].
Maximiliano-Cordova et al. (2022) found that taller dunes with more plant cover reduced erosion during winter storms, showing the effectiveness of natural solutions in mitigating the effects of climate-induced disasters [
12]. Similarly, Temel (2020) proposed a new ground snow load map for Turkey and provided recommendations for preventing snow damage in solar power plants, emphasizing the importance of adaptive designs to cope with changing environmental conditions [
13].
Röösli et al. (2021) created an open-source system to forecast building damage from winter windstorms in Switzerland. Although the system was accurate for winter storms, it faced challenges with other weather events, highlighting the need for more robust systems to address a wide range of weather-related risks [
14]. Hsu et al. (2025) found that subtropical warming has intensified and shifted winter storms northward in the North Pacific, while Arctic warming weakens storm activity, primarily driven by sea surface warming in the subtropical North Pacific and Indian Ocean [
15].
Shabani Shahreza (2025) developed a framework combining machine learning and IoT to assess risks from freezing rain on transmission towers, improving design, maintenance, and prediction efficiency [
16].
Semmens et al. (2024) adapted the Winter Storm Severity Index (WSSI) for Alaska to enhance storm response and mitigation, focusing on wind, precipitation, and air travel concerns. This study shows the importance of localized storm response tools in mitigating storm impacts [
17].
Finally, Tsybulnyk (2025) discussed passive protection methods for buildings against wind and snow loads, highlighting the effectiveness of deflectors for single-direction winds and barriers for broader coverage, as well as solutions for snow transfer control. These studies emphasize the importance of updating design codes and incorporating both technological and natural solutions to address the challenges posed by climate change and its effects on building design [
18].
With the increasing frequency of winter storms due to climate change, ice accumulation has become a significant threat to structural integrity. Existing design codes, such as ASCE 7-16, IBC 2018, are often based on assumptions of predictable and static loads, and the impact of these storms on awnings and building components has not been adequately addressed. Ice accumulation from freeze–thaw cycles, inadequate drainage, and poor structural design have led to numerous structural failures and safety risks [
19,
20].
The primary contribution of this study is a forensic investigation of awning failures observed during Winter Storm URI, supported by code-based analytical assessments using ASCE 7-16 and ACI 318-19. Based on field observations and analytical evaluations, the paper further proposes conservative and practical design and installation recommendations aimed at improving the performance of awning structures and anchor systems under freezing rain and ice accumulation conditions, particularly in regions traditionally classified as zero ground snow load zones. Accordingly, this research aimed to identify vulnerabilities in awning structures under such conditions and propose design recommendations to mitigate the risks associated with ice accumulation and other climate-related challenges. It explores the impact of winter storms on awnings and offers practical solutions, including improvements in drainage systems, structural geometry, and best practices for addressing the effects of ice buildup. Therefore, the main goal of this research is to enhance the safety and resilience of structures in the face of severe weather patterns. The proposed approach is primarily intended for lightweight roof-mounted equipment and ancillary structures such as awnings, canopies, and exposed components that are not explicitly covered by the standard roof load provisions. For primary roof structures, the design should remain fully compliant with ASCE 7 requirements. However, the findings of this study may serve as a complementary assessment tool to identify potential vulnerabilities under extreme winter storm conditions, particularly in regions classified as zero ground snow load zones, where localized snow accumulation and wind-driven effects may not be adequately captured by code-based uniform load assumptions.
2. Design Considerations for Cantilever Beams Under Snow and Rain-on-Snow Loadings
The cantilever beams can be tapered or prismatic, depending on the cantilever span length, load tributary area, and budget. The code does not allow the live load reduction for any kind of awning. In general, for snow loads on equipment, pipes, and platforms, snow accumulation on the external surface at temperatures below 45 °F (7.2 °C) triggers the code requirements, under which the snow accumulation height is a function of γ (snow density) and is limited to no more than 30 pcf (1.44 kN/m2).
To clarify the use of Equation (1), the same snow density γ adopted in the formulation is also used to determine the equivalent snow height. Specifically, the equivalent snow height
hb corresponding to a given uniform roof snow load
Ps is obtained by dividing the snow load by the snow density. The relationship is expressed as Equation (2) where
Ps represents the uniformly distributed snow load acting on the roof,
γ is the snow density, and
is the equivalent snow height associated with that load. In the SI system, to obtain the snow height in meters when
Ps is expressed in kN/m
2 and
γ in kN/m
3, the resulting value is multiplied by 102 to ensure unit consistency. This approach allows the applied snow load to be directly interpreted in terms of an equivalent snow depth, facilitating comparison with snow height–based provisions in design codes.
where
Pg = ground snow load as determined in ASCE, Figure 7-1 of ASCE 7- 05 for the United States (lb/ft
2) [
21].
Here, an additional code-required snow loading case associated with s snow accumulation on exposed equipment, molten and drifted ice, slush ponding, surplus ice dumping, and ancillary elements on exposed equipment and awning elements is considered.
2.1. Rain-on-Snow Surcharge
The rain-on-snow surcharge load per ASCE code is not applied when Pg exceeds 20 lb/ft2 (0.96 kN/m2). This surcharge load increases the eave-to-ridge length and decreases the roof slope. This load is triggered for slopes less than 1/4 in/ft (20.8mm/m) (1.19°). In hot regions and areas with no snow on the ground, there is no snow load; if any snow is recorded in historical data, it would be disregarded for loading purposes.
Although freezing rain and accumulation of ice are more applicable in the design, as discussed in the following: accumulation of ice is per the designer’s viewpoint, which should be considered for the awning design if the geometry, wind, and sun direction, elevation, and upper enclosures, overhangs and relevant ice accumulation factors are imposing the potential of this surcharge loading to the structure.
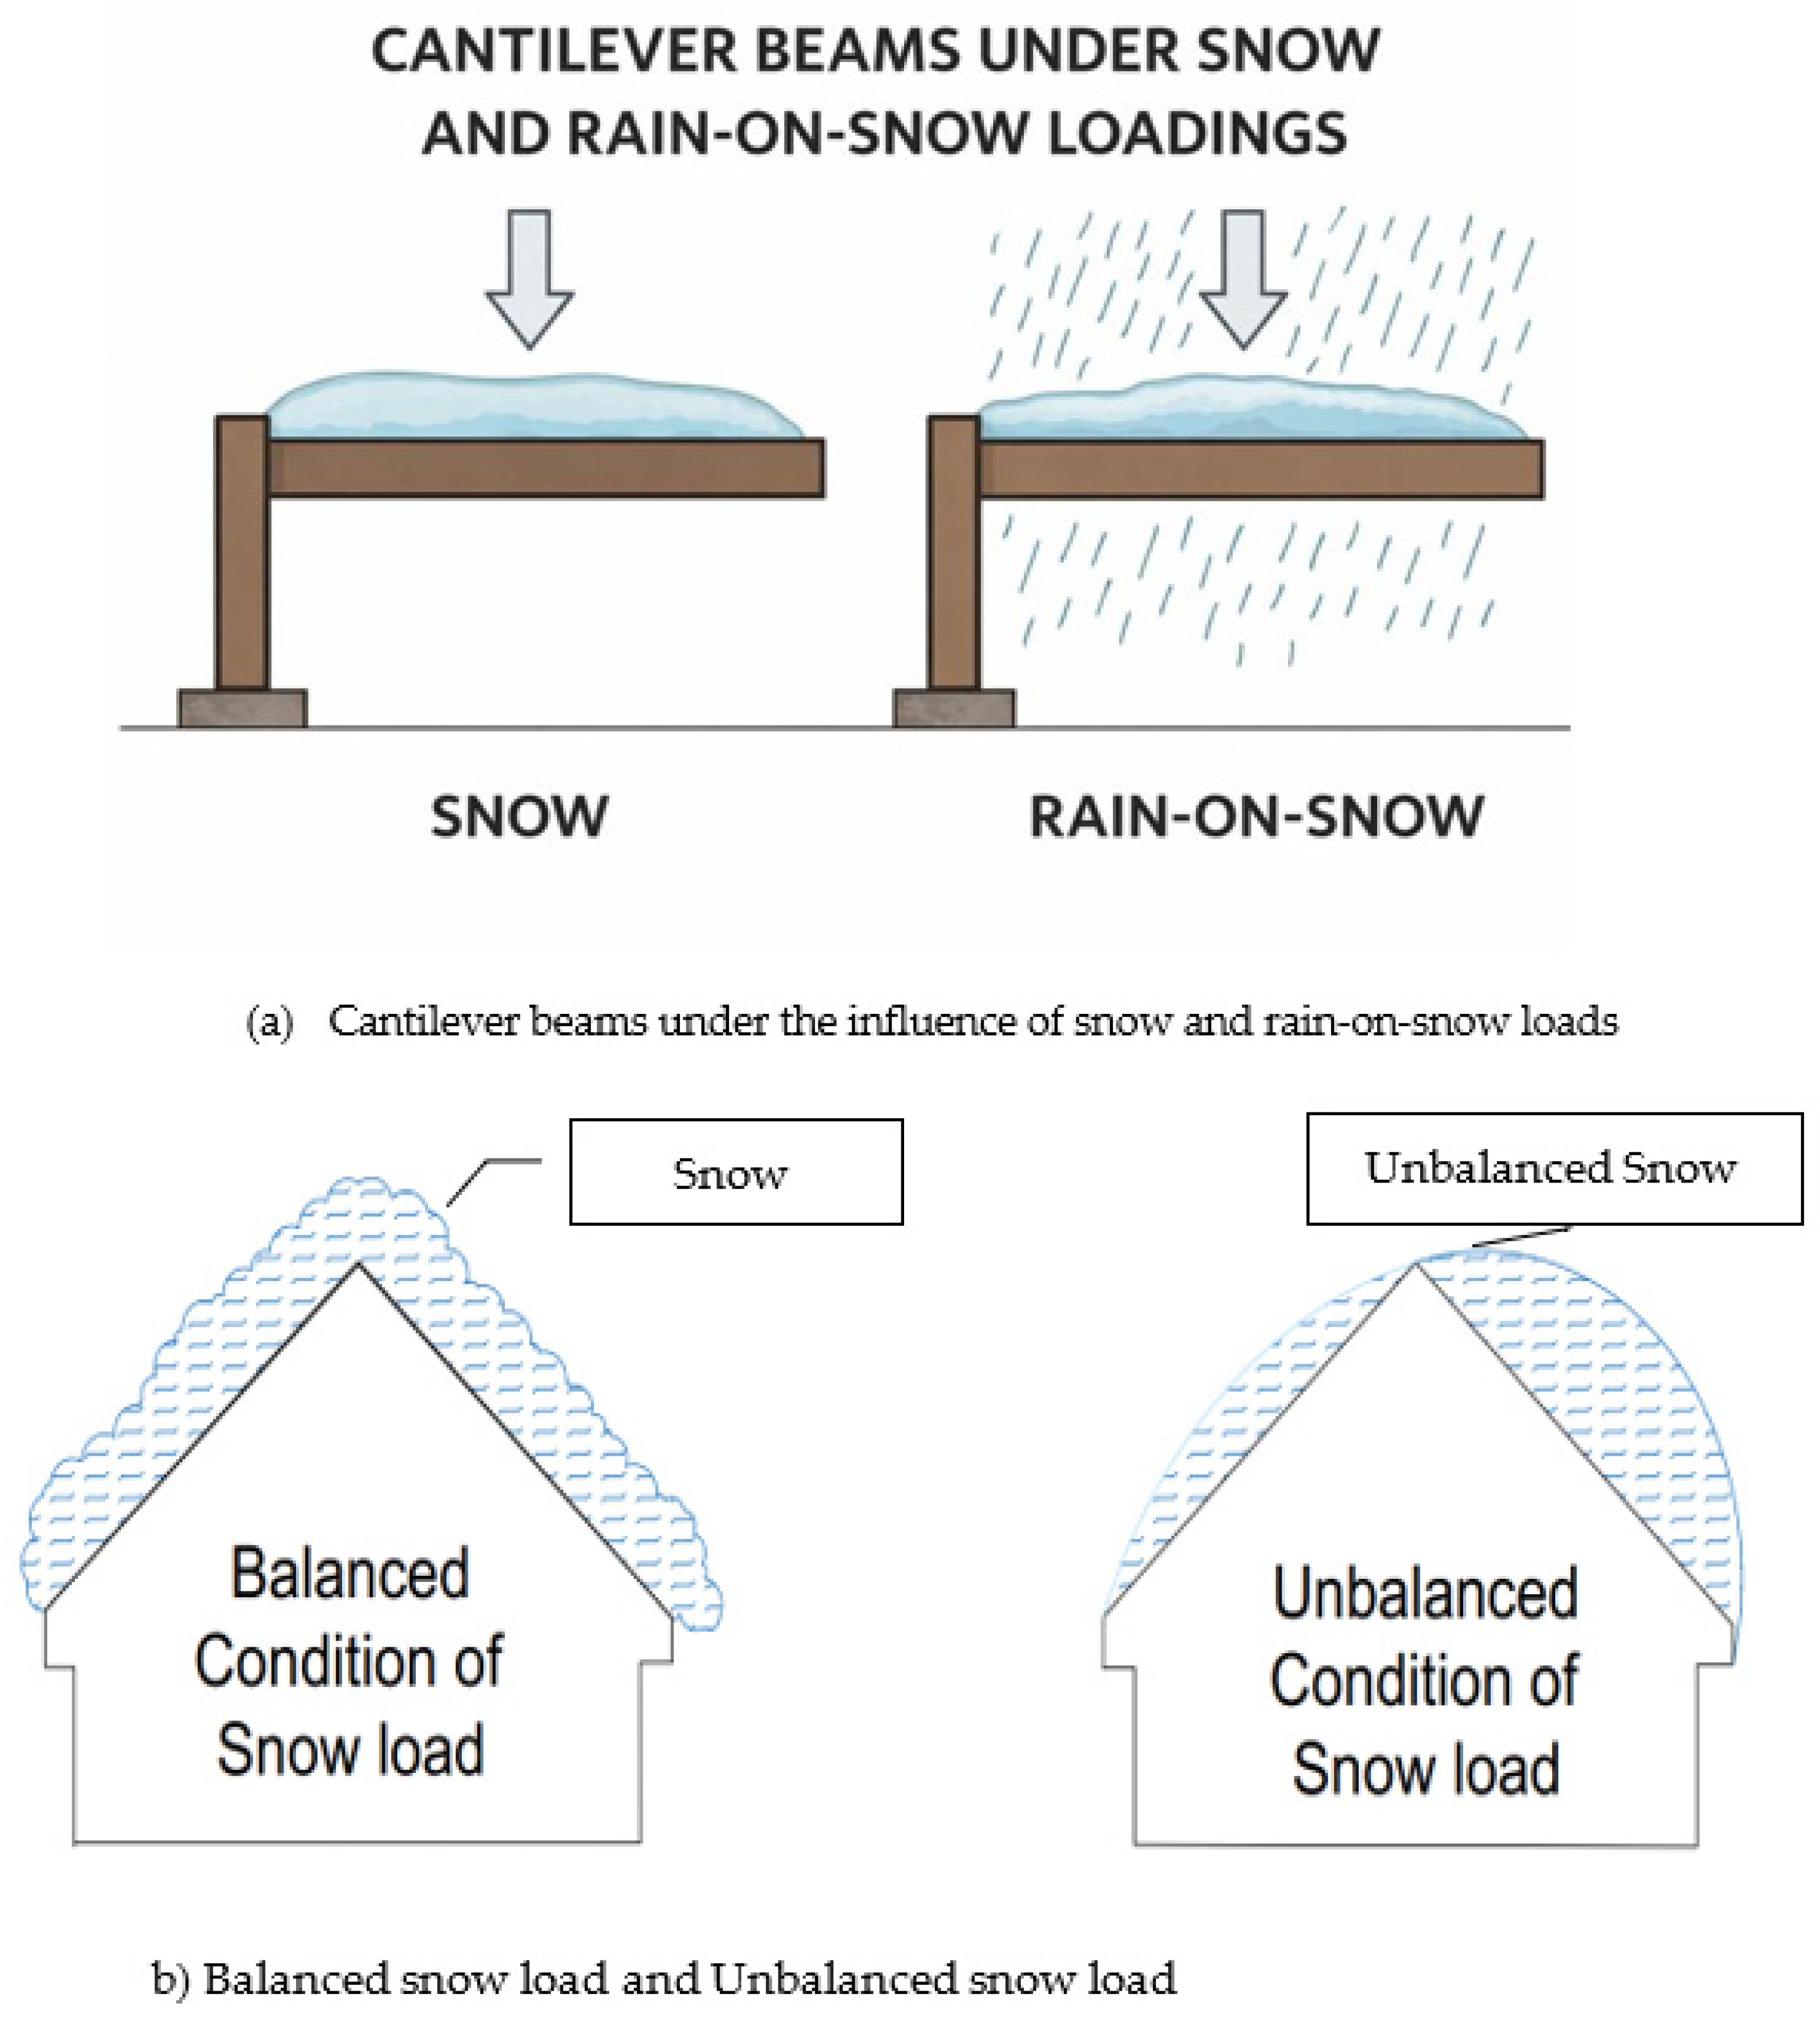
Figure 1a shows the difference between snow and rain-on-snow.
In both ASCE 7-16 and ASCE 7-22, the rain-on-snow surcharge is explicitly defined only for regions where a design ground snow load is specified. In ASCE 7-16, this is addressed in Section 7.10 (Rain-on-Snow Surcharge), while in ASCE 7-22, the same requirement is retained in Section 7.8, with application tied to the balanced snow load derived from mapped ground snow load values (ASCE 7-16, Figure 7-1; ASCE 7-22, Figure 7-1) [
19,
22]. Consequently, in zero-ground snow load areas, the standard does not explicitly require consideration of rain-on-snow surcharge, as snow accumulation is not assumed to be a governing design action.
The term “designer’s viewpoint” is used to reflect this limitation of prescriptive code provisions rather than to suggest arbitrary application. Both ASCE 7-16 and ASCE 7-22 recognize, through Section 1.3 (General Requirements), that load effects not explicitly prescribed may be considered when justified by site-specific conditions, structural configuration, or environmental exposure [
19,
22]. In this sense, the consideration of rain-on-snow or ice-related surcharge in zero-ground snow load regions is not mandatory, but may be evaluated as a supplementary, conservative check based on professional engineering judgement when atypical cold-weather events, drainage retention, or freezing-rain mechanisms present a credible risk.
2.2. Unbalanced Roof Snow Loads
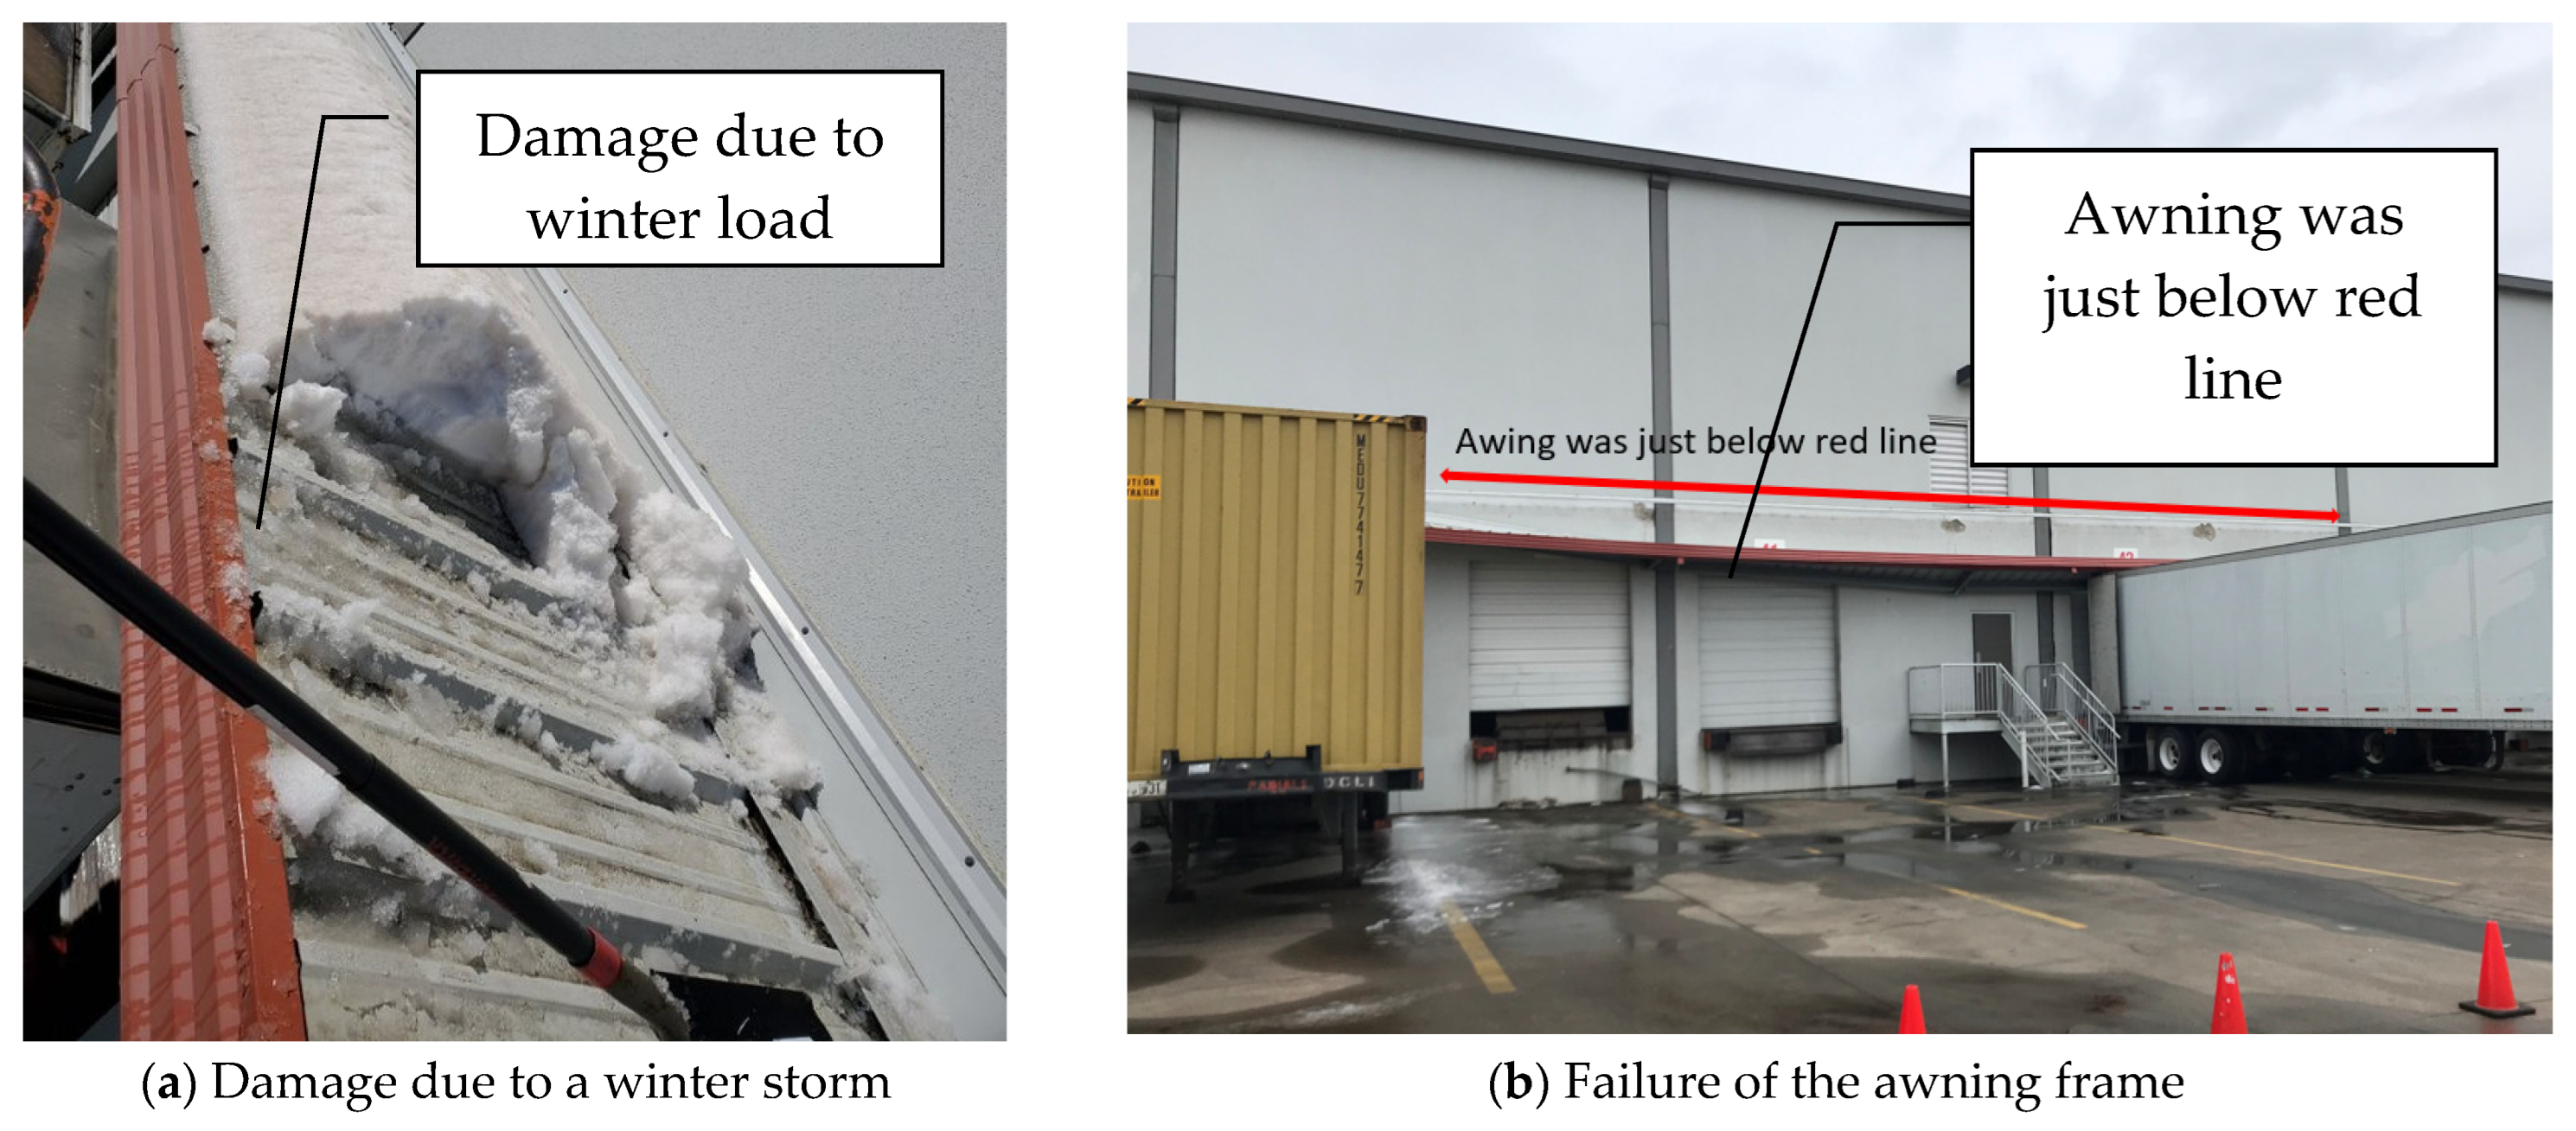
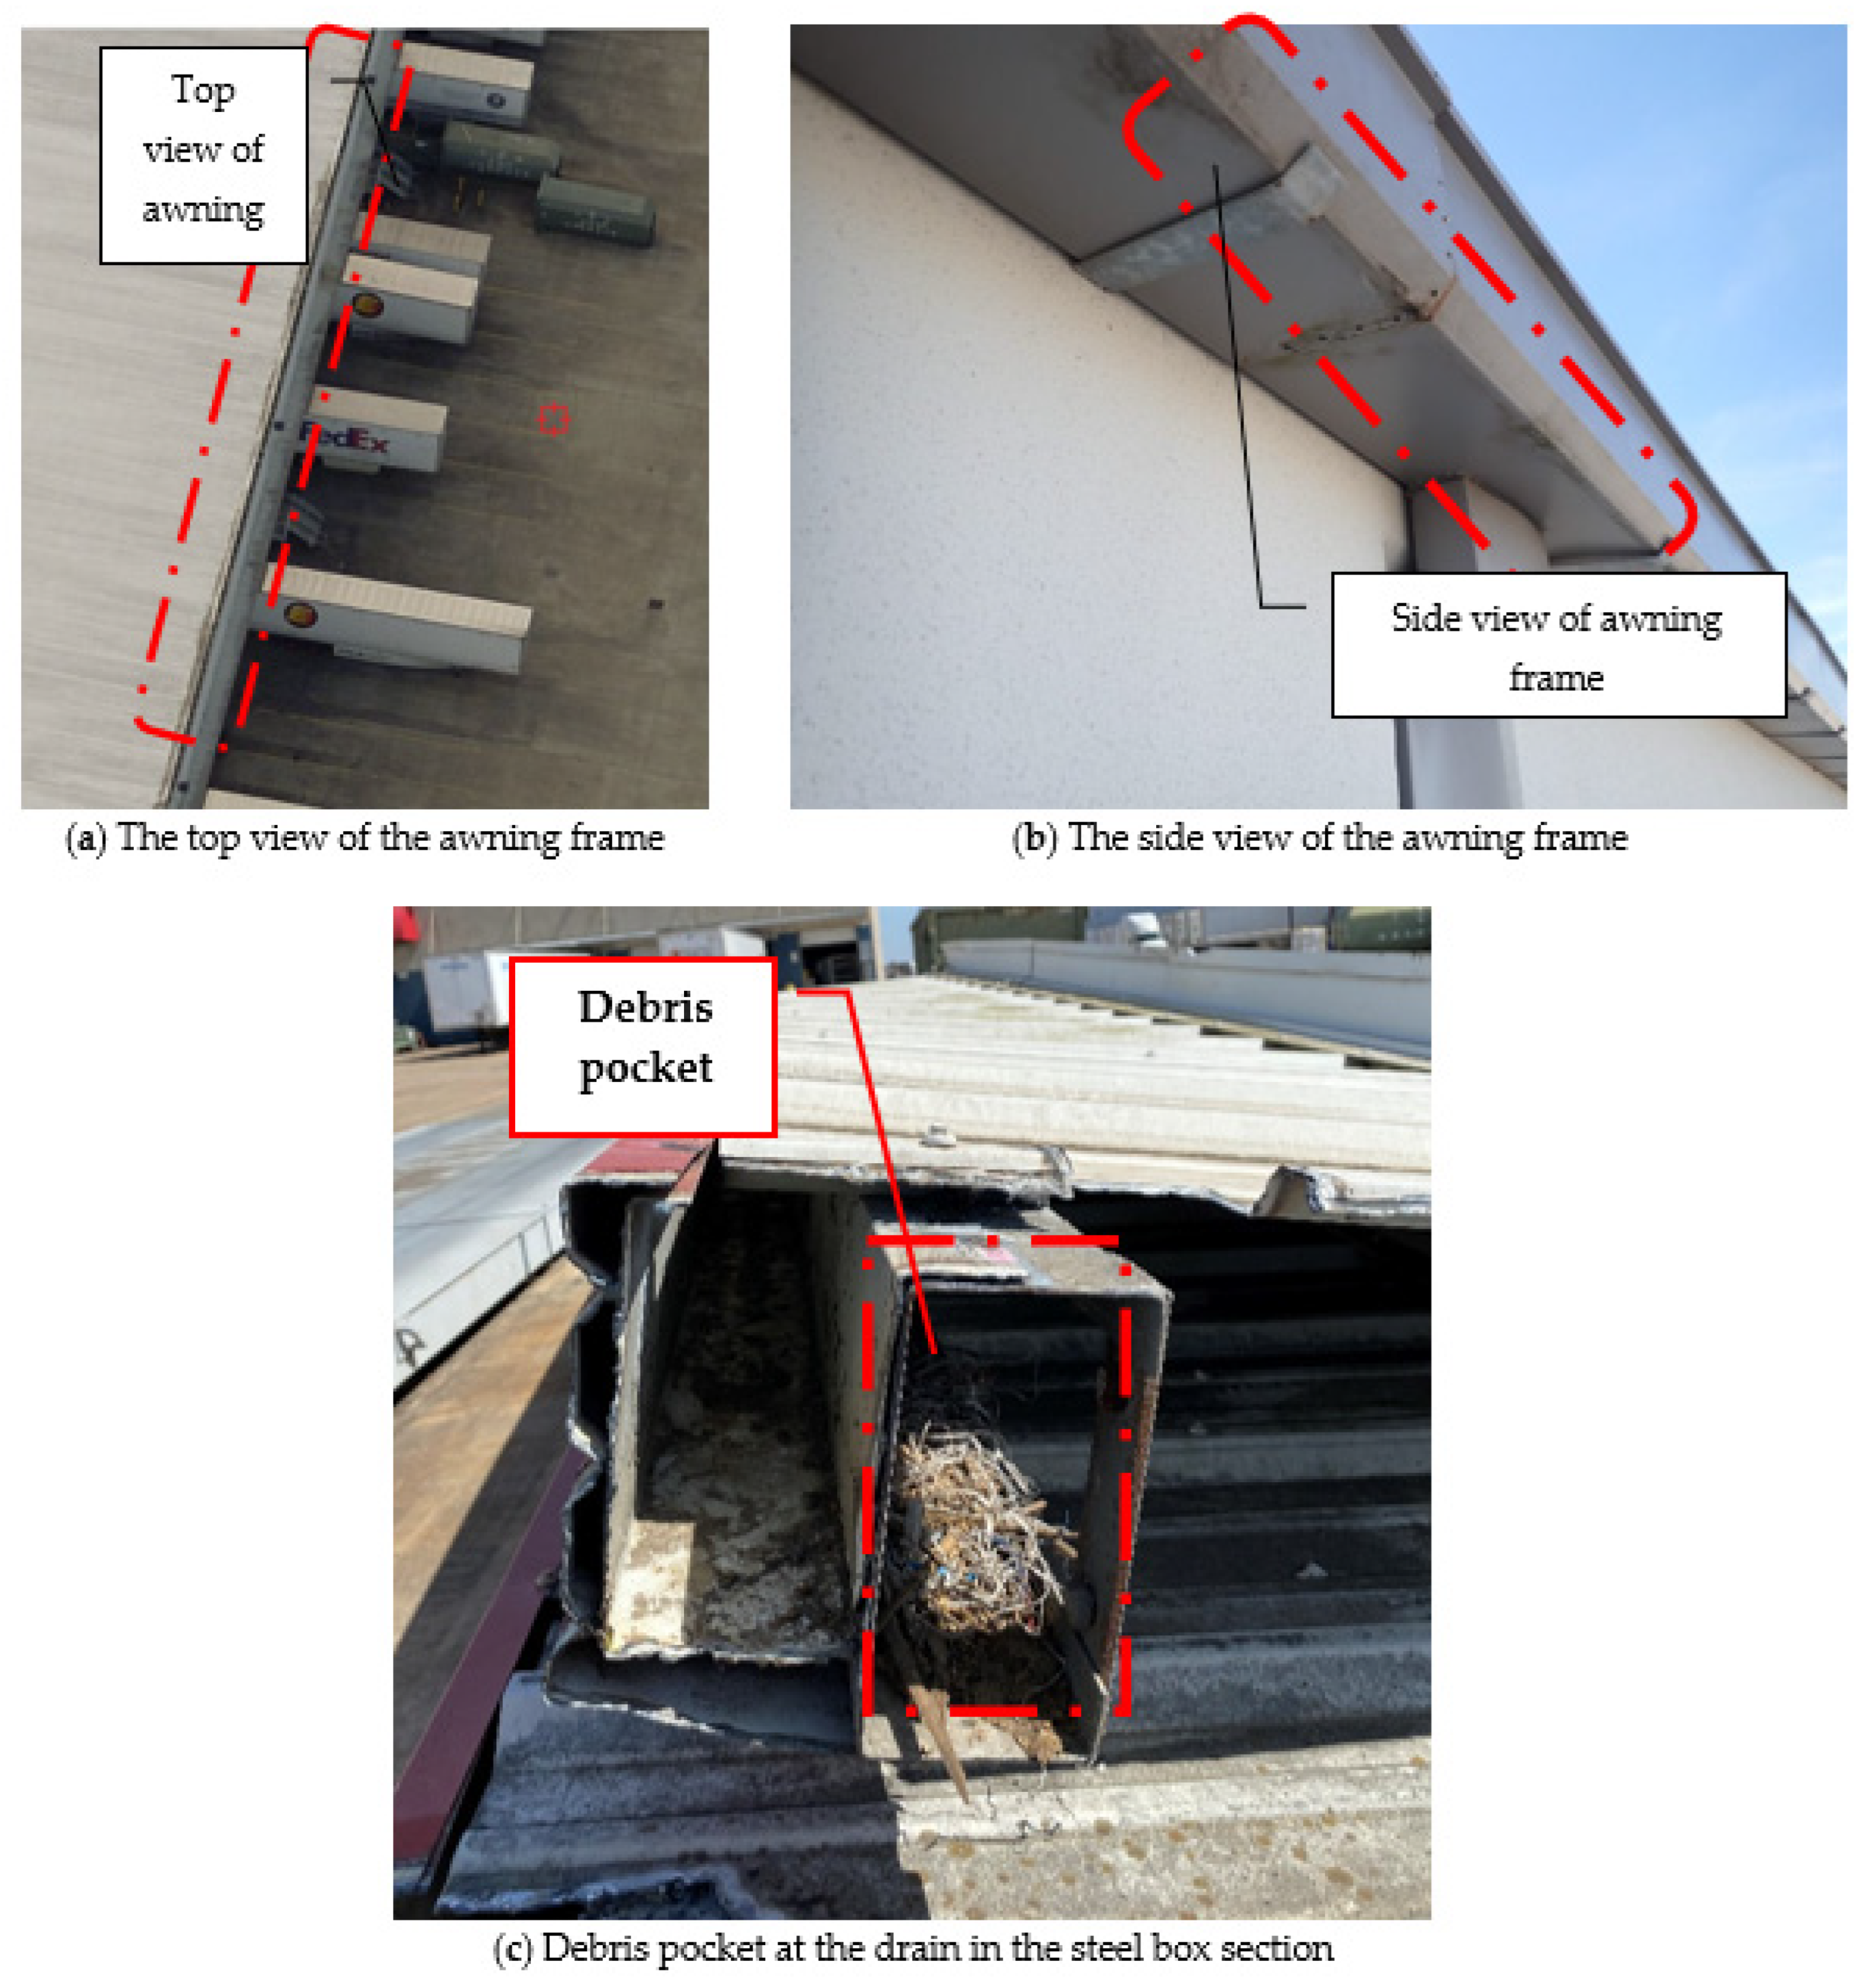
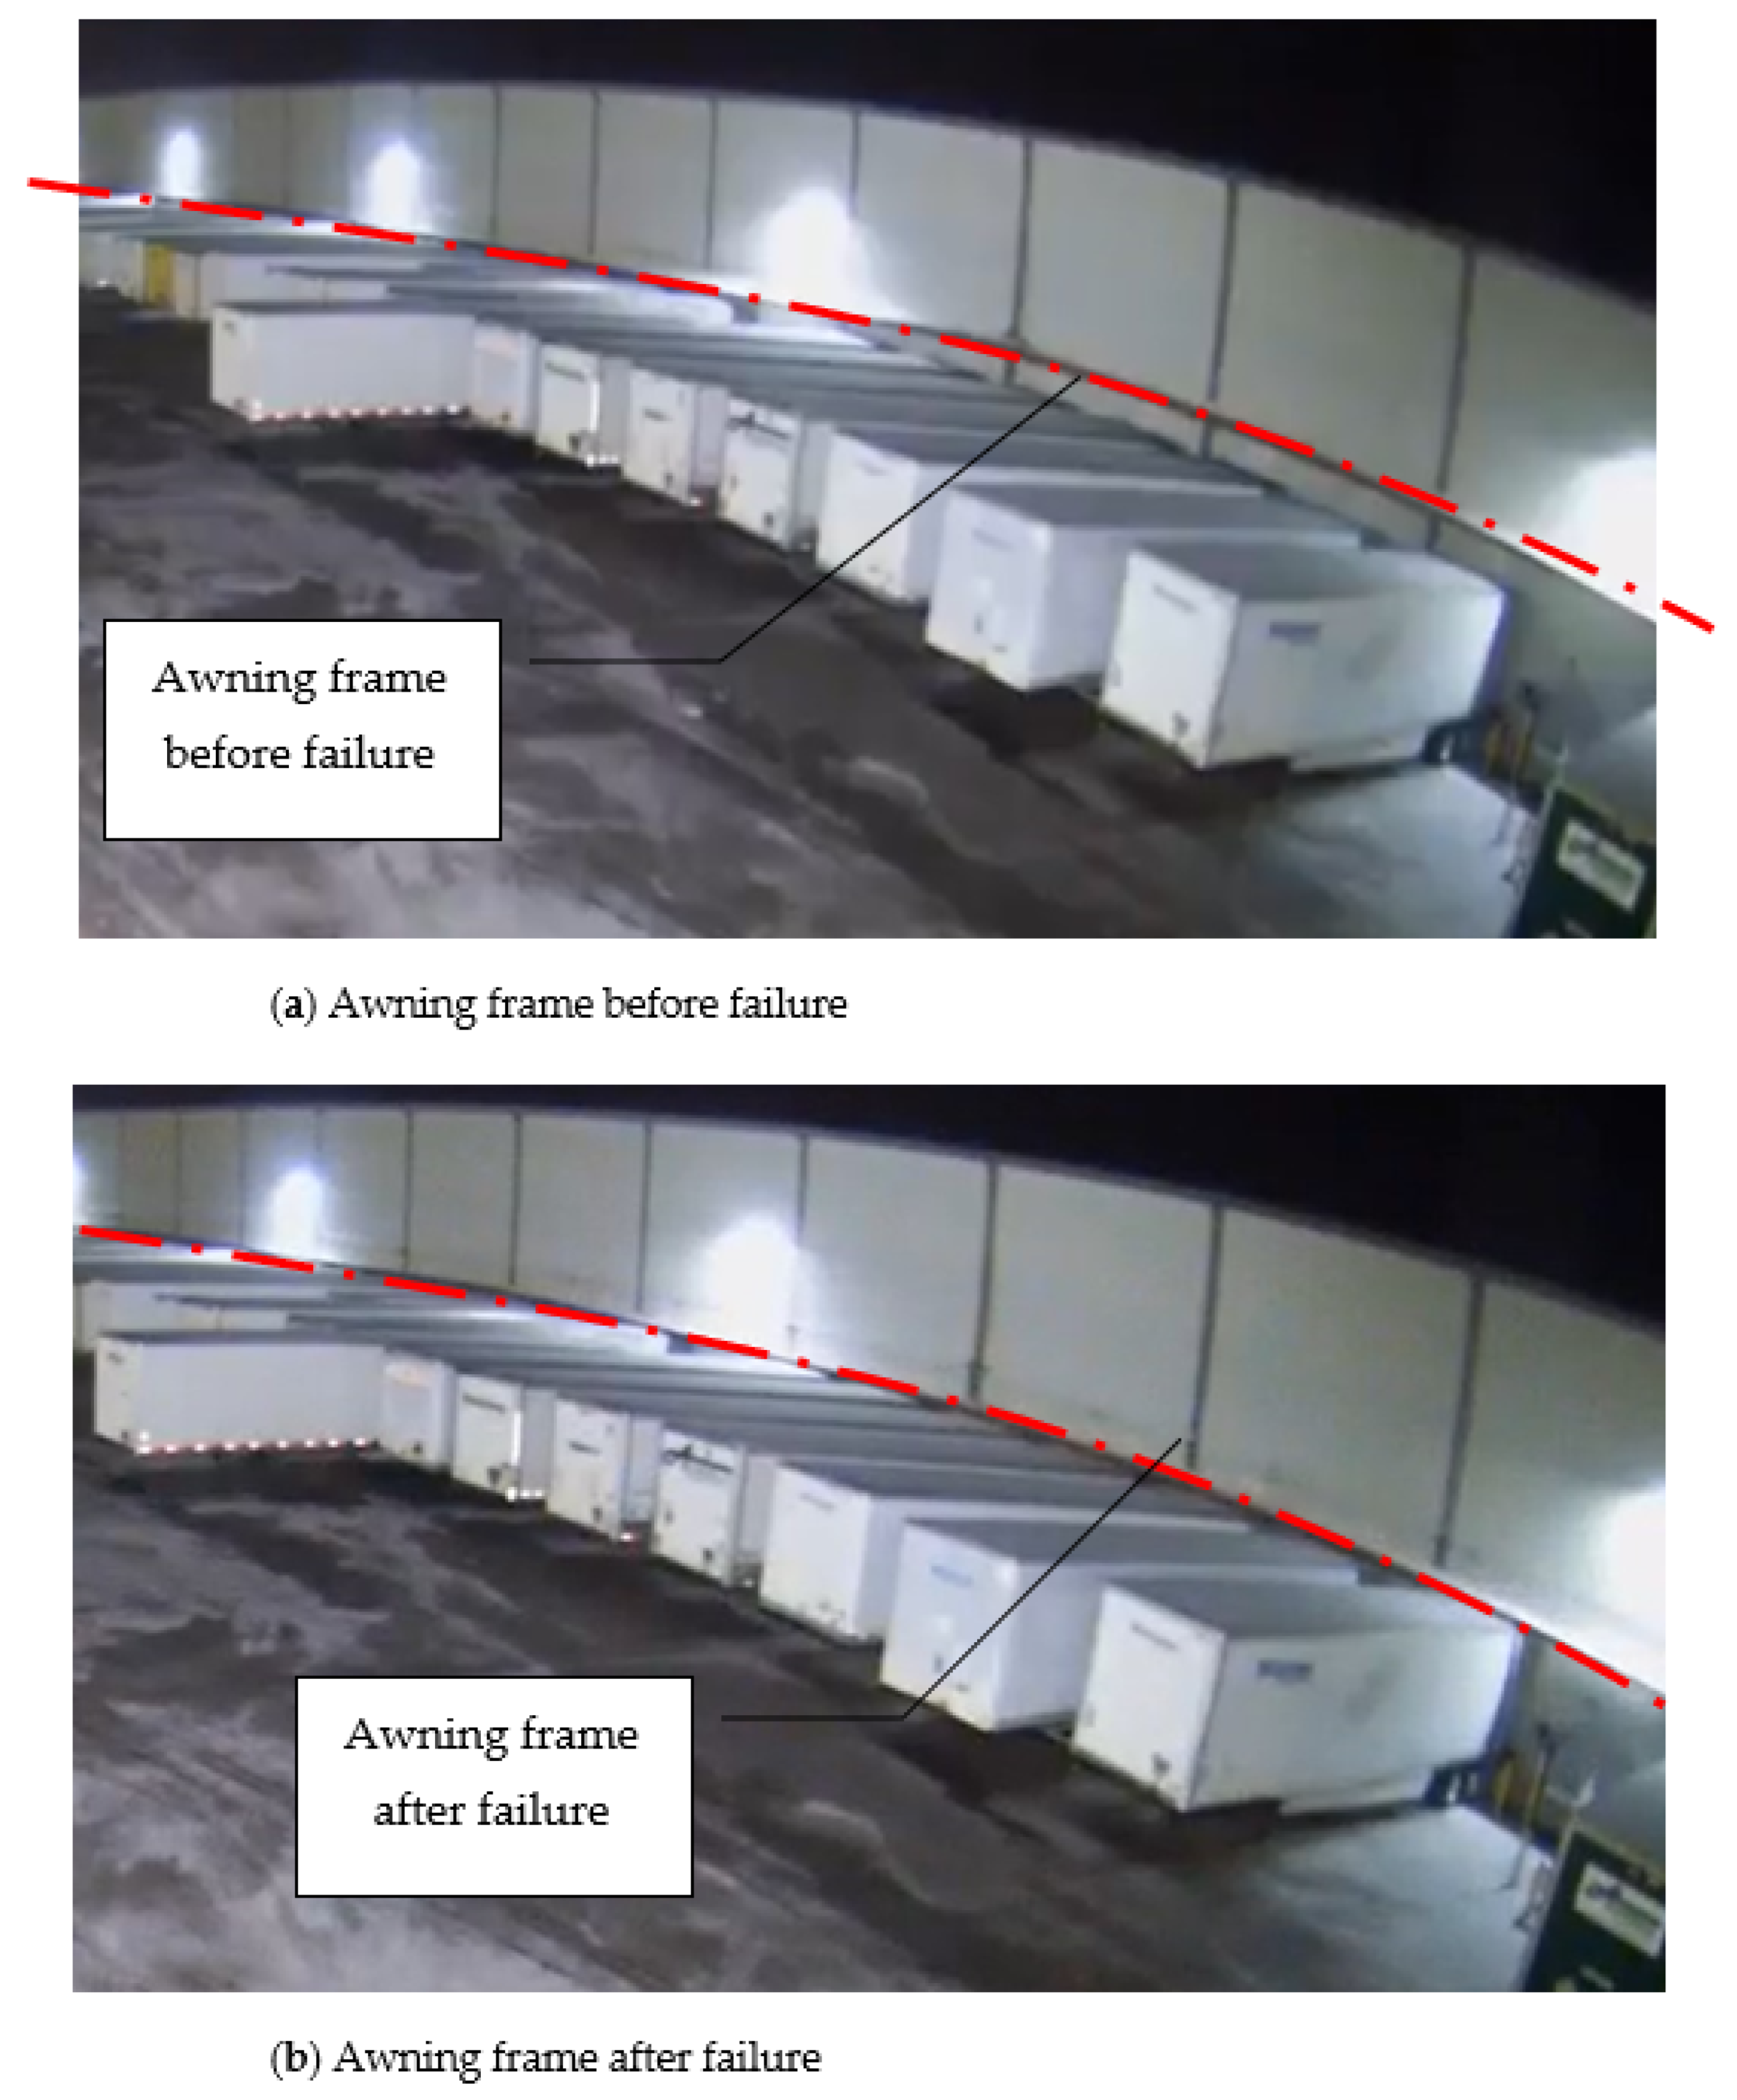
The unbalanced snow loads are related to the direction of wind and sunlight, but here, we discuss other aspects based on on-site investigations. During the inspection of failed awning issues, a leak from the upper roof was the dominant load due to the accumulation of ice on the awning. In winter storms, the load from the accumulation of ice from the watershed is unpredictable, specifically when the awning is located in the shade and upper roof overhangs have enough sunlight exposure during the day. This makes the ice mass thicker over time and forms a dome-shaped accumulation of ice with a density of over 56 pcf (2.68 kN/m
2) (ASCE-7-16) [
19].
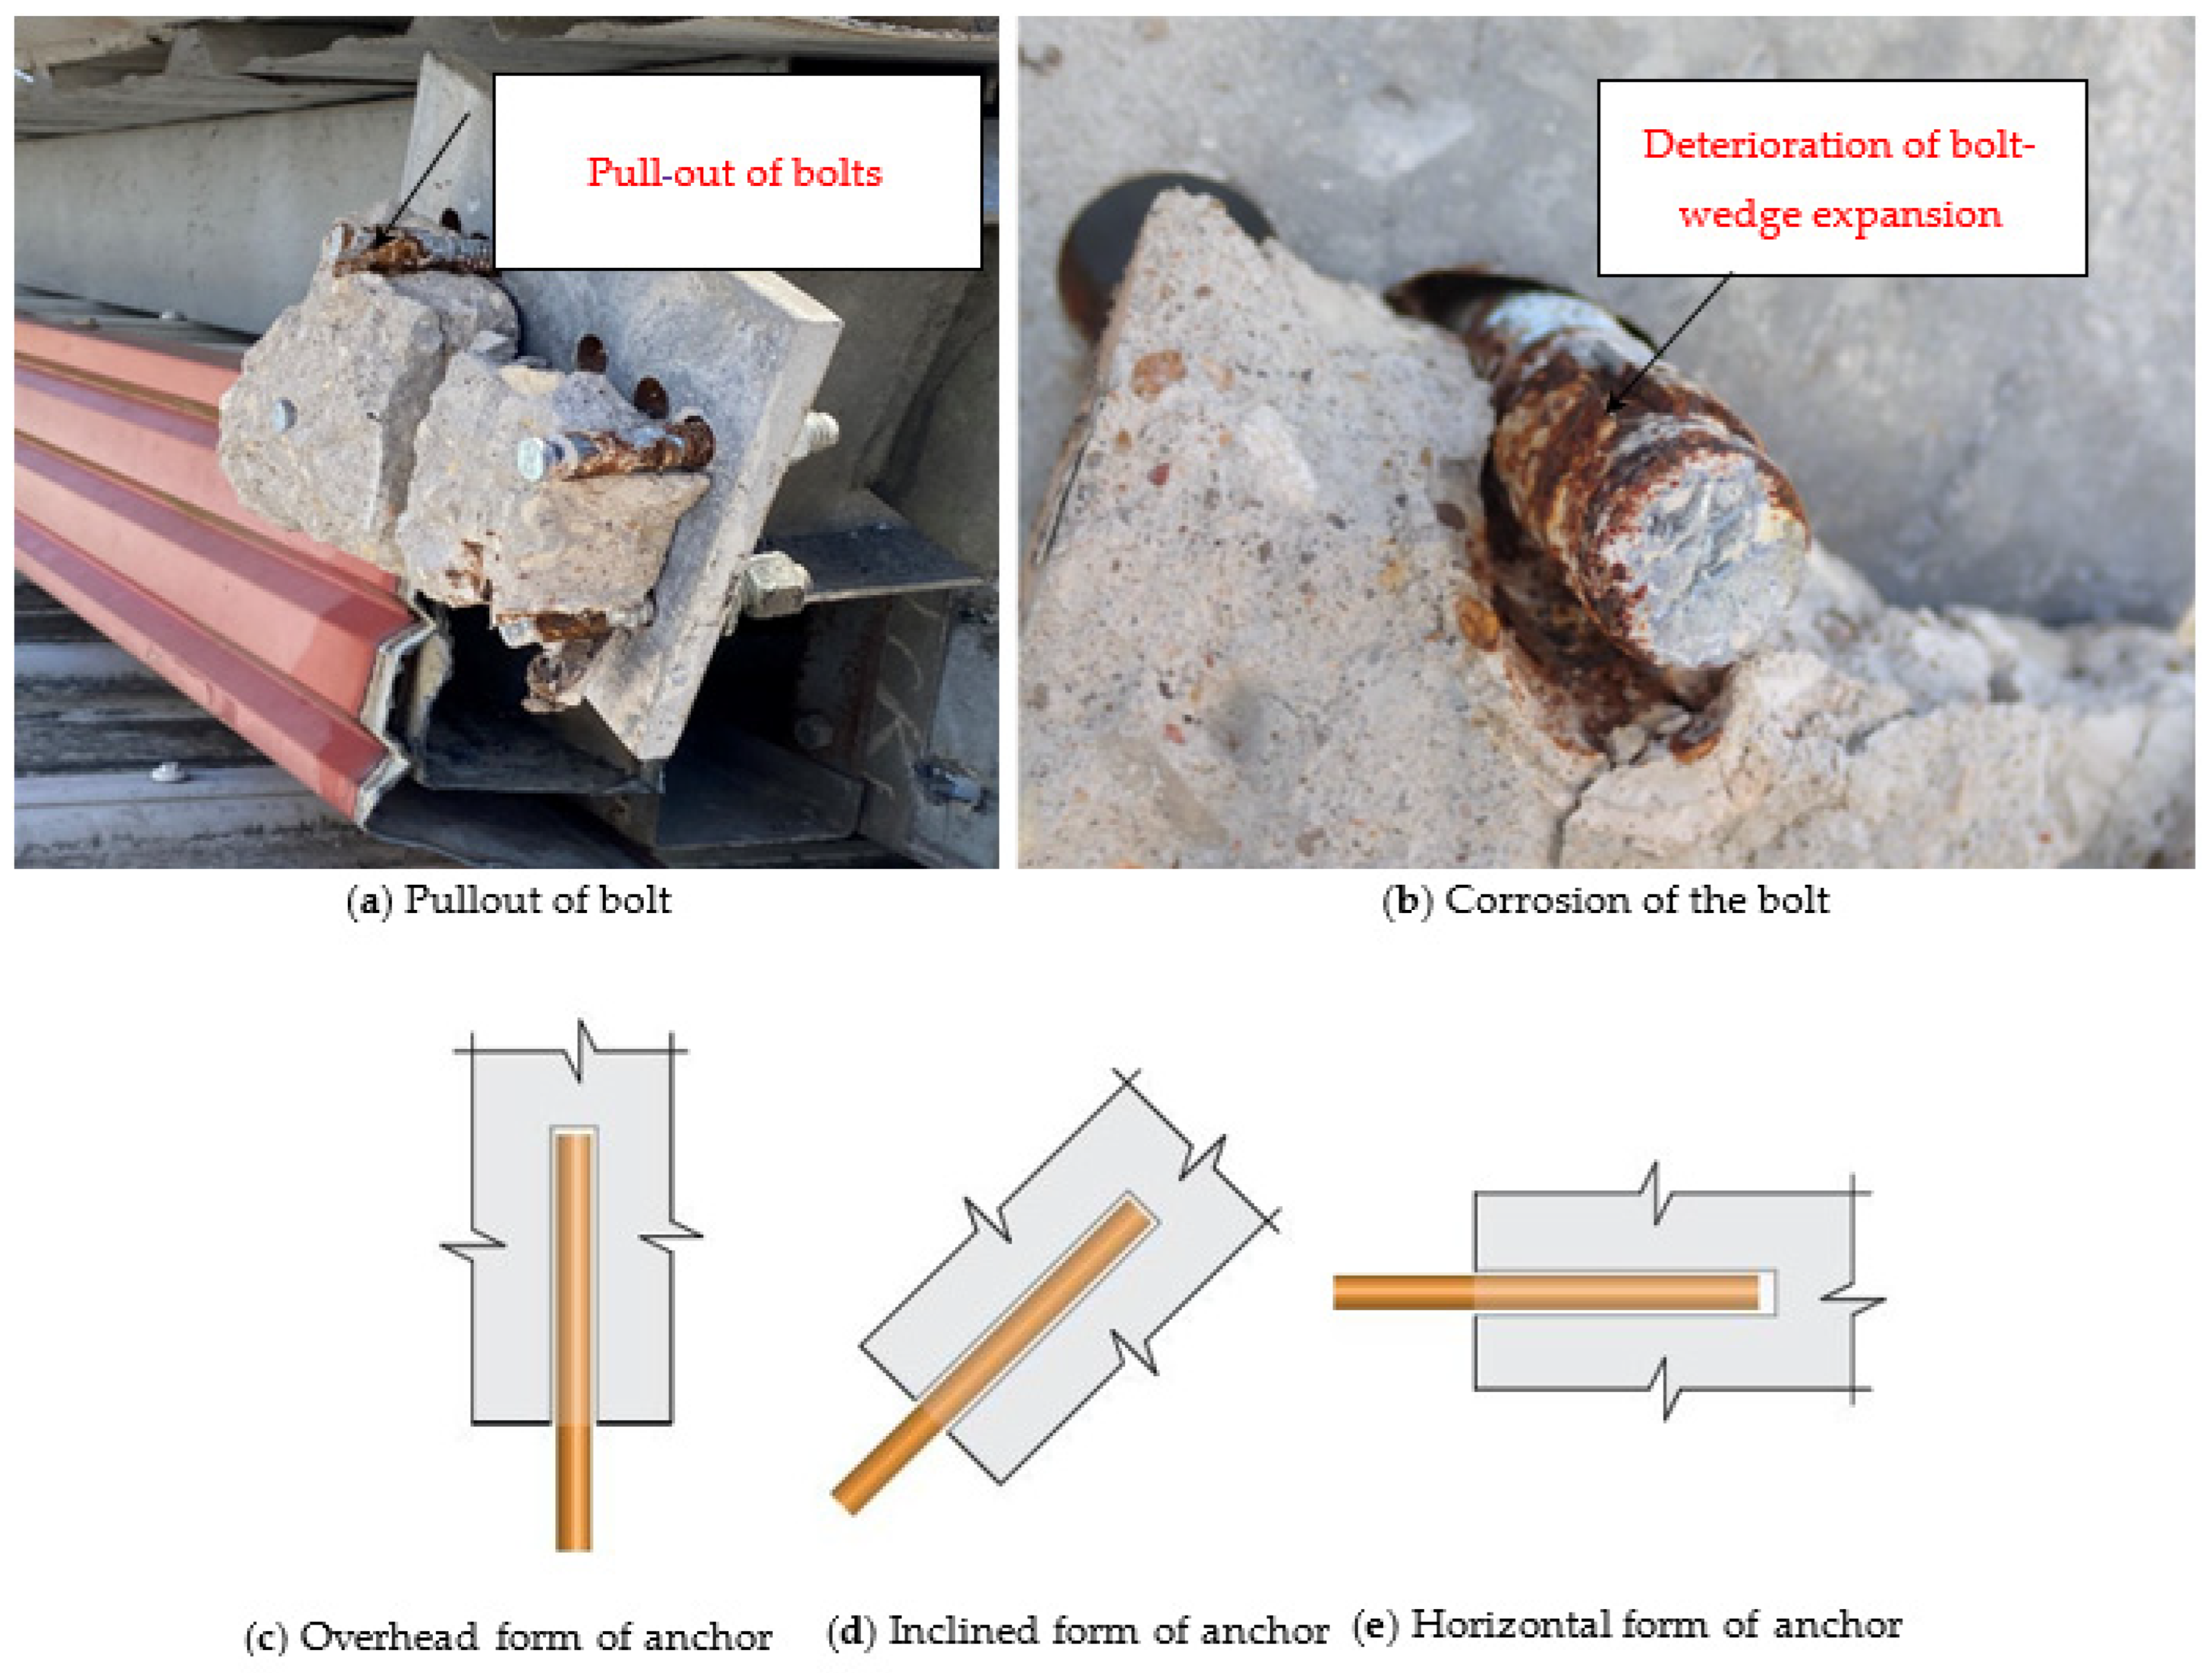
It is way beyond snow density and can endanger the awning beam and connections when reached at the yielding point, rupture, or pullout of anchor bolts. The accumulation of icicles at the tip of the cantilever beam, which is already frozen and even has a thin layer of ice, can be another source of structural overloading. This kind of loading is indirect, and adjacent elements, such as slopes, can induce this surpassing load on the structure. The possible loading pattern is somehow identical to the snow drift loading or unbalanced loading per structural layout, types of roofs, and designer judgment.
Figure 1b shows the definition of unbalanced roof snow Loads [
23]. Unbalanced snow load, including sliding snow from adjacent or upper roof surfaces (
Figure 1b), is an important load case in structural design and can significantly increase local demand. However, based on the post-event observations discussed in this study, the failures observed after the winter storm were not primarily governed by sliding snow from the upper roof. Instead, the dominant mechanism was associated with indirect ice-related loading, arising from freezing rain, water retention, and subsequent ice accumulation on lightweight canopy systems, rather than classical unbalanced or sliding snow load scenarios. While snow sliding may have contributed locally in some cases, it is considered a secondary effect rather than the main cause of the observed failures.
4. Rectifying the Breakout Strength of the Anchor in Tension
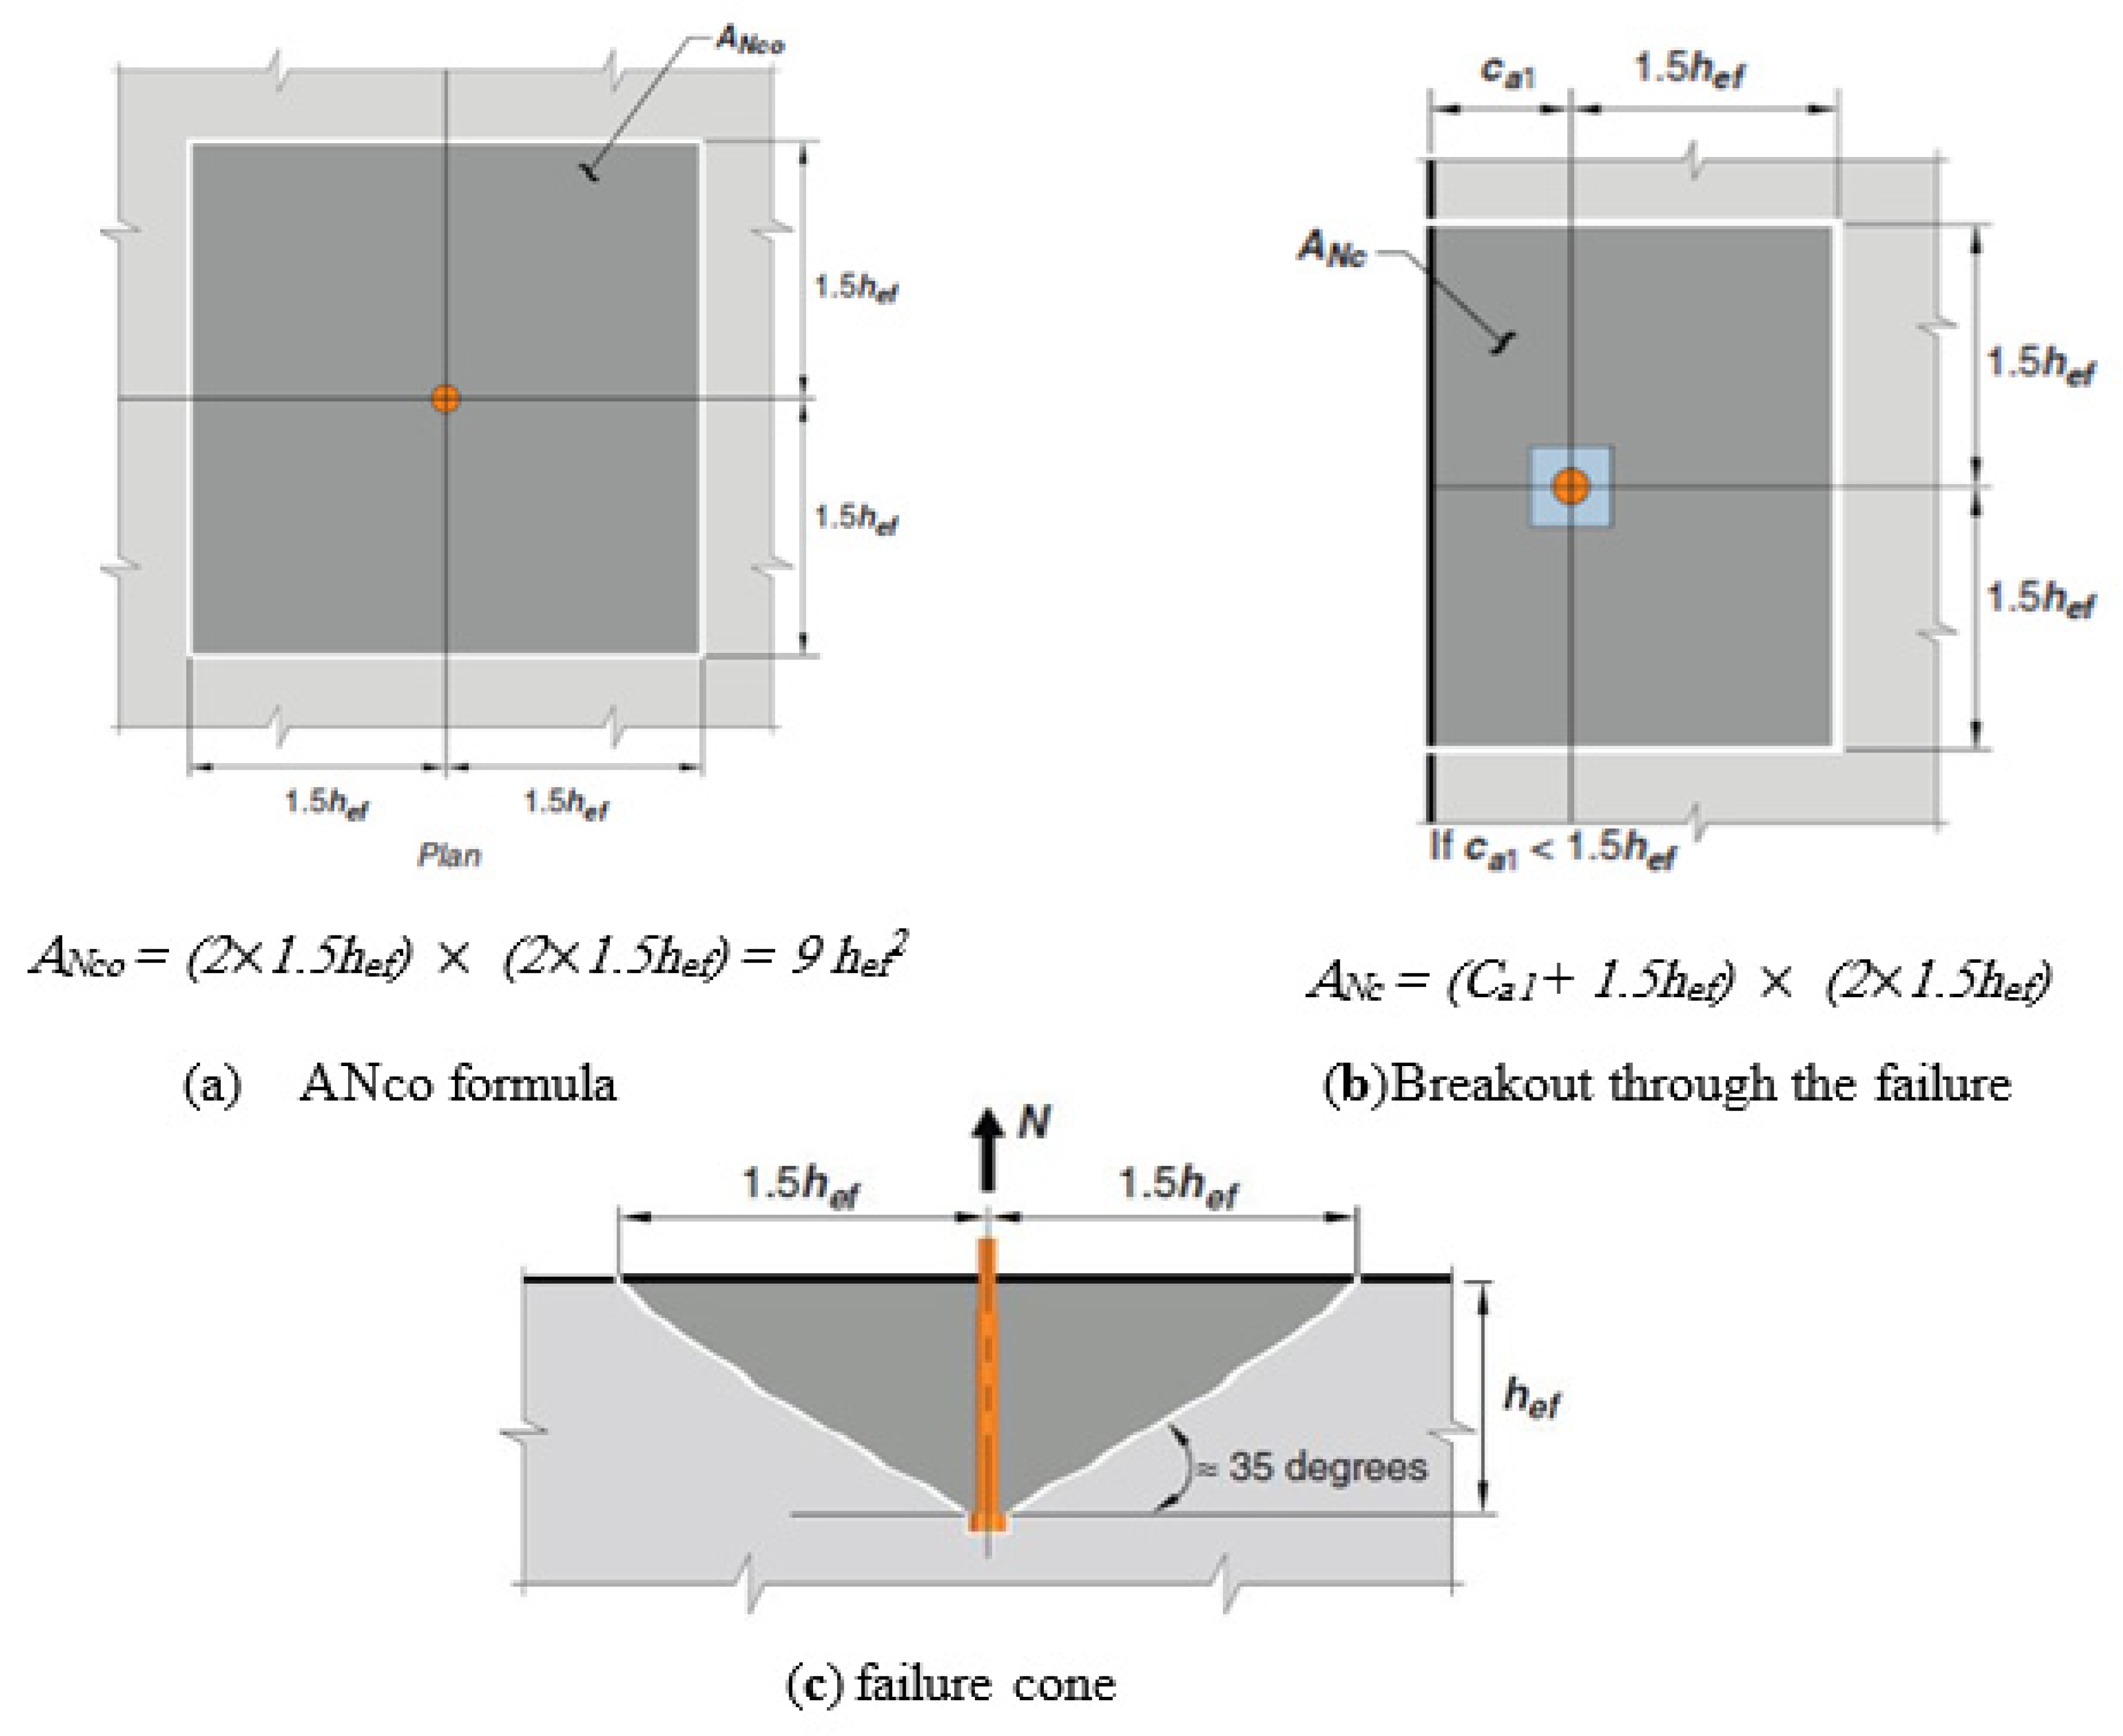
The ACI318-19 chapter 17.6.2.1. a offers the following formula for the breakout strength calculation. In
Figure 3, the projected failure area and fracture angle are depicted [
24].
where
Anc = projected concrete failure area for the group of anchors, considering the spacing in between anchors
Anco = 9hef2
Ψec,N = Modification factor for eccentrically loaded anchor groups = ≤ 1
Ψed,N = Modification factor for edge effects if C > 1.5hef this factor is 1.0 otherwise = 0.7 + 0.3C/1.5hef and C = edge distance
Ψc,N = Crack factor, it is 1.4 for post-installed anchors in uncracked sections.
Ψcp,N = Potential mode of failure from splitting if C > 2.5hef then factor = 1 otherwise equals to C/2hef
Nb = Basic concrete breakout strength of a single anchor in tension in cracked concrete =
kc.λhef1.5 assuming concrete breakout with an angle of 35 degrees (
Figure 3),
kc = 24 for cast-in anchors and 17 for post-installed.
Figure 3.
Details of anchorage breakout through the failure cone.
Figure 3.
Details of anchorage breakout through the failure cone.
In the above formula, per site observation, anchor locations near the edges show severe damage from breakout. The Anc factor in this formula is related to the geometry of the projected area of the fracture surface of a group of anchors, which has a distance to the edge of the concrete as a sensitive factor inside this formula. The evidence from failures shows this factor has been well beyond the code considerations for the non-edge anchors, but for the close-to-the-edge anchors, it is a very determinant factor in this formula.
Ψc,N factor for the post-installed anchors in the uncracked section is considered by default to be 1.4 and 0.96 for the uncracked section without supplemental reinforcement. R17.7.3.1 of ACI318-19 indicates that the pry-out shear resistance for short embedment up to 2.5 in (63.5 mm) can be compromised to one or two times the anchor tensile strength [
17]. The observations from the site show that although the spacing to the edge follows the code requirements
6da (Table 17.9.2a), due to a short embedment (2.5 in (63.5 mm)) and disconnection of the anchor from the active confined concrete core of the beam, it is not sufficient [
17]. The fracture pattern shows a 50-degree angle in the fracture cone, which exceeds the code assumption for this short embedment length and excessive concrete cover engagement. This factor seems to be overestimated whenever the embedment is only engaged in the concrete cover (
Figure 4).
5. Installation Defect
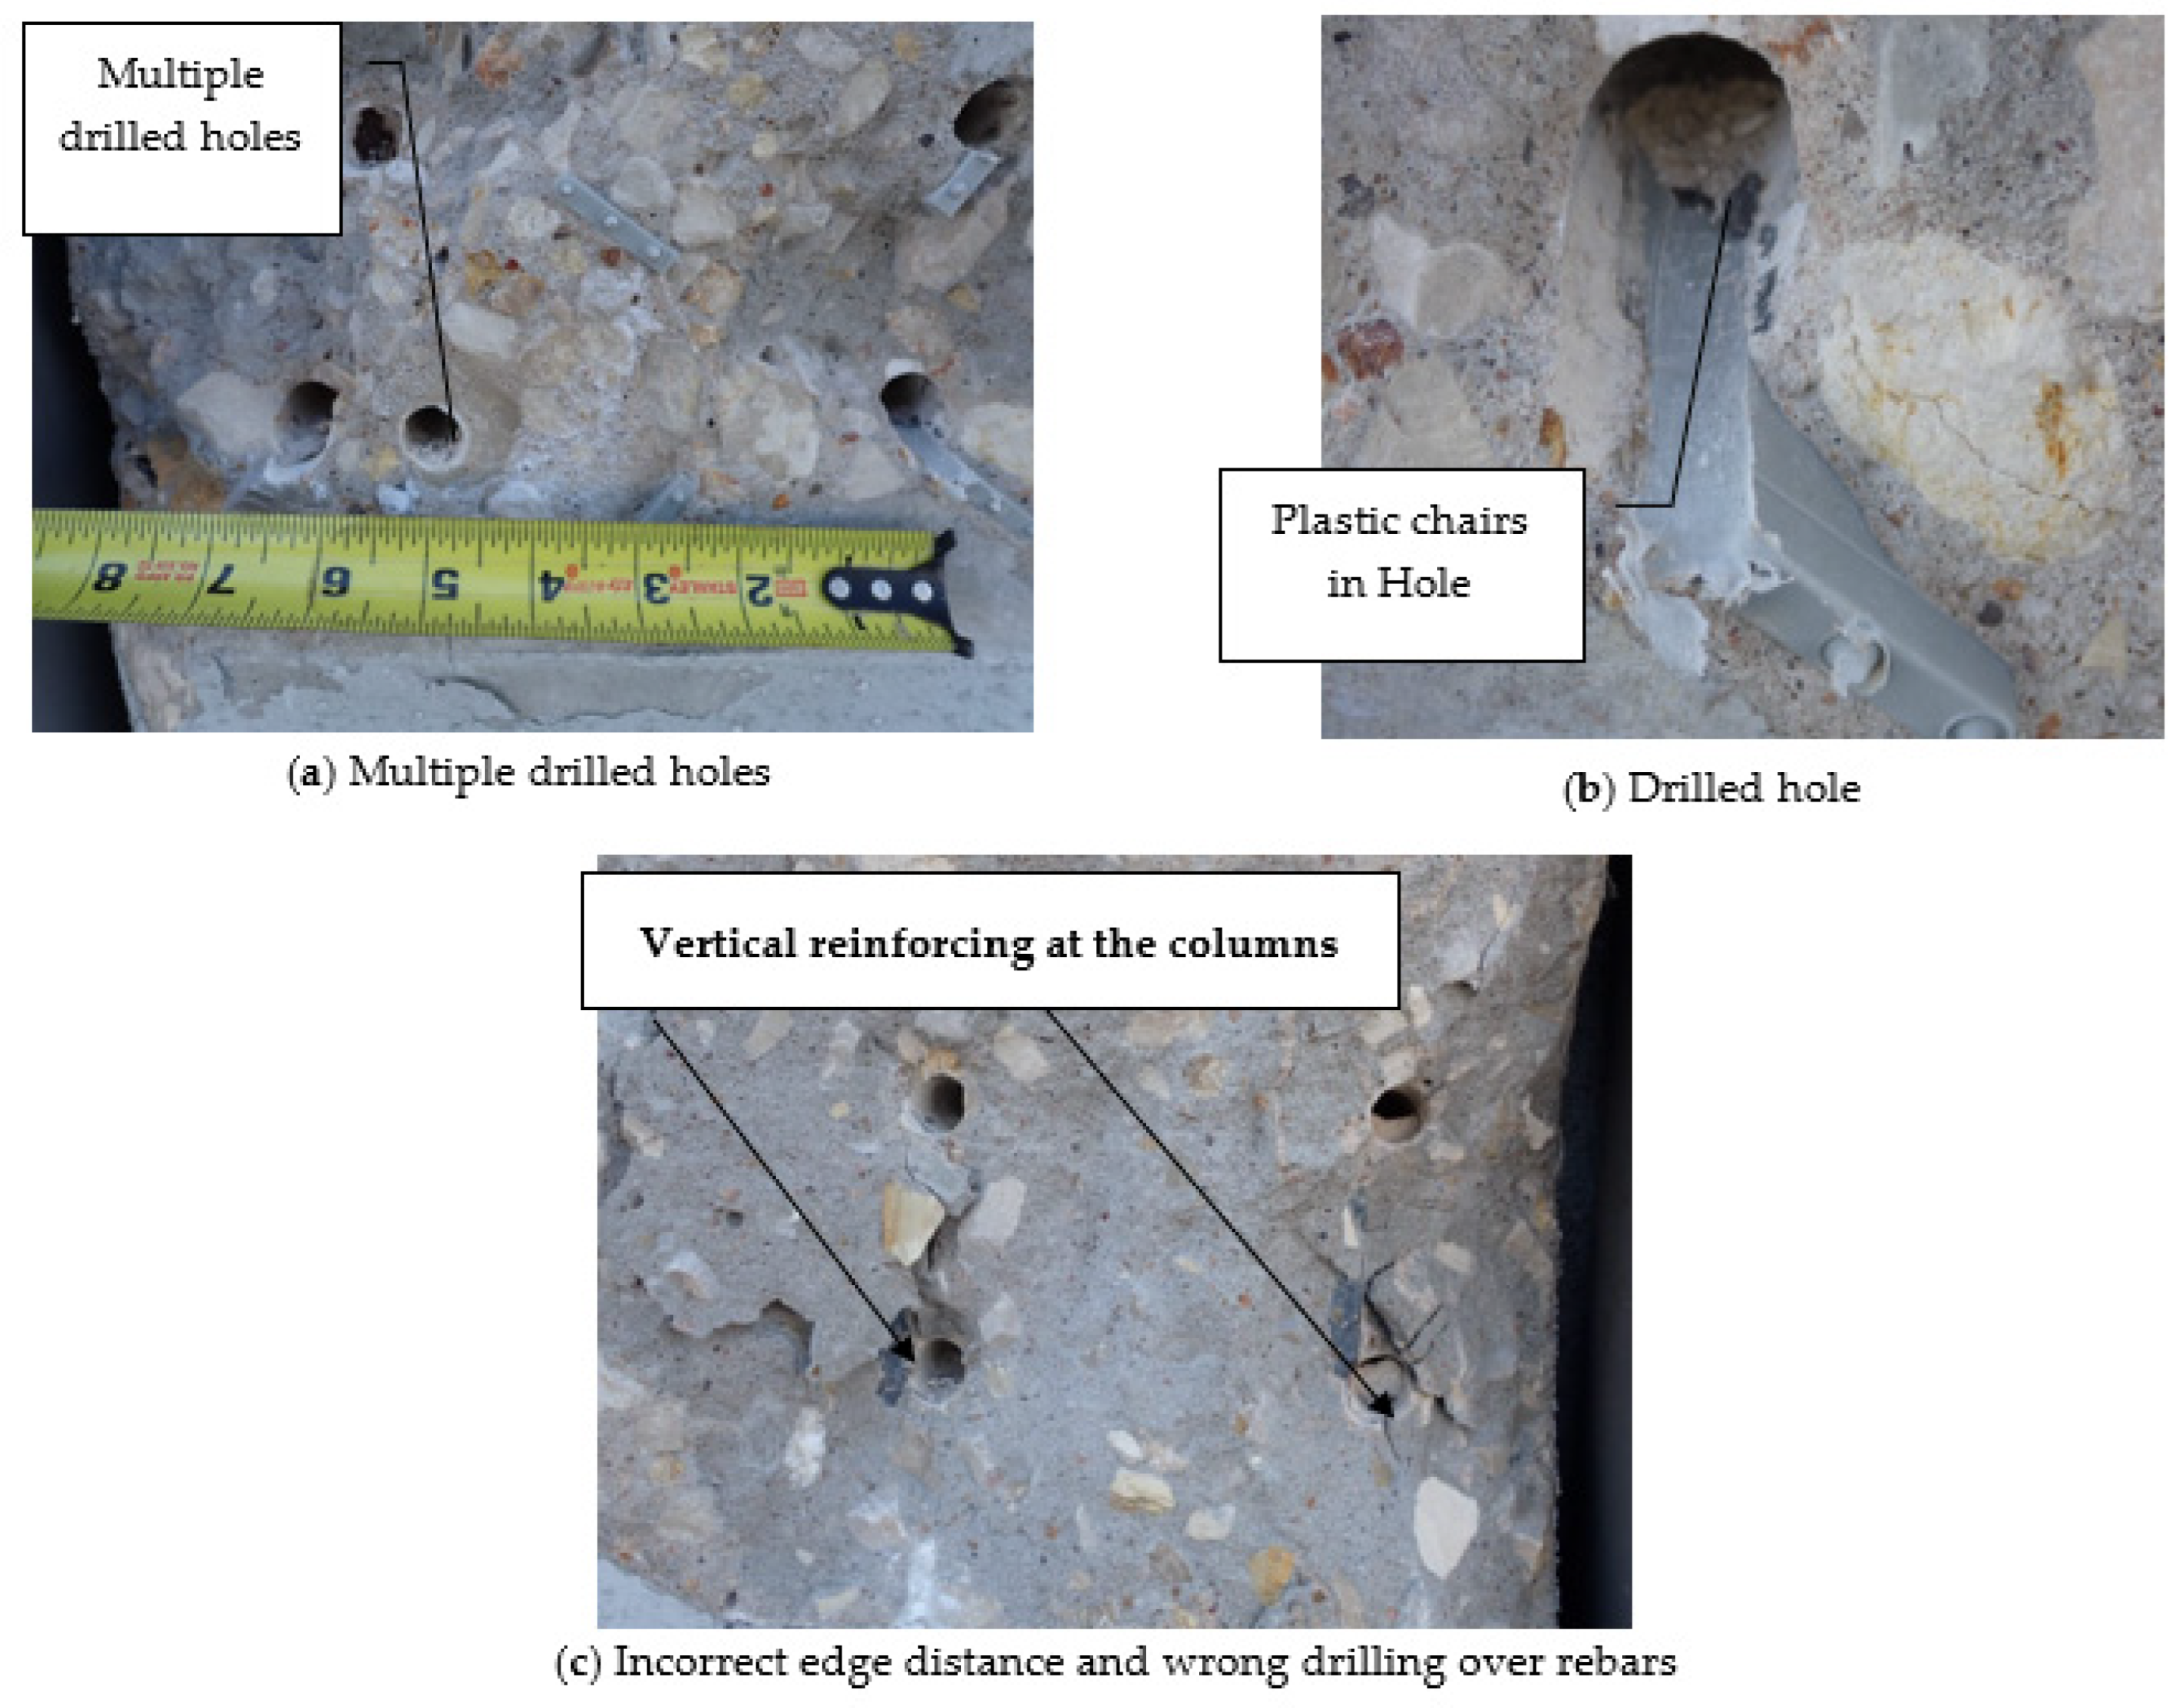
The accuracy of installation plays a crucial role in ensuring the structural integrity and performance of anchor systems, particularly in concrete applications. One of the common issues encountered during the installation of anchors is the improper drilling of holes, particularly when plastic support chairs used during the casting process are not clearly marked or properly positioned. This can lead to drilling through the plastic chairs, creating unintended holes and weakening the concrete structure. Although these issues may not always be visible, they significantly affect the interlocking process of the anchor, resulting in reduced friction and, ultimately, a decrease in the anchor’s load-bearing capacity. Additionally, incorrect edge distances and misalignment of the drilled holes can lead to severe issues such as premature splitting failures, further compromising the anchor’s effectiveness. The following section discusses the impact of these installation deficiencies and provides recommendations to mitigate these risks and ensure the anchors perform optimally under load.
5.1. Drilling of the Plastic Support Chairs
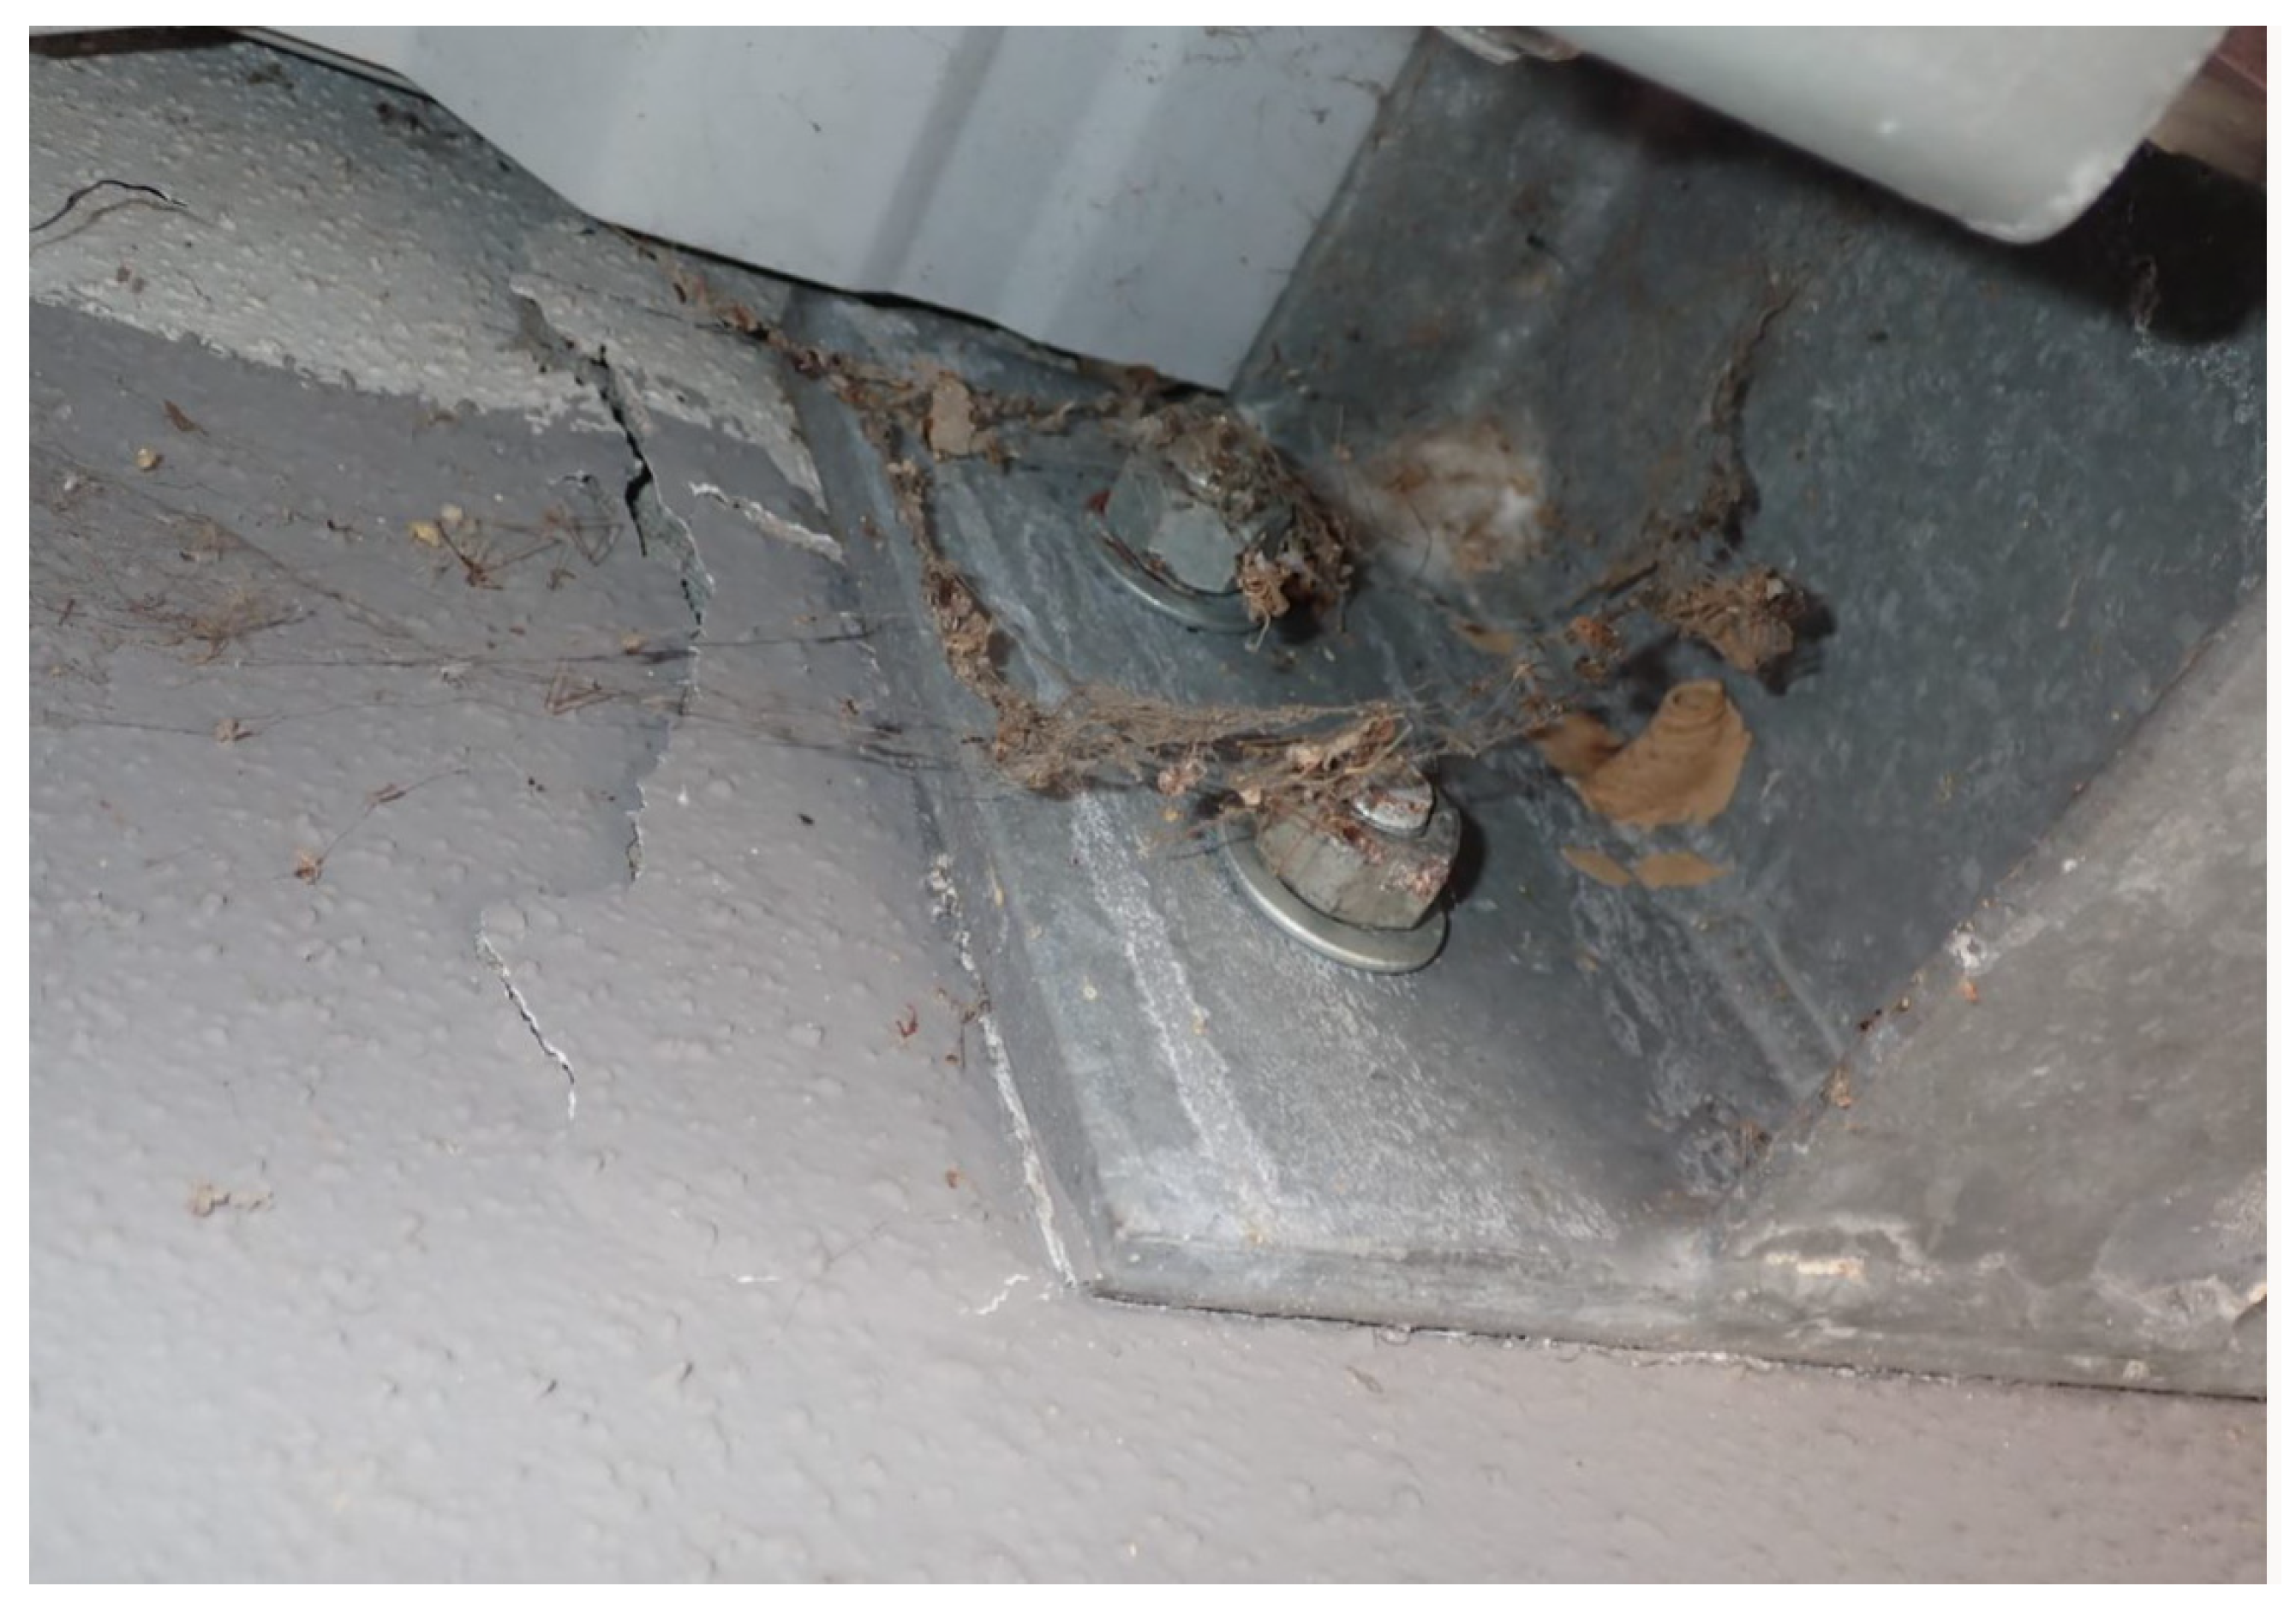
The drilling of the plastic support chairs used in casting concrete is another factor of anchorage deficiency, as the location of the plastic chairs is not clear to the installers. There’s a possibility that they run drilling through them, and installers may find it and create another hole nearby. It makes the concrete weaker, although they may not be able to visualize any evidence and installs the anchor in contact with the plastic chair, which results in less friction during the interlocking process (
Figure 5).
The
Ψcp, N is the bond splitting factor, which is a key driver in critical scenarios; it is given by
Cac/2
hef, where
Cac is the critical edge distance. In
Figure 5, the presence of a wrong-drilled hole one inch apart from the new-drilled hole makes
Cac = 1. This factor will severely reduce the breakout strength due to a premature splitting failure. Considering
hef = 2.5 in (63.5 mm), this factor will drop the breakout strength by 80%.
5.2. Recommendation for Drilling of the Plastic Support Chairs
A clean hole is an important factor for the correct interlocking of bolts and concrete. Consider the
hef more than the concrete cover depth to make sure confined concrete is involved in shear and tension stress. The edge distance should be more than cover plus twice the rebar diameter, and reinforcement details should be reviewed before installation to avoid drilling on the steel rebar (
Figure 5). For wrong-drilled holes, although code R17.9.5 suggests a minimum of 1.5
hef, for the sake of uncertainty for the corner test results, it is suggested to consider safe spacing. If adhesive anchors are used, the fire impact should be considered, and a safe load should be considered at the designer’s discretion.
5.3. Inefficient Anchor Spacing Installation
Improper spacing of anchors, such as insufficient vertical spacing for moment resistance, or unequal x- and y-direction spacing, can significantly compromise anchor performance when, by mistake, the base plate is rotated during installation, resulting in the x- and y-spacing being flipped. This misalignment can lead to unbalanced load distribution and excessive tensile forces under severe loading conditions.
5.4. Recommendation of Inefficient Anchor Spacing Installation
If spatial constraints prevent proper anchor layout, the preferred solution is to install a kicker (bracing) beneath the cantilevered awning beam. This provides additional stability and reduces the tensile resistance force demand for the anchor group and uses a possible rectangular hole pattern on the plates.
5.5. Length of Embedment
In general, mechanical properties, type, size, and effective length of embedment are defined in the product evaluation report by the manufacturer, although ACI 355.2 limits the embedment depth in post-installed anchors. For example, adhesive anchors, 4
d <
hef < 20
d have been suggested [
25].
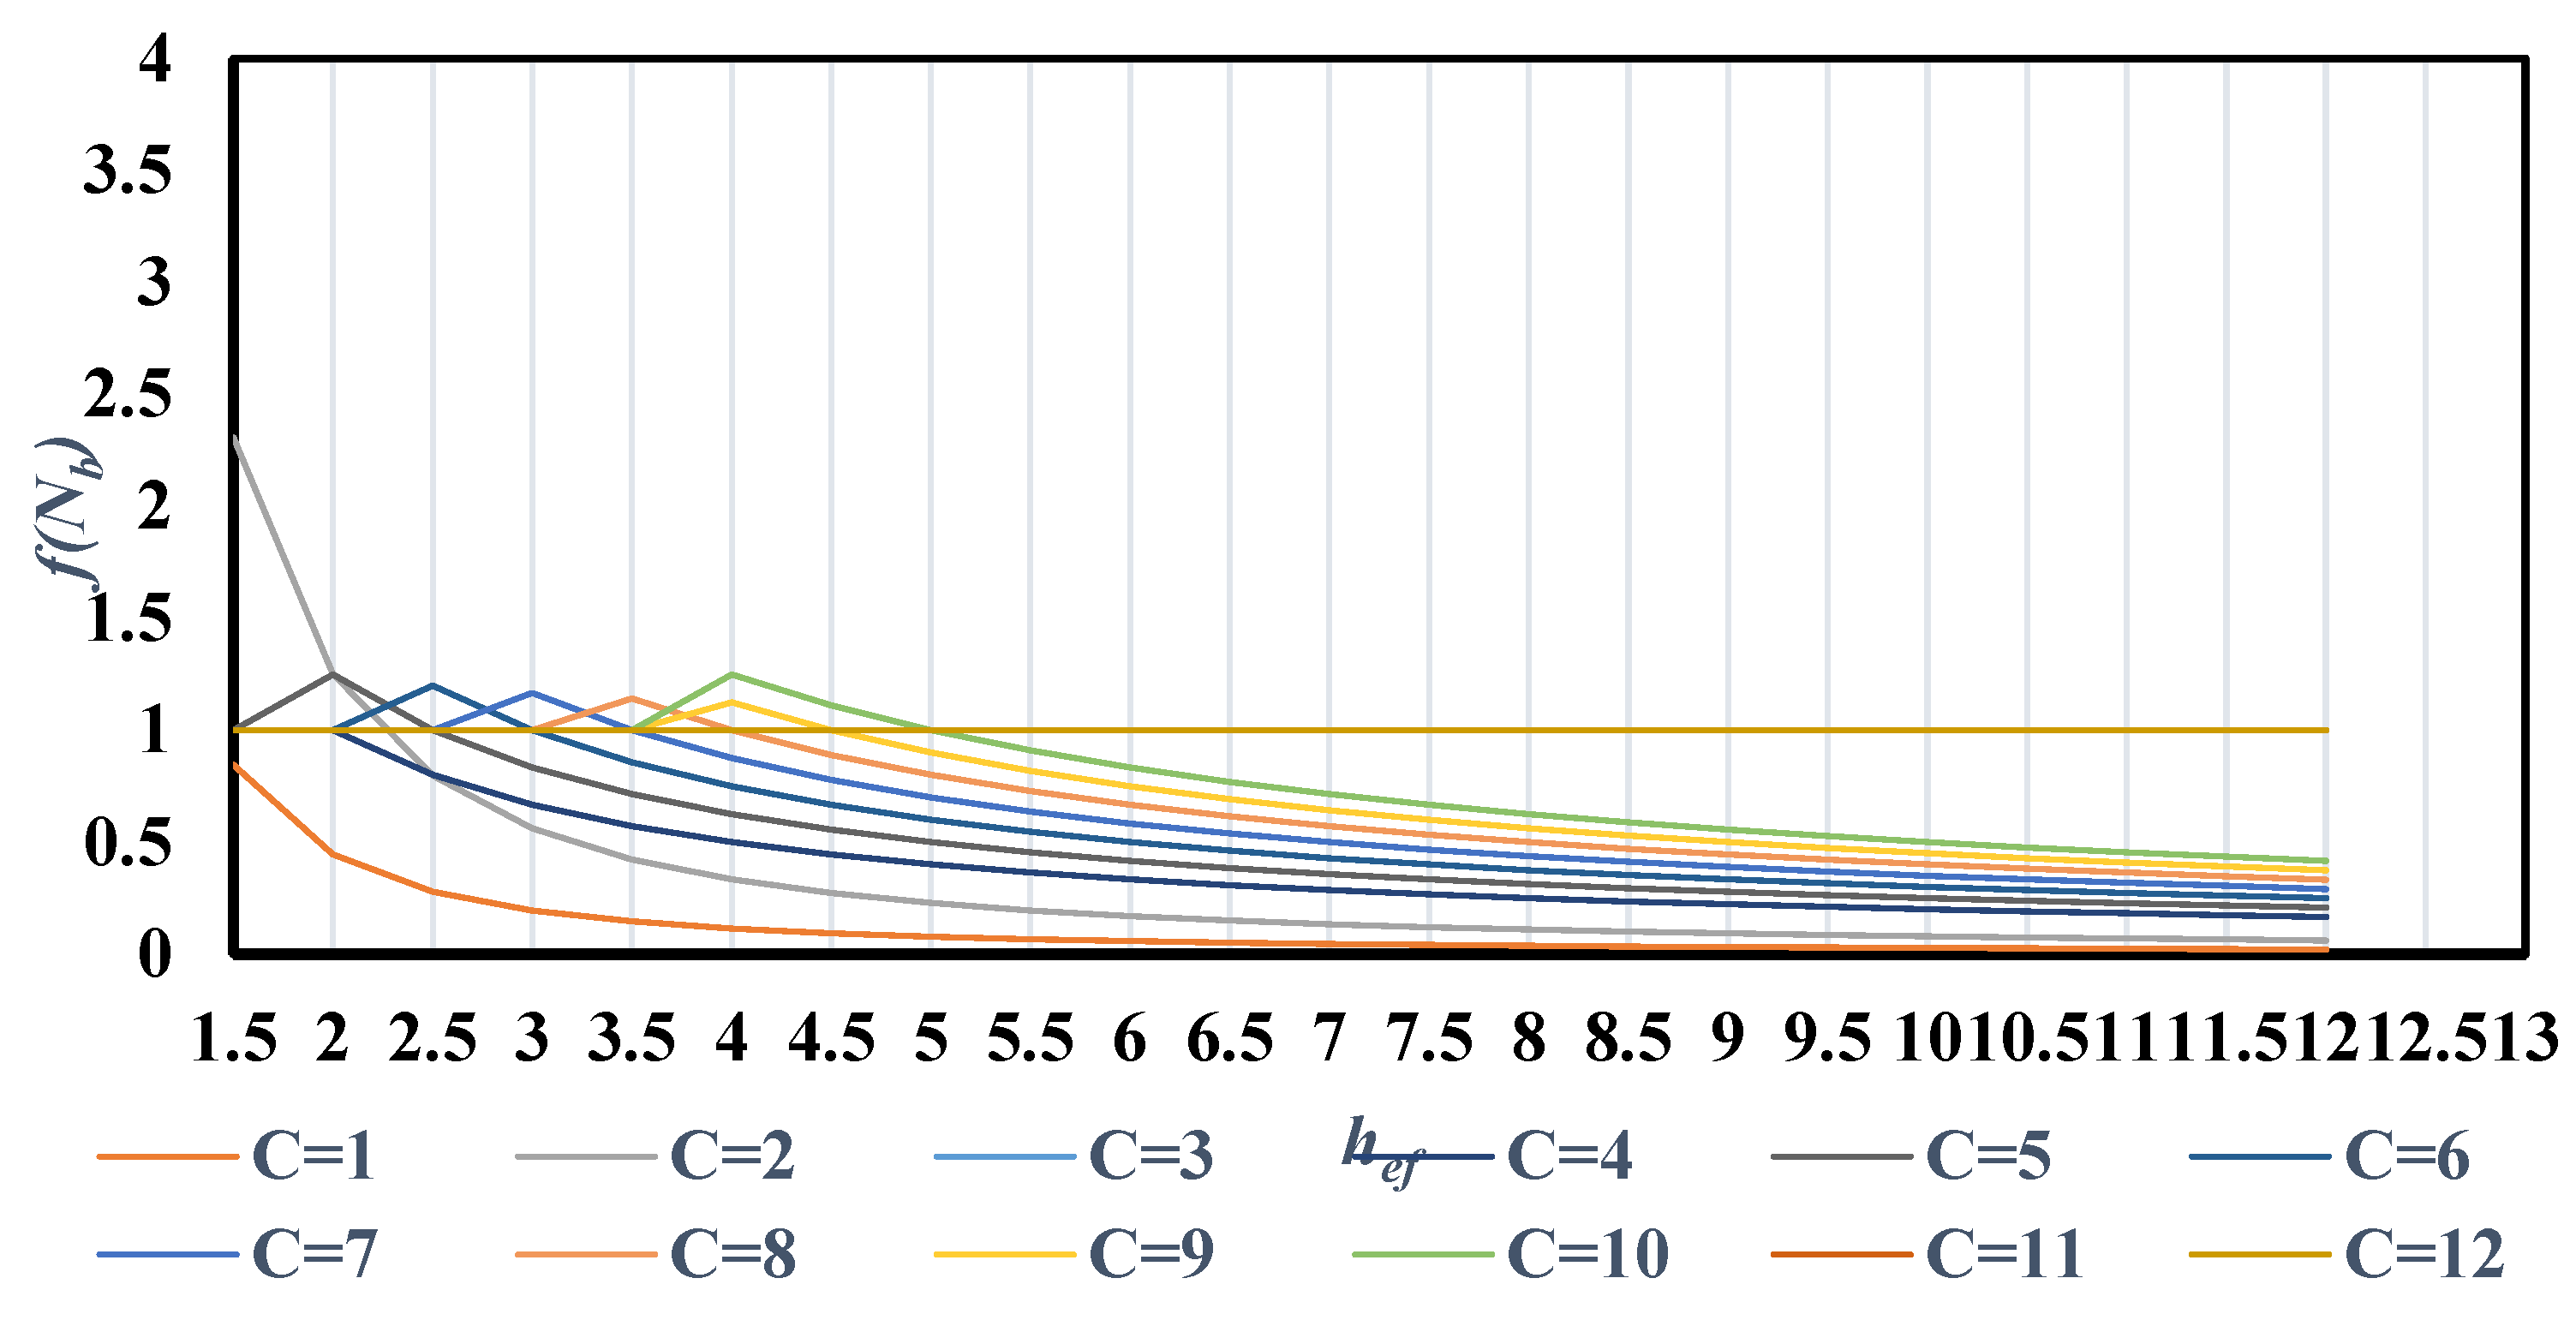
In the absence of an effective depth for the post-installed anchors, the following diagram for a group of different edge distance anchors and length of effective depth has been studied. Considering a minimum of 1.5 through 12 in (304.8 mm) edge distances with various lengths of embedment of anchor bolts, the concrete pullout capacity is shown in
Figure 6. For the calculation of pullout force, the breakout strength in Equation (1) is applied, and the critical edge distance and minimum edge distance are equated. Here, the
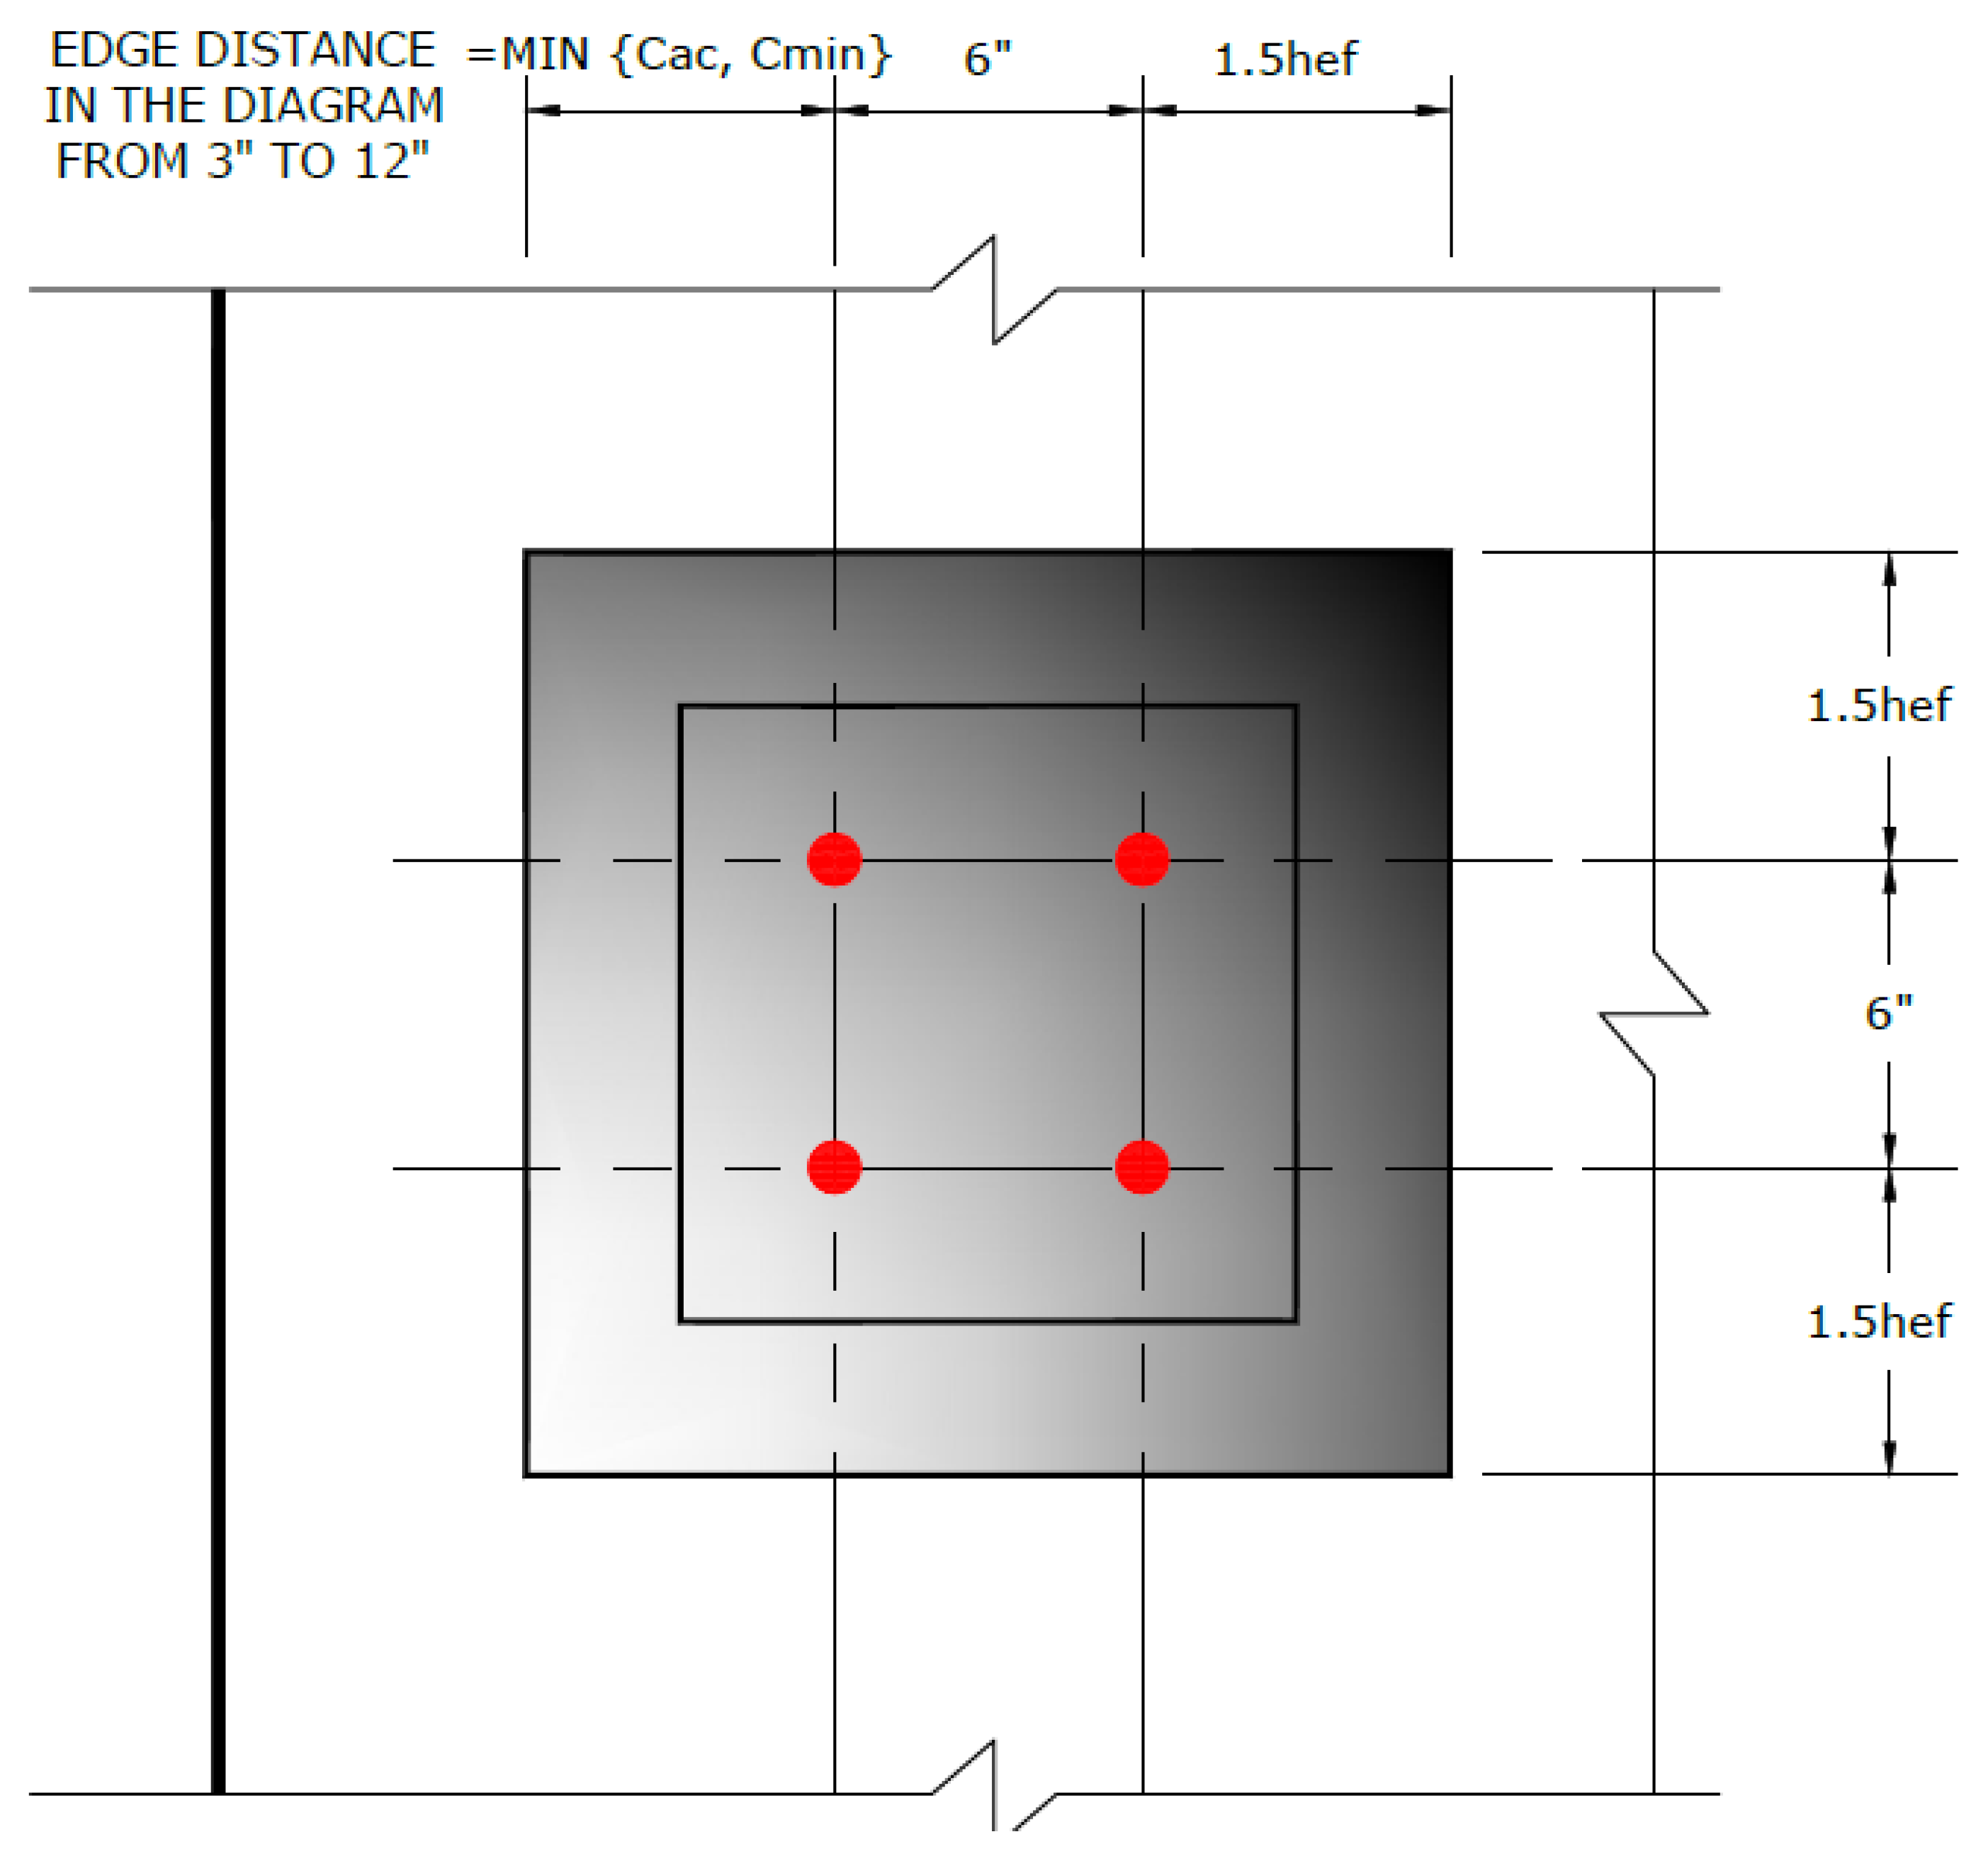
Anc = (
edge distance +
s + 1.5
hef) (3
hef +
s) with
s = 6 in (152.4 mm) spacing of the anchors in this diagram (
Figure 6). There’s a uniform increase in pullout capacity by enhancement of
hef for different edge distances. A drastic growth of pullout force at 10.5 in to 11 in (266.7–279.4 mm) indicates a 50% improvement in the pullout capacity. It is well noted that post-installed anchors shall not be used in concrete with a strength greater than 8000 psi (55.16 N/mm
2) without testing to verify acceptable performance per code requirement, which makes the drilling process more feasible.
6. Interaction Between Edge Distance and Effective Embedment Depth on Axial Load Capacity of Anchors
For the case where the edge distance
C = 2, the graphs in
Figure 6 show an unusual trend in the axial capacity factor
f(
Nb) when the effective embedment depth
hef is less than 3 in (76.2 mm). Rather than decreasing as expected with reduced embedment, the capacity factor increases sharply, reaching a peak of approximately 2.3
f(
Nb) at
hef = 1.5
h in (
hef = 38.1
h mm). This suggests an unrealistic amplification of axial force, likely due to limitations or inaccuracies in the analytical model or formula used for this specific edge condition. In practical terms, such a steep rise in
f(
Nb) contradicts physical anchorage behavior, where shallow embedment near an edge typically leads to reduced capacity due to breakout or pullout failure. According to ACI 318-19 Sections 17.7 and 17.9.2, minimum edge distances are prescribed to ensure reliable performance. For post-installed anchors, the code requires installation in accordance with the manufacturer’s instructions and product evaluation reports, which typically specify minimum edge distances of at least 6
da (six times the anchor diameter) for adhesive and expansion anchors to develop full strength. For cast-in headed anchors, the code specifies a basic edge distance
camin of at least 1.5
hef (38.1
h), but not less than 1.5 in (38.1 mm) [
24].
These requirements demonstrate that ACI 318-19 has already accounted for such unrealistic trends by enforcing minimum embedment and edge distance limits [
24]. Although our analysis shows an apparent amplification of axial loads at very shallow embedment, it should be noted that ACI318-19 already accounts for minimum embedment and edge distance requirements, mitigating any unrealistic behavior in practical design. As a result, the sharp amplification observed in
Figure 6 is inherently addressed by the code provisions and does not affect design practice.
7. Analysis of Factors in Load-Carrying Capacity
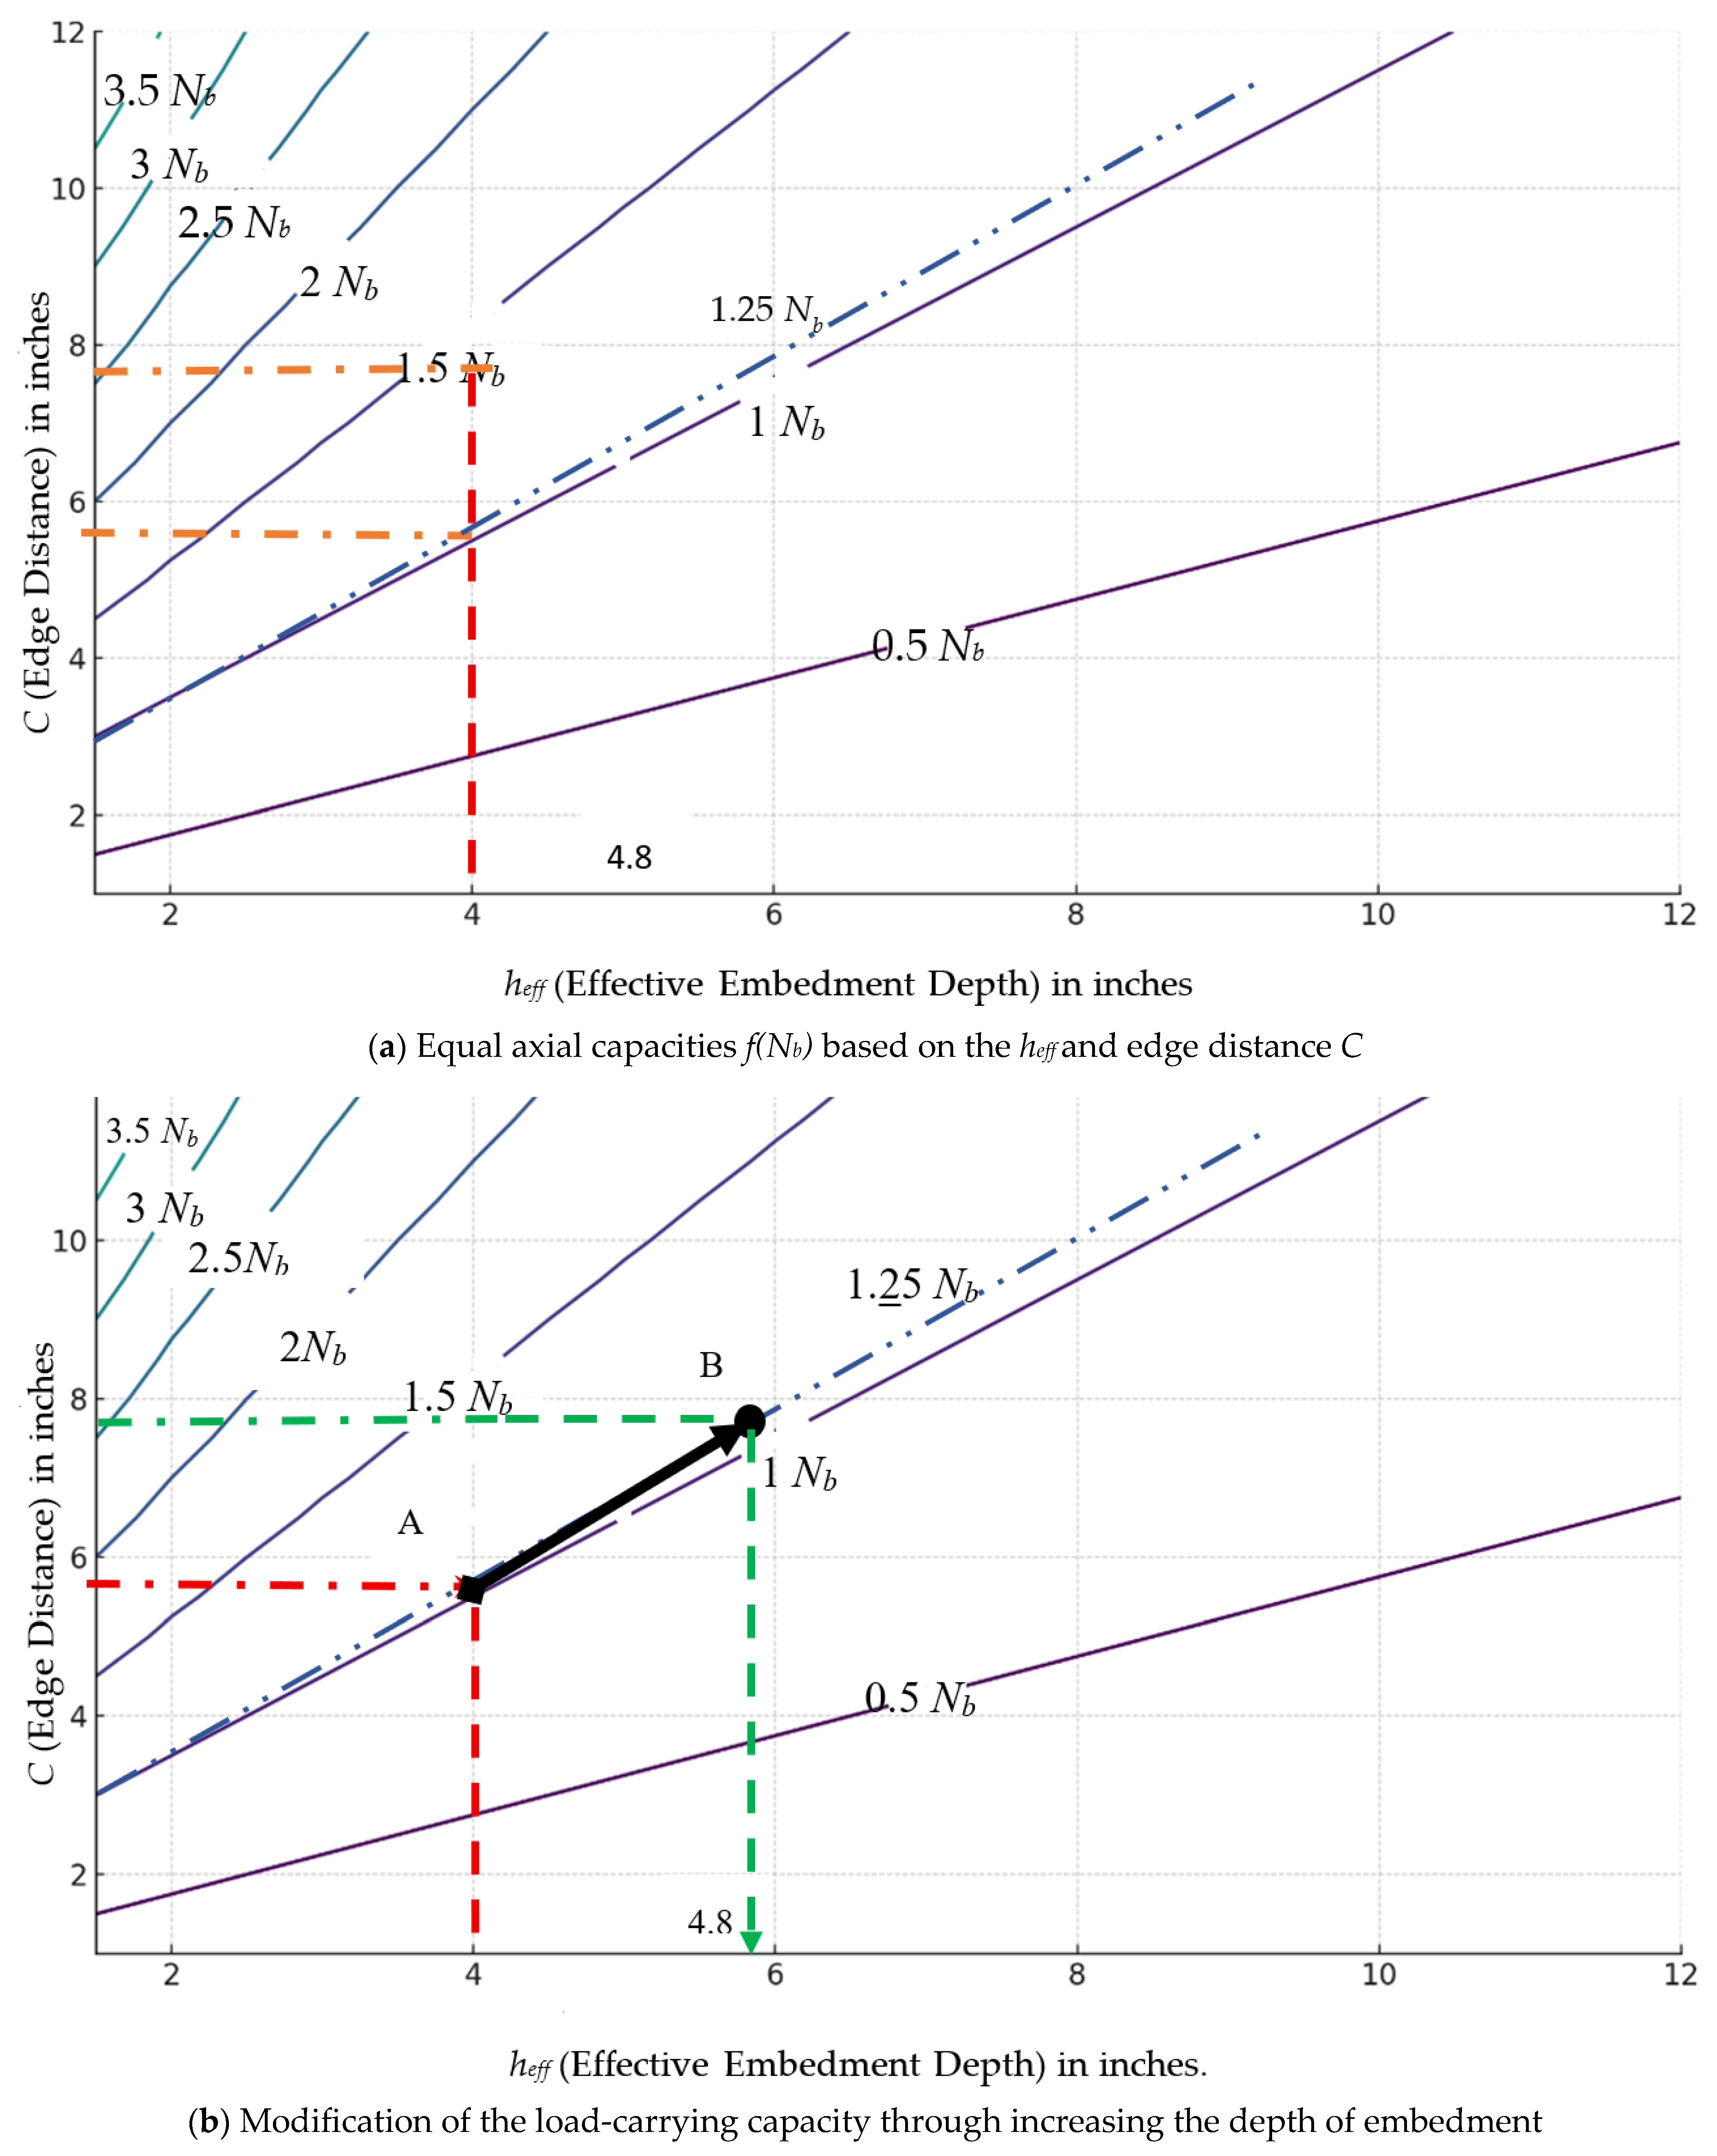
Improper drilling during anchor installation on cast concrete beams or columns, such as deviations in edge distance, incorrect hole positioning, or creating oversized or misaligned holes, can significantly compromise the axial load-carrying capacity of anchors. One of the most critical impacts of such errors is a reduction in concrete breakout strength, particularly when edge distances are unintentionally reduced. A smaller edge distance increases the likelihood of premature concrete cone failure under tension, leading to brittle, sudden anchor pullout. When such defects occur, installers must compensate by increasing the effective embedment depth (heff) of the anchor. As shown in the contour plot, for a given axial load capacity, deeper embedment can offset the reduction in edge distance. For example, if the edge distance is accidentally reduced from 6 in (152.4 mm) to 3 in (76.2 mm) due to mis-drilling, increasing the embedment depth from 3 in to 6 in (76.2–152.4 mm) can help restore the lost capacity. However, this adjustment must be evaluated carefully against the concrete member’s geometry and reinforcement to avoid interference or other structural compromises.
For example, when evaluating changes in axial capacity, if the edge distance is reduced from 8 to 6 in (152.4–203.2 mm) due to an installation issue and limited space, while keeping the embedment depth unchanged, the axial load capacity decreases noticeably. Specifically, the capacity factor drops from approximately 1.5
Nb to around 1.25
Nb, resulting in a 0.25
Nb, or a 17% reduction from the original axial load-carrying capacity. This change highlights the sensitivity of anchor performance to edge distance and underscores the importance of maintaining specified edge clearances during installation (
Figure 7a).
In another scenario, to compensate for such a reduced edge distance from 8 inches with 4 inches embedment depth to 6 inches edge distance (152.4–203.2 mm), we need to know how much the depth of embedment should be increased to reach the same level of load carrying capacity. In this scenario, the starting point, Point A, represents the existing reduced edge distance of 6 in (152.4 mm) and a corresponding lower axial capacity of approximately 1.25 Nb for an effective depth of 4 inches. By increasing the effective embedment depth, the anchor’s performance shifts along the capacity curve toward Point B by considering a new edge distance of 8 inches and drawing the green line to cross the dashed line of 1.25Nb at point B and reaching the horizontal axis of 4.8 inches of heff.
This example illustrates how increasing embedment depth can be an effective design strategy to compensate for reduced edge distances, helping restore axial capacity and maintain structural safety when ideal installation conditions are compromised on-site (
Figure 7b). This demonstrated that capacity was more sensitive to changes in edge distance than embedment depth for this range: a 33% increase in edge distance required only a 20% increase in embedment depth to achieve the same axial capacity.
These graphs can be effectively used in both design and field applications to improve the reliability of anchor installations in concrete elements. In anchor design optimization, they help engineers select suitable combinations of edge distance (
C) and effective embedment depth (
heff) to achieve a required axial load capacity without excessive conservatism. When installation errors occur, such as mis drilled holes or reduced edge distances, the graphs serve as a valuable tool for determining the necessary increase in embedment depth to restore the original load capacity and avoid the risk of concrete breakout failure. They are also useful during quality control and inspection processes, enabling field engineers to assess the impact of deviations from specified anchor positions and make informed decisions about corrective actions. Additionally, the visuals serve as effective educational tools for training installers and inspectors on the importance of proper anchor geometry. Finally, in forensic investigations, the graphs provide a basis for evaluating potential causes of failure by comparing actual field conditions with design expectations, particularly in cases involving insufficient edge distance or shallow embedment.
Figure 8 shows projected concrete failure, with red circles representing anchor holes.