Article

Microbiological and Physicochemical Parameters Related to Legionella spp. Colonisation in Hot Water Distribution Systems in Madrid: Case Study in Sports Centres

by
María Concepción Almonacid Garrido
,
Alejandra García-Alonso
*,
María José Villanueva-Suárez
and
María Dolores Tenorio-Sanz
Department of Nutrition and Food Science, Facultad de Farmacia, Universidad Complutense de Madrid, Plaza de Ramón y Cajal, s/n, 28040 Madrid, Spain
*
Author to whom correspondence should be addressed.
Appl. Sci. 2026, 16(3), 1628; https://doi.org/10.3390/app16031628
Submission received: 27 October 2025 / Revised: 23 January 2026 / Accepted: 3 February 2026 / Published: 5 February 2026
(This article belongs to the Special Issue New Approaches to Water Treatment: Challenges and Trends, 2nd Edition)

Abstract

Domestic hot water systems are one of the most important reservoirs of Legionella. It is thought that physicochemical and microbiological water quality influences bacterial development. Accordingly, the objective of this study was to evaluate this relationship in domestic hot water in public buildings in Madrid for potential health risks and to assess the parameters that could be associated with Legionella contamination, which would assist in developing control strategies to prevent legionellosis. A total of 1695 DHW samples were evaluated over a 14-year period (2007–2020). Legionella was analysed using culture plates and qPCR. The influencing parameters (pH, electrical conductivity, colour, turbidity, Fe nitrites, and coliforms) were analysed following official methods. Furthermore, sport centre risk assessment was carried out. Legionella was isolated in 64 samples. Non-compliance levels for turbidity, colour, iron, nitrites and coliforms were found primarily in samples containing Legionella. Nitrites > 0.5 mg/L, turbidity > 1 NFU, colour ≥ 1 Pt/Co, and building type were good parameters to test Legionella colonisation. The selected influencing factors may be a useful tool for ensuring water supply quality.

1. Introduction

Legionella is a Gram-negative, thin, aerobic, pleomorphic bacterium, which is non-spore-forming and non-sporulating. It has one or more polar or subpolar flagella and exists in a bacillary form in its free habitat, aquatic environments, but as coccobacilli when inside the macrophages of human pulmonary alveoli. This bacterium is the etiological agent of two clinical forms of legionellosis: Pontiac fever, a mild form of infection characterised by flu-like symptoms, and legionnaire’s disease, a severe form of atypical pneumonia [1,2].
Legionellosis is a reportable disease of environmental origin, transmitted to humans through inhalation of aerosols from contaminated water. The ability of Legionella to cause disease is associated with entering the respiratory system through small-size droplets as transporting particles. The most important reservoirs are man-made water environments including piped drinking water, cooling towers, fountains and humidifiers, with hot water systems being colonised more often than cold water in water systems and devices [3]. These aerosols are typically generated at terminal points, such as taps and showers, where water is dispersed into the air [4]. All suspected outbreaks should be reported urgently, and the environmental source should be identified and corrective measures taken. In Europe, Spain is one of the countries with the highest number of reported cases. Since 2015, both the number of reported cases and the incidence rate of legionellosis have been on the rise in our country. This upward trend appears to result from a combination of factors, including improvements in surveillance systems, an ageing population, increased population mobility, and inadequate maintenance of water distribution networks [5]. In 2018, Madrid ranked as the fifth city in Spain in terms of reported cases [6].
Legionella, as mentioned above, is transmitted through airborne aerosols from drinking water distribution systems inside buildings, under specific temperature conditions. Lower-risk installations include cold water and domestic hot water (DHW) storage systems without return lines, as well as installations that can generate aerosols such as sprinkler irrigation systems, ornamental fountains, and respiratory therapy devices [7].
Several factors influence the growth and proliferation of Legionella in water systems. The most important ones are temperature, physicochemical and microbiological water quality, material in contact with water, pipe design, water stagnation and chlorine levels, as well as the type of building and the quality and maintenance of its water distribution systems [8].
Temperature is a crucial parameter as Legionella thrives between 25 and 45 °C, with an optimal growth temperature of 35–39 °C. It is inactivated at 55 °C and eradicated at 65–70 °C [9]. According to Bédard et al. (2015) [10], maintaining high temperatures in hot water distribution systems suppresses its growth. However, high temperatures above 50 °C may not be sufficient to reduce Legionella colonisation if the system is poorly maintained or dirty. Heat shock can effectively control Legionella and reduce bacterial counts, but a temperature higher that 50 °C is not always enough to eliminate it from DHW systems, particularly if the installation is deteriorated or rarely used.
For physicochemical and microbiological water quality, factors like the presence of nutrients, suspended solids, scale, pH fluctuations, conductivity, turbidity, the presence of iron, material rugosity, calcium deposits and the formation of biofilms by protozoa, algae or bacteria all favour the multiplication of Legionella. In addition, the formation of biofilms [11,12] by some microbial species (e.g., E. coli, enterococci, Pseudomonas, Klebsiella) can encourage its growth. Microbial growth primarily occurs on the pipe in biofilms that act as reservoirs for Legionella, aiding the survival of virulent strains and contributing to infection risk [13,14,15]. Legionella can even survive in a viable but non-culturable state [16,17,18]. Among bacteria, although elevated bacterial indicators such as heterotrophic plate counts (HPC) may be observed, the pattern of coliform occurrences is known to be closely related to contamination originating from biofilms. On the other hand, nitrites can be considered as indicators of bacterial metabolism. This parameter, less considered by other authors, has an important role in our study since we think it can be useful in Legionella growth prediction.
The material in contact with water is also important. Thus, pipe design and configuration, as well as different pipe materials such as iron, plastic, or fibre cement, vary in surface roughness and corrosion potential, which affects biofilm formation. Iron pipes are particularly susceptible to Legionella colonisation, while copper, PVC, and stainless-steel pipes pose a lower risk. Iron can significantly influence the presence of Legionella due to its role in supporting bacterial growth, since in pipes it can create large surface scale encrustations that favour biofilm colonisation, requiring extensive chlorination for control [19]. Biofilms on polyethylene, by contrast, have lower biomass and poorer microbial diversity [20]. In addition, complex and long water distribution networks, especially those without traps or return systems, are more prone to Legionella contamination.
Stagnant water and recirculation issues contribute to Legionella growth. Dead zones or low water circulation, even in high-temperature areas, can lead to heavy colonisation in underused points. Avoiding this chlorination can be an interesting option, since residual chlorine concentrations of 1 mg/L can inhibit bacterial colonisation, compared to systems without chlorination [21].
In addition to all previously mentioned parameters, in a previous study, we determined that the type of building and its characteristics and installations are highly related to the possibility of Legionella growth, and we were able to conclude that Legionella contamination in sports centres in Madrid was higher than in the rest of the buildings sampled, which has been taken into account in this study to evaluate the structural risk in the development of the bacteria [22].
Several studies have associated certain physicochemical factors with Legionella colonisation and biofilm formation in various water facilities and pipes, in an attempt to advise the risk of bacterial growth and exposure to human health [23,24,25,26].
In this line, the aim of this study was to evaluate the relationship between Legionella contamination in hot water systems in different buildings in the City of Madrid and various water parameters believed to influence the bacterium’s presence and growth. These parameters include physicochemical factors like temperature, pH, electrical conductivity, turbidity, colour, iron, and nitrites, as well as microbiological parameters, such as total and faecal coliforms. Structural risk in sports centres was evaluated, as these facilities showed the highest number of positive Legionella results. The ultimate goal was to assess parameters that could contribute to reducing the risk of Legionella contamination in hot water distribution systems, thereby supporting the development of control strategies to prevent legionellosis.

2. Materials and Methods

2.1. Sampling Sites and Collection

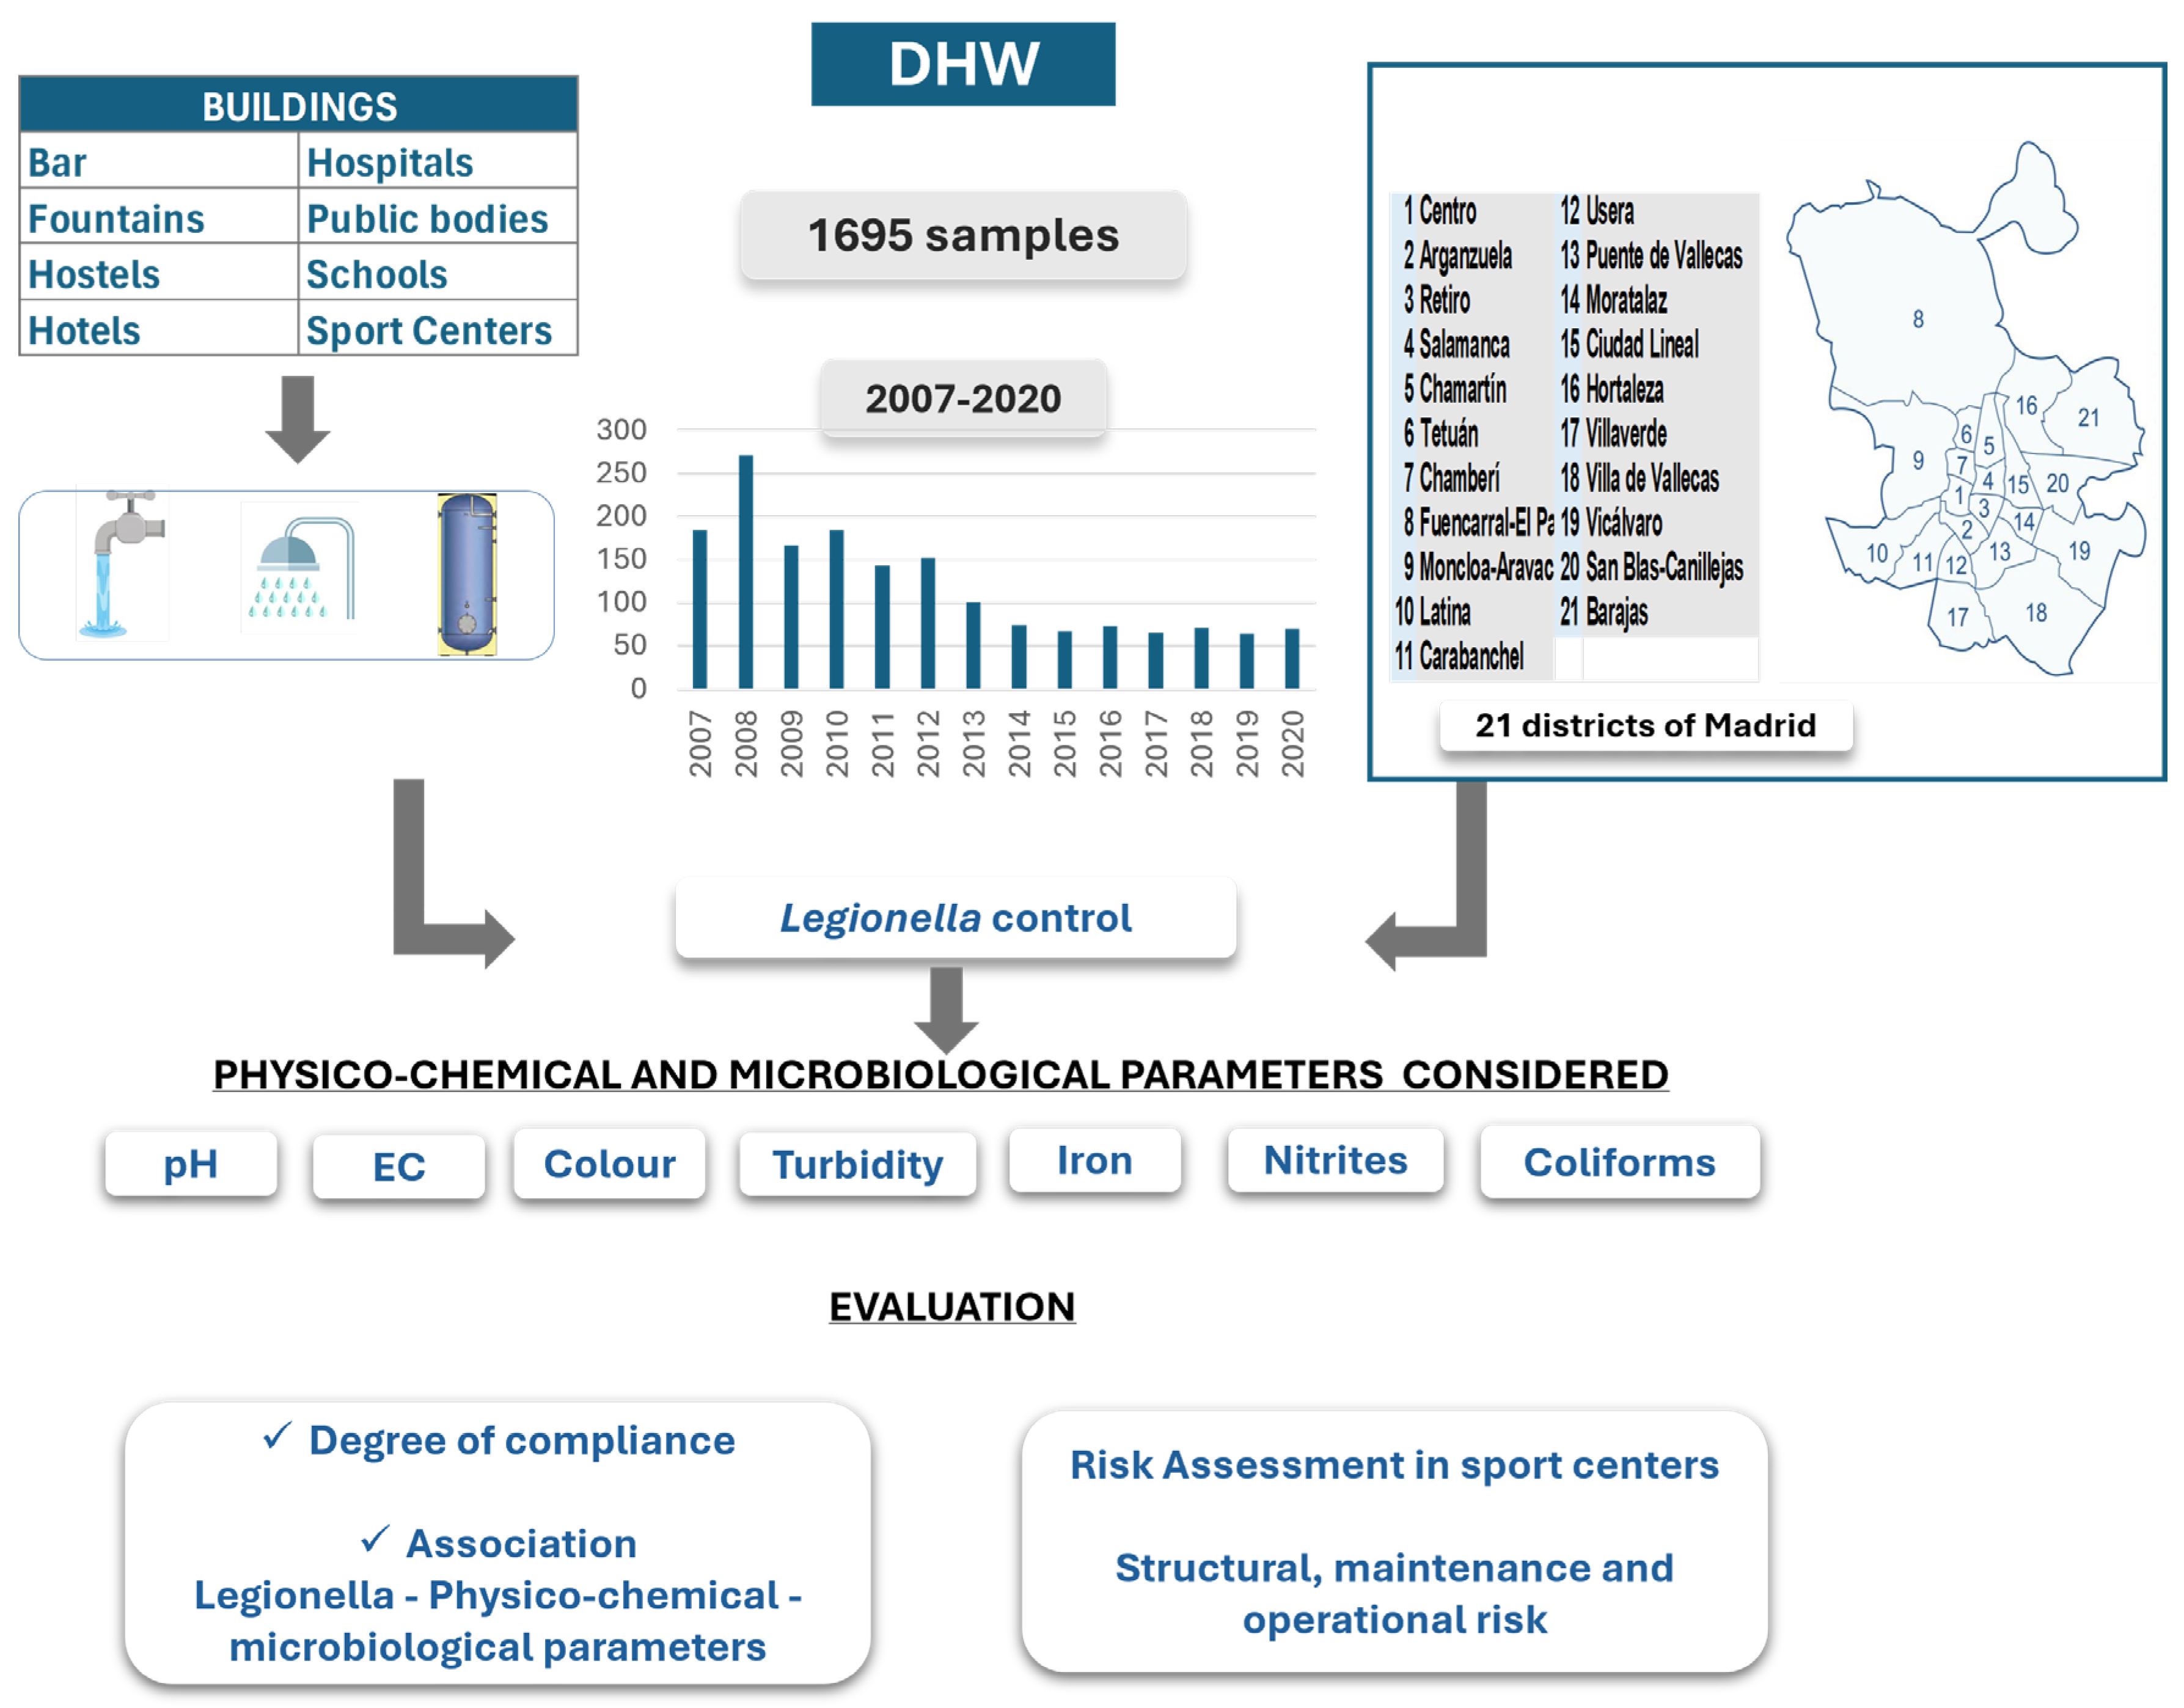
The samples were collected between 2007 and 2020 in domestic water distribution systems of buildings of public interest in Madrid, at points of increased risk of Legionella proliferation or at representative points of exposure. Samples were collected in sterile 1000 mL glass bottles after an unused period of at least 6 h. The first 100 mL were taken; then the tap or shower was scraped with a sterile swab, which was placed in the same bottle, and then the rest of the water was collected to complete 1000 mL, carrying the remains of the scraping with it, to incorporate the biofilm in accordance with ISO 11731:2017 [27]. Details such as water temperature and presence of biocides were recorded. Samples were kept at room temperature immediately after sampling, avoiding extreme temperatures. They were transported for analysis on the same day they were collected in suitable, airtight containers at a temperature between 6 °C and 10 °C, protected from heat and sunlight, and tested for biocides within 24 h, as detailed in a previously published paper [22]. To carry out the physical–chemical parameter tests, 1 L of water was collected simultaneously in sterile containers filled to their maximum capacity. A diagram of the study design is provided below (Figure 1).

2.2. Methodology

2.2.1. Legionella Determination

The analysis of Legionella in water samples was conducted at the Public Health Laboratory of Madrid Salud, which holds ENAC accreditation (nº 215/LE 406 and nº 215/LE 1915). The laboratory follows validated and standardised procedures in accordance with [27,28]. Two official methods were employed: culture-based counting [27] and quantitative polymerase chain reaction (qPCR) detection [28].

2.2.2. Physicochemical Parameters

Physicochemical parameters were analysed following the official analytical methods, according to Spanish Gazette 163 (BOE) Orden 1 July 1987 and/or Standard Methods for the examination of water and wastewater 2120 B and 2510 B.
A potentiometric determination of pH was carried out using a pH metre (PCE-pH 30; PCE Instruments, Meschede, Germany) calibrated with pH 4.00 and pH 7.02 buffer solutions. pH was determined in the laboratory, using an indicator electrode or glass electrode that responds to hydrogen ions, immersed in the water sample and a reference electrode (mercury electrode).
The conductivity or specific conductance of water is a measure of its ability to conduct electricity, and it increases as the concentration of electrolytes or salts that dissociate on dissolution increases. Electrical conductivity was measured with a conductivity metre (PCE-pH 30) against a reference standard of 0.01 N KCl at 20 °C, expressed in μS/cm and standardised at 20 °C. Since conductivity increases with water temperature, it is necessary to carry out this measurement in parallel.
For colour determination, a method based on spectrophotometric measurement was used, comparing standard solutions based on cobalt chloride and potassium chloroplatinate and expressing the colour intensity in mg/L on a scale of Pt-Co units (Agilent model 8453; Agilent Technologies, Inc., Waldbronn, Germany).
In case of turbidity in water due to the presence of small, suspended particles—inorganic compounds and organic substances, such as plankton and pathogenic micro-organisms—the official method involving the measurement of the diffraction of light caused by suspended particles in water in a turbidity metre was applied. A Hanna turbidimeter (HI88713; Hanna Instruments, Woonsocket, RI, USA) calibrated with Formazin reference standards was used for the determination, and results were expressed in Nephelometric Formazin Units (NFU).
Iron was quantified by atomic absorption spectrophotometry with a graphite chamber. The electrothermal atomic absorption spectrophotometry (ET-AAS) method (Varian 280Z, Palo Alto, CA, USA) was used. After preparation of the water sample, iron is measured at a wavelength of 248.3 nm against a calibration curve established with Fe standard solutions in the range of 20–50 µg/L.
And finally, nitrites were analysed using a colorimetric method based on their reaction in an acid medium with sulphanilic acid and N-naphthyl-ethylene-diamine chloride, causing the formation of a pink-purple azo dye, the colour intensity of which is proportional to the concentration of nitrite in the water sample. Absorbance was measured at 538 nm in a spectrophotometer (VIS 7200; Jenway, Stone, UK) against a calibration curve established with NaNO2 standards in a range of 0.05–0.2 mg NO2-/L from which the concentration of nitrite in the sample can be calculated.

2.2.3. Microbiological Parameters: Quantification of Total and Faecal Coliforms

Total coliforms, Escherichia coli and enterococci were used as indicators and microbiological parameters of drinking water quality, and their parametric value (PV) shall be zero in accordance with legislation. The coliform count was carried out using the official method, which consists of inoculating different volumes of the water to be analysed into lactose culture medium, followed by subculturing in selective media, incubation at appropriate temperatures and adjustment the final medium pH to between 3.8 and 7. Presumptive and confirmatory tests should be carried out for total coliforms, and only confirmatory tests for faecal coliforms if the former are positive. If no colonies have developed or those that have appeared are not gas-producing lactose fermenters, the confirmatory test is negative. If the isolated colony is lactose fermenting with gas production and oxidase negative, the presence of total coliforms is confirmed. Confirmation of faecal coliforms is positive if gas production and bacterial growth occur after 24 h. These analyses were performed in accordance with ISO 9308-1:2014 [29] and ISO 9308-2:2012 [30] standards. Both protocols are validated/verified in accordance with ISO 16140-3:2021 [31].

2.2.4. Methodology for Risk Assessment in Problematic Buildings

A study has been carried out to assess the potential risk of Legionella in drinking water based on non-compliant samples from sports centres, since they were previously identified [22] to be the type of building with more Legionella-positive results.
The Legionella health plan involves an assessment of the risk of Legionnaires’ disease transmission through the system, based on WHO recommendations, and must include control measures for facilities or related products and materials if the parametric valuess (PV) [32] are not complied with. It is therefore essential to assess the risk for each facility. The Legionella risk assessment in the DHW installation includes items and factors that are scored as low, medium or high.
A model that establishes the structural, maintenance and operational risk values of the facilities was used to calculate the risk factors.
The result is an overall risk index according to which facilities are classified as high-, moderate- or low-risk when the overall index is >80, between 60 and 80, or <60, respectively. This calculation has been taken from the Spanish Ministry of Labour [33], the tables in the Technical Guide for the Prevention and Control of Legionellosis in Facilities of the Spanish Ministry of Health, and the manual for the prevention of legionellosis in facilities at risk of the Autonomous Community of Madrid (CAM), included as Supplementary Materials [34].
The overall index is calculated using the following formula:
Overall index = 0.3 × SI + 0.6 × MI + 0.1 × IO,
where SI: structural index; MI: maintenance index; and IO: operation index.

2.3. Statistical Analysis

The variables analysed correspond to two types: categorical (qualitative) variables and non-categorical (quantitative) variables. In all cases, the frequency and individualised percentage for each variable was calculated, as well as the degree of compliance with respect to the prevalence of Legionella.
To analyse the presence or absence of this bacterium in relation to the different variables, Pearson’s Chi-square test was applied. Spearman’s correlation analysis was also used between the Legionella-positive samples and the factors of influence studied with a significance of p < 0.05. SAS software, version 9.4 (SAS Institute, Inc., Cary, NC, USA), was used for statistical analyses.

3. Results and Discussion

To determine the presence and prevalence of Legionella at critical points in the DHW distribution systems of various buildings in Madrid and their risk factors, the physical–chemical and microbiological parameters that may influence the presence of this bacterium in water have been considered, such as turbidity, colour, iron, nitrites and coliforms. Based on the results of the influencing factors, a predictive analysis was carried out to forecast the potential risk of Legionella in water. Finally, a study was carried out to assess the structural, maintenance and operational risks of sports centres, given the greater issues these facilities have with Legionella colonisation.
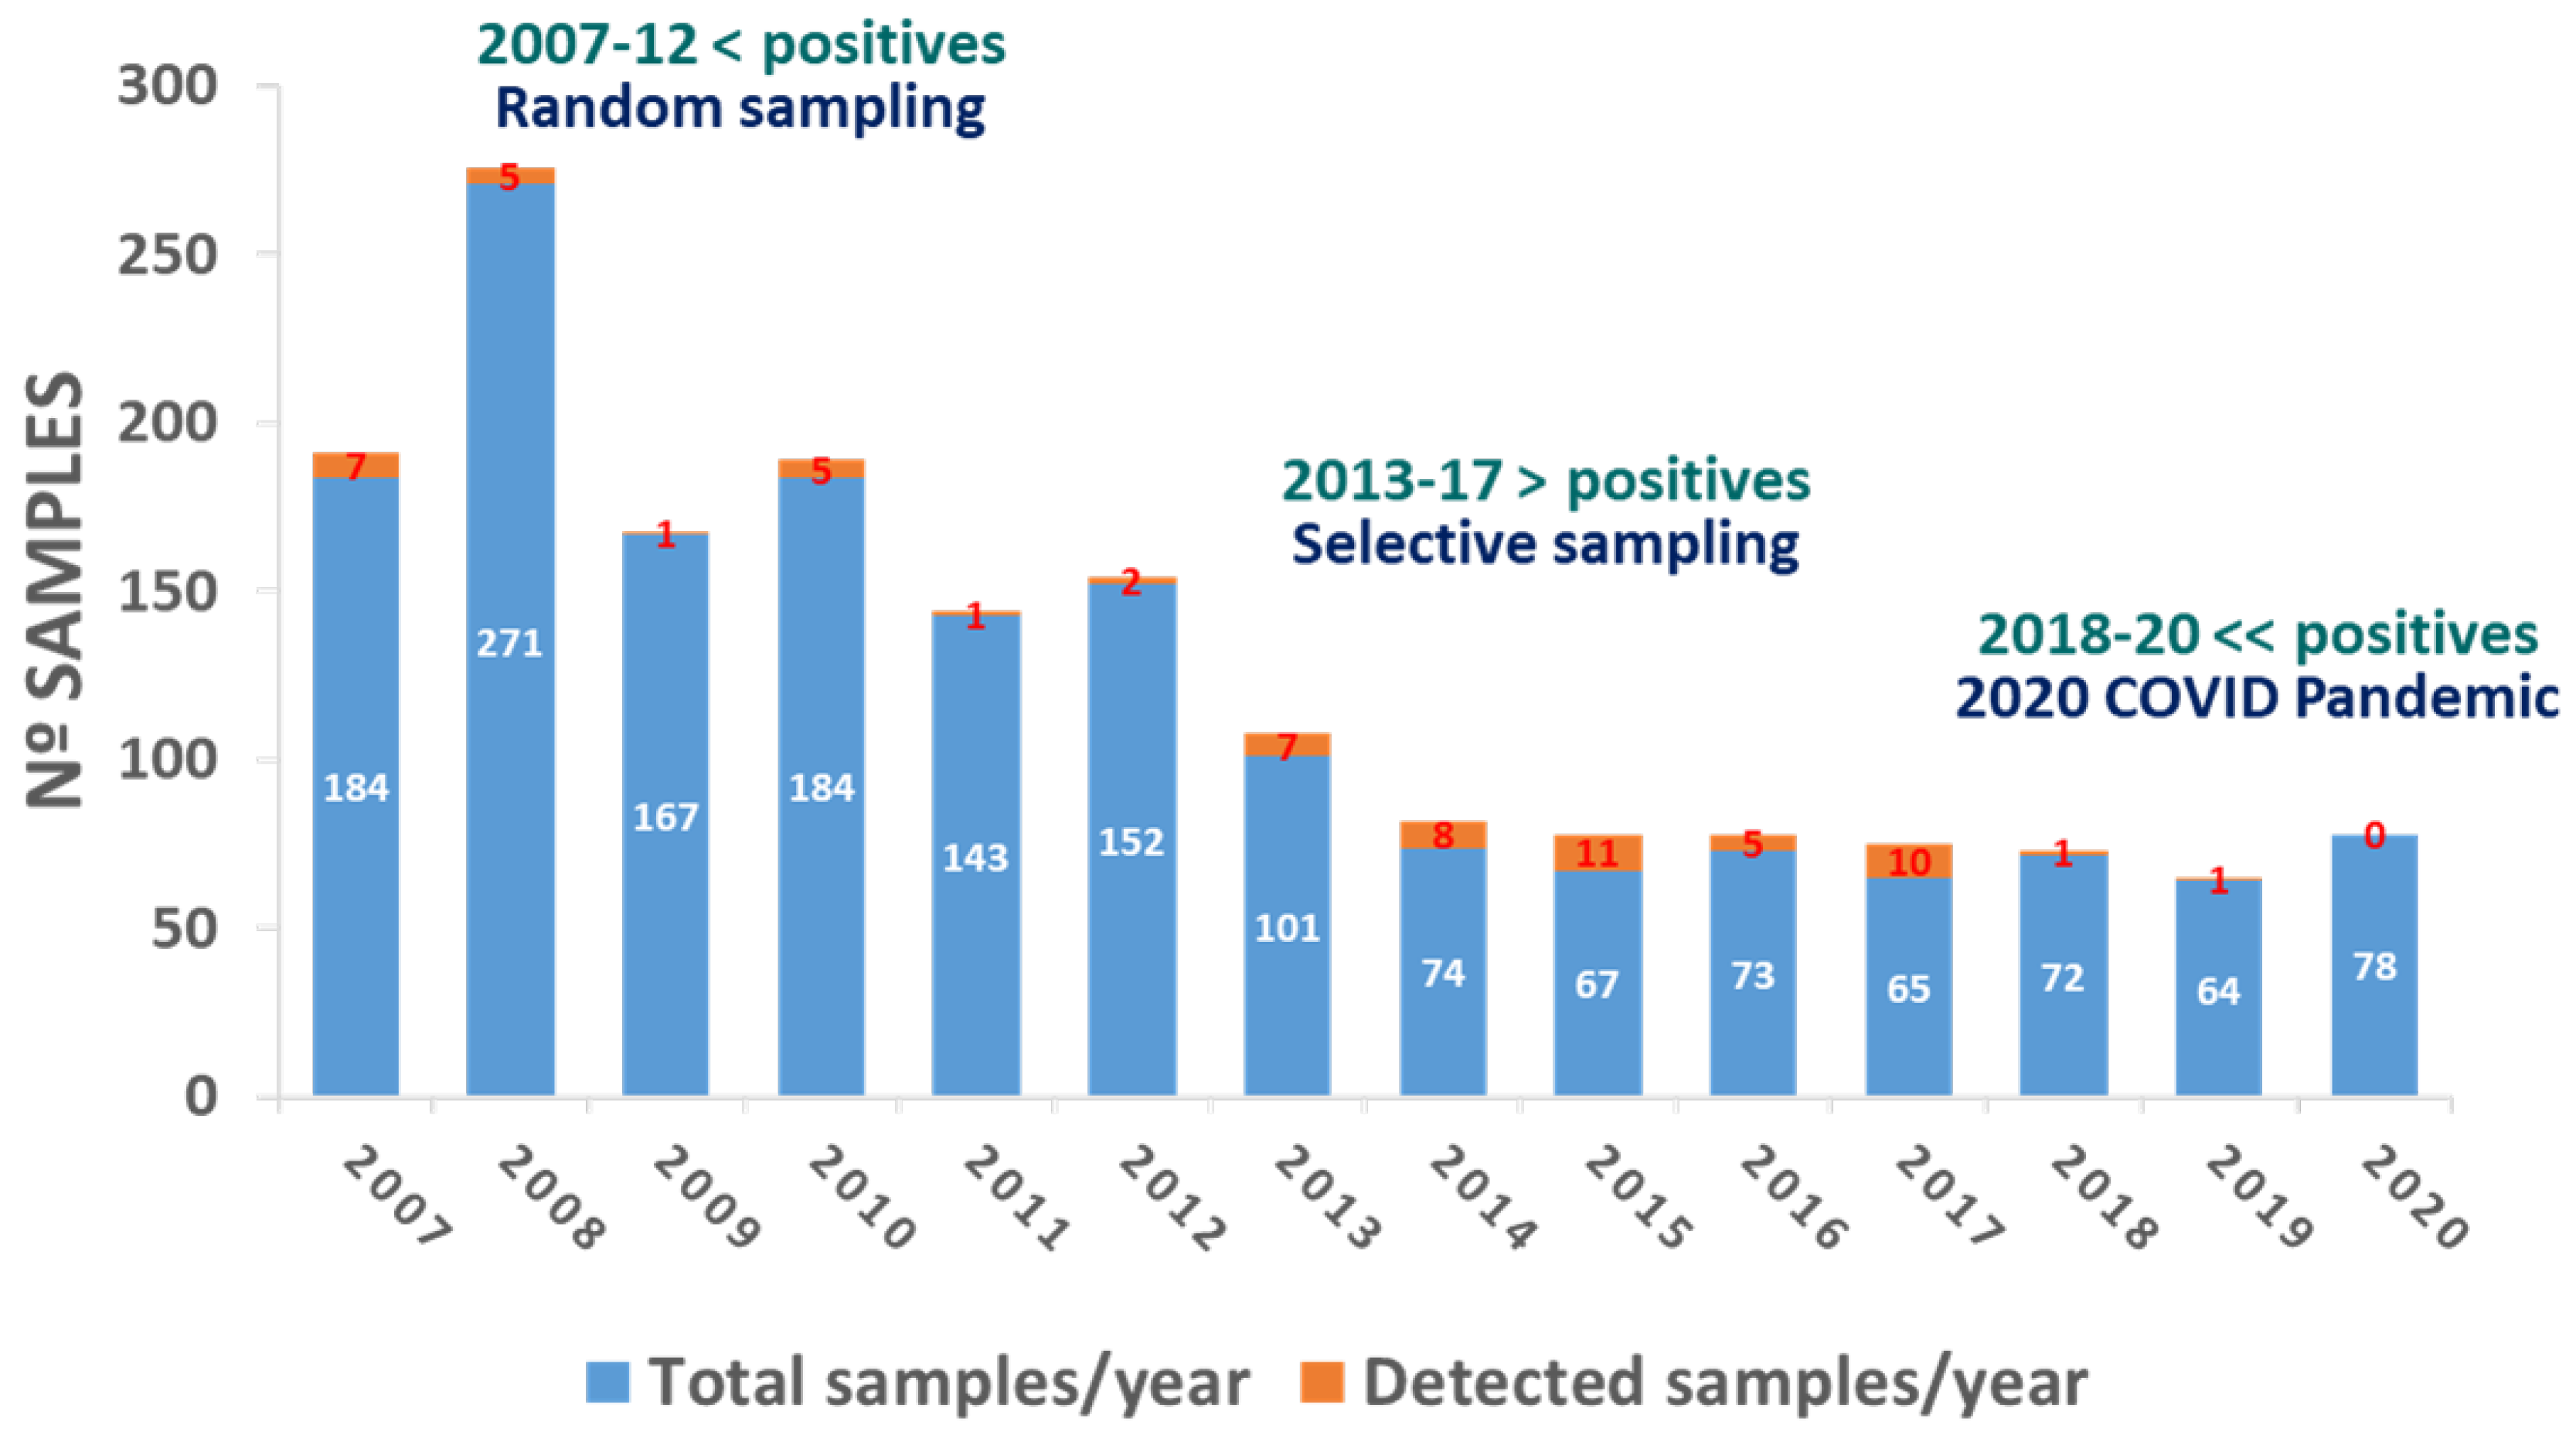
The present study has been carried out over 14 years in the period 2007–2020 on a total of 1695 DHW samples. In 2020, part of the sampling period was affected by restrictions during the COVID-19 pandemic. Figure 2 shows the distribution of positive Legionella samples in relation to the total number evaluated for each sampling period. A previous publication presents the results of colonisation by Legionella according to sampling year, building type, district of Madrid, disinfection type, temperature and sampling point. Legionella pneumophila was isolated in 67 sampling points, 64 of them in DHW systems, representing 3.8% of the DHW samples [22]. The high incidence in older installations in peripheral districts was remarkable. When the presence of the bacteria in the different buildings of the city of Madrid was evaluated, it was found that the sports centres have the highest incidence compared with other building types.

3.1. Influence of Different Physicochemical and Microbiological Indicator Parameters on Legionella Colonisation in Water

Certain water quality indicator parameters can favour Legionella colonisation in water distribution systems. These factors include the presence of organic nutrients (biofilm), deposits of suspended solids (turbidity), indicators of bacterial metabolism (nitrites), indicators of faecal contamination (coliforms), iron as a limiting factor for bacterial growth, and conductivity and colour associated with the presence of this microorganism, among others. [11,12].
The results obtained from the study of factors related to the presence of Legionella, selected from among the many studied by other authors, are shown below.
The possible range of Legionella growth is very wide since it ranges from 25 to 49 °C. In our previous study [22], we reported that the highest number of samples with Legionella growth (24%) occurred in the 35–40 °C range. Regarding other temperature ranges, positive samples detected in the 30–35 °C and 40–49 °C ranges were significantly lower—12% in both cases—and 9% of positive results were found at temperatures between 25 and 30%. Finally, positive samples in hot water installations found at more extreme temperatures such as 20–25 °C and even 49–60 °C were similar—between 3 and 4% respectively.

3.1.1. pH

In the present study, almost all samples (98%) showed values between 5.5 and 8.5 pH units, which is the range in which Legionella grows (5.5–9.2). The mean pH value was 7.01 in positive samples and 7.4 in negative ones, in line with the national average [35]. The highest percentage of samples, both with and without Legionella detection, was found in the pH range of 7.1–7.5, and it was observed that 78% of positive samples had alkaline pH values (7.1–8.5). Given that these values are within the normal range for drinking water, this suggests that pH does not have a significant impact on the presence or absence of this microorganism. The alkalinity of the water shows a trend towards scaling. In this regard, some authors [26] suggest that pH ≥ 8.70 favours Legionella colonisation; these pH levels were not detected in any of the cases tested in our study.

3.1.2. Electrical Conductivity

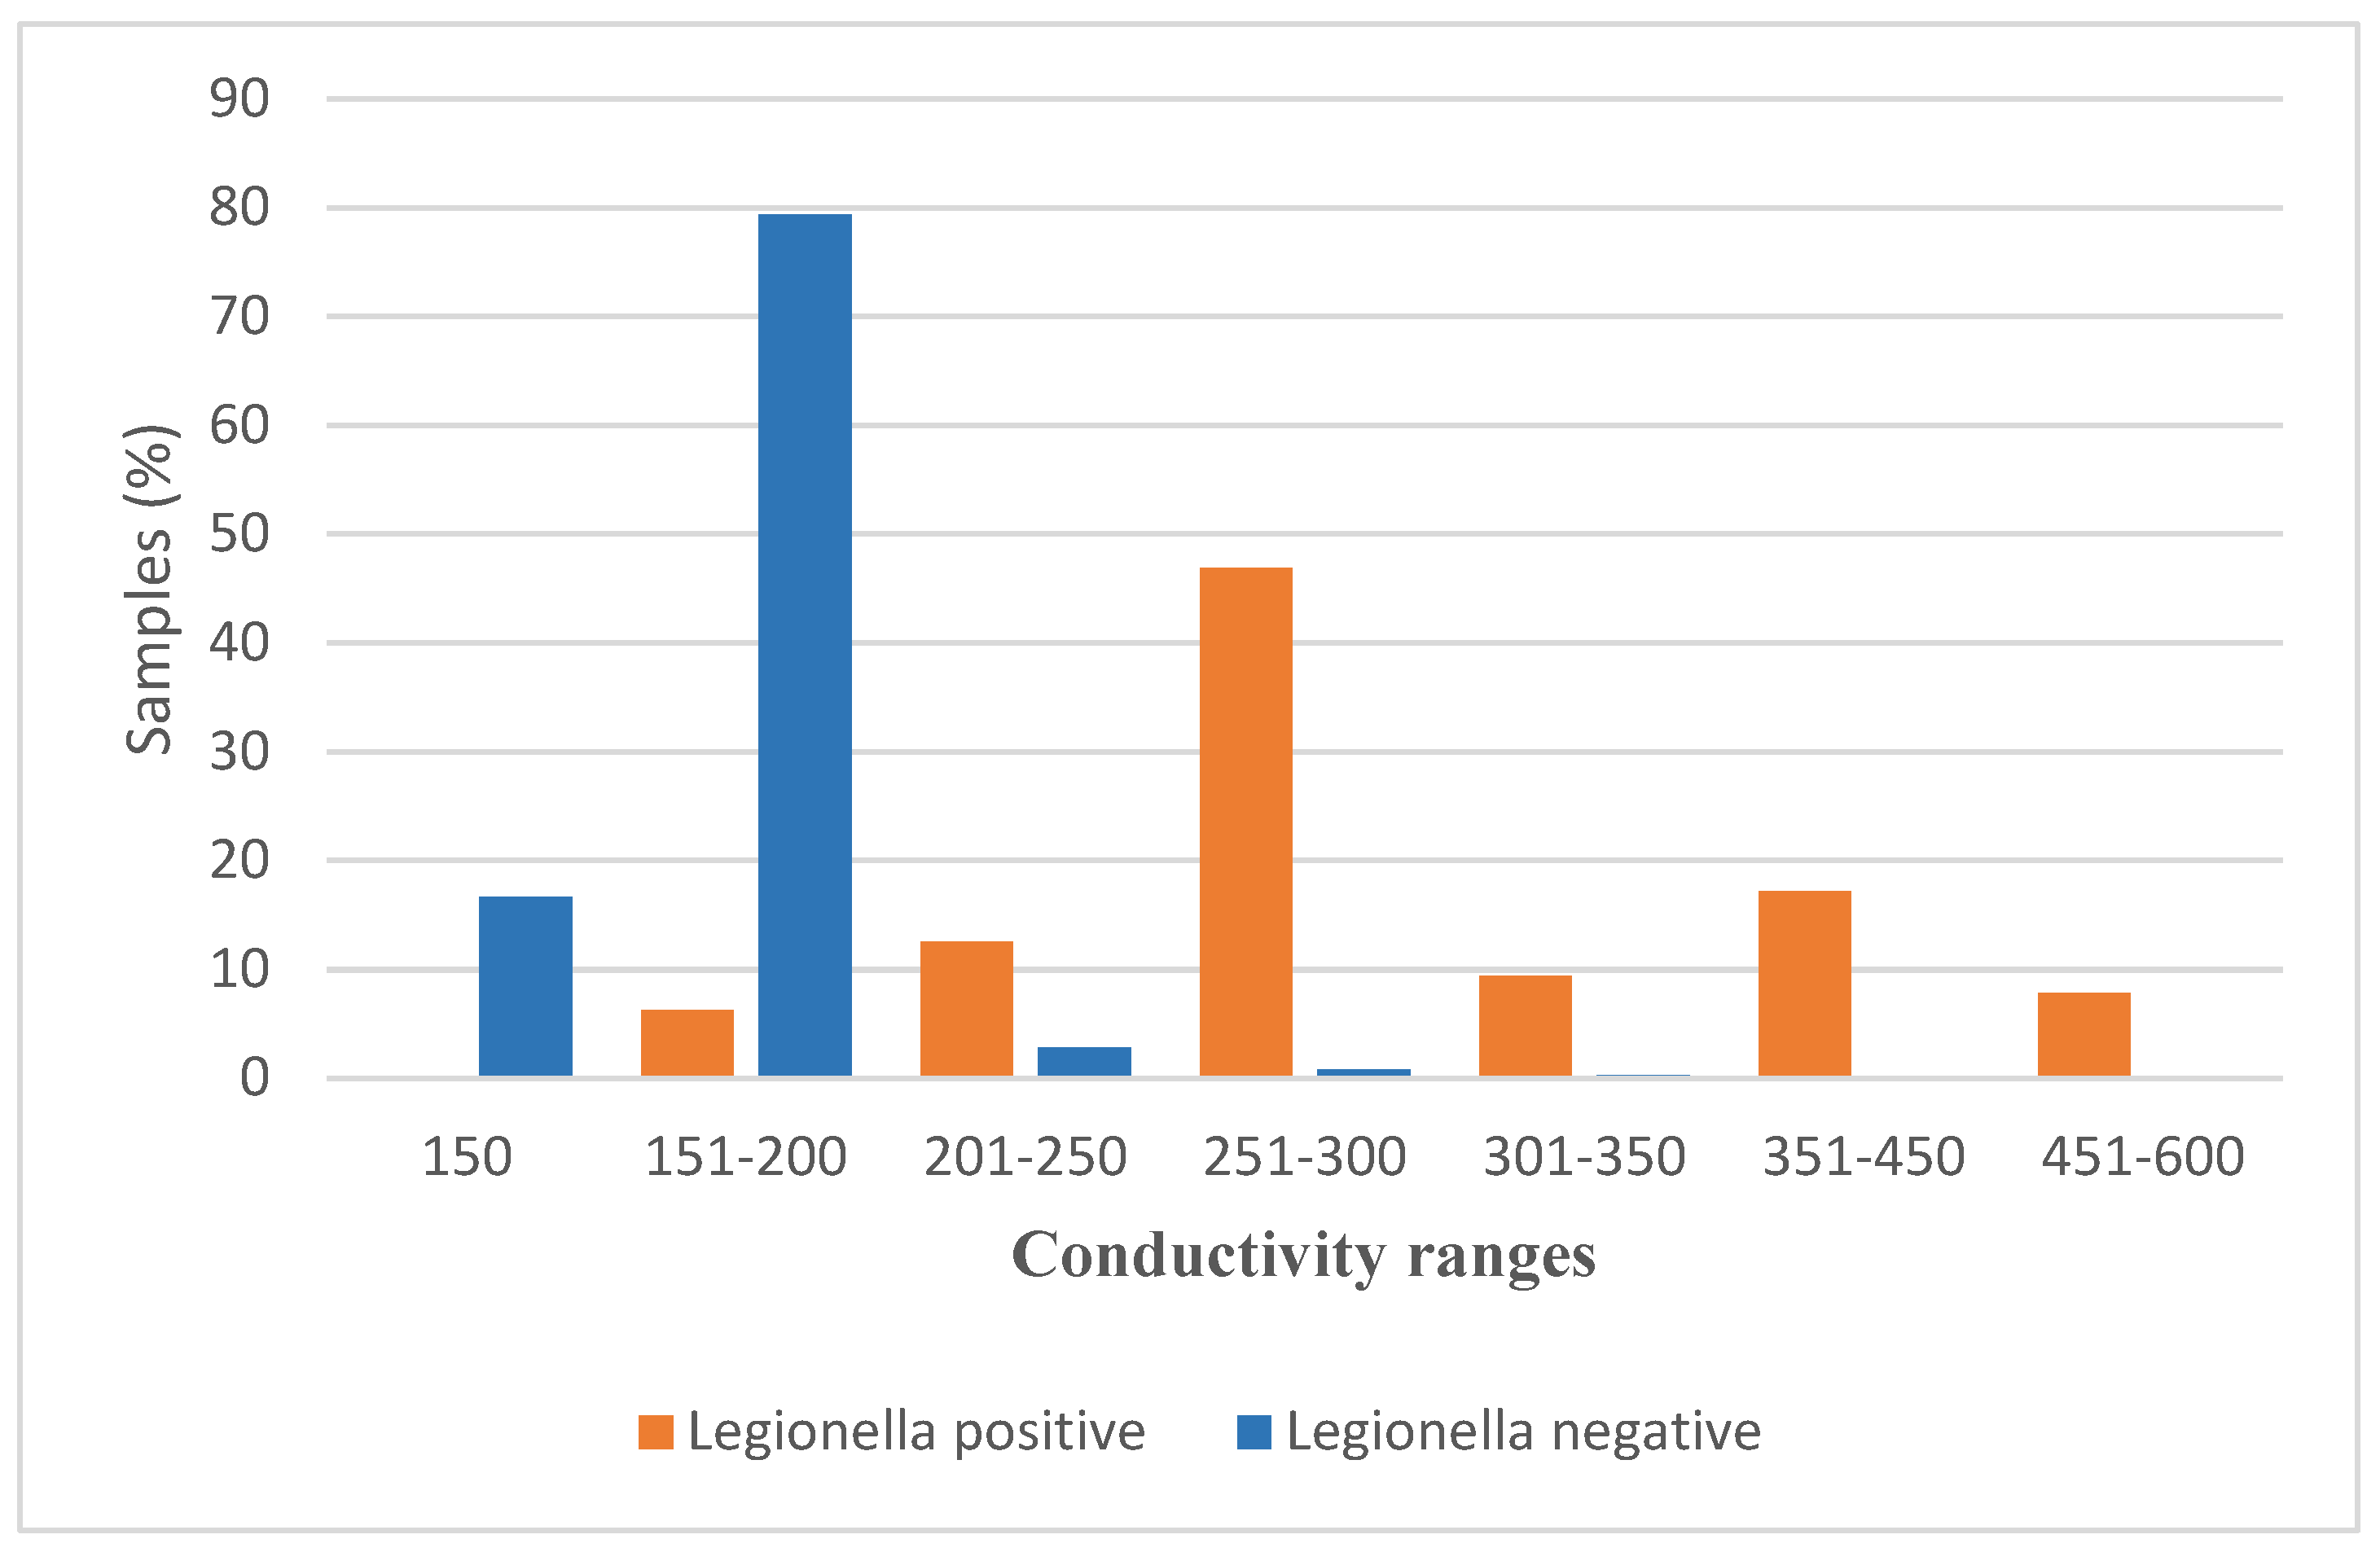
For the conductivity parameter, no values were found outside the range for drinking water (<2500 µS/cm) or the accepted value for classification as unsuitable (5000 μS/cm). Figure 3 shows the percentage of positive and negative Legionella samples found and the conductivity values found in the water under study.
The conductivity of Canal de Isabel Segunda (CYII) drinking water in Madrid is very low (usually between 60 and 180 µS/cm), which is very positive as it prevents corrosion of pipes and metal fittings such as iron that remain in solution. In the analysed samples, the levels exceeded the average value cited by CYII for water in Madrid, reaching 196.165 µS/cm and ranging between 150 and 650 µS/cm. Given that the samples were from DHW, the increase in conductivity values can be attributable to the increase in temperature itself, as both parameters are directly related. Thus, when analysing only the conductivity for Legionella-positive samples, the range was lower, 200–550 µS/cm, with an average of 323.5 µS/cm.
High conductivity levels cause the release of solids dissolved in water, which would favour an increase in salinity and subsequent scaling or corrosion phenomena. Campaña et al., 2023 [26] reported no significant differences between groups but showed a stronger association between very high EC values of 3.63 × 10³ uS/cm and Legionella colonisation.

3.1.3. Colour

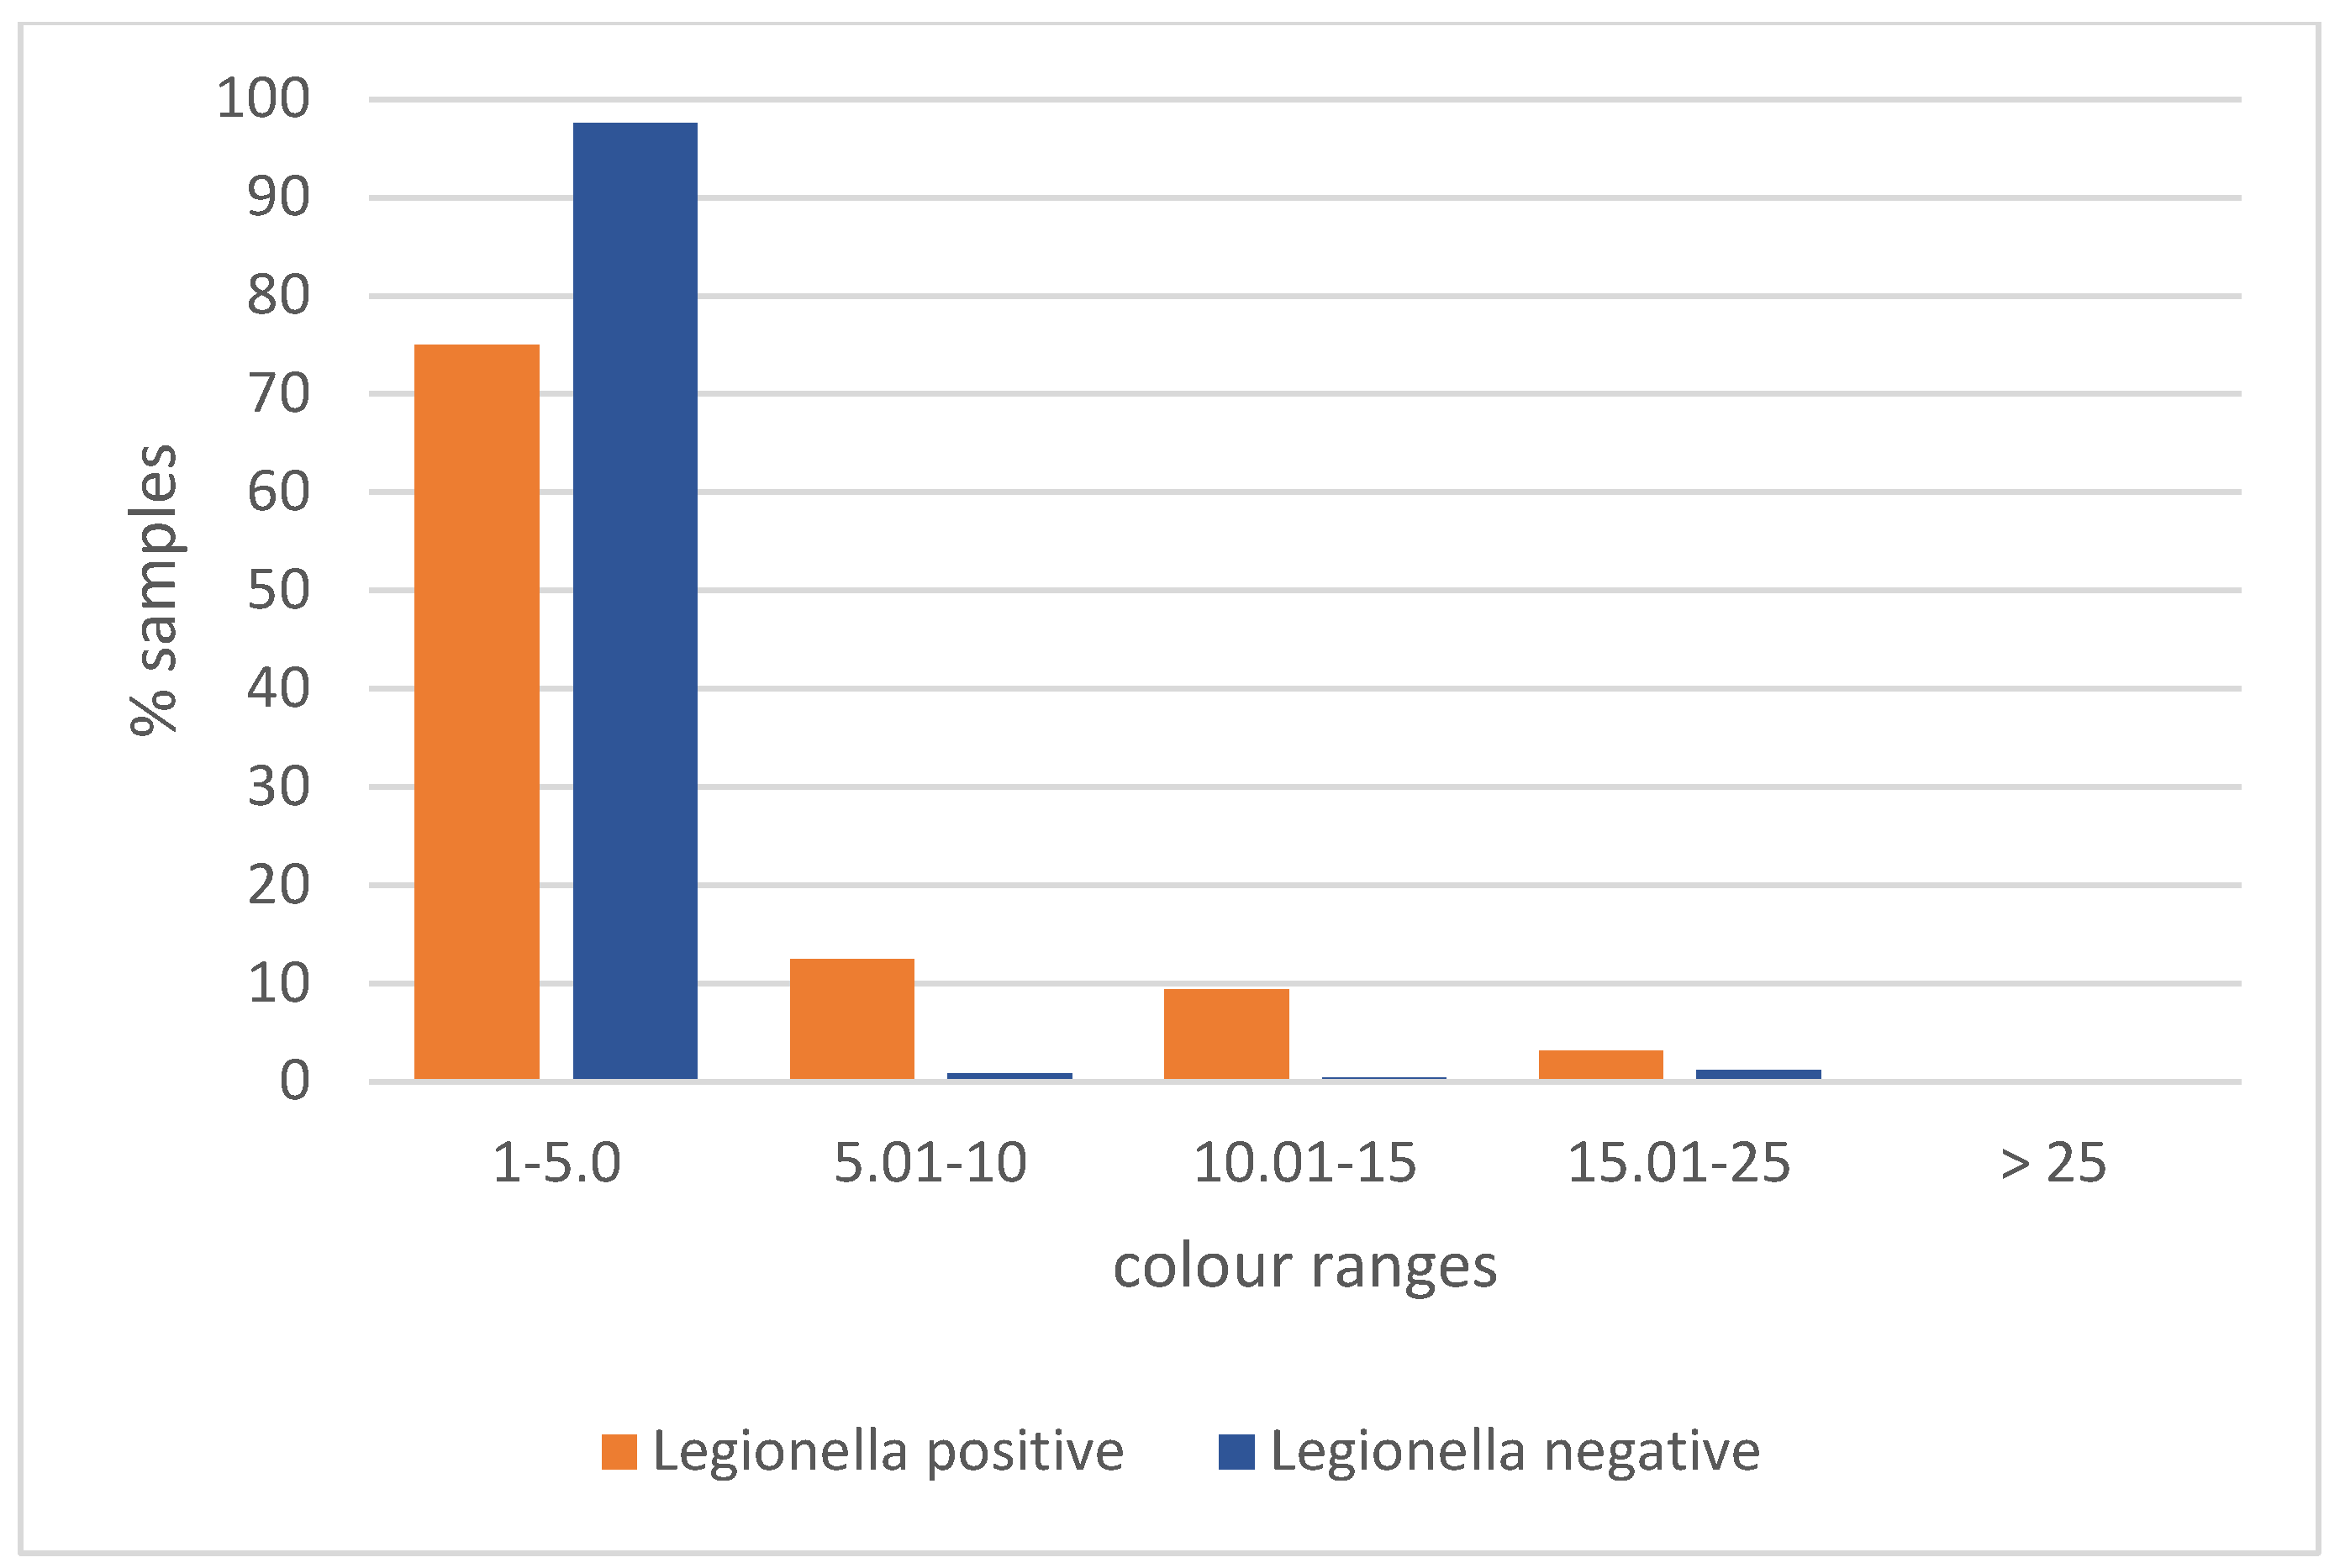
In the DHW samples analysed, the average colour value was 2 mg/L Pt/Co, in accordance with legislation, and is like those detected in Spain, which ranged between 1.7 and 1.8 mg/L during the period 2007–2020 [35]. Only 3.1% of the samples that had Legionella exceeded the permitted colour value (15 mg/L Pt/Co). In contrast, 98.88% of the samples without Legionella complied with this parameter. In addition, 97.5% of samples without Legionella had a colour between 1 and 5 mg/L Pt/Co. However, 20 samples (1.22% of the total) were detected that did not comply with the permitted value. Legionella-positive samples were mostly (75%) found in the lower range of 1–5 mg/L Pt/Co, although there were two samples (3.13%) that exceeded the permissible value (Figure 4).
The Chi-square test revealed significant differences between the degree of compliance with this parameter for positive and negative samples (p < 0.0001). The Spearman correlation between CT and colour for the population of 64 positive samples is weakly negative (r = −0.300, p < 0.05).
The presence of colour in the water in indoor installations may be due to the presence of non-reducing organic matter (NOM), such as humic substances, but in most cases it comes from certain metals in the pipes, such as iron, manganese and copper, which migrate into the water due to corrosion and are found dissolved or in suspension, causing characteristic reddish, blackish, brownish or greenish discolouration [16,18].

3.1.4. Turbidity

Water turbidity can also be related to the presence of this microorganism. Biofilm and turbidity measured in water are directly related, which is why, according to WHO guidelines [36], the turbidity of water for human consumption should not exceed 5 NFU under any circumstances and should ideally be below the PV of 1 NFU. In Spain, the average value obtained in drinking water during the years 2017–2021 was found to be between 0.37 and 0.43 NFU.
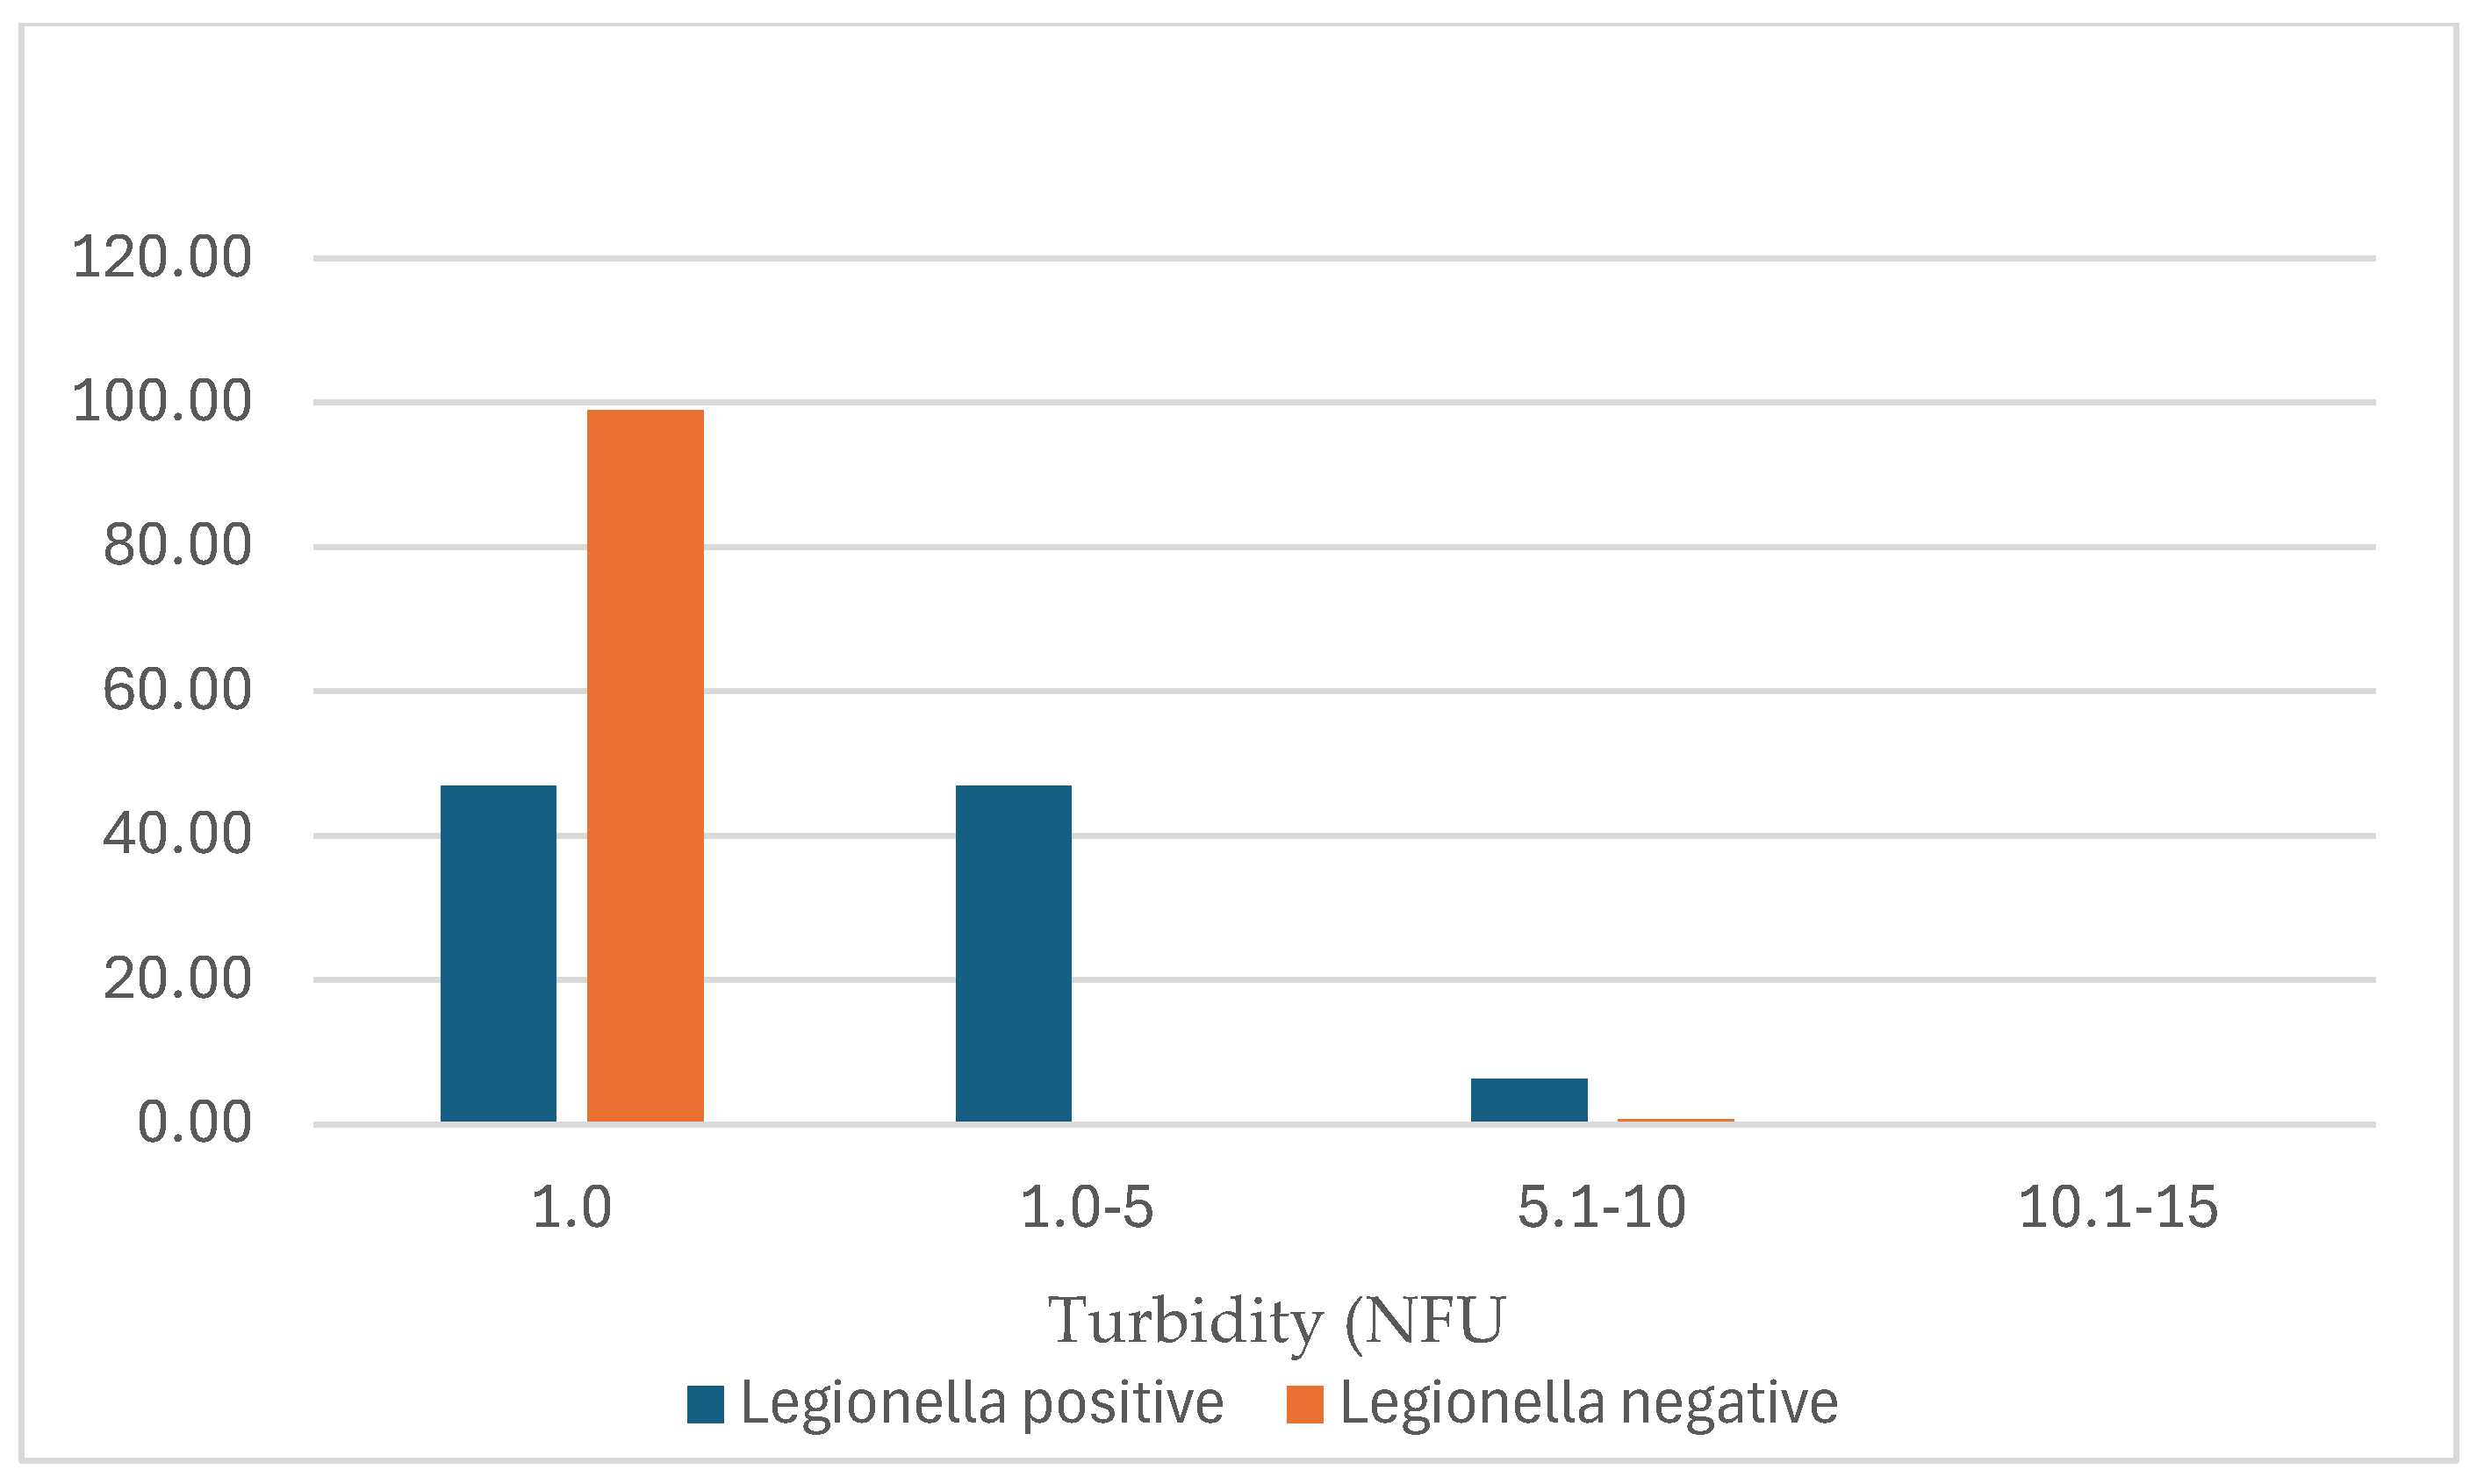
In this study, the average turbidity was <1 NFU according to the PV in 98.9% of Legionella-negative samples (Figure 5). Forty-six point nine per cent of samples colonised by Legionella had the same value (<1 NFU), but a similar percentage (46.9%) of these samples showed values between 1.1 and 5 NFU. Non-compliance for negative samples was very low (1.1%) and was found to a greater extent in samples colonised by Legionella (6.26%). Statistical analysis corroborates these differences (p < 0.0001).
High levels of both nitrites and iron were also observed in these samples. Some authors [26] showed that the correlation between turbidity and Legionella is very low (0.02), and that a turbidity level of 3.20 nephelometric units would be enough to detect the presence of Legionella.

3.1.5. Iron

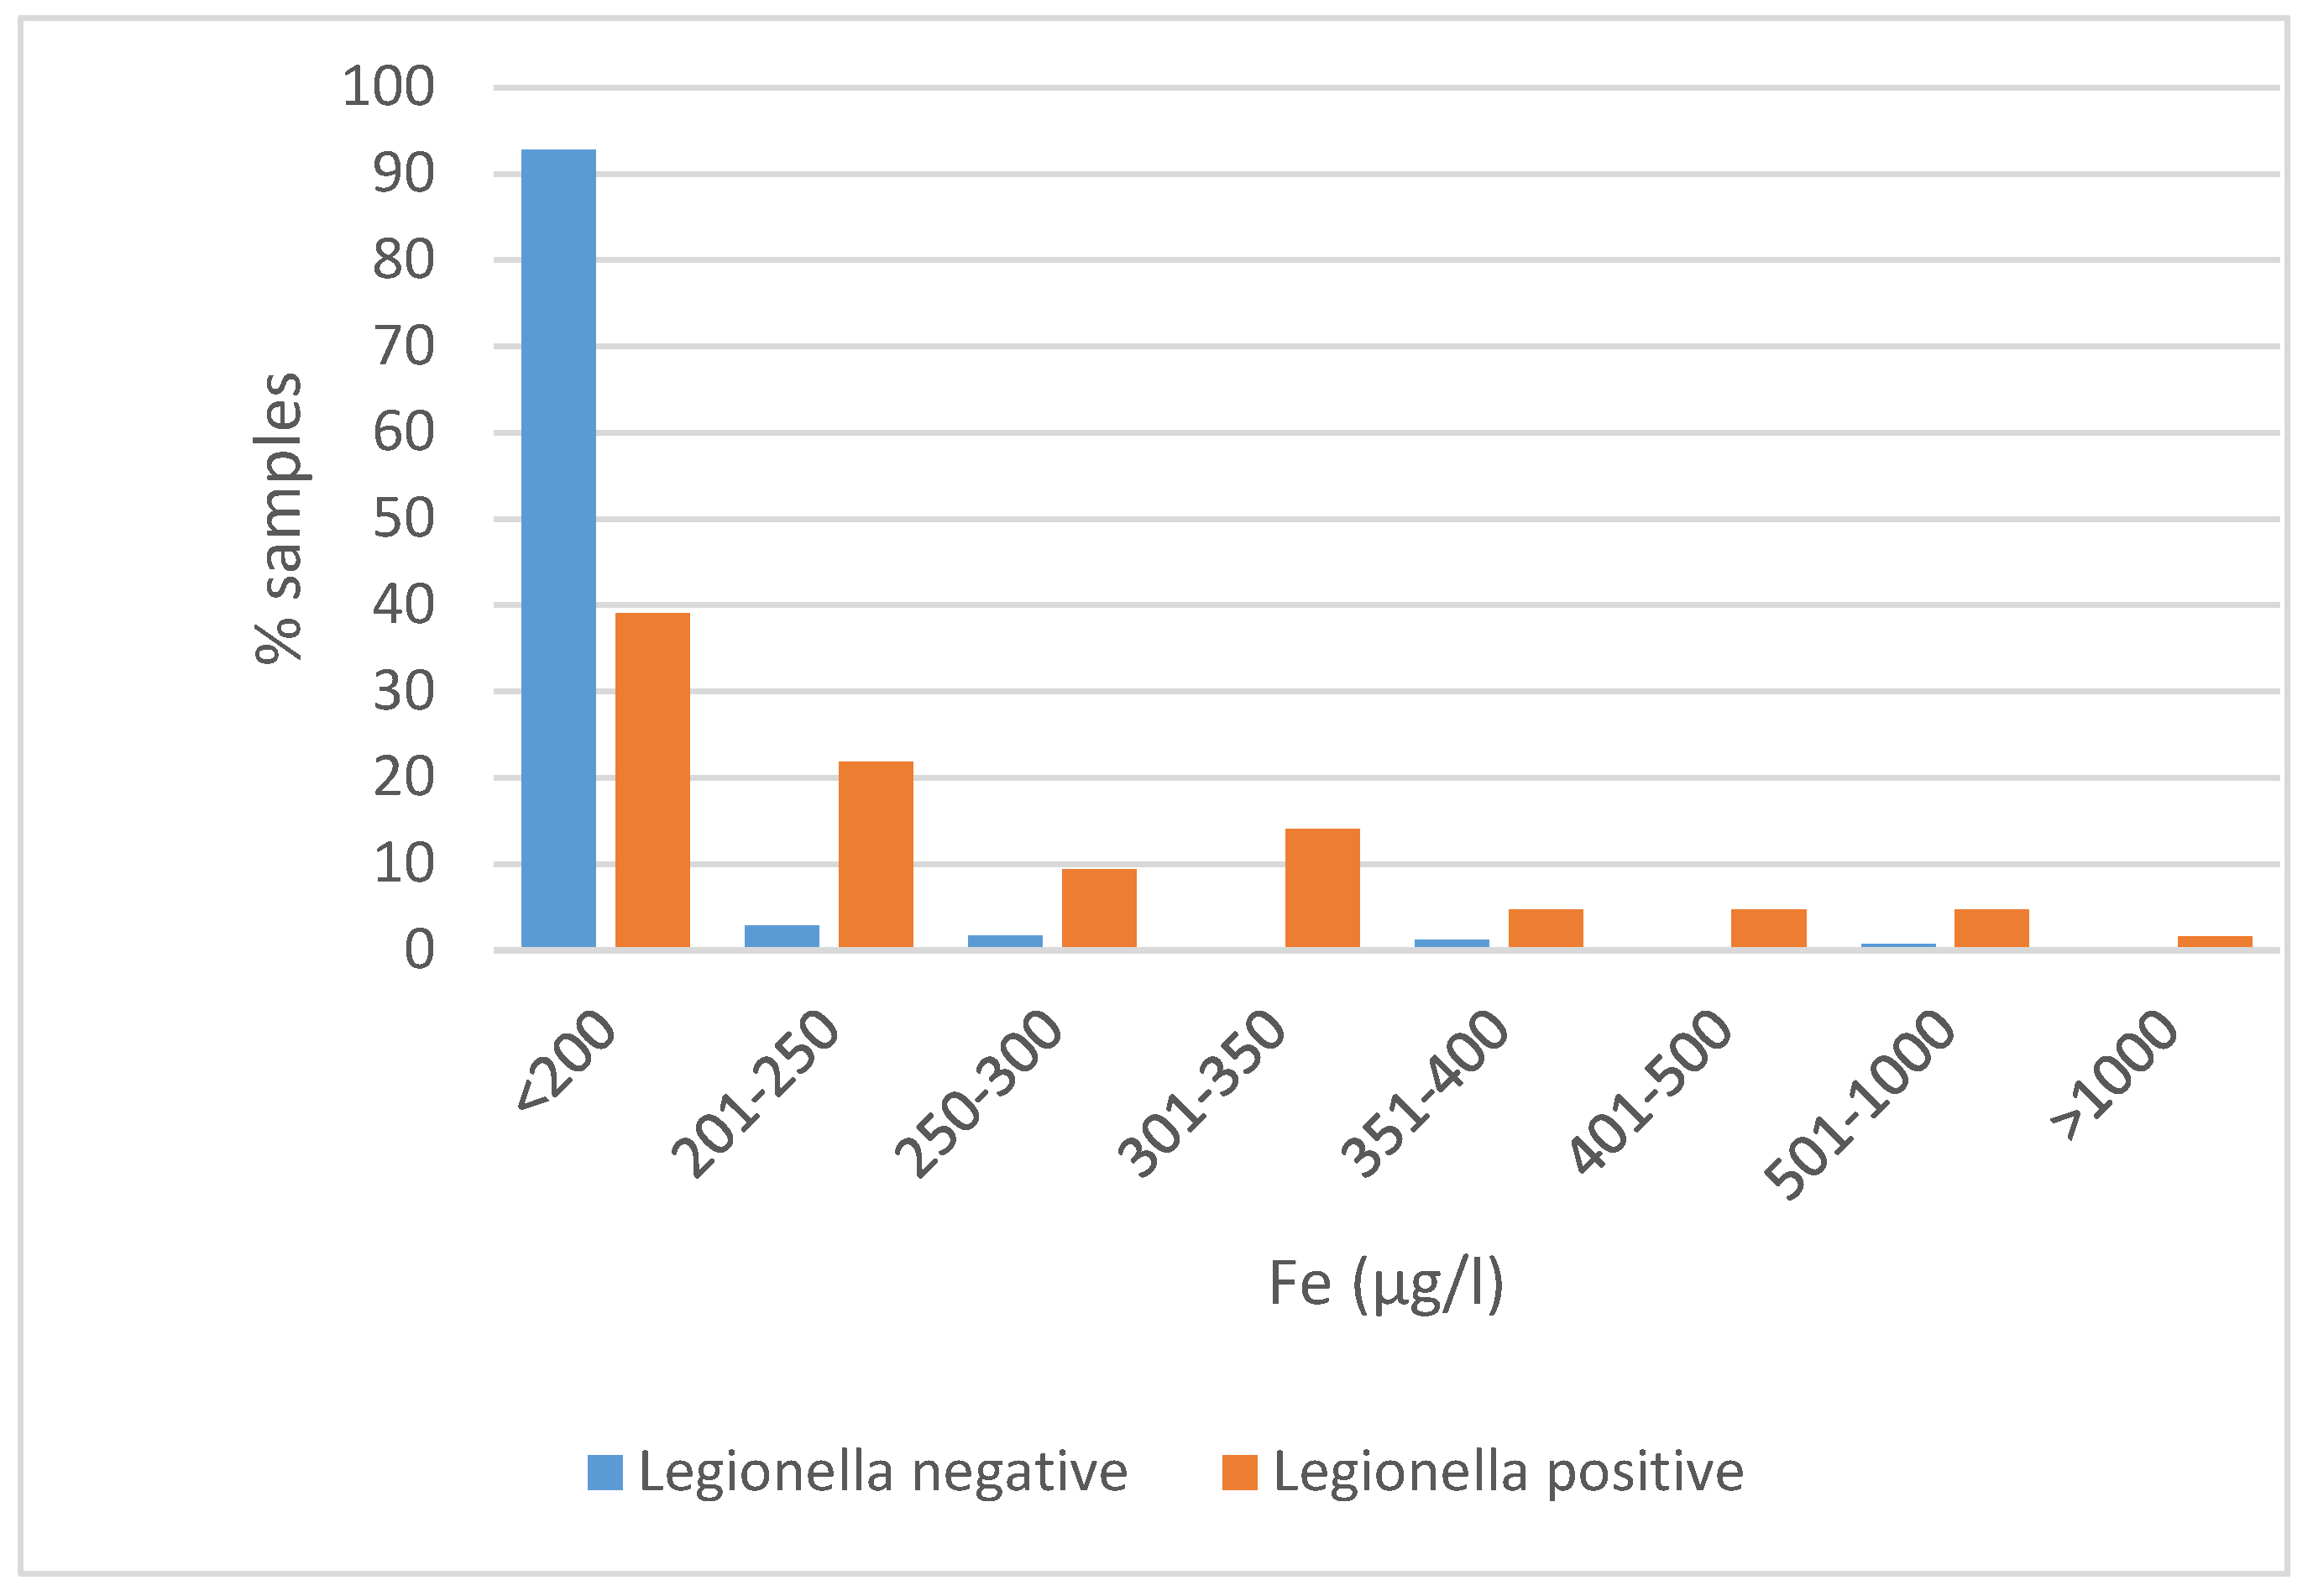
Iron is a growth factor that regulates the virulence of the bacterium, hence the importance of including this parameter in the present assay. The results obtained for iron in relation to the presence or absence of Legionella showed that 92.83% of Legionella-negative samples complied with legislation [37] for this parameter (Fe < 200 µg/L), compared to 39.1% of samples in which Legionella was detected (Figure 6).
The difference in compliance was significant (p < 0.0001). Spanish published data show lower results than the PV, with ranges between 16.9 and 22.6 µg/L in recent years (2016–2021).
When reviewing the distribution of iron values for Legionella-positive samples, a large percentage of samples (21.9%) were in the 201–250 µg/L range, 50% were in the higher 250–400 µg/L range, and, exceptionally, 1.6% of cases reached a maximum of 1022 µg/L. In contrast, only 6% of Legionella-negative samples had levels between 201 and 400 µg/L. In those cases where the Fe PV was exceeded, corrective measures were taken. In situations where iron levels were found to be >300 µg/L, measures were implemented immediately.
Pipe material often has a decisive influence on the development of Legionella, and this is particularly evident in a recent research [38] that studied the effect of galvanised iron pipes against plastic pipes in DHW systems and concluded that there is a higher detection of this bacterium in water samples from galvanised iron pipes (28.8%) compared to 17.8% in plastic pipe samples. In our study, most Legionella non-compliance cases were due to galvanised iron or steel, while this did not occur with plastic pipes in new sports facilities.
Borella et al., 2004 [39] suggested that water characteristics such as trace element concentrations are factors favouring Legionella growth. The concentrations of Fe might indicate corrosion processes in plumbing systems [40]. Other authors [41] detect a positive association between Legionella contamination and Fe concentration in hot water samples from public buildings in Japan. In 2011 a study [23] found that Legionella was positively associated with the concentrations of Fe. Others [24] found that a total iron level ≥ 0.095 was an independent risk factor for Legionella contamination in the hot water systems of 33 Catalan hotels and nursing homes. In line with these studies on cold and hot water systems, the present research identified the risk factors that favour Legionella colonisation in CT and EC. This could be explained by the fact that these facilities tend to accumulate stagnant water and products that constitute nutrients for bacteria, which favours the formation of biofilms that, together with a favourable temperature and optimal microbiological and physicochemical conditions, promote the growth of Legionella [11,12].

3.1.6. Nitrites

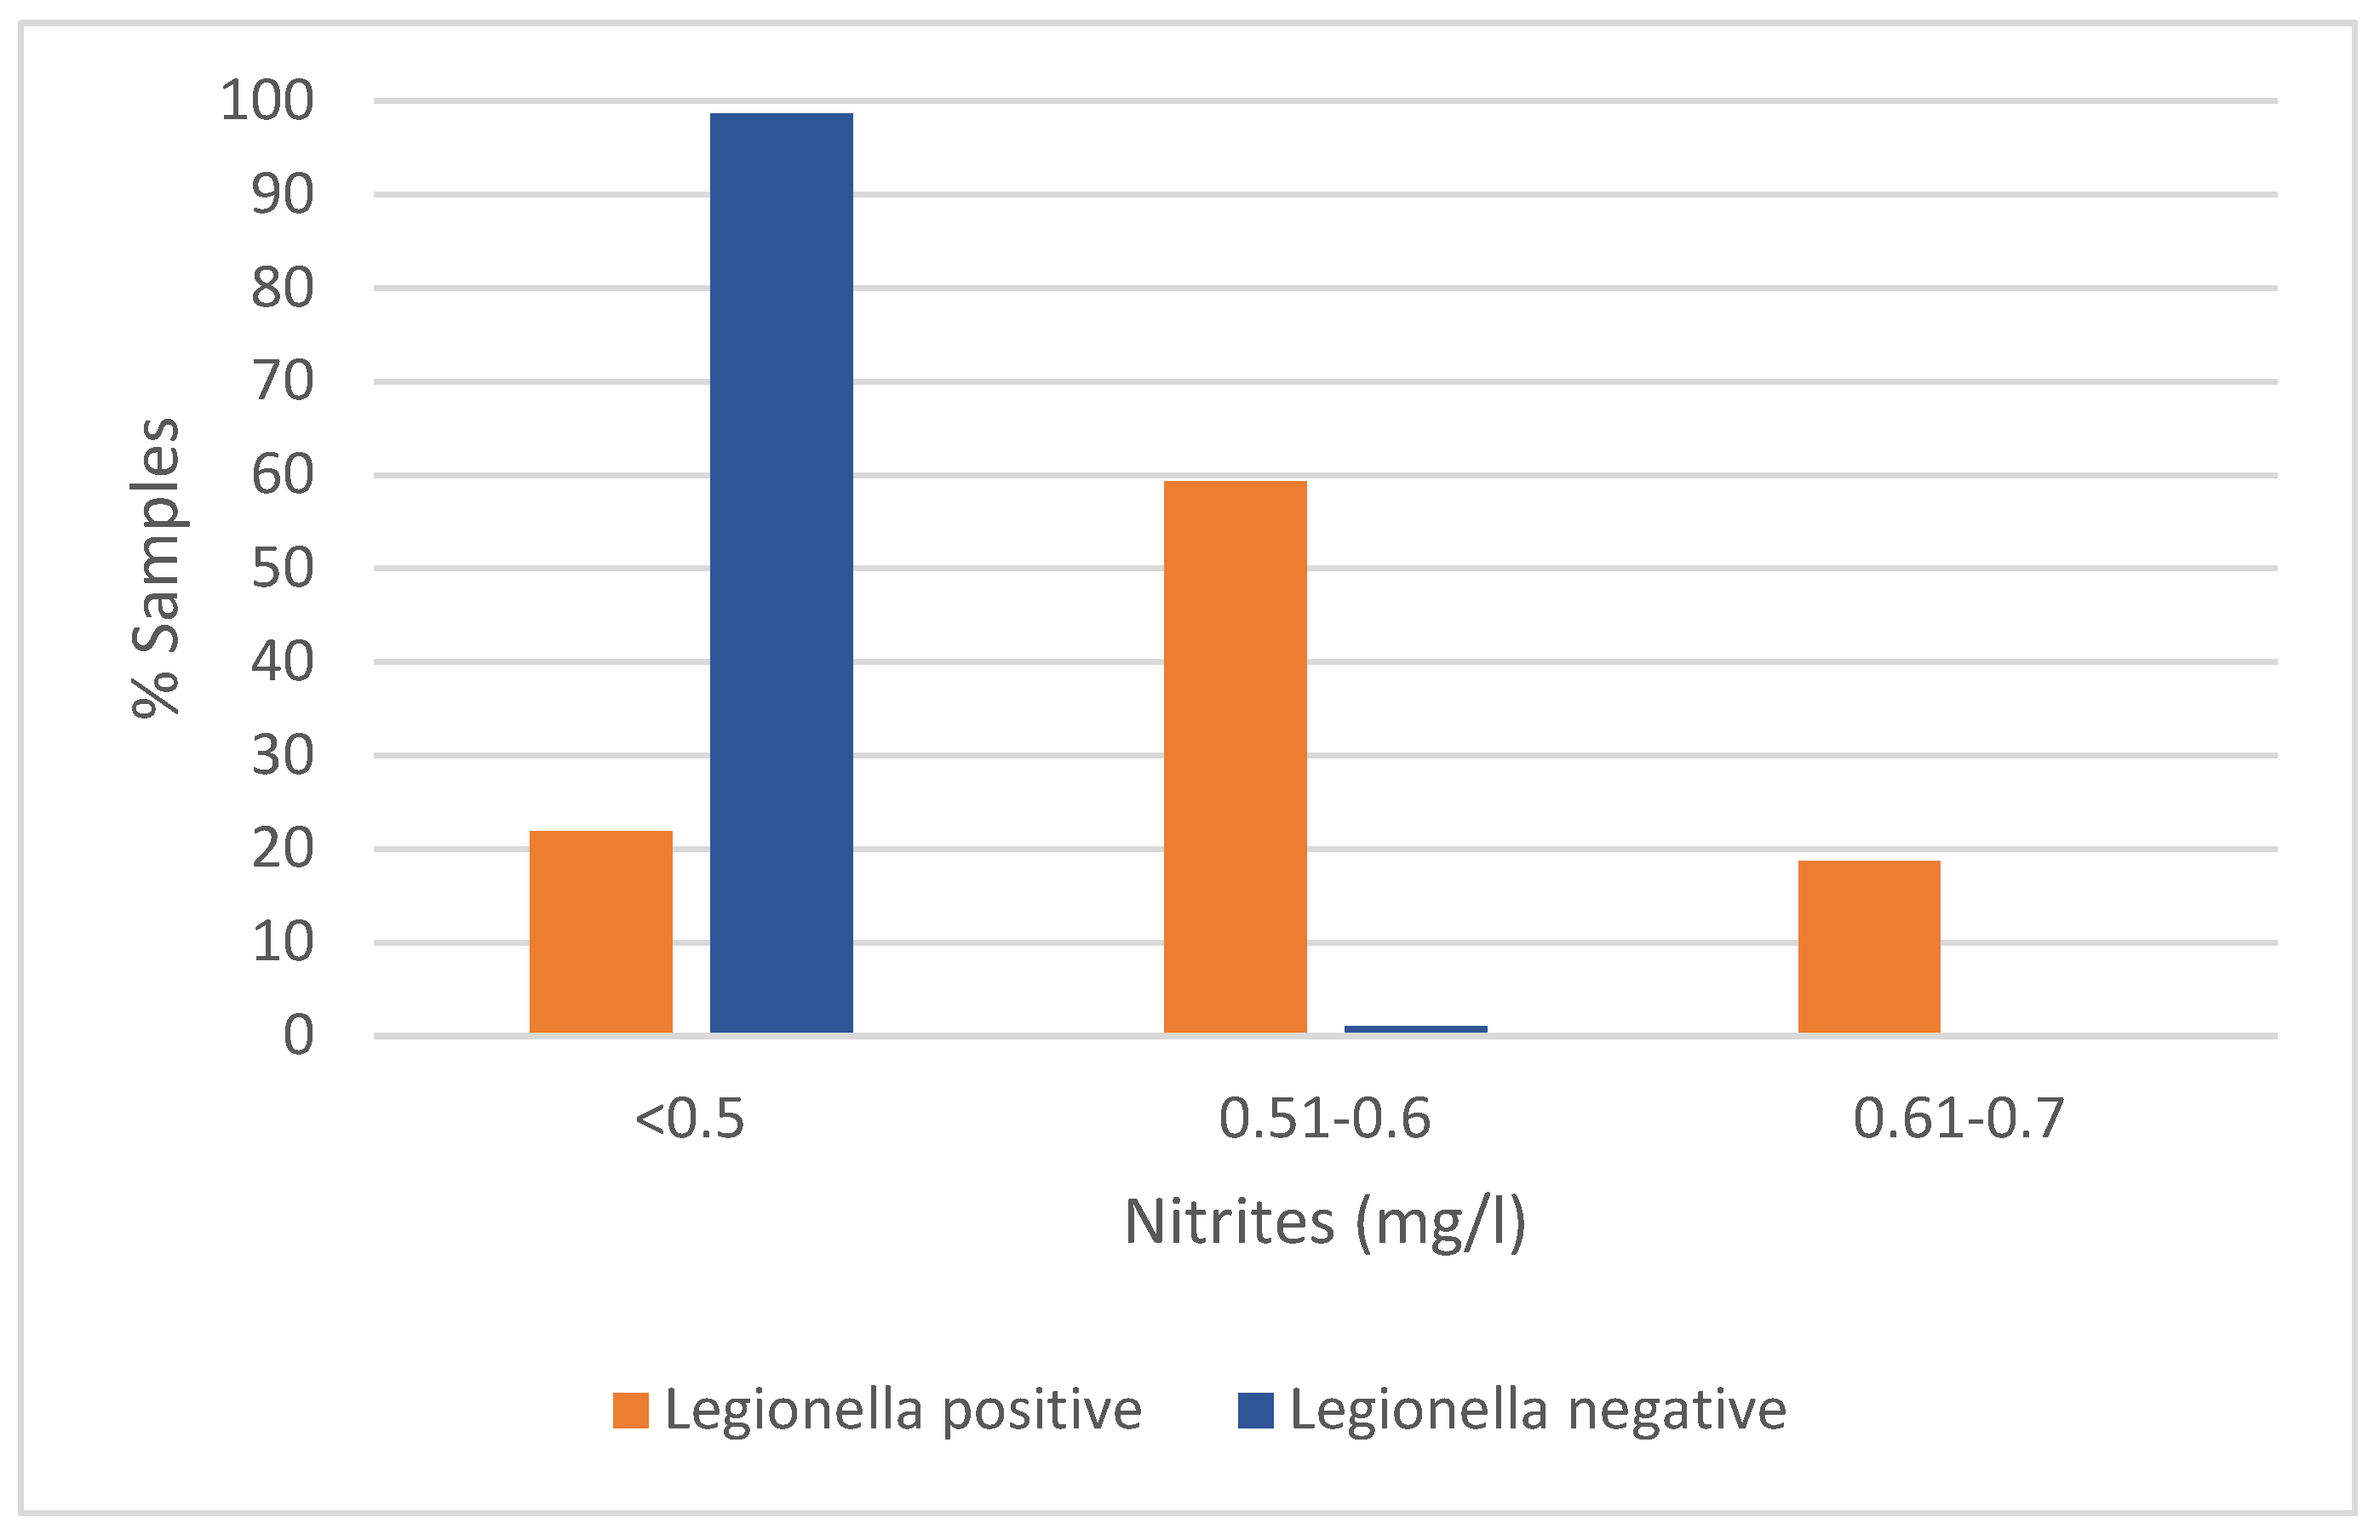
The presence of nitrites in water is a clear indicator of its quality. They come from faecal contamination or the metabolism of microorganisms such as Legionella. The results obtained for this parameter are shown in Figure 7.
In the present study, 98.6% of negative samples complied with the maximum allowed limits for nitrite presence in drinking water (<0.5 mg/L). Above these levels, the water is not suitable for human consumption. In the case of positive samples (21.9%), the level of compliance was significantly lower (p < 0.0001). When the distribution of sample percentages and nitrite values is analysed, a majority of 59.4% of samples have values between 0.51 and 0.6 mg/L, while a more moderate but remarkable percentage of samples (18.9%) have values above 0.61–0.7 mg/L. In these cases, the solution applied was to increase chlorination.

3.1.7. Coliforms

Total coliform bacteria can also survive and proliferate in water distribution systems, especially in the presence of biofilms, and their presence is related to improper maintenance of the distribution network and/or indoor installation [42]. The data obtained is used to assess and correlate the joint presence of Legionella with microorganisms such as Escherichia coli and enterococci, which are used as indicators and microbiological parameters of drinking water quality.
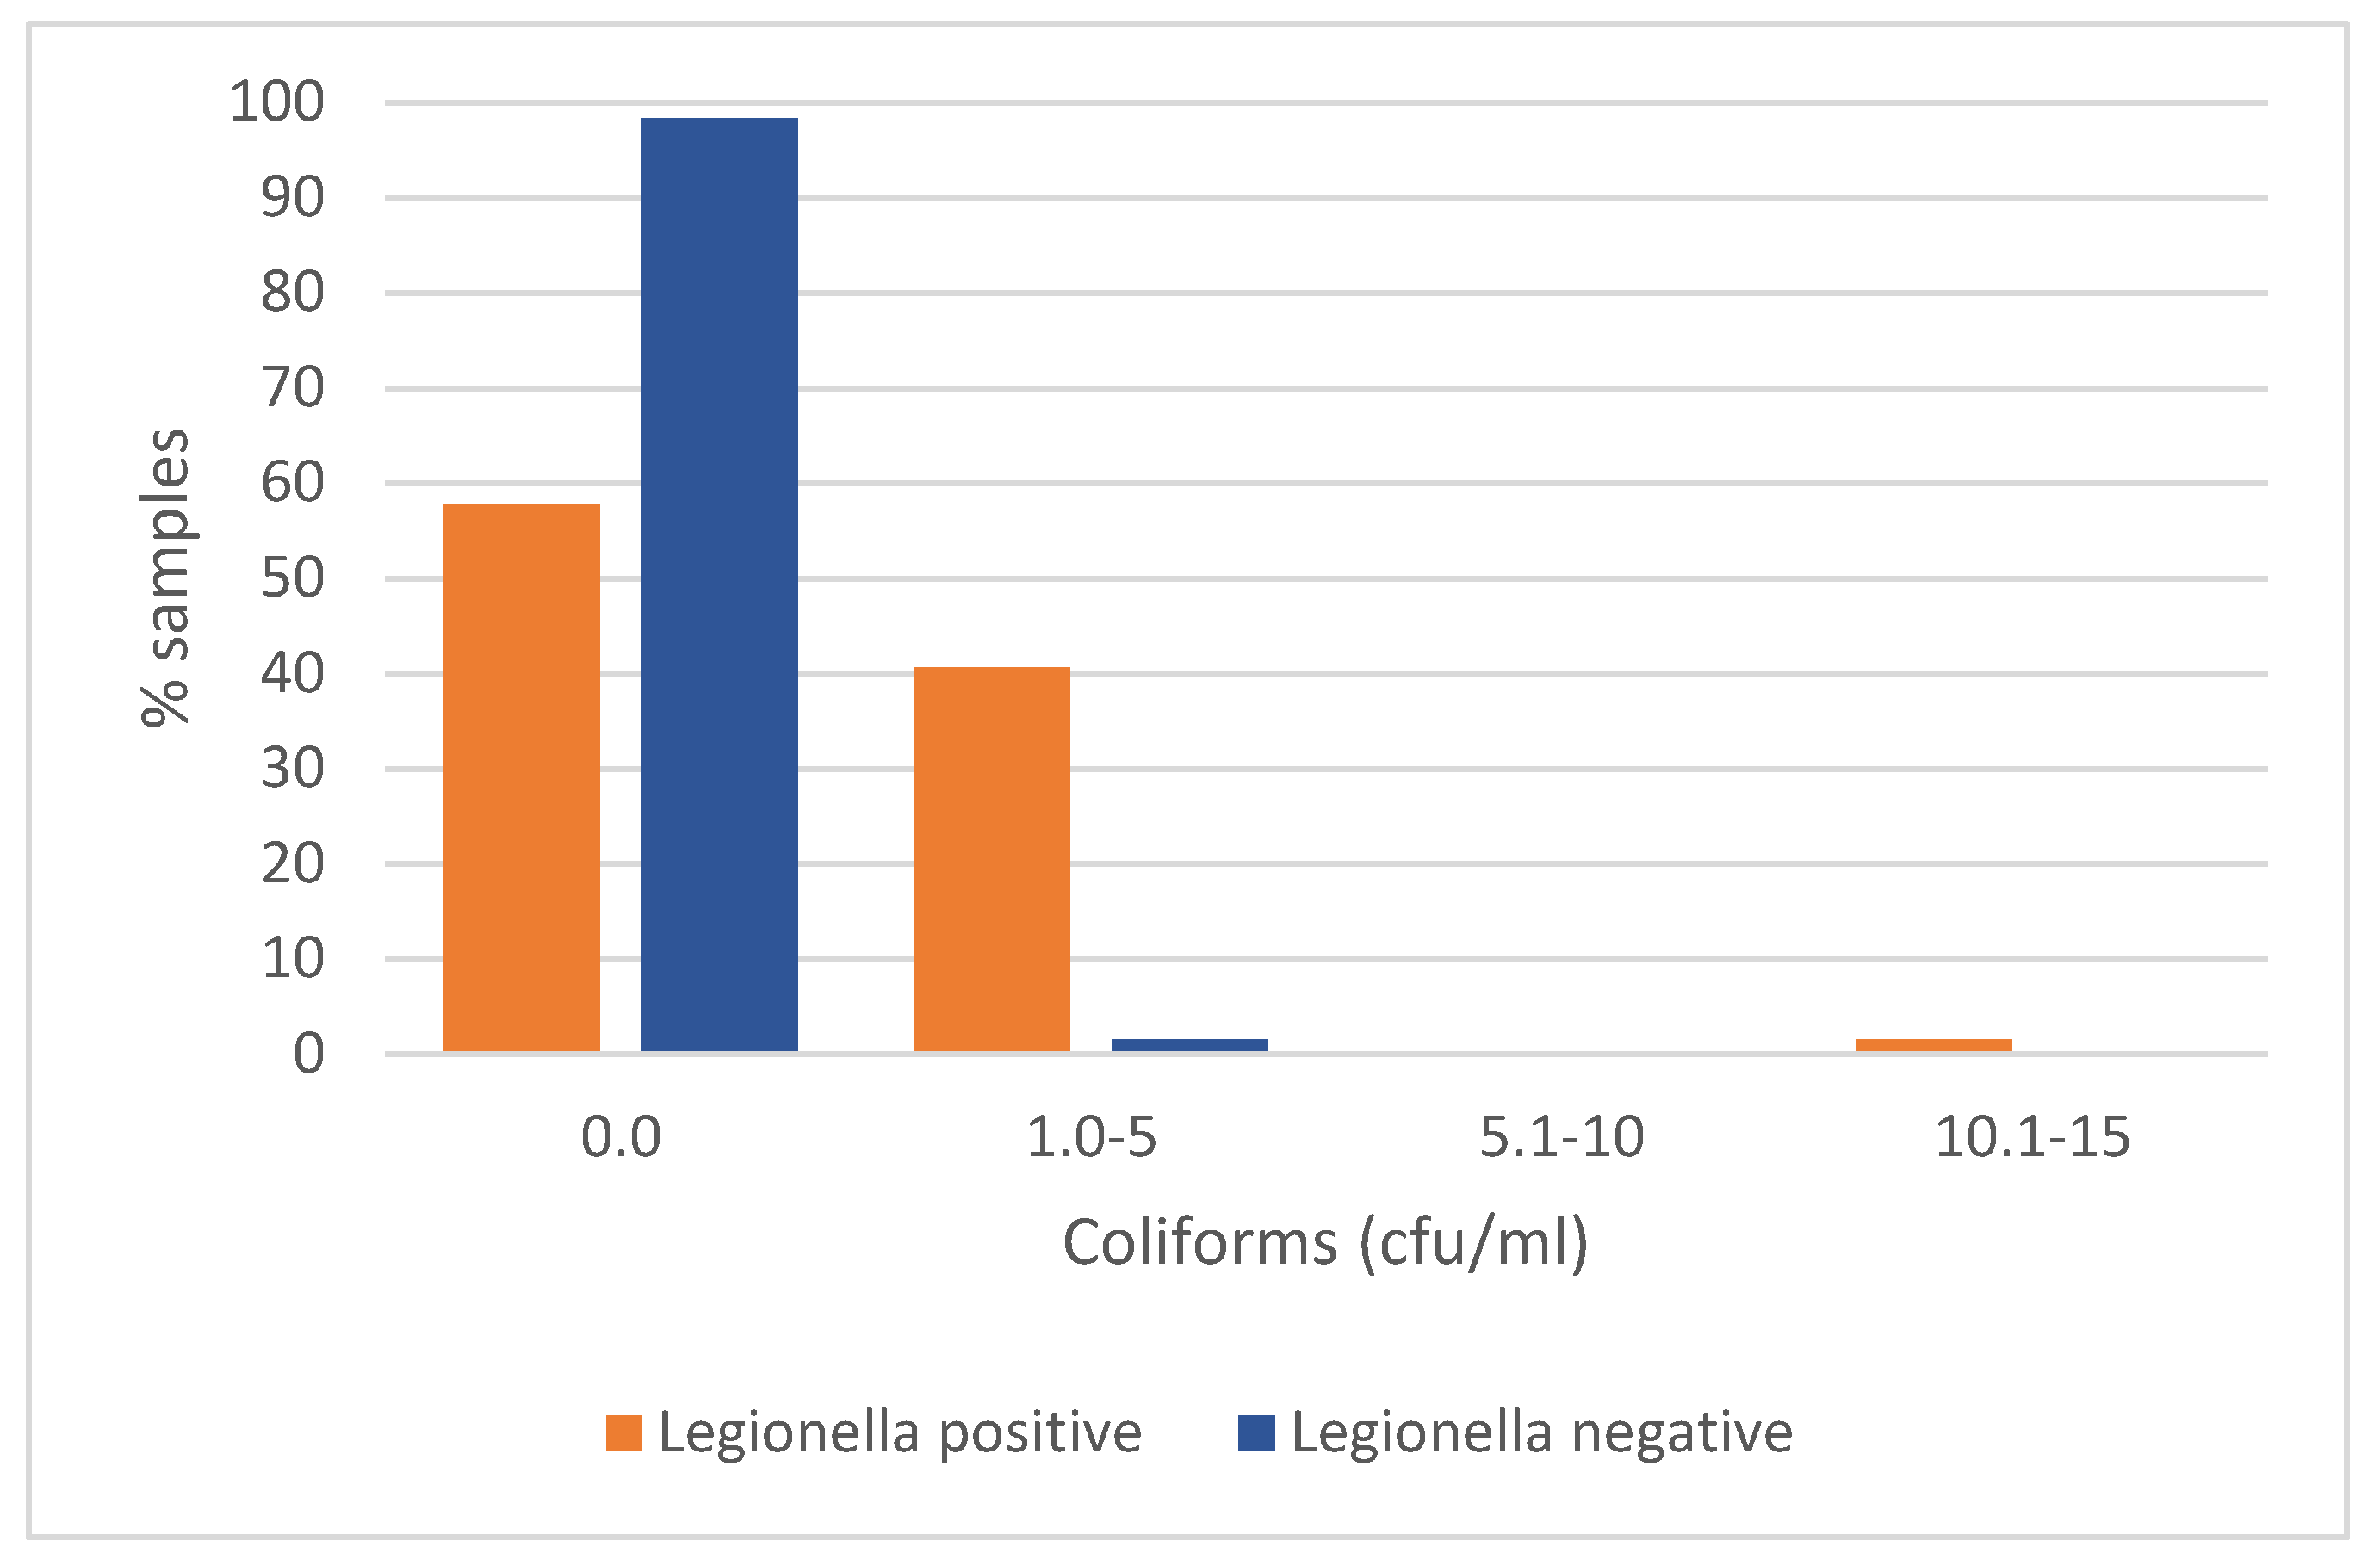
The present results on non-compliance are highlighted in Figure 8. In total, 98.3% of the samples not colonised by Legionella were not colonised by coliforms either. This percentage was significantly reduced (p < 0.0001) for Legionella-positive samples, where only 57.8% were free of coliforms in accordance with PV = 0 cfu/mL. The distribution of the percentage of Legionella-positive and -negative samples in each coliform count range is shown in Figure 6. It is noteworthy that 40.6% of the samples with Legionella contained coliforms at levels of 1–5 cfu/mL, and 1.6% still showed extreme contamination, with very high counts in the order of 10–15 cfu/mL.

3.1.8. Degree of Compliance with Parameter Indicators in Relation to Legionella

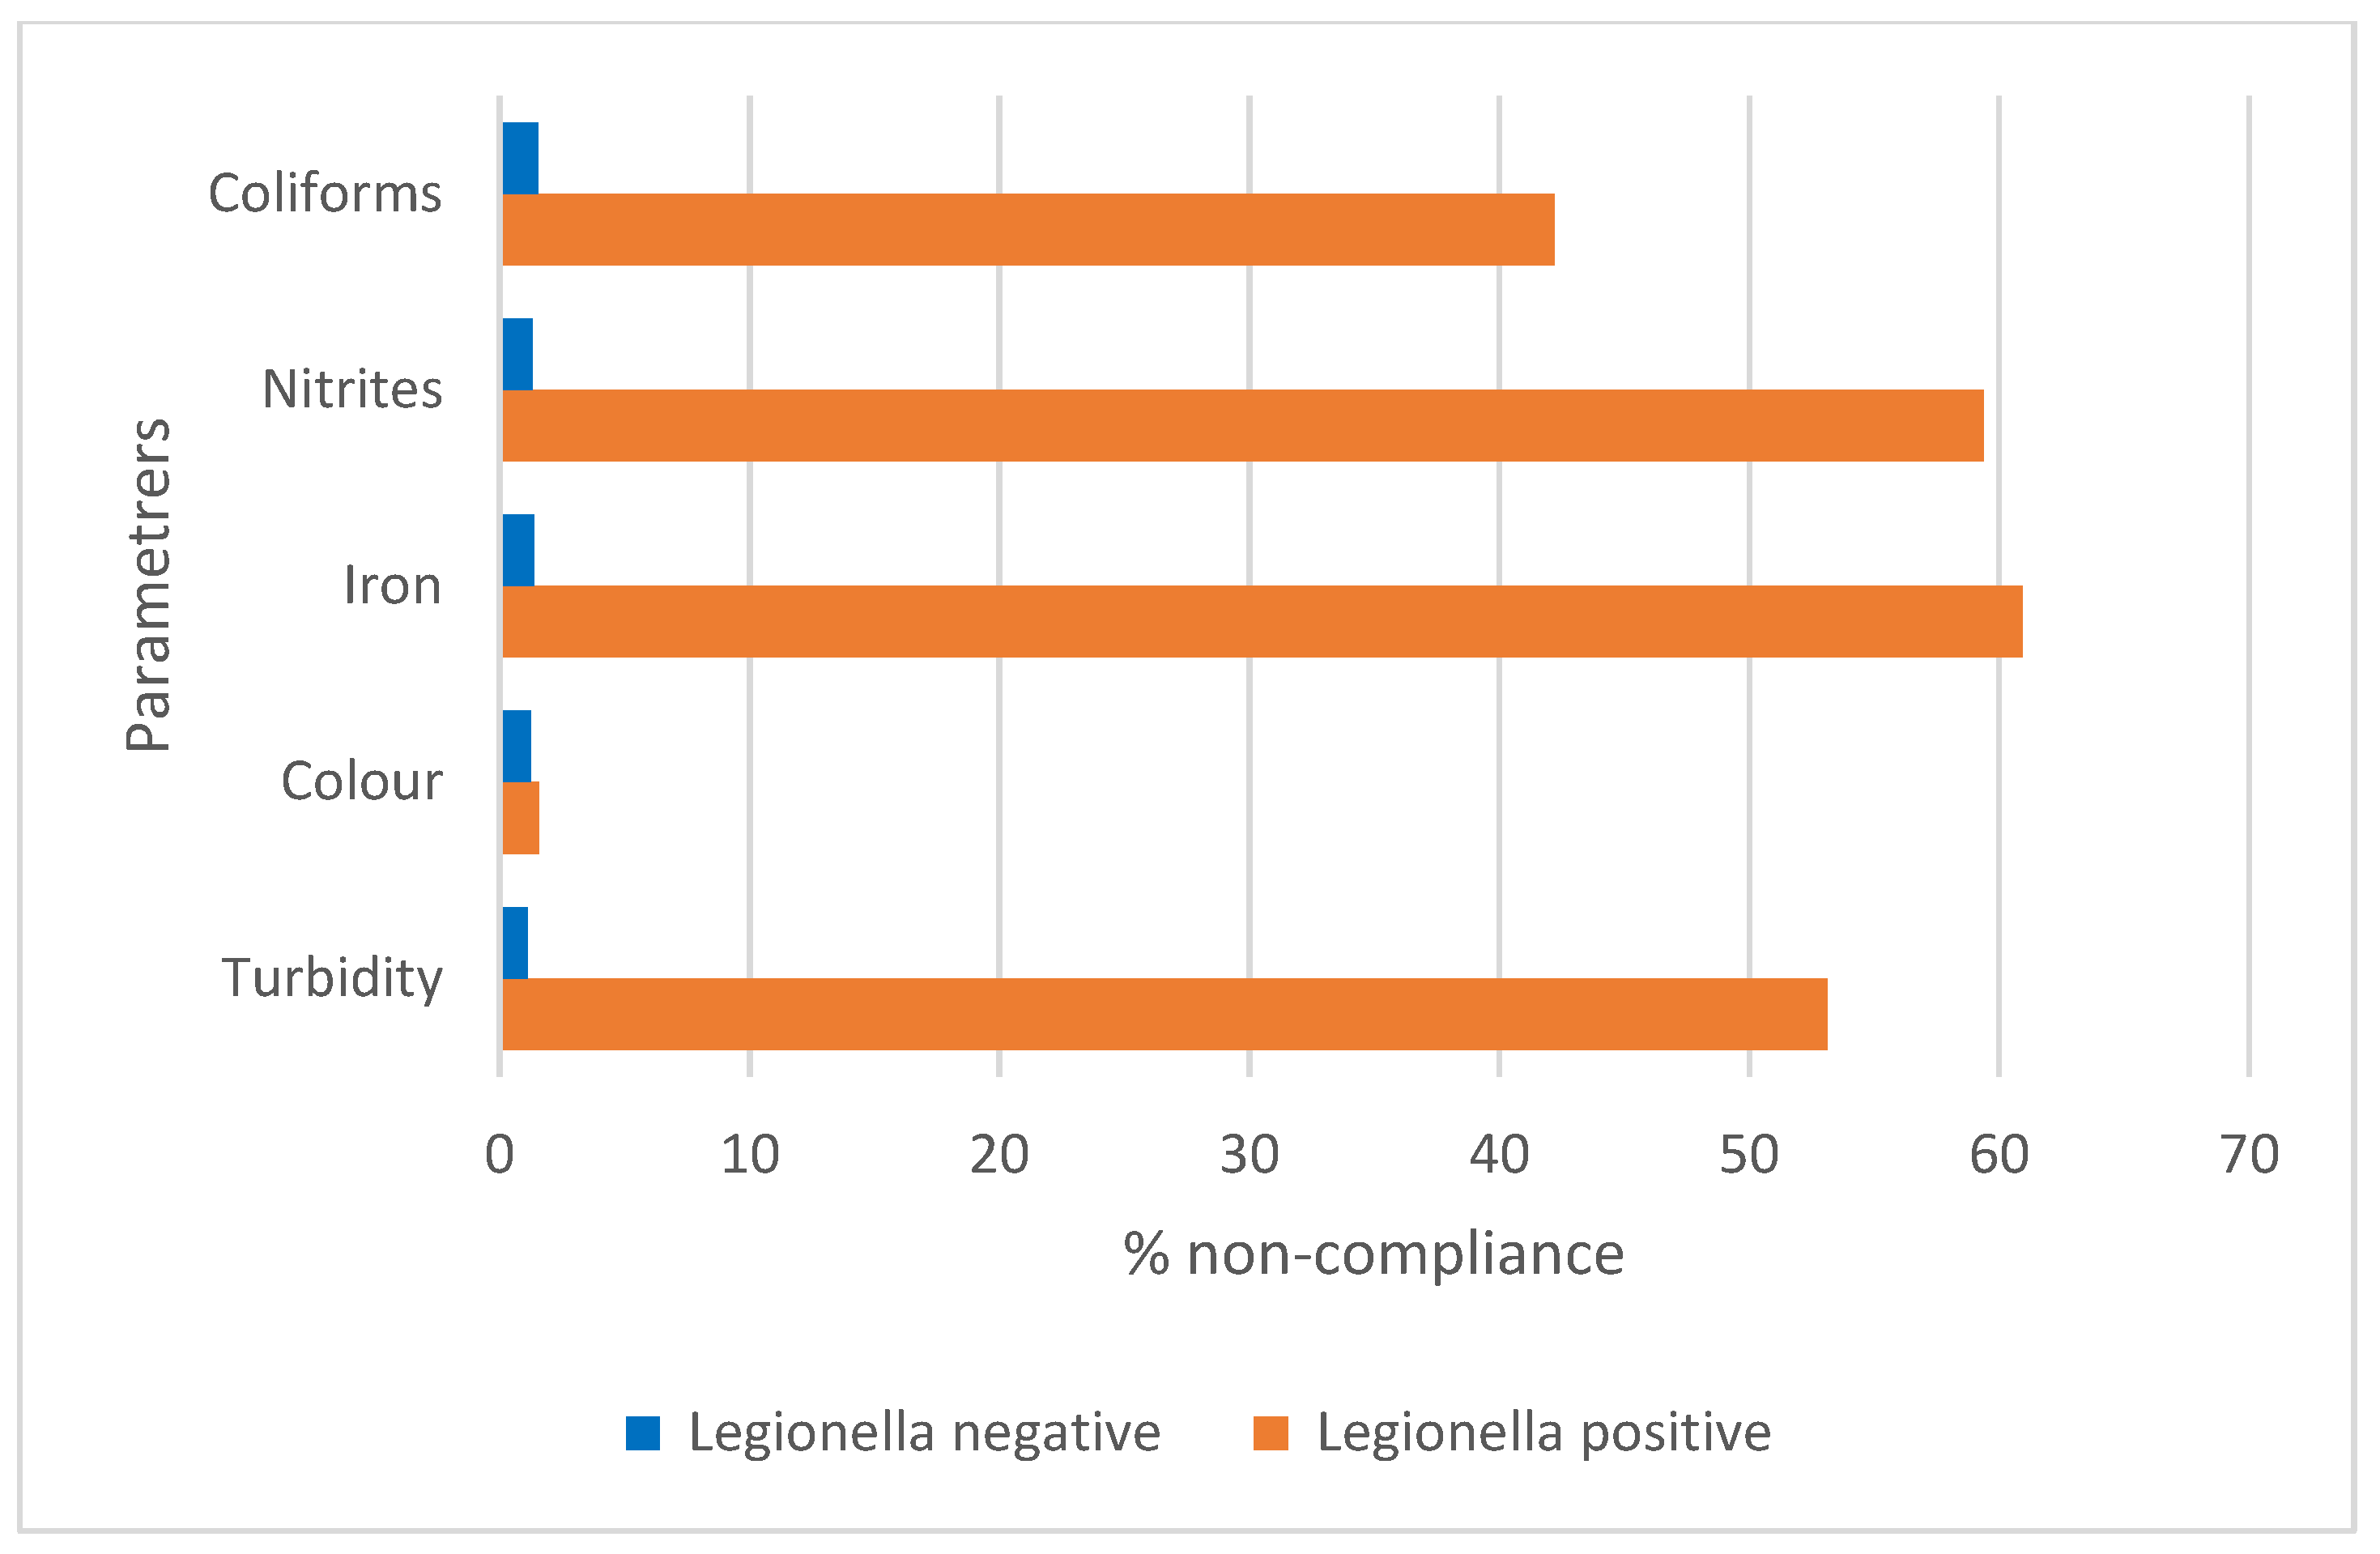
Figure 9 clearly shows that in samples colonised by Legionella, the rates of non-compliance for the physicochemical and microbiological parameters analysed were significantly higher than the levels calculated for Legionella-free samples. Of notable interest is the case of iron, where the highest proportion of non-compliance (>80%) occurred in samples with Legionella, as well as nitrites, where 79.10% of Legionella-positive samples had nitrite levels that exceeded the legal limit. The same occurred, although to a lesser extent, with the parameter of turbidity and the presence of other coliform and aerobic bacteria, which indicated the presence of biofilm in the drinking water samples for Legionella control.

3.1.9. Analysis of the Degree of Non-Compliance of Physicochemical and Microbiological Parameters by Building Type

Table 1 shows the non-compliance with the different microbiological and physical–chemical water quality parameters related to the different sampling locations in Madrid. No non-compliance cases were detected in samples from hostels, bars or public fountains. In hospitals, only 3 (10%) of the samples showed levels above the parametric value with respect to colour. In schools, few samples were found to be non-compliant, all of them belonging to the same district (Barajas) and sampled in autumn 2008. One of the samples taken from a shower was highly contaminated, with non-compliance in terms of colour, turbidity, iron and coliforms. In addition, two samples were found to have high levels of coliforms and iron, and one sample was only contaminated with coliforms. In these cases of non-compliance with physicochemical parameters, there was no Legionella colonisation. In hotels, there was a high number of samples (81) taken mostly in 2008 at different times of the year, with non-compliance of iron, 80 from showers, mainly from Arganzuela district, Salamanca and Barajas, where Legionella was not detected, and one sample from a tank in district Centre, where Fe levels reached 1100 ug, consistent with high levels of turbidity, colour and nitrites and the presence of coliforms and Legionella. Regarding public bodies, the turbidity non-compliance (15 instances) stands out in samples taken mainly in winter 2019, of which 14 came from showers and 1 from a tank, coinciding with the eight Fe non-compliances, the six nitrite non-compliances and the four coliform non-compliance instances. There was a clear relation between nitrite and coliform contamination and Legionella colonisation. Finally, sports centres were the type of building most affected by iron contamination, linked to non-compliance with colour and turbidity standards, as well as nitrites, which was associated with a high number of samples containing coliforms.
In all parameters studied, regardless of building type, higher pollution levels were observed in the outlying districts than in the central districts, which is perhaps related to building maintenance.

3.1.10. Association Between Physicochemical and Microbiological Parameters: Correlation Analysis

Correlation analysis applied to all samples (1695) (Table 2) revealed highly significant correlations between Legionella and all physicochemical parameters, except pH, as well as between microbiological contamination by coliforms and colonisation by Legionella. Stronger correlations (p < 0.0001) were observed among contamination indicators and Legionella: Legionella—nitrites (0.73216) and Legionella—coliforms (0.4371). Likewise, a high correlation of 0.55081 (p < 0.0001) was observed between nitrites and coliform bacteria, as expected, since both come from faecal contamination and are indicators of recent contamination. The correlation analysis also showed a very close association between Legionella and turbidity (0.56954), which is to be expected, since turbidity is closely related to the presence of biofilms, which favours the multiplication of Legionella. Finally, a significant and very evident correlation of 0.52311 (p < 0.0001) was also found between Fe and colour, as this element has a reddish colour, and its presence in water promotes colouration.

3.1.11. Overall Risk Assessment in Sports Centres Where Legionella Is Present

The risk assessment was performed at 12 sports centres located in different districts of Madrid, where Legionella was detected by qPCR in samples taken for monitoring purposes during the study period. Specifically, facilities SC1 and SC3 are located in Villaverde, SC2 in La Latina, SC4 in Villa de Vallecas, SC 5 Arganzuela, SC6 in the Salamanca district, SC7 in Chamberí, SC8 in Carabanchel, SC 9 in Puente de Vallecas and SC10, SC11, and SC12 in Moncloa.
Following the guidelines of the Technical Guide for the Prevention and Control of Legionellosis in Facilities of the Ministry of Health and technical notes NTP 691 and 692 (INSHT, 2006 [33]), the structural risk (SR) was calculated based on the characteristics of the facility, the operational risk (OR) associated with its operation, and the maintenance risk (MR) related to the treatments carried out for this purpose. Based on these results, the overall index was assessed. Table 3 shows the structural, maintenance and operational risk factors and indices, as well as the overall index included in our study. It should be noted that, as stated in the formula, the index associated with maintenance risk has the greatest impact, although in the case of very old facilities, the contribution of structural risk to the overall index is highly significant.
Among the 12 sports centres studied, SC1 and SC3 had a very high overall index, above 80, which meant that their DHW network was fully operational. As SC1 was a very old facility, it was completely renovated, and the storage elements and sections of pipes in poor condition were replaced in their entirety. The SC3 facility, which is in the same district, was found to be high risk, as it is similarly old and has a large and complex water distribution network. The insufficient effect of the disinfection methods observed in these two centres could be due in part to the specific conditions of these facilities, as they have several areas of piping where water could become stagnant (without exchange during cleaning and disinfection) and develop biofilms.
In addition, both three-way valves and faulty return valves in taps and showers can cause widespread temperature losses due to the mixing of cold and hot water and thereby promote the development of biofilms.
Improvements in disinfection at these sports centres by their maintenance companies—based on monitoring chlorine levels in remote locations, along with other measures such as regularly draining water from the networks, periodically purging accumulators and partially removing the corroded plumbing system, one of the causes of the persistence of Legionella in the system biofilms—succeeded in reducing the levels of this bacterium. In both cases, the action was aimed to reduce the structural risk below 60, through the replacement of deteriorated elements, and to reduce the maintenance risk below 50, with the following actions: increasing the temperature of DHW in storage to >60 °C, in the return network to above 55 °C and at terminal points to above 50 °C; review of the hygienic condition with microbiological control after maintenance of the installation; and increasing the frequency of cleaning and disinfection. Structural condition check: pipes were renovated and heated, insulation shells were replaced, and three-way valves were replaced at the entrance to the changing rooms. Shower diffusers were also replaced with wider pores to allow for thicker water droplets. The renovation of the return network and drainage valves was crucial in eradicating the bacteria.
Fifty per cent of the installations had a low overall index, below 60, and corresponded to samples SC-2, 5, 7, 8, 9 and 12. These cases were negative for Legionella since the water temperature coming out of the heaters remained constantly above 60 °C and above 55 °C throughout the network. The results confirm that frequent use and sufficiently high temperatures within hot water distribution systems can suppress the growth of Legionella. The remaining facilities had medium or moderate overall indices, and corrective actions were carried out to reduce the structural index and increase the frequency of facility reviews to reduce the maintenance index.

4. Conclusions

The results of this study show that, among the physicochemical and microbiological factors considered, the levels of non-compliance with the parameters for turbidity, nitrites, iron and coliforms in the hot water sampled in different buildings in the city of Madrid are decisive and show a relationship with the presence of Legionella in hot water systems. These parameters could be useful for monitoring the quality of the hot water supply if included in a comprehensive water safety plan, as they can indicate the possible presence of Legionella and other opportunistic pathogens.
The overall risk index for sports centres, based on structural, maintenance and operational risk factors and indices, was mostly low or medium, with only two considered to high-risk, mainly due to lack of maintenance. It should be noted that risk assessments have contributed to improving the supervision of facilities.
The diagnosis of the situation, established through the analysis of Legionella data, together with a systematic and critical examination of all factors contributing to its increased presence, has enabled us to identify ways to improve water quality.

Supplementary Materials

The following supporting information can be downloaded at: https://www.mdpi.com/article/10.3390/app16031628/s1, Table S1. Model for the calculation of structural risk factors; Table S2. Model for the calculation of maintenance risk factors; Table S3. Model for the calculation of operational risk factors.

Author Contributions

M.C.A.G., M.J.V.-S. and M.D.T.-S. contributed to the study conception and design. Material preparation, data collection and analysis were performed by all authors. The first draft of the manuscript was written by M.C.A.G., M.J.V.-S., A.G.-A. and M.D.T.-S., and all authors commented on previous versions of the manuscript. All authors have read and agreed to the published version of the manuscript.

Funding

This research received no external funding.

Institutional Review Board Statement

Not applicable.

Informed Consent Statement

Not applicable.

Data Availability Statement

The datasets generated during and/or analysed during the current study will be available from the corresponding author on reasonable request.

Acknowledgments

The authors acknowledge the Madrid Public Health Laboratory (CAM) for their remarkable collaboration and Ricardo García-Mata for his expert statistical assistance.

Conflicts of Interest

The authors declare no conflicts of interest.

References

  1. Fields, B.S.; Benson, R.F.; Besser, R.E. Legionella and Legionnaires’ disease: 25 years of investigation. Clin. Microbiol. Rev. 2002, 15, 506–526. [Google Scholar] [CrossRef] [Scilit] [PubMed]
  2. Mondino, S.; Schmidt, S.; Rolando, M.; Escoll, P.; Gomez-Valero, L.; Buchrieser, C. Legionnaires’ disease: State of the art knowledge of pathogenesis mechanisms of Legionella. Annu. Rev. Pathol. 2020, 15, 439–466. [Google Scholar] [CrossRef] [Scilit] [PubMed]
  3. Cunha, B.A.; Burillo, A.; Bouza, E. Legionnaires’ disease. Lancet 2016, 387, 376–385. [Google Scholar] [CrossRef] [Scilit] [PubMed]
  4. Burillo, A.; Pedro-Botet, M.L.; Bouza, E. Microbiology and epidemiology of Legionnaire’s Disease. Infect. Dis. Clin. N. Am. 2017, 31, 7–27. [Google Scholar] [CrossRef] [Scilit]
  5. Viñuela-Martínez, J.M.; Redondo-Cadenas, M.A.; Alonso-Calleja, C. Prevalencia de Legionella en instalaciones de suministro de agua en España: Revisión sistemática y meta-análisis. Sanid. Mil. 2022, 78, 245–252. [Google Scholar]
  6. ISCIII. Vigilancia epidemiológica de la legionelosis en España, años 2019 y 2020 Informe de la red nacional de vigilancia epidemiológica. Bol. Epidemiol. Sem. 2021, 9, 49–51. [Google Scholar]
  7. Agencia Estatal Boletín Oficial del Estado. RD-Royal Decree 865/2003, de 4 de julio, por el que se establecen los criterios higiénico-sanitarios para la prevención y control de la legionelosis. BOE 2003, 171, 28055–28069. [Google Scholar]
  8. Exner, M.; Kramer, A.; Lajoie, L.; Gebel, J.; Engelhart, S.; Hartemann, P. Prevention and control of health care-associated waterborne infections in health care facilities. Am. J. Inf. Control 2005, 33, S26–S40. [Google Scholar] [CrossRef] [Scilit]
  9. Gomez-Valero, L.; Rusniok, C.; Rolando, M.; Neou, M.; Dervins-Ravault, D.; Demirtas, J.; Rouy, Z.; Moore, R.J.; Chen, H.; Petty, N.K.; et al. Comparative analyses of Legionella species identifies genetic features of strains causing Legionnaires’ disease. Genome Biol. 2014, 15, 505. [Google Scholar] [CrossRef] [Scilit]
  10. Bédard, E.; Fey, S.; Charron, D.; Lalancette, C.; Cantin, P.; Dolcé, P.; Laferrière, C.; Déziel, E.; Prévost, M. Temperature diagnostic to identify high risk areas and optimize Legionella pneumophila surveillance in hot water distribution systems. Water Res. 2015, 71, 244–256. [Google Scholar] [CrossRef] [Scilit]
  11. Fitzhenry, R.; Weiss, D.; Cimini, D.; Balter, S.; Boyd, C.; Alleyne, L.; Stewart, R.; McIntosh, N.; Econome, A.; Lin, Y.; et al. Legionnaires’ disease outbreaks and cooling towers, New York City, New York, USA. Emerg. Infect. Dis. 2017, 23, 1769–1776. [Google Scholar] [CrossRef] [Scilit] [PubMed]
  12. Yamamoto, H.; Sugiura, M.; Kusunoki, S.; Ezaki, T.; Ikedo, M.; Yabuuchi, E. Factors stimulating propagation of Legionellae in cooling tower water. Appl. Environ. Microbiol. 1992, 58, 1394–1397. [Google Scholar] [CrossRef] [Scilit]
  13. Taylor, M.; Ross, K.; Bentham, R. Legionella, protozoa, and biofilms: Interactions within complex microbial systems. Microb. Ecol. 2009, 58, 538–547. [Google Scholar] [CrossRef] [Scilit]
  14. Abdel-Nour, M.; Duncan, C.; Low, D.E.; Guyard, C. Biofilms: The stronghold of Legionella pneumophila. Int. J. Mol. Sci. 2013, 14, 21660–21675. [Google Scholar] [CrossRef] [Scilit] [PubMed]
  15. Van der Kooij, D.; Bakker, G.L.; Italiaander, R.; Veenendaal, H.R.; Wullings, B.A. Biofilm composition and threshold concentration for growth of Legionella pneumophila on surfaces exposed to flowing warm tap water without disinfectant. Appl. Environ. Microbiol. 2017, 83, e02737-16. [Google Scholar] [CrossRef] [Scilit] [PubMed]
  16. Proctor, C.R.; Dai, D.; Edwards, M.A.; Pruden, A. Interactive effects of temperature, organic carbon, and pipe material on microbiota composition and Legionella pneumophila in hot water plumbing systems. Microbiome 2017, 5, 130. [Google Scholar] [CrossRef] [Scilit]
  17. Abu Khweek, A.; Amer, A.O. Factors mediating environmental biofilm formation by Legionella pneumophila. Front. Cell. Infect. Microbiol. 2018, 8, 38. [Google Scholar] [CrossRef] [Scilit]
  18. Pierre, D.; Baron, J.L.; Ma, X.; Sidari, F.P.; Wagener, M.M.; Stout, J.E. Water quality as a predictor of Legionella positivity of building water systems. Pathogens 2019, 8, 295. [Google Scholar] [CrossRef] [Scilit]
  19. Martin, R.L.; Harrison, K.; Proctor, C.R.; Martin, A.; Williams, K.; Pruden, A.; Edwards, M.A. Chlorine disinfection of Legionella spp., L. pneumophila, and Acanthamoeba under warm water premise plumbing conditions. Microorganisms 2020, 8, 1452. [Google Scholar] [CrossRef] [Scilit]
  20. Cullom, A.C.; Martin, R.L.; Song, Y.; Williams, K.; Williams, A.; Pruden, A.; Edwards, M.A. Critical review: Propensity of premise plumbing pipe materials to enhance or diminish growth of Legionella and other opportunistic pathogens. Pathogens 2020, 9, 957. [Google Scholar] [CrossRef] [Scilit]
  21. Chang, C.W.; Kao, C.H.; Liu, Y.F. Heterogeneity in chlorine susceptibility for Legionella pneumophila released from Acanthamoeba and Hartmannella. J. Appl. Microbiol. 2009, 106, 97–105. [Google Scholar] [CrossRef] [Scilit] [PubMed]
  22. Almonacid Garrido, M.C.; Villanueva Suárez, M.J.; Montes Martín, M.J.; García Alonso, A.; Tenorio Sanz, M.D. Prevalence and distribution of Legionella in municipal drinking water supply systems in Madrid (Spain) and risk factors associated. Sci. Total Environ. 2024, 954, 176655. [Google Scholar] [CrossRef] [Scilit] [PubMed]
  23. Bargellini, A.; Marchesi, I.; Righi, E.; Ferrari, A.; Cencetti, S.; Borella, P.; Rovesti, S. Parameters predictive of Legionella contamination in hot wáter systems: Association with trace elements and heterotrophic plate counts. Water Res. 2011, 45, 2315–2321. [Google Scholar] [CrossRef] [Scilit] [PubMed]
  24. Serrano-Suárez, A.; Dellundé, J.; Salvadó, H.; Cervero-Aragó, S.; Méndez, J.; Canals, O.; Blanco, S.; Arcas, A.; Araujo, R. Microbial and physicochemical parameters associated with Legionella contamination in hot water recirculation systems. Environ. Sci. Pollut. Res. 2013, 20, 5534–5544. [Google Scholar] [CrossRef] [Scilit]
  25. Yunana, D.; Maclaine, S.; Tng, K.H.; Zappia, L.; Bradley, I.; Roser, D.; Leslie, G.; MacIntyre, C.R.; Le-Clech, P. Developing Bayesian networks in managing the risk of Legionella colonisation of groundwater aeration systems. Water Res. 2021, 193, 116854. [Google Scholar] [CrossRef] [Scilit]
  26. Campaña, M.; del Hoyo, R.; Monleon-Getino, A.; Checa, J. Predicting Legionella contamination in cooling towers and evaporative condensers from microbiological and physicochemical parameters. Int. J. Hyg. Environ. Health 2023, 248, 114117. [Google Scholar] [CrossRef] [Scilit]
  27. ISO 11731:2017; Calidad del agua Recuento de Legionella. International Organization for Standardization: Geneva, Switzerland, 2017.
  28. ISO 12869:2017; Water Quality: Detection and Quantification of Legionella spp. and/or Legionella pneumophila by Concentration and Genic Amplification by Quantitative Polymerase Chain Reaction (qPCR). International Organization for Standardization: Geneva, Switzerland, 2017.
  29. ISO 9308-1:2014; Water Quality—Enumeration of Escherichia coli and Coliform Bacteria. Part 1: Membrane Filtration Method for Waters with Low Bacterial Background Flora. International Organization for Standardization: Geneva, Switzerland, 2014.
  30. ISO 9308-2:2012; Water Quality—Enumeration of Escherichia coli and Coliform Bacteria. Part 2: Most Probable Number Method. International Organization for Standardization: Geneva, Switzerland, 2012.
  31. ISO 16140-3:2021; Microbiology of the Food Chain—Method Validation. Part 3: Protocol for the Verification of Reference Methods and Validated Alternative Methods in a Single Laboratory. International Organization for Standardization: Geneva, Switzerland, 2021.
  32. Agencia Estatal Boletín Oficial del Estado. RD-Royal Decree 487/2022, de 21 de junio, por el que se establecen los requisitos sanitarios para la prevención y el control de la legionelosis. BOE 2022, 148. Available online: https://www.boe.es/buscar/act.php?id=BOE-A-2022-10297 (accessed on 25 May 2023).
  33. INSHT (Instituto Nacional de Seguridad e Higiene en el Trabajo). NTP 692. Legionelosis: Revisión de las Normas Reglamentarias (II). Medidas Específicas. 2006. Available online: https://www.insst.es/documents/94886/326775/ntp_692.pdf/59cc28d1-fc14-4430-8835-6bc6f50254ff (accessed on 20 May 2023).
  34. Abad Sanz, I. Manual para la Prevención de la Legionelosis en Instalaciones de Riesgo; Documentos de Sanidad Ambiental; Instituto de Salud Pública: Madrid, Spain, 2006; Available online: https://microservices.es/storage/237/madrid-manual-prevencion-legionelosis-instalaciones-de-riesgo.pdf (accessed on 2 October 2019).
  35. MS-Ministerio de Sanidad. Calidad del agua de Consumo Humano en España. Resumen Información y Estadísticas Sanitarias 2021; Informe Técnico; MS-Ministerio de Sanidad: Madrid, Spain, 2021. Available online: https://www.sanidad.gob.es/areas/sanidadAmbiental/calidadAguas/aguasConsumoHumano/publicaciones/informesAnteriores/docs/2021_INFORME_ANUAL_AGUAS_DE_CONSUMO.pdf (accessed on 14 April 2022).
  36. WHO. Guías para la Calidad del agua de Consumo Humano de OMS, 4th ed.; WHO: Geneva, Switzerland, 2017; Available online: https://www.who.int/es/publications/i/item/9789241549950 (accessed on 25 May 2019).
  37. Agencia Estatal Boletín Oficial del Estado. RD-Royal Decree 3/2023, de 10 de enero, por el que se establecen los criterios técnico-sanitarios de la calidad del agua de consumo, su control y suministro. BOE 2023, 9, 4253–4354. [Google Scholar]
  38. Rakić, A.; Vukić Lušić, D.; Jurčev Savičević, A. Influence of metal concentration and plumbing materials on Legionella contamination. Microorganisms 2022, 10, 1051. [Google Scholar] [CrossRef] [Scilit]
  39. Borella, P.; Montagna, M.T.; Romano-Spica, V.; Stampi, S.; Stancanelli, G.; Triassi, M.; Neglia, R.; Marchesi, I.; Fantuzzi, G.; Tato, D.; et al. Legionella infection risk from domestic hot water. Emerg. Infect. Dis. 2004, 10, 457–464. [Google Scholar] [CrossRef] [Scilit]
  40. Sarin, P.; Snoeyink, V.L.; Bebee, J.; Jim, K.K.; Beckett, M.A.; Kriven, W.M.; Clement, J.A. Iron release from corroded iron pipes in drinking water distribution systems: Effect of dissolved oxygen. Water Res. 2004, 38, 1259–1269. [Google Scholar] [CrossRef] [Scilit]
  41. Edagawa, A.; Kimura, A.; Doi, H.; Tanaka, H.; Tomioka, K.; Sakabe, K.; Nakajima, C.; Suzuki, Y. Detection of culturable and nonculturable Legionella species from hot water systems of public buildings in Japan. J. Appl. Microbiol. 2008, 105, 2104–2114. [Google Scholar] [CrossRef] [Scilit]
  42. Kilb, B.; Lange, B.; Schaule, G.; Flemming, H.C.; Wingender, J. Contamination of drinking water by coliforms from biofilms grown on rubber-coated valves. Int. J. Hyg. Environ. Health 2003, 206, 563–573. [Google Scholar] [CrossRef] [Scilit]
Figure 1. Outline of the study conducted on Legionella control in the Community of Madrid from 2007 to 2020.
Applsci 16 01628 g001
Figure 2. Distribution of Legionella samples detected according to the year of sampling.
Applsci 16 01628 g002
Figure 3. Distribution of electrical conductivity ranges in relation to the percentages of positive and negative Legionella samples.
Applsci 16 01628 g003
Figure 4. Distribution of colour ranges in relation to the percentages of positive and negative samples of Legionella.
Applsci 16 01628 g004
Figure 5. Distribution of turbidity ranges in relation to the percentages of positive and negative samples of Legionella (reference values: turbidity: 1 NFU; alarm 5 NFU; and non-compliance: 6 NFU).
Applsci 16 01628 g005
Figure 6. Distribution of iron concentration ranges in relation to the percentages of positive and negative samples of Legionella.
Applsci 16 01628 g006
Figure 7. Distribution of nitrite concentration ranges in relation to the percentages of positive and negative Legionella simples.
Applsci 16 01628 g007
Figure 8. Distribution of coliforms (cfu/mL) in relation to the percentages of positive and negative Legionella samples.
Applsci 16 01628 g008
Figure 9. Percentage of non-compliance for the different influencing parameters and relationship with positive and negative Legionella simples.
Applsci 16 01628 g009
Table 1. Number of instances of non-compliance with physical–chemical and microbiological parameters based on property type or station output.
ColourTurbidityFeNitritesColiforms
Hostels00000
Bar00000
Schools11603
Fountains00000
Hotels048158
Hospitals30000
Public bodies115864
Sport Centres1532636039
Table 2. Correlation values (p < 0.05) obtained from data of physicochemical and microbiological parameters and Legionella-positive samples.
LegionellapHECTurbidityColourFeNitritesColiforms
Legionella1
pH−0.089141
EC0.359300.400921
Turbidity0.569540.007290.212421
Colour0.32410−0.25294−0.061910.343831
Fe0.35232−0.205930.046740.305310.523111
Nitrites0.732160.059780.196210.369220.232920.277891
Coliforms0.437410.017100.084100.336670.190380.264050.550811
Table 3. Structural, maintenance and operational risk factors and indices, as well as the overall index obtained in the study.
SC1SC2SC3SC4SC5SC6SC7SC8SC9SC10SC11SC12
Structural risk factors and index
Accumulation168168816888888
Tank accessibility1051010010510100105
Drain valve on tanks6012606066666
Pipe and accumulator materials848844488484
Aerosolisation type8881616888168168
Aerosol emission points1055101655510555
Hydraulic circuit drain valves1005666666666
Water-stagnant areas16616168881616888
Structural index (SI)843680805863446780456750
Maintenance risk factors and index
Accumulator temperature221122221111111111111111
Terminal and return element temperature221122221111111111222211
Microbiological contamination241212121224121212241212
Hygienic condition of the installation168888816881688
Mechanical condition of the installation168168816588888
Maintenance index (MI)1005080725070585050816150
Operational risk factors and index
Setpoint temperature in the system603060606030306030606030
Facility use frequency202020202020202020202020
Operation index (IO)805080808050508050808050
Overall risk index934680755566535859706550
SC: sports centre. SC1 and SC3 Villaverde, SC2 La Latina, SC4 Villa de Vallecas, SC5 Arganzuela, SC6 Salamanca district, SC7 Chamberí, SC8 Carabanchel, SC9, Puente de Vallecas and SC10, SC11, SC12 Moncloa.
Disclaimer/Publisher’s Note: The statements, opinions and data contained in all publications are solely those of the individual author(s) and contributor(s) and not of MDPI and/or the editor(s). MDPI and/or the editor(s) disclaim responsibility for any injury to people or property resulting from any ideas, methods, instructions or products referred to in the content.