Article

Topological Evolution and Prediction Method of Permeability in Fracture Networks

1
Power China Zhongnan Engineering Co., Ltd., Hunan Provincial Key Laboratory of Key Technology on Hydropower Development, Changsha 410014, China
2
School of Information and Electrical Engineering, Hunan University of Science and Technology, Xiangtan 411201, China
3
School of Computer and Communication Engineering, Changsha University of Science and Technology, Changsha 410114, China
*
Author to whom correspondence should be addressed.
Appl. Sci. 2026, 16(2), 907; https://doi.org/10.3390/app16020907
Submission received: 21 December 2025 / Revised: 13 January 2026 / Accepted: 14 January 2026 / Published: 15 January 2026
(This article belongs to the Special Issue Applications of Big Data and Artificial Intelligence in Geoscience)

Abstract

Aiming to predict the evolution of fracture structures under stress conditions and the Permeability process of the fracture network, a damage evolution model reflecting the coupling mechanism between topological characteristics and mechanical responses of fracture networks is established based on yield criteria and complex network theory, realizing a prediction for permeability processes. Firstly, key parameters such as degree centrality, betweenness centrality, and clustering coefficient of fracture nodes are extracted through complex network topological analysis. Combined with the finite element method to calculate the node shear stress transfer coefficient, a topology–mechanics coupling model of the fracture network is constructed. Secondly, the Coulomb–Mohr yield criterion is improved to establish a damage evolution equation considering normal stress and shear stiffness degradation. Based on the above theory, a fracture network permeability iterative algorithm was developed to simultaneously update the network topology and the stress distribution of the fracture network. The evolution process of the network was analyzed based on the adjacency matrix and the changes in the number of connected clusters. The results show that the average degree of the largest cluster directly reflects the connectivity of the fracture network; a higher average degree corresponds to greater damage to the fracture network under stress. The average clustering coefficient indicates the extent of local connectivity; a higher clustering coefficient signifies denser local connections, which enhances the fracture network connectivity. Compared with traditional static methods, the dynamic damage evolution model has a permeability prediction error within 7%, indicating the effectiveness of this method.

1. Introduction

With the rapid economic development and expansion of construction-scale, underground projects in energy, water conservancy, marine, mining, and other fields are continuously extending to deep layers [1,2]. The high-stress and high-pore (fracture) water pressure environment of deep rock masses makes the complex internal fracture networks the main permeability channels for groundwater [3,4]. A large number of engineering practices have shown that the occurrence of water inrush and various water hazards does not depend on the permeability of intact rock blocks, but it is dominated by the connectivity pattern, opening distribution and dynamic evolution of internal fracture networks. Driven by deep high osmotic pressure, even if the rock mass is in a closed-compacted state macroscopically, complex fracture networks can achieve rapid permeability concentration through preferential paths, thereby inducing water inrush disasters or long-term leakage [5,6,7]. Therefore, focusing on the geometric characteristics and permeability behavior of complex fracture networks, and clarifying their evolution laws during different stress adjustment processes, is the key to revealing the mechanism of deep engineering water hazards, predicting water inrush risks, and formulating prevention and control countermeasures.
At present, fracture permeability theories are all based on analyzing the mechanical properties of fracture propagation mechanisms [3,8,9,10,11,12,13,14]. However, the fracture permeability process is not only a process of mesoscopic fracture expansion and connection but also affected by the interaction between multi-scale network structures such as permeability cluster aggregation formed by permeability occupation of fracture networks. The transfer of fluid mass, kinetic energy, and energy between fracture channels during permeability is a complex dynamic process, which directly affects the changes in the functional attributes of the network structure, and is a key influencing factor for the permeability phase transition, mutation, and obvious or inconspicuous qualitative changes in the entire fracture network. Therefore, to realize the prediction of water hazards in permeability areas, it is extremely important to reveal the dynamic evolution laws of the network structure of the complex dynamic system of fracture permeability.
Complex network theory, as an emerging theory of systems science, has received extensive attention and in-depth research in both the academic and industrial fields in recent years [15,16]. Particularly, complex network theory has provided a new paradigm for the topology–permeability coupling analysis of mining-induced fracture systems. Yu et al. [17] quickly generated complex fracture networks of arbitrary shapes (such as single-fracture, double-fracture, multi-fracture systems) by the PDSM method, regarded fractures as a connected set of network nodes, and accurately characterized topological relationships such as intersection and connection between fractures. Xue et al. [18] developed a three-dimensional discrete fracture network (DFN) model and optimized its topological structure, with a focus on investigating how fracture aperture heterogeneity influences network connectivity, permeability pathways, and overall permeability, constituting essentially a study on topological optimization and its correlation with permeability. Studies by Zhu et al. [19] and Li M et al. [20] have established the advantages of graph theory and complex network theory, confirming that topological parameters based on complex networks (such as node degree, betweenness centrality) can effectively predict equivalent permeability, identify key permeability channels, evaluate network connectivity, and reveal the correlation between network structure and percolation threshold; Xu et al. [21] established an evaluation framework through complex network theory to rank the roles of fractures in the permeability system, providing support for identifying key permeability channels and understanding the contribution of fractures to permeability. Artime et al. [22] proposed a network disassembly framework integrating topological attributes and non-topological node metadata, emphasizing the evolution characteristics under critical permeability conditions, and deepening the understanding of system robustness; Cañamón et al. [23] developed an efficient 3D discrete fracture network topological analysis tool and proposed a formula for estimating the critical percolation density based on complex network connectivity characteristics, significantly improving the computational efficiency of complex fracture network permeability analysis. Xia et al. [24] established a permeability model combining fractal theory and complex network characteristics, unifying the geometric morphology (such as tortuosity, length distribution) and topological structure (such as connectivity) of the fracture system under a fractal framework, thereby more realistically describing and predicting fluid permeability behavior and its percolation evolution process in fracture networks. Xue et al. [11] systematically applied complex network theory to fracture permeability research, demonstrating how to abstract physical fracture systems into graphs (complex networks), extract key topological indicators, directly establish quantitative connections between topological characteristics (such as connected components, largest cluster) and macroscopic permeability properties (permeability), and proving that topological characteristics are effective indicators for predicting rock mass permeability instability and percolation transition. However, at the evolution mechanism level, the cascading evolution law of “pore–fracture–stress–permeability” in high-dimensional parameter space has not been revealed. In particular, the coupling mechanism between describing the dynamic percolation process and damage propagation under the complex network framework remains to be improved. The deep integration of complex system theory and percolation theory in the research of rock damage and permeability instability is still in the exploration stage.
This study proposes a method for identifying fracture network permeability. The method is based on damage dynamics and complex network theory, combines the coupling mechanism between topological characteristics and mechanical responses of fracture networks, uses indicators such as node degree distribution, clustering coefficient, and betweenness centrality of complex networks to describe the connectivity of fracture networks, and identifies the evolution laws of internal permeability channels of rocks through network percolation analysis, based on node damage values combined with percolation theory, realizing the identification of internal damage regions of rocks and early warning of permeability instability, and providing a theoretical basis for quantifying fracture network permeability risks and improving the ability to predict rock mass instability.

2. Complex Network Topology of Fractures

Fractures within natural rock masses are distributed as interconnected networks, which cannot be directly analyzed by topological calculation. These network-distributed fractures need to be converted into topological networks with practical significance. Previous studies have conducted certain explorations in this field. They generally abstract the intersection or endpoint of fractures as nodes, and the fracture segments between adjacent nodes as edges. Thus, the fracture network is defined as a weighted undirected graph. Suppose the network contains N nodes. The set of nodes is denoted as V = ν i | i = 1 , 2 , , N , and its adjacency matrix is defined as A = [ A i j ] N × N , where [ A i j ] represents the element in the i-th row and j-th column of A:
A i j = 1 , If   node   i   is   directly   connected   to   node   j ,     then   there   exists   a   fracture   segment . 0 , There   are   no   directly   connected   fracture   segments .
The degree centrality of a node is defined as the number of edges directly connected to it, which intuitively reflects the node’s local influence within the network. Degree centrality is used to evaluate the current ability of the node to participate in stress transfer. The calculation formula for the degree centrality of node i is as follows:
k i e f f = A i j ( 1 D i ) ( 1 D j )
where D i is the damage value of node i. When the damage value of the node is 1, the degree centrality is 0, a damage value of 1 indicates complete failure, that is, it is a topological isolated point.

2.1. Stress Transfer Coefficient

The stiffness of the fracture network determines the stress transfer mode, which is influenced by both geometric morphology and material properties. To quantify the shear stress transfer capacity between connected nodes, a transfer coefficient is introduced that incorporates fracture segment length, orientation, and elastic modulus. The calculation formula for the fracture shear stress transfer coefficient is as follows:
k i j = E O i j L i j cos 2 θ i j + v sin 2 θ i j 1 v 2
where k i j is the fracture shear stress transfer coefficient between node i and node j, E is the rock elastic modulus, O i j is the cross-sectional area of the fracture segment, L i j is the length of the fracture segment between node i and node j, θ i j is the angle between the fracture segment between node i and node j and the principal stress direction, and ν is Poisson’s ratio.

2.2. Complex Network Connectivity and Fracture Connectivity Rate

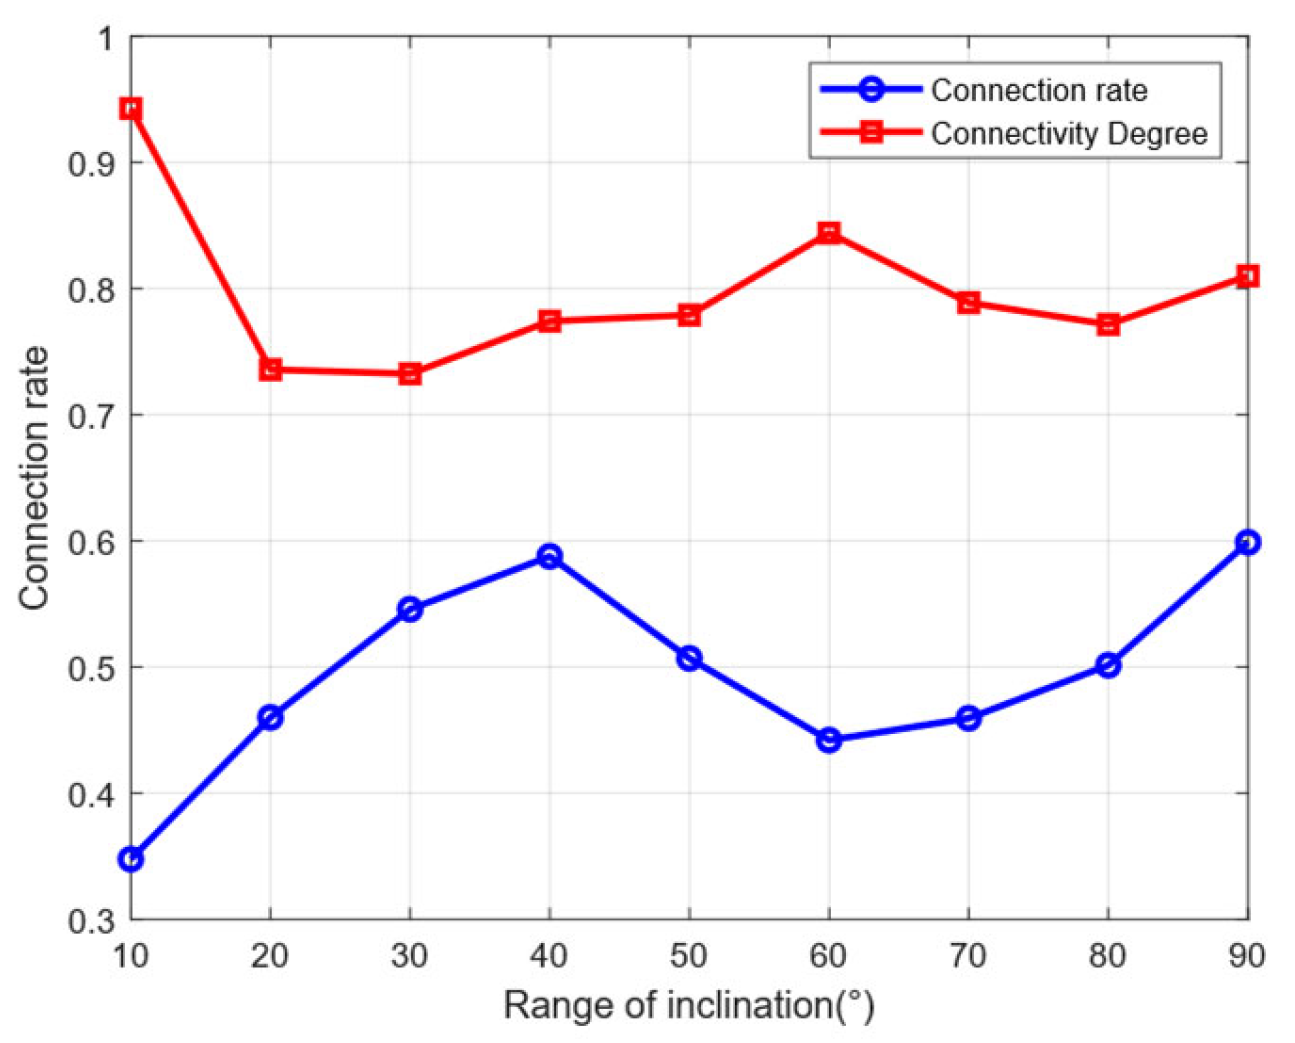
The connectivity rate is a parameter directly evaluating the permeability magnitude and a main influencing factor of permeability channels. Higher connectivity rates generally correlate with more significant permeability enhancement. As illustrated in Figure 1, the relationship between fracture connectivity rate and the corresponding complex network connectivity metric is compared. The blue line represents the variation in connection rate and fracture dip angle, as described in [25], while the red curve represents the result of connectivity degree and fracture dip angle. This figure shows the variation law of fracture network connectivity under different fracture inclination angles. As the fracture spacing increases, the connectivity also increases, which is inversely proportional to the fracture spacing. This is because when the fracture spacing increases, the fracture density in the entire fracture network decreases, the proportion of fractures in each sub-grid decreases, leading to an increase in connectivity.
As shown in Figure 1, the complex network-based connectivity metric demonstrates good agreement with the conventional connectivity rate, with prediction errors ranging between 6% and 8%. the relationship curve between fracture inclination angle and connectivity rate exhibits a discernible fluctuating trend, indicating that the fracture inclination angle has a significant impact on the connectivity and permeability characteristics of the fracture network.

3. Dynamic Equations of the Coupled Damage and Stress Nodes

3.1. Shear Stress Equation

Considering the influence of the fracture network topology structure on the stress diffusion of nodes, the dynamic equation of shear stress is:
d τ i j d t = j = 1 N A i j k i j ( 1 D i ) ( 1 D i ) ( τ j τ i )
The summation term is effective for neighboring nodes j N i . (Because A i j = 1 ) ( 1 D i ) ( 1 D j ) indicates the inhibition of damage on conduction capacity. F i ( t ) is the external loading stress, τ j τ i is the shear strain rate of neighboring nodes, τ i j is the shear stress of the node, t is the time step, and τ j is the shear stress of node j.

3.2. Damage Evolution Equation

Relevant experiments have proved that increasing the pore fluid pressure of rocks and faults will reduce their strength and lead to brittle failure [26,27]. This is due to the decrease in effective stress caused by the increase in pore fluid pressure. Positive effective normal stress presses the opposite blocks together and resists the sliding movement along the fault surface, which may be caused by the shear stress parallel to the fault. Therefore, higher pore fluid pressure reduces sliding resistance. The Coulomb–Mohr criterion uses a Mohr circle to illustrate the effect of increased fluid pressure on fault stability. The shear stress calculated by the Mohr circle is:
τ i = c i + tan ϕ i ( σ i P i )
where τ i is the shear stress causing sliding, P i is the pore fluid pressure, σ i is the normal stress, c i is the cohesion, tan ϕ i is the internal friction angle. On an inviscid fault, this strength may be related to the unevenness between relatively rough fault surfaces.

3.3. Damage Evolution Law

The fracture network is abstracted as a complex network, where nodes are fracture intersections or key stress points, and edges are fracture segments or stress transfer paths. The Coulomb–Mohr criterion is applied as the failure condition of nodes or edges [28]. When the stress on a node or edge meets the Coulomb–Mohr criterion, damage and leakage are determined, leading to edge breakage and node failure in the network structure, thereby affecting the entire network. The dynamic evolution equation is derived by combining complex network theory and the Coulomb–Mohr criterion. A damage evolution equation based on the Coulomb–Mohr criterion is derived, considering the influence of node importance:
d D i d t = α τ i [ c i + ( σ i P i ) tan ϕ i ] c i
where α is the damage rate constant related to material brittleness, and D i is the damage variable.

4. Evolutionary Model Calculation Process

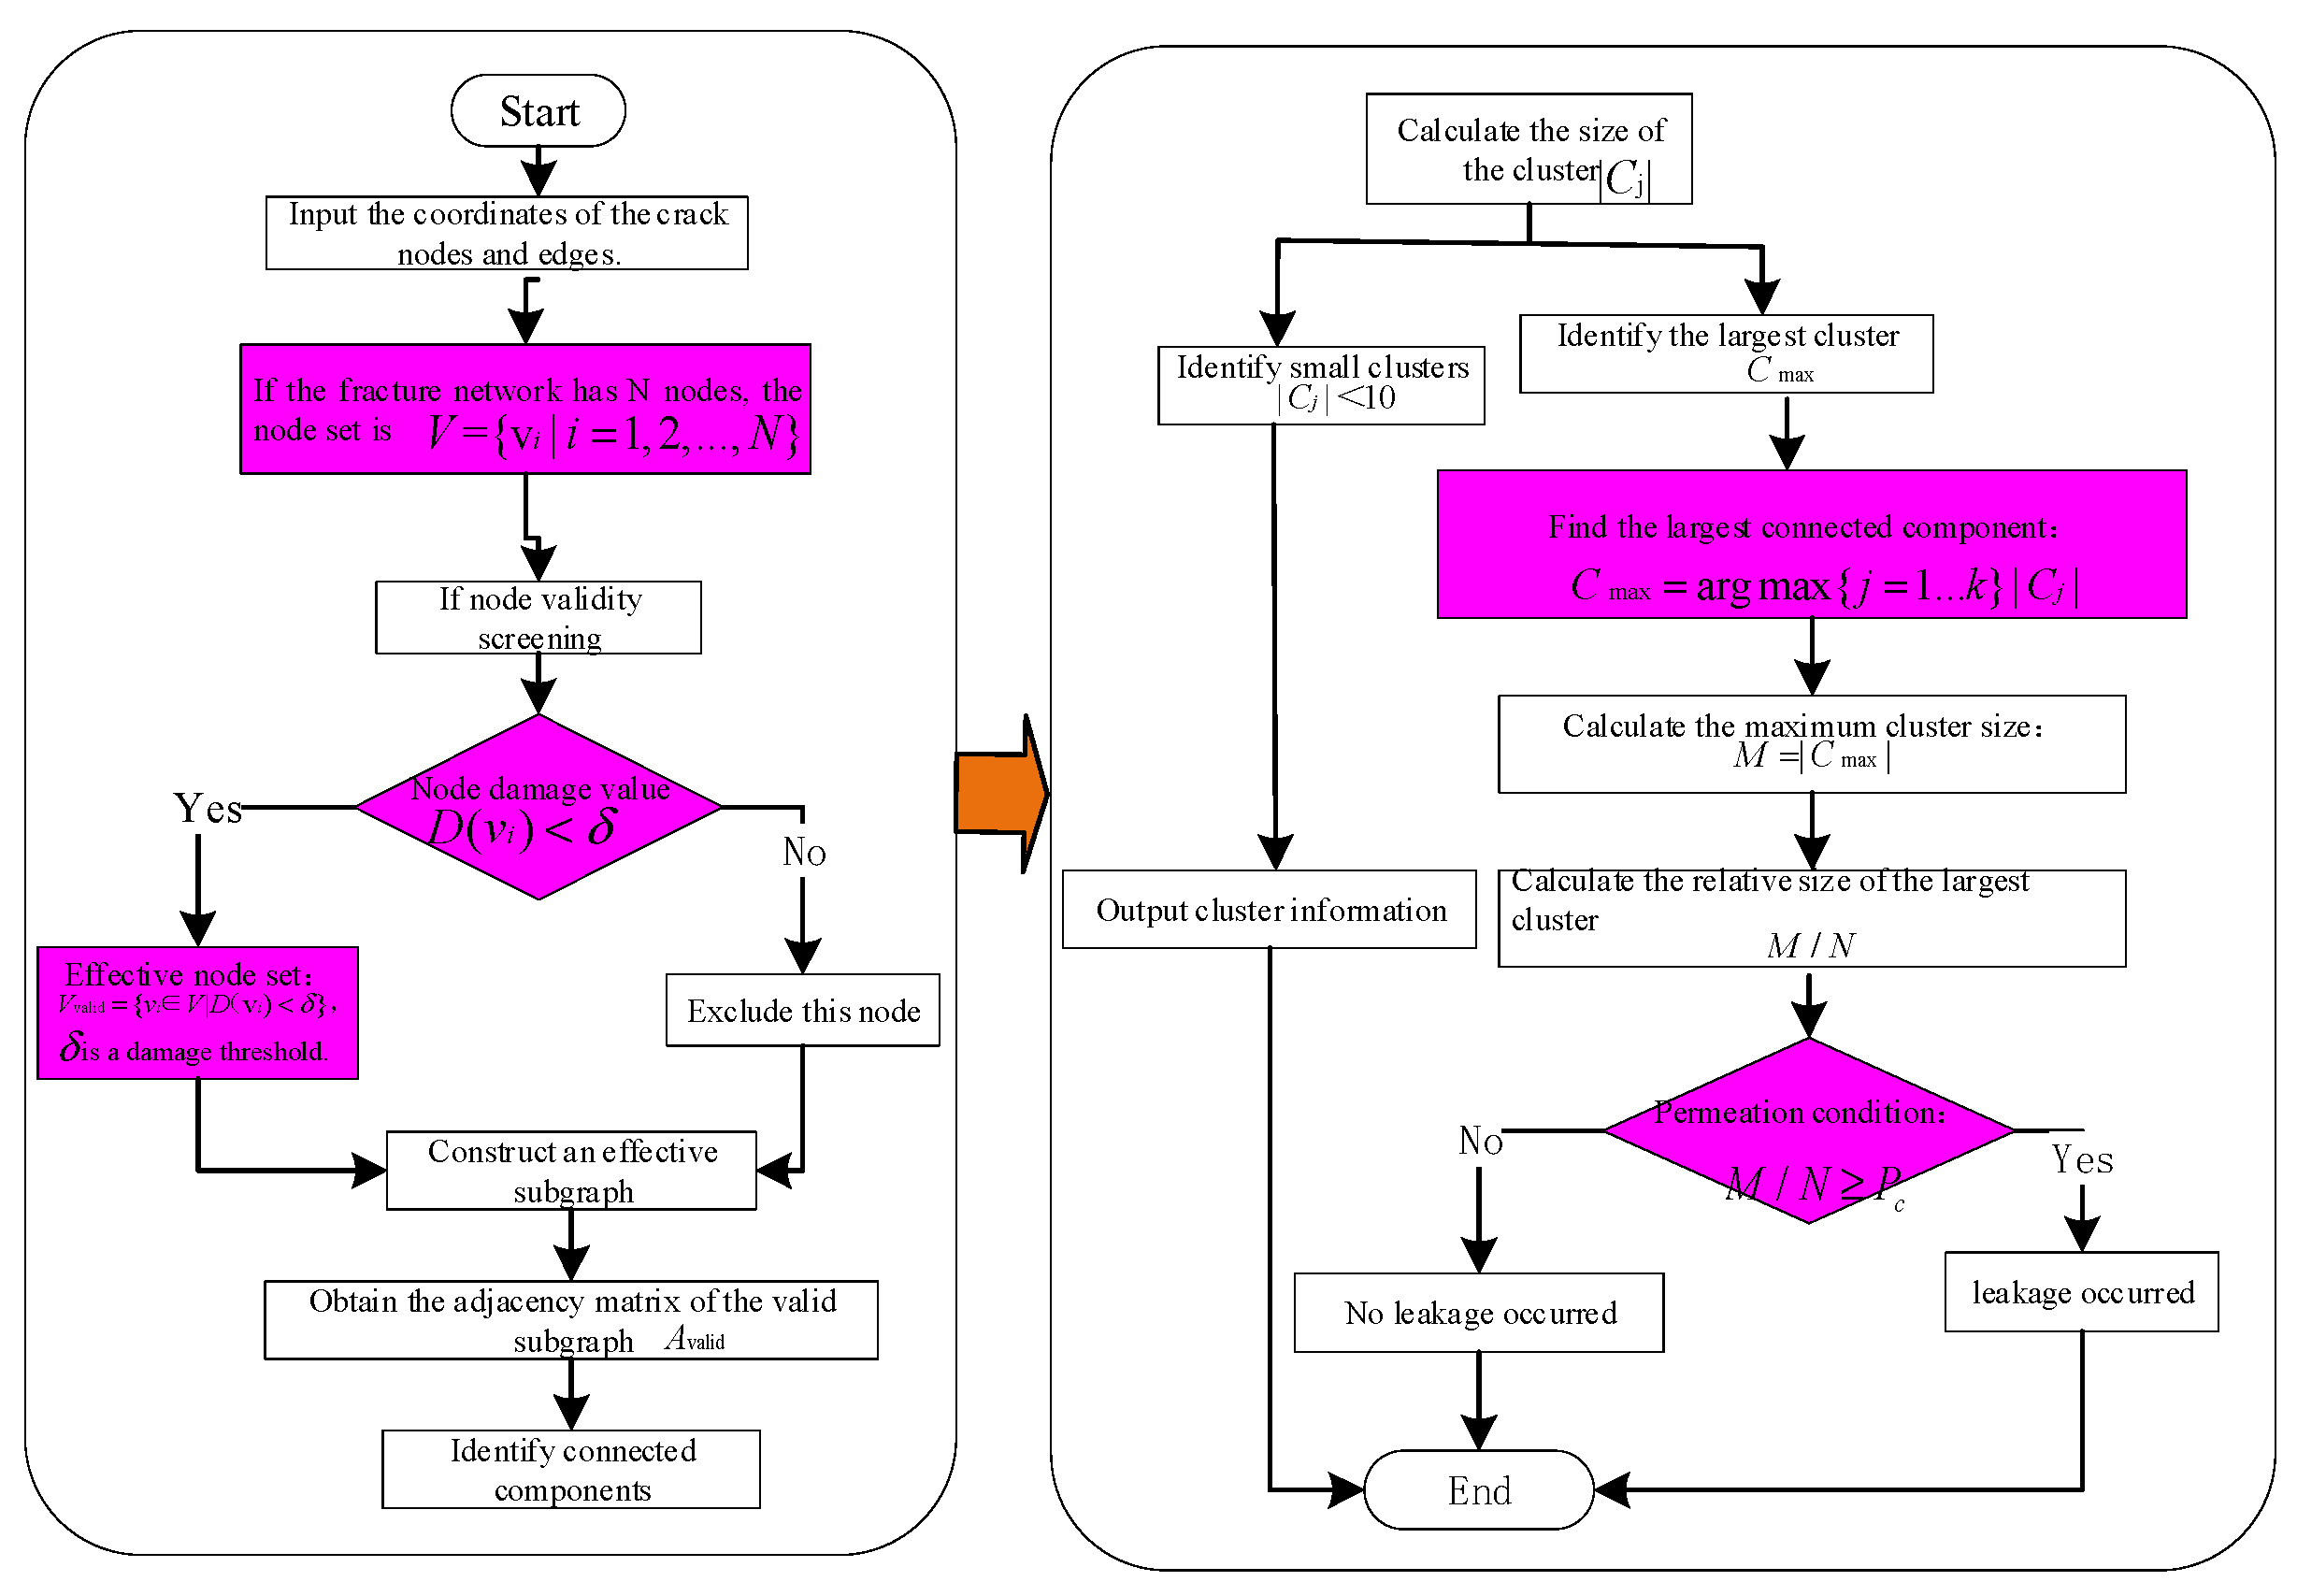
The process of damage evolution and permeability prediction in complex fracture networks, as illustrated in Figure 2, begins by applying graph theory to natural rock fracture systems. This involves two key abstractions: fracture intersections are represented as nodes, and the segments between adjacent nodes are defined as edges, which together form the original fracture network graph. Assume the network has a total of N nodes, and the node set is denoted as V = { v i | i = 1 , 2 , , N } ; its adjacency matrix is defined as A = [ A i j ] N × N . In practical analysis, it is necessary to screen the effectiveness of nodes. Each node has a damage value D i [ 0 , 1 ] . When the damage value of the node is 1, the degree centrality is 0, that is, it is a topological isolated point, and the node fails at this time; the node damage threshold δ is set to 1. If D ( v i ) < δ , the node is judged as an effective node and retained in the effective node set V valid = { ( v i ( V | D ) v i ) < δ } , otherwise it is an invalid node. Then, an effective subgraph can be constructed based on V valid , and its adjacency matrix A v a l i d is the submatrix of the original adjacency matrix A on the effective node set. According to the above process, the topological simplification and effectiveness extraction of the original fracture network can be completed. After obtaining the effective subgraph, the process enters the stage of connectivity quantitative analysis. Firstly, identify and decompose the connected components of the network. Identify the connected components in the effective subgraph and decompose the graph represented by A v a l i d into K connected components C max = arg max { j = 1 k } | C j | , determining the isolated clusters composed of interconnected fractures in the rock mass. Then, count the number of nodes C j contained in each connected component, find the connected component with the largest number of nodes, that is, the largest cluster C max , output the information of connected components with less than 10 nodes, and calculate the size of the largest cluster M = C max and its relative size (the ratio of the size of the largest cluster to the total number of nodes)M/N, to characterize the overall connectivity of the network. The change in this parameter corresponds to the key evolution process of fracture expansion and connection in rocks under stress. Finally, by comparing the relative size of the largest cluster with the preset percolation threshold P c [29], judge whether percolation occurs in the network: if the relative size of the largest connected component reaches or exceeds the threshold M / N P c , it indicates that percolation has occurred in the fracture network, and a through permeability channel has been formed inside the rock; otherwise, it indicates that percolation has not occurred in the fracture network and it is still in an incompletely connected state.

Evolutionary Process

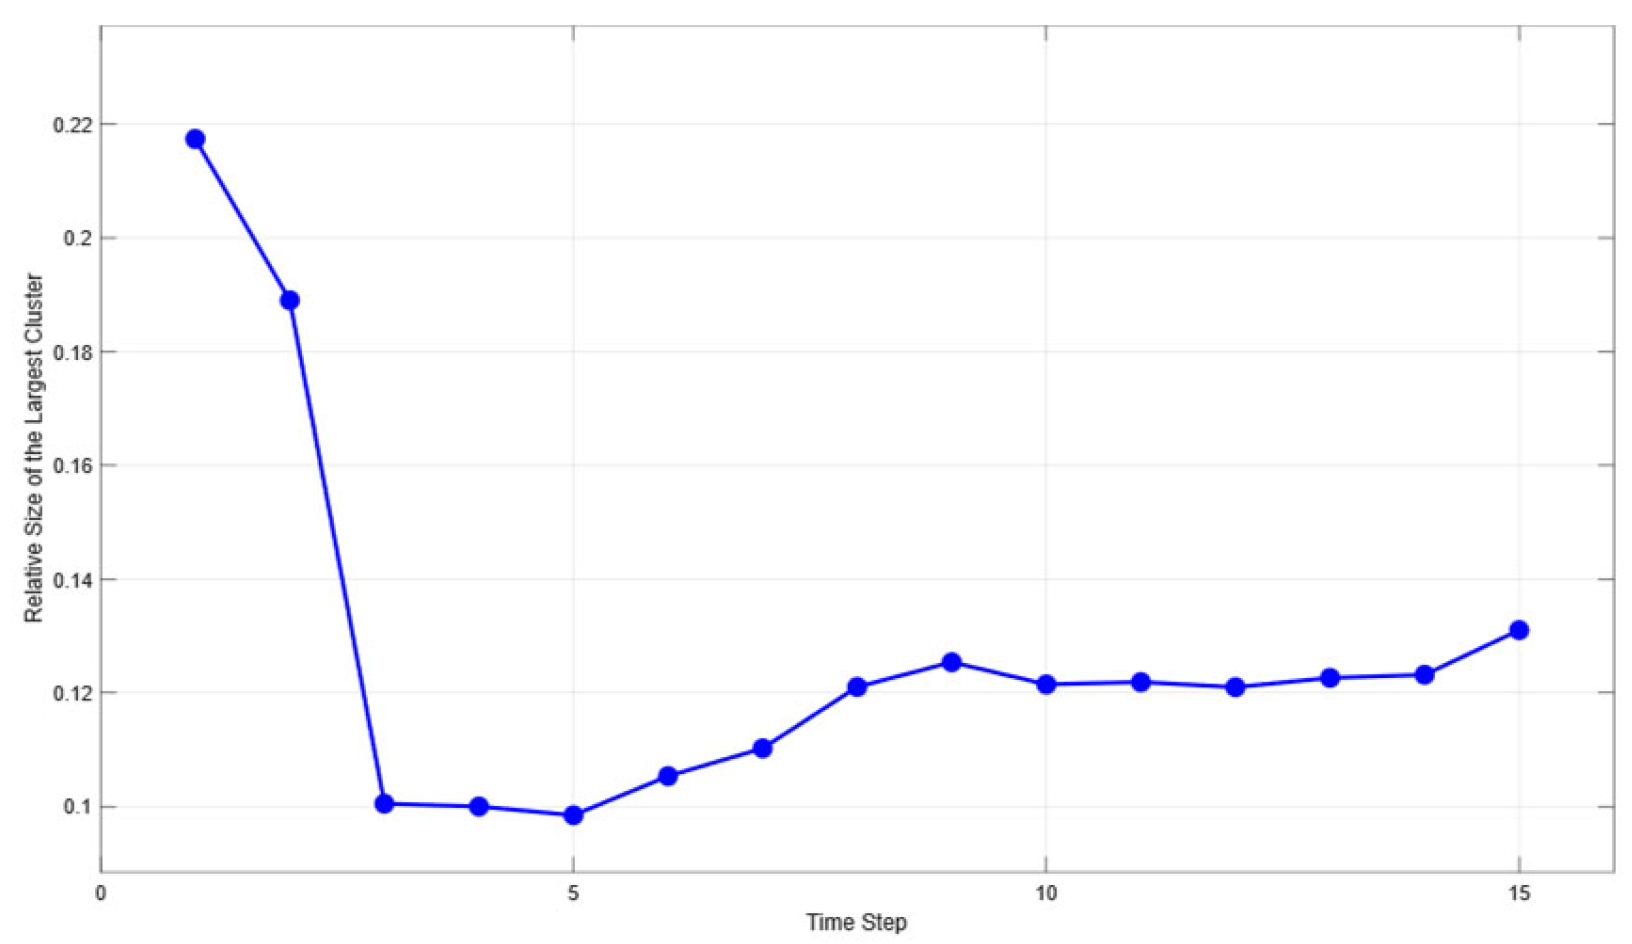
The relative size of the largest cluster is denoted as M/N, and it serves as a key indicator for identifying the percolation state of a fracture network. Figure 3 shows the evolution law of the relative size of the largest cluster with time steps, showing obvious phased characteristics. In the initial stage (time steps 1–5), due to the complex network damage process, the relative size of the largest cluster M/N decreases from 0.217 to 0.098, indicating that the fracture network may be dominated by newly generated isolated small clusters in this stage. Although the size of the largest cluster expands, its growth rate is much lower than the growth rate of the total number of nodes in the network. In the middle stage of evolution (time steps 5–10), the relative size of the largest cluster gradually recovers from 0.098 to 0.122. As normal stress and shear stress continue to act, the stress on nodes and edges gradually increases. According to the calculation of stress range and damage value, the stress of nodes and edges continues to increase, and energy is absorbed. The threshold enters the range of the largest cluster threshold. Under experimental conditions, it can be understood that the largest cluster may expand in scale by absorbing energy from surrounding small clusters. At this stage, although the total number of nodes is still increasing, the growth of the largest cluster becomes more pronounced during this stage. In the late stage of evolution (time steps 10–15), M/N shows a fluctuating upward trend, increasing from 0.126 to 0.131, and reaching a peak at time step 15. This change reflects that the evolution of the fracture network has entered the critical percolation region, and the size of the largest cluster continues to expand. At time steps 14 and 15, M/N jumps from 0.123 to 0.131, indicating that the fracture network has formed a giant cluster spanning the system, and the system has undergone percolation.
Table 1 shows the topological parameters of rock fracture network evolution at different time steps. While the progress of time steps, the number of connected clusters gradually increases. the network density of the largest cluster tends to decrease due to node failures. Nevertheless, both the number of nodes and edges within the largest cluster continue to grow, albeit at a diminishing rate.
In complex network theory, the degree value of a node is an important indicator to measure fracture connectivity. The higher the node degree value, the closer the connection between the node and other nodes, thereby affecting the transmission speed and efficiency of permeability. An uneven degree value distribution may lead to some highly connected nodes in the network. These nodes are prone to damage and destruction, which in turn affects the connectivity and permeability damage characteristics of the entire fracture network. Therefore, by analyzing the node degree value, we can better understand the expansion, connectivity, and damage characteristics of the fracture network.
The clustering coefficient reflects the density of connections between other nodes around a node in the fracture network. The higher the clustering coefficient, the more regions where fractures expand and intersect, and the greater the aggregation of nodes. The fracture connectivity in these regions is relatively good, and correspondingly, these regions are more likely to become the focus of local damage or destruction. By analyzing the relationship between the clustering coefficient and the degree value, a degree-clustering coefficient identification network can be constructed to better understand the structure and characteristics of the fracture network. the specific parameters of the model as Table 2.
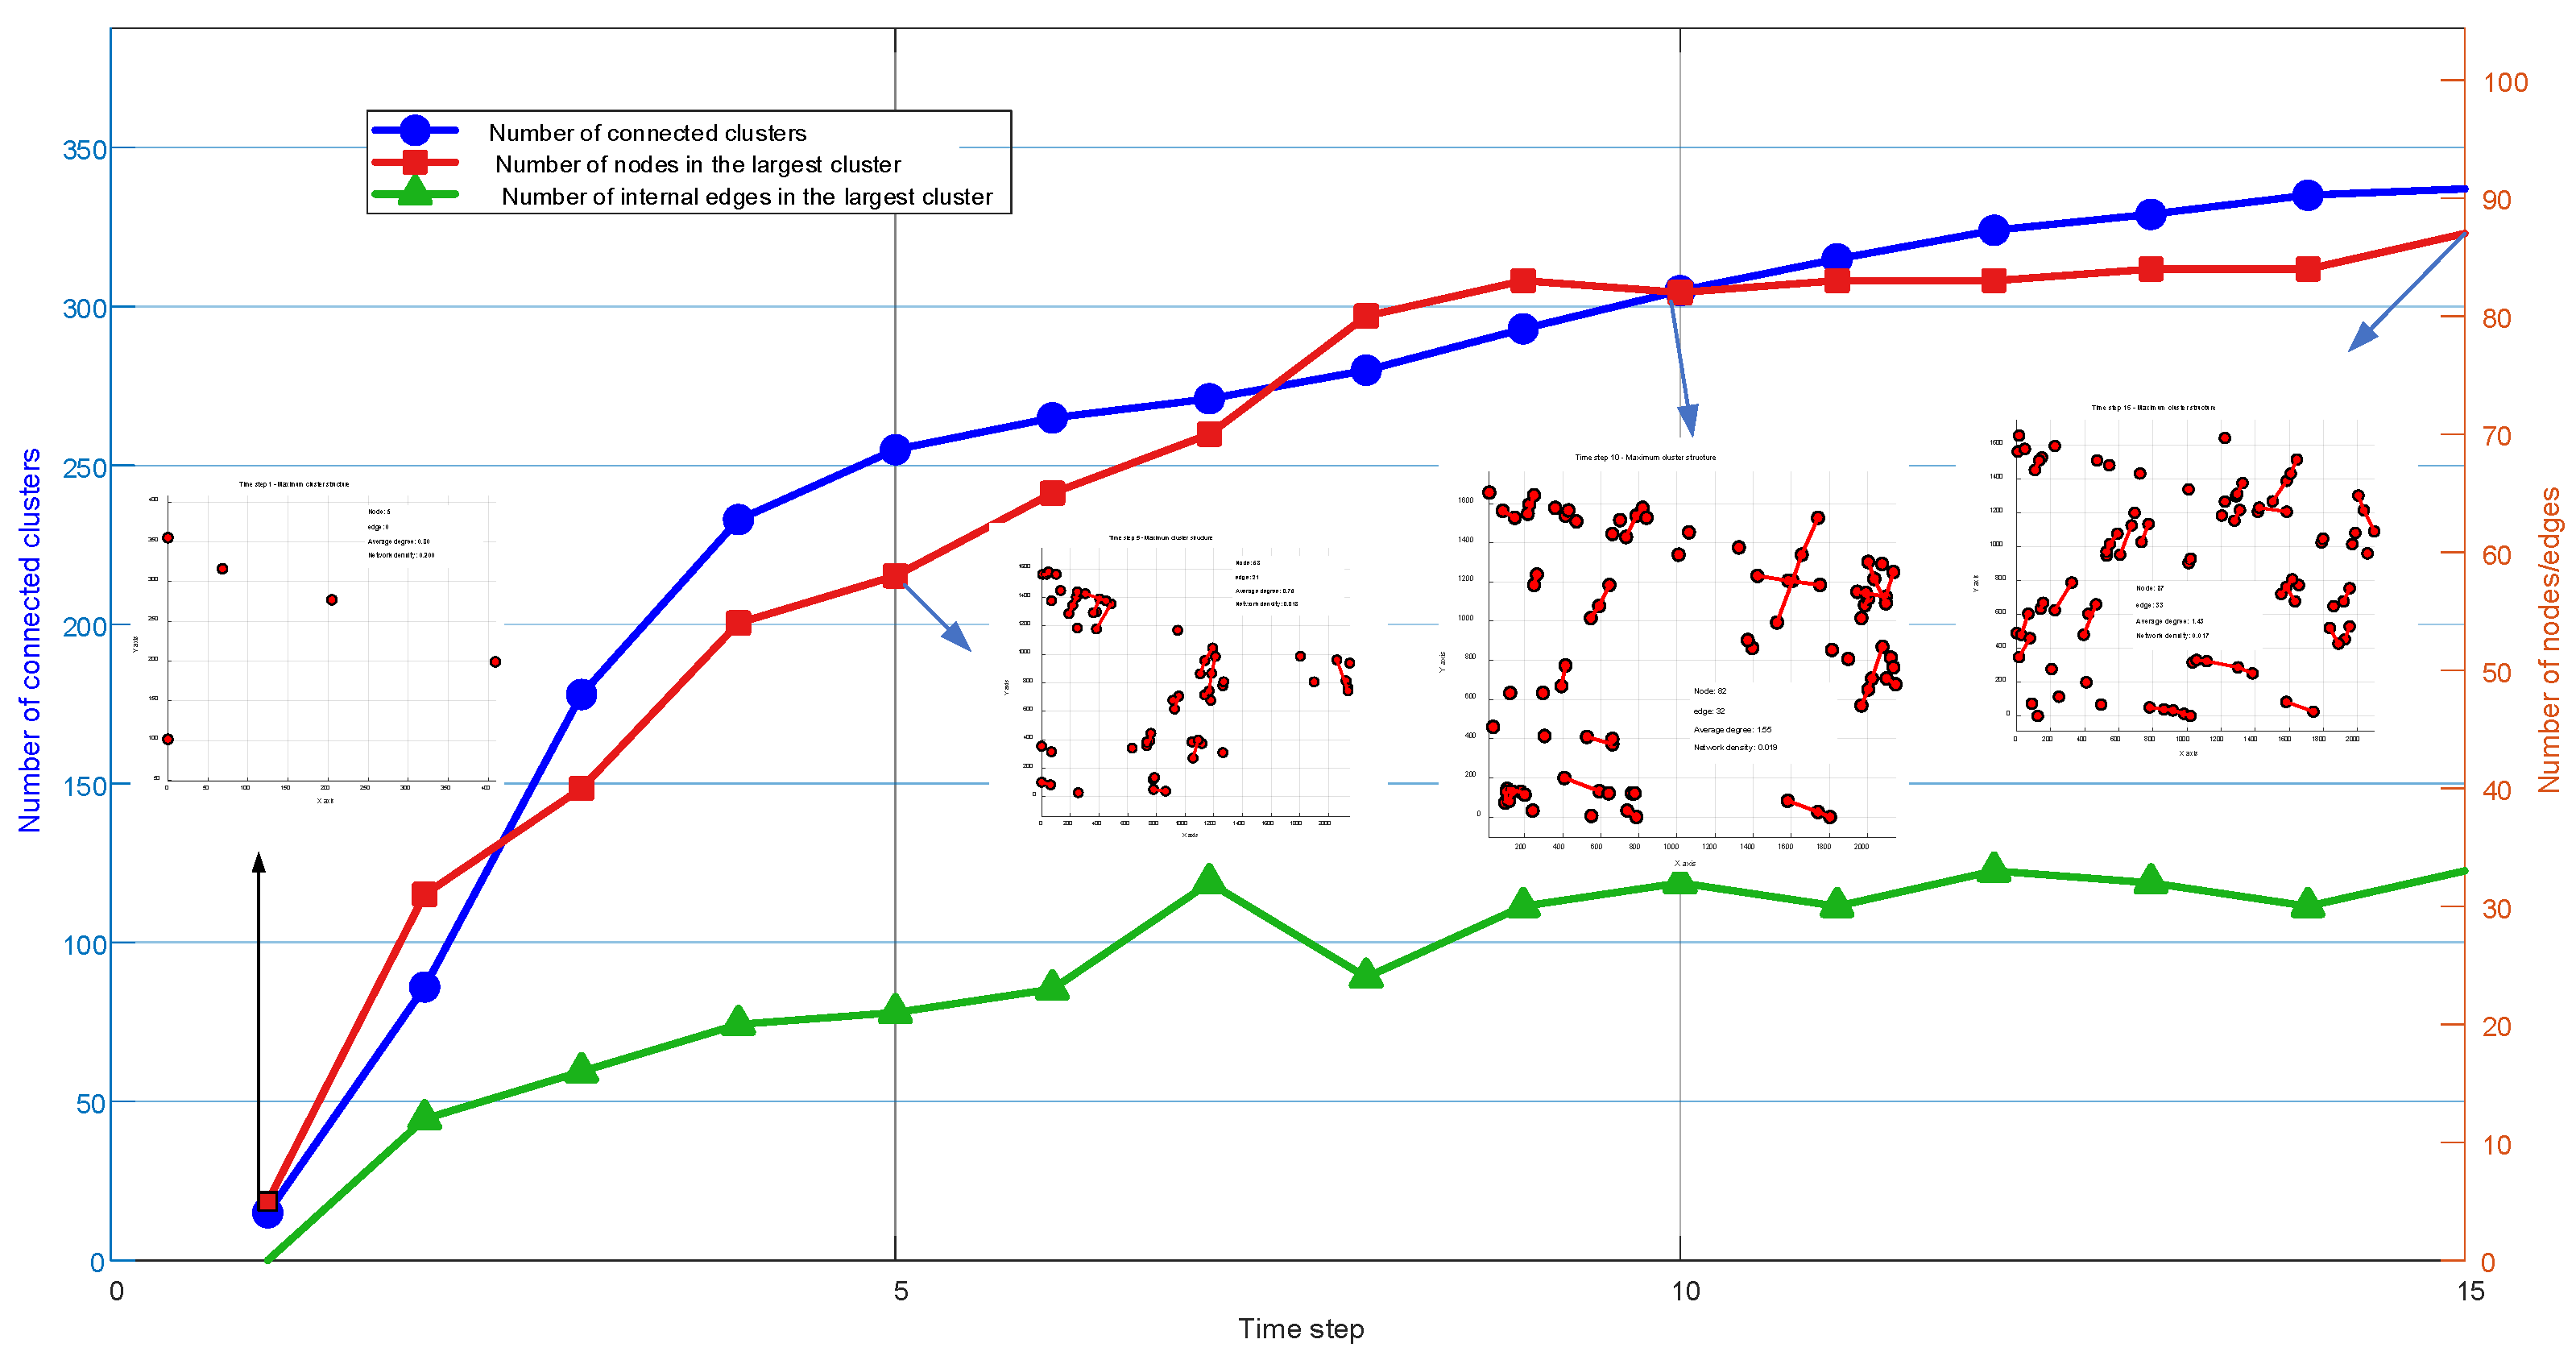
The changes in connected clusters across the fracture network over time are displayed in Figure 4, which also provides the size (node count) and internal edge count of the largest cluster. In the initial stage (time step 1), there are 15 connected clusters in the fracture network, and the largest cluster contains only 5 nodes with 0 internal edges. Analysis of the structure diagram reveals that the largest cluster at this stage comprises isolated points, devoid of any internal linkages. The connectivity between fracture nodes is weak, and the overall rock structure remains intact. During the time steps 1–5, the total number of connected clusters increases sharply, from 15 to 255; at the same time, the number of nodes in the largest cluster increases from 5 to 58, the number of internal edges increases from 0 to 21, and the network density decreases from 0.200 to 0.013. The largest cluster area begins to aggregate and gradually forms a local aggregation structure. During the time steps 5–10, the growth rate of the total number of connected clusters slows down significantly, from 255 to 305; at the same time, the number of nodes in the largest cluster increases from 58 to 82, the number of internal edges also increases to 32, and the network density fluctuates to 0.019. Under the stress loading effect, the largest cluster connects and merges with the surrounding small clusters, forming a more complex internal structure. During the time steps 10–15, the total number of connected clusters increases slightly to 337, the number of nodes in the largest cluster continues to increase to 87, and the number of internal edges is 33. As shown in the structure diagram of the largest cluster, its scale further expands, and the fracture network begins to over-percolate at time step 15.
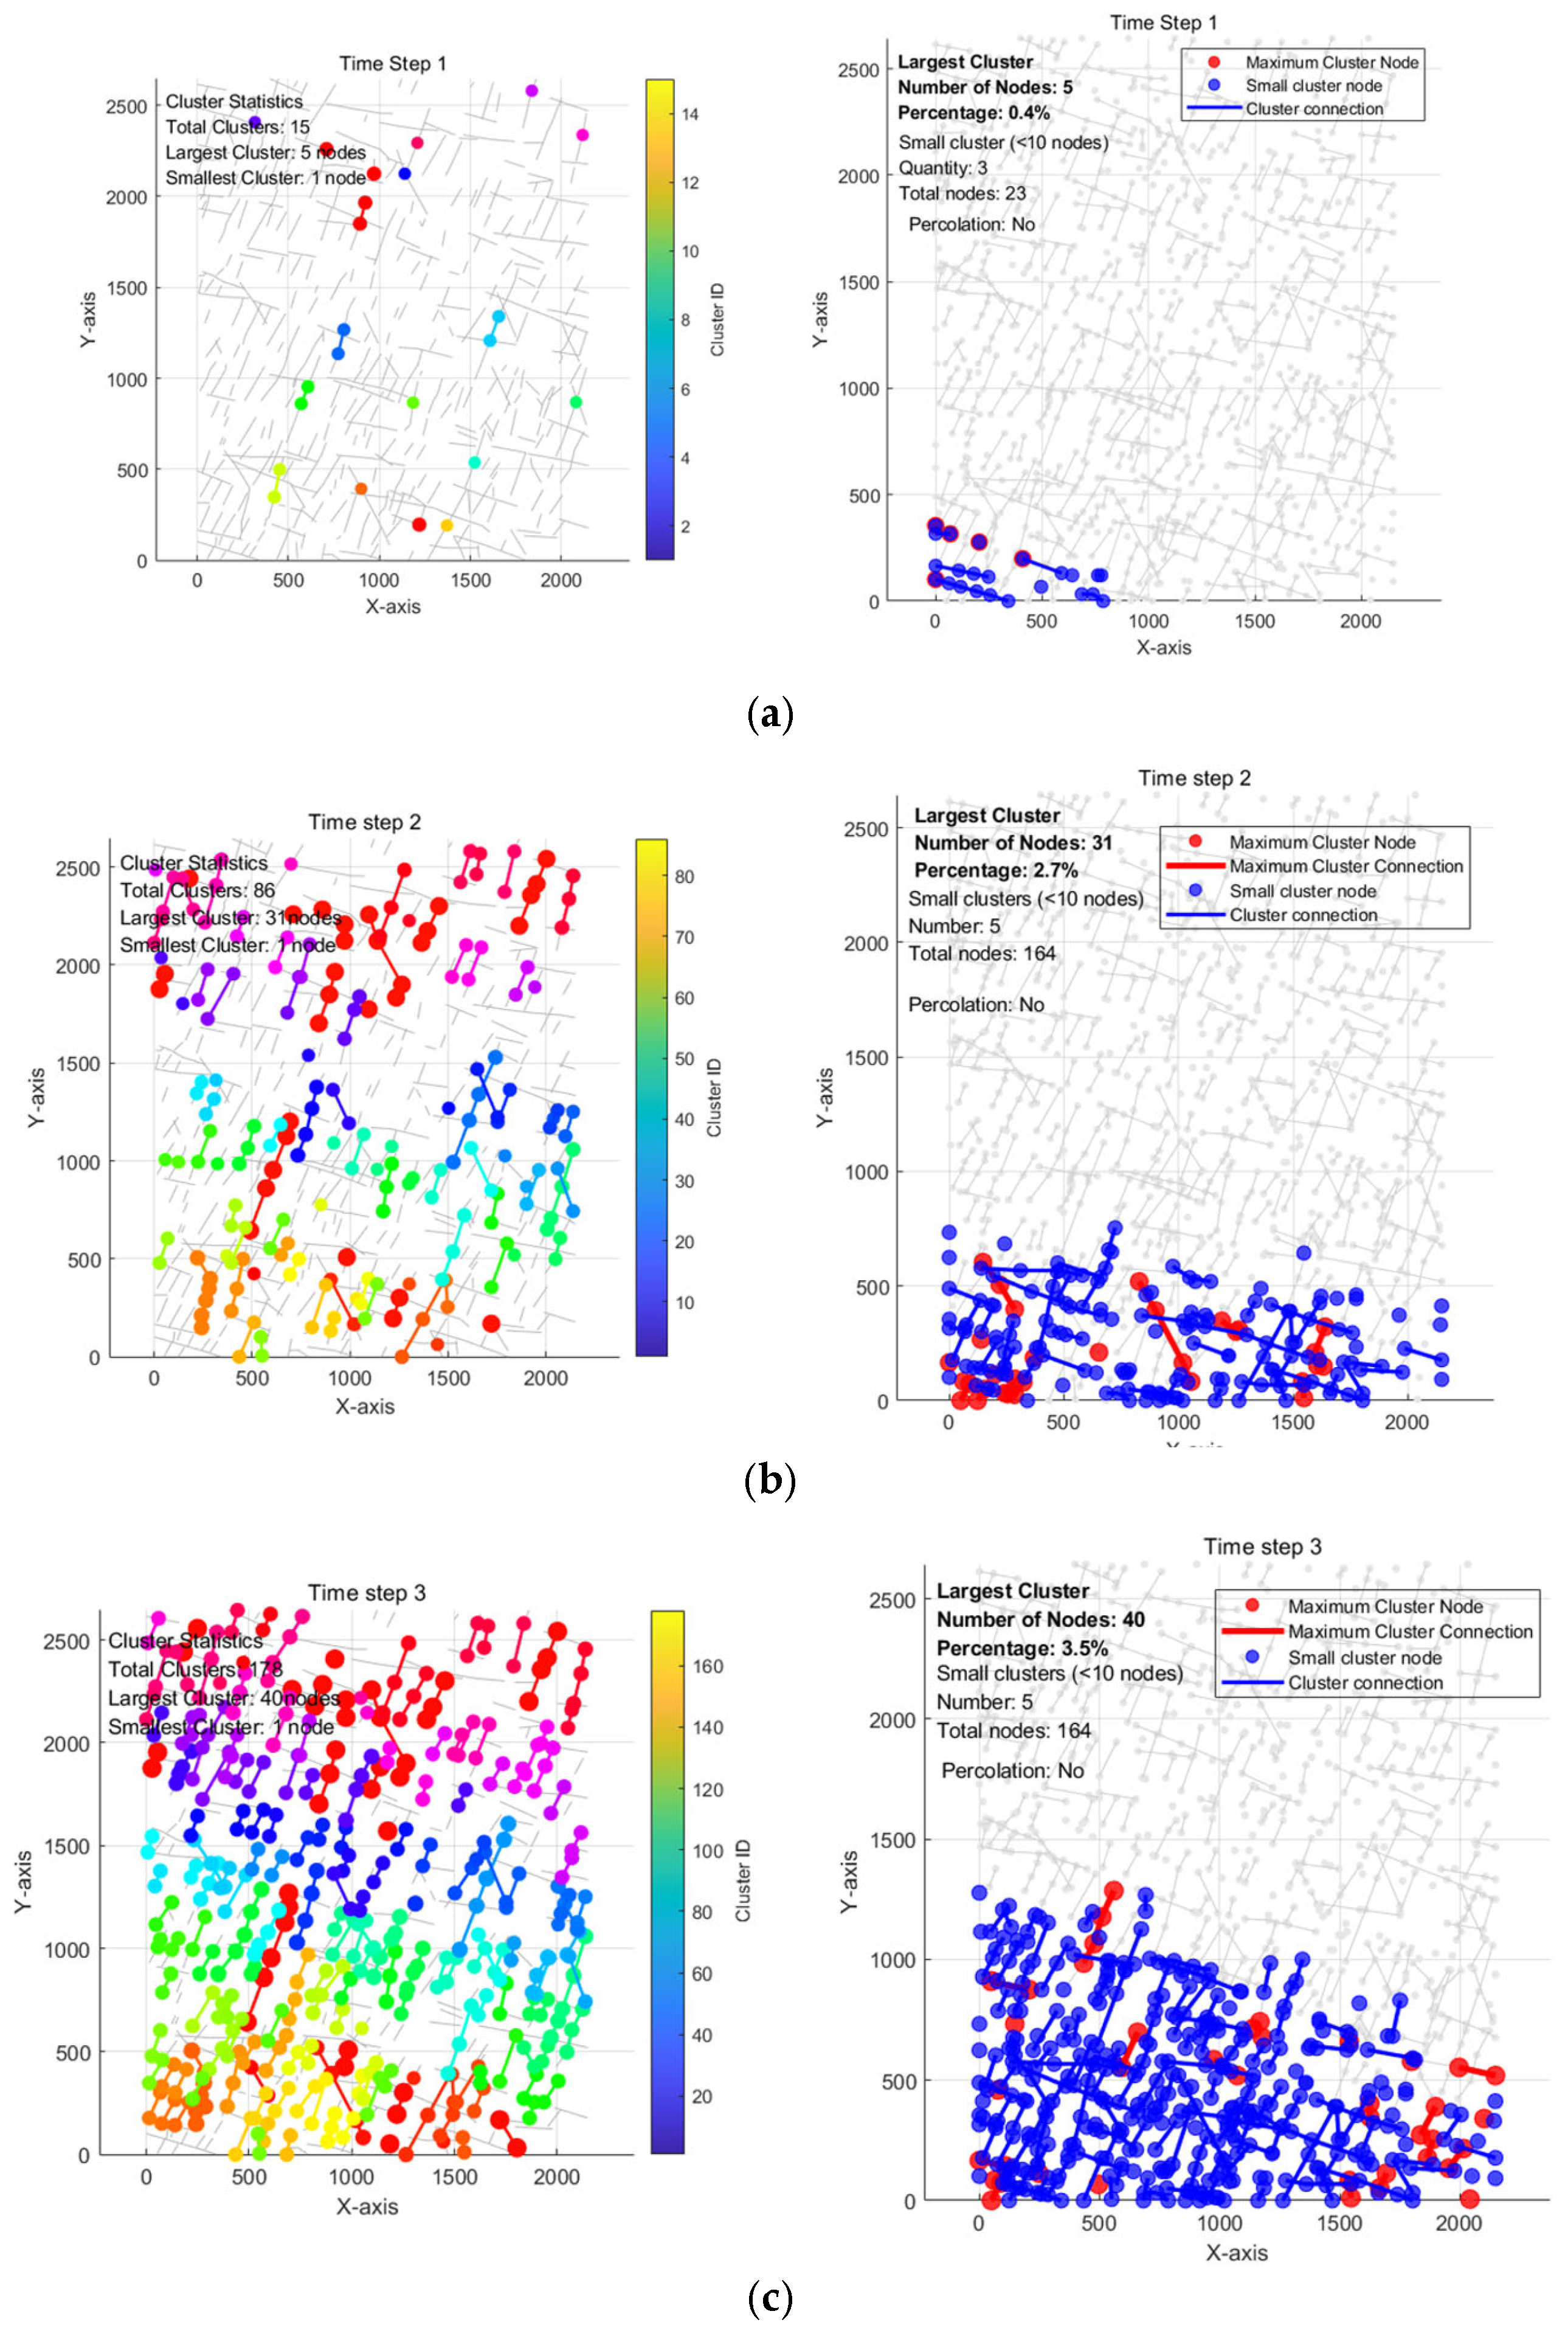
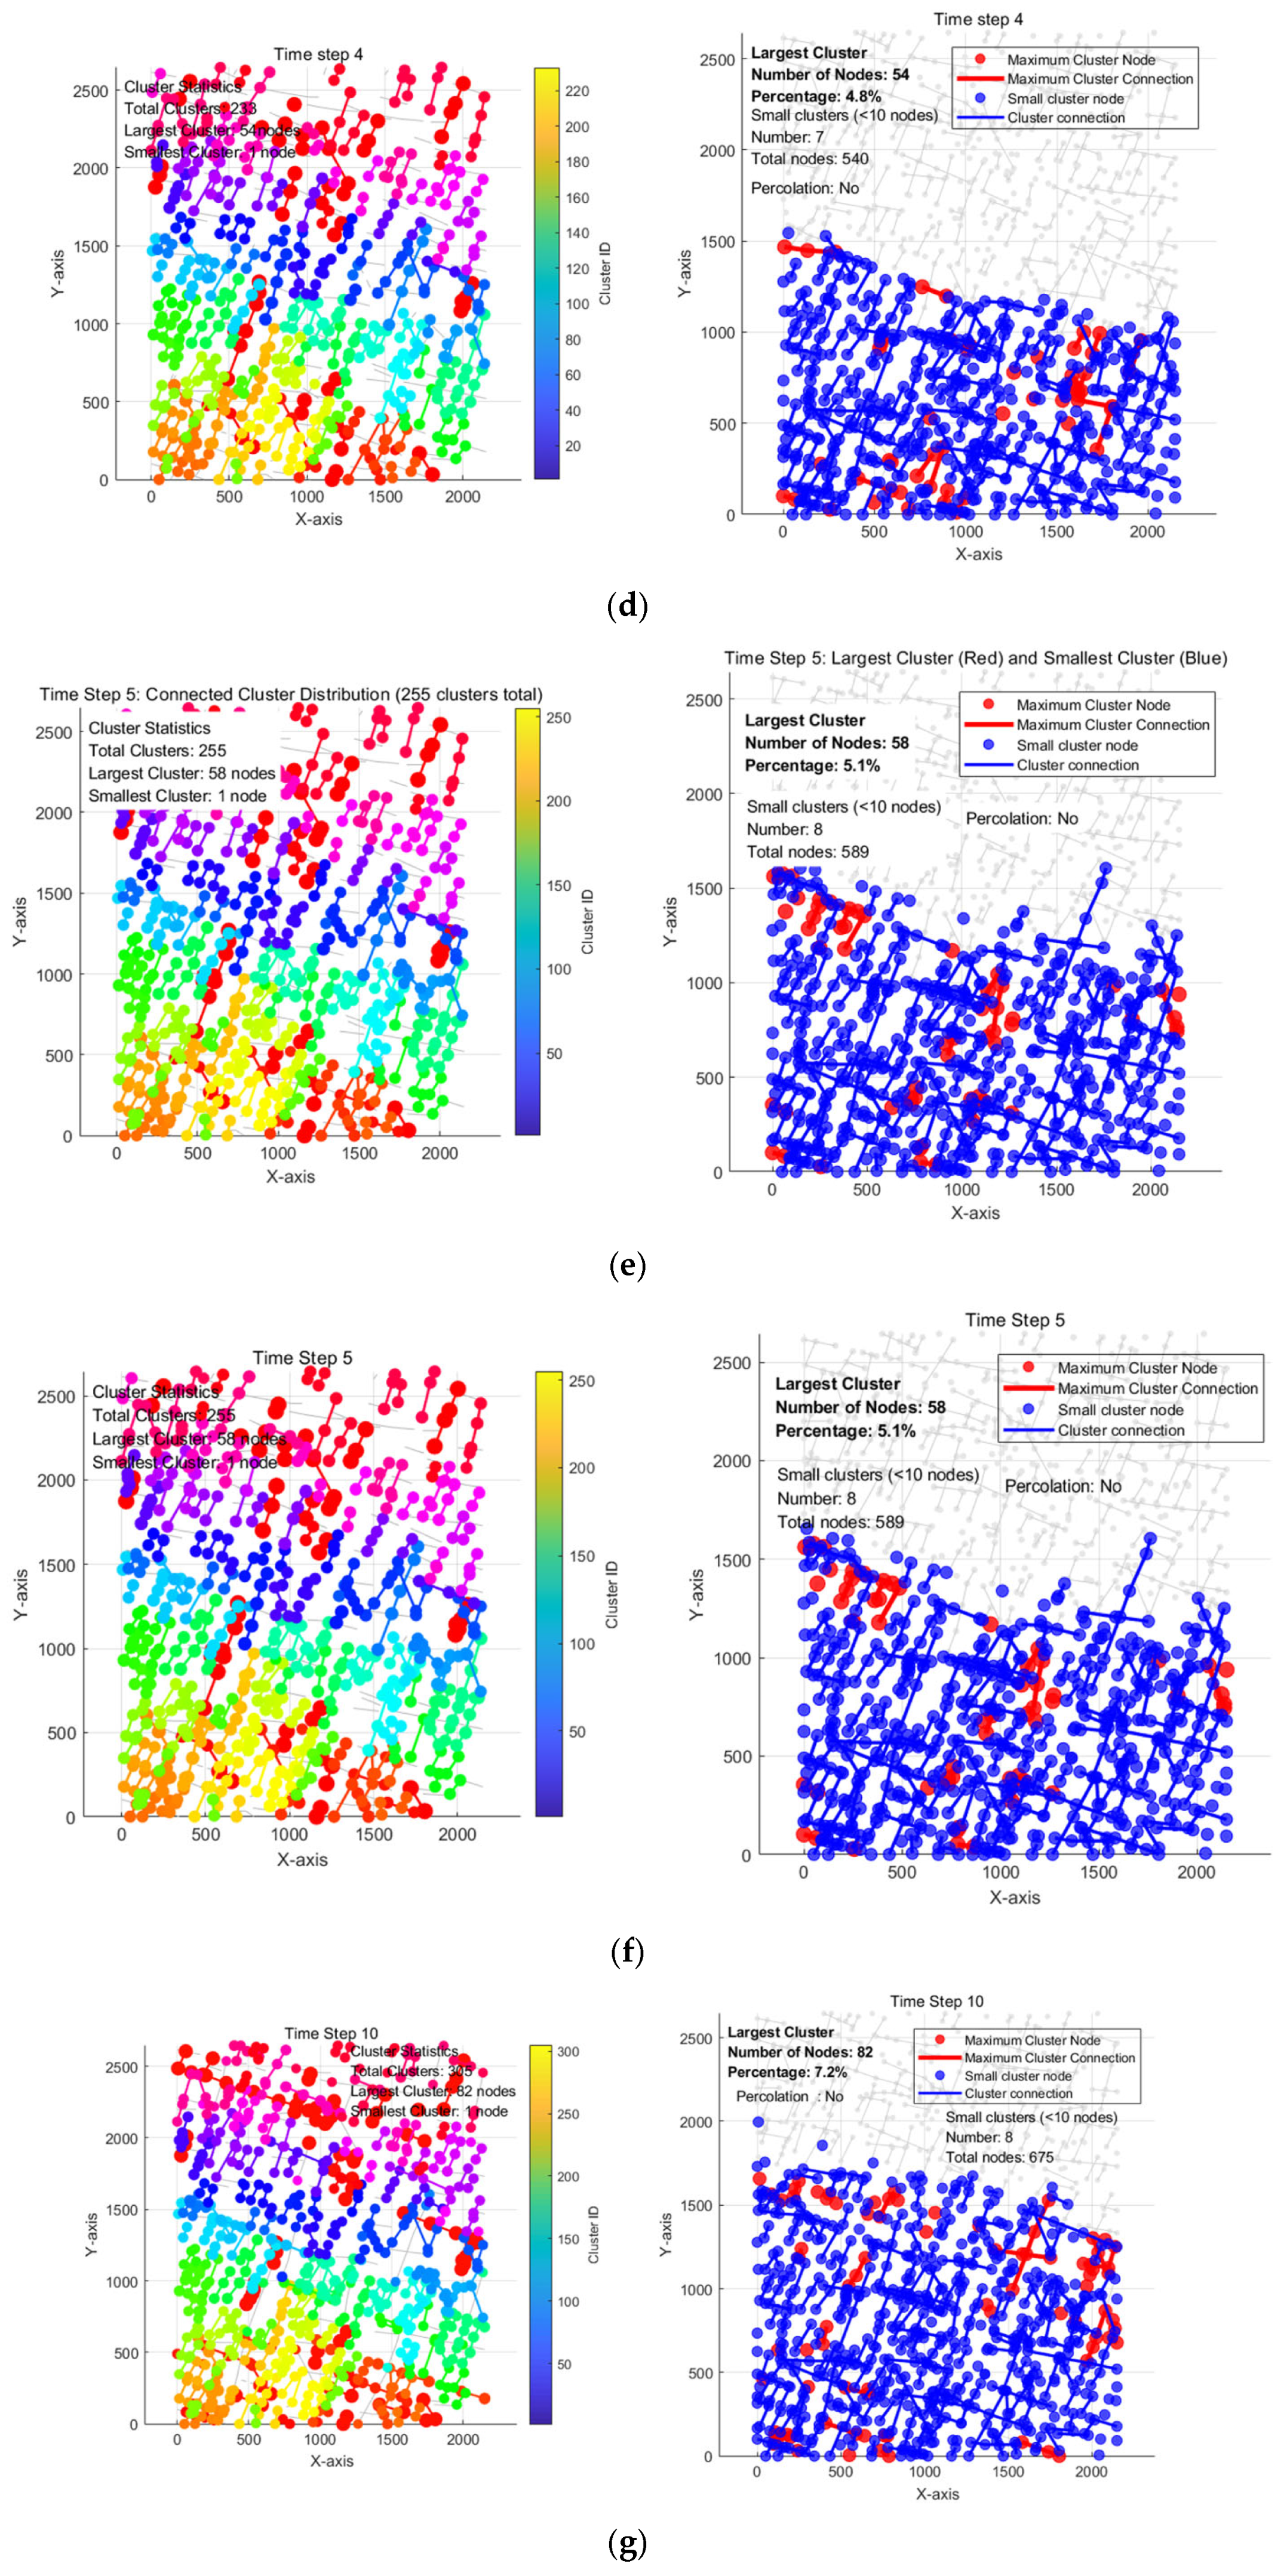
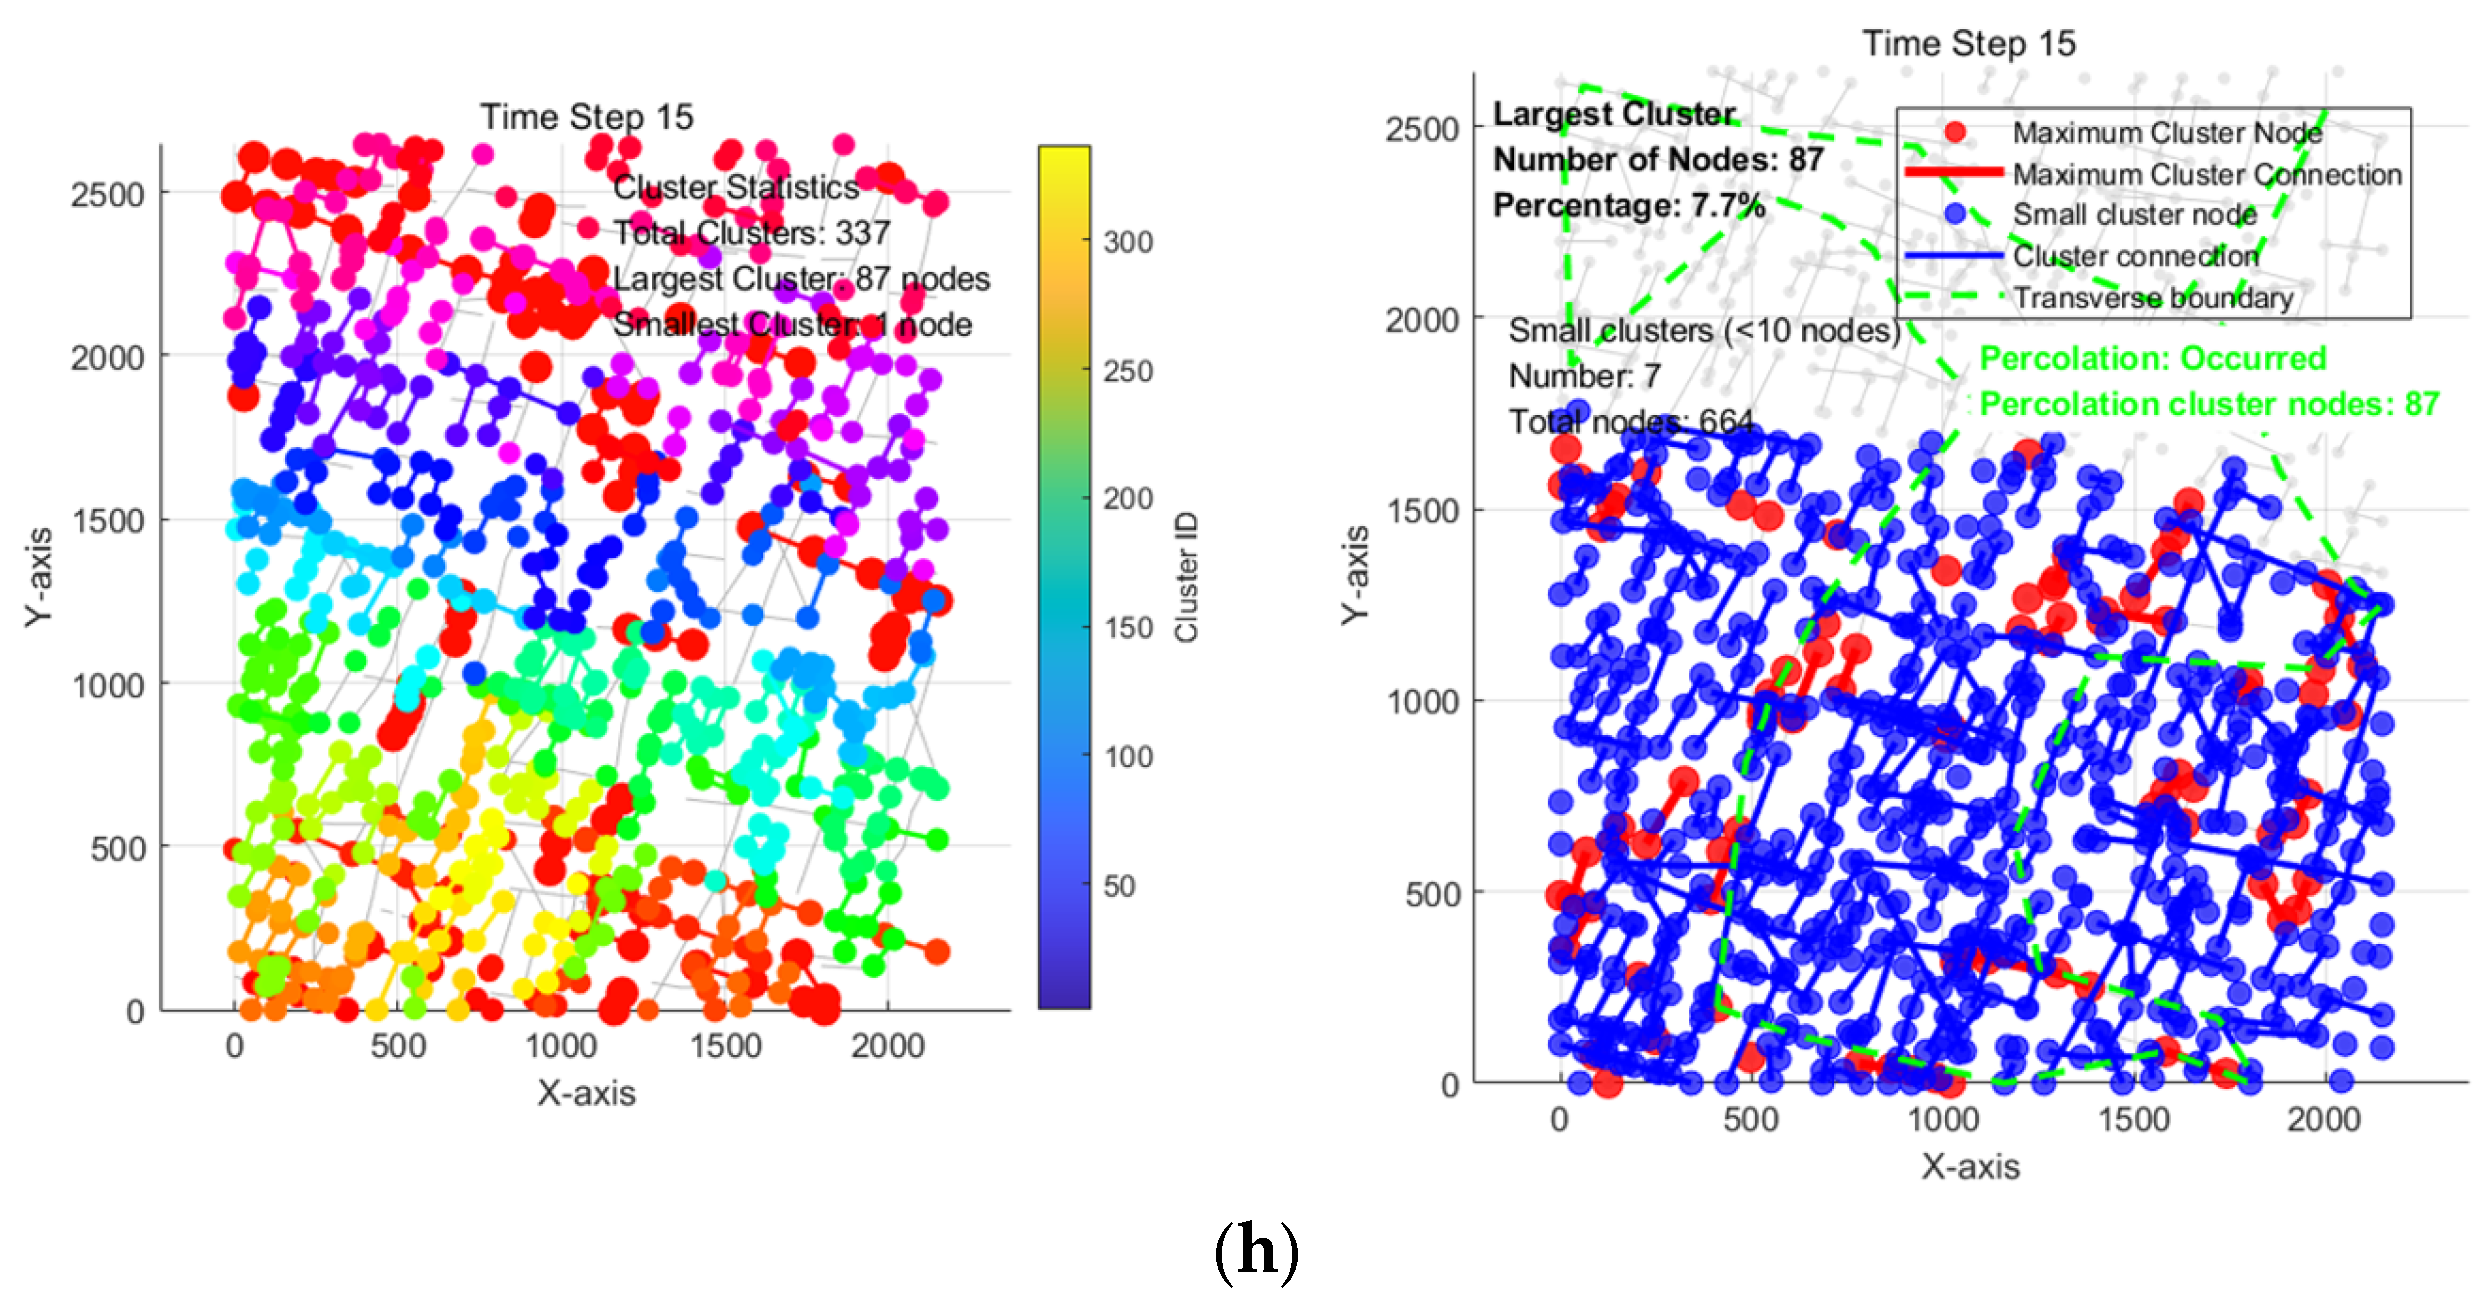
The evolution process of the fracture network is presented in Figure 5. At Time Step 1 to 5 (Figure 5a–d), as the stress changes and the connectivity increases, the number of small cluster nodes increases rapidly, the number of the largest cluster nodes increases rapidly as well, but in the middle and later stages, as the stress reaches equilibrium, the number of the largest cluster nodes gradually decreases. By time step 5 (in Figure 5f), the number of nodes in the connected cluster distribution map increases significantly, with nodes displaying various colors such as blue, green, and red. This suggests that under the continuous action of external damage stress, the damage to nodes intensifies. The largest cluster begins to aggregate locally, though the network is still dominated by blue nodes. In this stage, the largest cluster gradually forms a locally aggregated structure but has not yet percolated through the entire network. At time step 10 (in Figure 5g), the proportion of red nodes in the connected cluster distribution map increases notably, and the network begins to be dominated by red and yellow nodes. The size of the largest red cluster expands significantly, while the proportion of blue nodes in the network decreases. This suggests that the largest cluster starts to merge with surrounding smaller clusters, forming a more complex internal structure. By time step 15 (in Figure 5h), red nodes dominate the connected cluster distribution map. The number of red nodes and edges in the largest cluster increases substantially, indicating that as node and edge stresses intensify, the percolation kinetic energy further accumulates. The largest cluster expands further in scale, ultimately leading to the occurrence of percolation.
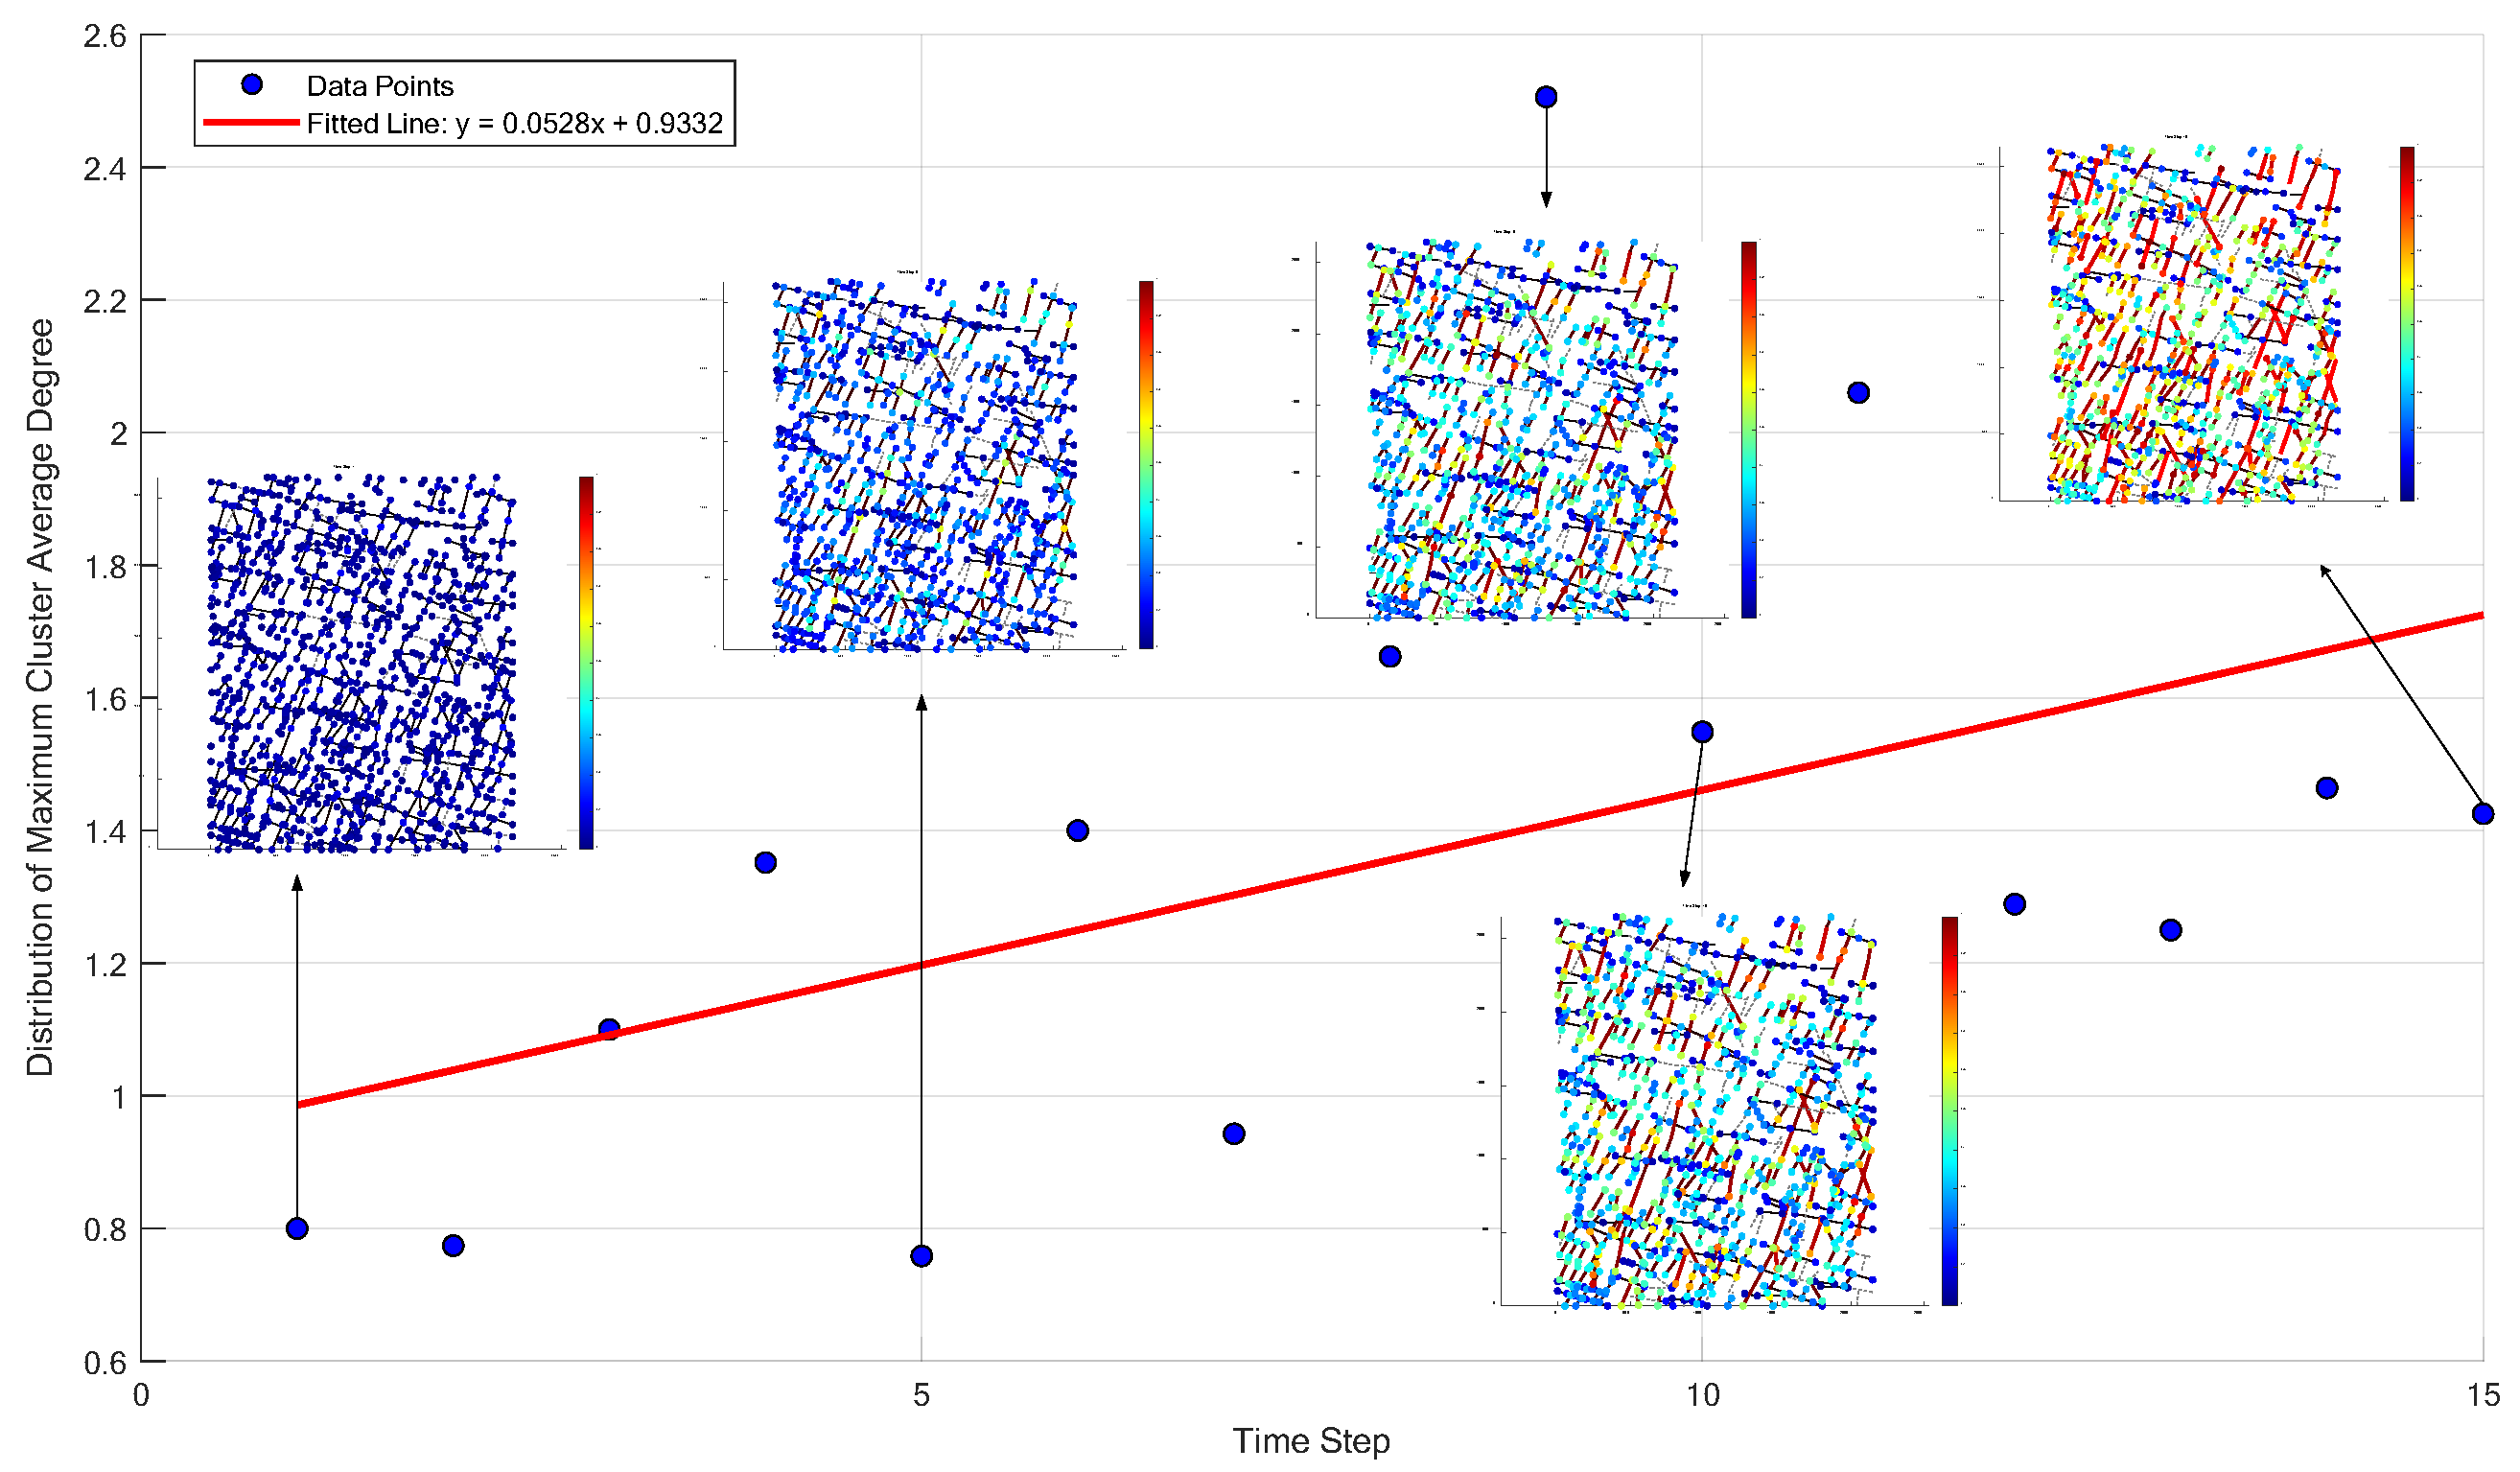
The connectivity evolution of the internal fracture network under sustained external stress can be described by the change in the average degree of the largest cluster over time. A higher average degree indicates better connectivity, whereas a lower the average degree, the worse the connectivity. As shown in Figure 6, with the progress of time steps, the average degree of the largest cluster shows a slow upward trend overall, and its fitting relationship is y = 0.0528 x + 0.9332 . The slope of the fitting line is small, indicating that the overall connectivity of the fracture network gradually enhances over time but grows relatively slowly, reflecting the continuity of damage accumulation and fracture expansion within the rock.
In the initial stage of fracture evolution, that is, time steps 1 to 5, almost all nodes and edges in the evolution diagram are blue, indicating that the external damage stress is small in this stage, and the nodes and edges in the fracture network remain relatively intact. The average degree of the largest cluster fluctuates and increases from 0.80 to 1.35, indicating that fractures in the rock may begin to initiate and initially expand, and the increasing average degree reflects that the internal connectivity of the largest cluster gradually enhances in this stage. In the middle stage of fracture network evolution, that is, time steps 5 to 10, it can be seen in the figure that the color of some nodes transitions from dark blue to light blue, and red nodes and edges appear locally. This reflects that under the continuous action of external damage stress, some nodes in the fracture network begin to be damaged, and they will fail in the network when their damage value reaches the threshold P c . The average degree of the largest cluster in this stage fluctuates and increases from 0.76 to 1.55, and reaches a peak of 2.51 at time step 9, indicating that the connectivity of the fracture network is locally significantly enhanced at this time, and multiple fractures may expand and intersect to form high-density connection regions in this stage. In the late stage of rock fracture network evolution, that is, time steps 10 to 15, red nodes and edges in the figure increase significantly and form local aggregated regions, and red nodes and edges begin to occupy the main area of the network, while the proportion of blue regions decreases significantly. This indicates that under the continuous action of damage stress, most nodes in the fracture network have reached the damage threshold P c and failed. The average degree of the largest cluster in this stage fluctuates and decreases from 2.06 to 1.43, indicating that although the scale of the fracture network expands, its internal connections gradually tend to be saturated. It can be seen from the evolution diagram at time step 15 that the proportion of red nodes and edges in the network has increased significantly, and the largest connected cluster may become the dominant connected structure of the system, and a through permeability channel may have been formed inside the rock.
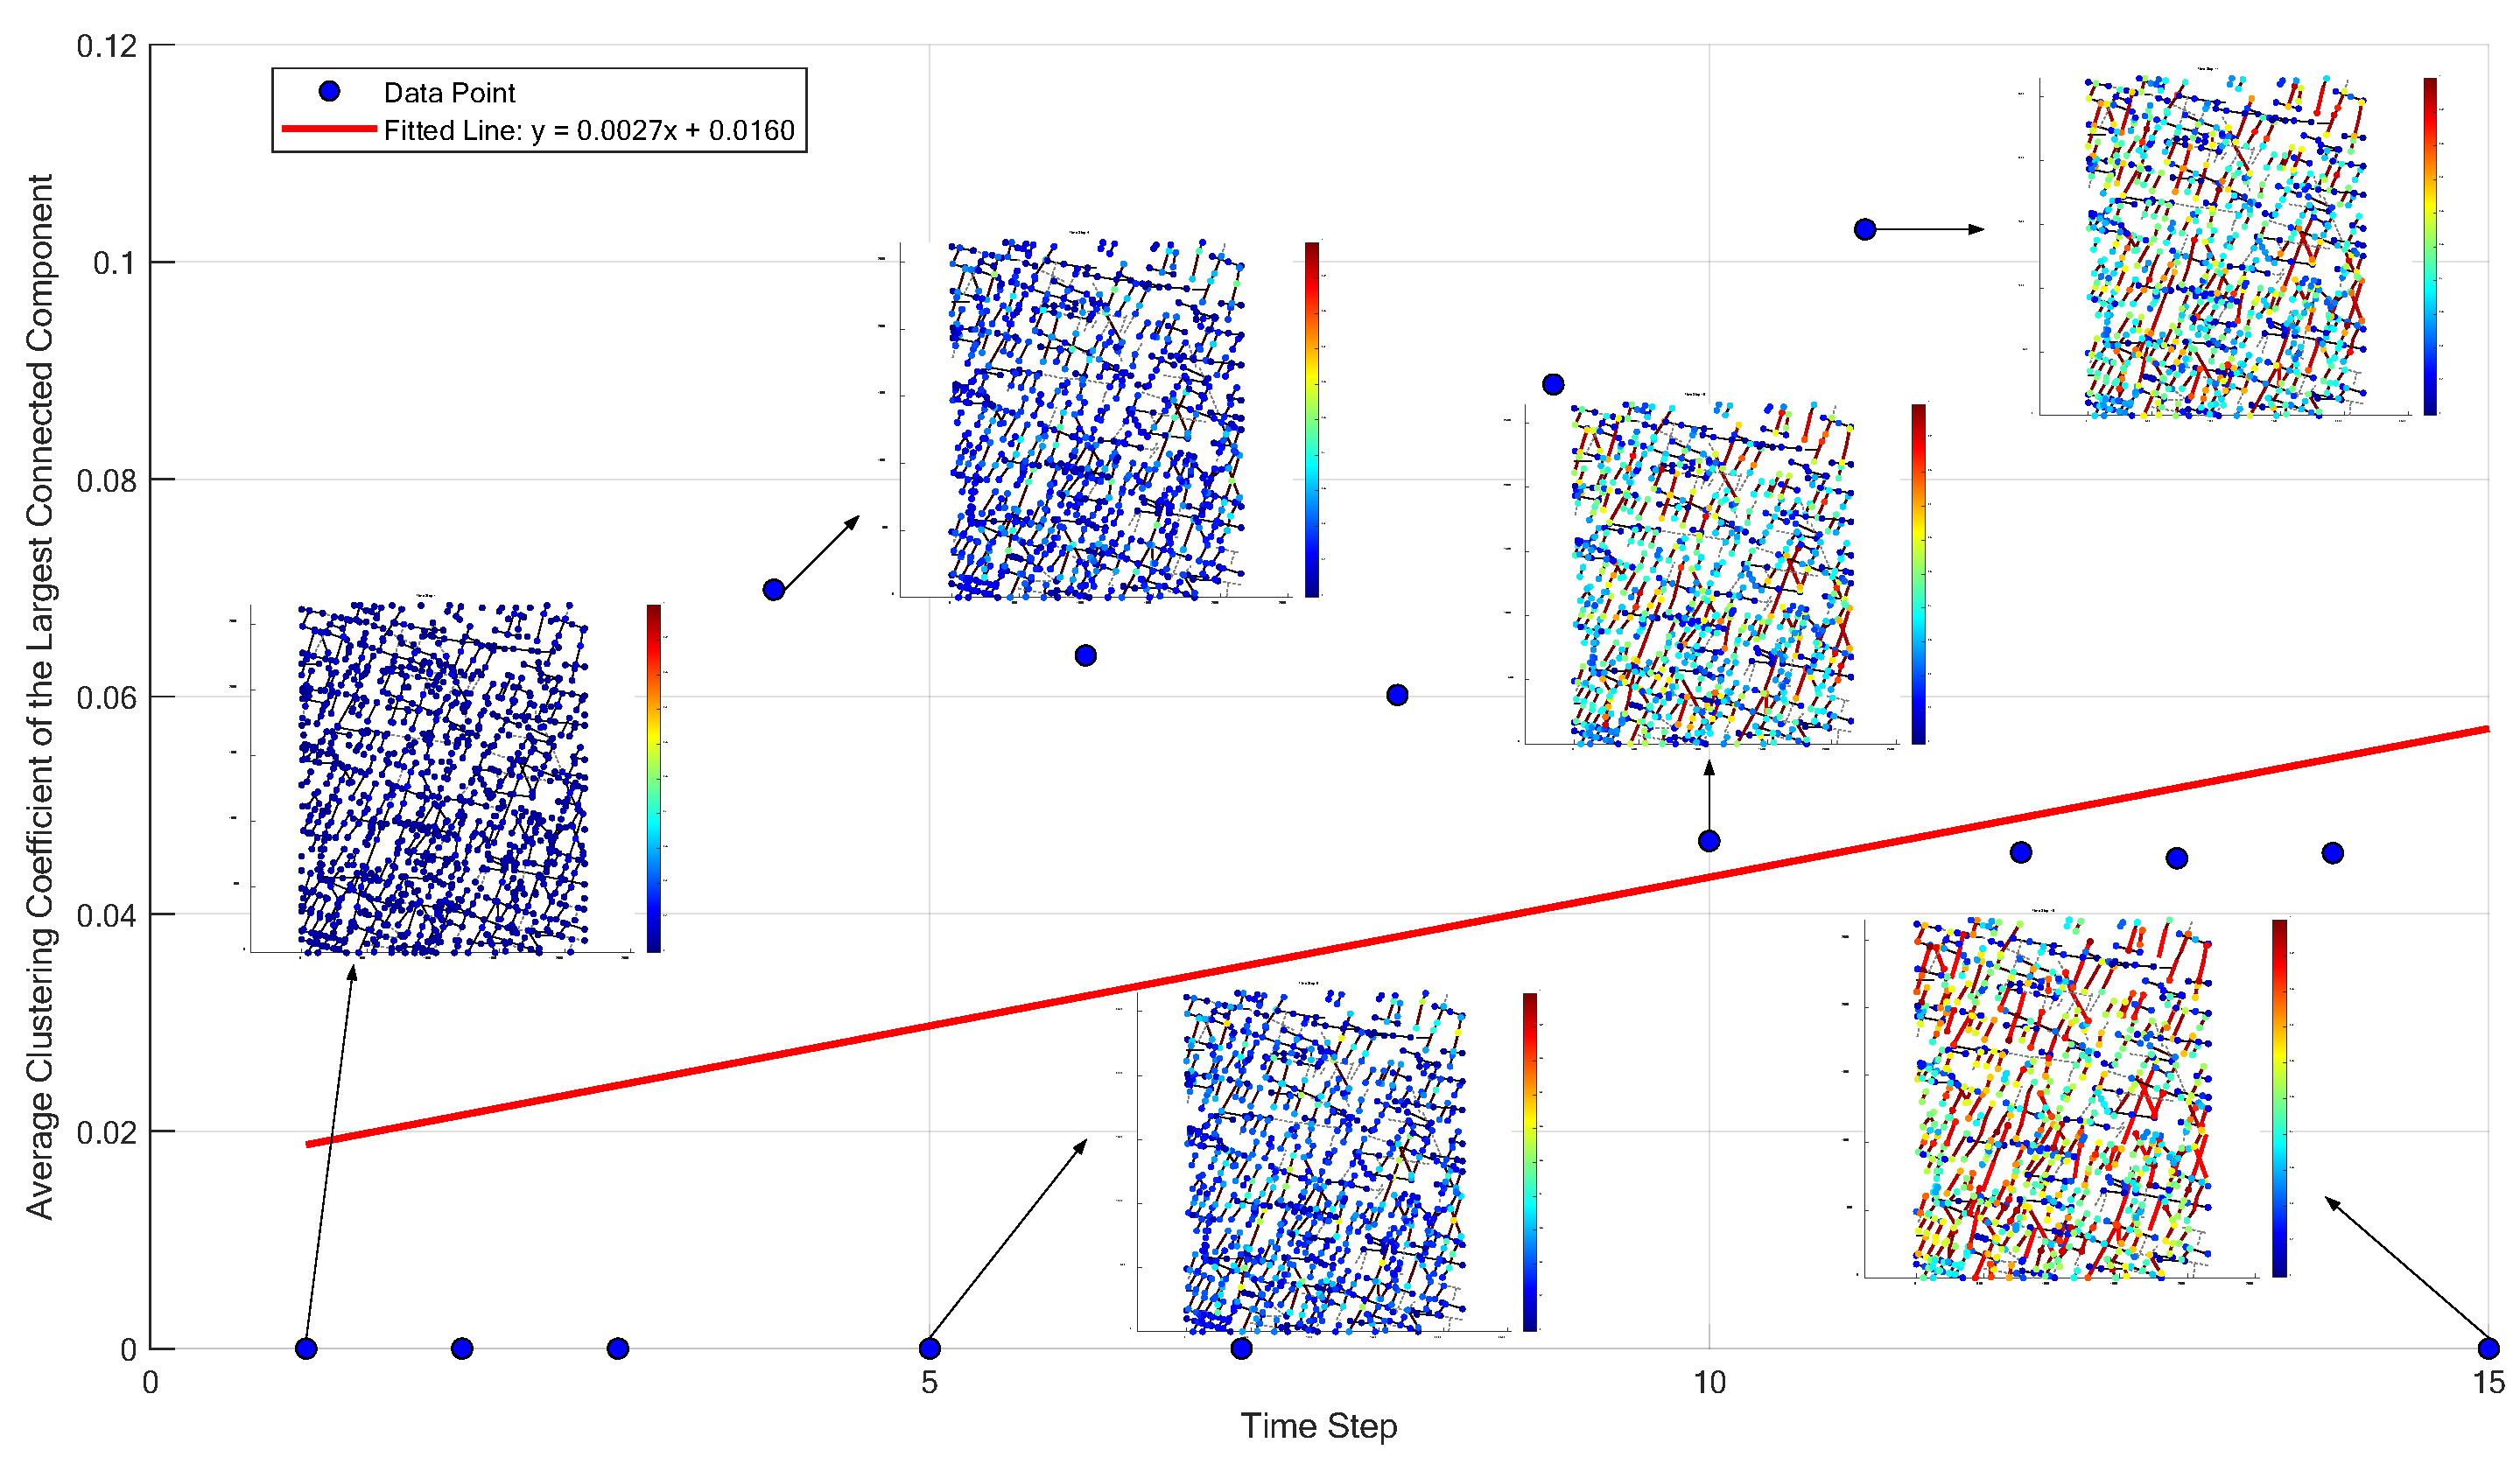
Under continuous external stress, the average clustering coefficient of the largest cluster exhibits a distinct evolutionary trend across time steps, as detailed in Figure 7. The average clustering coefficient is used to characterize the tightness of nodes forming local closed triangular structures in the network; the higher its value, the stronger the local aggregation of the network. It can be seen from the fitting line y = 0.0027 x + 0.0160 in the figure that the average clustering coefficient of the largest cluster shows a slow linear growth trend at all time steps, reflecting a steady enhancement in local connectivity within the largest cluster.
In the stage of time steps 1 to 3, the average clustering coefficient is 0, which is significantly lower than the predicted value of the fitting line. Combined with the corresponding evolution diagram of the fracture network, it can be seen that almost all nodes and edges in the network are blue at this stage, indicating that fractures inside the rock may have just initiated and are isolated from each other, without forming effective connections. The largest cluster is small, and the rock structure remains relatively intact.
At time step 4, the average clustering coefficient appears non-zero, indicating that fractures begin to form local connection structures, possibly due to the intersection of some newly generated fractures, and the internal connectivity of the largest cluster is further enhanced. However, at time step 5, the average clustering coefficient returns to zero, reflecting that some local connections may be damaged due to node failure. In the stage of time steps 4 to 11, the average clustering coefficient of the largest cluster shows a fluctuating growth trend, reaching a peak of about 0.1 at time step 11. It can be seen in the evolution diagram that red nodes and edges are obviously aggregated in local regions. indicating that under the continuous action of external stress, the damage to the fracture network intensifies, some nodes and edges in the network may fail, and local fractures may begin to expand and intersect. The rising clustering coefficient signifies both growth in the size of the largest cluster and improved network connectivity. In the stage of time steps 12 to 14, the measured clustering coefficients align closely with the fitted trend, and a large number of red nodes and edges appear in the evolution diagram, while the proportion of blue regions decreases. This indicates that with the further intensification of damage to the fracture network, most nodes and edges in the network may have failed due to reaching the damage threshold P c , and the scale of the largest cluster further expands, gradually dominating the fracture network, which is consistent with the controlling effect of the maximum node degree on the overall connectivity. At time step 15, the average clustering coefficient of the largest cluster drops sharply to 0, which is obviously deviated from the fitting line. At this stage, the evolution diagram shows that the red connected structure has occupied the main area of the network, and the largest cluster has developed into the dominant connected structure in the network, and a through permeability channel may have been formed inside the rock.

5. Verification

5.1. Permeability Comparison

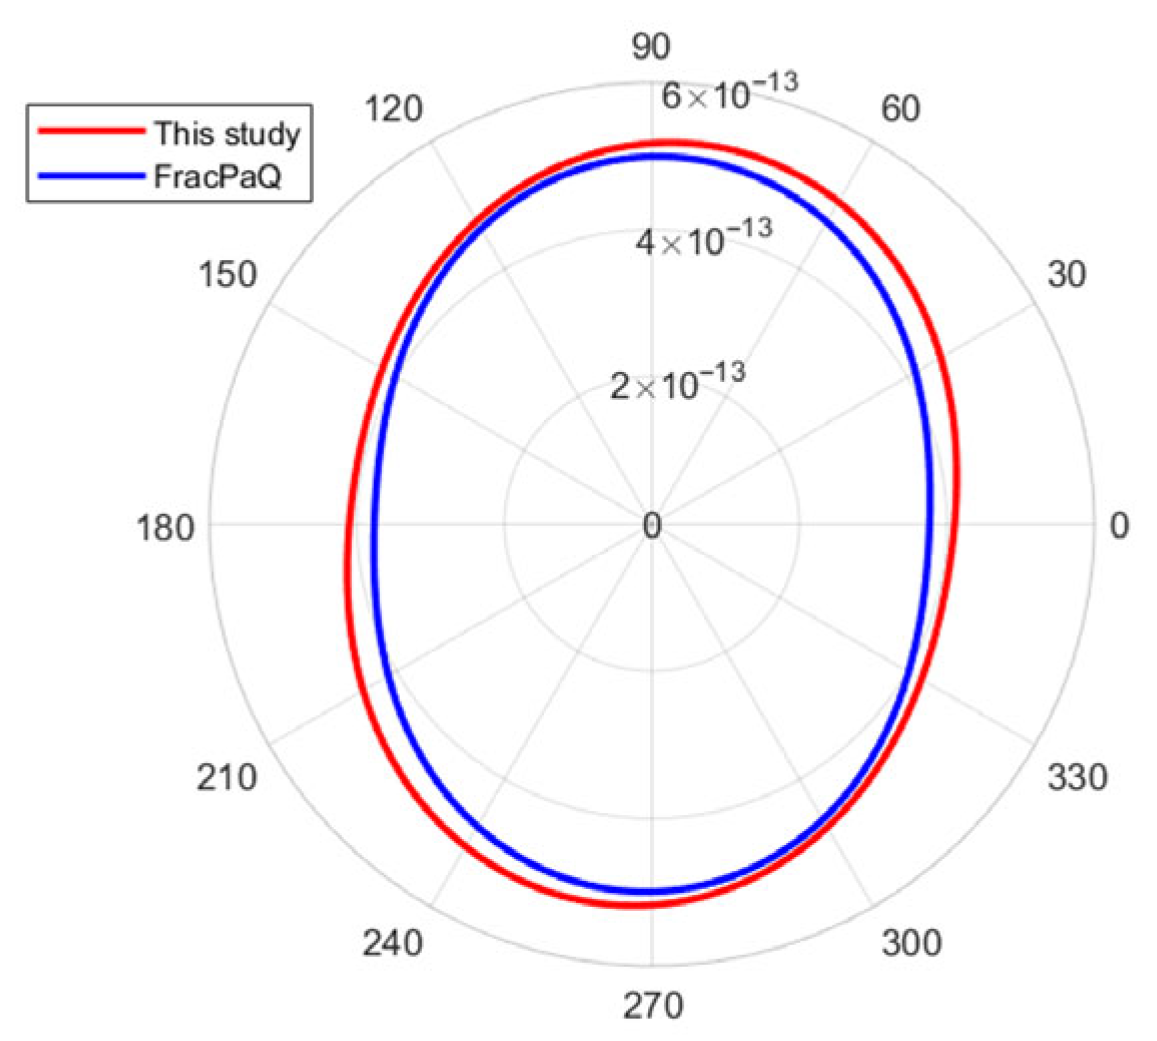
A comparison between the dynamic permeability of the fracture network and the FracPaQ permeability (Figure 8) was conducted to validate the accuracy of the node and edge damage model.
It can be seen from Table 3 that the maximum relative error of the permeability calculated by the method in this paper compared with that by the FracPaQ method does not exceed 3%, and the minimum relative error does not exceed 7%. This indicates that the permeability predicted by combining complex network theory with the yield criterion is feasible for fracture permeability calculation, further verifying that the complex fracture network permeability prediction model can effectively predict the permeability evolution process.

5.2. Equivalent Stress Comparison

To quantitatively evaluate the accuracy of the node-edge stress model, this study proposes an equivalent stress conversion method. This method converts the critical stress state (CSF) of fracture segments into equivalent stress values at nodes, enabling a comparative analysis with the stress values presented in this study [30]. The equivalent stress conversion formula is as follows:
D F r a c Q a q =   C S F m
where C S F represents the critical stress state of fracture edges in the FracPaQ model, and m is the number of fracture segments connected to the node.
By extracting the CSF distribution map from FracPaQ, the critical stress states of all fracture segments are obtained. For each node, the proportion of connected fracture segments with C S F is calculated as the equivalent damage value. The nodal stress state D i from this study is then compared with the FracPaQ equivalent stress, the formula is:
A = D i   /   D F r a c Q a q 1
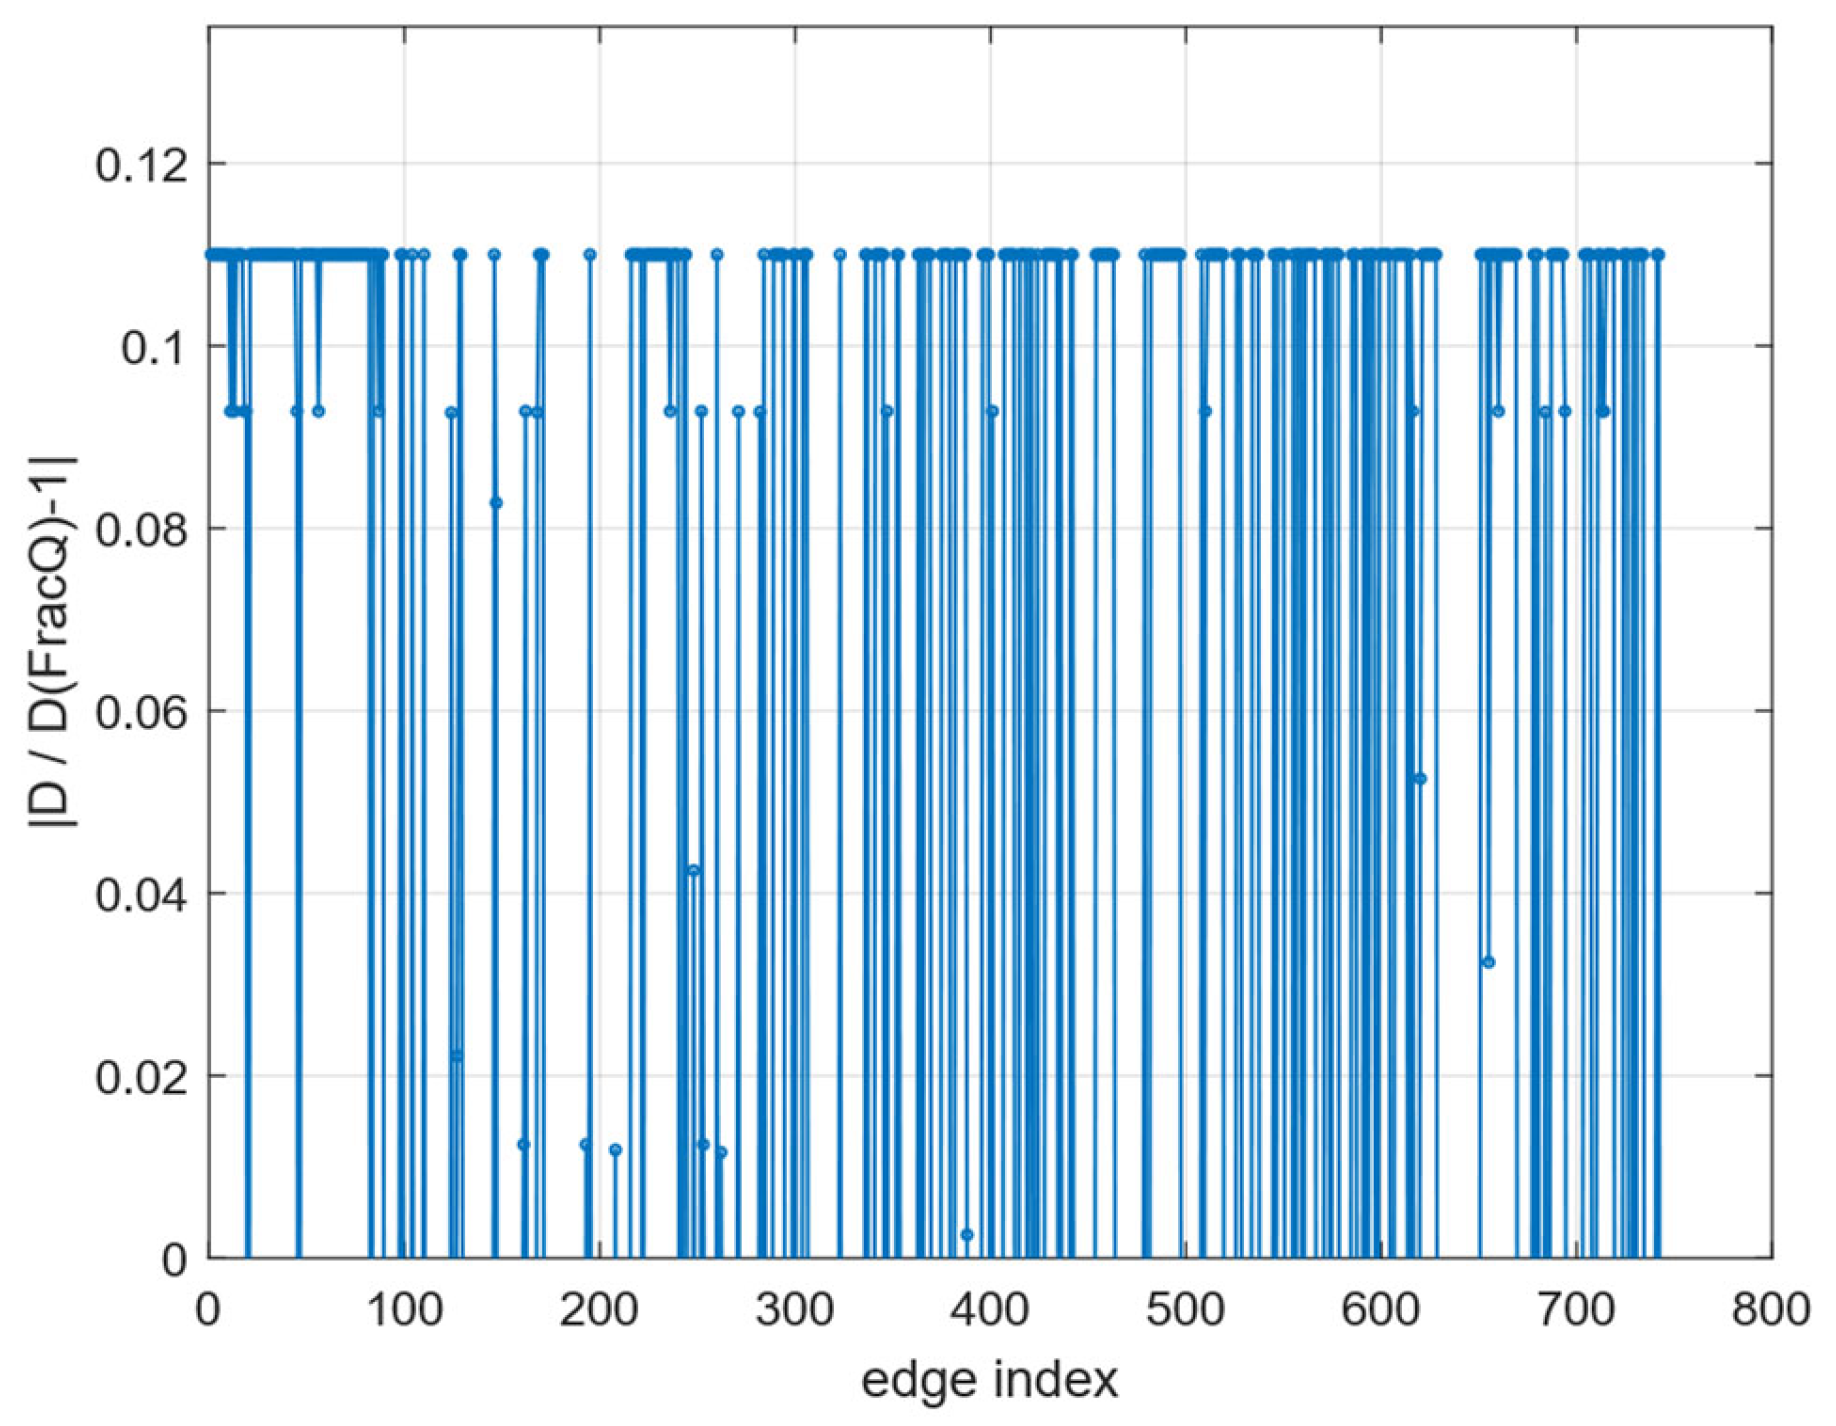
Based on the calculation results of Formula (8), we have drawn Figure 9, according to the calculation results presented in Figure 9, the edge error E < 12 % . This verifies the effectiveness of the proposed method for stress damage calculation.

6. Conclusions

Considering the influence of fracture network characteristics on fracture network connectivity and permeability range, combining the yield criterion and permeability–stress coupling mechanism, a fracture permeability evolution equation is established. The influence of complex network degree centrality and fracture-scale characteristics on the fracture shear force transfer coefficient is considered, the criteria for node and edge damage of the fracture network are determined, the percolation threshold is determined according to the stress conditions of nodes and edges, and the percolation region is calculated. The research proves the following:
(1)
Changes in the average degree and average clustering coefficient in the fracture network can characterize the connectivity and local aggregation characteristics inside the fracture. As show in its fitting relationship, the higher the average degree, the denser the connections between nodes, the better the overall connectivity of the fracture network, and the more serious the process of fracture expansion and intersection inside the rock under stress loading. The average clustering coefficient is related to the local aggregation degree of the fracture network; the higher the clustering coefficient, the closer the node connections in local regions of the fracture network, and the better the network connectivity.
(2)
The largest cluster can evaluate the permeability state of the fracture network. The relative size of the largest cluster is used to measure the change in fracture network connectivity during fracture evolution. Before the percolation critical point, M/N shows a steady growth trend, and the damage permeability area gradually increases; when approaching the percolation state, the largest cluster shows an increasing trend, and at this time, the largest cluster in the fracture network will become the preferential percolation channel of the fracture network.
(3)
Compared with the permeability of the FracPaQ fracture network, the maximum network permeability error is 3%, and the minimum error is controlled within 7%, indicating that this method can accurately predict the permeability process. By equivalent stress comparison, the edge error E < 12 % . This verifies the effectiveness of the proposed method for stress damage calculation.

Author Contributions

J.C.: Writing—review and editing, Methodology, Formal analysis, Funding acquisition, Software; X.L.: Software, Original-draft writing, Investigation; Y.L.: Methodology; Investigation; F.Y.: Software, Methodology; J.J.: Investigation, Methodology. All authors have read and agreed to the published version of the manuscript.

Funding

This research was funded by National Natural Science Foundation of China (Grant No. 52204210), Natural Science Foundation of Hunan Province, China (Grant No. 2023JJ30242), Research Foundation of Education Bureau of Hunan Province, China (Grant No. 21B0452), and Open Research Fund of Hunan Provincial Key Laboratory of Hydropower Development Key Technology, China (Grant No. PKLHD202202).

Institutional Review Board Statement

Not applicable.

Informed Consent Statement

Not applicable.

Data Availability Statement

The datasets used and/or analyzed during the current study are available from the corresponding author on reasonable request.

Acknowledgments

The authors would like to express their gratitude to the referees for their valuable comments and suggestions that improved the writing of this paper.

Conflicts of Interest

Authors Juan Chen, Xiaofeng Liu and Yongfeng Li were employed by the company Power China Zhongnan Engineering Co., Ltd. The remaining authors declare that the research was conducted in the absence of any commercial or financial relationships that could be construed as a potential conflict of interest.

References

  1. Suditu, S.; Dumitrache, L.; Brănoiu, G.; Prundurel, A.; Ghețiu, I. Carbon Capture and Storage Subsurface Study for a Natural Gas-Burning Power Plant in Oltenia, Romania. Processes 2024, 12, 1648. [Google Scholar] [CrossRef] [Scilit]
  2. Eparu, C.N.; Suditu, S.; Doukeh, R.; Stoica, D.B.; Ghețiu, I.V.; Prundurel, A.; Stan, I.G.; Dumitrache, L. Software for CO2 Storage in Natural Gas Reservoirs. Energies 2024, 17, 4984. [Google Scholar] [CrossRef] [Scilit]
  3. Cardona, A.; Finkbeiner, T.; Santamarina, J.C. Natural rock fractures: From aperture to fluid flow. Rock Mech. Rock Eng. 2021, 54, 5827–5844. [Google Scholar] [CrossRef] [Scilit]
  4. Fu, J.; Labuz, J.F.; Cheng, H.; Hou, R.; Zhu, W. Simulating progressive failure in fractured saturated rock under seepage condition using a novel coupled model and the application. Géoméch. Geophys. Geo-Energy Geo-Resour. 2022, 8, 42. [Google Scholar] [CrossRef] [Scilit]
  5. He, L.; Xiao, H.; Cui, Y.; Liu, S.; Chen, J. Review of visualisation methods of studying the seepage mechanism in fractured rocks. Géoméch. Geophys. Geo-Energy Geo-Resour. 2021, 7, 102. [Google Scholar] [CrossRef] [Scilit]
  6. Zhang, A.; Yang, J.; Cheng, L.; Ma, C. A simulation study on stress-seepage characteristics of 3D rough single fracture based on fluid-structure interaction. J. Pet. Sci. Eng. 2022, 211, 110215. [Google Scholar] [CrossRef] [Scilit]
  7. Chu, T.; Yin, Z.; Song, J.; Wu, J.; Wu, J. An efficient composite graph theory and machine learning method for estimating fracture equivalent permeability of the three-dimensional fracture networks based on topological parameters. J. Hydrol. 2025, 652, 132647. [Google Scholar] [CrossRef] [Scilit]
  8. Chen, X.; Shi, C.; Jia, Y.; Zhang, Y.; Ruan, H. Numerical study on seepage properties of rock mass with non-penetrating fracture using discrete element method. Int. J. Numer. Anal. Methods Géoméch. 2023, 48, 287–310. [Google Scholar] [CrossRef] [Scilit]
  9. Sun, K.; Liu, H.; Leung, J.Y.; Wang, J.; Feng, Y.; Liu, R.; Zhang, Y. Impact of effective stress on permeability for carbonate fractured-vuggy rocks. J. Rock Mech. Geotech. Eng. 2024, 16, 942–960. [Google Scholar] [CrossRef]
  10. Lian, Y.; Bui, H.H.; Nguyen, G.D.; Tran, H.T.; Haque, A. A general SPH framework for transient seepage flows through unsaturated porous media considering anisotropic diffusion. Comput. Methods Appl. Mech. Eng. 2021, 387, 114169. [Google Scholar] [CrossRef] [Scilit]
  11. Xue, K.; Zhang, Z.; Jiang, Y.; Luo, Y. Estimating the permeability of fractured rocks using topological characteristics of fracture network. Comput. Geotech. 2023, 157, 105337. [Google Scholar] [CrossRef] [Scilit]
  12. Huang, N.; Liu, R.; Jiang, Y.; Cheng, Y. Development and application of three-dimensional discrete fracture network modeling approach for fluid flow in fractured rock masses. J. Nat. Gas Sci. Eng. 2021, 91, 103957. [Google Scholar] [CrossRef] [Scilit]
  13. Li, Z.; Zhou, Z. Numerical Simulation of Rock Fracture and Permeability Characteristics Under Stress–Seepage–Damage Coupling Action. Int. J. Geomech. 2023, 23, 04022257. [Google Scholar] [CrossRef] [Scilit]
  14. Li, Z.Q.; Li, X.L.; Yu, J.B.; Cao, W.D.; Liu, Z.F.; Wang, M.; Wang, X.H. Influence of existing natural fractures and beddings on the formation of fracture network during hydraulic fracturing based on the extended finite element method. Geomech. Geophys. Geo-Energy Geo-Resour. 2020, 6, 58. [Google Scholar] [CrossRef] [Scilit]
  15. Yu, F.; Kong, X.; Yao, W.; Zhang, J.; Cai, S.; Lin, H.; Jin, J. Dynamics analysis, synchronization and FPGA implementation of multiscroll Hopfield neural networks with non-polynomial memristor. Chaos Solitons Fractals 2024, 179, 114440. [Google Scholar] [CrossRef] [Scilit]
  16. Jin, J.; Zhu, J.; Zhao, L.; Chen, L.; Chen, L.; Gong, J. A robust predefined-time convergence zeroing neural network for dynamic matrix inversion. IEEE Trans. Cybern. 2022, 53, 3887–3900. [Google Scholar] [CrossRef] [Scilit]
  17. Yu, S.; Ren, X.; Zhang, J.; Wang, H.; Sun, Z. An improved form of smoothed particle hydrodynamics method for crack propagation simulation applied in rock mechanics. Int. J. Min. Sci. Technol. 2021, 31, 421–428. [Google Scholar] [CrossRef] [Scilit]
  18. Xue, K.; Zhang, Z.; Zhong, C.; Jiang, Y.; Geng, X. A fast numerical method and optimization of 3D discrete fracture network considering fracture aperture heterogeneity. Adv. Water Resour. 2022, 162, 104164. [Google Scholar] [CrossRef] [Scilit]
  19. Zhu, W.; Khirevich, S.; Patzek, T.W. Impact of fracture geometry and topology on the connectivity and flow properties of stochastic fracture networks. Water Resour. Res. 2021, 57, 2. [Google Scholar] [CrossRef] [Scilit]
  20. Li, M.; Liu, R.-R.; Lü, L.; Hu, M.-B.; Xu, S.; Zhang, Y.-C. Percolation on complex networks: Theory and application. Phys. Rep. 2021, 907, 1–68. [Google Scholar] [CrossRef] [Scilit]
  21. Xu, Q.; Zheng, J.; Zhang, B.; Guo, J.; Yang, J. Quantitatively ranking the importance of fractures in seepage processes of rock masses: A complex network perspective. Phys. Fluids 2025, 37, 046604. [Google Scholar] [CrossRef] [Scilit]
  22. Artime, O.; De Domenico, M. Percolation on feature-enriched interconnected systems. Nat. Commun. 2021, 12, 2478. [Google Scholar] [CrossRef] [Scilit] [PubMed]
  23. Cañamón, I.; Rajeh, T.; Ababou, R.; Marcoux, M. Topological analysis of 3D fracture networks: Graph representation and percolation threshold. Comput. Geotech. 2022, 142, 104556. [Google Scholar] [CrossRef] [Scilit]
  24. Xia, B.; Luo, Y.; Hu, H.; Wu, M. Fractal permeability model for a complex tortuous fracture network. Phys. Fluids 2021, 33, 096605. [Google Scholar] [CrossRef] [Scilit]
  25. Jia, Z.X.; Wang, X.G. Calculation and application of connectivity rate for jointed rock masses containing oriented large fractures. Chin. J. Rock Mech. Eng. 2001, 20, 457–461. [Google Scholar]
  26. Handin, J.; Hager, R.V., Jr.; Friedman, M.; Feather, J.N. Experimental deformation of sedimentary rocks under con- fining pressure: Pore pressure tests. Bull. Am. Assoc. Petrol. Geol. 1963, 47, 717–755. [Google Scholar]
  27. Blanpied, M.L.; Lockner, D.A.; Byerlee, J.D. An earthquake mechanism basedon rapidsealing of faults. Nature 1992, 358, 574–576. [Google Scholar] [CrossRef] [Scilit]
  28. Handin, J. On the Coulomb-Mohr failure criterion. J. Geophys. Res. 1969, 74, 5343–5348. [Google Scholar] [CrossRef] [Scilit]
  29. Ma, Y.; Chen, M. Identification of gas outburst precursors based on outburst percolation theory. Sci. Rep. 2025, 15, 3228. [Google Scholar] [CrossRef] [Scilit]
  30. Mathur, G.K.; Jha, A.K.; Tiwari, G. Assessing fracture mechanics in thermally treated, uniaxial loaded grouted non-persistent medium-hard rock: A digital image correlation and FracPaQ analysis. Bull. Eng. Geol. Environ. 2025, 84, 172. [Google Scholar] [CrossRef] [Scilit]
Figure 1. Comparison diagram of fracture connectivity rate and complex network connectivity.
Applsci 16 00907 g001
Figure 2. Flow chart of network percolation analysis based on node damage values.
Applsci 16 00907 g002
Figure 3. Temporal Evolution of the Largest Cluster Relative Size.
Applsci 16 00907 g003
Figure 4. Analysis of fracture network evolution parameters.
Applsci 16 00907 g004
Figure 5. (ah) Fracture network evolution process.
Applsci 16 00907 g005aApplsci 16 00907 g005bApplsci 16 00907 g005c
Figure 6. Average degree of the largest cluster at all time steps.
Applsci 16 00907 g006
Figure 7. Average clustering coefficient of the largest cluster at all time steps.
Applsci 16 00907 g007
Figure 8. Permeability Analysis.
Applsci 16 00907 g008
Figure 9. Equivalent Stress error comparison.
Applsci 16 00907 g009
Table 1. Topological parameters of rock fracture network evolution at different time steps.
Time StepNumber of Connected ClustersTotal Number of NodesNumber of Nodes in Largest ClusterNumber of Internal Edges in Largest ClusterAverage Degree of Largest ClusterNetwork Density of Largest ClusterPercolation
11523500.800.200No
28616431120.770.026No
317839840161.100.028No
423354054201.350.026No
525558958210.760.013No
626561765231.400.022No
727163570320.940.014No
828066180241.660.021No
929366283302.510.031No
1030567582321.550.019No
1131568183302.060.026No
1232468683331.290.016No
1332968584321.250.015No
1433568284301.460.018No
1533766487331.430.017Yes
Table 2. The specific parameters of the model.
Parameters Value
rock elastic modulus (E)104 MPa
damage rate constant ( α )0.01
Poisson’s ratio ( ν )0.2
cohesion ( c i )2 × 10⁶ Pa
internal friction angle ( tan ϕ i )0.6
percolation threshold ( P c )0.3
Table 3. Permeability error comparison.
Calculated ValueFracPaQThis PaperError
Maximum Value4.9910 × 10−135.1986 × 10−133%
Minimum Value3.7636 × 10−134.0742 × 10−137%
Disclaimer/Publisher’s Note: The statements, opinions and data contained in all publications are solely those of the individual author(s) and contributor(s) and not of MDPI and/or the editor(s). MDPI and/or the editor(s) disclaim responsibility for any injury to people or property resulting from any ideas, methods, instructions or products referred to in the content.