Article

Improvement of Certain Composite Structures’ Quality by the Ultrasonic Field

Quality Engineering and Industrial Technologies Department, Faculty of Industrial Engineering and Robotics, National University of Science and Technology Politehnica Bucharest, Splaiul Independentei no. 313, 060042 Bucharest, Romania
*
Author to whom correspondence should be addressed.
Appl. Sci. 2026, 16(2), 781; https://doi.org/10.3390/app16020781
Submission received: 28 October 2025 / Revised: 9 December 2025 / Accepted: 13 December 2025 / Published: 12 January 2026
(This article belongs to the Topic Numerical Simulation of Composite Material Performance)

Abstract

This paper presents the activities carried out to improve the quality of certain composite structures by manufacturing them with the assistance of an ultrasonic field. As many composite materials use epoxy resins as base materials, an important problem was noted, namely their high curing time, as well as the problems of lack of adhesion and delamination, which are also known and experienced in the case of composite structures made with metallic materials as a support. The application of an ultrasonic field can successfully solve both problems. To demonstrate this improvement, the manufacturing of cylinders used in braking stands in the automotive industry was considered the main application. The proposed technology will be then extended to conveyor belts or to the manufacturing of other high-adhesion surfaces. This article presents the traditional method and the new ultrasonic field deposition technology. The design of the ultrasonic system is presented based on an analytical calculation, FEM modal analysis, followed by the construction of the ultrasonic system, as well as by bending tests and infrared thermography to demonstrate the advantages of presented method.

1. Introduction

1.1. About Research

This research refers to the applied study of the realization of composite structures based on epoxy resins, whose solidification process occurs in an ultrasonic field. The application of the ultrasonic field has proven to be very useful both in terms of reducing the time of the solidification process and in the adhesion improvement process of the composite structure deposited on a metallic support as well as of the quartz granule type reinforcing the elements in the base mass of the epoxy resin.

1.2. About Composite Structures

The composite materials that make it possible to create composite structures in an extremely varied range in the industry today have been studied for many years under different aspects, and the specialized literature is extremely rich. They are analyzed in turn and with great attention and depth, from the point of view of both the physical and the chemical mechanisms that underlie the production of basic materials, such as, for example, epoxy, phenolic resins, etc., as well as of the reinforcing materials present in an extremely wide range of the mechanisms that achieve adhesion improvement between them. Composite materials and the structures made from them are found in an impressive range of applications, from those in the aerospace industry or in military applications to those in the automotive industry, or in civil applications, to name just a few. In civil engineering applications, the effect of ultrasonic field propagation in aggregates was studied by Saad [1]. Also, in this field of research, since it is necessary to establish a monitoring system for the real-time evaluation of the curing process, the use of the ultrasonic field was taken into consideration. In several other research studies, the solidification process of resins was studied by using the propagation of ultrasound inside them [2,3,4,5]. In terms of the influence of the ultrasonic field on the solidification processes of metal alloys, many variants of the process have been studied [6,7,8,9,10,11], but all of them are valid outside the production of composite materials based on resins, epoxy, or phenolic resins.
The problem of creating composite structures by introducing particles as reinforcing materials was studied by Ouyang, Q. [12], who performed analyses regarding the relationships between the mechanical characteristics of the composites and the complex structure of the bonds located at the interface between the silicon carbide particles and the base matrix. The work of Güemes, A. [13] analyzes the classical methods of determining the quality of composite structures and presents a classification of them. The possible defects that can appear in the structure of composite materials by using NDT procedures are presented, as well as typical defects/damages in composite laminates such as delamination with internal ply failures, external wrinkles, foreign objects, internal and edge delamination, internal wrinkles, distributed porosity, and debonding. As a novelty, new methods of quality control are presented such as vibration methods, strain-based methods, guided waves, and acoustic emission. At the same time, Senthil A. [14] studies several types of defects that can appear in composite structures in terms of, very importantly, the mechanisms of their production as well as the effects they can produce. A review of the problems related to the defects in composite structures represents one of the main problems in this field and A. V. Hoa [15], among others, studied their delamination as part of the studies regarding the structural integrity of composite materials. Determining the quality of composite structures has also been undertaken by Waldemar Swiderski [16], by the thermography method, which is the method used in the research presented in his work. Monitoring the behavior of composite structures and their classification, the analysis of several methods of quality and integrity control has also been undertaken in the research performed by Hassani S. [17]. Problems related to the quality of composite structures are also considered by Groves R. [18] and Andrzej Katunin [19]. The problems related to the occurrence of mechanical stress in metal composite structures, which can lead to delamination, have been studied by Jang-Kyo Kim [20]. One of the important technological applications of the application of the ultrasonic field in the field of composite structures manufacturing refers to their influence on the epoxy or phenolic resins in which solid particles are embedded. The work of Birgit Bittmann [21] studies the uniformization of nanoparticles in the resin mass, the increase in resin temperature, the change in viscosity, and the influence of the production of ultrasonic cavitation bubbles. In another work, J. Sandler [22] studied the influence of the dissipation of carbon nanoparticles on the epoxy resin mass, which is the basis for the production of various components in the aviation industry. In the research carried out by Kovaleva EG [23], the ultrasonic processing of composite based on epoxy resin ED-20 filled with nanoparticle silicon-containing additives PDMS-5 and HDK during its preparation was analyzed. Next is the research of Liu Z. [24], who studied the introduction of ultrasonic energy and the production of the phenomenon of ultrasonic cavitation in the epoxy resin mass, which leads to the destruction of the connection through the physical interaction between molecules, thus accelerating the movement of the molecules. These effects reduce the viscosity, promote the crosslinking reaction, and accelerate the curing. In that work are presented, for example, the results of ultrasonic curing process, curing degree as a function of time, internal temperature curve of the adhesive by utilizing ultrasonic curing process, variation in the activation energy corresponding to thermal and non-thermal effects. In his work, Hui Wang [25] analyzed, for the case of the resin used in experiments, the internal temperature curve of the adhesive under ultrasonic vibration, tensile test, scanning electron microscopy, tensile strength, thermostability analysis, curing process analysis, dynamic mechanical analysis, all to study the influence of the ultrasonic field on the crosslinking process of the epoxy resin. Thus, Liu, Z. studied Curing Kinetics and the Mechanism of Ultrasonic Curing of an Epoxy Adhesive [24] and Andrzej Szewczak studied the influence of sonication and filler additives on the viscosity of the resin at a temperature of 22 °C, as well as the behavior of the interface between the epoxy resin and the related hardeners [26].
Considering all this, it is nevertheless found that applied technological research is quite poorly studied and presented, even though theoretical, demonstrative research is sufficient in this regard. The presented research aims to make contributions regarding the improvement of a real process, in industry, of manufacturing composite structures by activating the ultrasonic field during the solidification process of these. The research is based on the requirement of a manufacturer in the field to increase the quality of brake cylinders and reduce the solidification time of the resin + reinforcement materials mixture, therefore affecting the production costs. Of course, the results of theoretical and experimental research can be extended further to other types of composite structures that have as a base material the mixture of epoxy resins and related hardeners.

2. Current Technology for Manufacturing the Composite Structure of Brake Cylinders

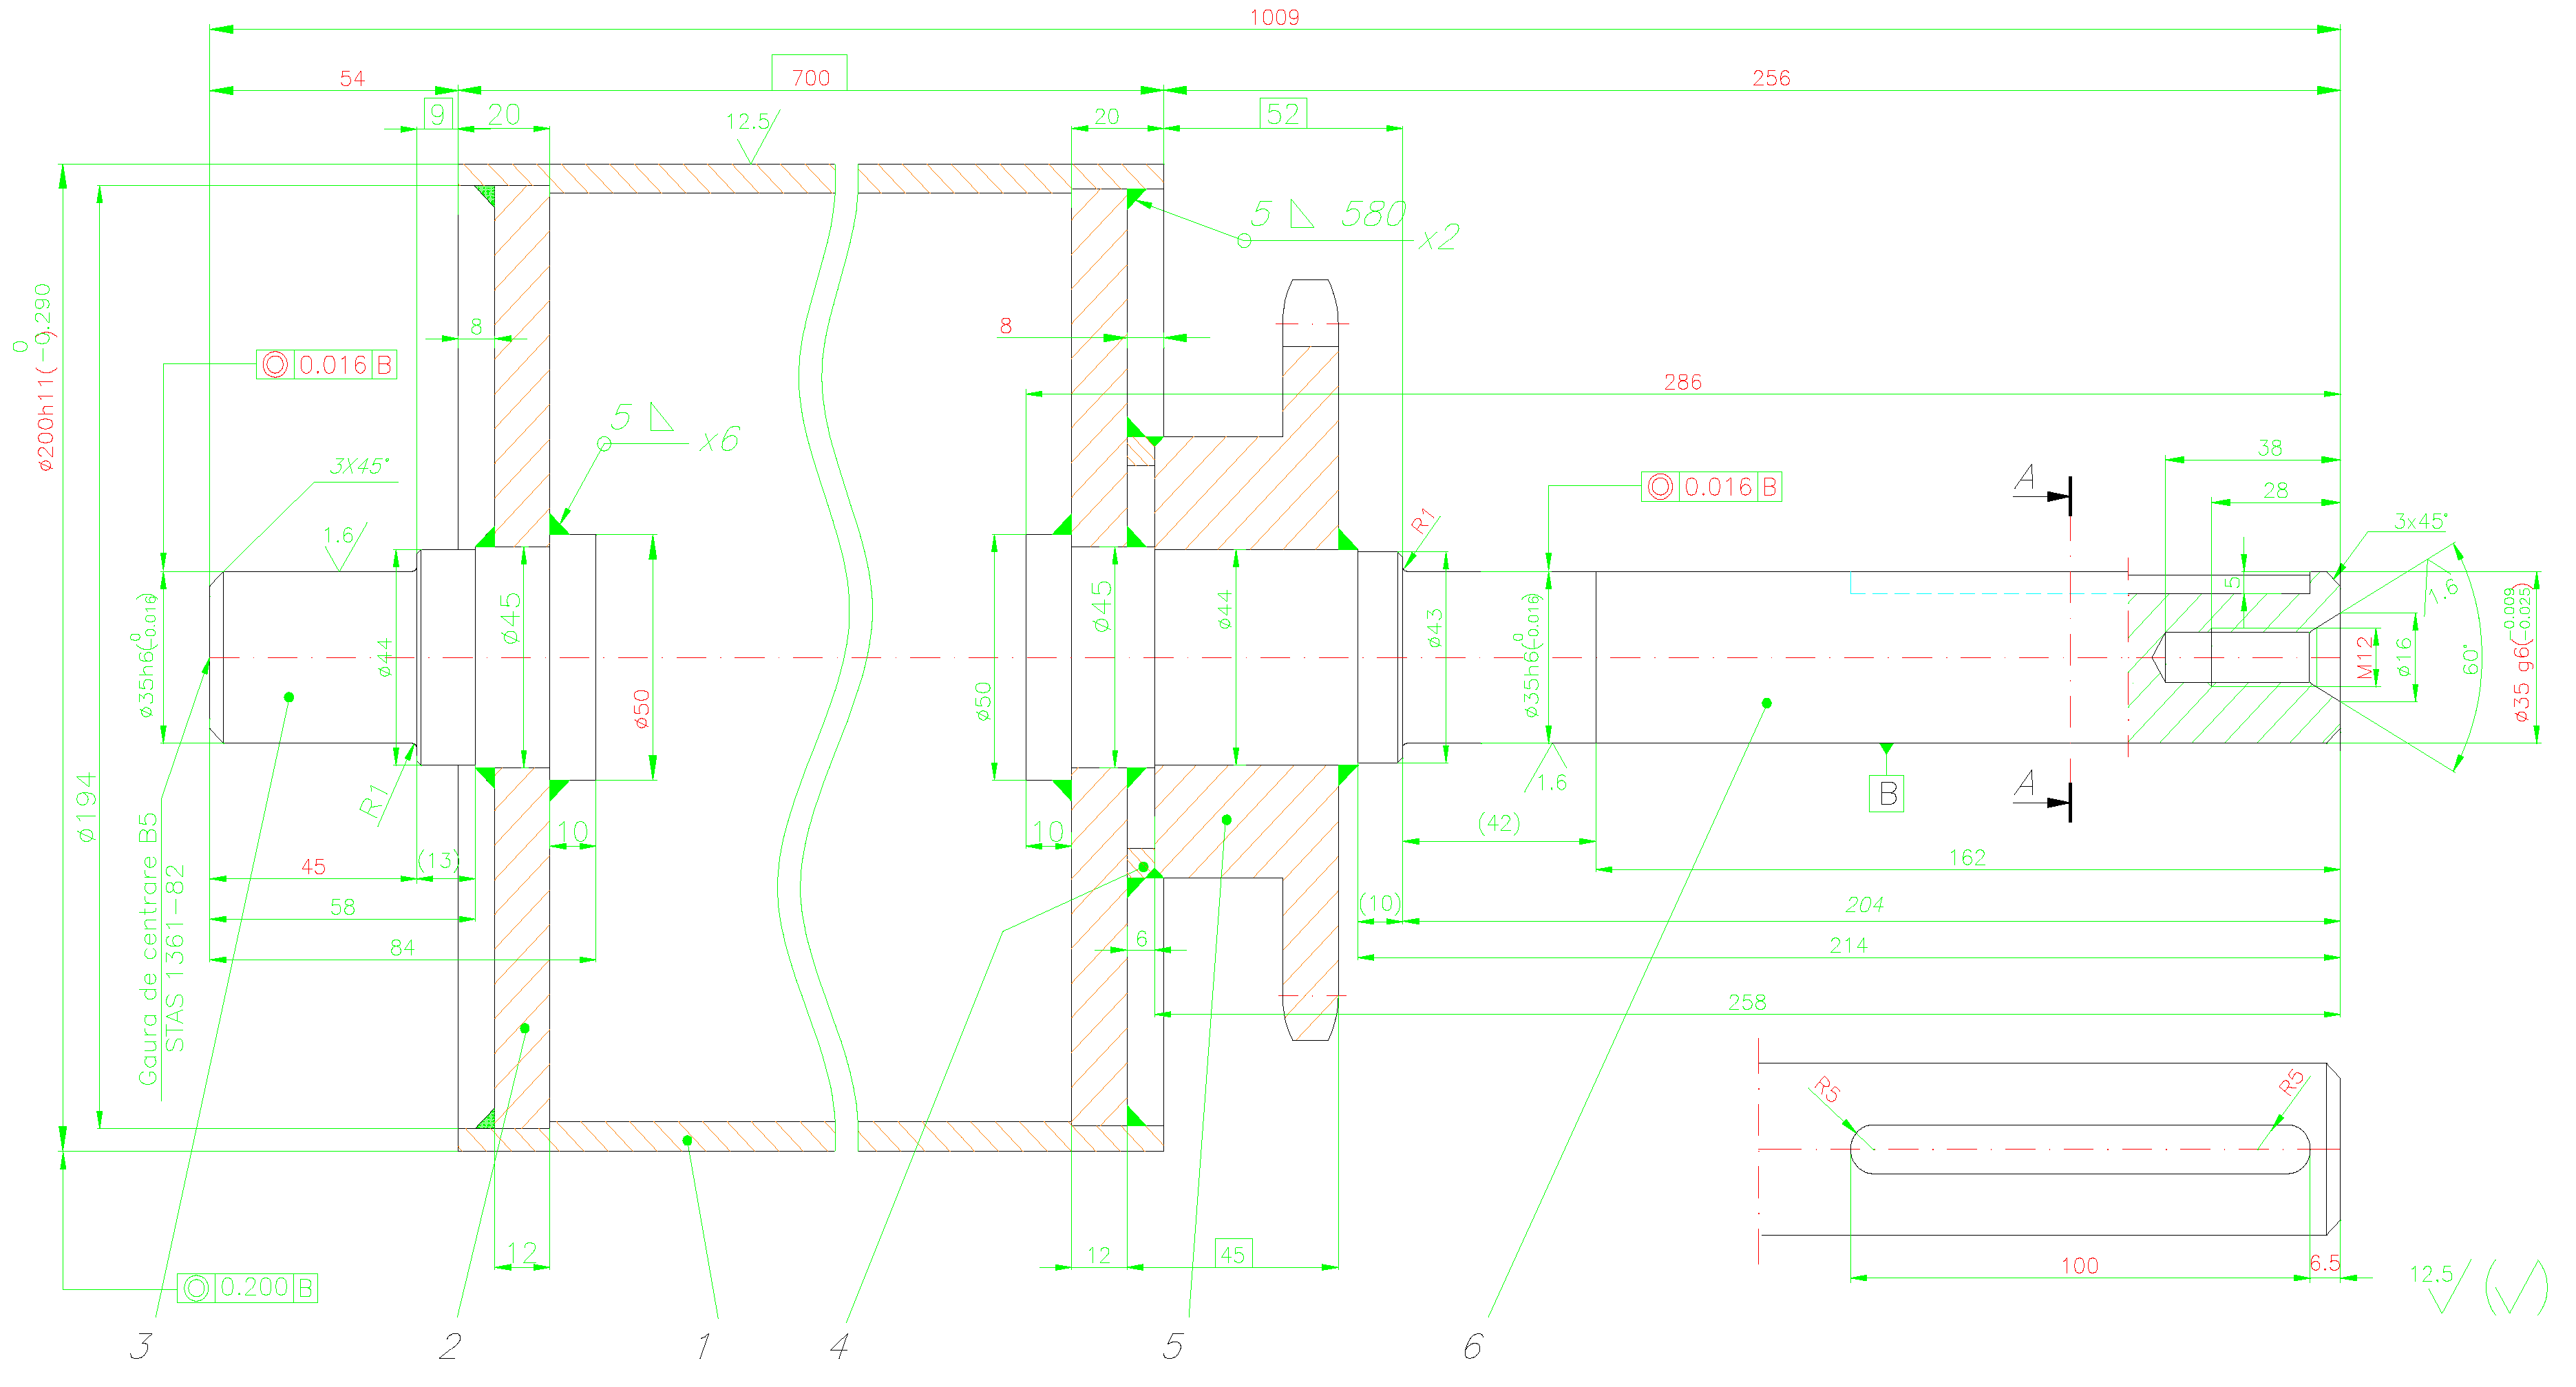
The research and experiments presented were aimed at improving the process of obtaining composite structures made on cylindrical metal surfaces, such as brake cylinders present in automobile inspection stands or as drive rollers used in conveyor belt systems. This research can be extended for any such composite structures made by deposition on metal surfaces, such as non-stick surfaces on vehicle loading platforms on ferries, on certain surfaces that require adhesion improvement on the road surface and on which high friction forces are manifested and are subject to difficult operating conditions. Research on the deposition of two layers of a composite structure was carried out using the surface of a cylinder whose execution drawing is presented in Figure 1, where the surface roughness of the metal cylinder is Ra = 12.5 μm.

2.1. Materials

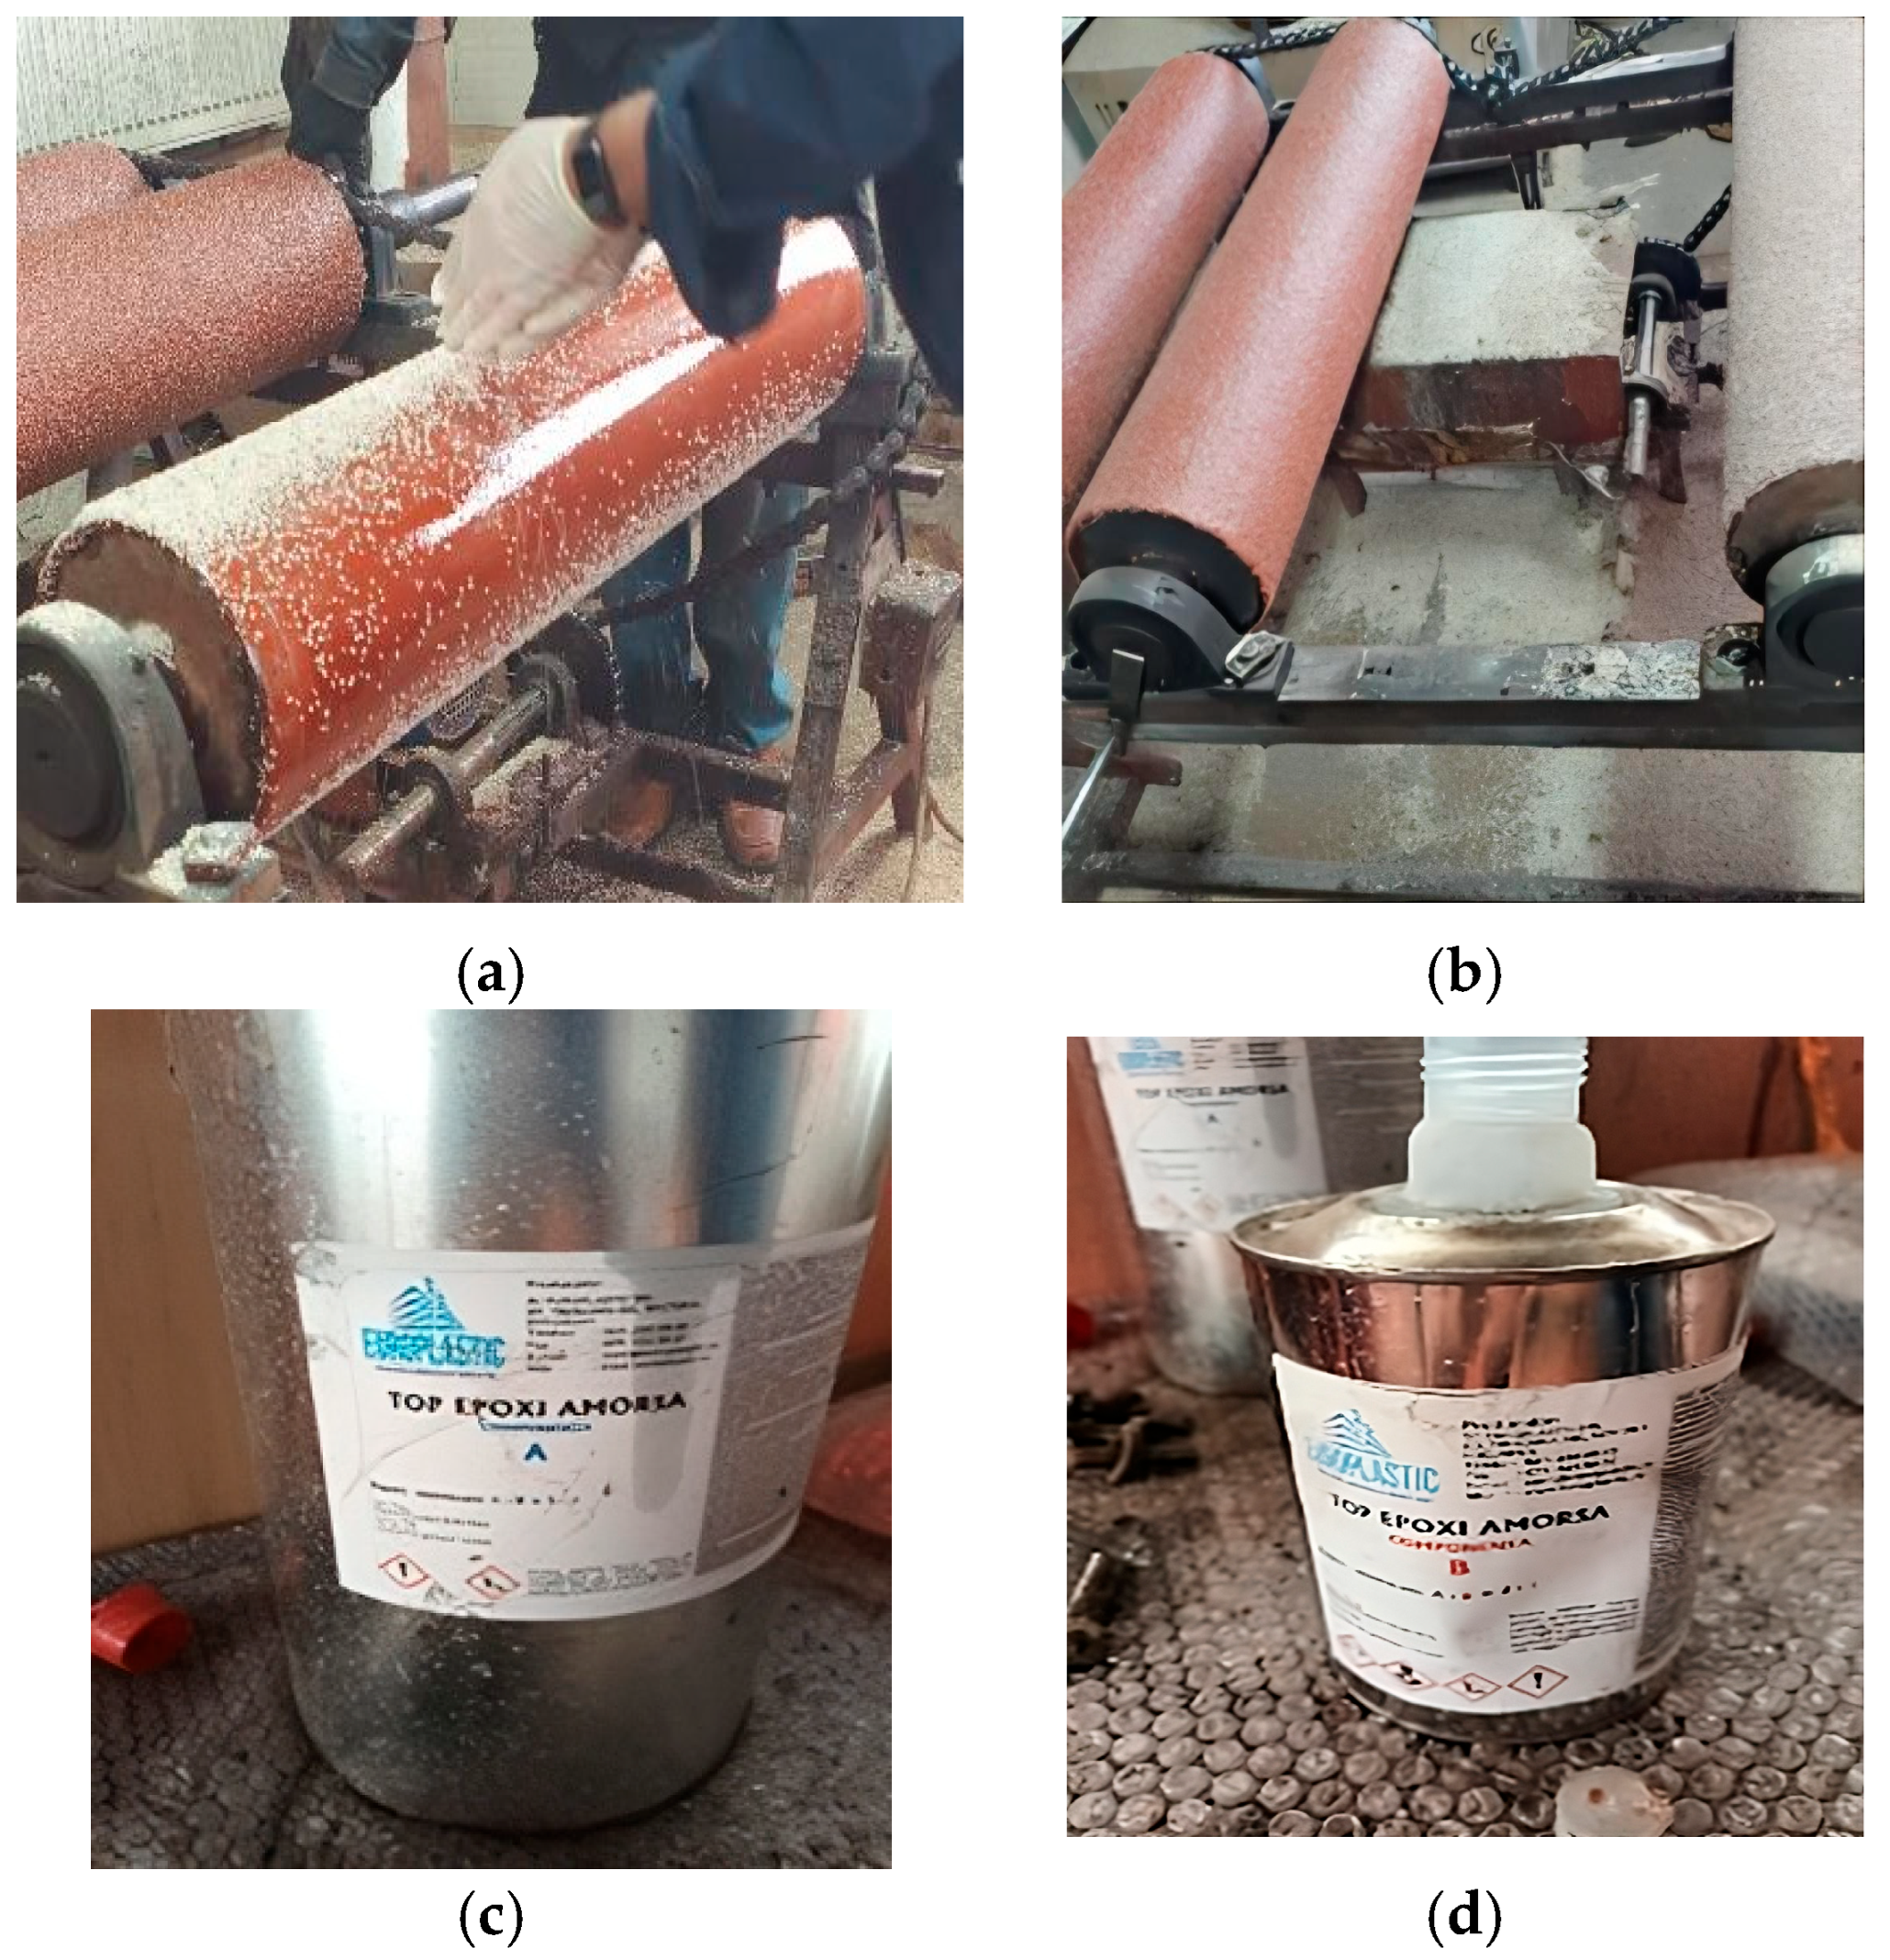
The composite structures made by depositing two layers of epoxy resin reinforced with quartz sand particles on the metal surface are as presented in Figure 2. The sizes of the quartz sand particles were selected from a range of 1–4 mm, the variant with sizes between 2–3 mm in a proportion of approximately 80% being considered the optimal one. In various studies, the effects of using quartz particles have been studied, but in general their sizes are much smaller than those used in the present study.
Thus, Masturi [27] studied the effect of quartz particles with dimensions of 0.94 microns in solid waste composite. Gupta [28] studied aluminum alloy-silica sand composites in which the quartz particles are between 90 and 180 microns. In his paper, [29] Sayed M. Derakhshani studied the properties of sand particles with dimensions between 300 and 600 microns. Also [30], Z. Bałaga studied composite structures in which the dimensions of the sand particles are a maximum of 0.2 mm. J. Aghazadeh Mohandesi studied in his research [31] sand particles with dimensions of 0.35 mm on the mechanical and micromechanical properties of a composite structure based on polyethylene terephthalate. Thus, the use of quartz particles with larger dimensions, approximately 2–4 mm, in defining composite structures is not very well documented, which makes the presented research a contribution in this regard. Taking this into account, the choice of the size of the quartz particles was made based on the needs and experience of the brake cylinder manufacturer. The use of small particles of approximately 1–2 mm contributes to reducing the coefficient of friction between the brake cylinder and the car tire. On the other hand, the use of larger particles of 4–5 mm leads to wear of the rubber or other materials with which the composite structure comes into contact, as well as the possibility of extracting quartz particles from the volume of the composite. Thus, Figure 2a presents the deposition process of the first layer of sand on the metal surface on which the first layer of epoxy resin was applied. Figure 2b presents the final product made by depositing the second layer of epoxy resin also reinforced with quartz sand particles. To manufacture the composite structure, a system consisting of an epoxy resin and the respective hardener was used, as presented in Figure 2c. The choice of the type of epoxy resin and the related hardener in carrying out the experiments was also based on the manufacturer’s experience in terms of quality and cost requirements, who provided the necessary quantities of resin and hardener. The manufacturer’s desire is to improve the production process by accelerating the solidification of the composite structure by the ultrasonic curing method.

2.2. Actual Method of Manufacturing Composite Structure of the Brake Cylinder

The two base layers of the composite structure were made using the epoxy resin and hardener provided by the manufacturer, in a 1:1 ratio. The classic technology for producing brake cylinders involves two distinct steps. In the first one, the resin and hardener mixture is deposited in a layer with a thickness of approximately 2 mm, on the metal surface of the cylinder, after which the cylinder is continuously rotated for approximately 8 h. In the second step, after the solidification of the first layer consisting of the resin layer reinforced with quartz sand particles with dimensions between 2–3 mm, the deposition of the second layer is performed by applying with a brush a layer of approximately 2 mm of the resin and hardener mixture, after which the deposition of the second layer of quartz sand is performed.
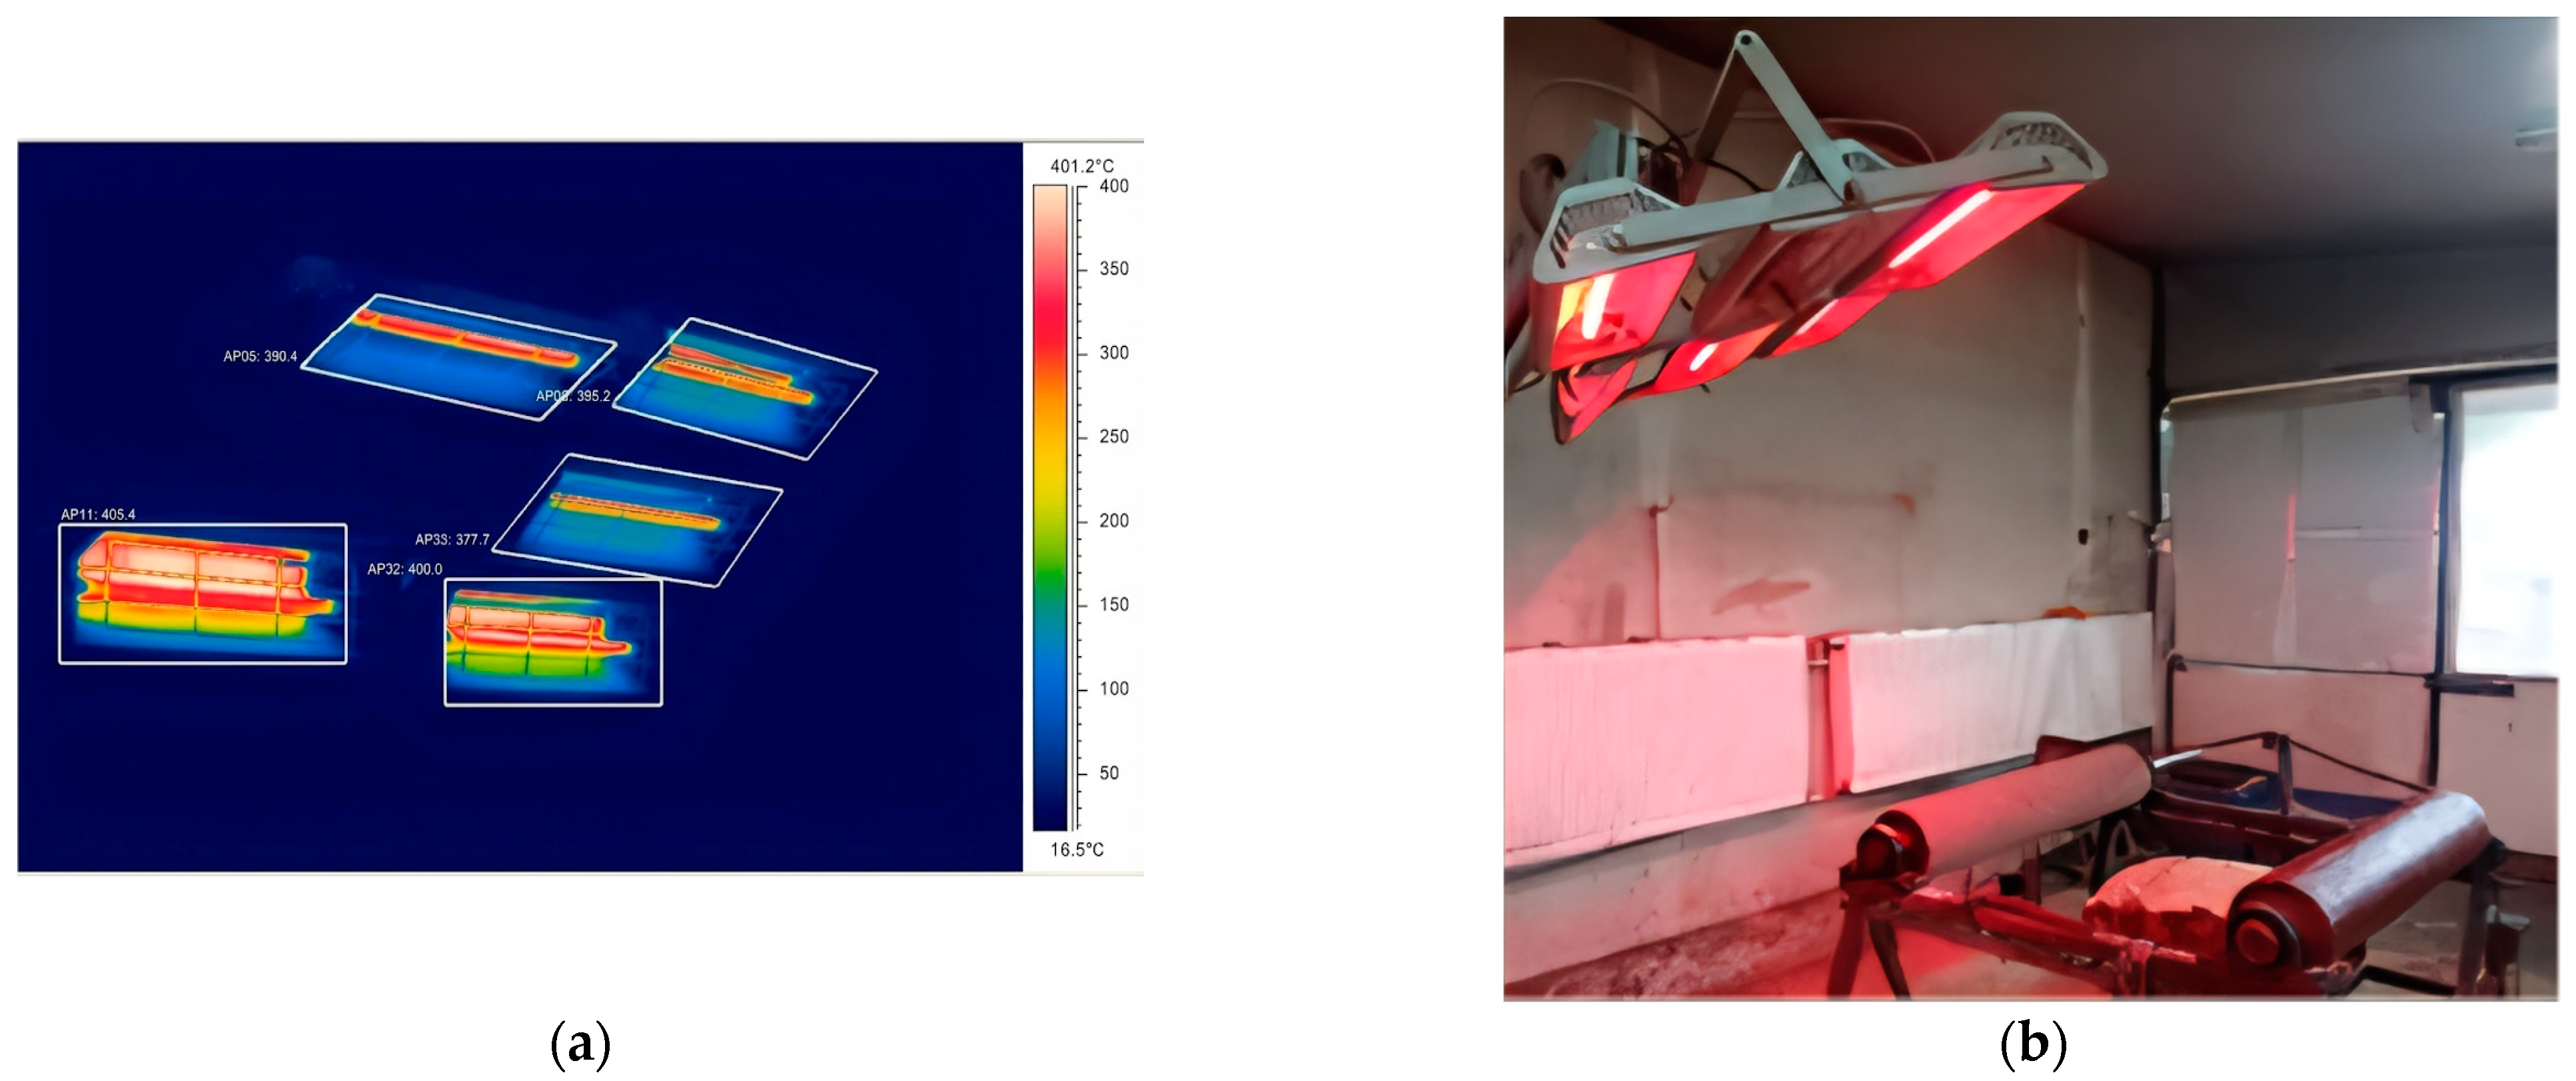
The solidification time, in continuous rotation, is also approximately 8 h. To maintain a relatively constant temperature T = 40 °C, the chamber is heated with a system presented in Figure 3. This additional heating system, which does not provide the desired results, can be eliminated by depositing the composite structure in ultrasonic field.
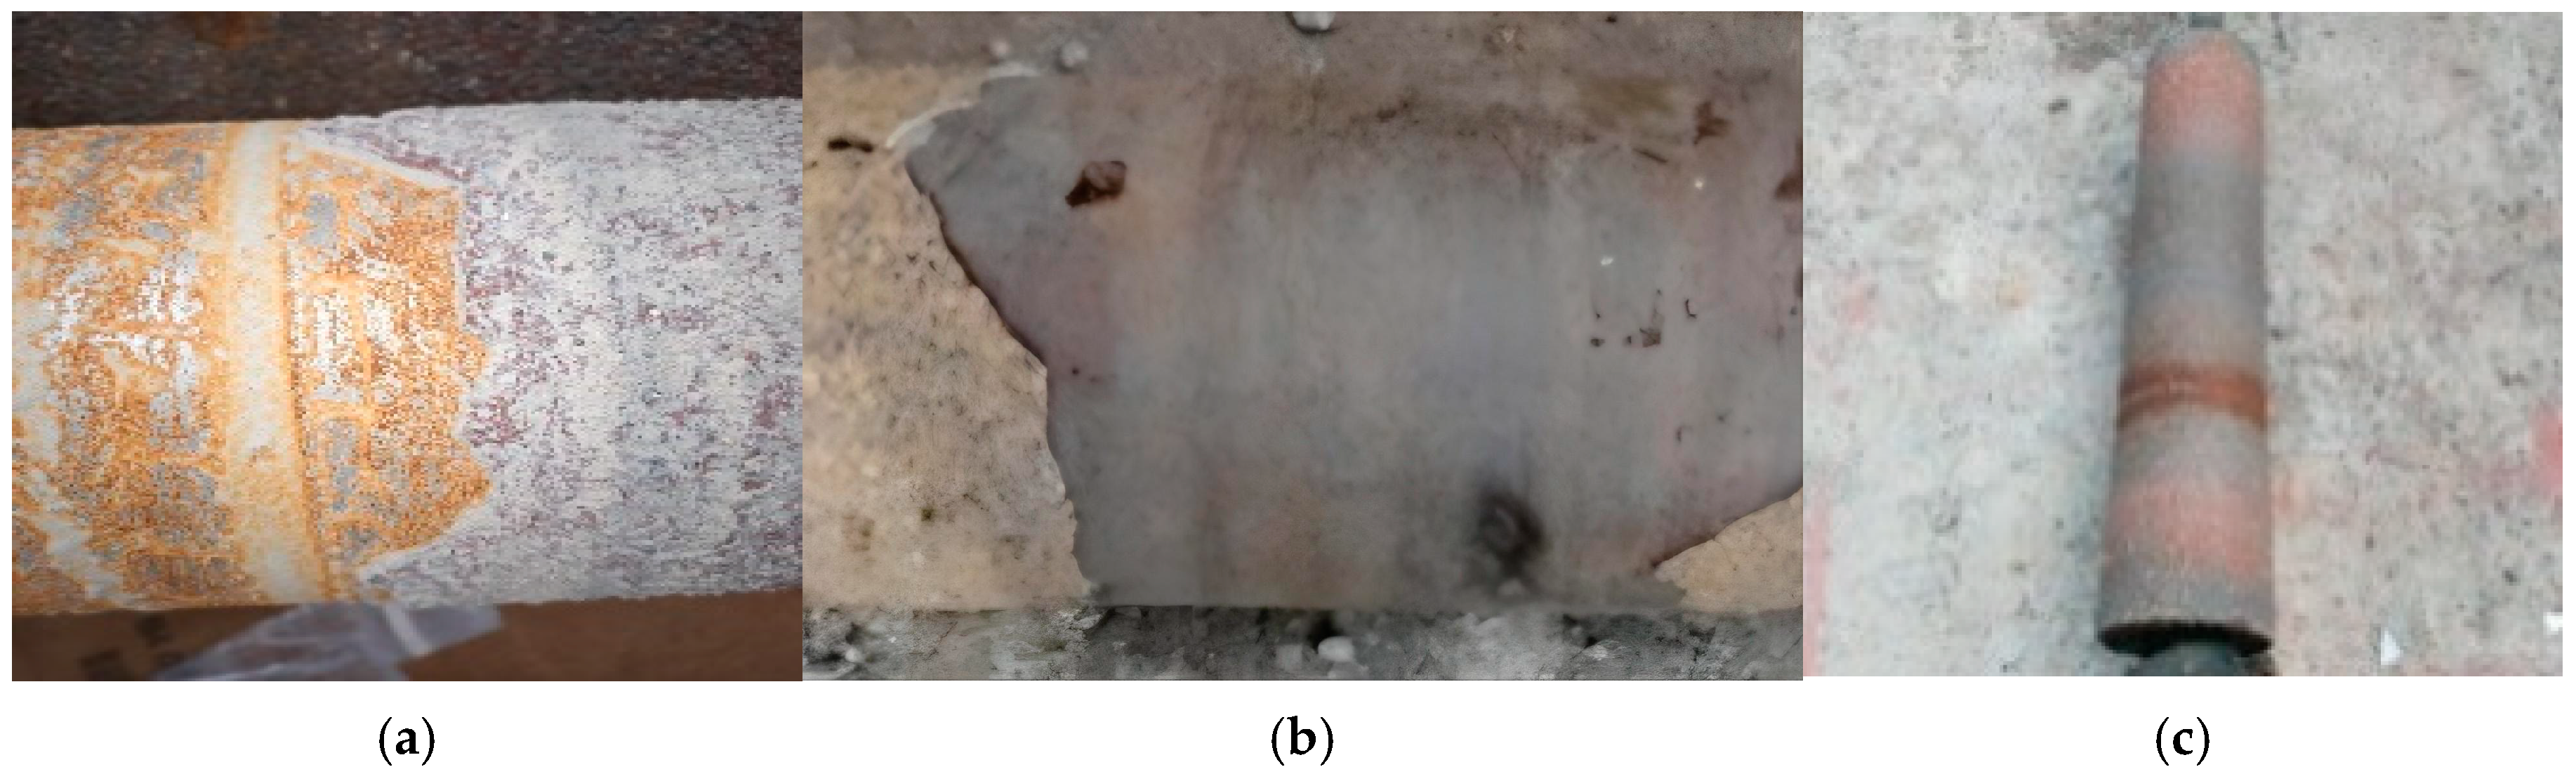
Unfortunately, often the quality of these types of composite structures is very low, so exfoliation occurs at the interface between the composite structure and the metal surface, or premature wear appears, as presented in Figure 4.

3. Mechanical Tests of Specimens Made from Composite Structures

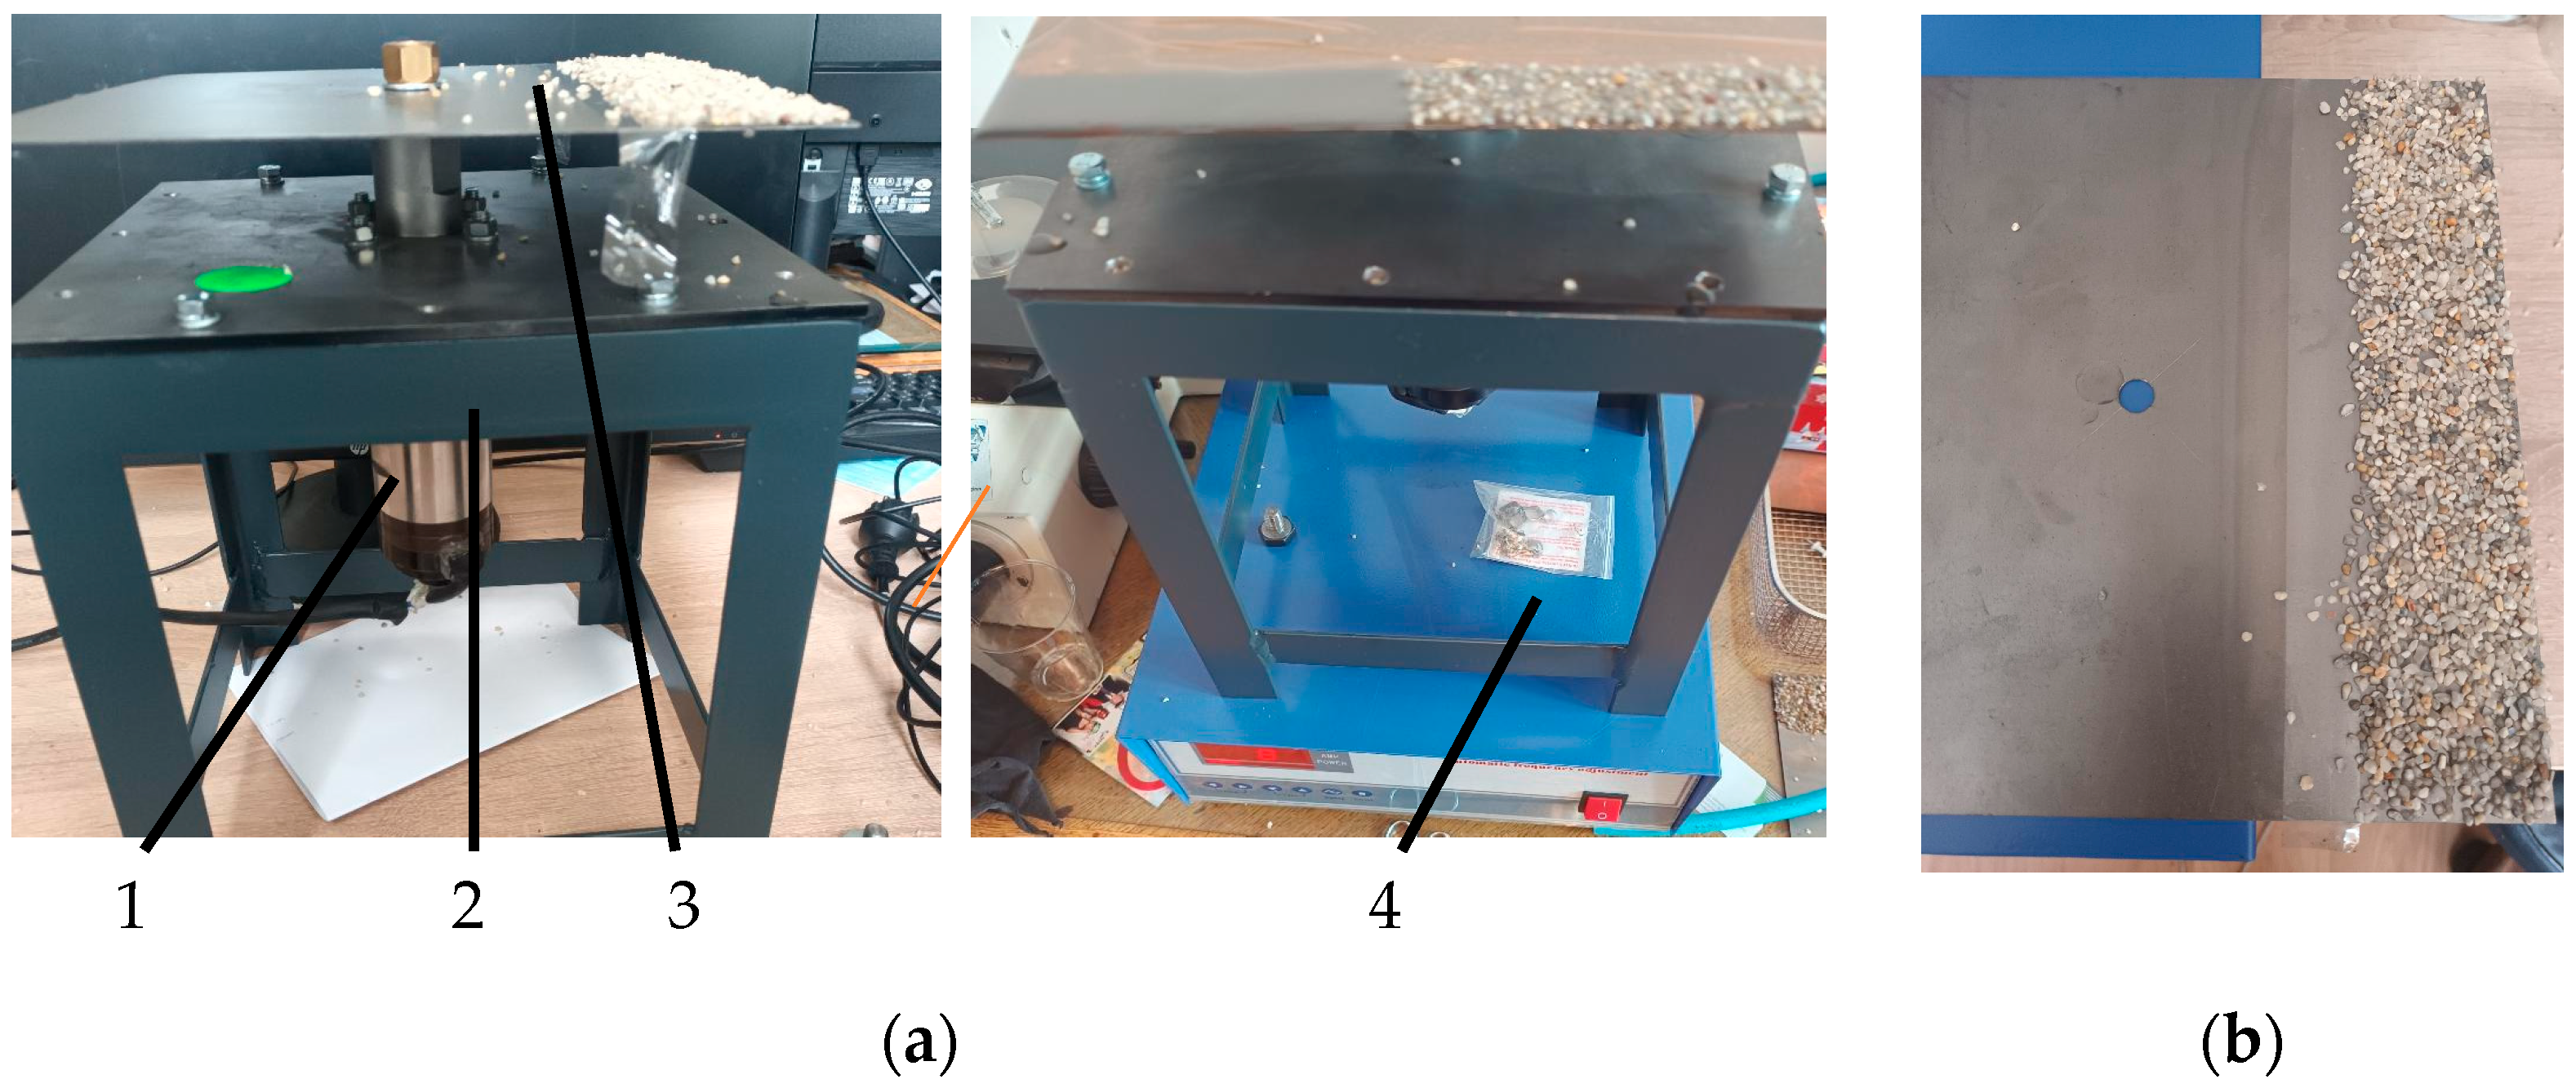
To experimentally demonstrate the efficiency of producing composite structures in an ultrasonic field, an experimental stand was first realized in which samples were produced using the same technology as that are used in production practice. The built stand consists of a metal frame on which the ultrasonic transducer was fixed in the nodal flange area. At the end of the ultrasonic amplifier area, where the amplitude of the oscillations is at the maximum, a 1 mm thick metal plate was fixed. On the surface of this metal plate, in a very similar way to the production of composite cylinders used in the automotive industry, two layers of epoxy resin mixture reinforced with quartz sand grains were deposited. The deposits were made in the form of strips which were subsequently cut to be tested for bending in three points. The composite structures were deposited on two metal plates, the first of which was used to create the structure without an ultrasonic curing system and the second plate for the deposition of the composite structure in ultrasonic field. The used ultrasonic system consists of four piezoceramic elements, the transducer reflector and its amplifier.
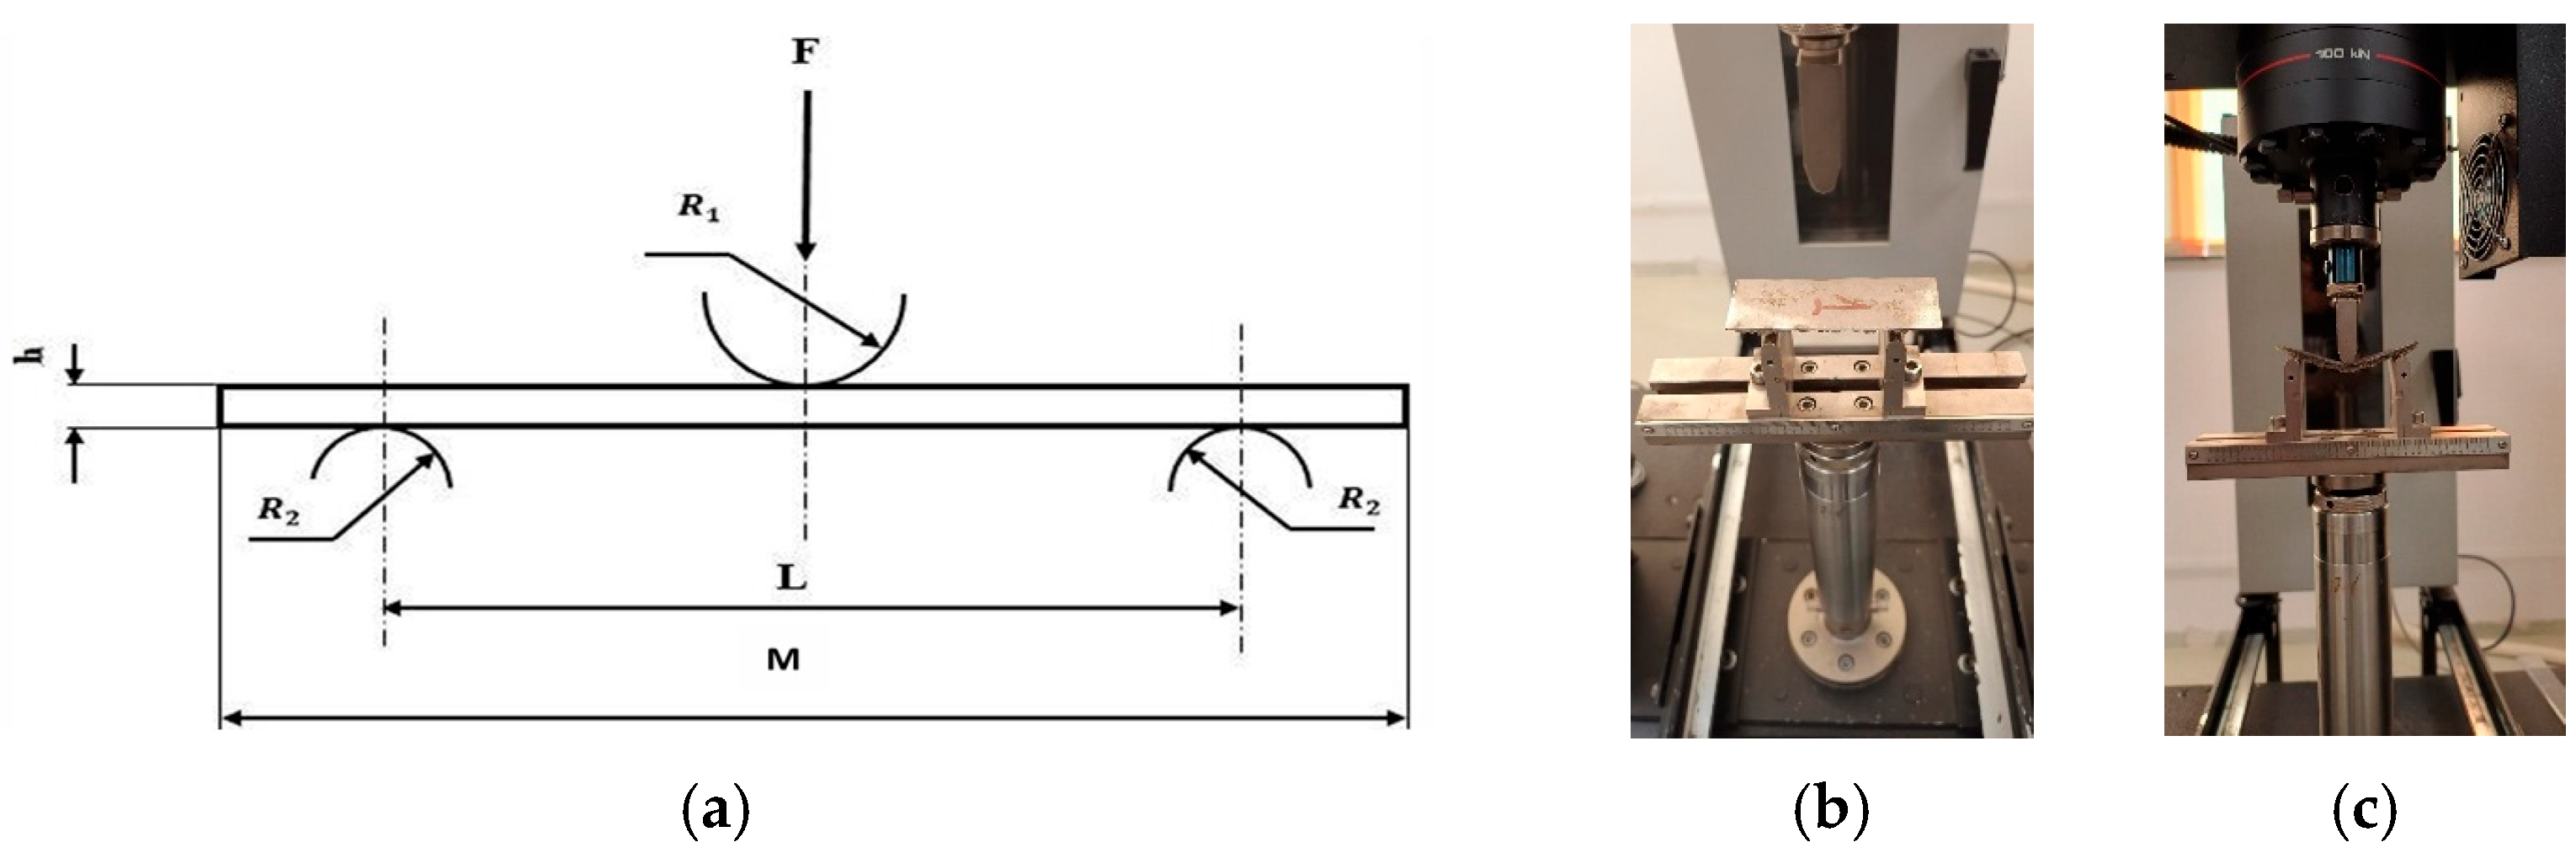
Figure 5b presents the manufacturing of the first layer of the composite made from the epoxy resin and hardener mixture, over which the first layer of quartz sand is deposited. The deposition is like the real process of making brake cylinders as shown in Figure 2a. After the second layer of metal plate was deposited, the probes used later for testing were cut. For the case studied, several bending tests were performed using the test scheme presented in Figure 6a. The three-point bending test was performed according to ISO Standard 178 (2003) [32]. This test scheme was used for both deposition technologies, namely by the classically used technology as well as by the new proposed technology in which the deposition is followed by the activation of a vibration field in the ultrasonic range. To perform the tests, the data presented in Figure 6 were used to perform the test; a force was applied by means of the upper punch which moved at a speed v = 2 mm/min. For the three-point bending test of the specimens formed from the metallic base material over which the two deposits were made, each consisted of a layer of resin + hardener mixture reinforced with quartz granules with dimensions of 1, 2, 3 mm. To perform the bending test, an INSTRON-type testing machine with a 100 KN force cell was used. This machine is presented in Figure 6. Thus, in Figure 6a, the three-point test scheme is presented. In Figure 6b,c, the placement and positioning of the specimen in the device, respectively, at a moment during the test, are shown.
From the practical realization of the specimens, a variable thickness of the samples was found but in a small range, of the order of a few millimeters, so that the thickness can be considered t = 6.5 mm. The distance between the supports was established at the value L = 78 mm as considered in Figure 6 and L = 107 mm. For the tests, two sets of specimens were considered.
Each set consists of two samples, one in which the solidification of the two deposited layers is performed in an ultrasonic field and one in which the solidification occurs naturally, without any external intervention. For this specimen, Figure 7a presents the first tested sample in an undeformed state and Figure 7b presents the sample in a deformed state, after the moment when the two deposited layers were detached from the metal base plate.
For the first tested sample, the solidification process was permanently accompanied by the vibrations of the ultrasonic field produced by the system shown in Figure 5. Following the bending test for the first specimen, two variation curves were drawn. The first of these shows the variation in the applied force as a function of the displacement of the punch and is shown in Figure 8a. As can be seen, the curve shows a relatively linear behavior up to a displacement of the punch of approximately 20 mm. After this, the sand particles, due to the relatively large displacements, start to slide off the surface of the lower supports and the curve shows some characteristic peaks.
In Figure 8b, also for this specimen, the stress-displacement graph is presented, which has a relatively uniform shape until the test is interrupted.
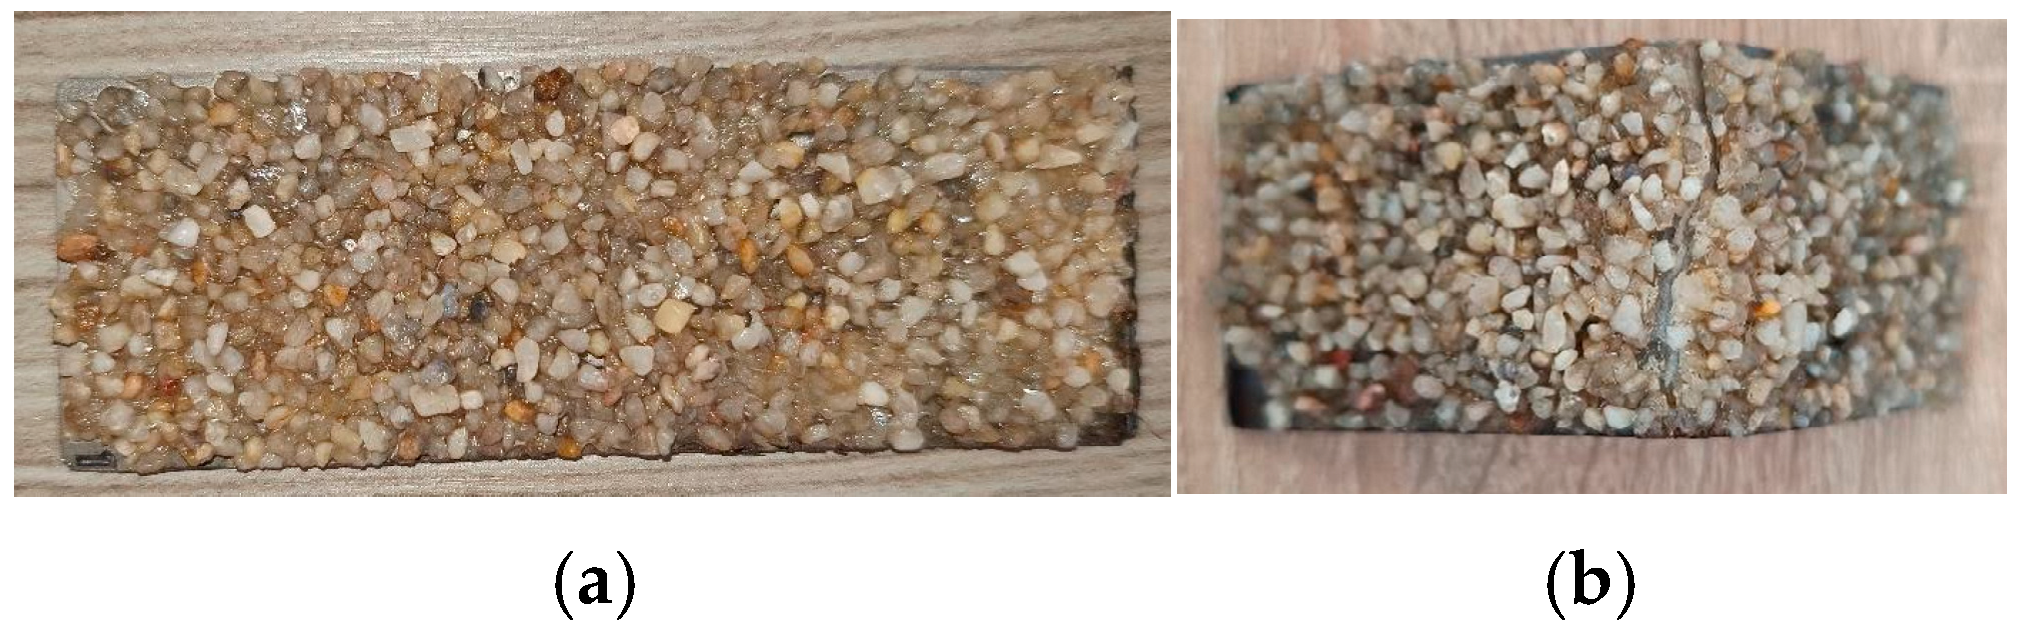
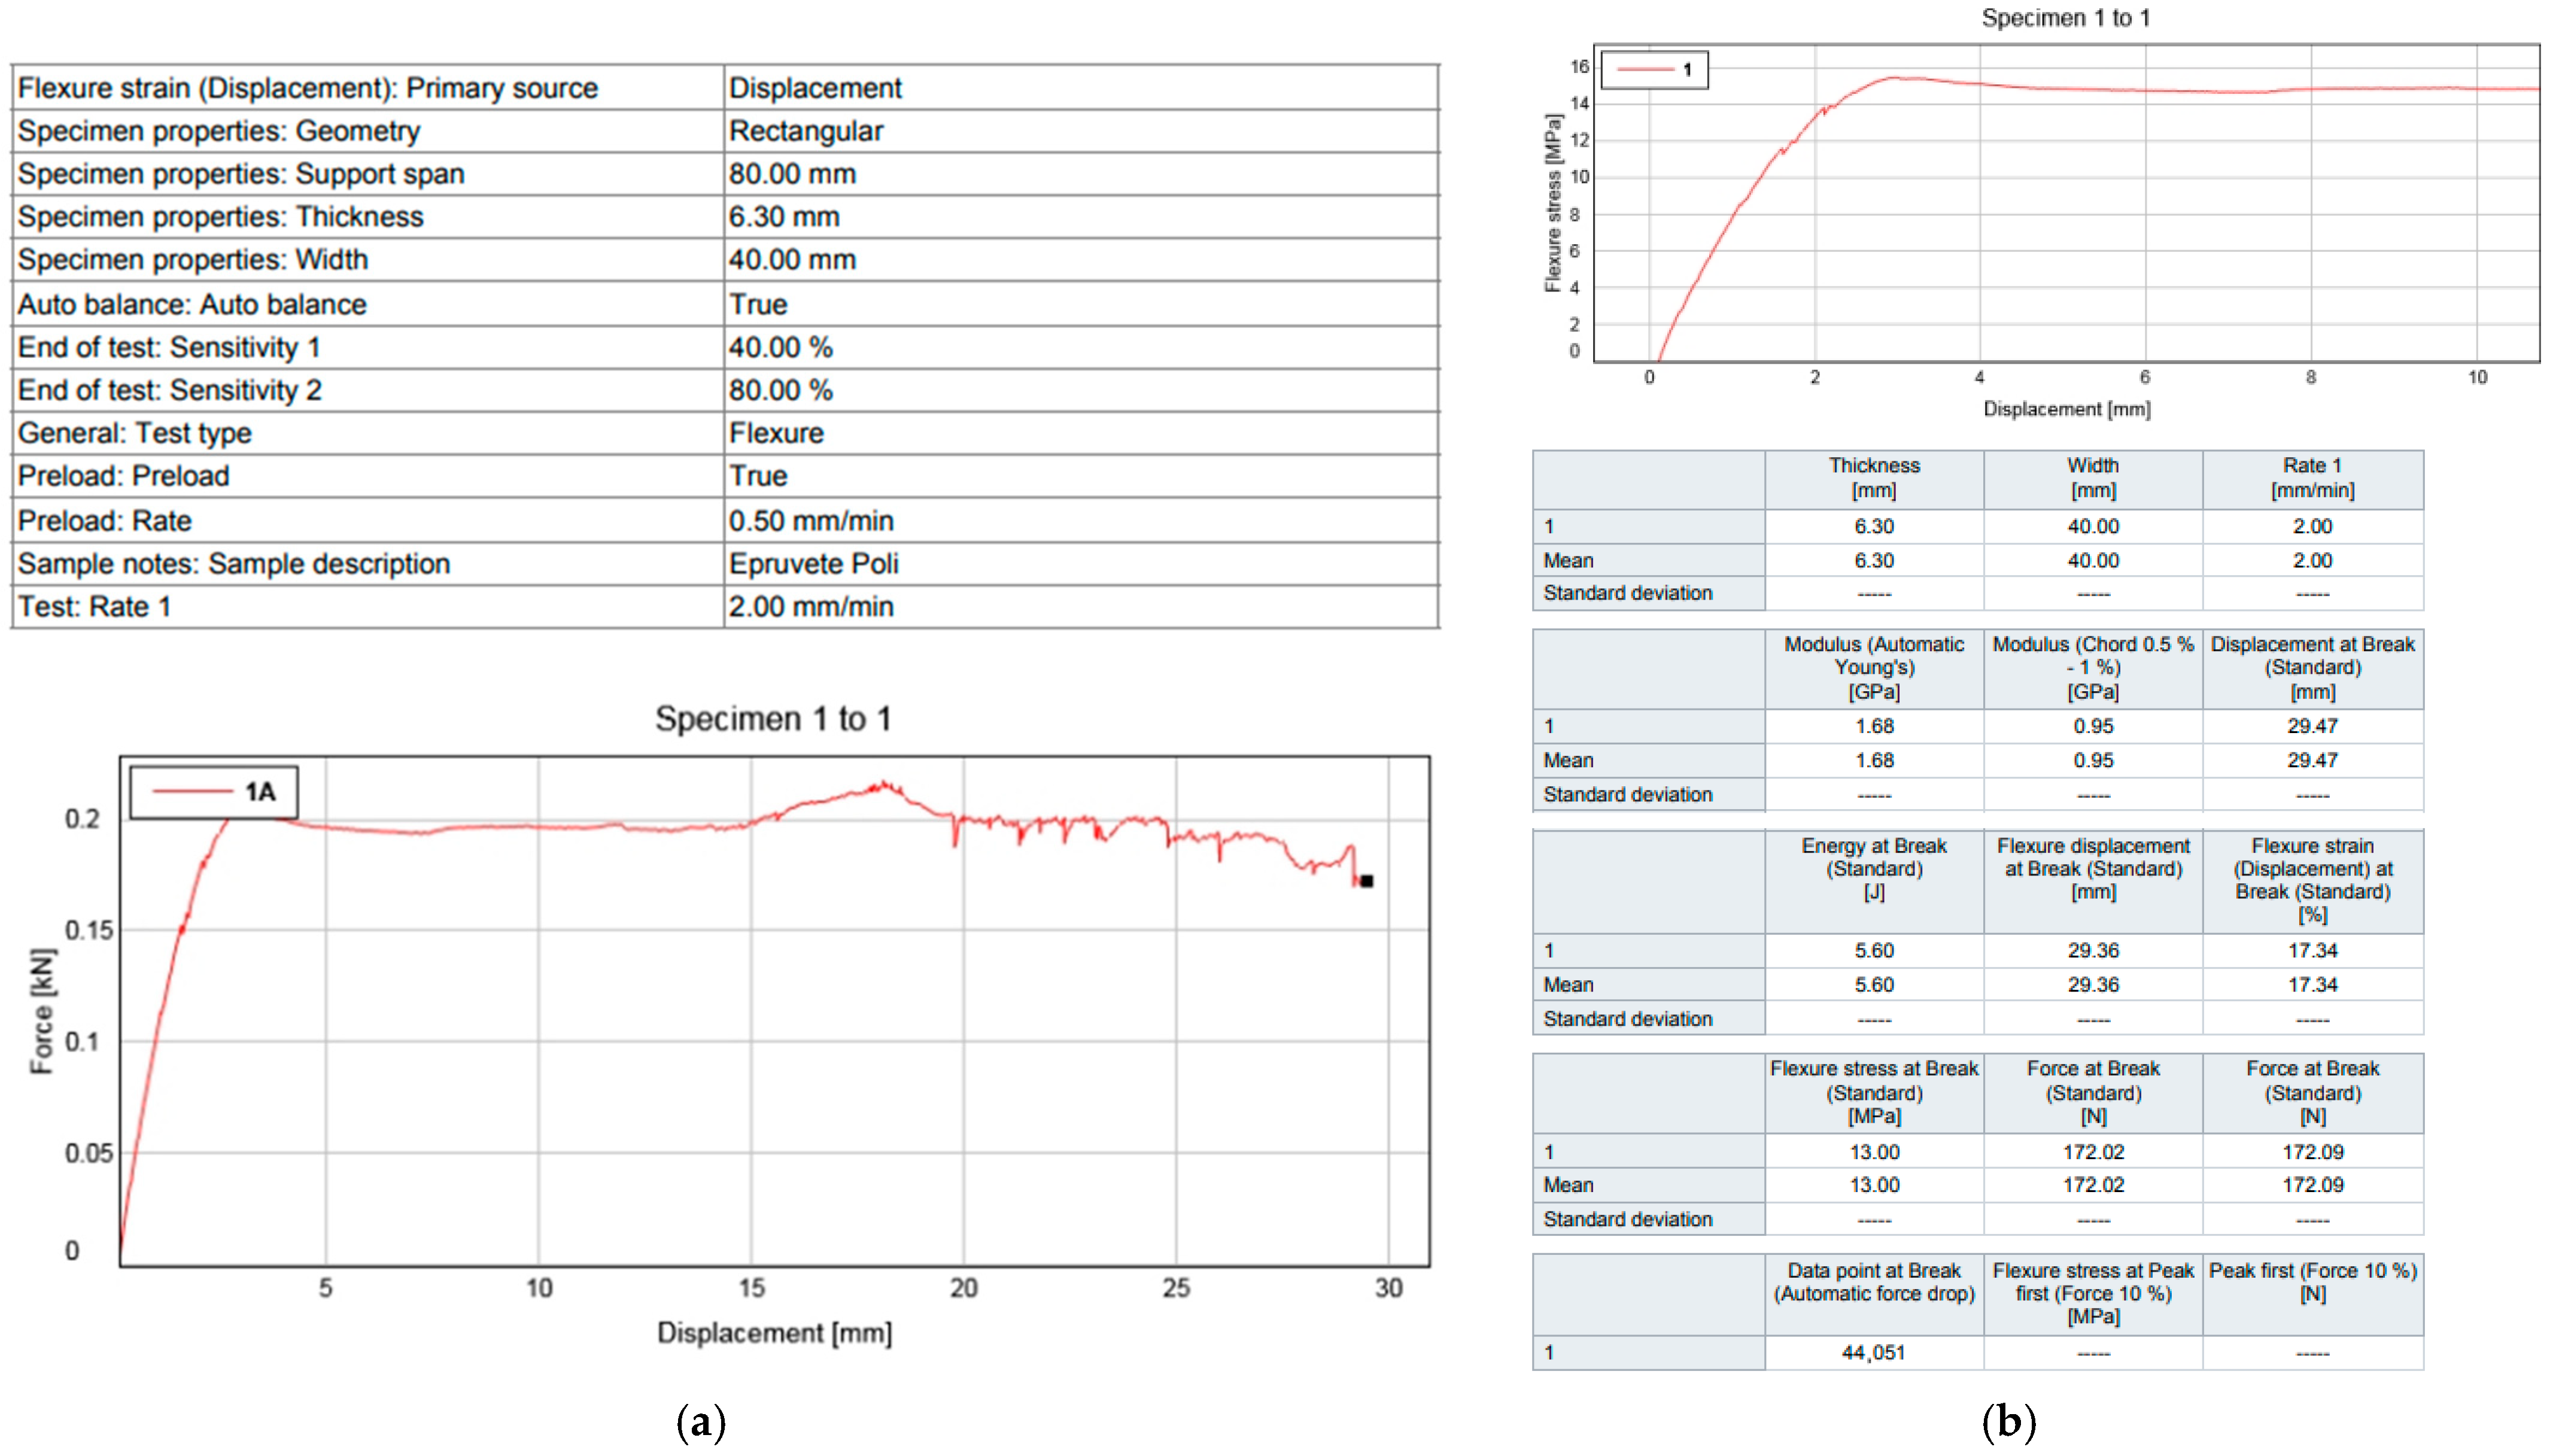
For the specimen from the first set whose deposition technology was the classic one, Figure 9a presents the image before the test and Figure 9b after the test where delamination of the deposited layer can be observed. For this specimen, Figure 10a presents the first curve, namely the force-displacement curve. Essentially, compared to the first specimen, the solidification of which was achieved by applying the ultrasonic vibratory field, a downward facing “peak” can be observed in this one (red circle), which is produced at the moment of failure of the resin layer mixed with the quartz sand that detaches from the surface of the metal support. This peak, produced at an approximate displacement of the punch of about 11 mm, does not occur in the case of the first specimen solidified in the ultrasonic field. So, essentially, this new technology produces a much better adhesion improvement of the composite layer on the metal support surface that prevents delamination. Figure 10b presents the displacement–flexure stress graph and the rapport associated with this.
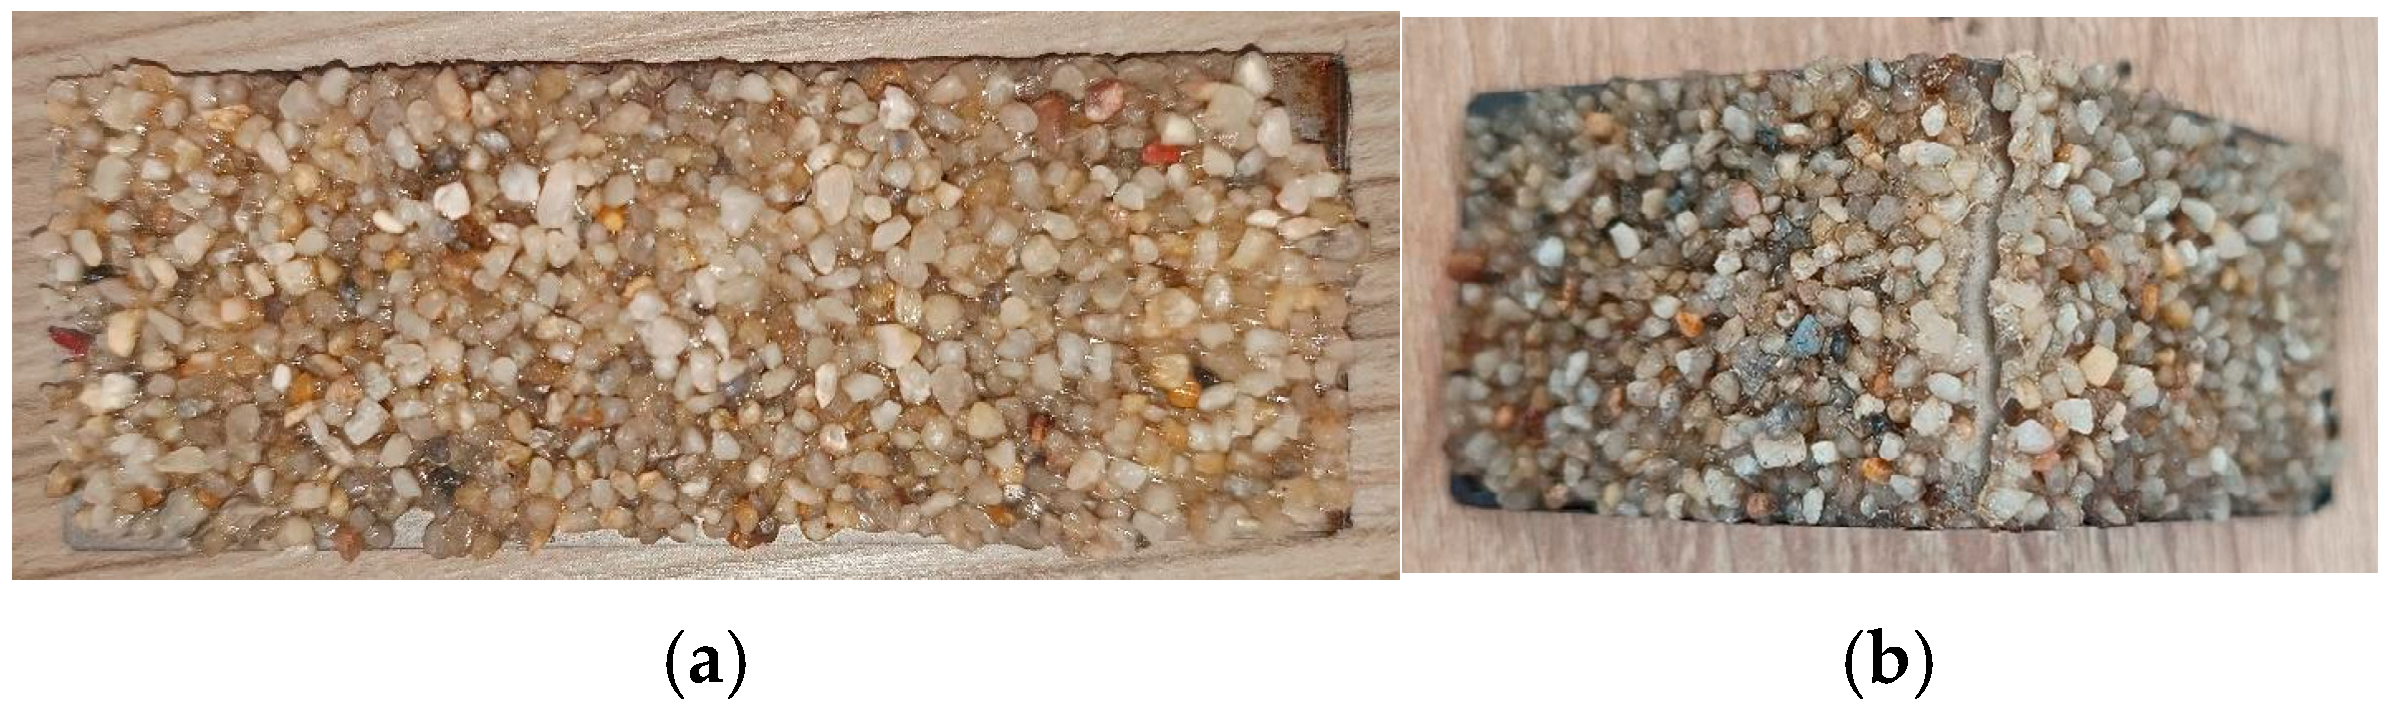
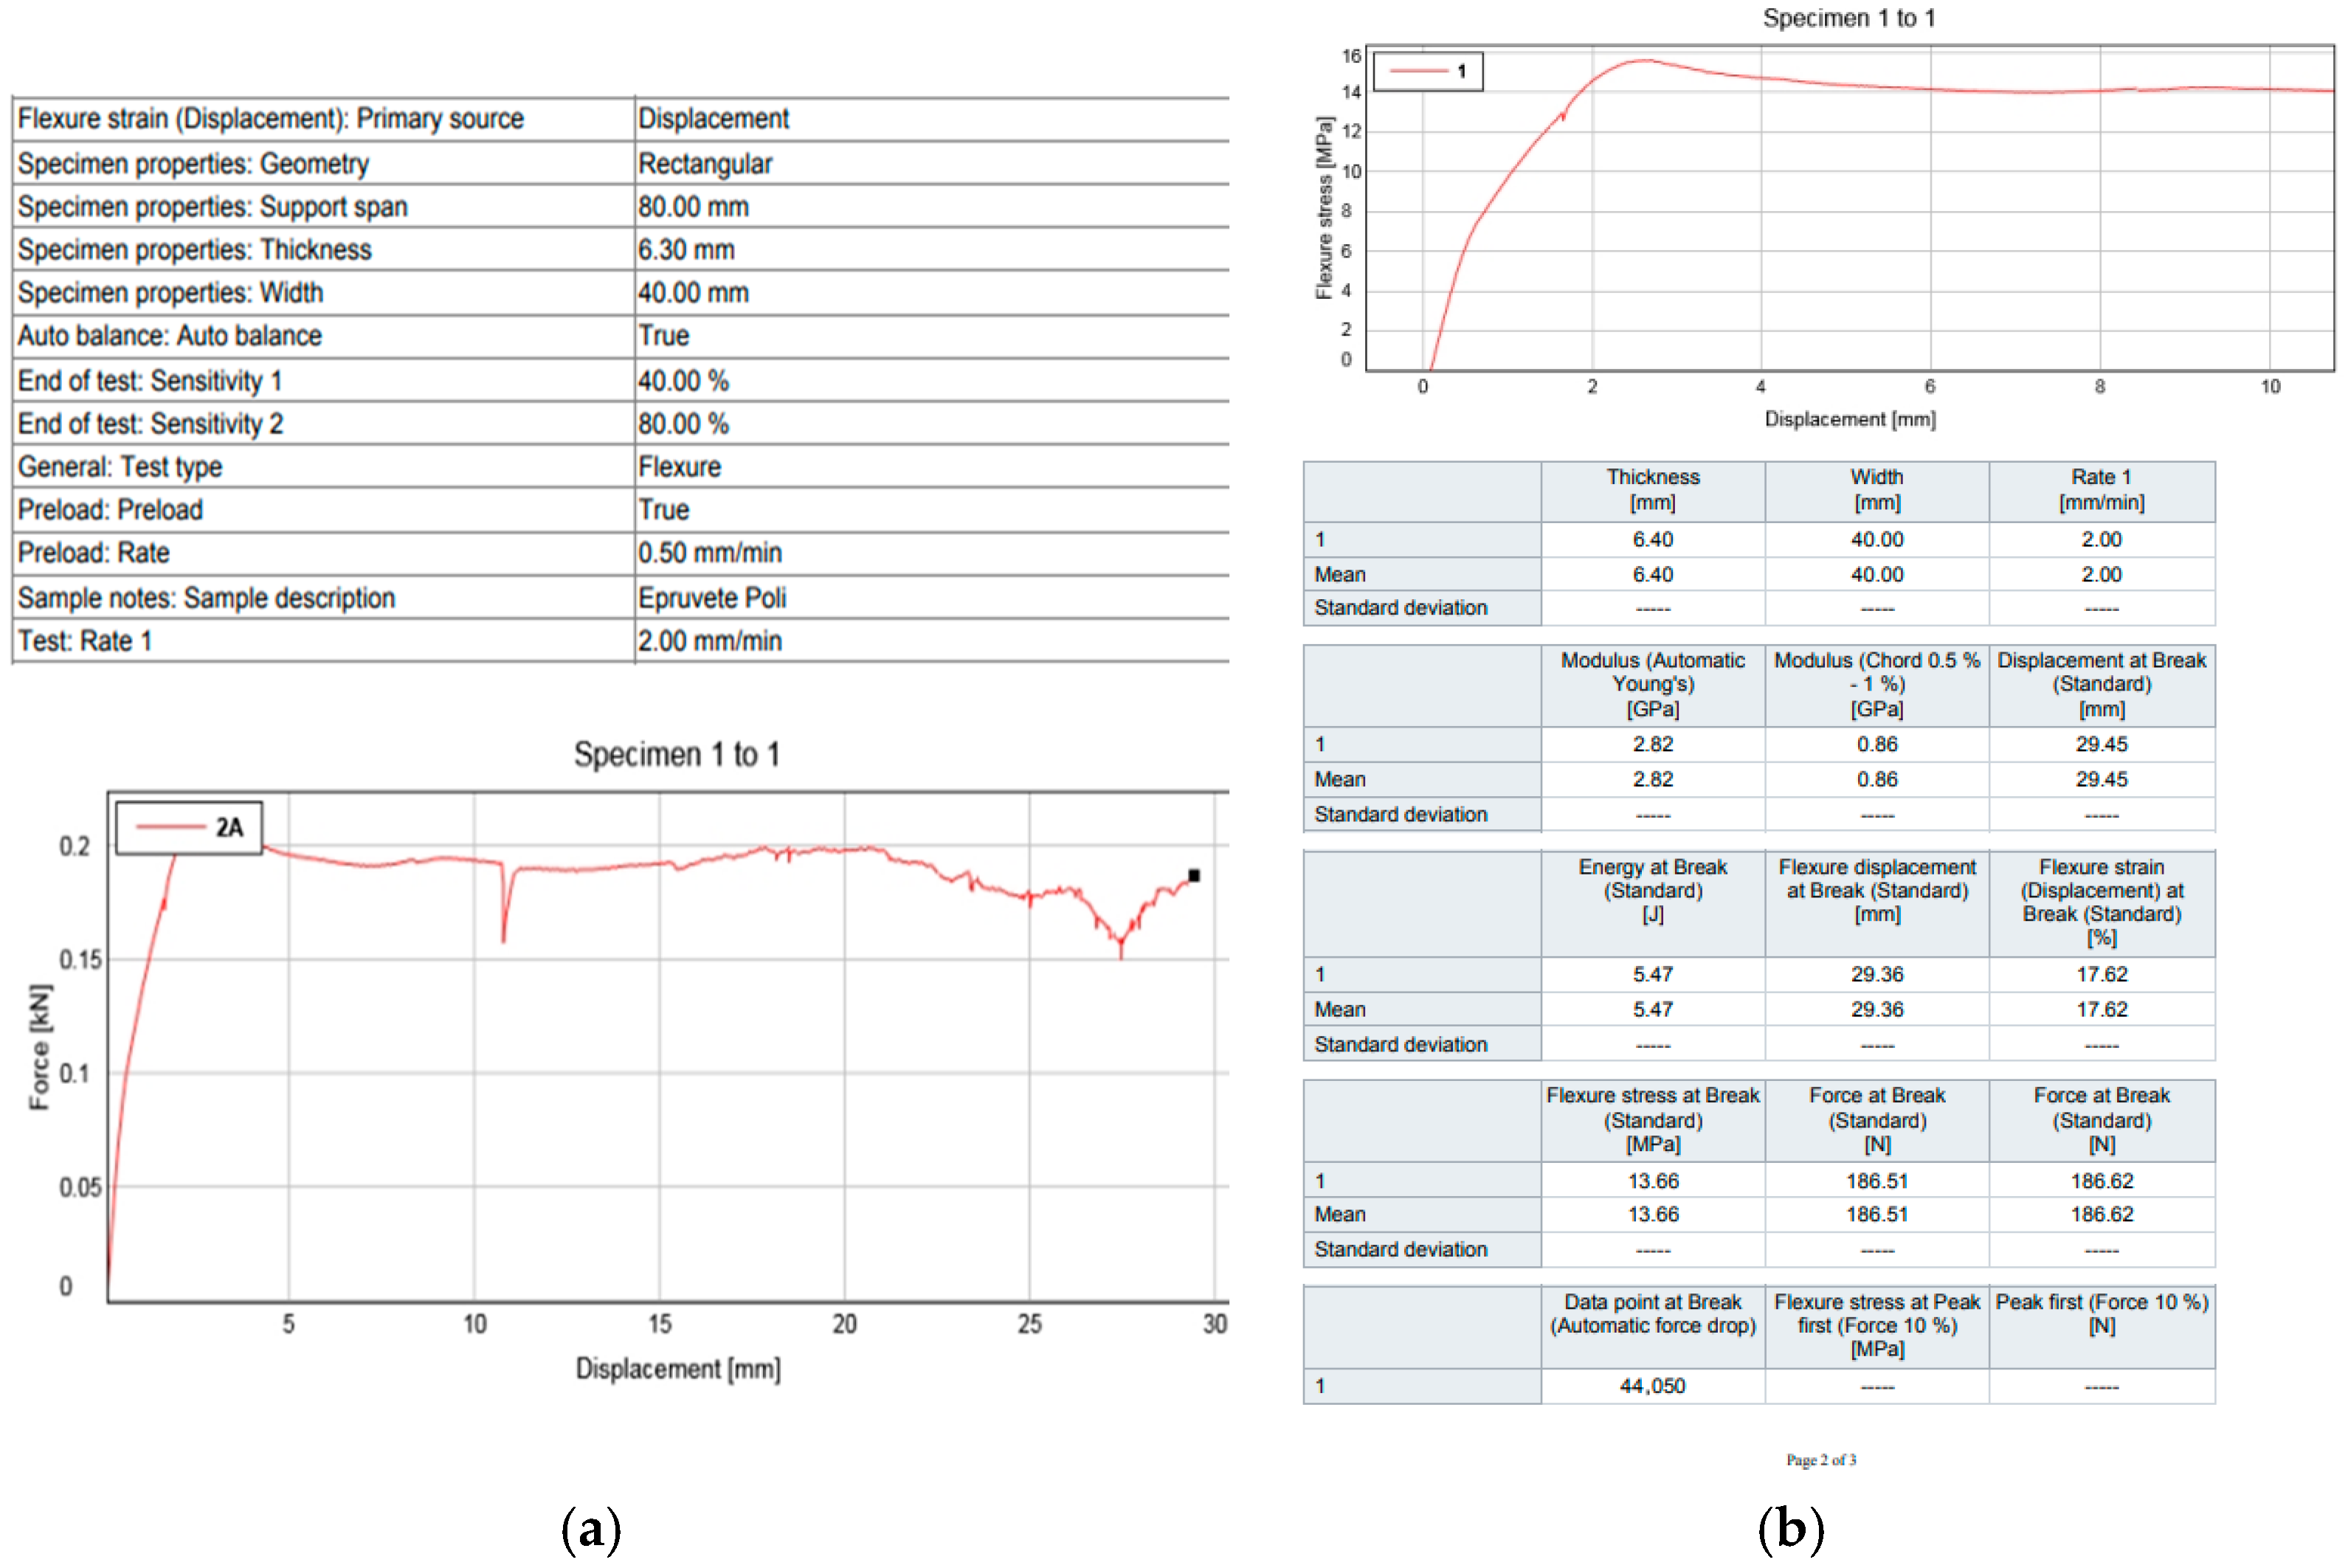
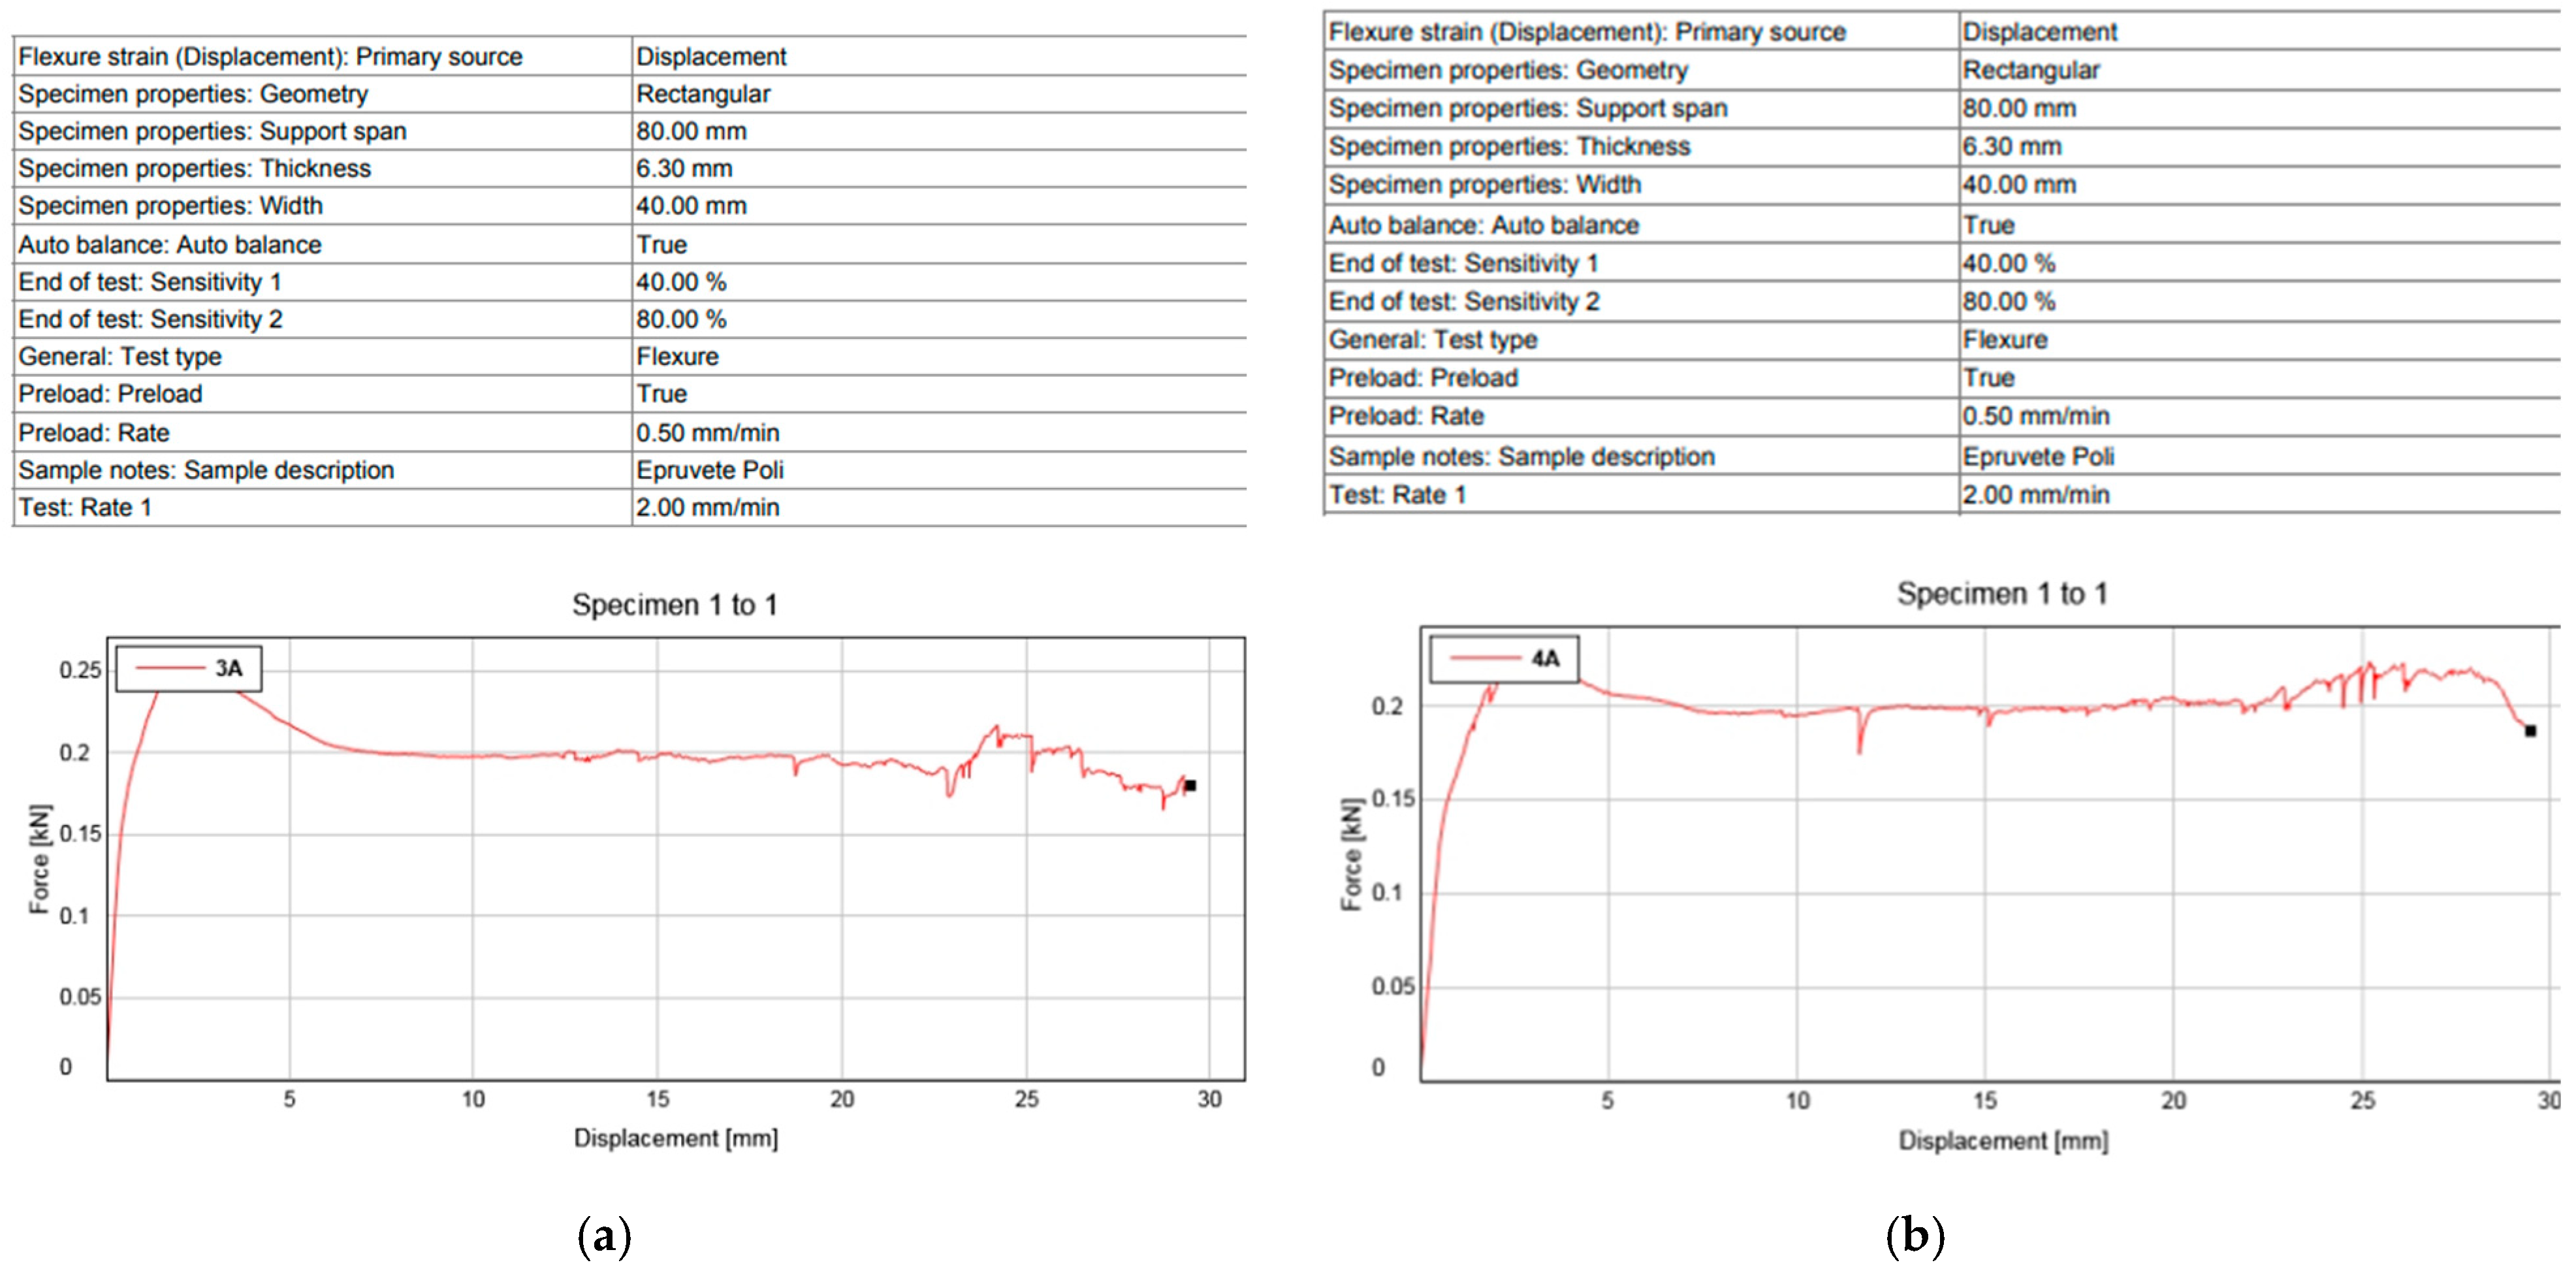
For the second set of specimens for which the bending test is performed, the corresponding diagrams are presented in Figure 11. Thus, Figure 11a presents the displacement–force graph for the specimen made using the ultrasonic curing method, a graph that shows a relatively continuous evolution, without unnatural jumps. Figure 11b shows the displacement–force graph for the specimen made using classical technology, where corresponding to a displacement of approximately 11 mm the graph shows a discontinuity (circled in red), a jump corresponding to the delamination of the composite structure from the base metal surface.
As can be seen in this second set of tests, the differences between the samples made by ultrasonic deposition and by classical technology are obvious. Starting from the encouraging results regarding the ultrasonic field production of composite materials, the next step was to design a dedicated ultrasonic system that will be used for the effective production of brake cylinders. The analytical calculation to realize the dimensional design of the main elements of the piezoceramic transducer represents a very important step in the realization of the entire ultrasonic assembly. To calculate and size the ultrasonic system, according to [33,34], in the first step the initial data necessary to solve the equations describing the vibrational behavior of piezoceramic materials are entered, namely [35,36,37]: material permittivity— ε 0 = 9.69   × 10 11 [F/m]; resonance frequency—f0 = 20,000 Hz; resonance pulsation— ω 0 = 2 π f 0 = 12.56 × 10 4 ; particle displacement—ξ = 0.5 × 10⁻⁷ m; input electrical power—Pin = 2000 W; acoustic intensity— I a =   Z c · 2 · π · f 0 2 · ξ 2 2 = 1246 × 103 W/m2, where Z c —acoustic impedance; f0—resonance frequency; ξ —particle displacement; Zc = 80 kRayl [38,39,40,41,42,43,44]: the acoustic-mechanical efficiency—η_am = 0.8; the electromechanical coupling factor—ζ = 0.74; the electroacoustic efficiency—ηea = 0.94; piezoceramic material density— ρ = 7.8 × 10 3 [Kg/m3]; piezoceramic material Young modulus— Y = 5.1 × 10 10   [N/m2]; piezoceramic material Poisson coefficient—ν = 0.25; the relative permittivity at 1 Hz— ε r p = 2600 ; loss angle—δ p = 0.72 deg; tg (δp) = 0.0125; piezoelectric constant k p = 390 × 10 12 [m/V]; steel Young modulus— Y = 200 × 10 9   [N/m2]; steel density— ρ = 7.8 × 10 3   [Kg/m3]; steel Poisson coefficient ν= 0.3; aluminum density— ρ = 7.8 × 10 3 [Kg/m3]; aluminum Poisson coefficient ν = 0.33.
Using the input data presented previously, the dimensions of the transducer composed of a passive element (the reflector) and an active element, made of steel and aluminum, were calculated. It was calculated as follows:
Ultrasound propagation speed [40] through piezoceramic elements—vp, with formula (1).
s p = E p 1 ν p ρ p 1 + ν p 1 2 ν p = 2801   m / s ,  
where Ep is the modulus of elasticity of the material; ν—Poisson’s ratio.
Using the same formula, the speed of ultrasound propagation through the aluminum amplifier area sAl = 6148 m/s and through the steel area sSt = 5952 m/s resulted.
The wavelength λp of ultrasound through the piezoceramic material thus is
λ p = s p f 0 = 140   mm ;
For aluminum and steel cylinders, respectively, the wavelengths are λAl = 297 mm and for the steel one λSt = 307 mm.
The axial dimensions of the main components made of piezoceramic material, aluminum and steel of the ultrasonic transducer according to the longitudinal direction of propagation of ultrasonic vibrations in λ p /4 are, according to the relation, for the piezoceramic elements,
l p = λ p 4 = 35   mm .
For the disk-type piezoceramic elements, their size is related to the possibilities of construction and purchase of piezoceramic disks. Four 6-mm-thick piezoceramic disks were used in the construction of the piezoceramic transducer. The total thickness of the piezoceramic block is thus l = 24 mm. For the aluminum portion of the transducer amplifier, the resulting length is lAl = 74 mm, and for the steel portion lSt = 76 mm. To determine the radius of the piezoceramic active element, the radiation area of the active element must be calculated. This must be correlated with the input power and with the required acoustic intensity and is as follows:
A p = P i n I a · η e a = 0.0012   m 2
The radius of the resulting piezoceramic active element (for the circular section), is rp:
r p = A p π = 17   mm
The effective electroacoustic efficiency of the transducer of the compound transducer is
η e   a r = p a o p i n = 0.8
The force developed by the active element
F p = k p · U p · A p · Y p · η e   a r d p = 960   N
where
U p = α 0 · Z p · P i n · η e a η a m   · n p = 1.71 × 10 3 V
where α 0 = 0.85 , n p = 2.23   N / V is the electromagnetic transformation coefficient.
The effective electroacoustic efficiency of the transducer is η e   a r = 0.8 .
The actual mechanical energy is of the form
W m = 1 2 F p 2 · C m = 0.6 × 10 3 W s
where Cm = 1.36 nF is the real electrical capacitance of the active element. The electrical energy consumed is calculated with the relationship
W e = 1 2 U p 2 · C p = 1.52 · 10 3 W s
where Cp = 1.36 nF is the electrical capacitance of the active element.
Calculation elements for the ultrasonic energy concentrator are length of ultrasonic energy concentrator
L = n · c 2 · f 0 1 + l n N π · n = 160   mm
where f0 = 20,000 Hz; n = 1; N = 5
and nodal points xnod are calculated with the relation
X n o d = L n · π a r c   t g   ln N n · π + n 1 · π
where n = 1, where n 1 = 1 ,   2 ,   3
The first nodal point is xnod = 66.24 mm.
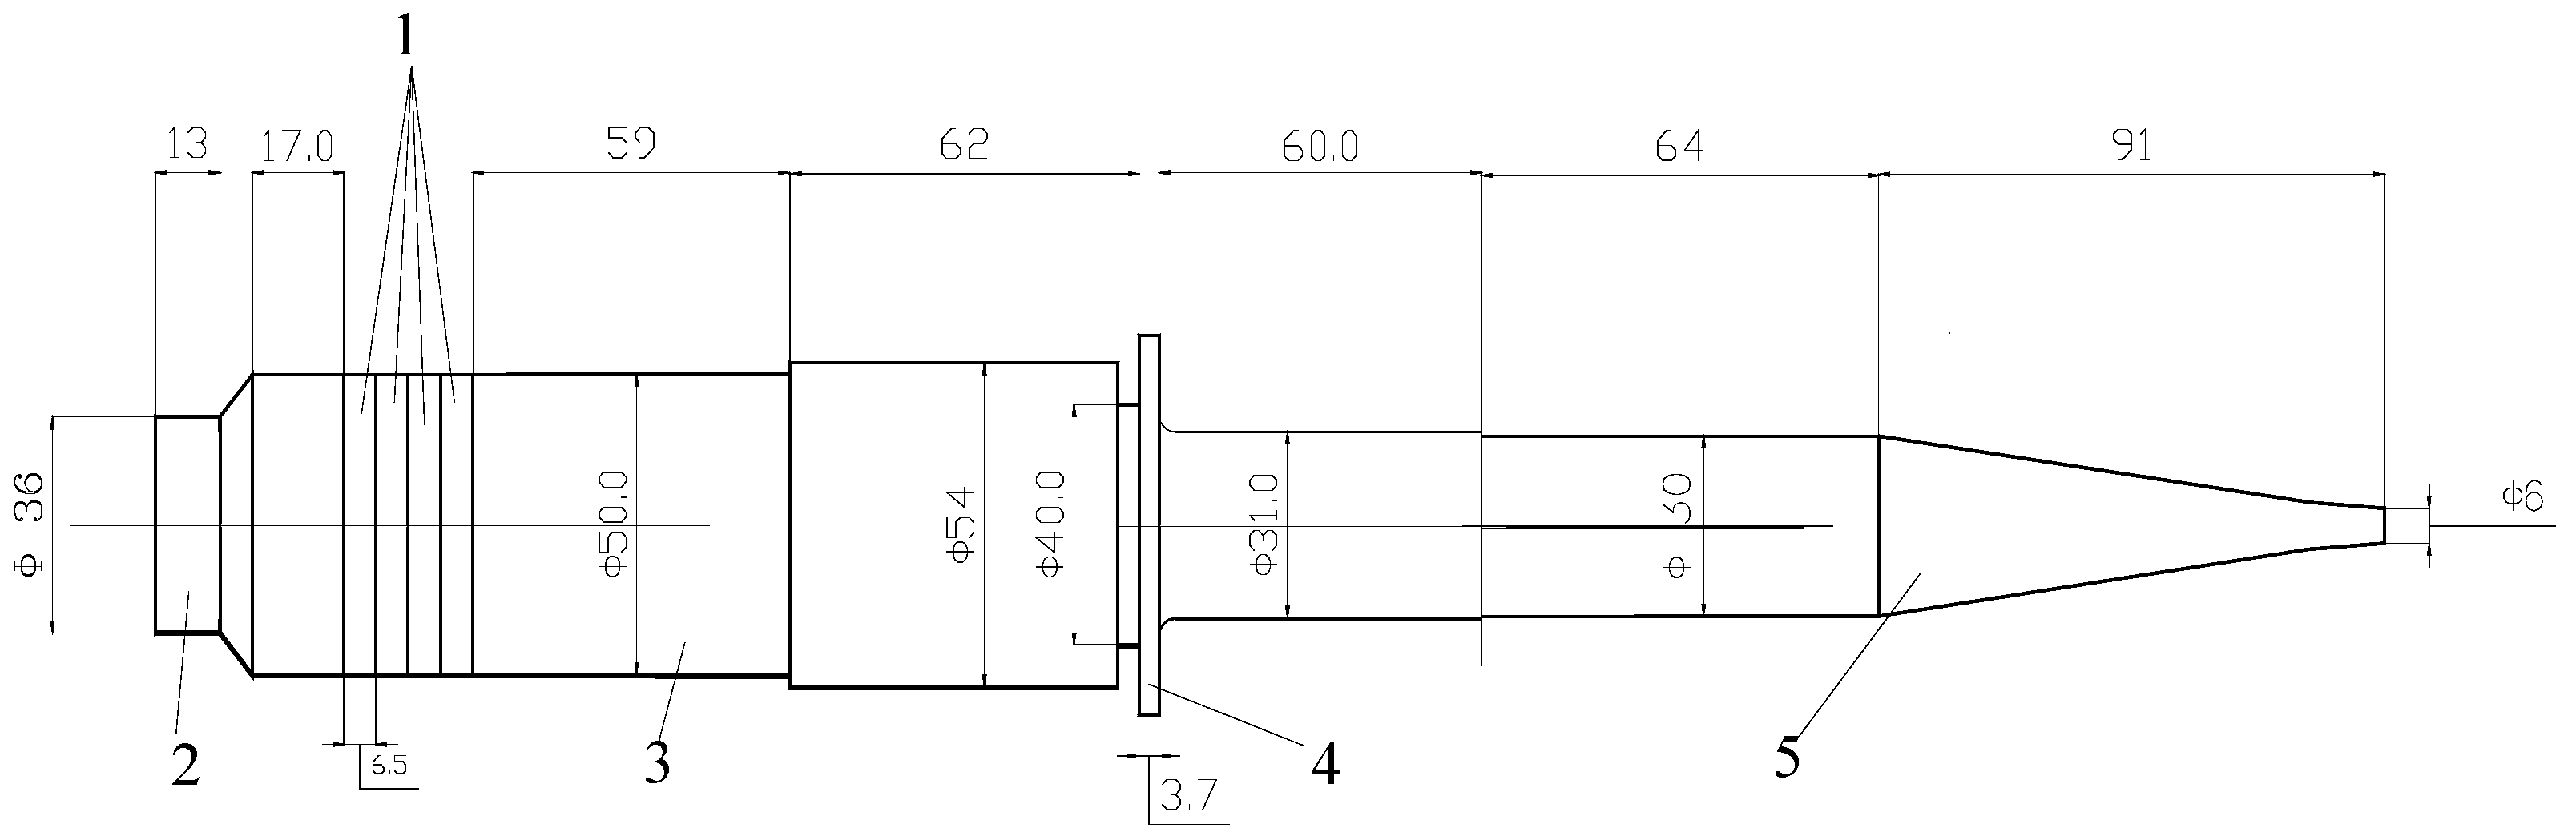
Considering the constructive possibilities regarding the choice of piezoceramic elements, the radius of the available piezoceramic element is rp = 25 mm. One of the most important elements of the ultrasonic transducer system is represented by the ultrasound concentrator. It has the role of concentrating the energy of the ultrasonic vibrations and sending it to the area of interest. As can be seen in Figure 1, a concentrator consisting of two conical zones was designed; at the end of the second one, a hemispherical zone was designed to increase the rigidity of the concentrator. Its design considered the general dimensions of the piezoceramic transducer and the experience of the authors in this field. Figure 12 presents the overall scheme of the ultrasonic system used to activate the deposited composite structure on the metal cylinder. Here they were noted as follows: 1—piezoceramic disks; 2—ultrasonic reflector; 3—the ultrasonic amplifier; 4—nodal flange; 5—the ultrasonic concentrator.

4. Finite Element Modeling of Vibration Modes of the Ultrasonic System

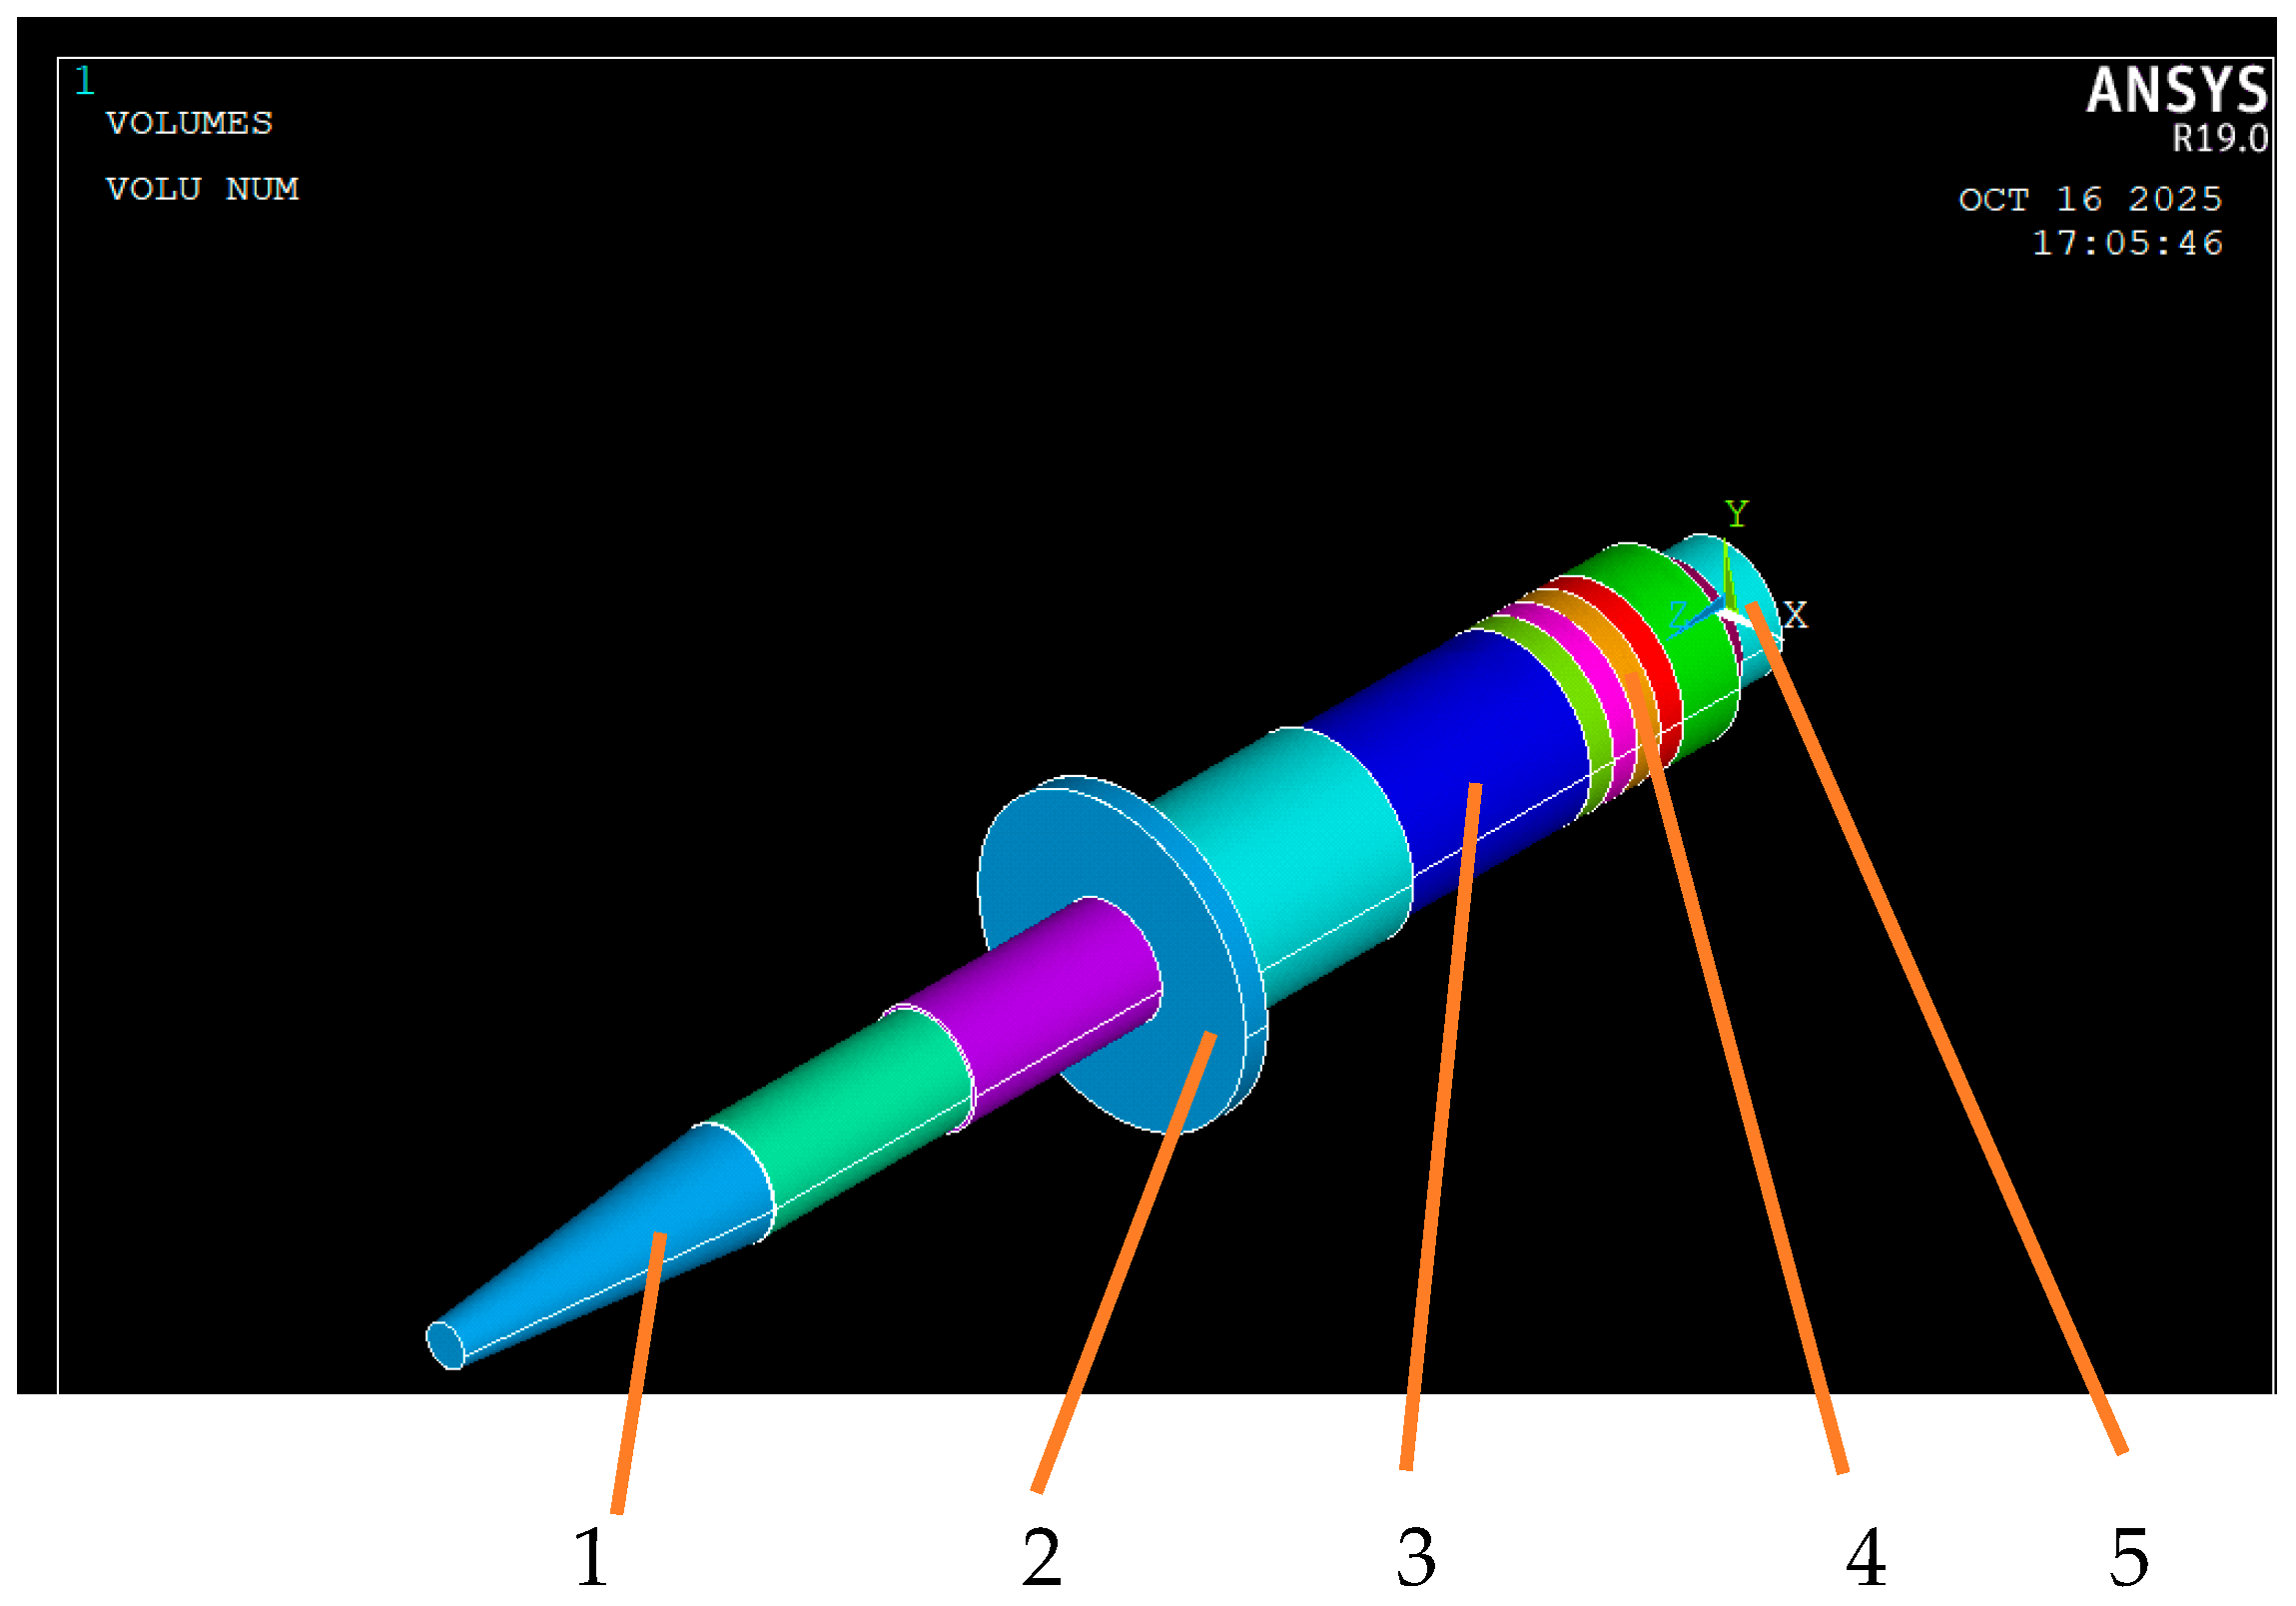
Performing a modal analysis and determining the appropriate vibration frequencies is particularly important, as it leads to optimal operation of the ultrasonic system, with minimal energy consumption. Starting from the analytical design of the piezoceramic transducer followed by the determination of its geometry, its model was created, which is presented in Figure 13.
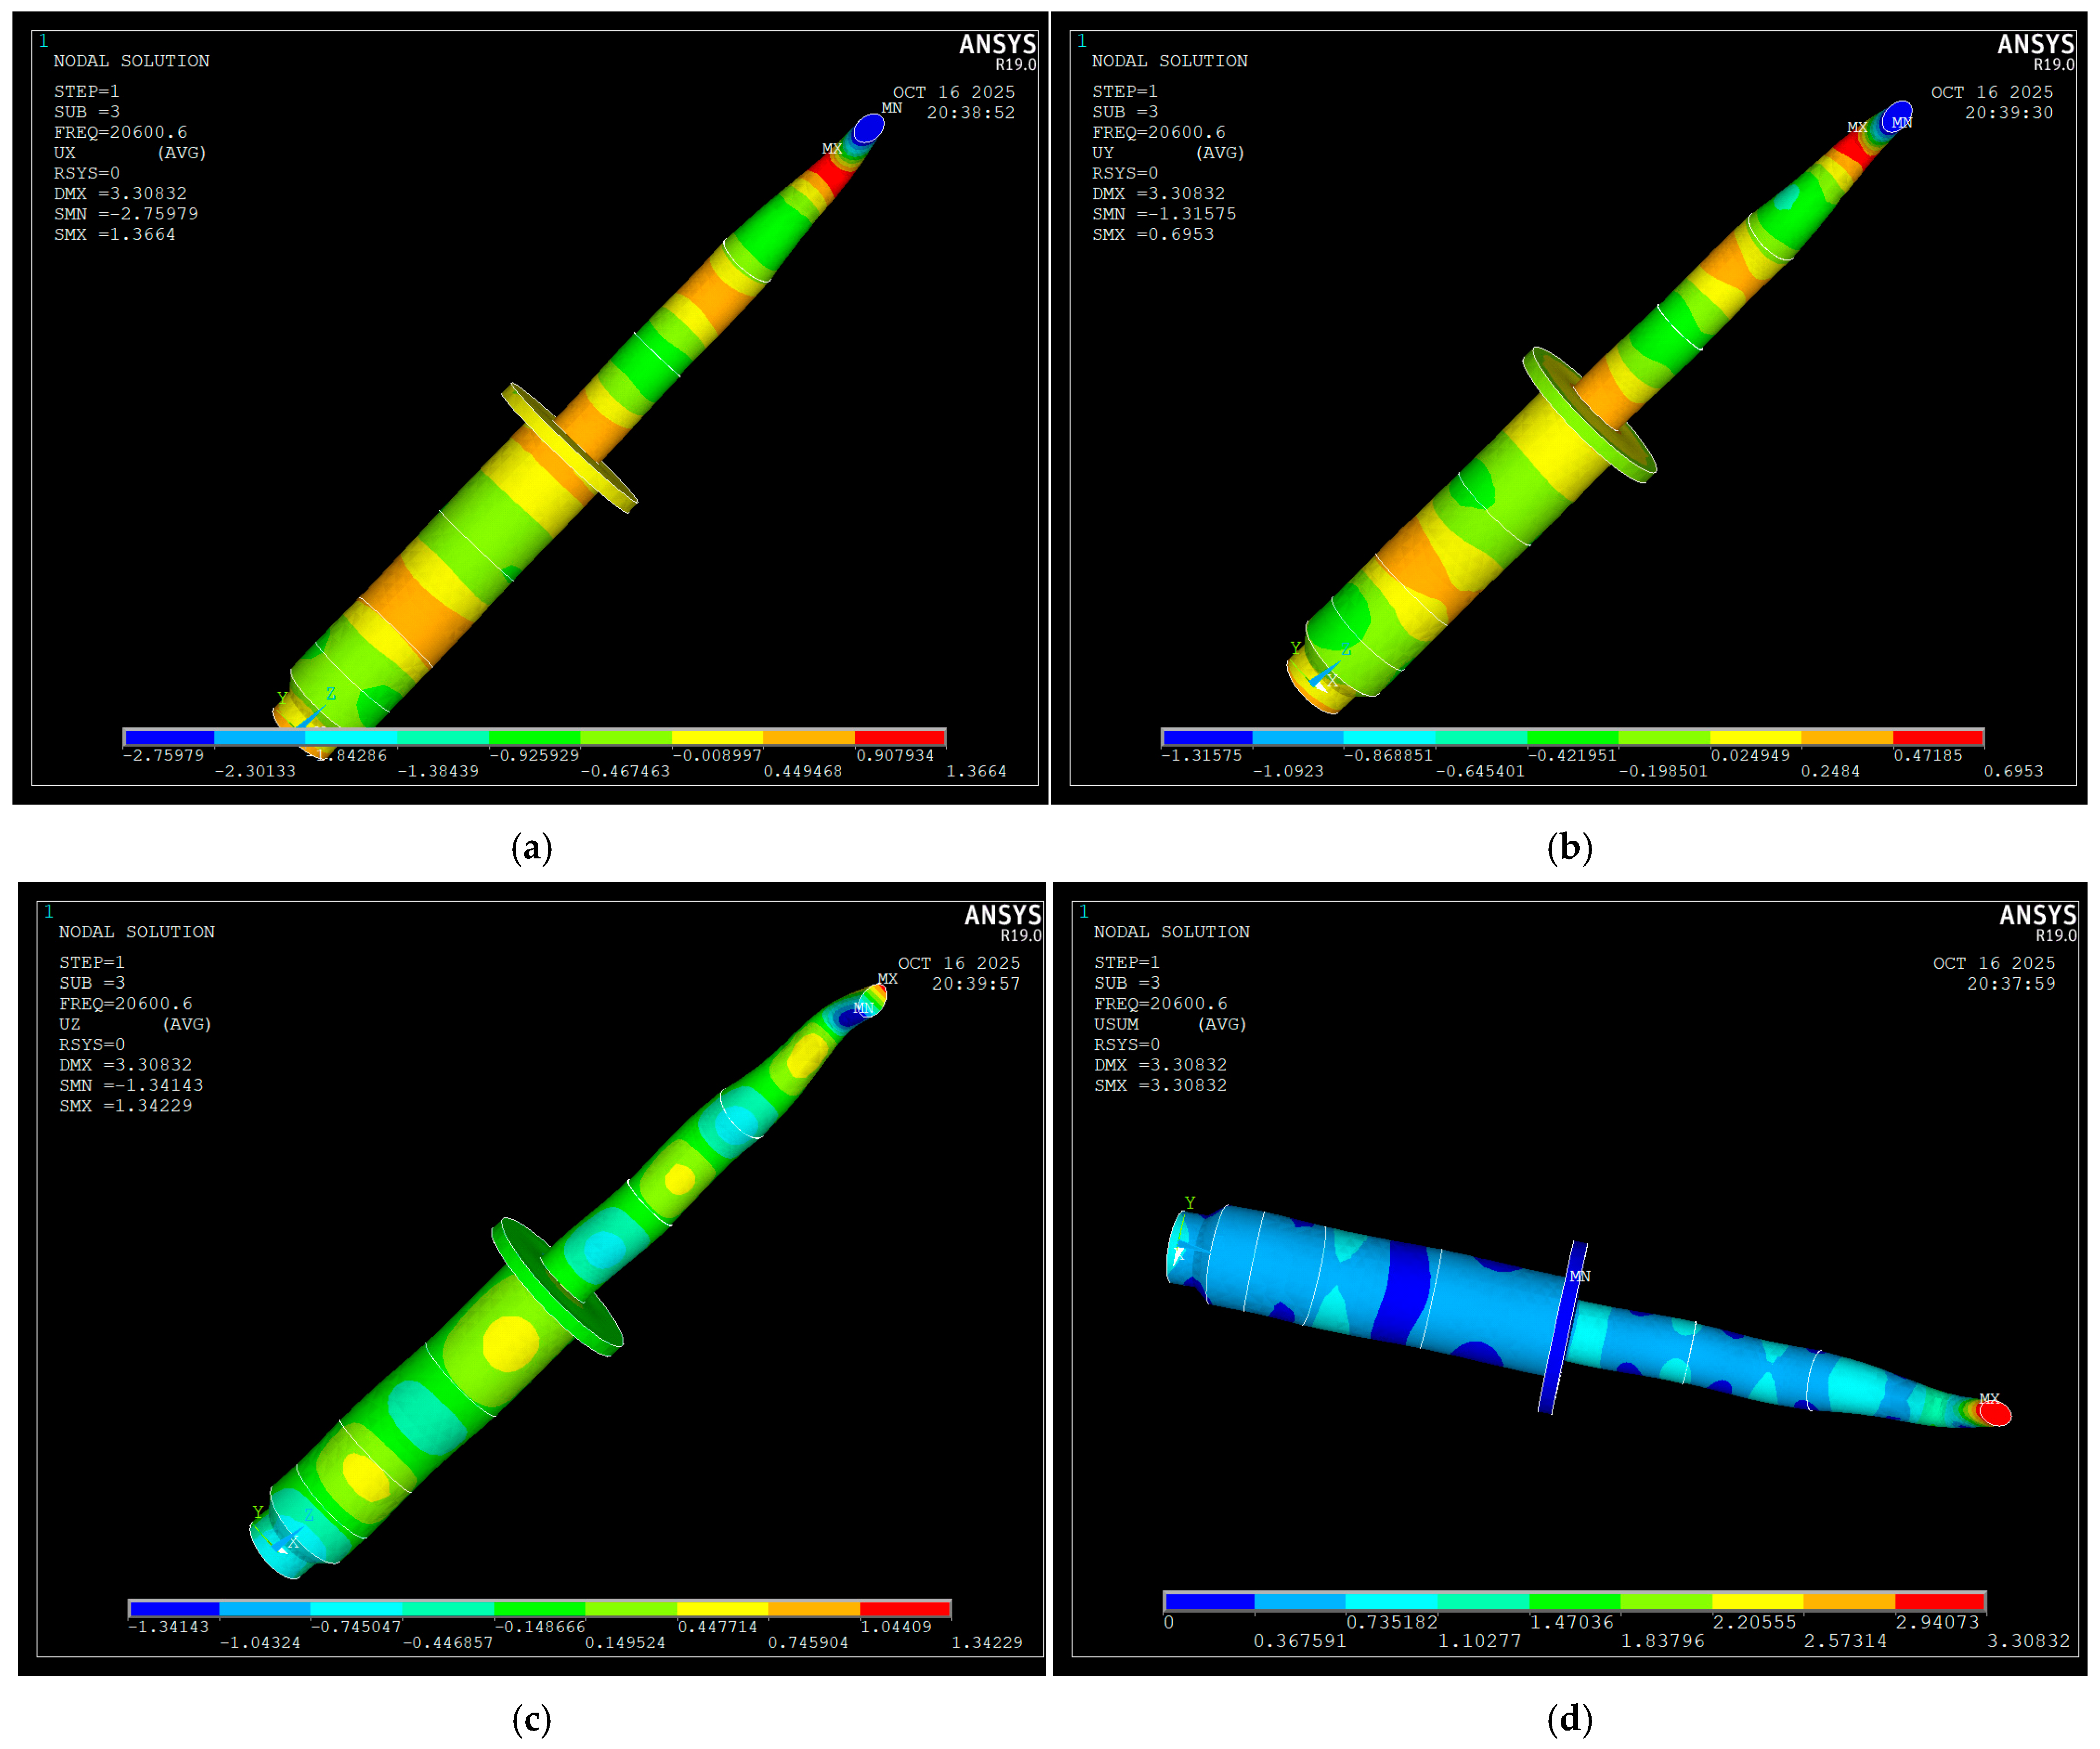
The piezoceramic elements 2, ultrasonic reflector 1, ultrasonic amplifier 3, nodal flange 4 and ultrasonic concentrator 5 are presented here. To perform the modal analysis, two types of discretization elements were used, namely SOLID5 for the piezoceramic material and SOLID187 for the metallic structure, respectively. As input data, the stiffening of the transducer in the nodal flange area was considered and a potential difference of 100 V was applied to the surfaces of the four piezoceramic elements. The first vibration frequency of the system, and the most possible to be really realized, is f = 20,600 Hz. At this frequency, the vibrating system performs oscillations along the OZ axis, vibrations that are useful for the proposed method, namely the action on the metal support on which the composite structure is made. In this sense, Figure 14a presents the displacement of the structure relative to the OX axis. Figure 14b presents the displacement relative to the OY axis and Figure 14c shows the displacement relative to the OZ axis. As can be seen, the maximum value of the displacements is recorded along the OZ axis and is shown in Figure 14c in red with a maximum value of UZ = 1.34 microns. Figure 14d presents the sum of the deformations on the three axes, where it can be clearly seen that in the area of the piezoceramic elements the deformation of the structure is very small, even close to zero, which is a positive fact since it prevents the deterioration over time of the piezoceramic disks and their junction with the electrodes that provide the electrical voltage to which the piezoceramic elements are subjected. In the area of the piezoceramic disks, the displacements presented for the three axes are of very small value—submicron—and do not affect in any way the integrity of the ultrasonic transducer.
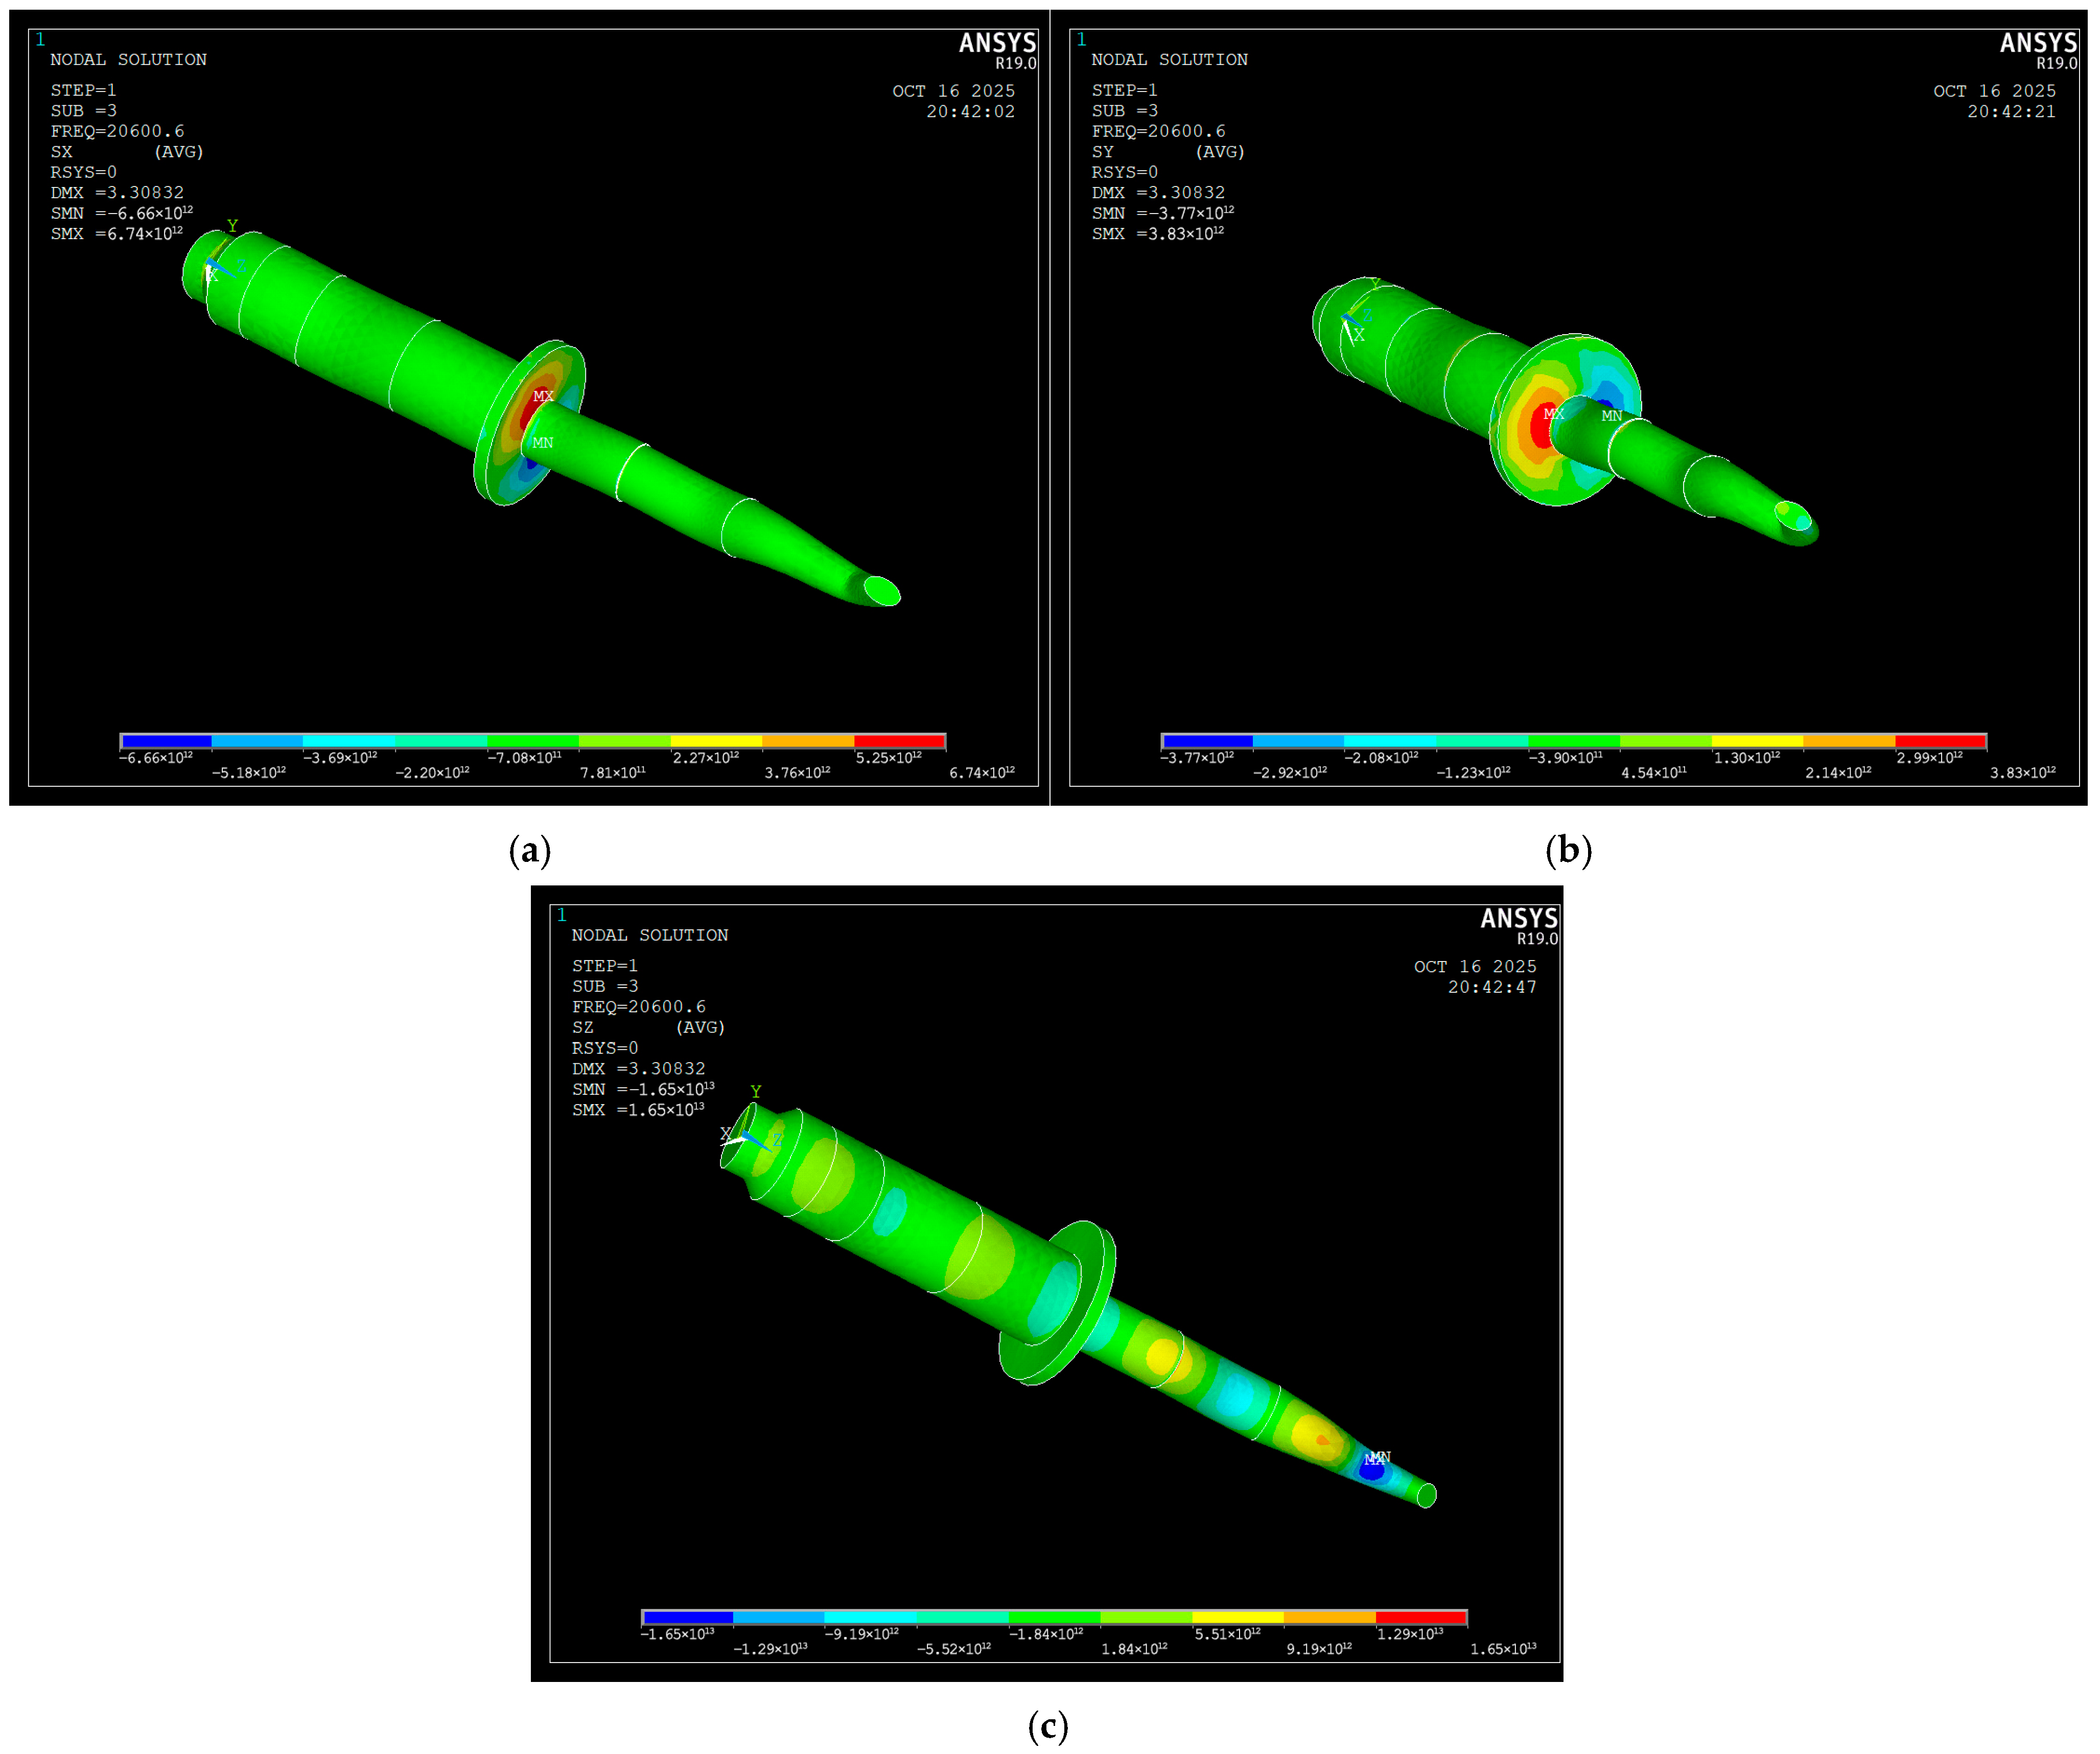
The second set of results refers to the analysis of stress state; in Figure 15 the mechanical stresses reported to the three axes OX, OY and OZ are presented. As can be seen from the analysis of the images, the maximum values of the stresses are found in the nodal flange area, that is, in the embedding area of the ultrasonic system with the metal support on which it is placed, an area specially designed for optimal, long-lasting behavior and with high structural resistance. In the area of the ultrasonic transducer, the green color is found, a color indicating a minimum of the calculated stresses. In this area, stresses are calculated from negative values to positive values (i.e., from compression states to tensile states). Figure 15a presents the stresses calculated for the OX axis with the minimum values Sx = − 0.7 E12 − 0.78 E12 N/m2. For mechanical stresses calculated to the OY axis, their minimum values are in the interval Sy = − 0. 39 E12 − 0.45 E12 N/m2 according to Figure 15b. Corresponding to the OZ axis, the lowest values of mechanical stresses are calculated in the range Sz = − 0.18 E13 − 0.19 E13 N/m2. In the middle of this interval, the zero value or near-zero stresses are found. It is very important that in the zone of the piezoceramic elements the mechanical stress values are as low as possible because due to their construction they are brittle. As can be seen from the analysis of the images presented in Figure 15, this condition is met.
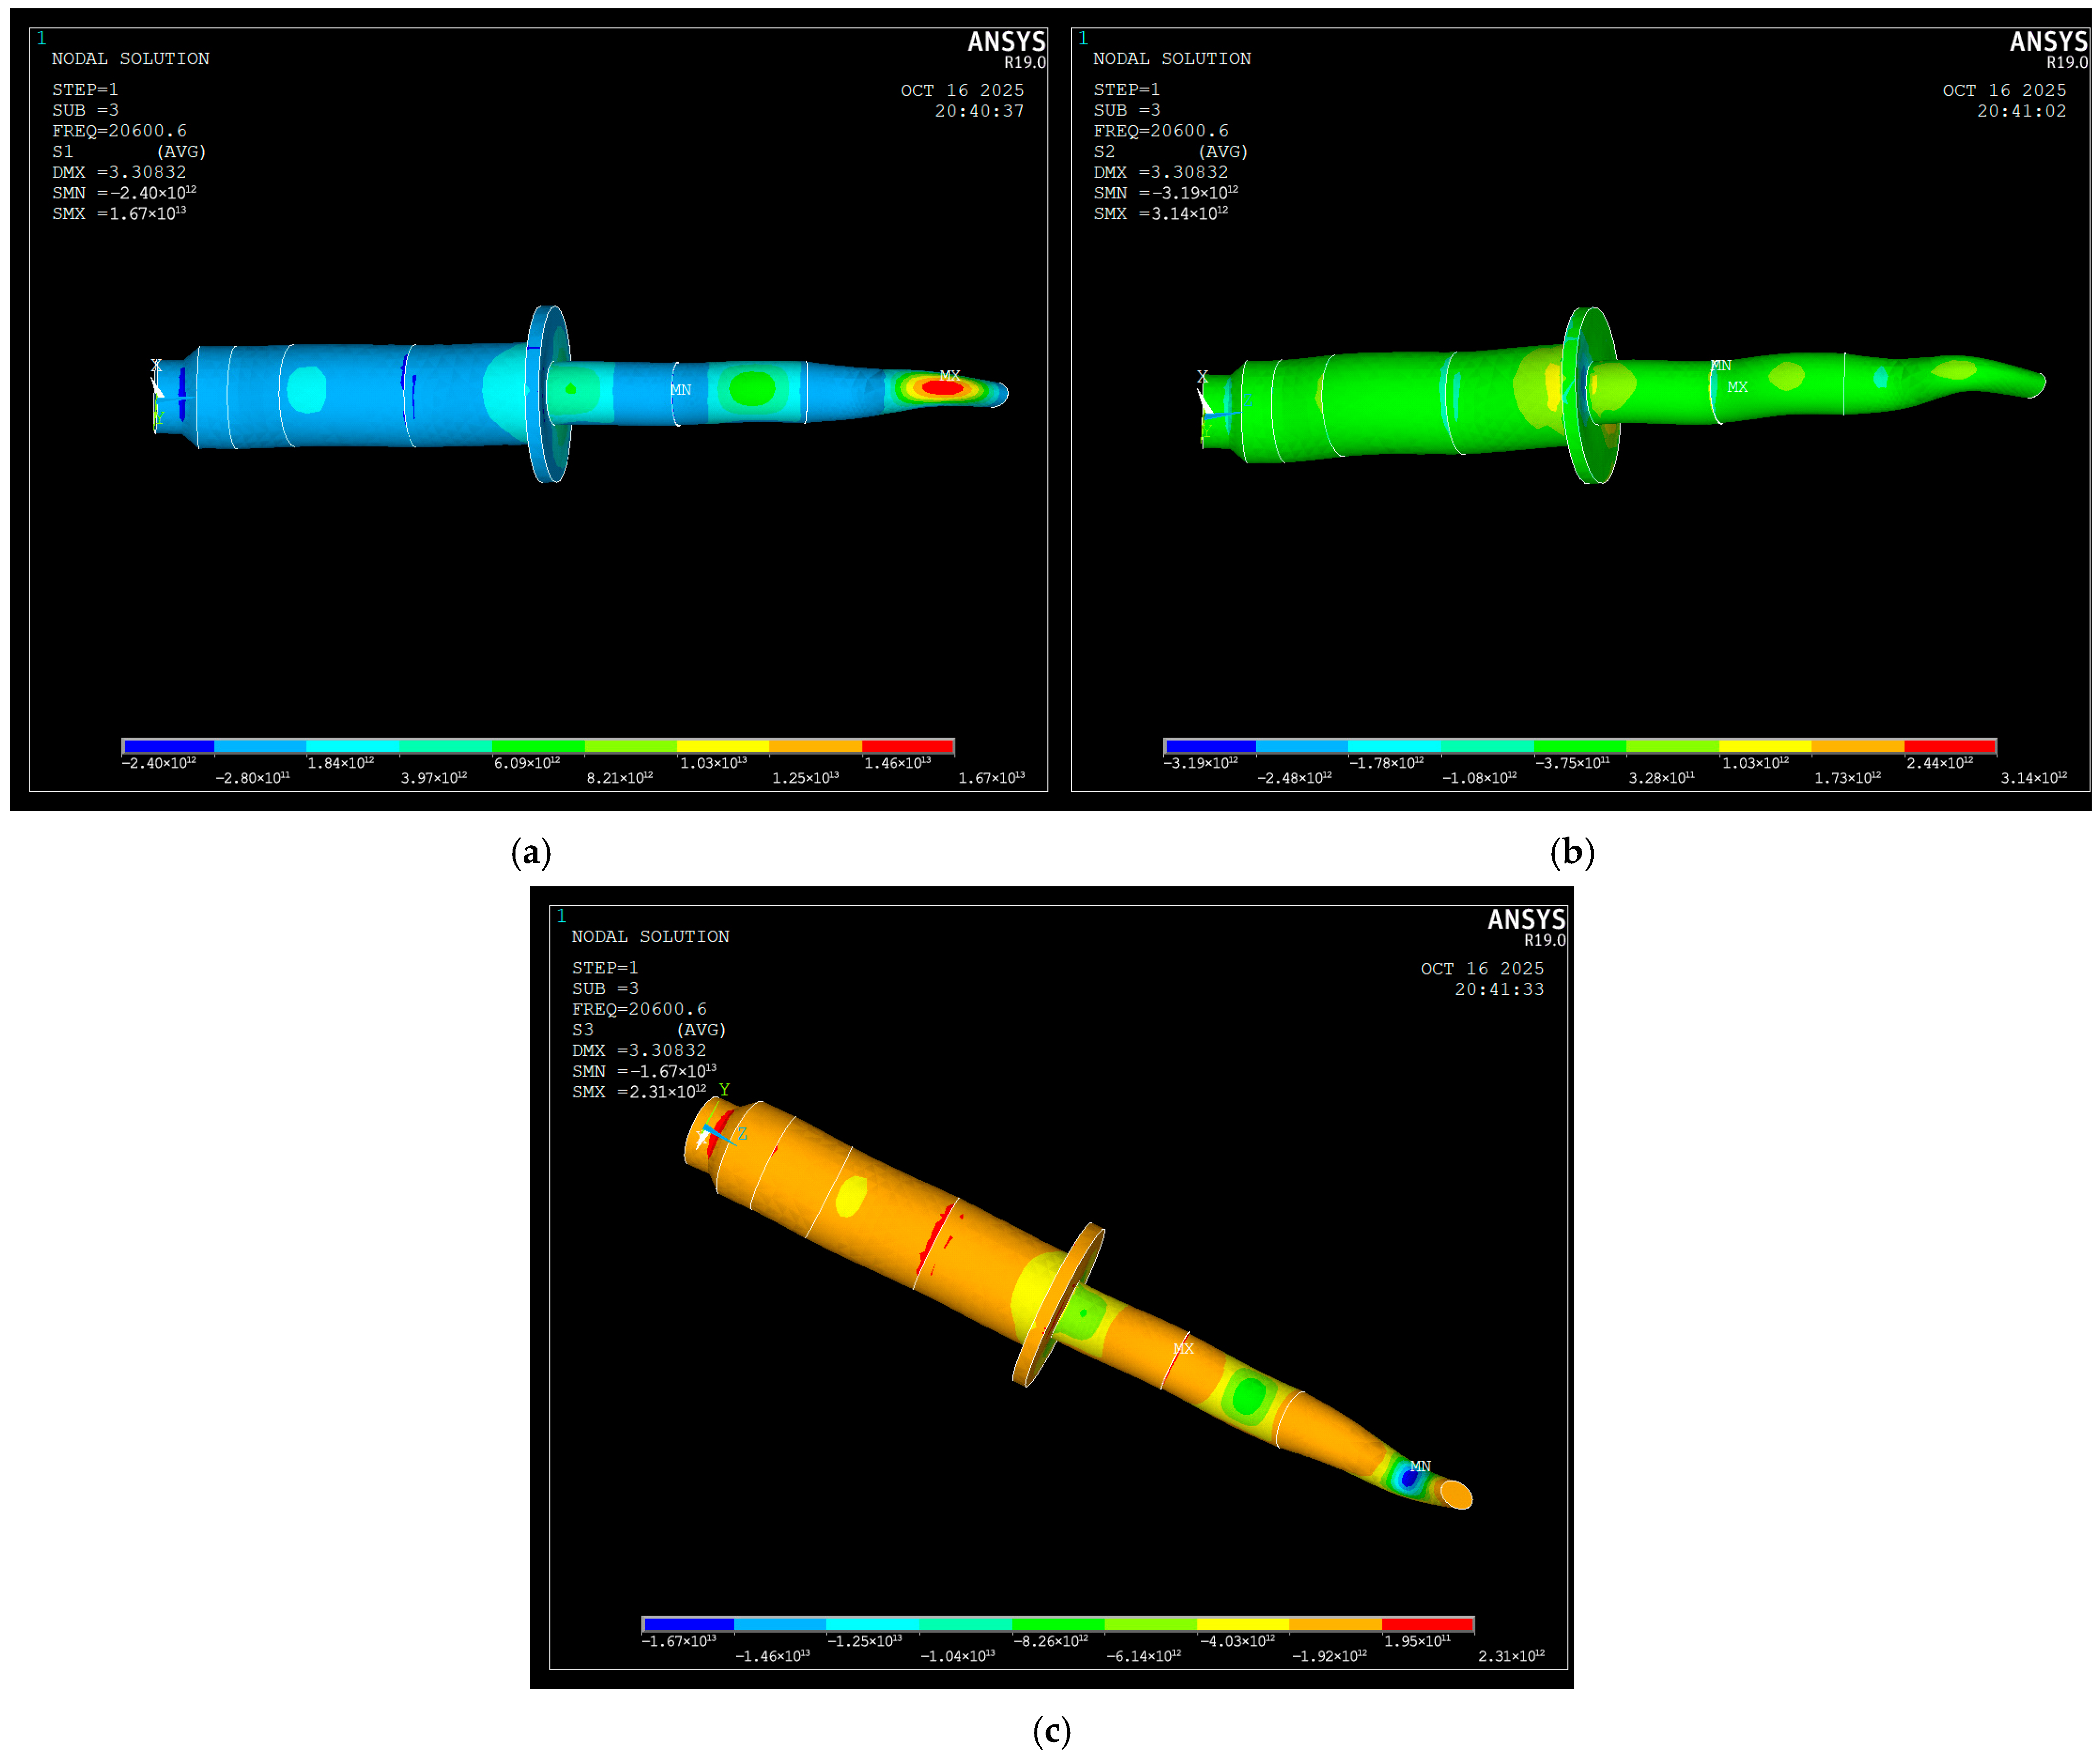
Next, the S1-, S2- and S3-type stresses are presented. As is known, the stress state in a structure is made up of tensile stresses and compressive stresses. From the theory of material strength, it is known that stresses of this form calculate predominantly the state of tensile stress (S1), compression (S3), and in a balanced way the tension and compression (S2). Figure 16 presents the stresses of this type. From the analysis of the three images, it is observed that the area of the piezoceramic disks is subjected to minimal mechanical stresses compared to the rest of the structure. Figure 16a presents the S1-type stresses that calculate in the blue area the values S1 = 0.24 E13 − 0.18 E13 N/m2. These values, being relatively symmetrical with respect to the zero value, fall into an area with minimal values. Figure 16b presents the stress values that calculate the tension and compression state equally. The minimum stresses are shown in green, also presented in the area of the piezoceramic disks. These values are S2 = − 0.37 E12 − 0.32 E12 N/m2. Maximum values of the stresses are naturally calculated in area of the system embedding at the nodal flange. Figure 16c shows the S3 type stresses that emphasize predominantly the compression state inside the structure. The orange color here corresponds to the stresses with a minimum value S3 = − 0.19E13 − 0.19 E12 N/m2 that make the transition from compression to tension stresses, passing through those of zero value. In the area of the nodal flange, stresses with a maximum value are also found, both in tensile and compression.
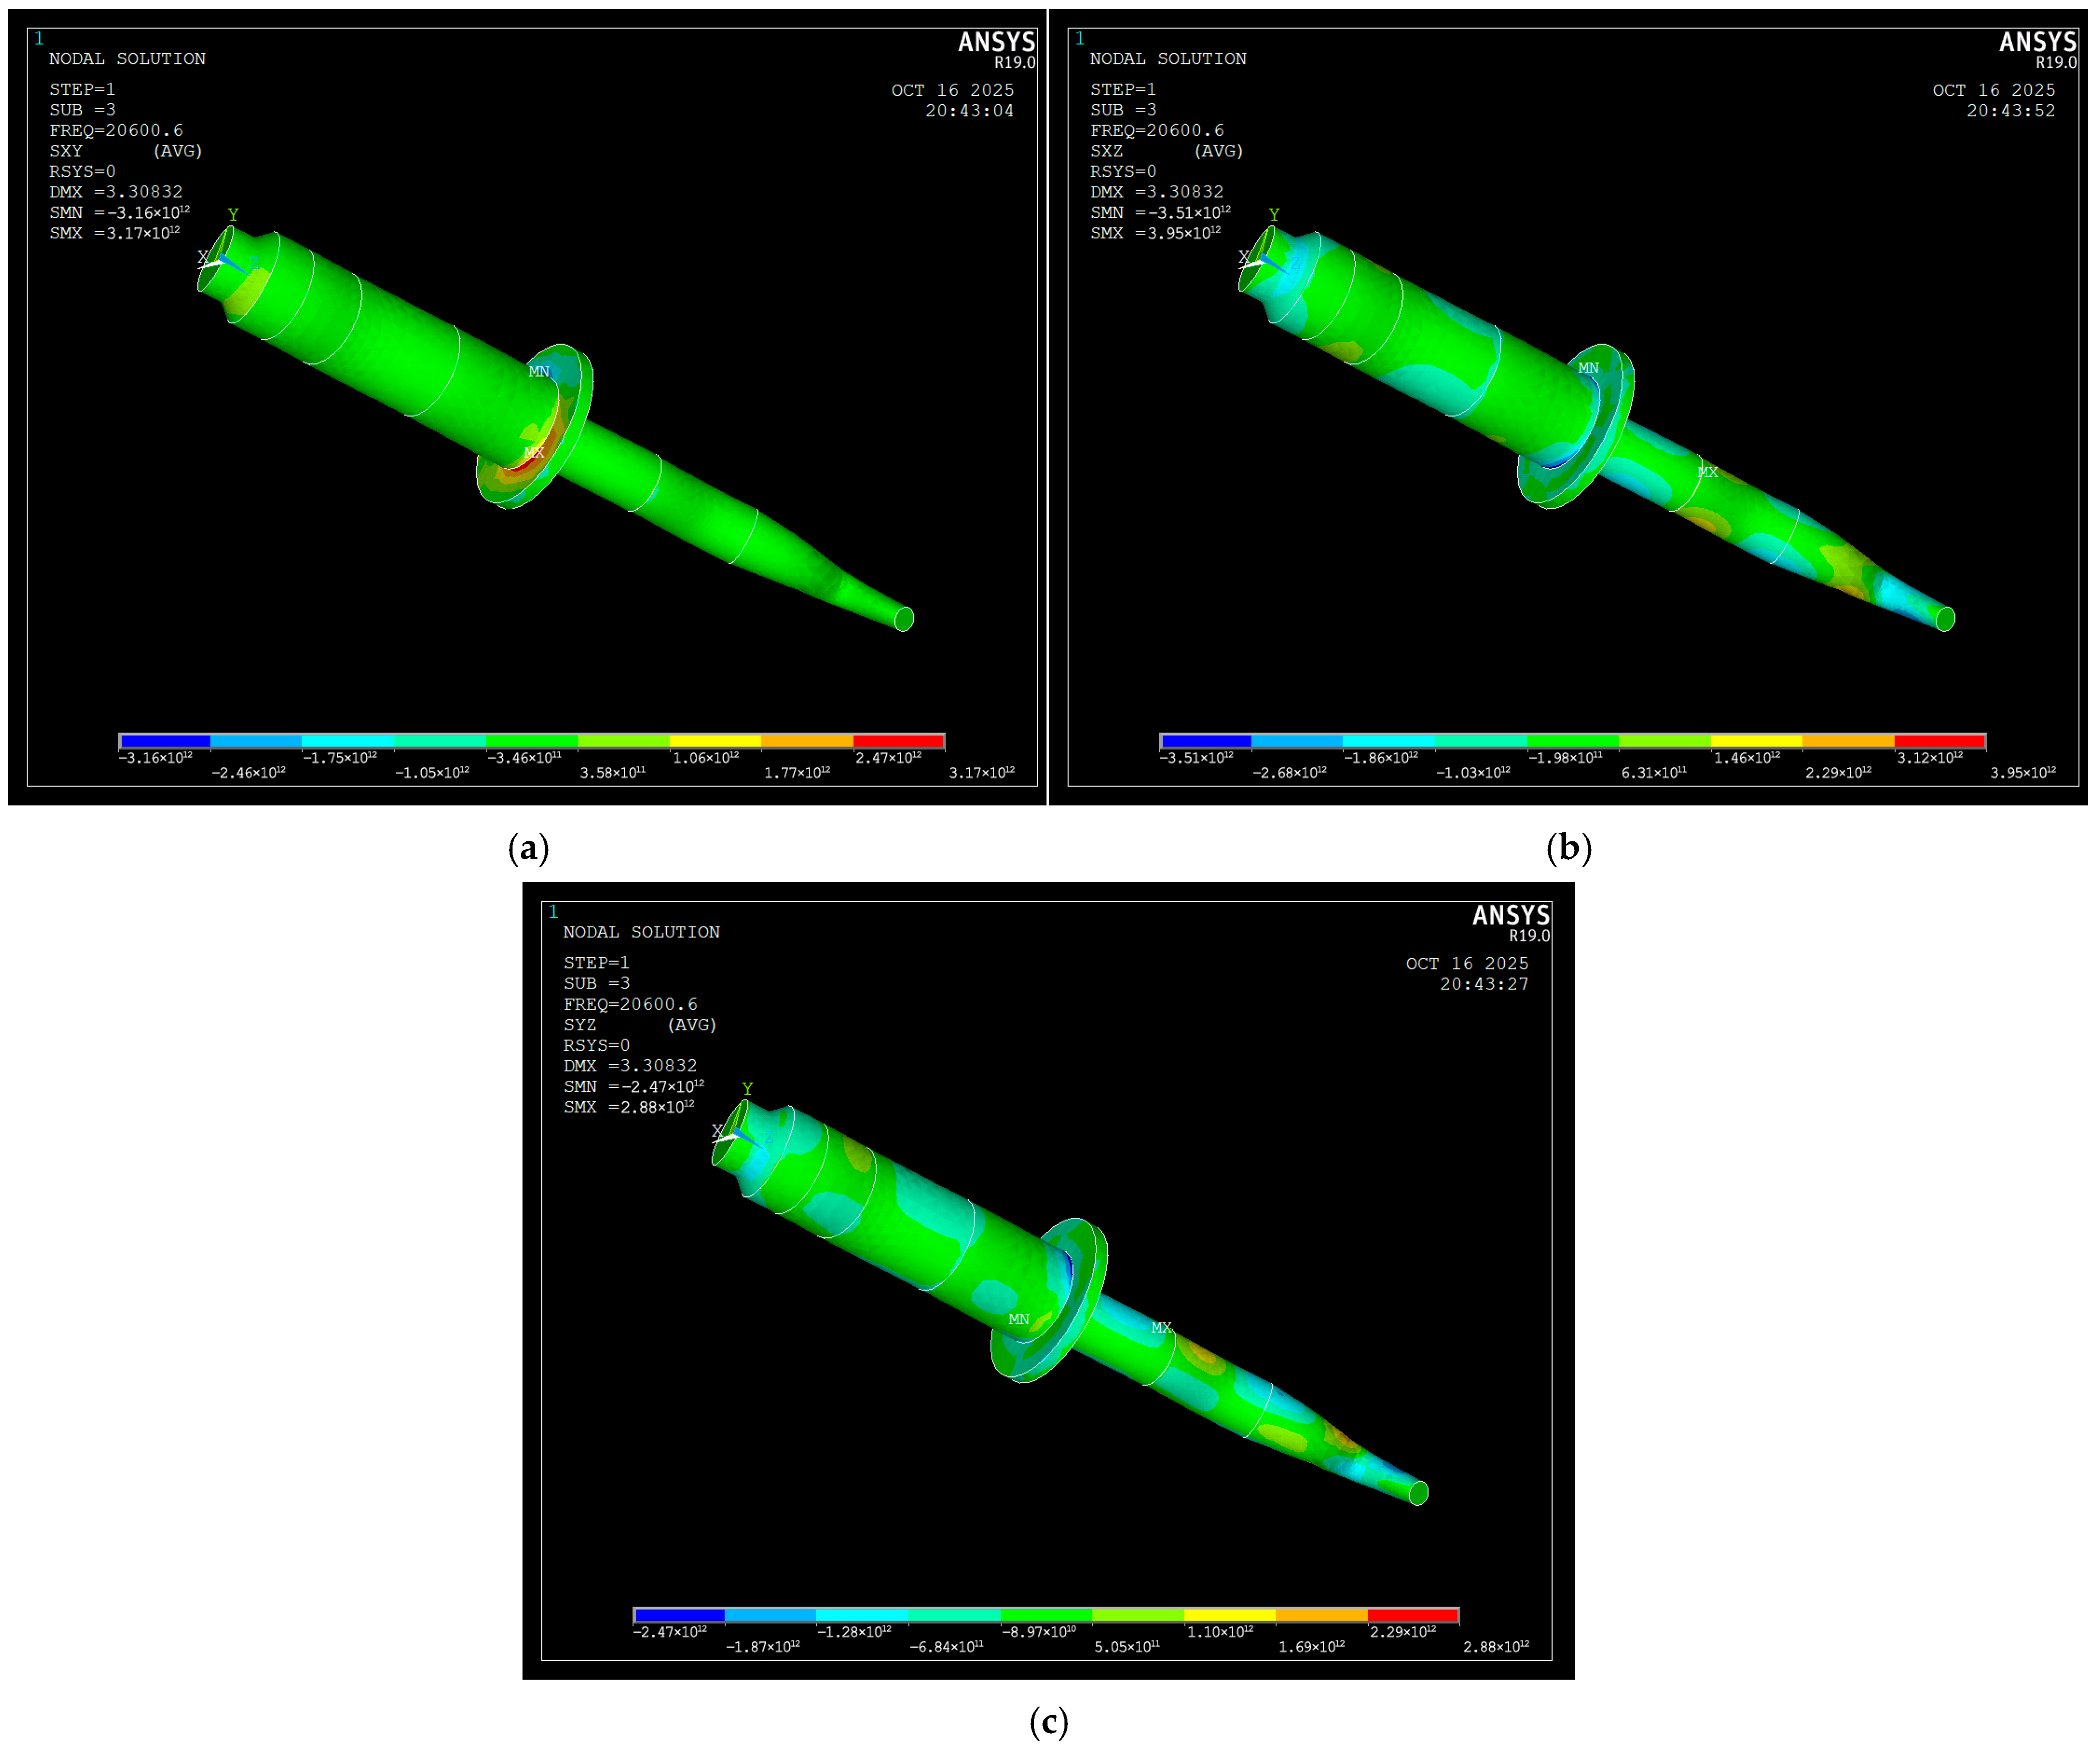
Shear stresses represent another type of very important stresses, the analysis of which can provide particularly valuable information in certain cases. Thus, in Figure 17 this type of stress is presented, namely SXY, SXZ and SYZ. As can be seen in Figure 17a, the stresses calculated here and reported to the XOY plane have minimums in the green area, namely in the range SXY = − 0.34 E12 – 0.35 E12 N/m2. Maximum values are found predominantly in the nodal flange area. From the point of view of the XOZ axis, in Figure 17b the minimum values that fall within the range SXZ = − 0.19 E13 – 0.63 E13 N/m2 are presented in brown. Zero values in the middle of the range are also found in the area of the piezoceramic disks. The maximum values, noted in red and blue, respectively, are also calculated in the nodal flange area. For the third plane ZOY, the corresponding shear stresses are presented in Figure 17c. In this case too, the largest part of the transducer, including the area of the piezoceramic disks, is shown in yellow, which also represents the minimum stresses in the range SYZ = − 0.68 E12 – 0.11 E13 N/m2.
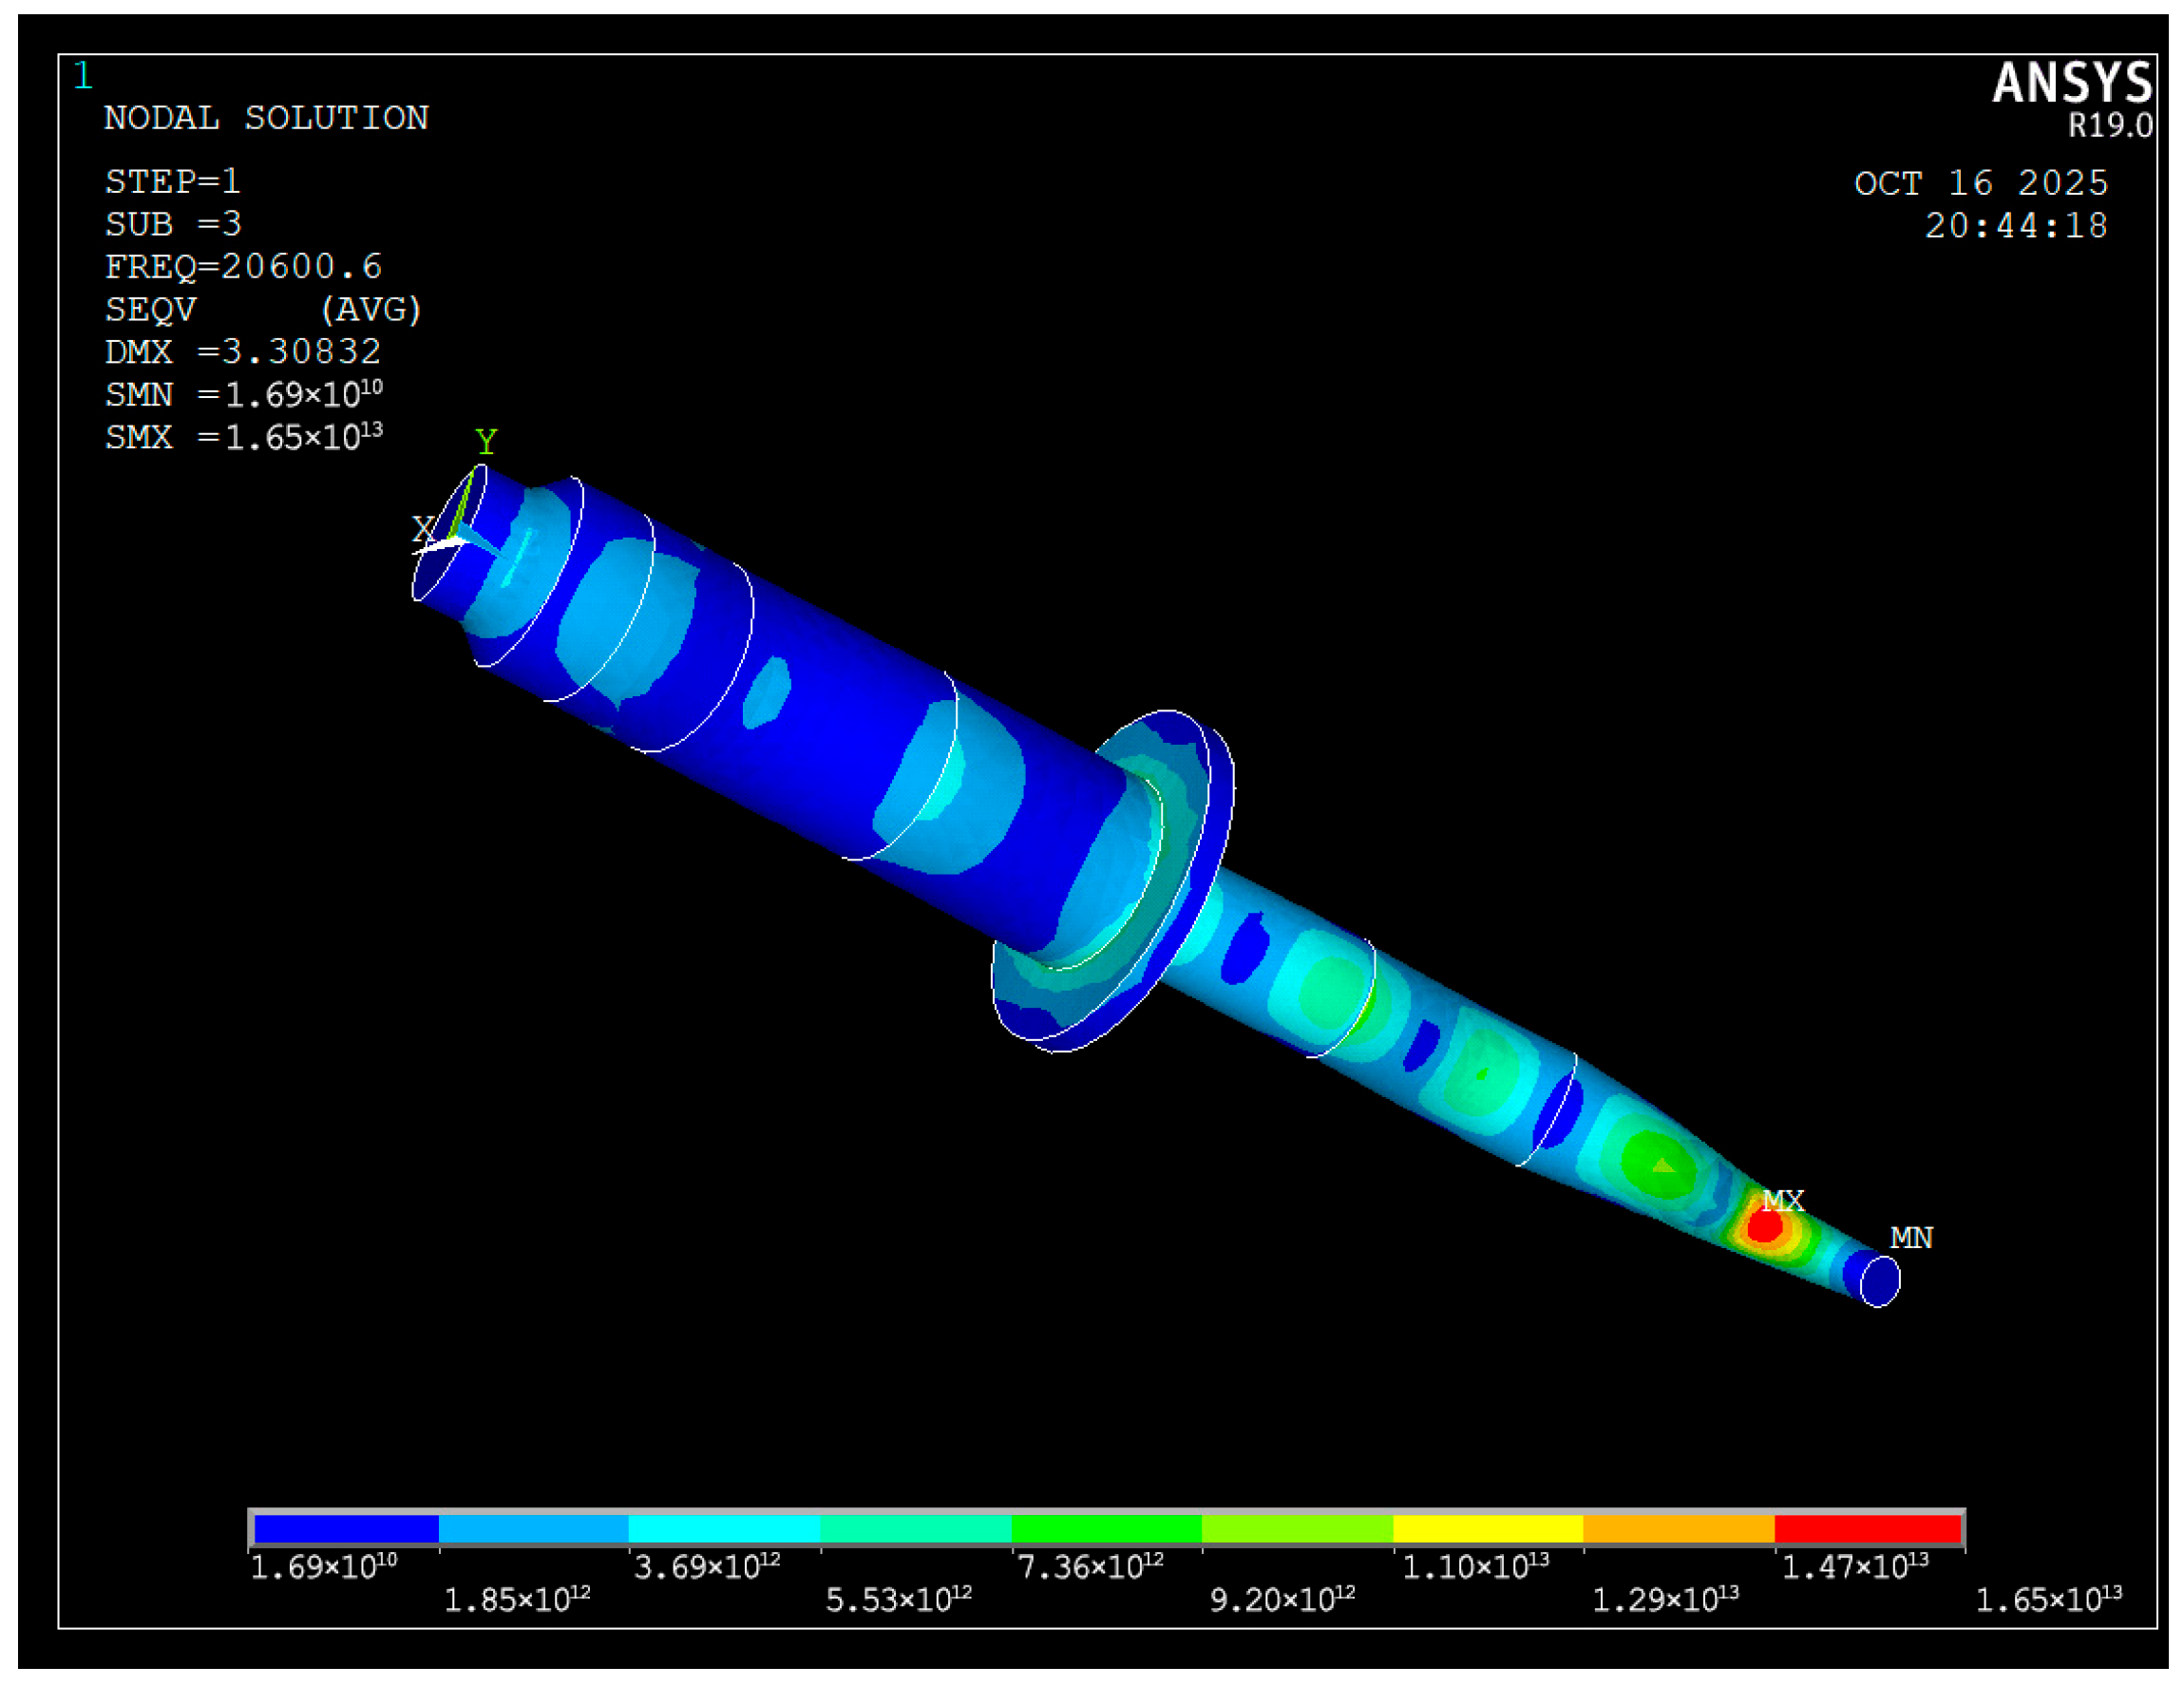
The last type of stress calculation refers to Von Mises stresses, presented in Figure 18. These stresses no longer consider the distribution of tensile and compressive stresses as they actually are, but calculate their maximum values starting from zero.
As can be seen, in the piezoceramic disks the color is blue, which means that the mechanical stress values are at the lowest level. This fact confirms once again that this vibration mode is the optimal one, which means that this working frequency can be used during the experiments.

5. Testing the Ultrasonic Curing System in Real Working Conditions

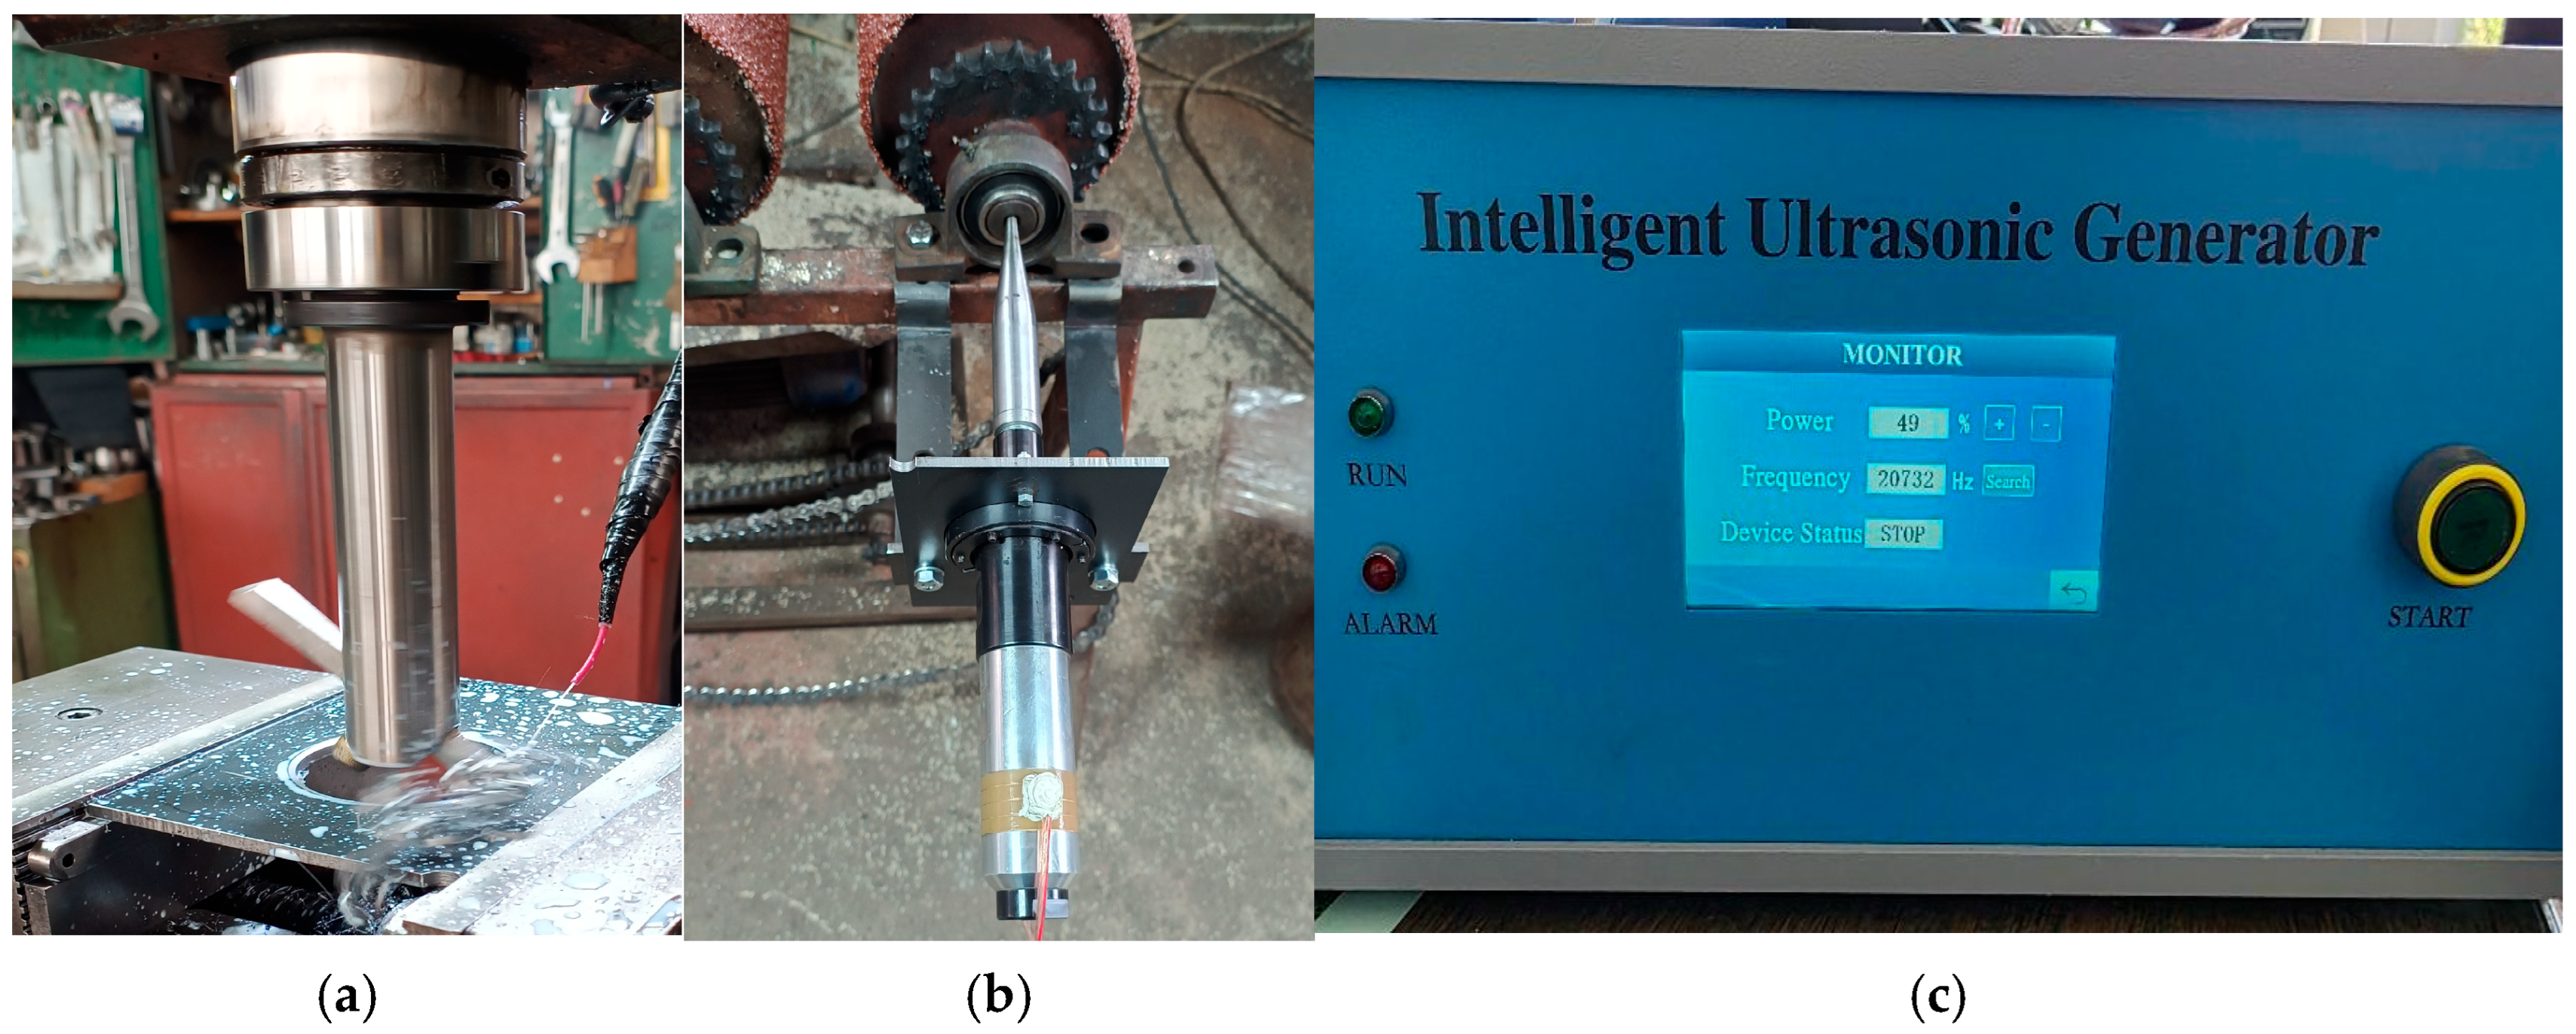
Considering the work steps and design of the ultrasonic system considered to improve the solidification process of the composite structure by reducing the crosslinking time of the epoxy resin and by increasing the adhesion of the sand particles in the resin volume, in order to improve the quality of the structure deposited on the metal support by adhesion improvement to it, the next step aimed at its effective testing in real working conditions. In this regard, Figure 19a presents, for example, the manufacturing of the flange for fixing the ultrasonic system on the workbench, as well as the placement of the entire system in working position in Figure 19b. Figure 19c presents the ultrasonic generator on working frequency f = 20,732 Hz. Very important is the fact that the vibration frequency theoretically determined by FEM, namely f = 20,600 Hz, is very close to the working frequency obtained from the self-tuning of the ultrasound generator f = 20,732 Hz.
The tests carried out on the real system for manufacturing composite cylinders used in the brake stands of the workshops in the automotive industry showed a reduction in manufacturing times from approximately 8 h for the deposition of each composite layer to approximately 6.5 h required when using the energy introduced by the vibratory field with a frequency of 20,732 Khz (Figure 19c). In addition, the superior quality of the obtained structure is also very important. In this regard, a thermographic analysis was carried out with a thermal imaging camera, ThermaCam SC 640. This type of analysis is among the few methods of quality analysis that can be performed in this type of part in real time being applicable with relative ease to product control right where it is manufactured.
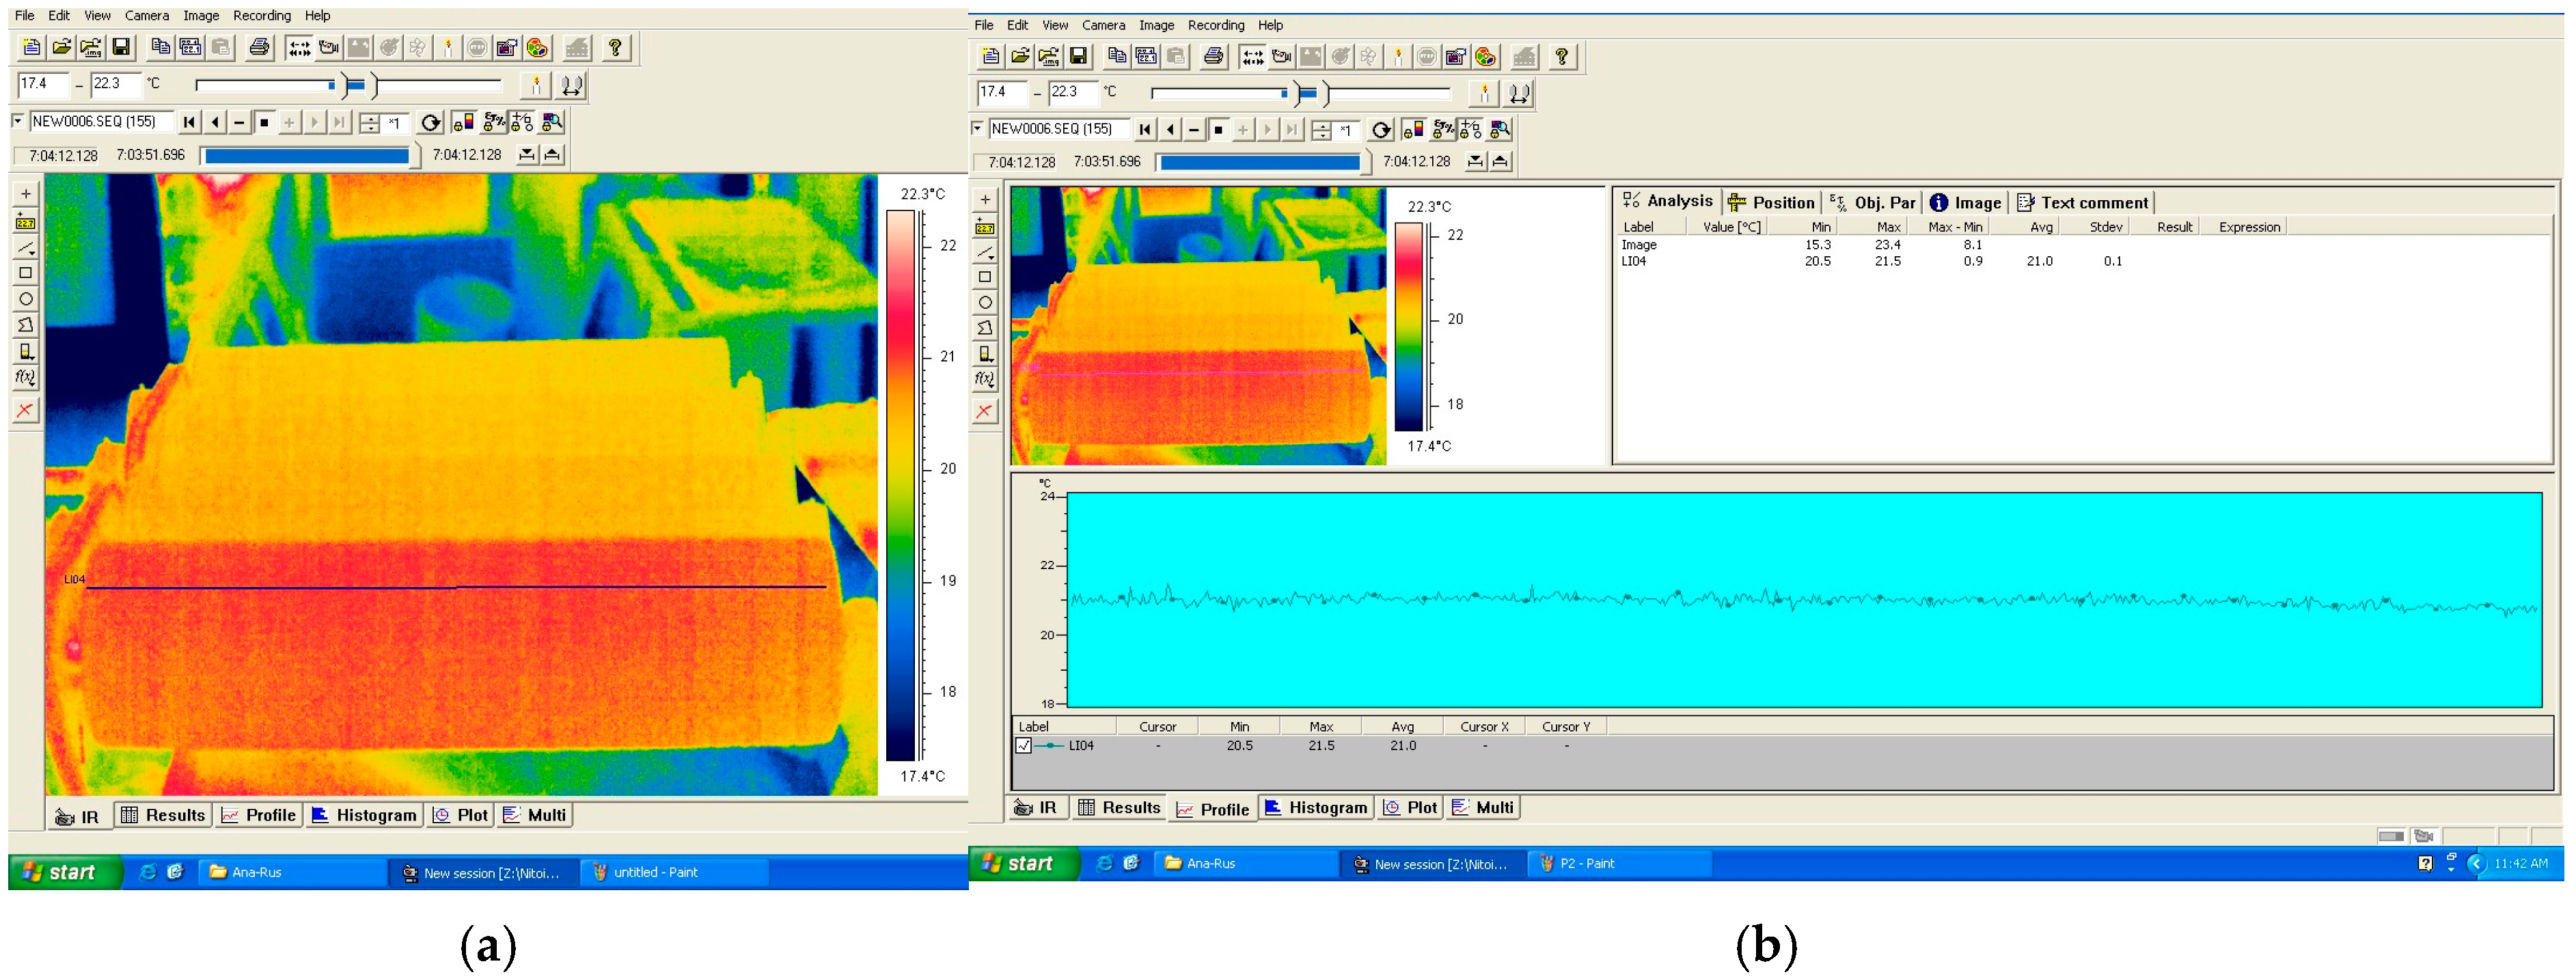
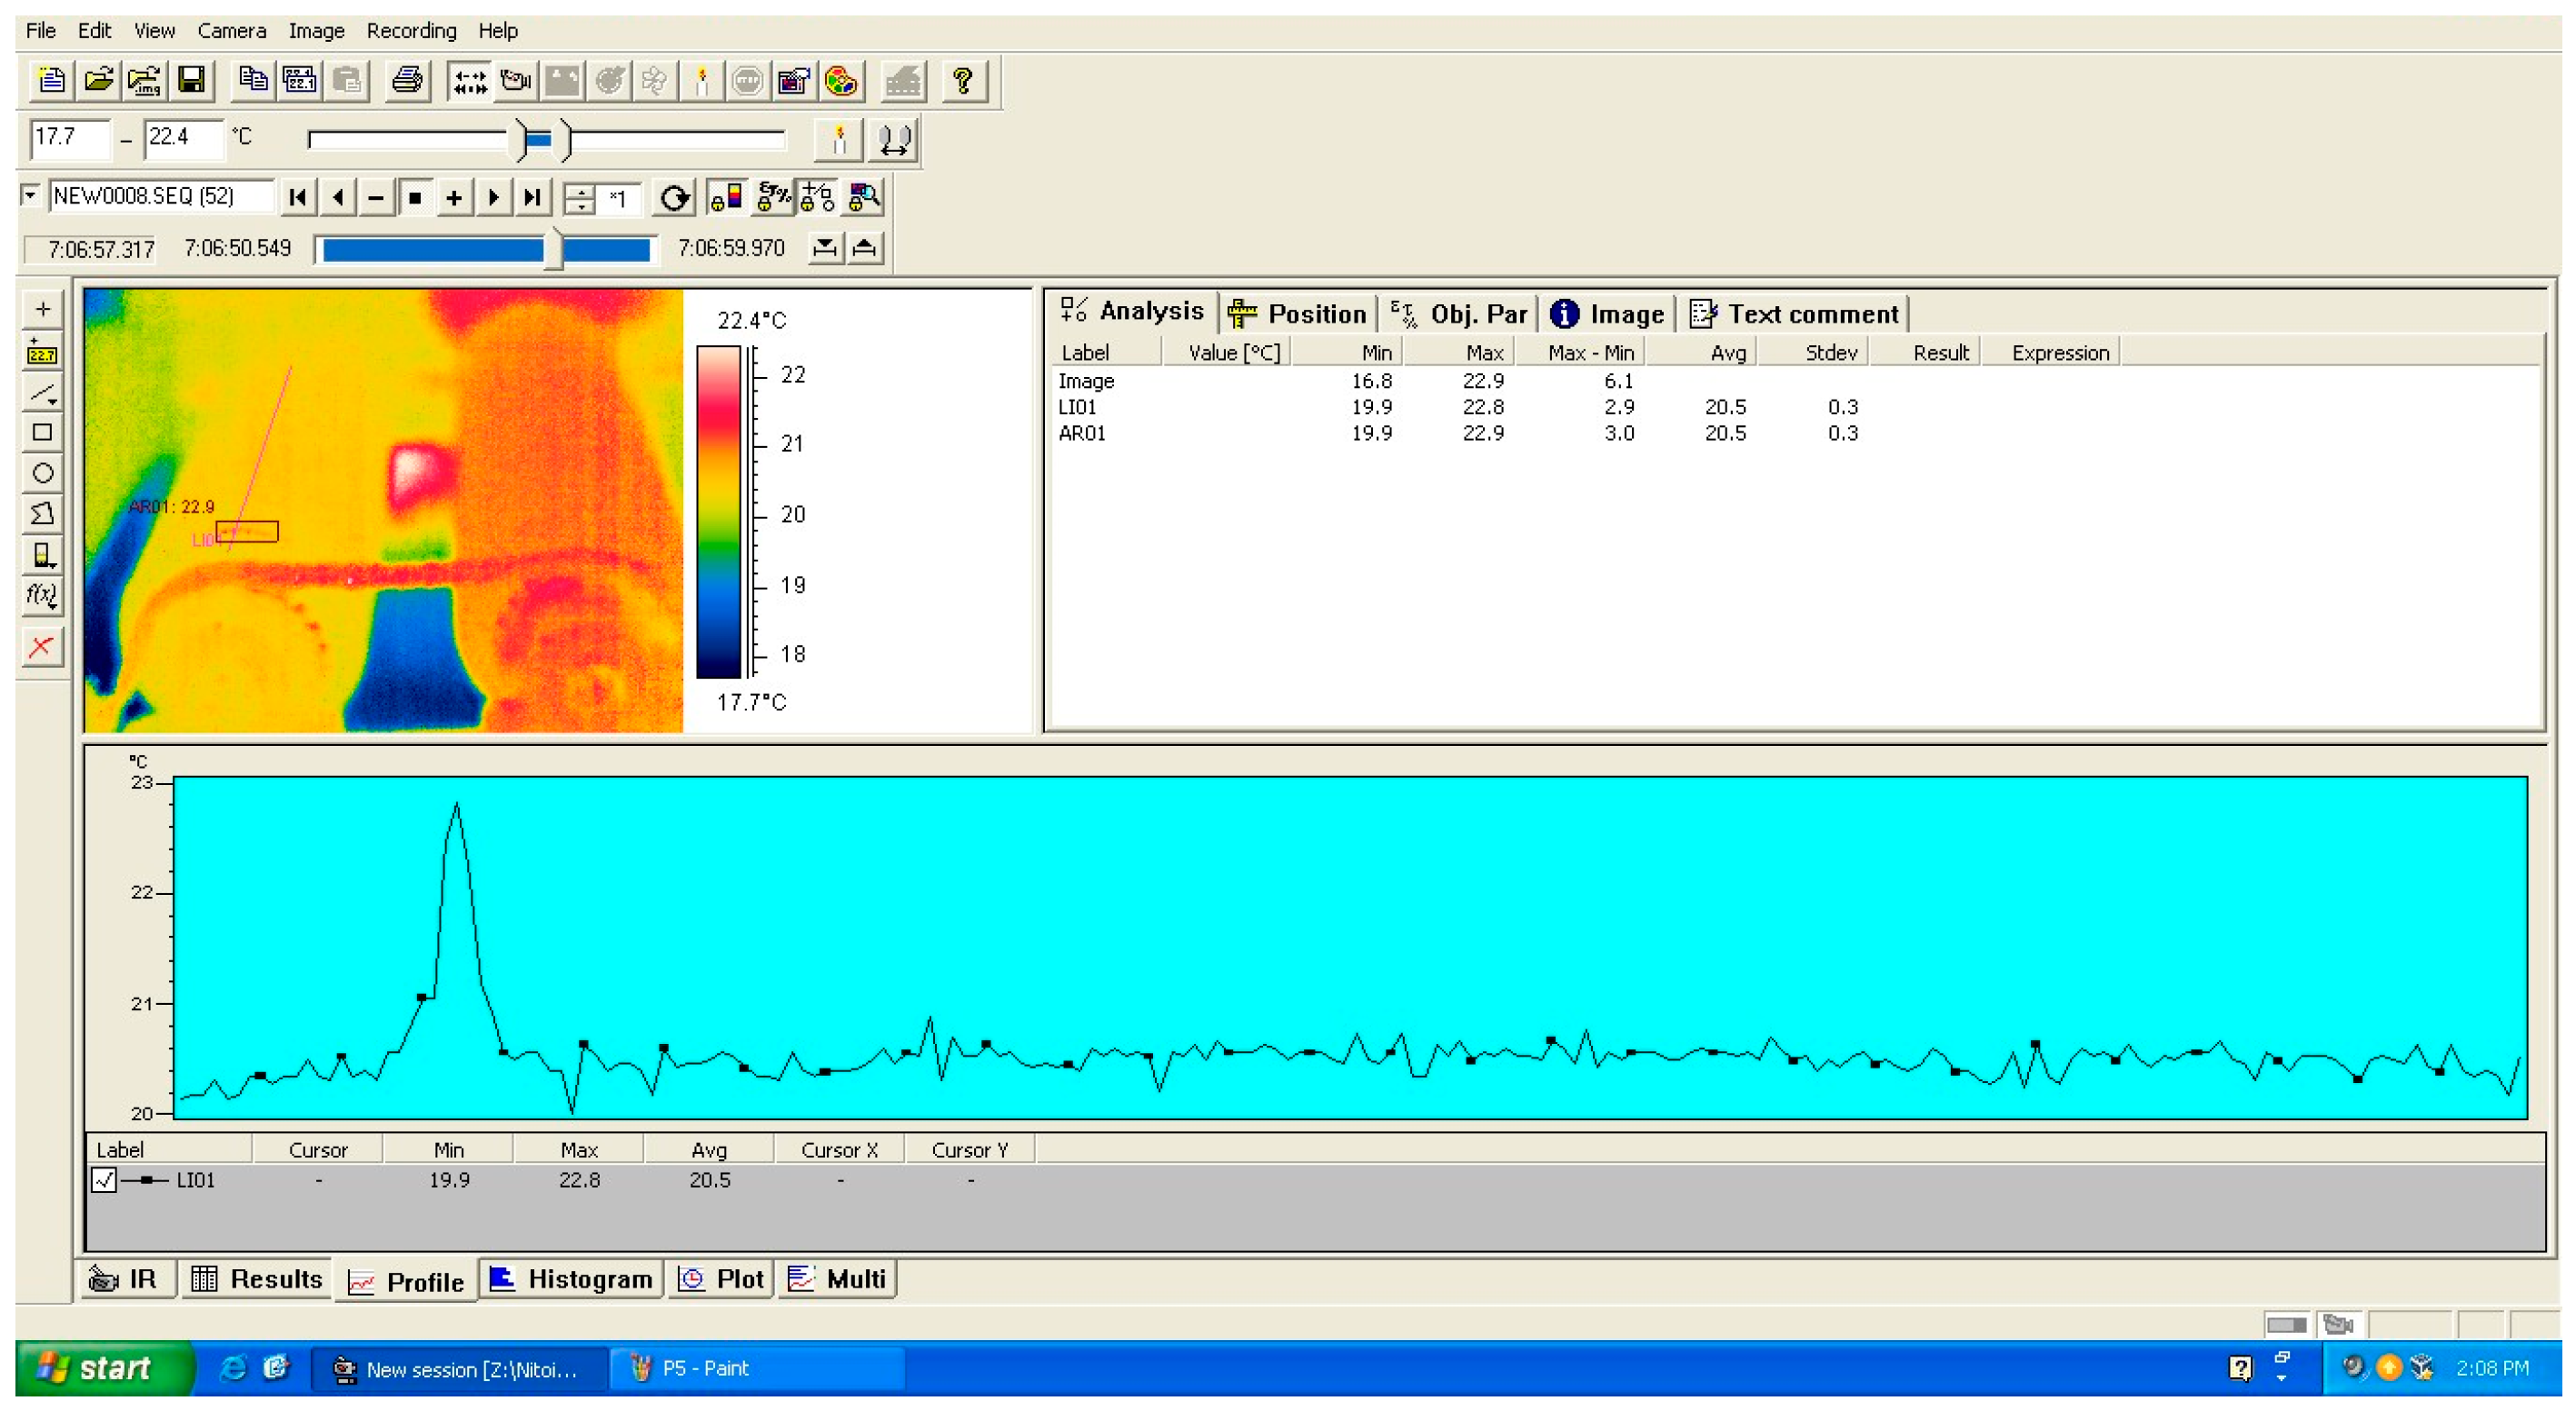
In this regard, Figure 20 shows the analysis corresponding to a cylinder made by deposition in an ultrasonic field. As can be seen, its quality is very good, in the sense that the thickness of the deposited layers is constant, uniform and there are no discontinuities as shown in the figure. Along with any generator line the temperature is constant as can be easily seen from the image analysis. In comparison with the realization of the cylinder in an ultrasonic field, Figure 21 presents a cylinder obtained by classical technology, without an ultrasonic field. As can be seen, marked with a red circle, in certain portions of the cylinder temperature variations appear, which indicates inhomogeneities, discontinuity in its structure.

6. Discussion

Composite structures are systems made up of two or more materials, the properties of which are much improved over each individual material. This type of structure is found in a very wide range of shapes and sizes with applicability in many engineering fields. On the other hand, the manufacturing of composite structures currently involves several aspects of quality and optimization that must be solved. Lack of adhesion, exfoliation, and degradation over time represent only some of the real problems that specialists from different engineering fields focus on to find solutions. This paper has studied and successfully tried to solve some real problems that arise when depositing several layers of epoxy resin reinforced with quartz sand on the surface of metal cylinders. Regarding the research on epoxy resins, the research was carried out in close connection with those presented in the work of R. Somoghi, A. Semenescu [45]. Structures thus created are found in the components of braking stands in the automotive field, and of the drive rollers of conveyor belts, but also in other engineering fields. On the other hand, very important from the point of view of costs and labor productivity, the solidification of this type of structure is achieved in a relatively long time. This means approximately 8 h in conditions of relatively high temperature of the rooms in which the production process takes place. It is important that these cylinders cannot be inserted into ovens with controlled temperatures because they must rotate permanently so that the resin, in its initial liquid state, does not leak. This installation cannot be inserted inside the ovens because it is too massive, and the ovens would have to be too large or expensive. The activity carried out within the research included the analysis of the types of defects encountered in these types of parts. The production technology of this composite structure and the design of an ultrasonic system comes to improve the quality of the products obtained and shorten the time of their realization. To see if ultrasonic activation during the manufacturing of these composite structures based on the use of an epoxy resin matrix is useful in the first technological research step, an experimental stand was created. This consisted of a metal structure supporting an ultrasonic transducer that has a metal plate fixed on which several composite deposits similar to real structures were made. The samples made in the form of strips, deposited with and without the activation of the ultrasonic system, were tested for bending at three points. It was clearly observed how the use of the vibration field achieved adhesion improvement with the base metal plate compared to the samples made in the classical way. In these, during the bending test, a sudden detachment of the composite deposit from the metal surface could be recorded. Secondly, but equally important, a significant decrease in the solidification time of the resin and hardener mixture was observed from approximately 8 h in the case of the classical realization of the structure to approximately 6.5 h when applying the ultrasonic curing method. This represents an obvious and very useful optimization for the manufacturers of these types of parts. In the realization of the experimental stand, the metal plate on which the deposits were made was fixed to the free end of the ultrasonic amplifier of the transducer. Here the vibration amplitude is at its maximum. Next, for the practical use of the ultrasonic transducer used, its analytical design was performed. The main characteristics of this are thus presented, as well as the dimensions of the ultrasonic concentrator that will be used in the real use of the transducer during the manufacture of the parts by their manufacturer. Based on the analytical calculation, a modal analysis was performed through FEM to determine the optimal vibration frequencies of the system, frequencies at which the vibration amplitude has a maximum value and the energy consumption is minimum. This analysis determined the first vibration frequency very close to that at which the ultrasonic system was designed, namely f = 20,732 Hz. Thus, the designed system was practically realized and implemented on the brake cylinder production stand. To prove the usefulness of using the ultrasonic field in the production of this type of composite structures, qualitative analysis was used by thermography. This method can be used practically and quickly right at the production site and with good results. Thermographic analysis has proven once again that the use of the ultrasonic field led to the obtaining of good quality structures, without inclusions, lack of adhesion or possible inhomogeneities. The cylinders obtained by classical technology have proven possible such defects as presented.
On the other hand, using the ultrasonic system periodically, by operating it for 5 min every 15 min, led to a solidification time of approximately 6.5 h instead of approximately 8 h in the usual production. It is worth noting that the ultrasonic field was activated only after approximately one hour of deposition. This was because it was necessary for the resin substrate to be more viscous in order not to leak during the application of vibrations. The vibrations were applied as long the cylinder was not rotating. During its rotation, due to the moving elements, the application of ultrasonics proved ineffective.

7. Conclusions

This research concerns the improvement of the production process of a composite structure used for the manufacture of brake cylinders, which is based on the deposition of two layers of resin mixture and quartz sand reinforcement material. These improvements refer to the manufacturer’s desire to improve the quality and production time of these. In this regard, the following were carried out:
-
analytical calculation of several functional parameters of the ultrasonic curing system as well as the dimensional design of the ultrasonic system starting from the vibration frequency f = 20,000 Hz offered by the manufacturer of the piezoceramic elements;
-
to determine the optimal theoretical vibration frequency, starting from the designed geometric model, a modal analysis was carried out through FEM which resulted in a vibration in the ultrasonic domain of the free end of the ultrasonic concentrator at a frequency f = 20,600 Hz, which validated the initial design. FEM was also used to analyze the mechanical stress states that appeared in the system in order to eliminate any suspicions of damage to the piezoceramic elements during working;
-
experimental specimens tested for three-point bending to demonstrate the validity of the proposed method;
-
experiments carried out on the production stand of composite brake cylinders with the designed ultrasonic system. The real working frequency of the ultrasonic oscillations was f = 20,732 Hz, their theoretical amplitude of approximately 3.3 Um, their application time being 5 min for every 15 min of cylinder rotation. Thus, the solidification time of a deposited layer was reduced from 8 h to approximately 6.5 h;
-
selection and application of a viable quality control method for composite cylinders in workshops, namely thermography. This highlighted the differences in quality of the products obtained by the classical method and by the one with ultrasonic activation.
-
Since the processes for obtaining cylinders of this type require long times, in the future, experimentation with other application times and periods of application of the ultrasonic field is planned.

Author Contributions

Conceptualization, D.F.N. and A.S.; methodology, D.F.N.; validation, O.C. and F.B.; investigation, D.F.N. and C.D.; data curation, V.P., D.-F.M.; writing—original draft preparation, (O.C.).; writing—review and editing, D.F.N.; project administration, F.B. All authors have read and agreed to the published version of the manuscript.

Funding

This work was supported by a grant from the “National Program for Research of the National Association of Technical Universities—GNAC ARUT 2023”. The experiments were performed in the laboratories of the National University of Science and Technology Politehnica Bucharest. The authors have reviewed and edited the output and take full responsibility for the content of this publication.

Institutional Review Board Statement

Not applicable.

Informed Consent Statement

Not applicable.

Data Availability Statement

All data related to this research are presented in this article.

Conflicts of Interest

The authors declare no conflicts of interest.

References

  1. Abo-Qudais, S.A. Effect of concrete mixing parameters on propagation of ultrasonic waves. Constr. Build. Mater. 2005, 19, 257–263. [Google Scholar] [CrossRef] [Scilit]
  2. Vogt, T.; Lowe, M.; Cawley, P. Cure monitoring using ultrasonic guided waves in wires. J. Acoust. Soc. Am. 2003, 114, 1303–1313. [Google Scholar] [CrossRef] [Scilit]
  3. Lionetto, F.; Maffezzoli, A. Monitoring the cure state of thermosetting resins by ultrasound. Materials 2013, 6, 3783–3804. [Google Scholar] [CrossRef] [Scilit]
  4. Lionetto, F.; Maffezzoli, A. Polymer characterization by ultrasonic wave propagation. Adv. Polym. Technol. 2008, 27, 63–73. [Google Scholar] [CrossRef] [Scilit]
  5. Ghodhbani, N.; Maréchal, P.; Duflo, H. Ultrasound monitoring of the cure kinetics of an epoxy resin: Identification, frequency and temperature dependence. Polym. Test. 2016, 56, 156–166. [Google Scholar] [CrossRef] [Scilit]
  6. Yamamoto, T.; Komarov, S.V. Influence of ultrasound irradiation on transient solidification characteristics in DC casting process: Numerical simulation and experimental verification. J. Mater. Process. Technol. 2021, 294, 117116. [Google Scholar] [CrossRef] [Scilit]
  7. Kotadia, H.R.; Qian, M.; Das, A. Solidification of Aluminium Alloys Under Ultrasonication: An Overview. Trans. Indian Inst. Met. 2018, 71, 2681–2686. [Google Scholar] [CrossRef] [Scilit]
  8. Kong, W.; Cang, D. Effects of ultrasound on the flow field in molten steel and solidification structure. Simulation 2011, 88, 694–706. [Google Scholar] [CrossRef] [Scilit]
  9. Nastac, L. Mathematical Modeling of the Solidification Structure Evolution in the Presence of Ultrasonic Stirring. Met. Mater. Trans. B 2011, 42, 1297–1305. [Google Scholar] [CrossRef] [Scilit]
  10. Yifan, W.; Xuelai, Z.; Xiaofeng, X.; Xiangwei, L.; Lu, L. A review on the effect of external fields on solidification, melting and heat transfer enhancement of phase change materials. J. Energy Storage 2020, 31, 101567. [Google Scholar] [CrossRef] [Scilit]
  11. Eskin, D.G.; Tzanakis, I.; Wang, F.; Lebon, G.S.B.; Subroto, T.; Pericleous, K.; Mi, J. Fundamental studies of ultrasonic melt processing. Ultrason. Sonochem. 2019, 52, 455–467. [Google Scholar] [CrossRef] [Scilit]
  12. Ouyang, Q.; Zhang, W.; Li, Z.; Guo, Q.; Fan, G.; Zhang, D. Composite structure modeling and mechanical behavior of particle reinforced metal matrix composites. Mater. Sci. Eng. A 2014, 597, 359–369. [Google Scholar] [CrossRef] [Scilit]
  13. Güemes, A.; Fernandez-Lopez, A.; Pozo, A.R.; Sierra-Pérez, J. Structural Health Monitoring for Advanced Composite Structures: A Review. J. Compos. Sci. 2020, 4, 13. [Google Scholar] [CrossRef] [Scilit]
  14. Senthil, A.; Arockiarajan, R.P.; Santhosh, B.; Usha, K.M. Defects in composite structures: Its effects and prediction methods, A Comprehensive review. Compos. Struct. 2013, 106, 139–149. [Google Scholar] [CrossRef] [Scilit]
  15. He, K.; Hoa, S.; Ganesan, R. The study of tapered laminated composite structures: A review. Compos. Sci. Technol. 2000, 60, 2643–2657. [Google Scholar] [CrossRef] [Scilit]
  16. Swiderski, W. Lock-in thermography to rapid evaluation of destruction area in composite materials used in military applications. In Proceedings of the Sixth International Conference on Quality Control by Artificial Vision, Gatlinberg, TN, USA, 19–22 May 2003; Volume 5132. [Google Scholar]
  17. Hassani, S.; Mousavi, M.; Gandomi, A.H. Structural Health Monitoring in Composite Structures: A Comprehensive Review. Sensors 2022, 22, 153. [Google Scholar] [CrossRef] [Scilit]
  18. Groves, R.M. Inspection and Monitoring of Composite Aircraft Structures, Comprehensive Composite Materials II; Beaumont, P.W.R., Zweben, C.H., Eds.; Elsevier: Amsterdam, The Netherlands, 2018; pp. 300–311. [Google Scholar]
  19. Katunin, A.; Dragan, K.; Dziendzikowski, M. Damage identification in aircraft composite structures: A case study using various non-destructive testing techniques. Compos. Struct. 2015, 127, 1–9. [Google Scholar] [CrossRef] [Scilit]
  20. Kim, J.-K.; Tjong, S.C.; Mai, Y.W. Effect of Interface Strength on Metal Matrix Composites Properties. In Comprehensive Composite Materials II; Beaumont, P.W.R., Zweben, C.H., Eds.; Elsevier: Amsterdam, The Netherlands, 2018; pp. 22–59. [Google Scholar]
  21. Bittmann, B.; Haupert, F.; Schlarb, A.K. Ultrasonic dispersion of inorganic nanoparticles in epoxy resin. Ultrason. Sonochemistry 2009, 16, 622–628. [Google Scholar] [CrossRef] [Scilit]
  22. Sandler, J.; Shaffer, M.S.P.; Prasse, T.; Bauhofer, W.; Schulte, K.; Windle, A.H. Development of a dispersion process for carbon nanotubes in an epoxy matrix and the resulting electrical properties. Polymers 1999, 40, 5967–5971. [Google Scholar] [CrossRef] [Scilit]
  23. Kovaleva, E.G.; Savotchenko, S.E. Kinetics of epoxy resin optical characteristics during ultrasonic processing. J. Compos. Mater. 2021, 56, 387–395. [Google Scholar] [CrossRef] [Scilit]
  24. Liu, Z.; Wang, H.; Chen, Y.; Kang, G.; Hua, L.; Feng, J. Study on Curing Kinetics and the Mechanism of Ultrasonic Curing of an Epoxy Adhesive. Polymers 2022, 14, 512. [Google Scholar] [CrossRef] [Scilit]
  25. Hui, W.; Zhaoyi, L.; Yizhe, C.; Lin, H.; Yi, Q. Effect of ultrasonic pretreatment on thermo-mechanical properties of epoxy ad-hesive. Mater. Res. Express 2021, 8, 075305. [Google Scholar]
  26. Szewczak, A.; Szelag, M. Modifications of Epoxy Resins and their Influence on their Viscosity. IOP Conf. Ser. Mater. Sci. Eng. 2019, 471, 022038. [Google Scholar] [CrossRef] [Scilit]
  27. Masturi; Putut, M.; Sunarno; Supriadi, R. Effect of quartz sand on compressive strength of the solid waste composite. AIP Conf. Proc. 2016, 1712, 050006. [Google Scholar] [CrossRef] [Scilit]
  28. Gupta, A.K.; Dan, T.K.; Rohatgi, P.K. Aluminium alloy-silica sand composites: Preparation and properties. J. Mater. Sci. 1986, 21, 3413–3419. [Google Scholar] [CrossRef] [Scilit]
  29. Sayed, M.D.; Dingena, L.S.; Lodewijks, G. Micro–macro properties of quartz sand: Experimental investigation and DEM simulation. Powder Technol. 2015, 269, 127–138. [Google Scholar] [CrossRef] [Scilit]
  30. Bałaga, Z.; Biedak, D.; Gnatowski, A. Examinations of properties and structure of polymer composites with quartz filler. Compos. Theory Pract. 2015, 15, 228–232. [Google Scholar]
  31. Aghazadeh Mohandesi, J.; Refahi, A.; Sadeghi Meresht, E.; Berenji, S. Effect of temperature and particle weight fraction on mechanical and micromechanical properties of sand-polyethylene terephthalate composites: A laboratory and discrete element method study. Compos. Part B Eng. 2011, 42, 1461–1467. [Google Scholar] [CrossRef] [Scilit]
  32. ISO Standard 178:2003; Plastics—Determination of flexural properties (British Standard). British Standards Institution (BSI): London, UK, 2003. Available online: https://webstore.ansi.org/standards/bsi/bseniso1782003 (accessed on 12 December 2025).
  33. Amza, G. Sisteme Ultraacustice; Tehnica; Publising House: Bucuresti, Romania, 1991. [Google Scholar]
  34. Amza, G. Actuatori Electromecanici Neconvenţionali; Publising House: Bucuresti, Romania, 2002. [Google Scholar]
  35. You, Z.; Zaghloul, M. Changes in Permittivity of the Piezoelectric Material PVDF as Functions of the Electrical Field and Temperature. Materials 2021, 14, 5736. [Google Scholar] [CrossRef] [Scilit]
  36. Available online: https://www.ndt.net/index.php (accessed on 12 February 2025).
  37. Law, H.H.; Rossiter, P.L.; Simon, G.P.; Koss, L.L. Characterization of mechanical vibration damping by piezoelectric mate-rials. J. Sound Vib. 1996, 197, 489–513. [Google Scholar] [CrossRef] [Scilit]
  38. Lin, S.; Zhang, F. Measurement of ultrasonic power and electro-acoustic efficiency of high power transducers. Ultrasonics 2000, 37, 549–554. [Google Scholar] [CrossRef] [Scilit] [PubMed]
  39. Banno, H.; Masamura, Y.; Naruse, N. Acoustic load dependency of electroacoustic efficiency in the electrostrictive ultrasonic transducer and acoustical matching. Ultrasonics 1979, 17, 63–66. [Google Scholar] [CrossRef] [Scilit]
  40. Geng, Y.Y.; Liu, L.; Leng, H.; Li, H.; Wang, X.; Priya, Y.; Jeba, S. Near-ideal electromechanical coupling in textured piezoelectric ceramics. Nat. Commun. 2022, 13, 3565. [Google Scholar] [CrossRef] [Scilit]
  41. Gowdhaman, P.; Annamalai, V.; Thakur, O.P. Piezo, ferro and dielectric properties of ceramic-polymer composites of 0–3 connectivity. Ferroelectrics 2016, 493, 120–129. [Google Scholar] [CrossRef] [Scilit]
  42. Jianjun, W.; Weijie, L.; Chengming, L.; Peijun, W. Effective determination of Young’s modulus and Poisson’s ratio of metal using piezoelectric ring and electromechanical impedance technique: A proof-of-concept study. Sens. Actuators A Phys. 2021, 319, 112561. [Google Scholar]
  43. Available online: https://www.americanpiezo.com (accessed on 11 May 2025).
  44. Available online: https://www.nde-ed.org/NDETechniques/Ultrasonics/CalibrationMeth/standreferences.xhtml (accessed on 11 May 2025).
  45. Şomoghi, R.; Semenescu, A.; Pasăre, V.; Chivu, O.; Nițoi, D.; Marcu, D.; Florea, B. The Impact of ZnO Nanofillers on the Mechanical and Anti-Corrosion Performances of Epoxy Composites. Polymers 2024, 16, 2054. [Google Scholar] [CrossRef] [Scilit]
Figure 1. Execution drawing of the metal cylinder used to apply the composite structure.
Applsci 16 00781 g001
Figure 2. Obtaining the composite structure of brake cylinders; (a)—deposition of the first layer of the composite structure; (b)—deposition of the second layer of the composite structure and the finished product; (c)—epoxy resin and corresponding hardener used; (d)—corresponding hardener.
Applsci 16 00781 g002
Figure 3. Heating the manufacturing room to maintain uniformity; (a)—temperature measurement with termovision camera; (b)—manufacturing break cylinders in the heated room.
Applsci 16 00781 g003
Figure 4. Defects of composite structures; (a,b) exfoliation of the composite layers; (c) premature wear.
Applsci 16 00781 g004
Figure 5. Experimental stand for manufacturing a composite structure; (a) experimental stand for the ultrasonic curing system used in generating the ultrasonic vibrations that consists of the ultrasonic transducer—1, metal frame—2, metal plate—3 for composite structure deposition, ultrasonic generator—4; (b) first layer of the composite structure deposition.
Applsci 16 00781 g005
Figure 6. Scheme of three-point bending test of composite specimens; (a)—schematic of the bending test; (b)—composite specimen before test; (c)—composite specimen after test.
Applsci 16 00781 g006
Figure 7. Sample 1a presentation for ultrasonic curing deposition probe; (a) before testing; (b) after testing.
Applsci 16 00781 g007
Figure 8. Testing the probe 1a made in ultrasonic field; (a) the displacement–force graph; (b) the displacement–flexure stress and the corresponding rapport.
Applsci 16 00781 g008
Figure 9. Presentation of specimen 1b for conventional deposition probe; (a)—before testing; (b)—after testing.
Applsci 16 00781 g009
Figure 10. Testing the probe 1b made using classic technology; (a) the displacement—force graph; (b) the displacement—flexure stress graph and the corresponding rapport.
Applsci 16 00781 g010
Figure 11. Displacement–force graph for the second group of probes; (a) probe made using ultrasonic vibration technology; (b) probe made using classic technology.
Applsci 16 00781 g011
Figure 12. Overall scheme of the ultrasonic system used to activate the deposited composite structure on the metal cylinder; 1—piezoceramic disks; 2—ultrasonic reflector; 3—the ultrasonic amplifier; 4—nodal flange; 5—the ultrasonic concentrator.
Applsci 16 00781 g012
Figure 13. Structure of the piezoceramic transducer; 1—ultrasonic energy concentrator, 2—nodal flange, 3—ultrasonic amplifier, 4—group of piezoceramic elements, 5—ultrasonic reflector.
Applsci 16 00781 g013
Figure 14. Presentation of the ultrasonic system displacements reported to the three axes for the vibration frequency f = 20,600 Hz; (a)—displacements reported to the OX axis, (b)—displacements reported to the OY axis, (c)—displacements reported to the OZ axis, (d)—sum of the displacements.
Applsci 16 00781 g014
Figure 15. Presentation of the calculated stresses in the ultrasonic transducer system; (a)—stresses reported to the OX axis; (b)—stresses reported to the OY axis; (c)—stresses reported to the OZ axis.
Applsci 16 00781 g015
Figure 16. Presentation of mechanical stress: (a)—S1, (b)—S2, (c)—S3.
Applsci 16 00781 g016
Figure 17. Presentation of shear stresses; (a)—in the XOY plane, (b)—in the XOZ plane, (c)—in the YOZ plane.
Applsci 16 00781 g017
Figure 18. Presentation of Von Mises mechanical stress for vibrations at frequency f = 20,600 Hz.
Applsci 16 00781 g018
Figure 19. Realization of the ultrasonic assembly used in improving the quality of composite structures; (a) making the mounting flange for the ultrasonic system, (b) orienting and positioning the ultrasonic system on the workbench; (c) ultrasonic generator on working frequency f = 20,732 Hz.
Applsci 16 00781 g019
Figure 20. Quality control of composite structure made by deposition in an ultrasonic field using a thermal imaging camera; (a) image of the tested cylinder and the line along which the temperature measurement was made, (b) uniform temperature variation along the corresponding line of the cylinder in the case of ultrasonic field manufacturing.
Applsci 16 00781 g020
Figure 21. Quality control of composite structure made without ultrasonic field using a thermal imaging camera. Image’s upper part represents the image of the controlled cylinder showing defects along a controlled line. Image’s lower part shows the temperature variation along a line of the cylinder where the temperature peak represents a defect highlighted by thermographic analysis.
Applsci 16 00781 g021
Disclaimer/Publisher’s Note: The statements, opinions and data contained in all publications are solely those of the individual author(s) and contributor(s) and not of MDPI and/or the editor(s). MDPI and/or the editor(s) disclaim responsibility for any injury to people or property resulting from any ideas, methods, instructions or products referred to in the content.