Article

Valorization of Chestnut Outer Shell, a Waste Biomass from the Chestnut Supply Chain: Source of Phenols or Additive for Breadmaking

1
Dipartimento di Scienze e Tecnologie Agrarie, Alimentari, Ambientali e Forestali (DAGRI), Università Degli Studi di Firenze, Piazzale Delle Cascine 16, 50144 Florence, Italy
2
Department of Human Science and Quality of Life Promotion, Università Telematica San Raffaele Roma, Via di Val Cannuta 247, 00166 Rome, Italy
*
Author to whom correspondence should be addressed.
Appl. Sci. 2026, 16(2), 1133; https://doi.org/10.3390/app16021133
Submission received: 5 November 2025 / Revised: 15 January 2026 / Accepted: 20 January 2026 / Published: 22 January 2026
(This article belongs to the Special Issue Recent Trends in the Valorization of Natural Products and Food Wastes)

Abstract

Global chestnut production has grown significantly in recent years, driven by its health benefits and growing interest in sustainable agriculture. Chestnut processing produces a solid residue consisting primarily of the fruit’s outer shell (pericarp), which is generally disposed of by on-farm combustion. However, this waste biomass shows a high potential for valorization due to its nutritional composition, particularly as a source of dietary fiber and polyphenols. In this study, the valorization potential of chestnut outer shells was evaluated through two approaches, demonstrating possible applicability at an industrial level: (1) the recovery of polyphenols using a simple and environmentally friendly extraction method, easily applicable on-farm, based on hot water as a solvent under different time–temperature combinations according to Response Surface Methodology (Central Composite Design); (2) the addition of chestnut outer shell flour during breadmaking as a source of fiber supplementation. Optimization of the extraction process using Response Surface Methodology combined with the desirability function identified optimal conditions at 102 min and 115 °C, yielding a maximum of approximately 172.30 mg of polyphenols per gram of dry outer shell. The incorporation of chestnut outer shell flour into bread formulations resulted in reduced dough workability, increased crust hardness (13.00 ± 0.87; 36.00 ± 1.00), and a darker bread color (1278.33 ± 39.27; 584.33 ± 25.90 RGB), particularly in the crumb.

1. Introduction

In recent years, chestnut production has grown significantly. According to FAO data, in the European area, the harvest has doubled, reaching about 321.530 tons in the period 2020–2023 [1]. The main producers are Italy, Portugal, Spain, and Greece, where chestnuts represent an important source of income, thanks to the health benefits associated with their consumption and the growing trend towards sustainable agriculture, in which the chestnut value chain plays a key role [2,3].
Throughout the entire chestnut production chain, from cultivation and harvesting to processing and final consumption, a substantial quantity of by-products is generated. These include leaves, twigs, outer shells (pericarps), and inner shells (integuments). As chestnut consumption continues to grow, so does the volume of residual biomass associated with its processing. Although a significant portion of chestnuts are marketed and consumed fresh, a considerable share is directed toward the production of processed goods such as chestnut flour and jam. These processing activities contribute to the generation of by-products at an industrial scale, highlighting the need for effective valorization strategies within the chestnut supply chain [4,5,6].
The main by-product generated throughout the chestnut supply chain is the shell. Chestnut shells account for approximately 20% of the total fruit weight, with the outer shell (pericarp) representing about 9–13% and the inner shell (integument) about 6–10%. Currently, chestnut shells are a largely underutilized by-product, primarily employed as a fuel for energy production or directed toward composting [7].
However, the pericarp of the chestnut has a complex and diverse composition; it is mainly made up of cellulose, lignin, and monosaccharides such as glucose and xylose, as well as a high content of polyphenols. This gives it a significant nutritional profile, making it potentially usable as a source of dietary fiber [8,9]. In addition, the high content of polyphenols, including tannins, phenolic acids, and flavonoids, represents an important source of bioactive compounds, widely studied for their antioxidant, antimicrobial, antiviral, and astringent properties [3,10].
In light of the above, the outer shell of chestnuts (COSs) represents an important biomass and a valuable source of high-added-value compounds that should be enhanced and directed toward alternative and more noble uses, promoting a circular economy and contributing to the sustainable management of agri-food by-products.
The current challenge lies in developing and studying adequate and efficient processing techniques while maintaining high quality standards. Addressing these issues requires a systemic and innovative approach capable of integrating sustainable practices and advanced technologies into the valorization of waste by-products such as chestnut pericarp. Although chestnut processing generates large amounts of by-products with promising functional properties, their effective valorization within a circular economy framework remains limited. In this context, the present study aims to explore the potential valorization of chestnut outer shells (COSs) through two alternative recovery methods. The first study involves the recovery of bioactive compounds from the outer shell using eco-friendly extractions, employing only water as the solvent under different combinations of time and temperature. The goal is to optimize the extraction process by minimizing inputs and maximizing outputs [11].
The second study investigates the use of chestnut pericarp as a potential alternative additive in breadmaking, with the aim of identifying a viable substitute for conventional additives. Specifically, the study seeks to evaluate how the incorporation of chestnut outer shell as a novel ingredient influences the rheological behavior of dough and the physical characteristics of the resulting bread. This approach is intended to generate useful insights for both the food industry and consumers, contributing to the diversification of bakery products and promoting the development of more sustainable and health-oriented food alternatives. In fact, dietary fibers are currently the focus of extensive research due to their well-documented benefits related to both health and sensory properties. Adequate fiber intake has been associated with several positive health effects, including improved intestinal function, prebiotic activity, reduced blood cholesterol levels, and attenuation of postprandial blood glucose and insulin responses [12]. It is well-established that the incorporation of dietary fibers from various sources into food products can significantly affect their functional properties [13,14,15]. Although the functional potential of chestnut peels has been previously investigated for the enrichment of selected food products, scientific evidence regarding their specific application in breadmaking remains limited [16]. Therefore, this study aims to enhance the understanding of the effects of chestnut outer shell incorporation on dough rheology and bread quality. The outcomes are expected to provide valuable information for the food industry and consumers, supporting the development of diversified bakery products and contributing to more sustainable and nutritionally improved food systems [9,13,15].

2. Materials and Methods

2.1. Trial A

2.1.1. Sample Preparation

Chestnut residue, composed of the outer shell, was collected in the Casentino area between the towns of Chiusi della Verna and Ortignano Raggiolo, Arezzo. The samples were brought to the DAGRI Department of the University of Florence, where the two experimental tests were conducted. The tests are referred to as “trial A” and “trial B,” corresponding to the optimization of bioactive compound extraction and the baking test, respectively.
For the trial A, 6 kg of outer shell was used. To optimize the extraction, it was decided to employ an industrial mincer (Minerva Omega group s.r.l., Bologna, Italy) equipped with a grid with a mesh width of 0.5 mm. A ratio of 1:25 was chosen; for each extraction, 100 g of minced residue by-product and 2.5 L of deionized water were weighed and subsequently placed in the pressure cooker to proceed with the extractions at different times and temperatures.

2.1.2. Extraction Procedure

The experiment was carried out by applying the statistical method called Response Surface Methodology (RSM), specifically, a Central Composite Design (CCD). In statistics, RSM explores the relationships between multiple explanatory variables and one or more response variables. The goal of RSM is to identify the optimal operating conditions for a system, or, more generally, to determine a region within the experimental space where the desired operating requirements are satisfied [17].
In accordance with the literature [18], two variables (time and temperature) were selected to test each at 5 levels (−α; −1; 0; +1; α), with α = 1.414. A Box–Wilson Central Composite Design, commonly called Central Composite Design (CCD), allowed us to conduct 12 total extractions; the central point was conducted in triplicate. The response variable considered was the total phenols concentration (mg/g) (TPC).
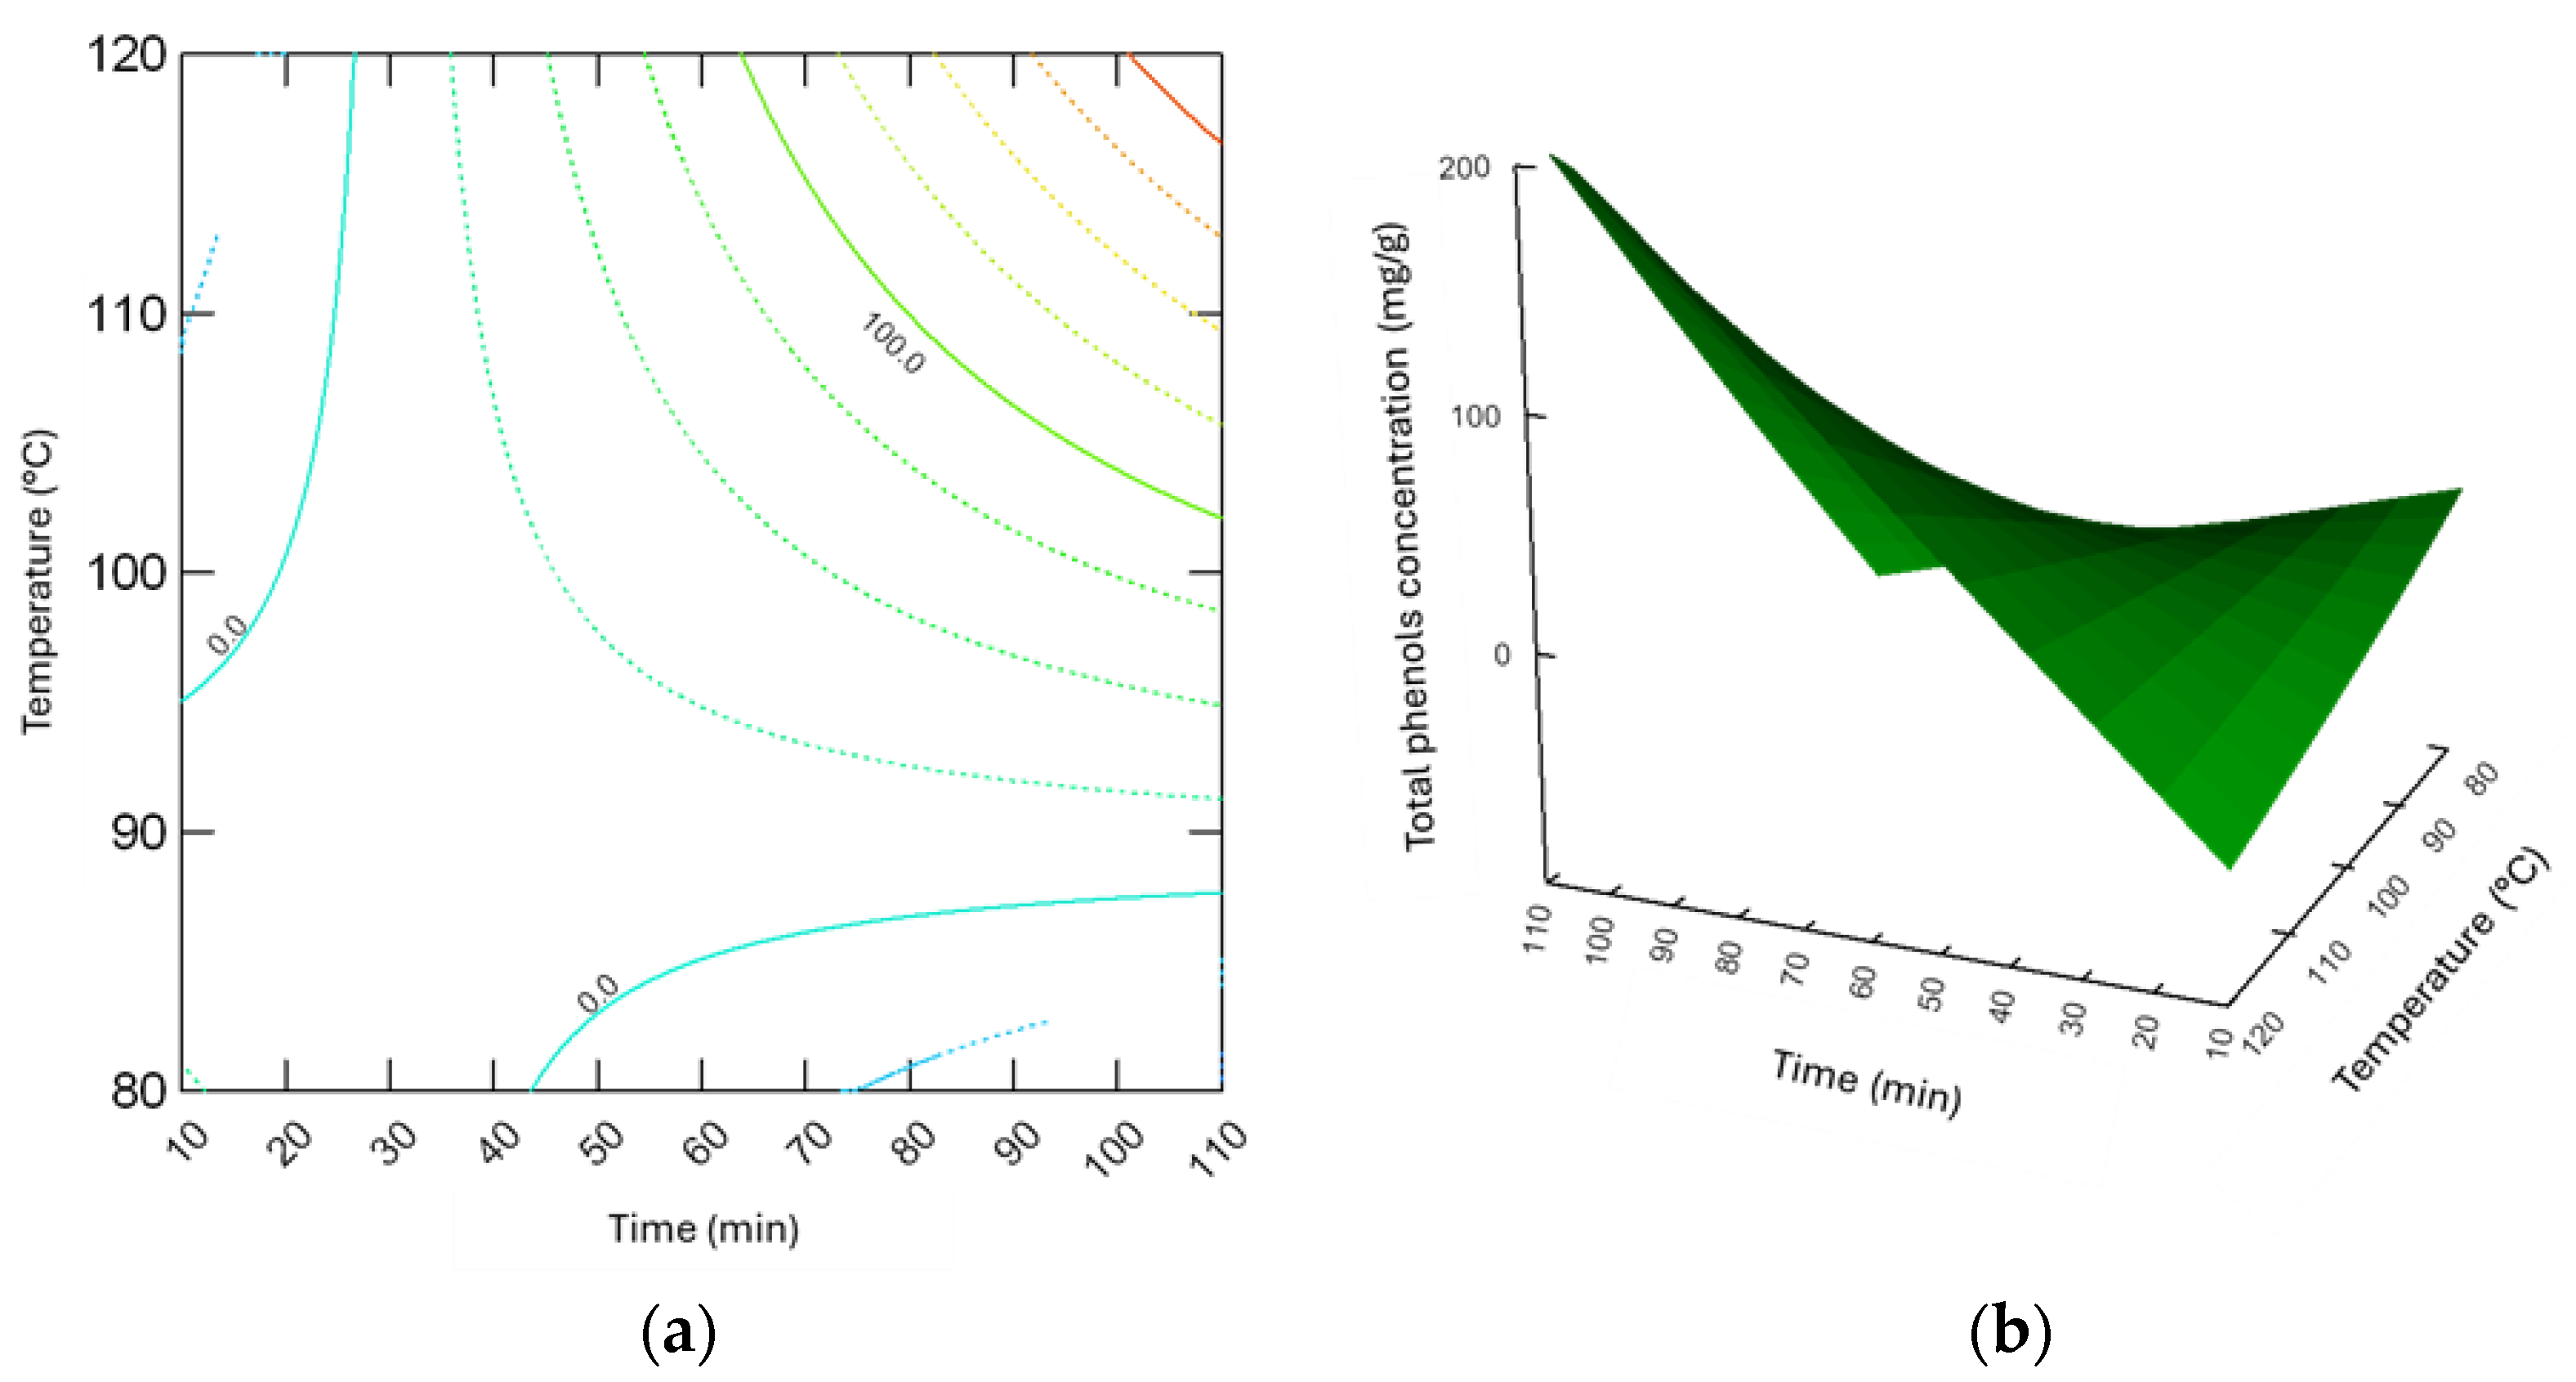
A predictive model of time (t) and temperature (T), as a function of TPC, was developed by applying the RSM to the data based on linear combinations of the variables time (t) and temperature (T) and their interaction (t × T). Goodness of fit was tested through ANOVA regression, and models were represented graphically by a level curves diagram. Subsequently, the desirability function (DF) was used to find the best compromise (time and temperature) to maximize the total phenols concentration based on the mathematical models built in RSM.
The levels of the tested factors are reported in Table 1 [18], while the combination of the factors tested at different levels is reported in Table 2.
For extractions at temperatures above 100 °C, the special lid was used to bring to the boil under pressure, while, for extractions at a temperature of 100° C, only the pot was used, bringing the contents to the boil without using the lid. Finally, for temperatures below 100 °C, the pot was placed in a thermostatic bath (GTR 190), using a thermometer to control the optimal temperature chosen. All temperatures were monitored using a probe thermometer (Hanna Edge, HANNA Instruments, Padova, Italy).
Subsequently, the liquid remaining from boiling was drained with the strainer, thus separating it from the chestnut residues and both were weighed and compared with their initial weight (before boiling). The extraction liquid was placed in Falcon tubes (Fisher Scientific, Hampton, NY, USA) weighing each one with the high precision balance (Orma model bc, ORMA s.r.l., Sesto San Giovanni, Milano, Italy) to ensure their weight uniformity (maximum tolerance between the various samples ± 3 mg), after which the tubes were centrifuged at 6000 rpm for five minutes (Hermle Z606 A, HERMLE Labortechnik GmbH, Wehingen, Germany). A further filtering of the contents of the tubes was then performed with the coffee paper filter (Melitta, Minden, Germany), to eliminate any further residues of solid particles, after which the remaining liquid was placed in new tubes. Finally, both the solid residues contained in the freezer bag and the final tubes were stored in the freezer.

2.1.3. Statistical Analysis

Each extract was then appropriately characterized with the following physical–chemical analyses. SYSTAT software (version 13.2) was used for the determination of the regression equations, the analysis of the response surface and plots, and statistical analysis of the experimental design.

2.1.4. Physicochemical Analysis

A benchtop digital pH meter (Hanna Edge, HANNA instruments, Padova, Italy) was used to determine the pH of each extraction. The product from each tube was poured into a beaker to facilitate the immersion of the pH meter electrode at 3 cm. The procedure was repeated three times for each sample. Finally, the average of the three pH values for each extraction was calculated and reported.
Each extraction was analyzed by calculating the TDS (total dissolved solids) value. A VST Lab Coffee III digital refractometer (Voice Systems Technology, Sebastopol, CA, USA) was needed for this procedure. The purpose of the refractometer is to record the intensity of the light reflected by the solution under examination, directly returning a TDS % value. A sample of each extraction was taken with a plastic pipette to place a few drops on the glass reading prism. The procedure was repeated three times for each extraction, calculating the average for each.
The bitter index measurement was performed using a syringe and a 1 mL sample was aspirated with an automatic pipette (Eppendorf Italy, Milano, Italy) from each extraction, which was then filtered at 0.45 μm (Isolab, Eschau, Germany). Afterwards, the bitter index evaluation was performed for each extraction, through the UV-1200 spectrophotometer (LC Instruments, Berlin, Germany) at a wave frequency of 225 nm, and a quartz cuvette containing the sample diluted with osmotized water 1:1000 [18]. This instrument was used to determine the concentration of molecules dissolved in a sample. For each dilution, the analysis was performed three times and then the average was calculated (acceptable values from 0 to 1). This methodology allowed the isolation of minor polar compounds, including polyphenols, which in chestnuts are responsible for the bitter taste.
To calculate the fixed residue, a beaker was used for each extraction, in which the contents of the test tube were transferred and weighed with an Orma model bc precision balance. All the beakers were placed inside the drying oven (Thermo Heraeus B6060, Thermo Fisher Scientific, Waltham, MA, USA) at 180° C for 24 h.
The determination of total polyphenols was performed according to the Folin–Ciocâlteu methodology; the reagent was used to determine total polyphenols in a solution and other reducing substances. It is a mixture of sodium phosphomolybdate (Na3PMo12O40) and sodium phosphotungstate (Na3PW12O40). In these compounds, molybdenum and tungsten both have an oxidation number of +6. The method is based on an oxidation–reduction reaction, following which the molybdenum and tungsten contained in the Folin–Ciocâlteu reagent were reduced to oxidation numbers of +4 and +5. A blue chromophore was formed whose absorption maximum depended on the concentration of the phenolic compounds.
The total phenolic content (TPC) was determined spectrophotometrically according to the Folin–Ciocâlteu procedure [19]. A total of 500 μL of extract was mixed with 2.5 mL of Folin–Ciocâlteu reagent and left to react for 5 min. Then, 2.5 mL of 7.5% Na2CO3 solution was added and made up to 10 mL with deionized water. Subsequently, it was added and left to stand for 15 min at 45° C and 30 min at room temperature. Absorbance was determined at 765 nm using a UV-1200 spectrophotometer (LC Instruments, Berlin, Germany).
The calibration curve was obtained using standard gallic acid by taking the 20% water–ethanol solvent as a stock solution and reacting it with Folin–Ciocalteu to obtain a correlation between the absorbance of the sample and the standard concentration (linearity range = 5–100 μg mL−1, R2 > 0.998). In addition to the stock solution, 10 dilutions were analyzed with the spectrophotometer (in increasing order from a minimum of 1:1.25 to a maximum of 1:1000). The TPC of the extracts was expressed in mg of gallic acid equivalents (GAE) per gram of plant material on a dry weight (dw) basis [5].

2.2. Trial B

2.2.1. Sample Preparation

For Trial B, two types of bread were prepared, each in triplicate: one bread was obtained using 100% wheat flour (Triticum aestivum, Molino Mettone, Cuneo, Italy), another bread was obtained by adding the flour composed of COSs in a percentage of 3%, based on Reg. (EC) No. 1924/2006 [20]. Specifically, the formulation involved the incorporation of 3 g of COSs into 97 g of wheat flour, Reg. (EC) No. 1924/2006 [20]. The flour in question has a sifting degree similar to type “0”, as per Italian legislation; with regard to nutritional values, proteins correspond to 10.3 g, starch to 71 g, and, finally, humidity is equal to 14.4%. The choice to use wheat flour was clearly motivated by the type of study carried out and consequently by its well-known breadmaking characteristics. Other ingredients used in the preparation of the breads include natural mineral water (Levissima, Sondrio, Italy) with a hardness of 6.1° F, dehydrated “brewer’s” yeast (Saccharomyces cerevisiae, Cameo S.p.a., Brescia, Italy), and sea salt (NaCl, Atisale, Barletta, Italy). The amount of water was equal to 200 mL, thus ensuring a constant hydration level of 57%, while both salt and yeast were previously measured, with the aid of the measuring spoon supplied with the bread machine, and subsequently weighed. All the ingredients were kept at room temperature (18 °C). Then, the flours were carefully weighed and inserted into the bread machine basket (Pain doré, Moulinex, Ecully, France), using the WWF program (mixing step: 25 min at room T, resting and leavening: 1 h and 20 min at 40 °C, baking: 55 min at 180 °C), followed by the incorporation of salt, yeast, and water according to the predefined proportions; for the series of tests where the addition of the flour was planned, this was added as the last ingredient. At the end of the preset program, the bread was removed from the basket and left to cool at room temperature [21].

2.2.2. Physicochemical Analysis

Various types of analyses were carried out to fully understand and characterize the chemical–physical properties of the products obtained with the tested flours.
Chopin’s Alveograph (Belotti Strumenti S.r.l., Milano, Italy) is an instrument composed of a kneading chamber, a turntable, and a data recording system. The kneading chamber is where the dough to be tested is inserted, while the turntable is made up of a peculiar structure that allows air to be blown in from the bottom so as to exert a force on the dough and then evaluate its rheological properties. During the test, the dough is worked for a period of 8 min inside the chamber with the addition of a known solution of sodium chloride (prepared by adding 25 g of NaCl to 1 L of distilled water) in order to ensure standardized conditions. It is then extruded, pressed, formed into circular disks, and left to rest for a total of 20 min in the special leavening chamber (at a controlled temperature of 24 °C) before being measured. During this measurement phase, the machine records several variables, including the dough tenacity (P), its extensibility (L), the ratio between tenacity and extensibility, i.e., the degree of extensibility of the flour (P/L), the swelling index (G), and the overall strength of the dough (W).
The volume of the bread was evaluated using the seed displacement method or “millet method” (AACC Standard 10-05.01) [22] which, in addition to its reliability, allows for correct measurement of the product given its shape. At the same time, the mass was measured, thus providing a solid basis for calculating the specific volume of the bread (L/kg), which will be the result of the ratio between the volume (L) and the mass (kg). To add further details to the characterization of the bread, the maximum height was measured using a precision caliper, which allowed for a precise evaluation of the external dimensions of the product, also providing a parameter for evaluating the expansion of the cooked dough. At the same time, the consistency of the crust was evaluated using a durometer, and therefore in terms of crust hardness. The durometer (Durometer—Shore A, Novotest, INNOVATEST Europe BV, Maastricht, The Netherlands), although designed for purposes other than these, has proven to be a useful tool for understanding the external resistance of bread. Measurements were carried out on bread slices with a minimum thickness of 6 mm after cooling to room temperature. Samples were placed with the crust facing upward on a rigid, flat surface. The durometer was applied perpendicular to the crust surface using constant manual pressure until full contact of the presser foot was achieved. Hardness values were recorded once the reading stabilized. For each sample, 3 measurements were taken at different points on the crust, at least 6 mm apart, and the mean value was used for data analysis.
In order to explore the visual aspect of the bread, two distinct measurements were adopted: first, the colorimetric evaluation of the bread (PCE-RGB2, Pce Italia, Capannori, Italy), both for the crust and the crumb, and jointly the alveolation of the bread was evaluated by photographing the central region of a slice of bread, 20 mm thick and obtained from half of the whole loaf, thus offering a detailed view of the distribution and size of the alveoli present in the crumb. As regards the use of a colorimeter, it is necessary to deepen this evaluation by indicating the instrument used that allowed us to precisely analyze the RGB chromatic area (Rot–Grün–Blau, i.e., red–green–blue), a chromatic model in which the basic colors are added to white; this allowed us to reveal nuances and tones that can influence the visual attractiveness of the product.
Finally, to better understand the quantity of water, or more precisely the humidity of the bread, a portion of crumb was taken, approximately in the center of the bread, together with a portion of crust, which were dried until reaching a constant weight. Finally, to better assess the water content, or more precisely the moisture of the bread, a portion of crumb taken approximately from the center of the loaf, together with a portion of crust, was collected and dried until a constant weight was reached. Moisture content was determined gravimetrically by oven drying at 40 °C until reaching a constant weight.
This integrated methodology has allowed us to obtain a broad, although not complete, overview of the characteristics of bread, thus providing valuable information for improving the production process and trying to satisfy consumer needs. Another measurement carried out to evaluate the mechanical and rheological characteristics of the dough and bread is the TPA test (Texture Profile Analysis).
TPA was performed by two-bite compression using a texture analyzer (Stable Micro Systems, Warrington, UK), equipped with a circular flat-plate probe (diameter: 30 mm). This device is characterized by a support plane moved along the vertical axis by an electric motor, which comes into contact with a probe equipped with a flat square shape (whose dimensions measure 20 mm × 20 mm). The operating conditions included a travel distance of 2 cm with a speed of 0.00261 m/s, in order to ensure an accurate representation of the mechanical response of the panel. To conduct the analysis, a slice of bread was obtained from which, in turn, a cube of crumb with a thickness of approximately 2 cm was extracted, which was placed between the plates of the texture analyzer (Stable Micro Systems, Warrington, UK). A two-bite compression was applied to the bread slices to simulate the human chewing process. The time between two compression cycles was 5.0 s. During the test, the probe recorded different force (N) values on the samples while moving vertically along a predefined trajectory; this is clearly attributable to the different composition of the breads which consequently developed different characteristics. This procedure measured several textural properties, including hardness, cohesiveness, springiness, gumminess, and chewiness of the bread crumb.

2.2.3. Statistical Analysis

A one-factor ANOVA was applied to investigate significant differences; where appropriate, Tukey’s HSD post hoc test was performed. A denotative significance was accepted at p ≤ 0.05. The software used was R version 4.5.0.

3. Results

Table 3 reports the analyses carried out for each extract of trial A. Specifically, the values of pH, TDS, fixed residue, bitter index, and TPC are reported. Taking as a reference the values of each of the 12 extractions, for each of the parameters, the mean, the maximum and minimum value, the standard deviation, and the coefficient of variation were calculated.
For pH, an average of 5.318 was reported with a standard deviation of ±0.284. The lowest value is 4.950, resulting in the highest acidity, while the highest value of 5.89 is the least acidic. The coefficient of variation reports a value of 5.343%.
Aires et al. [23] report almost similar values using only deionized water as a solvent, from a minimum of 4.69 to a maximum of 4.82. While the values are more basic when sodium sulfite or sodium hydroxide at a concentration of 8% is used as a solvent with values ranging from 6.55 to 6.94 for sodium sulfite and from 12.54 to 12.69 for sodium hydroxide.
For the TDS values, an average of 0.178 was reported with a minimum of 0.09 and a maximum of 0.271. The calculated standard deviation is 0.055 and the coefficient of variation is 30.797%. Regarding the fixed residue, the average is 137.92 g, with a minimum reported value of 78.31 g and a maximum value of 205.81 g. The standard deviation reports a value of 37.87 and a coefficient of variation of 27.46%. In the bitter index, an average value of 12,270.057 was reported, with a minimum value of 8543.762 and a maximum of 15,762.427. The standard deviation reports a value of 2439.963 and a coefficient of variation 19.886%.
Regarding the TPC, a maximum value of 105.64 mg/g, a minimum of 0.66 mg/g, and an average of 38.32 ± 37.81 mg/g were obtained.
The results reported below show that the application of Response Surface Methodology (RSM) to the experimental data led to a significant regression model for predicting the TPC as a function of extraction time (t) and temperature (T). The fitted model equation is as follows:
TPC = 38.28 + 40.04 t + 38.52 T + 55.45 tT
The significance of each coefficient was determined and is reported in Table 4, while ANOVA results are reported in Table 5, where the fitted model showed a high coefficient of determination (R2 = 0.94), indicating good agreement between experimental and predicted values.
The three-dimensional response surface graph (Figure 1a) and the level curves diagrams (Figure 1b) illustrate the impact of the variables (time and temperature) on TPC, showing that an increase in extraction time and temperature enhances extraction yield. Since extraction is a mass transfer process, longer irradiation times are expected to increase yield until equilibrium is reached between extraction efficiency and the amount of extracted polyphenols.
According to the proposed model, optimization analyses using the desirability function indicate that the optimal conditions maximizing extraction yield are a time of 102.45 min and a temperature of 115° C, achieving a predicted maximum value of 172.30 mg/g, with a confidence interval between 139.01 and 205.59. In our case, the overall desirability factor does not exceed a maximum value of 0.34, corresponding to approximately 70% of the target value of 500 mg/g reported in the literature [19].
The optimization led to the best possible value under the tested conditions, but it does not fully meet the predefined target. Table 6 shows the outputs of the desirability function, which summarizes the model responses into a single index ranging from 0 to 1, where higher values indicate a better match with the predefined goals.
Regarding trial B, Table 7 shows the measurements obtained using the Chopin Alveograph (Belotti Strumenti S.r.l., Milano, Italy). Each parameter provides specific information about the individual properties of the flours, whose complete characterization is summarized by the combined analysis of all the obtained values.
Significant differences emerged for each of the alveographic parameters for the two types of flours. These are important for predicting baking performance. Specifically, a higher P value (129.20 ± 16.13 mm H2O) was obtained for flours with added COSs, contrary to the L value (16.4 ± 4.57 mm), which was much lower. This led to obtaining a very high P/L ratio value (8.71 ± 1.45) for flour with added COSs. High P/L values are typical of unrefined flours, in line with the result obtained [24]. On the other hand, a value of 0.79 was obtained for wheat flour, in line with the optimal reference of 0.4–0.7 [25].
Significant differences also emerged for the G value, with higher values recorded for doughs made with traditional flour (19.52 ± 0.66 mm) compared to those with the addition of COSs (8.85 ± 1.15 mm). The same trend was also found for the W value; a value of 168.13 ± 20.59 (10−4 J) has been recorded for traditional flour, compared to the addition of COSs (91.47 ± 31.52 10−4 J). W and P/L parameters are the best predictors of breadmaking performance [26]. Table 8 and Table 9 show quality characteristics of bread samples.
No significant differences were found in the qualitative parameters of the bread. The addition of COSs led to a greater crust hardness in W + COS bread (36.00 ± 1.00) compared to the W made exclusively with wheat flour (13.00 ± 0.87). This suggests that the addition of COS flour significantly increases crust firmness, which may impact textural perception. Another clear difference between the two types of bread examined is the color of the crumb. The crumb of the W bread had a much higher RGB value (1278.33 ± 39.27) than the W + CSS (584.33 ± 25.90), indicating that the W + COS crumb is substantially darker or more colorful [15]. Since higher RGB values typically correspond to lighter colors, this suggests that the addition of COS flour significantly darkens the crumb. No statistically significant differences were observed in the TPA parameters among the breads. Although the bread enriched with COSs showed slightly higher numerical values for hardness, cohesiveness, gumminess, and chewiness, these variations did not reach statistical significance and should therefore be interpreted with caution. Springiness values were comparable between W + COS and W breads, indicating that the addition of COSs did not affect crumb elasticity. Overall, the results indicate that the incorporation of COSs did not significantly modify the textural properties of the bread under the experimental conditions considered.

4. Discussion

The aim of the experimental trials was to investigate alternative valorization strategies for chestnut processing residues, with a specific focus on the outer shells. This work is framed within the broader context of circular economy principles and the sustainable management of agri-food by-products. The two experimental trials (Trial A and B) yielded promising findings, demonstrating the potential to recover and enhance agro-industrial residues while maintaining quality and promoting environmentally responsible practices.
Trial A focused on the extraction of bioactive compounds, particularly TPC from chestnut outer shells using water as the sole extraction solvent. The extraction process was conducted under different temperature and time conditions in order to investigate their combined effects on phenolic recovery. The significant variability observed (98.68%) in TPC values can be attributed to the strong influence of these parameters on mass transfer phenomena, solvent and solute interactions, and the diffusion of phenolic compounds from the plant matrix. Higher temperatures generally enhance solvent penetration, increase solute solubility, and accelerate diffusion rates, thereby improving extraction efficiency. Similarly, longer extraction times allow for more extensive contact between the solvent and the solid matrix, promoting the release of phenolic compounds. However, excessive temperatures or prolonged extraction times may also lead to the degradation or transformation of thermolabile phenolic compounds. Consequently, the observed variability in TPC values reflects the complex balance between extraction enhancement and potential compound degradation, underscoring the strong dependency of phenolic recovery on extraction parameters [27]. Based on the considerations above, the values obtained are consistent with those reported in the literature, particularly de Vasconcelosas et al. (2009) [4] reported TPC values between 10.90 and 26.02 mg/g under aqueous extraction at different temperatures. Conversely, lower values were noted by Aires et al. (2015) [23], while significantly higher yields were achieved by Barreira et al. (2008) [28] and Pinto et al. (2021) [19], though these involved the use of organic solvents or subcritical extraction technologies, methods that require costly equipment and specialized personnel, thereby limiting their applicability in low-resource or environmentally sensitive contexts. Optimization using the desirability function (DF) identified the optimal conditions at 102.45 min and 115 °C, predicting a TPC of 172.30 mg/g. Nonetheless, the associated desirability score (0.34) indicates that this value remains below the literature-reported optimal target of 500 mg/g, underscoring the limitations of solvent-free extraction. Despite the lower extraction yields, the results support the feasibility of water-only extraction as a more sustainable alternative. Its operational simplicity, low investment costs, and reduced environmental impact make this approach particularly attractive for enterprises seeking to adopt sustainable extraction protocols in the food, nutraceutical, and cosmetic sectors. However, it is widely recognized that water-based extraction exhibits lower efficiency toward phenolic compounds compared to organic solvent-based systems, resulting in reduced yields. This limitation may be partially mitigated through appropriate optimization of process parameters, which this study aimed to address.
Trial B evaluated the addition of chestnut-derived by-products into breadmaking as a functional ingredient, with the objective of identifying a natural substitute for conventional additives. The addition of COSs significantly affected dough rheology, increasing tenacity (P, 129.20 ± 16.13 mm H2O) and reducing extensibility (L, 16.4 ± 4.57 mm), resulting in a markedly high P/L ratio (8.71 ± 1.45), characteristic of unrefined flours typically unsuitable for traditional breadmaking [29]. Similar rheological trends have been reported in previous studies, where the dilution of the gluten network and increased water competition led to stiffer and less extensible dough systems [30,31].
Furthermore, lower values were recorded for dough strength (W = 91.47 ± 31.52 ×10⁻⁴ J) and swelling index (G, 8.85 ± 1.15 mm) compared to standard wheat flour, indicating a potential impact on leavening performance. These parameters are key indicators of gas retention capacity and overall dough performance during fermentation. The observed reduction suggests a potential negative impact on leavening behavior, likely attributable to the high fiber content of COSs, which may disrupt gluten continuity and limit gas cell expansion. Similar effects have been reported for bread formulations enriched with plant-derived fibers or phenolic-rich by-products, where increased dough rigidity and reduced extensibility negatively affected dough development and gas-holding capacity [32].
From an application perspective, these rheological modifications may influence processing behavior and leavening performance in breadmaking. However, these changes do not necessarily preclude the use of COSs in bakery formulations, particularly when its functional and nutritional attributes are considered. On the contrary, they indicate that formulation strategies, such as optimization of water content, mixing conditions, fermentation time, or the use of improvers, may be required to compensate for the structural effects induced by fiber-rich ingredients [33]. This is particularly relevant in the context of fiber-enriched or clean-label bakery products, where consumer demand increasingly favors natural ingredients over synthetic additives.
In terms of final product quality, the rheological modifications observed at the dough stage were only partially reflected in the characteristics of the baked bread. Significant differences were observed in crust hardness and crumb color, in agreement with findings by Alinovi et al. (2022) [9]. The increase in crust hardness may be related to modifications in moisture distribution and starch–fiber interactions during baking, while the darker crumb color is likely attributable to the presence of phenolic compounds and fiber fractions in COSs, which can enhance Maillard reactions and non-enzymatic browning processes [34].
Importantly, no statistically significant differences were observed in key textural parameters such as cohesiveness, springiness, gumminess, or chewiness. This suggests that, despite measurable changes in dough rheology and selected physical attributes, the overall structural integrity and textural quality of the bread crumb were preserved. Comparable results have been reported in studies where moderate levels of dietary fiber or by-product incorporation did not negatively affect consumer-relevant texture attributes, particularly when inclusion levels were carefully controlled [31].
Overall, the incorporation of COSs into bread formulations appears to be a promising strategy for the nutritional and functional enhancement of widely consumed foods. Considering the well-documented deficiency in dietary fiber intake in Western populations, the enrichment of bread with agro-industrial by-products such as chestnut outer shells could contribute to improved dietary quality while simultaneously supporting waste valorization and circular economy principles [16,17]. These findings support the feasibility of COSs as a functional ingredient in bakery applications, provided that formulation and process parameters are appropriately optimized to balance technological performance with nutritional and sustainability benefits.

5. Conclusions

This study aimed to valorize chestnut processing residues, specifically the outer shell, by investigating two complementary applications: the extraction of high-value bioactive compounds for potential use in the cosmetic, chemical, and food industries, and the direct incorporation of these residues as functional additives in the baking sector. Overall, the results indicate that both approaches represent promising strategies for the sustainable management and reuse of this biomass. The extraction of bioactive compounds from chestnut outer shells (COSs) using water as the sole solvent proved to be an efficient and environmentally sustainable method. The RSM, combined with the desirability function, identified optimal extraction conditions at 115 °C for 102 min, yielding approximately 172.30 mg of polyphenols per gram of dry outer shell. This approach aligns well with green extraction principles and offers practical advantages for both industrial-scale and small-scale applications, particularly in terms of safety, cost, and regulatory acceptance. Although the extraction yields may be lower compared to those obtained using organic solvents, the use of water ensures a cleaner process and facilitates the potential food-grade application of the extracts. In parallel, the incorporation of COSs into bread formulations demonstrated its potential as a functional ingredient rich in dietary fiber. This aspect is particularly relevant in Western diets, where bread represents a staple food and dietary fiber intake frequently falls below recommended levels. The addition of COSs may therefore contribute not only to waste valorization but also to the nutritional enhancement of bakery products; however, it also affects technological quality, leading to reduced dough workability, increased crust hardness (13.00 ± 0.87; 36.00 ± 1.00), and a darker bread color (1278.33 ± 39.27; 584.33 ± 25.90 RGB), particularly in the crumb. Nevertheless, the inclusion of fibrous by-products can influence dough rheology and bread quality, highlighting the need for formulation optimization. Despite these promising findings, further investigations are required to fully assess the sensory attributes and consumer acceptance of COS-enriched breads. Future studies should consider different bread types, varying inclusion levels, and diverse consumer target groups to better define the practical applicability and market potential of this approach.

Author Contributions

Conceptualization, P.M. and A.C.; methodology, P.M. and A.C.; software, A.C., G.A., A.S. and F.C.; validation, P.M. and A.C.; formal analysis, G.A., A.S. and F.C.; resources, P.M. and A.C.; data curation, A.S., G.A. and F.C.; writing—original draft preparation, A.S. and G.A.; writing—review and editing, P.M., A.C. and A.P.; visualization, P.M. and A.P.; supervision, P.M. and A.P.; project administration, P.M. and A.C. All authors have read and agreed to the published version of the manuscript.

Funding

This research was funded by the project “Innovazione e recupero sostenibile in alcune filiere agroalimentari pedemontane dell’appennino Toscano—SSD, AGR\09 (AGRI-04/B)”.

Institutional Review Board Statement

Not applicable.

Informed Consent Statement

Not applicable.

Data Availability Statement

Data is contained within the article.

Conflicts of Interest

The authors declare no conflicts of interest.

Abbreviations

The following abbreviations are used in this manuscript:
COSChestnut outer shell
RSMResponse Surface Methodology
TPCTotal phenols concentration
CCDCentral Composite Design

References

  1. FAO. Food and Agriculture Organization of the United Nations. FAOSTAT: Crops and Livestock Products. 2025. Available online: https://www.ccacoalition.org/resources/faostat-crops-and-livestock-products (accessed on 3 July 2025).
  2. Pozzoli, C.; Martinelli, G.; Fumagalli, M.; Di Lorenzo, C.; Maranta, N.; Colombo, L.; Piazza, S.; Dell’agli, M.; Sangiovanni, E. Castanea sativa Mill. By-Products: Investigation of Potential Anti-Inflammatory Effects in Human Intestinal Epithelial Cells. Molecules 2024, 29, 3951. [Google Scholar] [CrossRef] [PubMed]
  3. Silva, V.; Falco, V.; Dias, M.I.; Barros, L.; Silva, A.; Capita, R.; Alonso-Calleja, C.; Amaral, J.S.; Igrejas, G.; Ferreira, I.C.F.R.; et al. Evaluation of the phenolic profile of Castanea sativa mill. By-products and their antioxidant and antimicrobial activity against multiresistant bacteria. Antioxidants 2020, 9, 87. [Google Scholar] [CrossRef] [PubMed]
  4. De Vasconcelos, M.C.; Bennett, R.N.; Rosa, E.A.; Ferreira-Cardoso, J.V. Composition of European chestnut (Castanea sativa Mill.) and association with health effects: Fresh and processed products. J. Sci. Food Agric. 2010, 90, 1578–1589. [Google Scholar] [CrossRef] [PubMed]
  5. Meleti, Ε.; Kossyva, V.; Maisoglou, I.; Vrontaki, M.; Manouras, V.; Tzereme, A.; Alexandraki, M.; Koureas, M.; Malissiova, E.; Manouras, A. The Nutritional Benefits and Sustainable By-Product Utilization of Chestnuts: A Comprehensive Review. Agriculture 2024, 14, 2262. [Google Scholar] [CrossRef]
  6. Echegaray, N.; Gómez, B.; Barba, F.J.; Franco, D.; Estévez, M.; Carballo, J.; Marszałek, K.; Lorenzo, J.M. Chestnuts and by-products as source of natural antioxidants in meat and meat products: A review. Trends Food Sci. Technol. 2018, 82, 110–121. [Google Scholar] [CrossRef]
  7. Pinto, D.; Cádiz-Gurrea, M.d.l.L.; Vallverdú-Queralt, A.; Delerue-Matos, C.; Rodrigues, F. Castanea sativa shells: A review on phytochemical composition, bioactivity and waste management approaches for industrial valorization. Food Res. Int. 2021, 144, 110364. [Google Scholar] [CrossRef]
  8. De Vasconcelos, M.D.C.B.M.; Bennett, R.N.; Quideau, S.; Jacquet, R.; Rosa, E.A.S.; Ferreira-Cardoso, J.V. Evaluating the potential of chestnut (Castanea sativa Mill.) fruit pericarp and integument as a source of tocopherols, pigments and polyphenols. Ind. Crop. Prod. 2010, 31, 301–311. [Google Scholar] [CrossRef]
  9. Alinovi, M.; Rinaldi, M.; Paciulli, M.; Littardi, P.; Chiavaro, E. Chestnut peels and wheat bran at different water level influence the physical properties of pan bread. Eur. Food Res. Technol. 2022, 248, 1227–1237. [Google Scholar] [CrossRef]
  10. Cacciola, N.A.; Squillaci, G.; D’apolito, M.; Petillo, O.; Veraldi, F.; La Cara, F.; Peluso, G.; Margarucci, S.; Morana, A. Castanea sativa Mill. Shells aqueous extract exhibits anticancer properties inducing cytotoxic and pro-apoptotic effects. Molecules 2019, 24, 3401. [Google Scholar] [CrossRef]
  11. Spadi, A.; Angeloni, G.; Guerrini, L.; Corti, F.; Parenti, A.; Innocenti, M.; Bellumori, M.; Masella, P. Hydrodistillation of coffee by-products to recover of bioactive compounds: The spent coffee ground and coffee silvers skin case-study. Chem. Eng. Trans. 2021, 87, 313–318. [Google Scholar] [CrossRef]
  12. Delzenne, N.M.; Olivares, M.; Neyrinck, A.M.; Beaumont, M.; Kjølbæk, L.; Larsen, T.M.; Benítez-Páez, A.; Romaní-Pérez, M.; Garcia-Campayo, V.; Bosscher, D.; et al. Nutritional interest of dietary fiber and prebiotics in obesity: Lessons from the MyNewGut consortium. Clin. Nutr. 2020, 39, 414–424. [Google Scholar] [CrossRef] [PubMed]
  13. Pop, I.-A.; Dossa, S.; Stoin, D.; Neagu, C.; Moigradean, D.; Alexa, E.; Poiana, M.-A. Nutritional, Rheological, and Functional Assessment in the Development of Bread Using Chestnut and Rosehip-Fortified Wheat Flour. Foods 2025, 14, 3343. [Google Scholar] [CrossRef] [PubMed]
  14. Wang, L.; Shi, D.; Chen, J.; Dong, H.; Chen, L. Effects of Chinese chestnut powder on starch digestion, texture properties, and staling characteristics of bread. Grain Oil Sci. Technol. 2023, 6, 82–90. [Google Scholar] [CrossRef]
  15. Marciniak-Lukasiak, K.; Lesniewska, P.; Zielińska, D.; Sowinski, M.; Zbikowska, K.; Lukasiak, P.; Zbikowska, A. The Influence of Chestnut Flour on the Quality of Gluten-Free Bread. Appl. Sci. 2022, 12, 8340. [Google Scholar] [CrossRef]
  16. Zhu, J.; Cai, Y.; Xu, Y.; Wei, X.; Yang, Z.; Yin, Y.; Wakisaka, M.; Fang, W. Effects of heterotrophic Euglena gracilis powder on dough microstructure, rheological properties, texture, and nutritional composition of steamed bread. Food Chem. X 2024, 23, 101754. [Google Scholar] [CrossRef]
  17. Montgomery, D.C. Design and Analysis of Experiments; Wiley: Hoboken, NJ, USA, 2017. [Google Scholar]
  18. Gutiérrez Rosales, F.; Perdiguero, S.; Gutiérrez, R.; Olias, J.M. Evaluation of the bitter taste in virgin olive oil. J. Am. Oil Chem. Soc. 1992, 69, 394–395. [Google Scholar] [CrossRef]
  19. Pinto, D.; Vieira, E.F.; Peixoto, A.F.; Freire, C.; Freitas, V.; Costa, P.; Delerue-Matos, C.; Rodrigues, F. Optimizing the extraction of phenolic antioxidants from chestnut shells by subcritical water extraction using response surface methodology. Food Chem. 2021, 334, 127521. [Google Scholar] [CrossRef]
  20. European Commission. Regulation (EC) No 1924/2006 of the European Parliament and of the Council of 20 December 2006 on nutrition and health claims made on foods. Off. J. Eur. Union 2006, 404, 9–25. [Google Scholar]
  21. Parenti, O.; Guerrini, L.; Cavallini, B.; Baldi, F.; Zanoni, B. Breadmaking with an old wholewheat flour: Optimization of ingredients to improve bread quality. LWT 2020, 121, 108980. [Google Scholar] [CrossRef]
  22. AACC—American Association of Cereal Chemists. AACC Approved Methods of Analysis, 11th ed.; American Association of Cereal Chemists: St. Paul, MN, USA, 2010. [Google Scholar]
  23. Aires, A.; Carvalho, R.; Saavedra, M.J. Valorization of solid wastes from chestnut industry processing: Extraction and optimization of polyphenols, tannins and ellagitannins and its potential for adhesives, cosmetic and pharmaceutical industry. Waste Manag. 2016, 48, 457–464. [Google Scholar] [CrossRef]
  24. Messia, M.C.; Reale, A.; Maiuro, L.; Candigliota, T.; Sorrentino, E.; Marconi, E. Effects of pre-fermented wheat bran on dough and bread characteristics. J. Cereal Sci. 2016, 69, 138–144. [Google Scholar] [CrossRef]
  25. Quaglia, G. Scienza e Tecnologia Della Panificazione; Chiriotti Editore: Pinerolo, Italy, 1977. [Google Scholar]
  26. Parenti, O.; Guerrini, L.; Canuti, V.; Angeloni, G.; Masella, P.; Zanoni, B. The effect of the addition of gelatinized flour on dough rheology and quality of bread made from brown wheat flour. LWT 2019, 106, 240–246. [Google Scholar] [CrossRef]
  27. Spigno, G.; Tramelli, L.; De Faveri, D.M. Effects of extraction time, temperature and solvent on concentration and antioxidant activity of grape marc phenolics. J. Food Eng. 2007, 81, 200–208. [Google Scholar] [CrossRef]
  28. Barreira, J.C.M.; Ferreira, I.C.F.R.; Oliveira, M.B.P.P.; Pereira, J.A. Antioxidant activities of the extracts from chestnut flower, leaf, skins and fruit. Food Chem. 2008, 107, 1106–1113. [Google Scholar] [CrossRef]
  29. Cappelli, A.; Cini, E.; Guerrini, L.; Masella, P.; Angeloni, G.; Parenti, A. Predictive models of the rheological properties and optimal water content in doughs: An application to ancient grain flours with different degrees of refining. J. Cereal Sci. 2018, 83, 229–235. [Google Scholar] [CrossRef]
  30. Rosell, C.M.; Santos, E.; Collar, C. Physico-chemical properties of commercial fibres from different sources: A comparative approach. Food Res. Int. 2009, 42, 176–184. [Google Scholar] [CrossRef]
  31. Bchir, B.; Rabetafika, H.N.; Paquot, M.; Blecker, C. Effect of Pear, Apple and Date Fibres from Cooked Fruit By-products on Dough Performance and Bread Quality. Food Bioprocess Technol. 2014, 7, 1114–1127. [Google Scholar] [CrossRef]
  32. Noort, M.W.J.; van Haaster, D.; Hemery, Y.; Schols, H.A.; Hamer, R.J. The effect of particle size of wheat bran fractions on bread quality - Evidence for fibre-protein interactions. J. Cereal Sci. 2010, 52, 59–64. [Google Scholar] [CrossRef]
  33. Gómez, M.; Ronda, F.; Blanco, C.A.; Caballero, P.A.; Apesteguía, A. Effect of dietary fibre on dough rheology and bread quality. Eur. Food Res. Technol. 2003, 216, 51–56. [Google Scholar] [CrossRef]
  34. Purlis, E. Browning development in bakery products—A review. J. Food Eng. 2010, 99, 239–249. [Google Scholar] [CrossRef]
Figure 1. (a) The level curves diagrams; (b) The three-dimensional response surface graph.
Applsci 16 01133 g001
Table 1. Factors and respective levels tested by RSM.
Levels−α−101α
VariablesTime (min)17.5306090102.42
Temperature (°C)8590100110115
Table 2. Two factors of CCD scheme by RSM.
Run123456789101112
VariablesTime (min)−11−11−αα000000
Temperature (°C)−1−11100−αα0000
Table 3. Physical–chemical characterization of the extracts. Means and standard deviations are reported (n = 3).
ParameterpHTDSFixed Residue
(g/mL)
Bitter IndexTPC
(mg/g)
Mean5.320.18137.9212,270.0638.32
SD±0.28±0.05±37.87±2439.96±37.81
Min.4.950.0978.318543.760.66
Max.5.890.27205.8115,762.43105.64
CV5.34%30.79%27.46%19.89%98.68%
TDS: Total dissolved solids. TPC: Total phenols content. SD: Standard deviation. Min.: Minimum. Max.: Maximum. CV: Coefficient of variation.
Table 4. Estimates of the regression coefficients for TPC.
Estimates of the Regression Coefficients
EffectCoefficientSEtp-Value
Constant38.283.1812.06***
Time (t)40.045.507.28***
Temperature (T)38.525.666.81***
t × T55.4511.684.75ns
SE: Standard error. ns: Non-significant. *** p < 0.001.
Table 5. ANOVA results.
Analysis of Variance
SourcedfType I SSMean SquaresF-Ratiop-Value
Regression314,757.254919.0840.65***
Linear212,028.206014.1049.70***
Interaction12729.042729.0422.55***
Residual error8968.00121.00
Total error1115,725.24
*** p < 0.001.
Table 6. Tables of optimization results obtained using the desirability function (DF).
(a)
ResponseAimLower ValueTargetUpper ValueWeightImportance
TPCMaximize0.10 500.001.001.00
(b)
FactorStationary Point
CodedUncoded
Time (t)1.00102.42
Temperature (T)1.00115.00
(c)
Optimal Response95% Confidence IntervalDesirability
UpperLower
TPC172.30139.01205.590.34
Table 7. Rheological parameters of flours using the Chopin Alveograph. Means and standard deviations are reported (n = 3).
Rheological ParametersFlourp-Value
WW + COS
P (mm H2O)59.13 ± 7.40 b129.20 ± 16.13 a*
L (mm)77.67 ± 5.51 a16.4 ± 4.57 b**
P/L0.79 ± 0.13 b8.71 ± 1.45 a*
G (mm)19.52 ± 0.66 a8.85 ± 1.15 b**
W (10−4 J)168.13 ± 20.59 a91.47 ± 31.52 b*
W: Wheat flour. W + COS: wheat flour + chestnut outer shell. P: tenacity. L: extensibility. P/L ratio. G: swelling index. W: flour strength. * p < 0.05. ** p < 0.01. Different letters (a,b) indicate different levels of significance.
Table 8. Bread quality measurement. Means and standard deviations are reported (n = 3).
MeasuresBread
WW + COSp-Value
Weight (kg) 0.46 ± 0.01 a0.45 ± 0.00 b*
Height (cm) 8.57± 0.388.47 ± 0.15ns
Volume specific (L/kg) 6.68 ± 0.106.74 ± 0.01ns
Crust hardness
(shore A)
13.00 ± 0.87 b36.00 ± 1.00 a***
Water Content (g)Crust0.19 ± 0.030.23 ± 0.01*
Crumb0.40 ± 0.020.40 ± 0.01ns
Color (RGB)Crust1032.67 ± 107.111130.00 ± 57.40ns
Crumb1278.33 ± 39.27 a584.33 ± 25.90 b*
W: Wheat flour. W + COS: wheat flour + chestnut outer shell. ns: non-significant. * p < 0.05. *** p < 0.001. Different letters (a,b) indicate different levels of significance.
Table 9. Texture Profile Analysis (TPA) of bread. Means and standard deviations are reported (n = 3).
MeasuresBread
WW + COSp-Value
Hardness
(N)
P17.76 ± 1.3110.28 ± 3.48ns
Cohesiveness 0.62 ± 0.080.71 ± 0.13ns
Springiness
(mm)
0.90 ± 0.040.93 ± 0.09ns
Gumminess
(N)
4.84 ± 1.106.87 ± 2.05ns
Chewiness
(N)
4.38 ±0.916.71 ± 2.20ns
P1: Peak one. W: wheat flour. W + COS: wheat flour + chestnut outer shell. ns: non-significant.
Disclaimer/Publisher’s Note: The statements, opinions and data contained in all publications are solely those of the individual author(s) and contributor(s) and not of MDPI and/or the editor(s). MDPI and/or the editor(s) disclaim responsibility for any injury to people or property resulting from any ideas, methods, instructions or products referred to in the content.