1. Introduction
Sustainable practices in agronomy, such as organic farming and crop rotation, are increasingly viewed globally as essential approaches for improving soil health, enhancing water quality and supporting biodiversity. These practices represent a shift in modern agriculture toward methods that reduce environmental pressures while maintaining long-term productivity [
1,
2,
3].
Organic agriculture is a farming system that enhances soil fertility by maximizing the efficient use of local resources, while avoiding agrochemicals, genetically modified organisms (GMOs), and many synthetic food additives, thereby aiming to minimize the environmental impact of the food industry and ensure the long-term sustainability of soil [
4,
5]. Organic farming systems are more profitable and environmentally friendly, leading to healthier crop production compared with conventional farming [
6].
Pesticides are essential in agriculture, contributing to significant increases in crop yields and helping meet the demands of the growing global population. Estimates indicate that their absence could lead to substantial reductions in the agricultural production of fruits, vegetables, and cereals [
7].
However, the persistent use of chemical pesticides worldwide, while contributing to agricultural productivity, has been associated with substantial environmental and public health consequences, as recognized since the 1990s [
8,
9,
10]. Recent evidence further supports these findings by linking the disproportionate use of pesticides to contamination of soil, water, and air; disruption of biodiversity; and degradation of essential ecosystem services [
11,
12,
13,
14]. The accumulation of chemical pesticides poses a significant risk of bioaccumulation in living organisms and of biomagnification in the food chain, leading to documented acute and chronic diseases in humans, such as acute poisoning, cancer, and neurological disorders [
11,
12,
14]. Other major consequences of excessive pesticide use include the development of resistance in pests and weeds [
12,
13] and the destruction of beneficial organisms, such as pollinators and natural predators [
11].
Recent research highlights a key issue in modern agriculture: while pesticides are vital for maintaining crop yields and preventing significant losses, they are often viewed as obstacles to sustainability because of their risks to human health and ecosystems. Therefore, many authors have highlighted the need for sustainable pest management practices and have recommended the promotion of biological control methods [
7,
12], such as integrated pest management (IPM). IPM combines cultural, biological, and targeted chemical methods to minimize chemical use [
13] and emphasizes the need for effective tools to evaluate pesticide safety and guide informed choices [
15].
The European Union established a comprehensive framework for the sustainable use of pesticides through Directive 2009/128/EC, aiming to reduce the risks and impacts of pesticide use on human health and the environment. Member States are obliged to develop National Action Plans (NAPs) that set quantitative objectives, measures, and timelines to promote Integrated Pest Management (IPM) and alternative, non-chemical control methods [
16].
Alongside this regulatory framework, core EU policies such as the Common Agricultural Policy (CAP), the European Green Deal and Farm to Fork Strategy place strong emphasis on advancing the transition toward sustainable agriculture by reducing the environmental and health impacts of pesticides and promoting ecological farming practices [
17,
18,
19]. These initiatives, and CAP in particular [
20], align with the United Nations 2030 Agenda for Sustainable Development and Sustainable Development Goals (SDGs). SDGs include several targets and indicators directly related to pesticide use and chemical risk reduction. For example, target 2.4 (SDG 2 Zero Hunger) includes managing harmful pesticides for sustainable farming, and target 6.3 (SDG 6 Clean water and sanitation) focuses on improving water quality by minimizing the release of pollutants such as pesticide residues. Moreover, target 12.4 (SDG 12 Responsible consumption and production) promotes the environmentally sound management of chemicals throughout their life cycle, aiming to minimize their adverse impacts on human health and the environment. Furthermore, indicator 3.9.3 “Mortality rate attributed to unintentional poisoning” (SDG 3 Good health and well-being) aims to substantially reduce the number of deaths from hazardous chemicals [
21,
22]. Collectively, these policy frameworks highlight the EU’s commitment to lowering pesticide dependency, mitigating environmental contamination, and protecting public health while safeguarding long-term agricultural productivity.
According to FAOSTAT Analytical Brief 29 [
23], global pesticide use increased by more than 50% during the 2010s compared to the 1990s, while pesticide use per hectare of cropland rose from approximately 1.8 to 2.7 kg/ha. These findings indicate a long-term intensification of chemical inputs in agriculture at the global scale. In contrast, pesticide use in Europe increased by only about 3% over the same period, suggesting a comparatively more stable trend in pesticide consumption.
Further analyses of FAOSTAT data covering the period 1990–2014 revealed that the global cost–benefit ratio of total pesticide use increased steadily until 2007 and declined thereafter. A similar pattern was observed for pesticide application intensity measured in kilograms per hectare. In addition, the use and cost–benefit ratios of pesticides showed a declining trend after 2007 at the global level [
24].
These global trends, however, should be interpreted with caution, as more recent research has highlighted limitations in the completeness and reliability of FAO pesticide statistics. An analysis of FAO data identified a decline in reporting coverage and data quality since 2007, particularly in low- and lower-middle-income countries. To address these limitations, the authors developed the Global Pesticide Use and Trade (GloPUT) database and concluded that pesticide use in several regions has likely been substantially underestimated [
25].
Recent data from Eurostat provide a more detailed and policy-relevant picture of pesticide use within the European Union. In 2023, sales of pesticides in the EU declined further to approximately 292,000 tonnes, the lowest level recorded since the start of the data series in 2011. This represents a 9% decrease compared to 2022 and an overall reduction of 18% relative to 2021, indicating a continuing downward trend in pesticide sales volumes across the EU [
26].
In terms of composition, the most sold pesticide groups in 2023 were fungicides and bactericides (39% of total sales volumes), followed by herbicides, haulm destructors and moss killers (36%), and insecticides and acaricides (17%). France, Spain, Germany, and Italy accounted for the largest shares of pesticide sales volumes in the EU; these countries are also the EU’s main agricultural producers, collectively representing approximately 52% of total utilized agricultural area (UAA) and 49% of total arable land [
27].
The European Union also monitors pesticide-related risk through harmonized indicators that support comparability across Member States. Thus, the European Commission has developed two Harmonized Risk Indicators (HRI 1 and HRI 2) to measure trends in pesticide risk. Harmonized Risk Indicator 1 (HRI1) can be implemented at the country level, and EU Member States use their own data and results in order to calculate and deliver annual values to the Commission [
28]. According to the European Commission [
29], Harmonized Risk Indicator 1 shows an overall 61% reduction in the risk posed by pesticides in the European Union in the period from 2011 to 2023 compared to the baseline period of 2011–2013.
Environmental protection expenditure has become a key indicator for assessing countries’ commitment to implementing environmental policies in the European Union. Between 2006 and 2019, environmental protection expenditure in the EU-27 increased by 34% [
30]. Recent empirical evidence shows that increases in environmental protection investments are associated with reductions in greenhouse gas emissions, indicating that financial commitment to environmental protection contributes meaningfully to sustainability outcomes. This highlights the relevance of incorporating environmental protection investment as a core indicator when evaluating agri-environmental performance across Member States [
31].
Given this policy and environmental context, assessing agri-environmental performance requires analytical tools that integrate multiple dimensions of sustainability. Multiple-Criteria Decision Analysis (MCDA) methods are powerful tools for assessing agricultural sustainability, and the number of studies has increased in recent years [
32]. For example, MCDA methodologies combined with tools such as the FAO SAFA guidelines have been used to evaluate diversified organic cropping systems, demonstrating how multi-criteria approaches can capture the complexity of farming practices and support decision-making toward more sustainable agricultural transitions [
33]. Moreover, a study in Germany, France, and Italy developed an actor-oriented MCDA framework to support the transition towards sustainable agricultural systems. A new set of 32 indicators was created to assess stakeholder needs, involve stakeholders in the assessment process, and strengthen the sustainability of the entire value chain [
34].
In the broader agri-environmental sector, a well-known example of environmental assessment application is the Victorian Weed Risk Assessment (VWRA) model, where MCDA techniques are used to structure complex ecological data and generate priority rankings of invasive plant species. This MCDA framework is supported by expert-derived AHP weightings and is used to address uncertainty in environmental risk evaluation [
35].
Multiple-criteria decision analysis (MCDA), particularly the Preference Ranking Organization Method for Enrichment Evaluation (PROMETHEE), has been widely used to evaluate national sustainability performance using multidimensional indicator sets. For example, Antanasijević et al. [
36] applied PROMETHEE to 38 Sustainable Development Indicators across 30 European countries over a decade, illustrating how MCDA can capture differences in socioeconomic, environmental, and thematic sustainability progress.
PROMETHEE has been increasingly used to assess environmental performance on the national scale, enabling comparisons across countries using multidimensional indicator sets. For example, Digkoglou and Papathanasiou [
37] applied PROMETHEE to Environmental Performance Index (EPI) data for EU Member States from 2006 to 2018, producing country rankings based on environmental health and ecosystem vitality and highlighting how MCDA techniques capture variations in national environmental trajectories.
Moreover, PROMETHEE has been widely applied to the evaluation of agricultural, environmental, and forestry policies, offering a structured approach to integrating economic, social, and environmental criteria. For example, Tsiaras and Andreopoulou [
38] applied PROMETHEE to assess Forest Policy performance across 26 European countries, demonstrating the method’s suitability for sustainability-oriented, multi-indicator country evaluations.
Recent studies have demonstrated the value of multiple-criteria decision analysis for assessing the environmental impacts of agriculture. Zekić et al. [
39] applied PROMETHEE to agri-environmental indicators across EU-28 Member States and Serbia, integrating factors such as pesticide and fertilizer use, organic farming, energy consumption, and GHG emissions to evaluate countries’ ecological performance. Their findings underline the complexity of agricultural sustainability and the need for composite approaches to capture its multidimensional nature.
Previous PROMETHEE-based country assessments in Europe have primarily utilized broad sustainability indicator sets, such as Sustainable Development Indicators (SDIs), Environmental Performance Indices (EPI), forest policy metrics, or extended agri-environmental frameworks. However, no prior studies have evaluated EU Member States using a concise set of policy-relevant agri-environmental indicators officially reported by Eurostat, including Harmonized Risk Indicator 1 (HRI1), pesticide sales intensity (kg/ha UAA), and environmental protection investments. These indicators are directly associated with the European Green Deal and Farm to Fork objectives, yet their combined behavior and cross-country variability have not been systematically examined. The present study addresses this gap by applying PROMETHEE to a focused set of Eurostat-based indicators and conceptually linking them to the environmental, social, and economic pillars of sustainable development. The objective is to evaluate and compare the agri-environmental performance of EU-27 Member States through a transparent PROMETHEE-based ranking grounded in these three sustainability dimensions.
3. Results
The implementation of the PROMETHEE method provided the results for the three scenarios examined in the present study. The three examined scenarios used the same dataset for the most recent available year (2023), differing only in the weighting structure of the criteria.
3.1. Scenario 1
In the first scenario, the ranking of EU countries was based on equal weights for all the selected criteria using the most recent data provided by Eurostat, in most cases for the year 2023.
According to the PROMETHEE ranking (
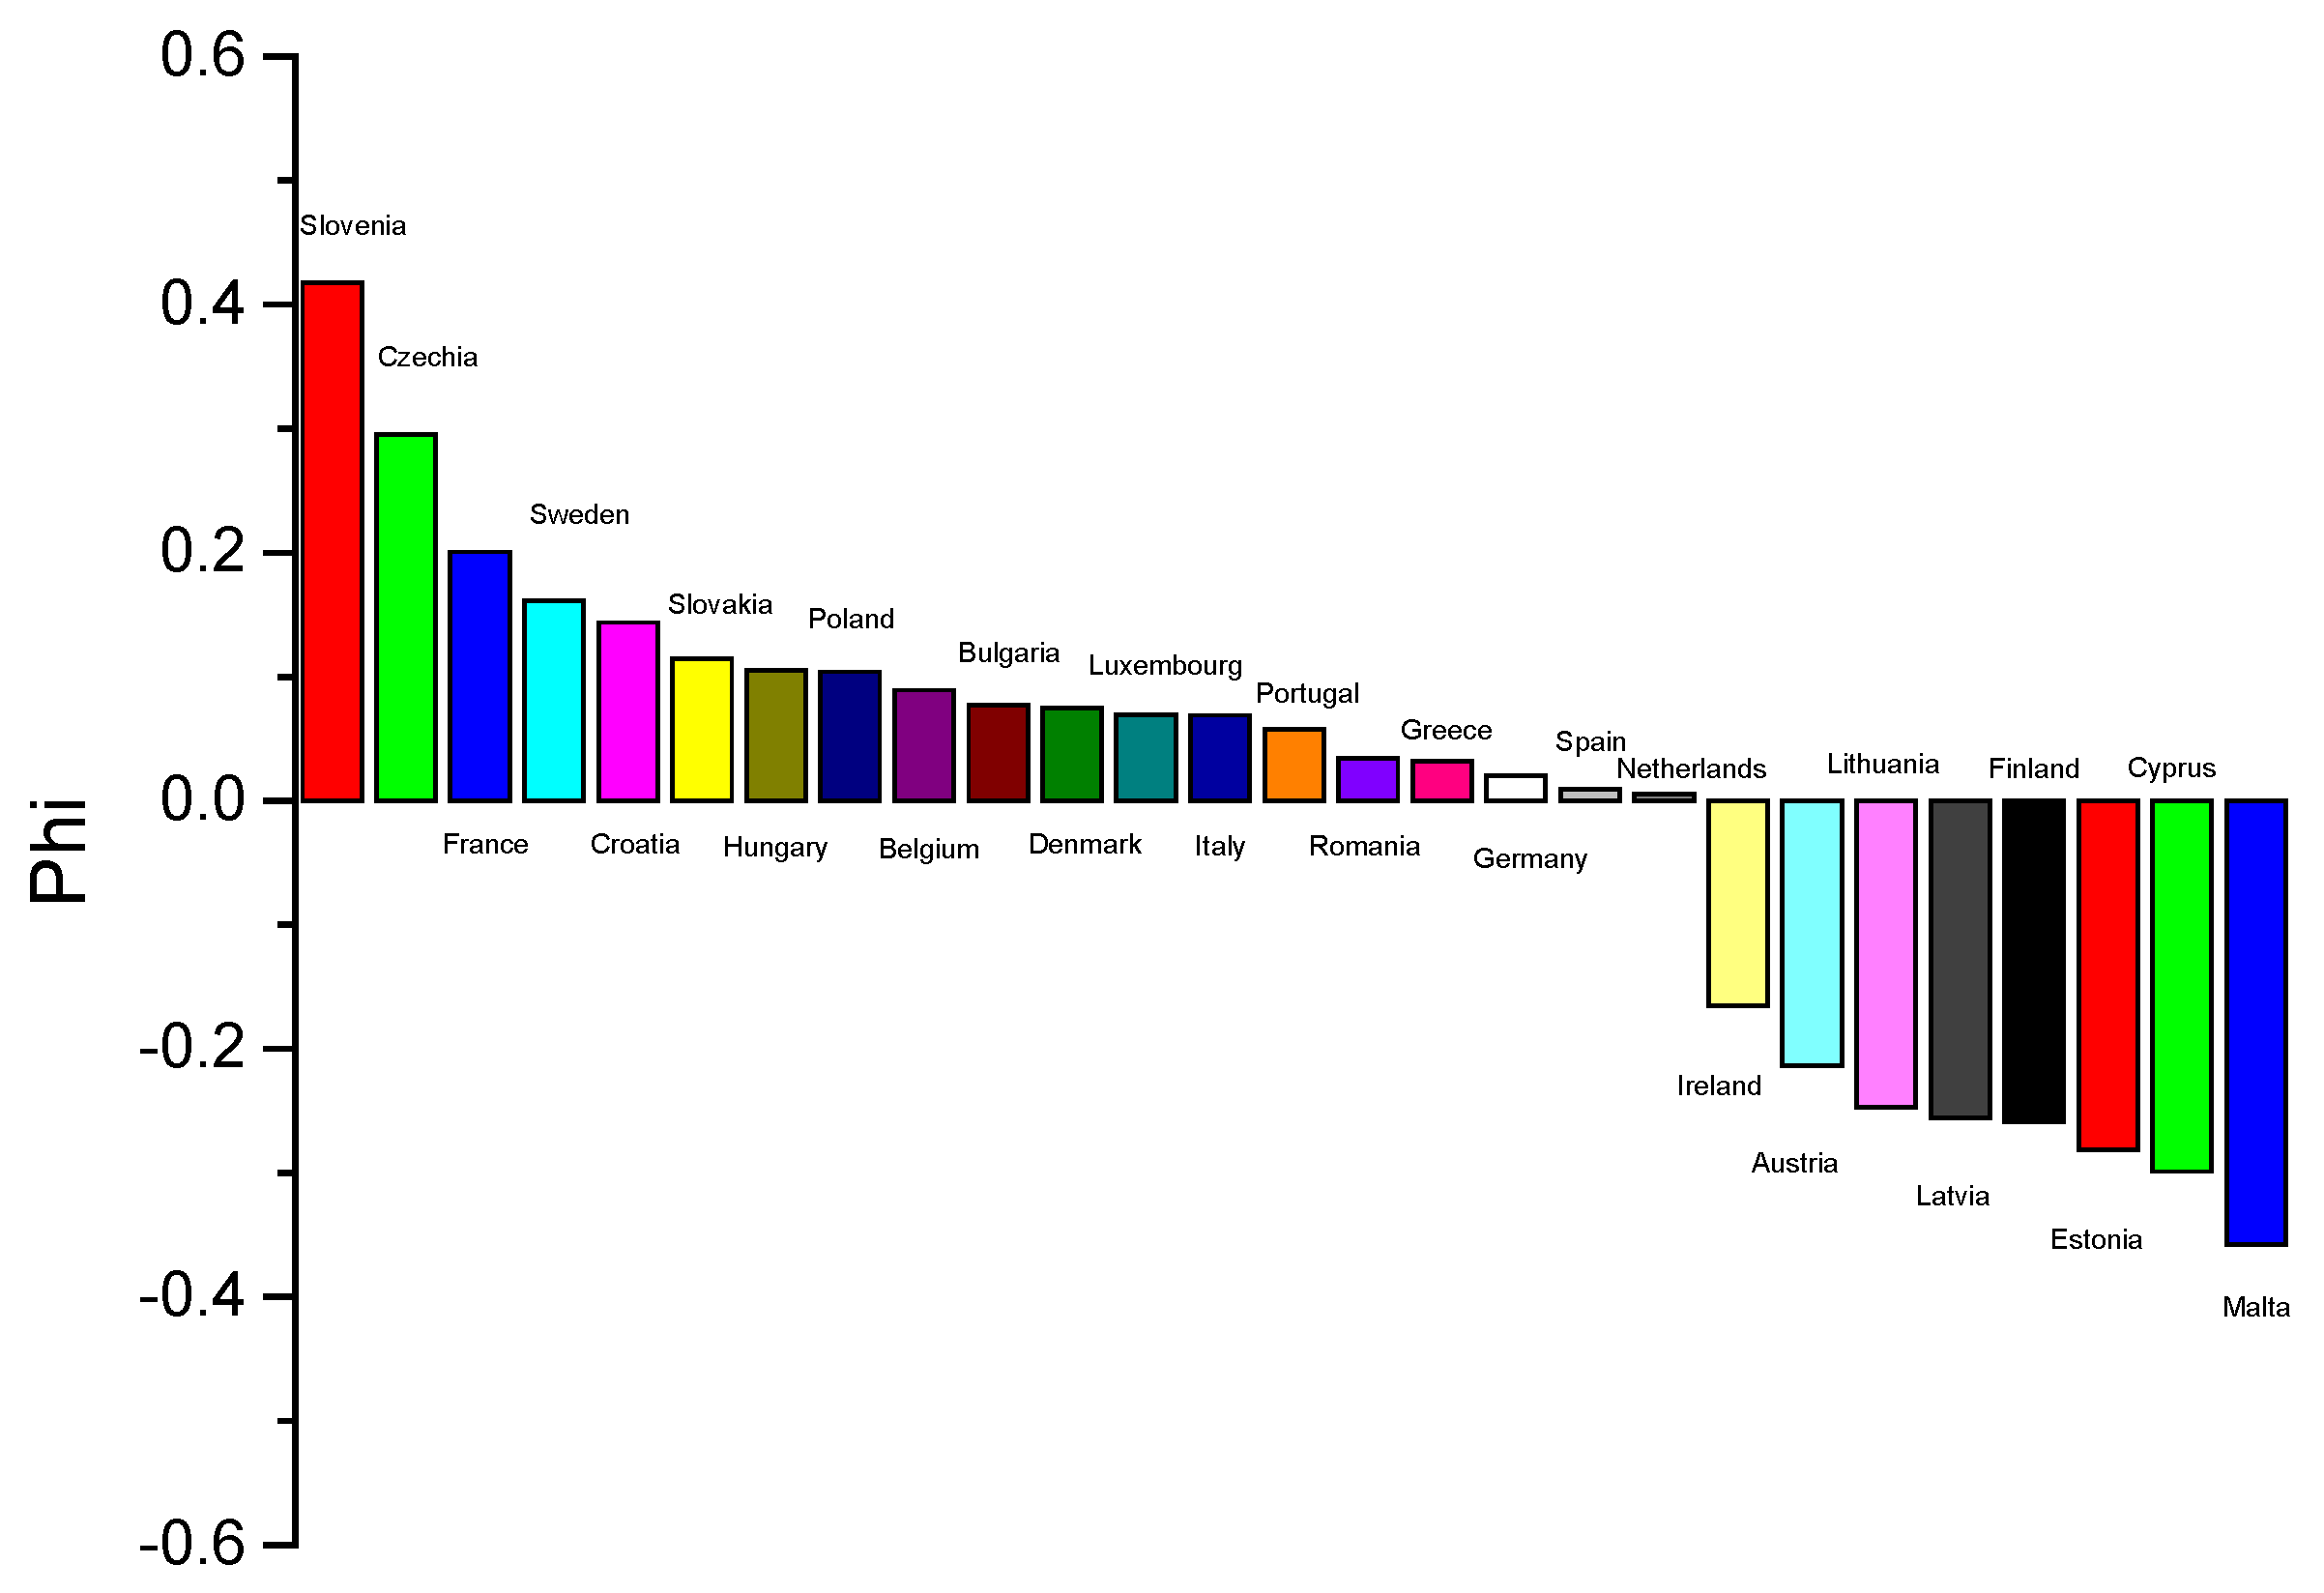
Table 5), Slovenia achieves the highest Phi (0.4173) by far among the EU-27 countries and therefore the best performance under the examined criteria. Czechia and France follow at a noticeable distance (Phi = 0.2950 and Phi = 0.2004, respectively). Sweden and Croatia are in 4th and 5th place, closing the Top-5 performers. These five countries are significantly ahead of the other countries.
At the other end of the ranking, Malta has the worst performance, with Phi = −0.3579, followed by Cyprus (−0.2990), Estonia (−0.2815), Finland (−0.2586), and Latvia (−0.2556). These five countries have the worst performance on these criteria among the EU-27 countries for the baseline scenario of the study.
3.2. Sensitivity Analysis
In order to assess the robustness of the results, a sensitivity analysis was conducted focusing on the criteria weights of the baseline scenario, where all three criteria were assigned equal importance. The Visual PROMETHEE software provides a dedicated sensitivity analysis tool through the option “Visual Stability Intervals,” which allows the estimation of the Walking Stability Intervals (WSIs) for each criterion. WSIs define the range within which the weight of a given criterion can vary without altering the overall ranking of the alternatives [
45].
Table 6 presents the Walking Stability Intervals for the three criteria considered in Scenario 1.
The criterion “Pesticides” exhibits the widest stability interval (WSI = 0.0591 or 5.91%), indicating a comparatively higher robustness of the ranking with respect to changes in its weight. Specifically, the ranking remains unchanged as long as the weight assigned to this criterion lies between 0.3249 (32.49%) and 0.3840 (38.40%). In contrast, the criteria “HRI1” and “Environmental protection investments” display narrower stability intervals (0.0211 or 2.11% and 0.0210 or 2.10%, respectively), suggesting that the ranking is more sensitive to variations in their weights. From a practical perspective, the WSIs indicate that for the criterion “Pesticides,” the ranking of EU countries would change only if its weight decreases below approximately 0.32 or increases above 0.39. Within this interval, the overall ordering of countries remains stable.
The sensitivity analysis demonstrates that the PROMETHEE-based rankings remain robust under reasonable variations in the weighting structure of the criteria. The relatively wide stability interval for pesticide sales intensity suggests that this criterion can accommodate substantial weight changes without affecting country rankings. In contrast, the narrower intervals for HRI1 and environmental protection investments indicate a greater influence on marginal ranking shifts. Countries positioned at both extremes of the ranking—those with the highest and lowest performance—remain largely unaffected across the examined weight ranges, reinforcing the stability and policy relevance of the results. These findings confirm the reliability of the proposed multi-criteria framework as a consistent tool for comparative agri-environmental performance assessment across EU Member States.
3.3. Scenario 2
In the second scenario, the emphasis was put on the economic dimension of sustainable development, so the criterion “environmental protection investments” weighed 0.40, while the other two criteria weighed 0.30 each.
Table 7 shows the ranking of EU-27 countries.
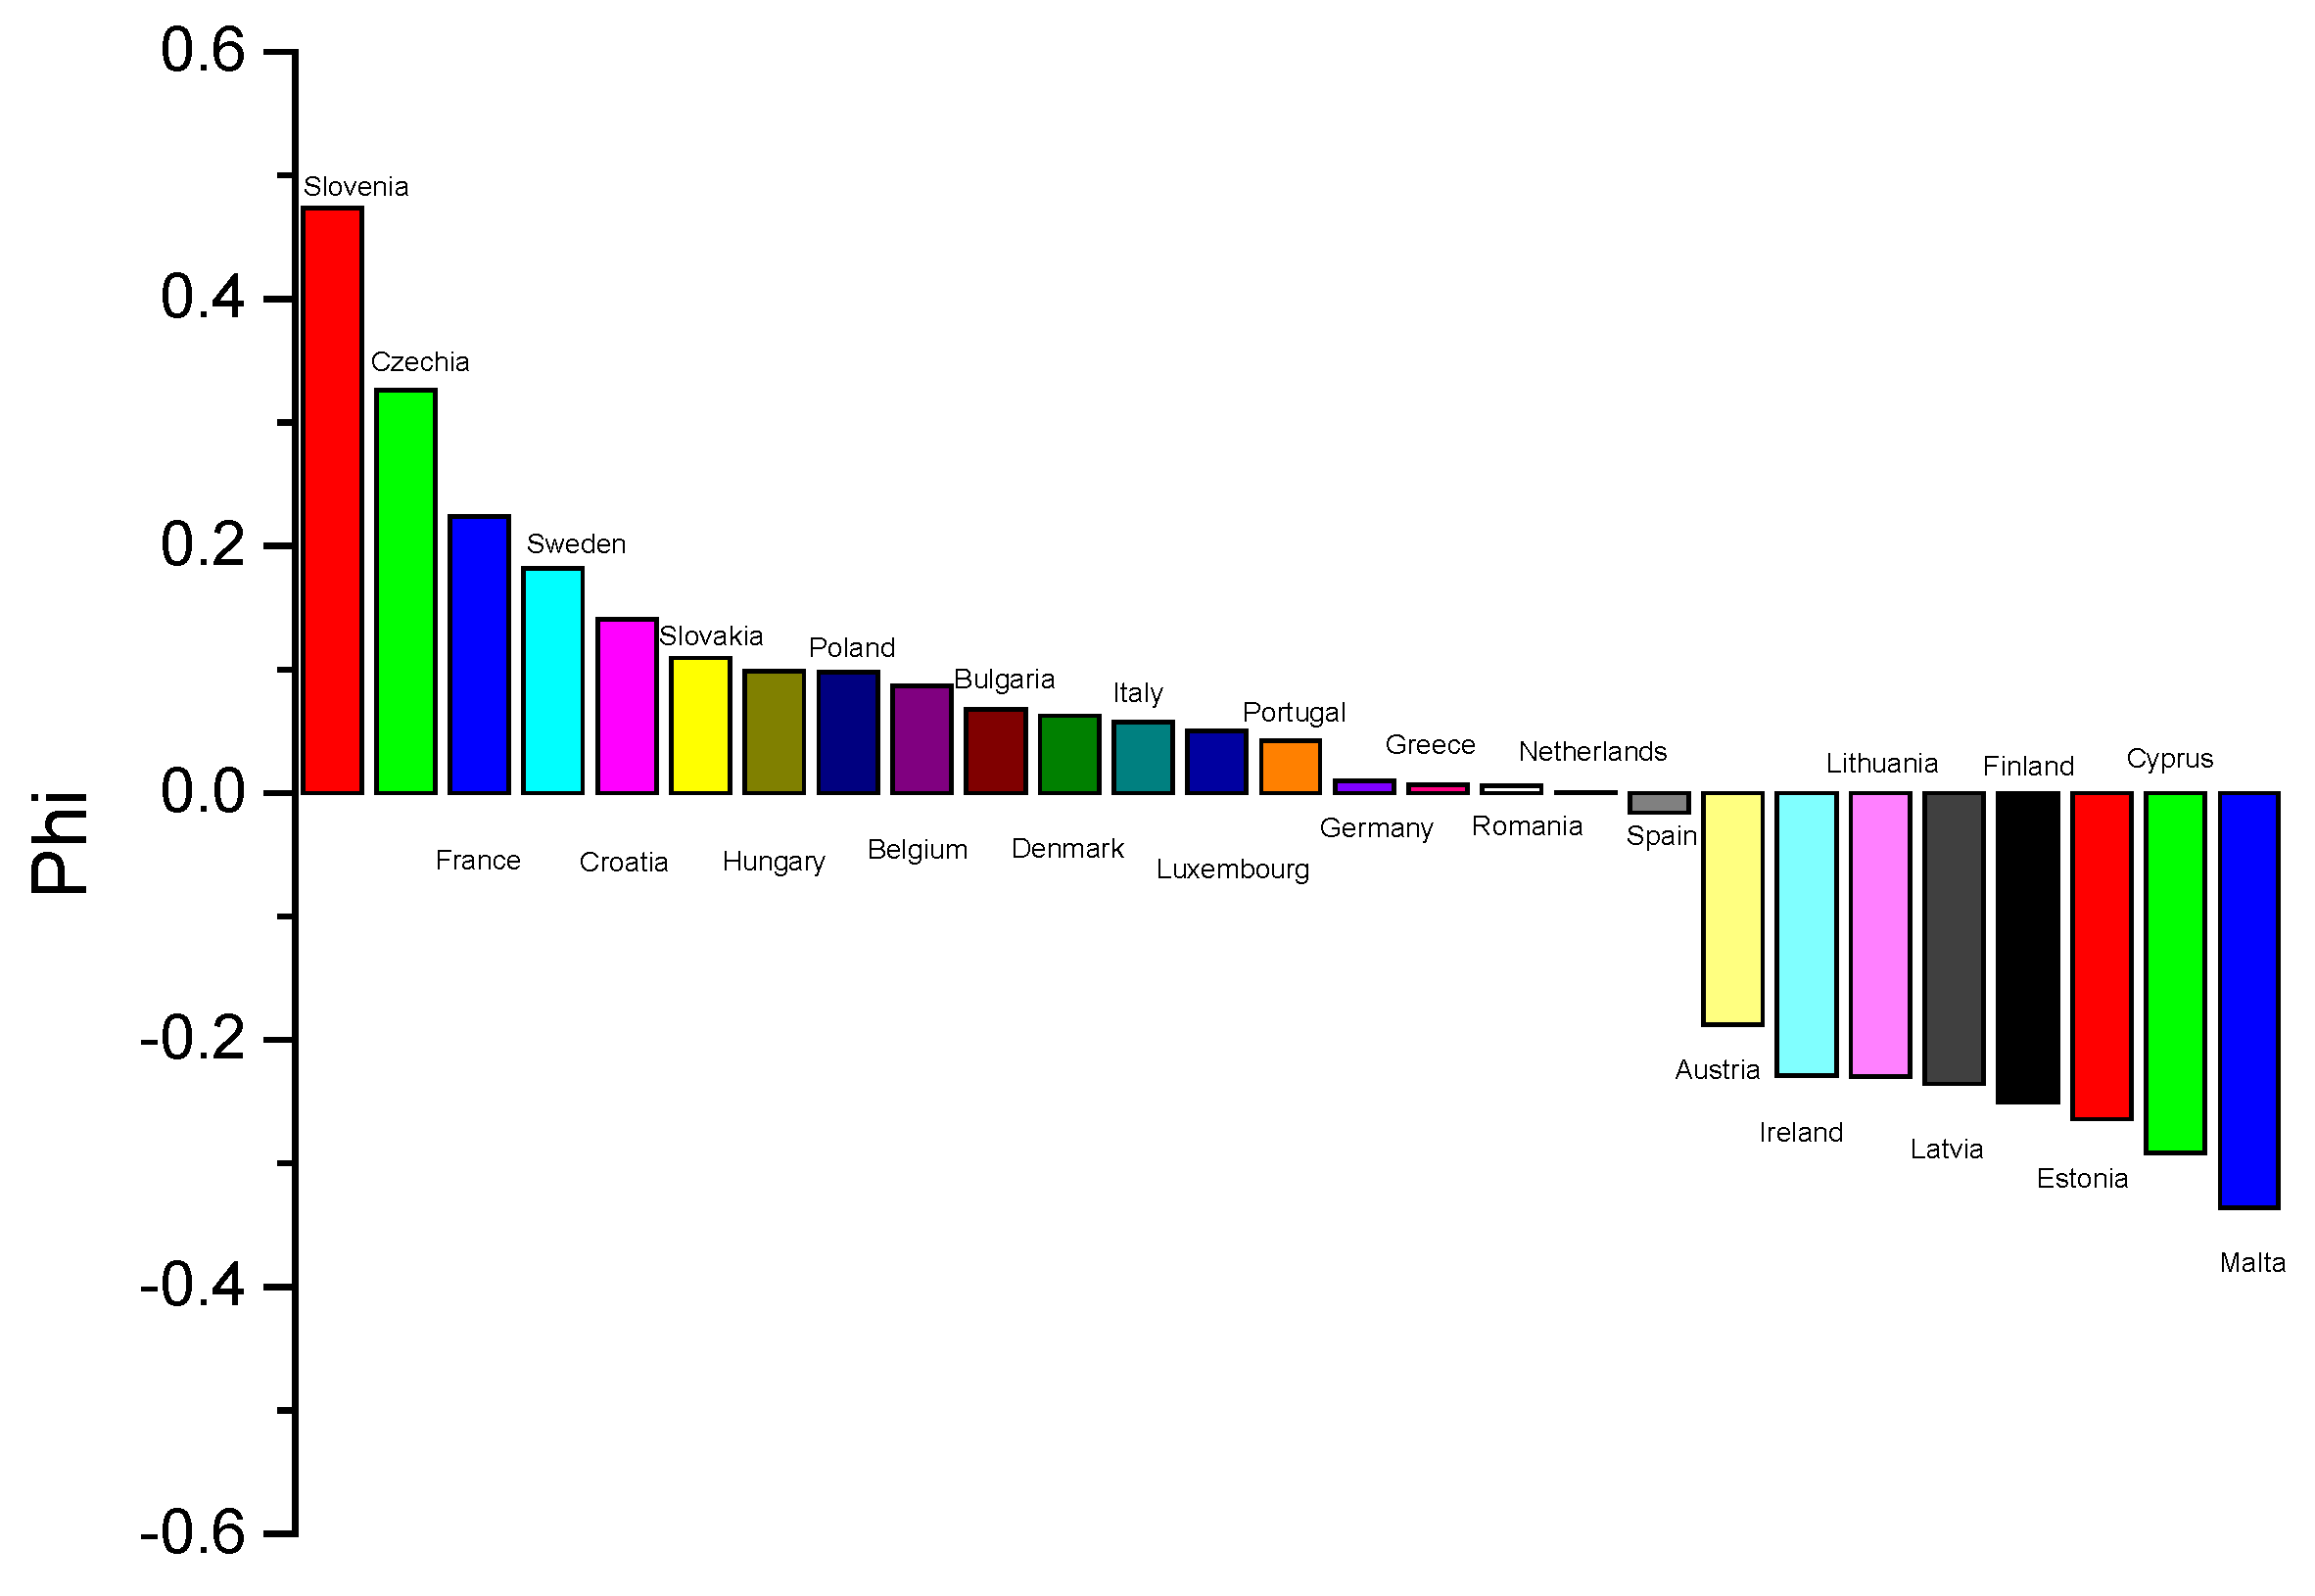
The top-5 countries remain the same as in Scenario 1 and with the same order. Slovenia (Phi = 0.4734) remains in first place, extending its lead over Czechia (Phi = 0.3260). The difference in Phi (ΔΦ) between the two countries increases to 0.1474, compared with 0.1223 in Scenario 1. Among the top five countries, the first four achieve higher Phi values than in Scenario 1, while Croatia shows a slightly reduced Phi (0.1402 instead of 0.1436). Comparing the country ranking in the bottom five countries, we observe the same ranking with Malta, Cyprus, Estonia, Finland and Latvia occupying the last places, with the same order as the first scenario, with Malta achieving the lowest Phi and consequently the worst performance within the EU for the selected criteria. The ranking of the countries is identical in Scenarios 1 and 2 up to the 11th position. The same ranking is observed for the places from 22 to 27. Portugal is in 14th place in both scenarios; Greece remains in 16th place in both scenarios. In Scenario 1 Luxembourg is 12th and Italy is 13th, while in Scenario 2, the opposite is true. Romania is 15th in the first scenario and Germany is 17th, while these two countries swap positions in the second scenario. Places from 18th place to 21st differ: in the first scenario Spain is 18th, Netherlands is 19th, Ireland is 20th, and Austria is 21st, while in the second scenario the ranking is (18) Netherlands, (19) Spain, (20) Austria, and (21) Ireland.
3.4. Scenario 3
In the third scenario, the emphasis was put on the environmental and social pillars of sustainable development. Therefore, these criteria weighed 0.35 each, while the criterion “environmental protection investments”, representing the economic pillar of sustainable development, weighed 0.30.
Table 8 presents the ranking of the countries for Scenario 3.
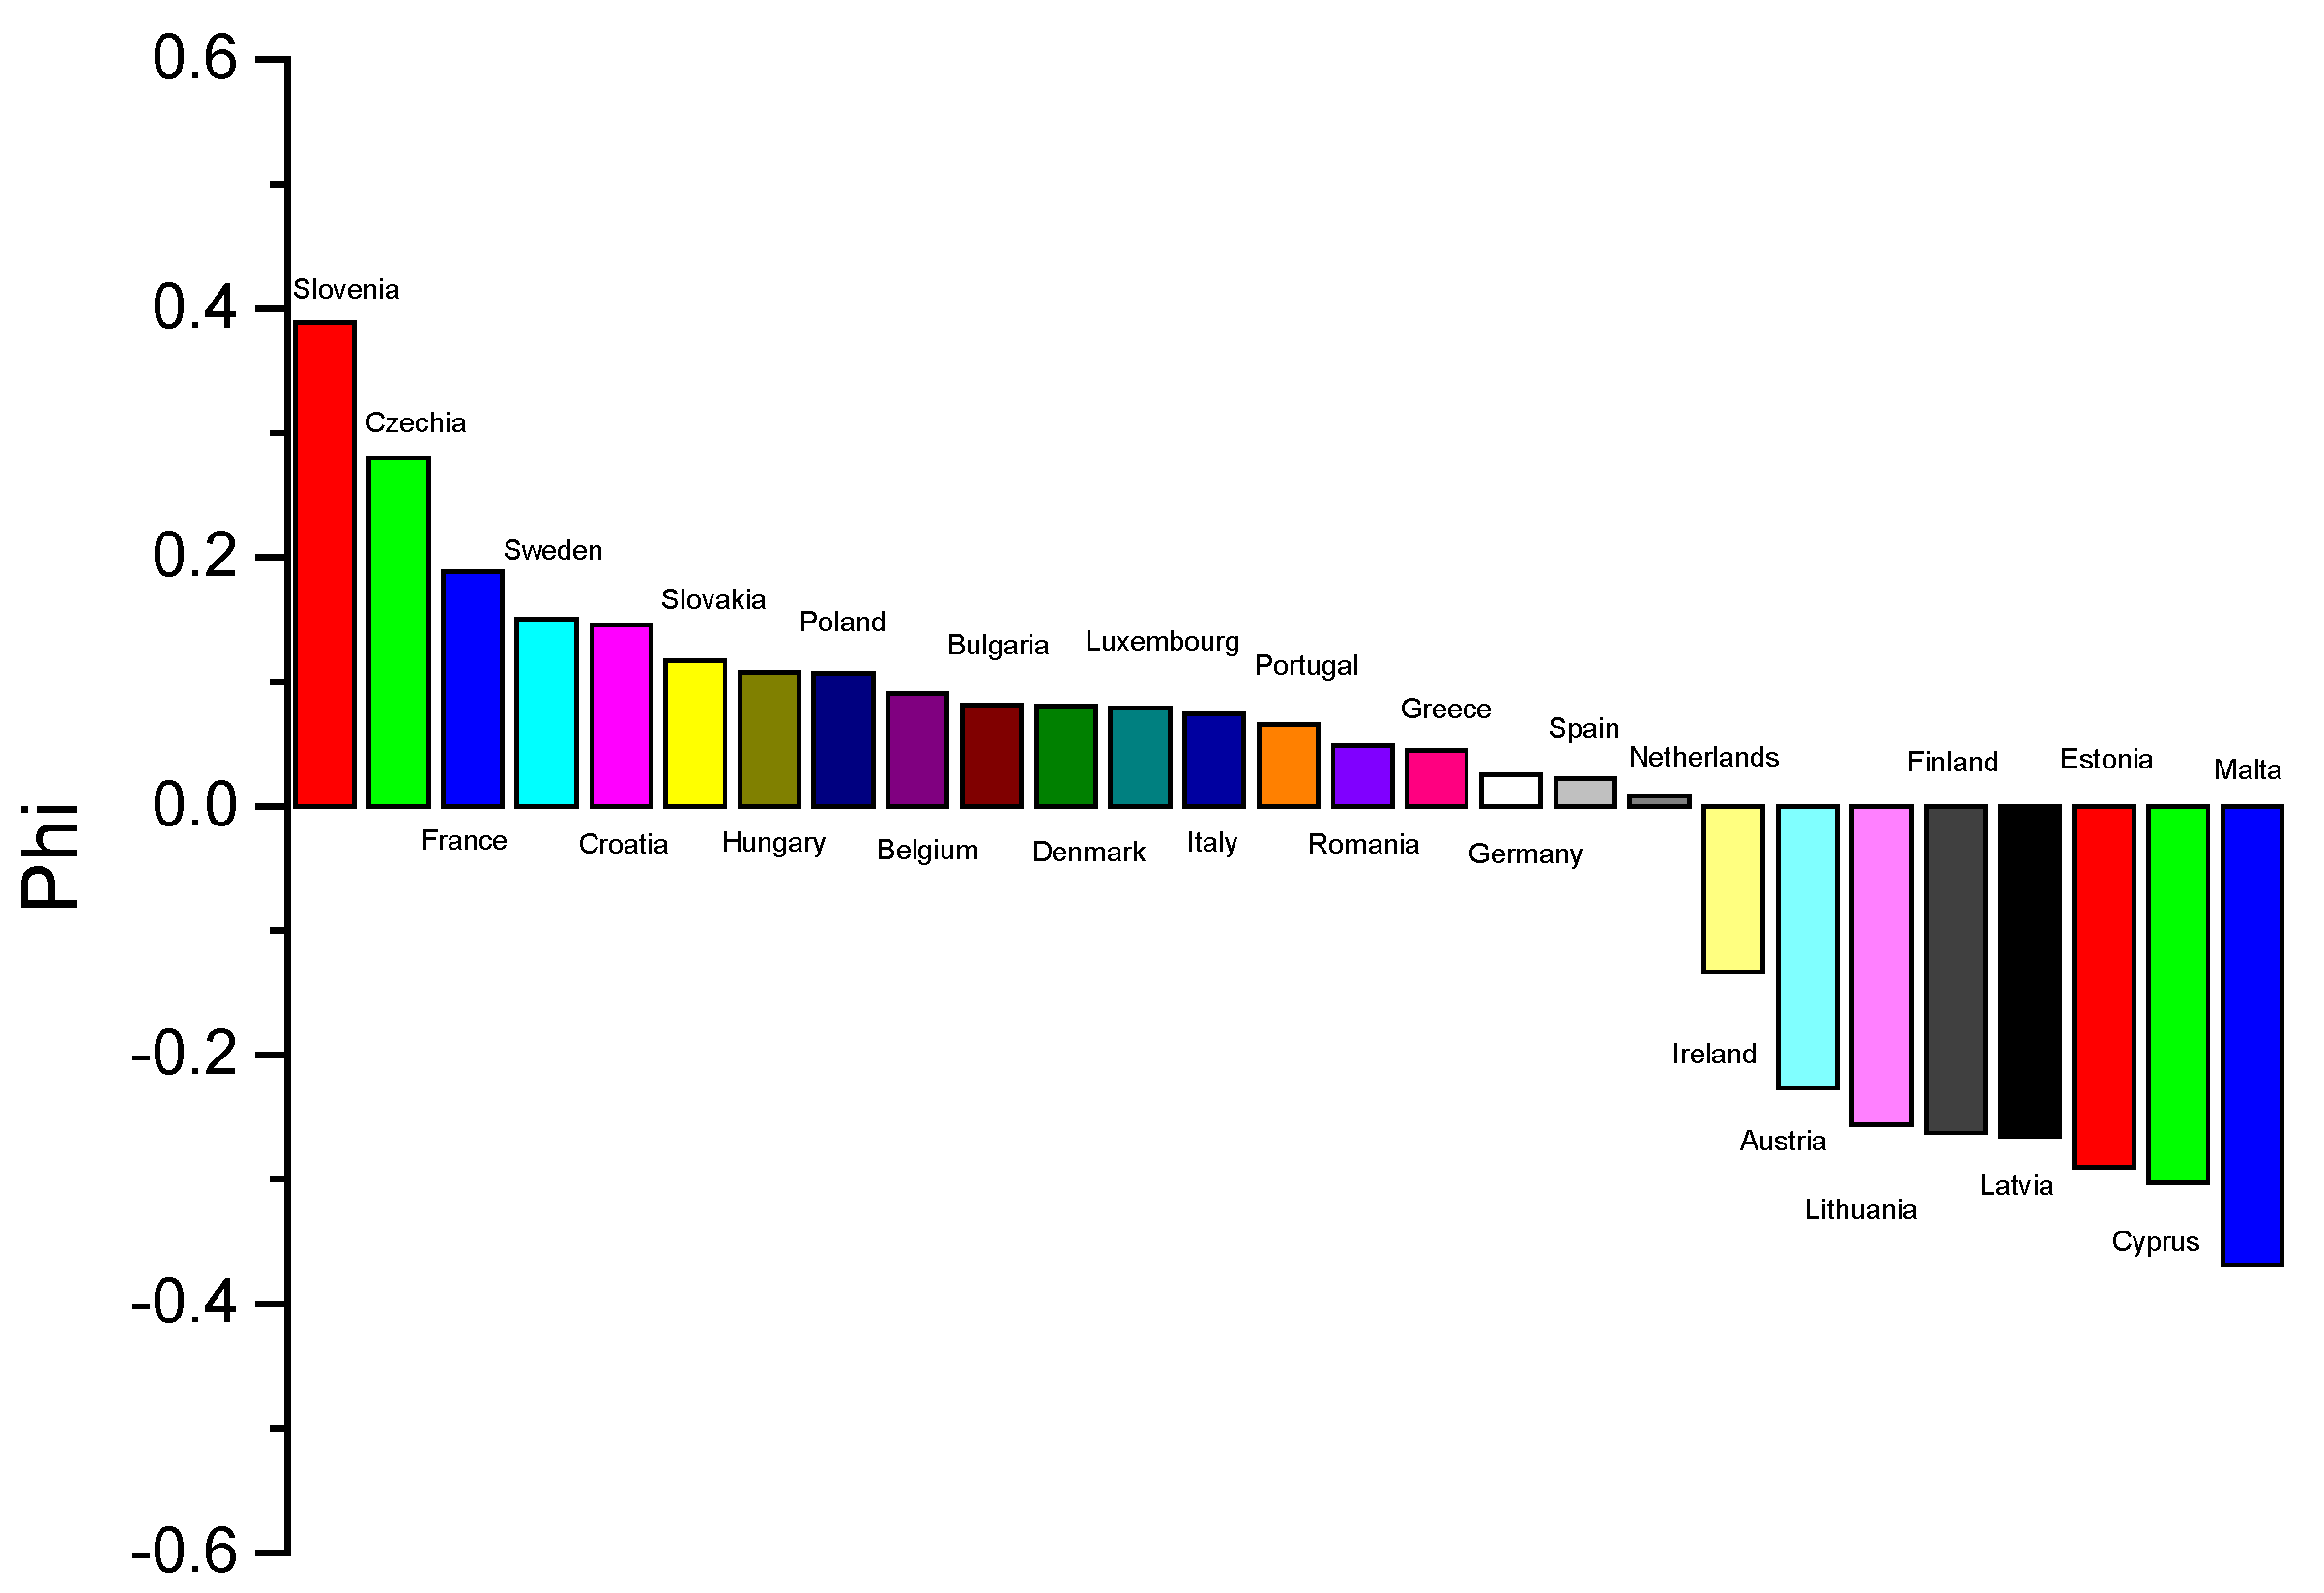
The ranking in Scenario 3 is almost the same as the ranking in Scenario 1. The only difference is in places 23 and 24 of the ranking; in Scenario 3, Finland is 23rd, and Latvia is 24th, while Scenario 1 is the opposite.
Figure 1,
Figure 2 and
Figure 3 visualize the PROMETHEE II net outranking flow (Phi) for each country under the three weighting scenarios. Countries located further to the left with higher Phi values (taller bars) exhibit better overall performance across the selected criteria, whereas countries placed further to the right with lower (or negative) Phi values show weaker performance. Across all scenarios, Slovenia consistently appears as the top-ranked country, while Malta remains at the lowest position. A direct comparison of rankings across scenarios is provided in
Section 3.5.
3.5. Scenarios Comparison
We observe that the first eleven countries keep their positions in all three scenarios. Moreover, the last three countries (Malta, Cyprus, and Estonia) are placed at the bottom of the ranking in all three scenarios, and in the same placement. Other countries that achieve the same ranking in all three scenarios are Portugal (14th), Greece (16th) and Lithuania (22nd). Overall, in all three scenarios, there are 17 countries that have the same placement. For the remaining 10 countries of EU-27, the difference in ranking is almost negligible, with the ranking for these countries differing by only one position. Only Germany and Romania appear to have a different placement by two places. Romania is ranked 15th in Scenarios 1 and 3, while it ranks 17th in Scenario 2. For Germany the ranking is the opposite (17th in Scenario 1 and 3, while it ranks 15th in Scenario 2). In Scenarios 1 and 3, nineteen (19) countries achieve a positive Phi, and only eight (8) countries achieve a negative Phi. In Scenario 2, eighteen countries achieve a positive Phi, while nine (9) countries achieve a negative Phi. Across scenarios, 26 of the 27 countries maintain the same Phi sign (positive or negative), with Spain being the only exception. Spain has a positive Phi in Scenarios 1 and 3, while it has a negative Phi in Scenario 2.
The ranking structure is largely driven by clear differences in the indicator profiles of top and bottom performers. Slovenia consistently ranks first because it combines the highest environmental protection investments (0.85% of GDP) with favorable performance in the pesticide-related criteria. In contrast, Malta consistently occupies the last position, mainly due to its markedly higher pesticide sales intensity (10.33 kg/ha UAA), combined with comparatively weak performance in HRI1 and environmental protection investments relative to the EU-27.
4. Discussion
According to the findings of the study, Slovenia, Czechia, and France achieved the best performance among the EU-27 countries, consistently occupying the top three positions across all examined scenarios. Moreover, the ranking of the first eleven countries remained unchanged. Specifically, Sweden ranked 4th, Croatia 5th, Slovakia 6th, Hungary 7th, Poland 8th, Belgium 9th, Bulgaria 10th, and Denmark 11th in each scenario. At the lower end of the ranking, Malta (27th), Cyprus (26th), and Estonia (25th) consistently exhibited the weakest performance, occupying the bottom three positions among EU Member States. Overall, most countries maintained identical rankings across the three scenarios examined, while the remaining countries showed only marginal variations in their relative positions.
Building on the cross-scenario comparison (
Section 3.5), the ranking patterns can be further interpreted in relation to each country’s indicator profile across the three selected criteria. Slovenia consistently ranks first because it combines very high environmental protection investments with favorable pesticide-related performance, resulting in a clearly positive and stable net flow across scenarios. At the opposite end, Malta consistently occupies the last position, indicating persistent weaknesses in the composite performance of the selected indicators, regardless of the weighting structure. Spain constitutes a notable case, as it is the only country that changes the sign of its net flow across scenarios; this suggests a profile close to the neutrality threshold, where relatively small changes in weights are sufficient to shift its overall balance from slightly positive to slightly negative. Overall, these patterns highlight that countries positioned at the extremes of the ranking remain robustly classified, while borderline cases may be more sensitive to scenario assumptions.
Research from the early 1990s indicated that the public is concerned about pesticides contaminating their food and the environment. Consequently, they are willing to accept the small economic costs associated with reducing pesticide use [
8,
9]. The importance of integrated pest management (IPM) has been highlighted in recent studies [
11,
14], including cultural, physical, and biological controls, as well as the development of resistant plant varieties through biotechnology [
11]. Zhou et al. [
14] also noted that the implementation of enhanced regulatory frameworks is a strategic approach to reduce pesticide reliance, minimize environmental harm, and promote sustainable agriculture.
Climate change is expected to intensify pest pressure and may increase the frequency and intensity of pesticide applications, thereby amplifying health and environmental risks associated with pesticide pollution [
7,
61,
62,
63]. Recent studies indicate that climate is increasingly discussed as a potential indirect driver for greater pesticide dependence by expanding the geographic range of pests, increasing overwinter survival, and intensifying the occurrence of extreme weather events that promote pest outbreaks [
64,
65].
Nevertheless, empirical evidence that directly quantifies a causal and statistically robust relationship between climate change and increased pesticide use at the European Union level remains limited and inconsistent, particularly when disaggregated by crop and region [
7,
61,
66]. Therefore, although climate change is frequently cited as a potential driver of pesticide dependence, establishing this link within the European Union context necessitates further longitudinal, crop-specific, and regionally detailed analyses. This ongoing uncertainty underscores the need for integrated pest management strategies and the development of safer alternatives, such as biological pesticides, to enhance agricultural system resilience under changing climatic conditions [
7,
66,
67].
Beyond the country-level patterns identified in our results, global pesticide-use trends also provide important context for interpreting agri-environmental performance across regions. Shattuck et al. [
25] concluded that between 2008 and 2018, global pesticide use increased by 20% in volume, with a striking 153% rise in low-income countries. The same authors noted that global pesticide use is steadily increasing, which partly contrasts with findings from Zhang’s study [
24], which reported a decline in total pesticide use worldwide after 2007.
The increasing pressures on a global scale have renewed focus on how pesticide risks are measured. Recent analyses have identified significant limitations in the Harmonized Risk Indicator HRI1, which the EU uses to assess pesticide-related risks. HRI1 mainly measures the volume of active substances and their hazard classifications but does not adequately capture cumulative or endpoint-specific risks. In response, recent research proposes a comparative risk-assessment framework that considers multiple toxicological endpoints and the relative risks of individual active ingredients [
68]. This approach offers a more comprehensive understanding of risks across different crop protection programs and underscores the necessity for improved metrics to better assess pesticide sustainability.
In addition to methodological limitations in pesticide-risk indicators, the effectiveness of pesticide management also depends on how these substances are used in practice across Member States. Lykogianni et al. [
15] highlight that pesticides are crucial for plant protection, preventing significant yield losses of 20–40%. Their sustainability impact depends on responsible use. While strict EU authorization criteria aim for safer pesticide use, actual implementation is complex. Our findings show that despite common EU policies, Member States vary greatly in key agri-environmental indicators like pesticide sales intensity, Harmonized Risk Indicator 1, and environmental protection investments. This indicates that sustainability outcomes are influenced not only by EU-level regulations but also by national implementation capabilities, investment trends, and the effectiveness of integrated pest management application.
Beyond pesticide-specific indicators, broader environmental policy instruments also shape agri-environmental performance. In parallel with risk-assessment challenges, policy responses through environmental protection expenditures also play a critical role. Recent studies examining environmental protection expenditures show that energy taxes can stimulate business spending directed to reduce air pollution and mitigate climate impacts. However, the effectiveness of these expenditures depends on whether they are directed toward long-term investments rather than short-term operational mitigation [
69].
These methodological advancements are particularly relevant in light of the limitations of existing risk indicators such as HRI1. Recent advances in pesticide-safety assessment emphasize the need for more sophisticated decision-support tools that integrate expert judgment with environmental risk parameters. Fuzzy logic-based models have proven effective for selecting pesticides with minimal ecological and human health impacts. This approach promotes sustainable pesticide management in agricultural systems [
70].
Such methodological advances complement system-level evidence on the environmental performance of organic and diversified farming systems. When examining how these indicators interact within broader sustainability-assessment frameworks, our findings align with evidence indicating that diversified organic cropping systems often achieve high levels of environmental sustainability. This is due to the absence of synthetic inputs, improved resource-use efficiency, and the broader agroecological benefits they provide. While social and economic performance may vary across systems, the environmental advantages consistently support the opinion that organic and diversified practices can significantly contribute to sustainability outcomes at the national level [
33]. This may partly help contextualize the strong performance of countries with more advanced organic sectors, as reflected in their broader agri-environmental profiles. These dynamics highlight the importance of evaluating sustainability across multiple dimensions, a theme also reflected in broader MCDA-based assessments.
Taken together, these methodological and system-level insights reinforce the value of multi-criteria frameworks for capturing the multidimensional nature of agri-environmental sustainability. Previous sustainability assessments based on MCDA approaches have indicated significant variations in national performance across different thematic dimensions. For instance, Antanasijević et al. [
36] showed that countries like Germany, Hungary, Czechia, and Sweden made progress across all themes of the EU Sustainable Development Strategy (EU SDS). In contrast, countries such as Greece and Ireland did not exhibit overall improvements. Their results also revealed pronounced discrepancies between themes, with above-average progress observed in social inclusion, sustainable transport, and climate change and energy. However, many other themes, including natural resources and socio-economic development, require further efforts to achieve future sustainability progress. Additionally, the study revealed that while the gap in sustainability performance among EU Member States narrowed significantly before 2009, this positive trend continued only for a limited number of EU SDS themes thereafter. These findings support our results by illustrating that advancements in sustainability are uneven across thematic areas. Strong performance in certain dimensions does not necessarily lead to long-term progress in others, particularly in environmentally related domains such as natural resources, where progress remained comparatively limited throughout the examined period.
PROMETHEE-based evaluations of broader environmental performance further highlight the variability in country rankings across criteria. Digkoglou and Papathanasiou [
37] demonstrated that EU Member States exhibit significantly different trajectories when environmental health and ecosystem vitality indicators are assessed through PROMETHEE rather than through the environmental performance index (EPI). Their analysis also revealed substantial heterogeneity regarding the PROMETHEE ranking. Thus, countries such as Sweden, France, and Czechia consistently ranked among the top performers, while others, such as Romania and Belgium, ranked among the worst performers in environmental health and ecosystem vitality.
Comparisons with alternative MCDA-based approaches, such as EDAS, further highlight that country rankings are highly sensitive to both the choice of indicators and the decision-support method employed. For instance, Skvarciany et al. [
71] identified divergent agri-environmental performance patterns when using EDAS, underscoring that methodological choices may substantially affect country positioning.
These comparisons demonstrate that country rankings are highly sensitive to the choice of indicator set and decision-support framework. This finding underscores the necessity of employing harmonized, policy-relevant metrics when benchmarking agri-environmental performance across EU Member States, especially for monitoring pesticide-related risks, pesticide pressure intensity, and investments in environmental protection.
From a policy perspective, the PROMETHEE-based framework provides a transparent, reproducible, and policy-aligned tool for benchmarking agri-environmental performance across EU Member States using officially reported Eurostat indicators. This approach facilitates monitoring progress toward EU sustainability objectives, such as those outlined in the Common Agricultural Policy, the European Green Deal, and the Farm to Fork Strategy, and identifies areas where targeted national measures may be necessary.
PROMETHEE rankings offer a relative rather than an absolute assessment of performance and do not establish causal relationships between policy instruments and observed outcomes. Therefore, the results should be viewed as diagnostic and comparative rather than as definitive measures of sustainability performance. Within these limitations, the practical value of this study lies in delivering a coherent, policy-relevant, and methodologically robust framework for cross-country agri-environmental assessment in the European Union.
5. Conclusions
This study evaluated the agri-environmental performance of the EU-27 Member States using the PROMETHEE multi-criteria decision analysis method and the most recent data available from Eurostat (mainly for the year 2023). Three policy-relevant indicators were selected, each corresponding to one pillar of sustainability: the social pillar, represented by the Harmonized Risk Indicator 1 (HRI1); the environmental pillar, represented by pesticide sales intensity; and the economic pillar, represented by environmental protection investments. A baseline scenario with equal weighting of all criteria was initially applied in line with the principles of the Brundtland Report, followed by a sensitivity analysis that confirmed the robustness of the results. Two additional scenarios were then examined, placing greater emphasis on the economic pillar in the second scenario and on the environmental and social pillars in the third.
Across all three scenarios, Slovenia consistently achieved the highest overall performance, followed by Czechia and France. Moreover, the ranking of the first eleven countries remained unchanged across scenarios, indicating a high degree of stability in relative performance. Similarly, the last three countries—Malta, Cyprus, and Estonia—consistently occupied the lowest positions in all scenarios, underscoring persistent agri-environmental challenges.
Overall, the results reveal marked differences in agri-environmental performance across EU Member States, despite the high stability of country rankings across scenarios. As shown in the Results, a clear divide persists between countries with positive and negative net preference flows, with 18–19 Member States exhibiting positive Phi values across scenarios and a smaller group consistently displaying negative performance. This indicates that common EU policy frameworks do not necessarily lead to convergent agri-environmental outcomes, but rather coexist with structurally differentiated national performance profiles. National implementation capacity, investment priorities, and structural characteristics continue to play a decisive role in shaping sustainability performance.
The findings highlight the value of multiple-criteria decision analysis for addressing the multidimensional nature of agri-environmental sustainability. By integrating indicators related to pesticide sales intensity, pesticide risk, and environmental protection investments, the PROMETHEE method provides a transparent and structured framework for cross-country comparison. The results indicate that improving agri-environmental sustainability requires coordinated policy actions that extend beyond reductions in pesticide use alone. Effective implementation of integrated pest management, increased and targeted environmental investments, and strengthened agri-environmental policy measures are all necessary components of sustainable transition pathways.
A limitation of the present analysis is that it is based on the most recent cross-sectional Eurostat data (single reference year, 2023). Future research could evaluate ranking stability over time using multi-year Eurostat series, dynamic PROMETHEE extensions, and complementary statistical modelling to investigate temporal dynamics and potential drivers of performance changes.
Further work may expand the indicator set, examine longer-term trends, and assess the effectiveness of specific national policy instruments. In addition, alternative weighting approaches—such as the Analytic Hierarchy Process (AHP)—may be employed to incorporate stakeholder or expert preferences and further strengthen the weighting procedure. Overall, the analysis demonstrates that while measurable progress is achievable, sustained improvements in agri-environmental performance across the EU will depend on coherent policy design, effective implementation, and continued methodological innovation.