1. Introduction
The railway tunnels on the Western Sichuan Plateau traverse the Hengduan Mountains on the eastern margin of the Qinghai–Tibet Plateau. Intense tectonic movements along this route, including plate compression and plateau uplift, have created a highly complex engineering geological environment [
1,
2,
3]. More than 80% of these tunnel sections traverse layered soft rock formations, such as Triassic carbonaceous slate and phyllite. These rock masses exhibit densely developed weak structural planes (bedding and foliation), resulting in pronounced mechanical anisotropy [
4,
5,
6]. Under the combined effects of high in-situ stress and layered structures, excavation often triggers asymmetric large deformation along bedding planes. Recurrent failures, such as cracking of the primary shotcrete lining and buckling of steel ribs, have been reported, severely compromising construction safety and schedule [
7,
8,
9]. For example, in the Muzhailing Tunnel of the Lanzhou–Chongqing Railway, the maximum deformation in the carbonaceous slate section reached 1468 mm, accompanied by severe distortion of steel ribs and repeated replacement of the support system, resulting in significant construction delays [
10]. In the Wushaoling Tunnel, crown settlement in the phyllite section reached 1209 mm, leading to cracking of the primary lining and substantial schedule overruns [
11]. Clarifying the controlling role of bedding dip angles on deformation and failure mechanisms and determining appropriate excavation methods and support parameters are therefore critical for tunnels constructed in such geological settings.
The influence of discontinuities on deformation and failure of rock masses in tunneling has remained a focal point in the field of rock mechanics [
12,
13,
14]. Aydan et al. [
15], drawing on soft rock tunneling experience in Japan, first established a quantitative relationship between the degree of squeezing and the strength-to-stress ratio, categorizing squeezing deformation into five distinct stages. Hoek and Marinos [
16] introduced the Geological Strength Index (GSI) and proposed a prediction criterion for squeezing deformation in heterogeneous weak rock masses. In recent years, the control mechanisms of bedding orientation on rock failure modes have been systematically investigated. Si et al. [
17] conducted true triaxial tests on phyllite and identified three distinct failure modes governed by bedding orientation: bedding-parallel sliding, bedding-crossing shear, and local spalling. Lu et al. [
18], based on a layered phyllite tunnel along the Chengdu–Lanzhou Railway, demonstrated that the angle between the in-situ principal stress and bedding planes governs asymmetric deformation and crack evolution. Tian et al. [
19] quantified the coupled impact of bedding dip angles and lateral pressure coefficients on haunch convergence in carbonaceous slate tunnels. Furthermore, Zhou et al. [
20] implemented an enhanced ubiquitous-joint model as a FLAC3D plugin, enabling numerical reproduction of the tensile–shear mixed failure process along bedding planes. Sun et al. [
21] developed an analytical model for the full-process displacement of deep tunnels with fully grouted rockbolts, quantifying the coupled effects of bolt length and installation timing on tunnel wall convergence. Their results revealed that installing bolts close to the tunnel face is more effective in restraining deformation than doubling bolt length: reducing the installation distance to within 1 m of the tunnel face can decrease the wall displacement by up to 51%, whereas doubling the bolt length reduces it by up to 20%. Collectively, these studies have elucidated the impact of bedding orientation on failure modes from various perspectives, establishing a methodological foundation for the deformation analysis of layered soft rock tunnels.
Deformation control of tunnel surrounding rock primarily relies on the optimization of excavation methods and rock bolt parameters [
22,
23,
24]. Liu et al. [
25] demonstrated that in tunnels through extremely weak chlorite schist, the reserved core soil method offers significantly better constraints on face extrusion and crown settlement than the Cross Diaphragm (CRD) method. Regarding rock bolt support, Freeman [
26] pioneered the neutral point concept for fully grouted rock bolts in the Kielder experimental tunnel, identifying a shear stress reversal point along the bolt–rock interface. This point separates the effective anchorage section (inward) from the ineffective drag section (outward). Cai et al. [
27] developed a nonlinear analytical model for the axial load of rock bolts in soft rock tunnels, elucidating the control mechanism of interface coupling–debonding behavior on the anchorage force. Liu et al. [
28] theoretically verified that once the bolt length exceeds a critical limit, the neutral point position stabilizes, and additional length yields no substantial contribution to the anchorage force. Yu et al. [
29,
30] confirmed the existence of an optimal inflection point for bolt length in controlling deformation through comparative studies of prestressed anchoring systems and tests on partially grouted rock bolts. These prior works have deepened the understanding of the mechanical mechanisms of rock-bolt support, providing a theoretical baseline for the bolt length optimization in this study. Although the studies reviewed above have advanced the understanding of bedding-related failure mechanisms and individual support measures, most of them have examined a single factor or a single construction measure in isolation. The coupled effects of bedding orientation, excavation sequence, and support configuration on the deformation and failure of layered soft-rock tunnels remain inadequately addressed, particularly under high in-situ stress conditions.
To address the above gap, this study investigates a railway tunnel section in carbonaceous slate on the Western Sichuan Plateau. Based on field monitoring coupled with FLAC3D numerical simulations, the deformation and failure mechanisms of the surrounding rock are analyzed under two representative bedding conditions: 89° (subvertically bedded) and 54° (moderately dipping). The applicability of three excavation methods—the micro-bench method, the three-bench method, and the reserved core soil method—is evaluated through comparative FLAC3D simulations in terms of stress, displacement, and plastic zone. A parametric analysis of multiple bolt lengths reveals a threshold length of 6 m, on the basis of which a differentiated reinforcement strategy for bedding-induced asymmetric loading is proposed and numerically validated. The results provide a scientific basis for excavation method selection and support parameter design in layered soft rock tunnels.
2. Project Overview
The study site, a plateau tunnel, is located on the Western Sichuan Plateau. The area is in a tectonically denuded high-mountain terrain with exceptionally steep topography. The tunnel is situated in a complex geological region characterized by intense tectonic activity. The tunnel alignment traverses the conglomerate of a Tertiary formation and the carbonaceous slate of a Lower Triassic formation. The rock mass is highly fractured, with pronounced bedding and well-developed joints. Groundwater is weakly developed, and the tunnel face generally remains dry during excavation.
The total tunnel length is 17,772 m, with a maximum burial depth exceeding 300 m. The tunnel axis trends approximately 337°, and more than 60% of the alignment is affected by large deformation. The excavation cross-section measures 10.21 m in height and 9.15 m in width. The surrounding rock is classified as Grade V. In this study, large deformation is defined quantitatively following the strength-to-stress ratio and relative displacement criteria for squeezing ground: a rock mass with a strength-to-stress ratio lower than 0.5 or a relative displacement greater than 3% is classified as large-deformation (squeezing) ground, and the corresponding deformation class is determined from
Table 1. With a strength-to-stress ratio of 0.152–0.197 and a maximum measured displacement approaching 300 mm (relative displacement of approximately 6%), the study section is accordingly identified as Class II (moderate) large-deformation soft rock. The maximum horizontal principal stress ranges from 9.66 to 12.96 MPa, and the minimum horizontal principal stress from 5.75 to 7.28 MPa. The estimated overburden stress ranges from 9.38 to 9.86 MPa. At the measurement points, the average lateral pressure coefficients (the ratios of the maximum and minimum horizontal principal stresses to the vertical stress) are approximately 1.49 and 1.06, respectively. The in-situ stress field is dominated by horizontal stresses, with the maximum principal stress oriented between NW and NWW, forming an angle of approximately 22° to 45° with the tunnel axis, indicative of a moderate oblique intersection. The tunnel adopts a composite lining system and is excavated using the micro-bench method, with an advance length of 2 m and a bench length of 4 m.
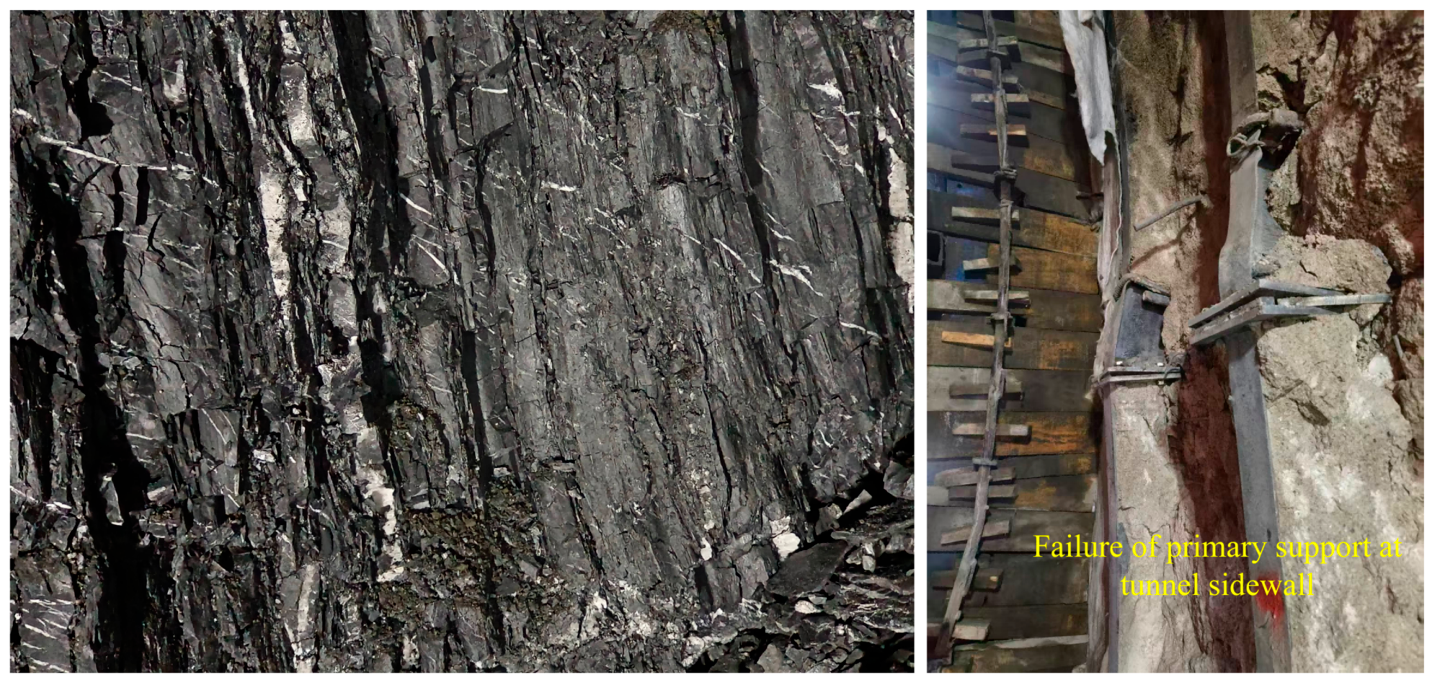
Field observations indicate that the carbonaceous slate is highly fractured and exhibits reduced face stability, with frequent rockfalls occurring prior to installation of the primary support. Influenced by the bedding dip angle, the deformation of the surrounding rock is markedly asymmetric. The maximum displacement approaches 300 mm, and large-deformation-induced failures are observed in the sidewall support system, including cracking of shotcrete and distortion of steel ribs. The exposure of carbonaceous slate strata and the deformation and failure of the sidewall support structure are shown in
Figure 1.
3. Failure Modes of Surrounding Rock Governed by Bedding Dip Angles
To elucidate the controlling role of bedding dip angles on the large-deformation failure mechanism of carbonaceous slate tunnels, two representative cross-sections with bedding dip angles of 89° (subvertically bedded) and 54° (moderately dipping) were selected. Based on the physical and mechanical properties of carbonaceous slate, a ubiquitous-joint model was implemented in FLAC3D 7.0 (Itasca Consulting Group, Inc., Minneapolis, MN, USA) to simulate the excavation-induced distribution characteristics of the plastic zone. Meanwhile, multipoint extensometers were installed at the selected sections for field monitoring to capture the spatiotemporal evolution of surrounding rock convergence. The reliability of the numerical model was validated through comparison between simulation results and field measurements, thereby clarifying the failure modes and deformation characteristics of the surrounding rock under different bedding dip angles.
3.1. Numerical Modeling and Parameter Calibration
Carbonaceous slate exhibits pronounced mechanical anisotropy because of its well-developed bedding, with the strength and deformation behavior depending strongly on the orientation of the bedding relative to the loading direction. The bedding planes, as the dominant weak structural planes, largely control the deformation and failure of the tunnel. The ubiquitous-joint model was therefore adopted in the numerical simulation; it embeds the bedding planes in the rock mass as weak planes that follow the Mohr–Coulomb shear and tensile failure criteria, so that shear slip and failure along the bedding planes can be reproduced.
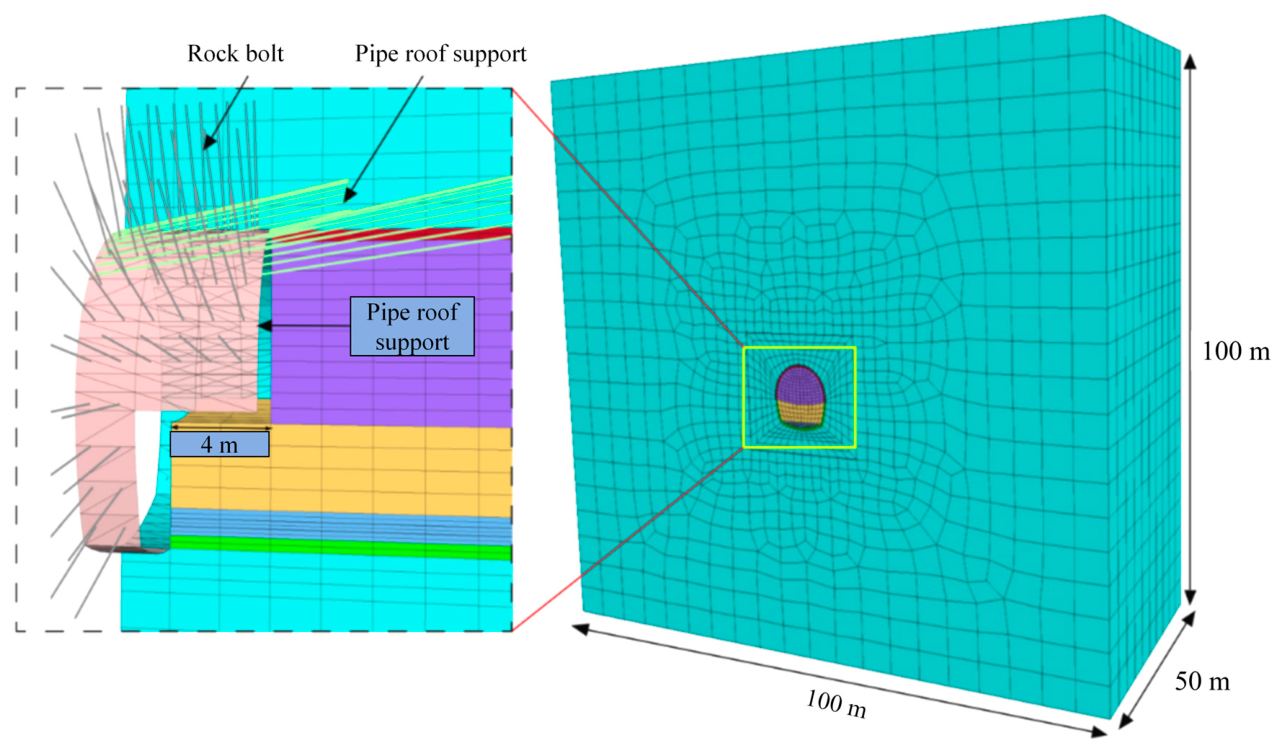
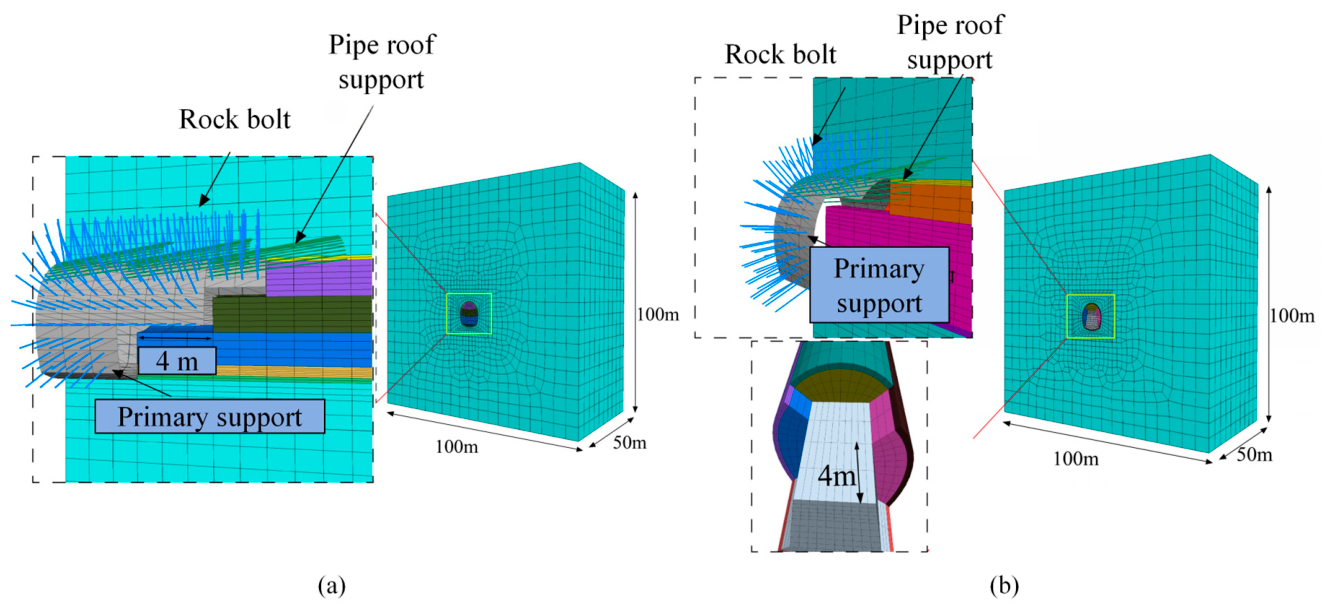
The numerical simulation adopted the micro-bench excavation method consistent with field construction, with an advance length of 2 m and a bench length of 4 m. To strike a balance between computational efficiency and accuracy, the model dimensions were set to 50 m (length) × 100 m (width) × 100 m (height). The lateral boundaries and bottom boundary were fixed, while the top boundary was free. The initial stress field was established on the basis of the in-situ stress measurements at the study site (
Section 2), where the in-situ stress was measured using the hydraulic fracturing method (HFSM) in boreholes and the initial stress field was back-analyzed by multiple linear regression: the measured principal stresses were transformed to the model coordinate directions, and the vertical stress was applied at the top surface as a uniformly distributed load representing the self-weight of the overlying rock mass (γ = 24 kN/m
3), whereas the horizontal stresses were applied as depth-increasing gradients according to the corresponding stress ratios. The composite lining system and rock bolt support were incorporated into the model. The numerical analyses were performed in the large-strain mode of FLAC3D to account for the geometric nonlinearity caused by the large convergence of the surrounding rock. To maintain numerical stability and convergence, the mesh was refined near the tunnel boundary and the excavation was simulated in multiple small steps, with each calculation stage advanced only after the maximum unbalanced force ratio fell below the tolerance of 1 × 10
−5. The numerical model and related parameters are presented in
Figure 2 and
Table 2,
Table 3 and
Table 4.
To obtain the equivalent rock mass parameters listed in
Table 2, core samples from the study section were first tested in the laboratory. Uniaxial and triaxial compression tests yielded an intact uniaxial compressive strength of 74 MPa, and a Mohr–Coulomb fit of the Mohr circles gave an intact-rock cohesion of 8.93 MPa and an internal friction angle of approximately 50°. Because the carbonaceous slate in the study section is highly fractured with well-developed bedding and joints, the intact-rock parameters were reduced to equivalent rock mass parameters following the GSI-based Hoek–Brown approach (GSI = 35, D = 0.2, mi ≈ 10), which yielded an equivalent uniaxial compressive strength of about 0.8 MPa for the fractured zone. The equivalent deformation modulus (0.8 GPa), cohesion (0.5 MPa), and internal friction angle (45°) listed in
Table 2 were then derived through reduction factors reflecting the degradation of the heavily fractured rock mass and excavation-induced disturbance. Consistent with the strength degradation of fractured rock masses, the cohesion and deformation modulus were reduced substantially (to 0.5 MPa and 0.8 GPa, respectively), while the friction angle was reduced only moderately (from approximately 50° to 45°). The lining support and material mechanical parameters were assigned according to the actual field support design.
3.2. Evolution and Failure Modes of the Plastic Zone
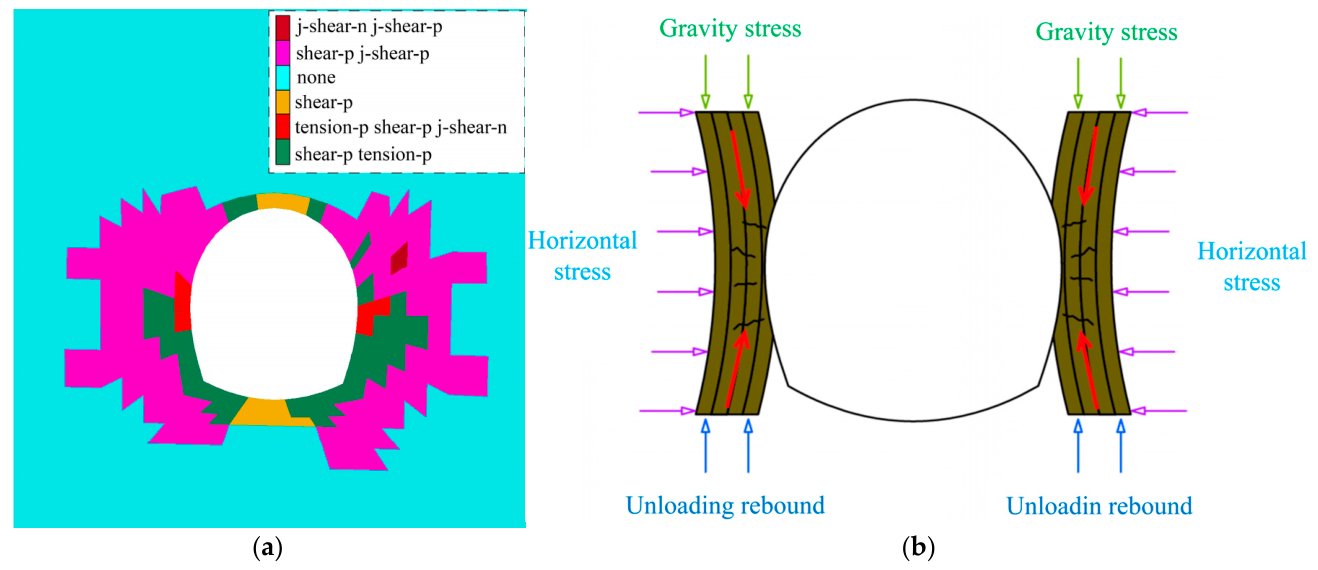
In Case 1, the carbonaceous slate has a bedding dip angle of approximately 89°, and the angle between the bedding strike and the tunnel axis is about 15°, representing a subvertical bedding condition. The post-excavation distribution of the plastic zone is illustrated in
Figure 3a. The plastic zone at the sidewalls is significantly larger in area than at the crown and invert, extending approximately 7.5 m into the interior rock mass. At the haunch and sidewalls, the failure mode is complex, dominated by tensile-shear failure of the rock mass and joints, while the deep-seated rock primarily undergoes shear failure. The crown and invert are dominated by tensile-shear failure near the free surface, reaching a maximum depth of approximately 4 m. The mechanical response is illustrated in
Figure 3b. The horizontal stress acts perpendicular to the bedding planes, causing flexural failure of the sidewall rock under normal stress. Meanwhile, the overburden stress acts parallel to the bedding, triggering interlayer slip. In combination with the intrinsically low shear strength of the bedding planes, this induces extensive shear failure. As a result, sidewall convergence significantly exceeds crown settlement, rendering the sidewalls particularly susceptible to large deformation.
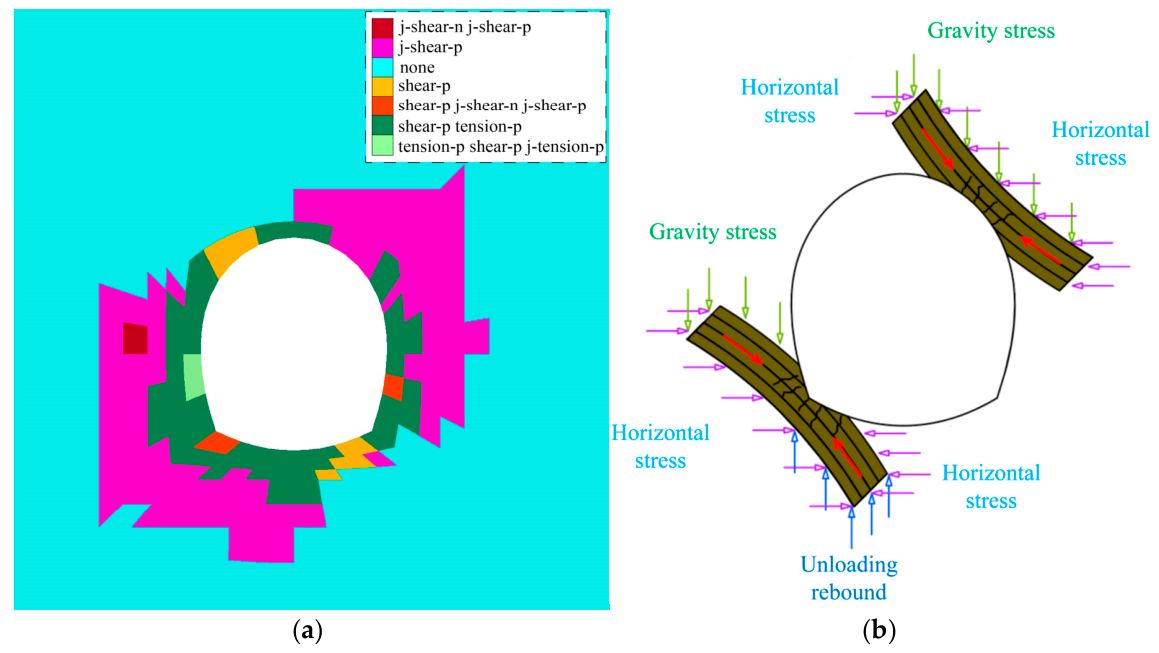
In Case 2, the carbonaceous slate features a bedding dip angle of 54° and an angle of approximately 10° between the rock strike and the tunnel axis, representing surrounding rock subjected to bedding-induced asymmetric loading. As illustrated in
Figure 4a, the plastic zone distribution differs markedly from the subvertically bedded case; it is concentrated at the right shoulder and left springline, propagating to a depth exceeding 7 m. Near the free surface, failure is predominantly characterized by mixed tensile–shear modes within the rock mass and along bedding planes, extending to a maximum depth of 3.4 m, whereas the deep-seated rock mass is dominated by shear failure. As shown in
Figure 4b, the overburden and horizontal stresses are resolved into components normal and parallel to the bedding planes. The normal component exerts perpendicular pressure on the slate, triggering flexural failure near the free surface. Conversely, the parallel component promotes deep-seated interlayer slip, causing the strata to slide along the bedding planes and resulting in widespread shear failure. Therefore, the displacements at the right shoulder and left springline are significantly greater than those at other locations, identifying these areas as high-risk zones for large deformation.
Since the two cases share the same in-situ stress field and differ only in the bedding orientation, the contrasting failure patterns of the two cases can be attributed to the bedding orientation rather than to the stress orientation. For the two representative bedding conditions investigated in this study, the plastic zone distribution and failure modes in carbonaceous slate tunnels are strongly influenced by the bedding dip angle. Morphologically, the distribution of the plastic zone around the tunnel cross-section is symmetric about the normal to the bedding planes. Specifically, it exhibits a butterfly-shaped symmetry in subvertically bedded rock masses and a skew-symmetric pattern under bedding-induced asymmetric loading. Regardless of the dip angle, the plastic zone consistently propagates from the free surface deeper into the rock mass along the normal direction. The specific failure mode depends on the angle between the bedding and the free surface. When they are nearly perpendicular, localized shear failure dominates, resulting in a confined plastic zone and relatively better stability. When they are nearly parallel, a composite failure mode of “shallow flexural–tensile failure + deep-seated interlayer shear” is formed. The rock near the free surface undergoes flexural extrusion under normal stress, while deep-seated shear stress triggers extensive interlayer slip along the bedding planes, leading to a significant degradation of rock mass stability.
Quantitatively, the plastic zone extends approximately 7.5 m into the sidewall rock mass along the direction normal to the bedding planes in Case 1, whereas it propagates beyond 7 m toward the right shoulder and left springline in Case 2, with a failure depth of approximately 3.4 m near the free surface. These extension orientations are consistent with the decomposition of the in-situ stress into components normal and parallel to the bedding. These numerically predicted failure patterns are corroborated by the field observations at the investigated sections: the maximum measured displacement approached 300 mm, and the deformation of the shotcrete and distortion of the steel ribs of the primary support occurred in the regions where the model predicted the most extensive plastic zone and the largest deformation.
3.3. Spatio-Temporal Convergence Characteristics
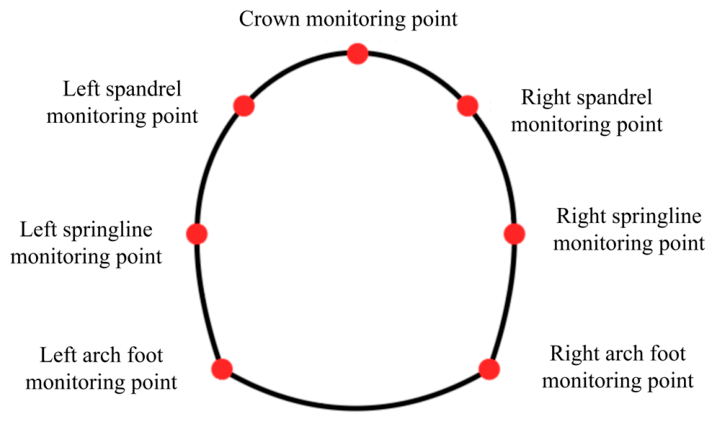
The convergence of surrounding rock reflects the integrated response to excavation-induced disturbances, where its spatio-temporal evolution provides a direct indicator of rock mass stability. By cross-validating field monitoring data with numerical results under various bedding dip angles, the reliability of the numerical model was verified. Consequently, the distinct characteristics and evolution patterns of rock mass deformation under the two typical bedding inclinations were elucidated. To capture the convergence behavior of the surrounding rock during tunnel excavation, multipoint extensometers were installed at the crown, shoulder, haunch, and springline of typical cross-sections. The layout of these monitoring points is illustrated in
Figure 5.
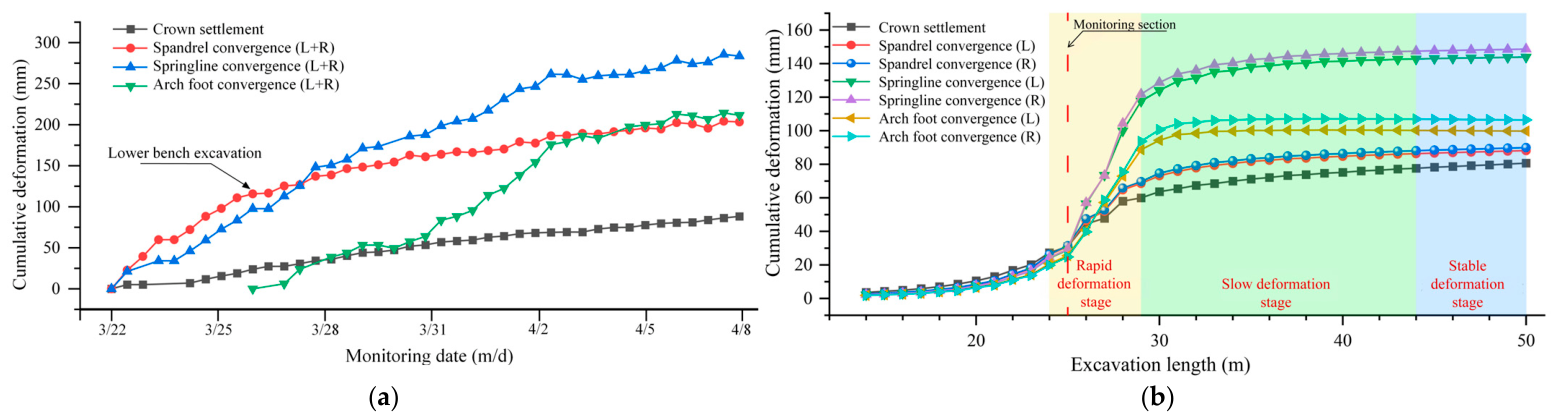
For Case 1, continuous field monitoring was conducted for 16 days, and the resulting field deformation data is presented in
Figure 6a. As illustrated, following the closure of the primary support at the invert, the maximum cumulative displacement was recorded at the haunch (285.7 mm) with a rate of 22.6 mm/d. In contrast, the crown exhibited the minimum displacement (88.3 mm) at a significantly lower rate of 4.9 mm/d. Notably, the deformation rate at the haunch increased by 22.5% during the lower-bench excavation relative to the upper-bench stage, indicating a pronounced secondary disturbance triggered by subsequent excavation steps. To eliminate the boundary effects caused by the longitudinal constraints at both ends of the numerical model, displacement curves were extracted from the cross-section at x = 25 m. The evolution of these displacement curves is shown in
Figure 6b. A comparative analysis reveals that the sidewall convergence is significantly greater than the crown settlement, which strongly aligns with the anisotropic characteristics of the carbonaceous slate. This anisotropic response is primarily governed by the bedding orientation. In the horizontal direction, the rock mass is intersected by weak bedding planes, leading to a significant reduction in shear strength and elastic modulus. As a result, the sidewalls are highly susceptible to flexural failure under horizontal tectonic stress. Conversely, the rock mass exhibits superior mechanical integrity in the vertical direction, which effectively restricts crown deformation.
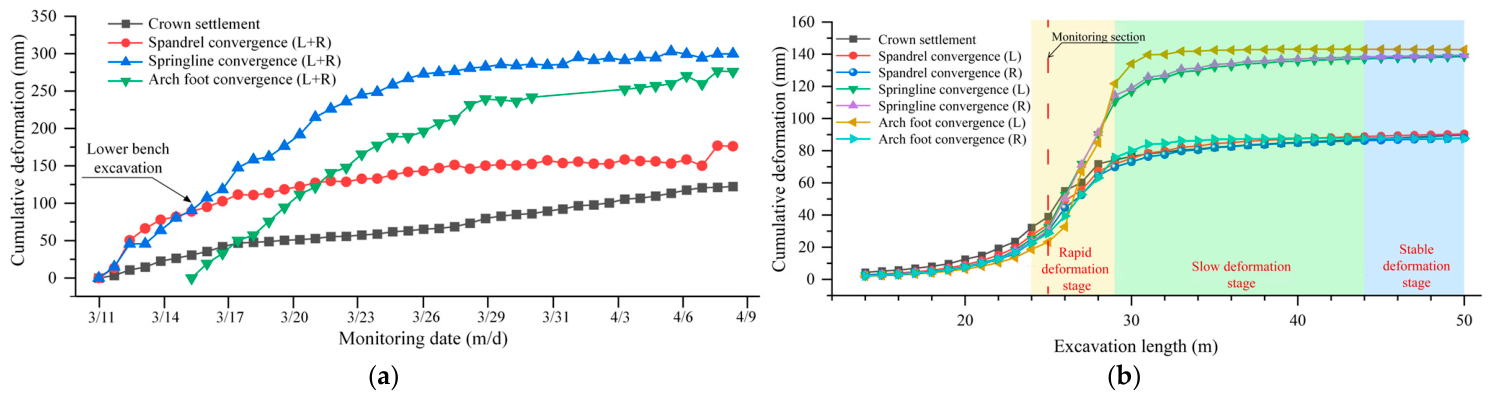
For Case 2, continuous field monitoring was conducted for 29 days, and the resulting field deformation data is presented in
Figure 7a. As illustrated, the maximum cumulative displacement was recorded at the haunch (299.3 mm) with a rate of 29.1 mm/d. In contrast, the crown exhibited the minimum displacement (110.3 mm) at a significantly lower rate of 4.7 mm/d. Following the excavation of the lower bench, the deformation rates at the shoulder and haunch surged by 30.5% and 81.9%, respectively. This indicates a markedly more pronounced triggering effect of construction disturbance under asymmetric loading. Upon the closure of the primary support, the deformation rates gradually decreased. The numerical simulation results, as depicted in
Figure 7b, reveal a distinct asymmetric pattern in the rock mass deformation. Specifically, the displacement at the left springline reached 146.6 mm, whereas that at the right springline was only 90.8 mm. Mechanistically, at the left springline, the bedding planes are sub-parallel to the free surface, causing the layered rock mass to undergo flexural failure under normal compression. Conversely, at the right springline, the bedding planes intersect the free surface at a sub-perpendicular angle. In this orientation, the compressive strength dominates over the flexural strength, thereby restricting the magnitude of deformation. Consequently, these findings demonstrate that the bedding dip angle not only governs the distribution of the plastic zone but also directly dictates the degree of asymmetry in the surrounding rock deformation.
A systematic comparison between the simulated and field-measured results for both cases demonstrates the reliability of the numerical model. The simulated and measured cumulative displacements at each monitoring point are compared in
Table 5. For Case 1, the relative errors at the crown, shoulder, haunch, and springline are 2.2%, 2.4%, 3.4%, and 6.2%, respectively; for Case 2, they are 16.0%, 4.1%, 6.2%, and 8.5%, respectively. The largest error occurs at the crown of Case 2, where the simulated displacement is underestimated more markedly.
Furthermore, the simulation for Case 2 successfully captures the asymmetric deformation characteristic—where the displacement at the left springline notably exceeds that at the right—which strongly aligns with the field observations. Overall, the model accurately reproduces the spatial distribution patterns of rock mass deformation under both dip angles. The slight underestimation of the simulated values compared to the field data can likely be attributed to the absence of the creep effect in the constitutive model. Because the constitutive model does not include a time-dependent (creep) component, the simulated displacement represents the final deformation state, whereas the field-measured time histories additionally incorporate time-dependent creep deformation. Built upon this rigorous validation, and by synthesizing the monitoring curves with the construction sequence, the severe deformation process of the soft rock can be classified into three distinct stages: (1) Rapid release stage: Following the excavation of the upper bench, the in-situ stress is abruptly released, yielding the highest deformation rates. Specifically, the maximum rates at the haunch for Case 1 and Case 2 peaked at 22.6 mm/d and 29.1 mm/d, respectively. (2) Secondary disturbance stage: The excavation of the lower bench triggers a secondary disturbance, causing a transient rebound in the deformation rate at the haunch. Subsequently, following the closure of the primary support, the deformation rate progressively declines. (3) Creep and stabilization stage: The rock mass subsequently enters a creep-dominated deformation stage, during which the displacement rate progressively declines, the monitoring curves gradually level off, and the deformation ultimately stabilizes. This stage is identified solely from the field monitoring curves and reflects the time-dependent deformation observed in the field; the numerical constitutive model adopted in this study does not include a creep component, and the simulated displacement therefore represents the final deformation state.
4. Applicability Assessment of Construction Methods
The micro-bench method was adopted for excavation in this tunnel. The preceding analysis indicates that under this method, the sidewalls exhibit pronounced displacement gradients and the plastic zone undergoes sustained shear failure, suggesting that there remains room for improvement in deformation control performance. The three-bench method and the reserved core soil method are likewise staged excavation techniques and have been successfully applied in soft rock tunnels. However, their relative applicability under the geological conditions of the present project remains unclear. In this section, the micro-bench method is systematically compared with the aforementioned two methods. A comprehensive evaluation is conducted in terms of stress, displacement, and plastic zone to assess the advantages and limitations of each method and to determine the optimal excavation Scenario for this soft rock tunnel.
4.1. Numerical Model and Parameter Selection
Section 3 revealed a fundamental difference in the failure modes of the surrounding rock under subvertical bedding (89°) and inclined bedding (54°). The former exhibits a symmetric butterfly-shaped failure pattern, whereas the latter undergoes an asymmetric failure driven by asymmetric loading. To objectively compare the different construction methods, it is imperative to first eliminate the confounding factor of bedding-induced asymmetric loading. This allows for an isolated evaluation of each method’s inherent deformation control efficacy under a symmetric failure mode. Consequently, the numerical models in
Section 4.1,
Section 4.2,
Section 4.3 and
Section 4.4 are established using Case 1 (subvertical bedding) as the baseline scenario. The geometric modeling and mesh generation for the tunnel were executed using the Rhino 8 (Itasca Consulting Group, Inc., Minneapolis, MN, USA) software and its associated plug-ins. Three separate excavation models were constructed, corresponding to the micro-bench method, the three-bench method, and the reserved core soil method. The overall dimensions for all models were uniformly set to 50 m (length) × 100 m (width) × 100 m (height). After mesh generation, the models were imported into FLAC3D for numerical analysis. A ubiquitous-joint model governed by the Mohr–Coulomb failure criterion was adopted to represent the rock mass behavior [
20,
32,
33]. The influence of groundwater pressure was neglected, which is justified by the site hydrogeology: the tunnel face remained dry throughout excavation with no observed seepage or water inflow, and swelling tests on the carbonaceous slate samples confirmed that the cation exchange capacity, montmorillonite content, and free swelling ratio were all below the swelling thresholds, indicating no notable water sensitivity of the rock mass. The influence of groundwater pressure on the surrounding rock strength and on the numerical results is therefore negligible. The initial stress field was applied in the same manner as in
Section 3.1, based on the in-situ stress measurements at the study site (
Section 2).To minimize numerical errors and reduce the influence of boundary effects on the simulation results, the following boundary conditions were applied: the upper surface was treated as a free boundary without constraints; displacement constraints in the Y-direction were imposed on the front and rear boundaries; displacement constraints in the X-direction were applied to the left and right boundaries; and displacement constraints in the Z-direction were imposed at the bottom boundary.
The lateral boundaries are approximately 45 m from the sidewalls, about 4.9 times the tunnel width, which exceeds the commonly recommended range of 3–5 times the excavation span for avoiding significant boundary effects. Moreover, the maximum plastic-zone extension into the sidewall is about 7.5 m (
Section 4.4), far smaller than the boundary distance, confirming that the boundary conditions do not influence the computed results. The relevant physical and mechanical parameters for the support materials are listed in
Table 3 and
Table 4. The excavation model for the micro-bench method is illustrated in
Figure 2, while the numerical models of the compared excavation methods are presented in
Figure 8.
4.2. Distribution Characteristics of Maximum Principal Stress
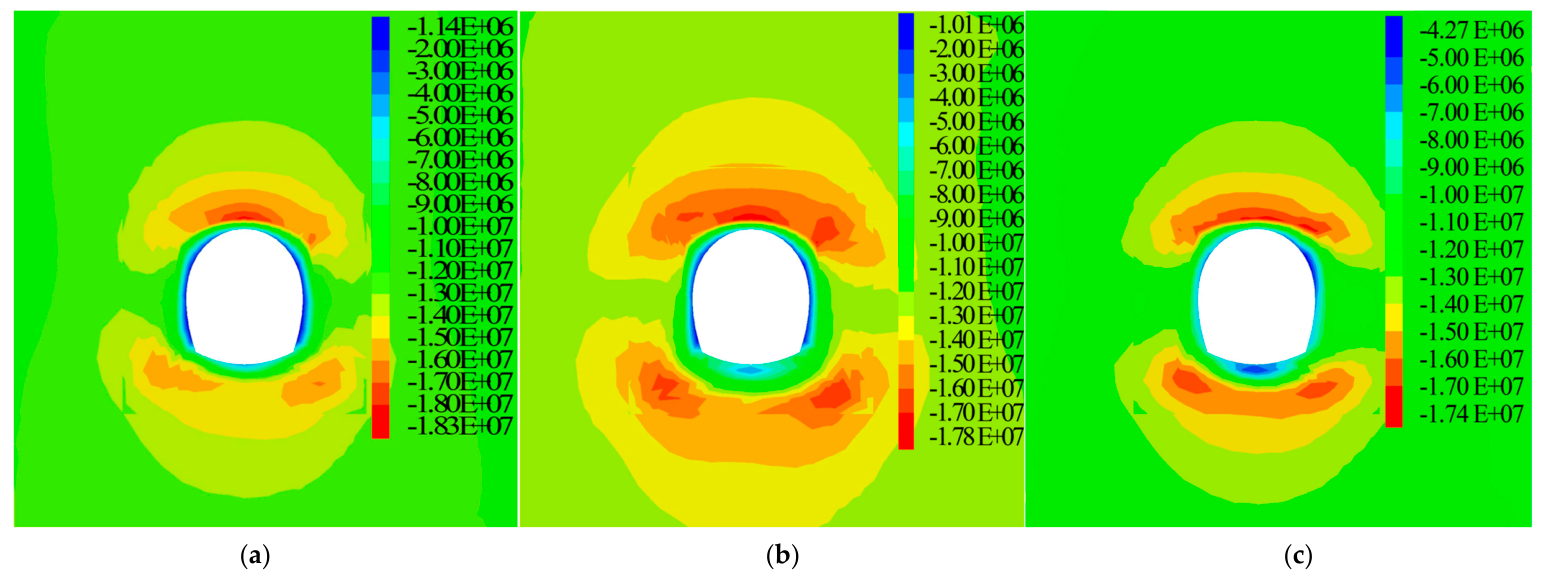
Figure 9 presents the contours of the maximum principal stress for the tunnel cross-section after excavation using the three different methods. As shown in
Figure 9, the overall distribution patterns of principal stress are broadly similar among the three excavation methods. Stress concentration occurs primarily at the crown and sidewalls, gradually attenuating toward the interior rock mass, while the invert exhibits the lowest stress level. However, noticeable differences exist in the magnitude of stress concentration. The peak maximum principal stresses rank as follows: micro-bench method (18.3 MPa) > three-bench method (17.8 MPa) > reserved core soil method (17.4 MPa). Compared with the micro-bench method, the peak stress is reduced by 2.8% and 4.9% for the three-bench and reserved core soil methods, respectively, indicating that the reserved core soil method is most effective in mitigating stress concentration. In terms of stress gradient, the reserved core soil method exhibits the smallest peak-to-valley difference and relatively sparse contour distribution, suggesting a smooth stress transition from the sidewalls to the invert and a more uniform stress state across the entire cross-section. Conversely, the micro-bench method displays the maximum stress differential. The contours are densely clustered in the sidewall regions, and the stress decreases rapidly along the radial direction, reflecting a highly non-uniform and polarized stress distribution within the surrounding rock. Conversely, the micro-bench method displays the maximum stress differential. The contours are densely clustered in the sidewall regions, and the stress decreases rapidly along the radial direction, reflecting a highly non-uniform and polarized stress distribution within the surrounding rock. For the three-bench method, the stress at the invert is the lowest among the three scenarios, with a minimum principal stress of 1.01 MPa near the sidewalls and the invert. The contours are densely packed in this region, highlighting a precipitous stress drop. In contrast, the reserved core soil method maintains a relatively higher stress level at the invert, where the minimum principal stress reaches 4.27 MPa, compared with 1.14 MPa for the micro-bench method. Coupled with its lowest peak stress, this method exhibits minimal variation in the circumferential stress distribution, thereby achieving the optimal overall stress state.
These differences primarily arise from variations in excavation staging and timing of support installation. In the micro-bench method, the bench length is approximately 4 m, and the unloading interval between the upper and lower benches is short. Consequently, the two successive excavation disturbances superimpose in the sidewall region, leading to elevated peak stress and concentrated stress transition. The three-bench method divides excavation into three stages, reducing the peak stress to some extent. However, the total bench length is greater, and the closure of the invert is delayed, allowing sufficient stress release at the invert without timely confinement, which results in a pronounced stress drop in this area. In the reserved core soil method, the retained core soil restricts radial deformation of the surrounding rock, promoting progressive stress redistribution during unloading. As a result, the peak stress is lower, and the circumferential stress transition along the cross-section is more gradual.
Tunnel convergence directly reflects the mechanical response of the surrounding rock following excavation-induced unloading. Both its magnitude and spatial distribution comprehensively characterize the extent and intensity of disturbance imposed by different excavation methods.
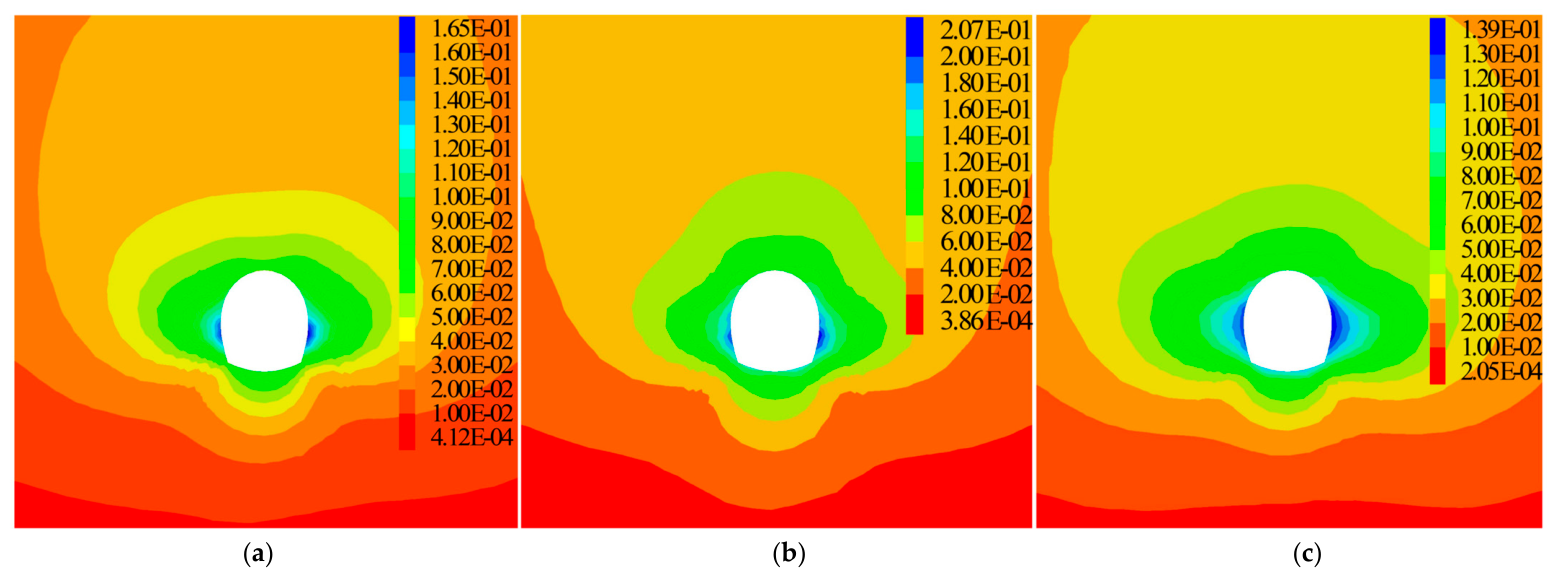
Figure 10 presents the instantaneous displacement contours for each method upon the completion of excavation and support installation.
The displacement characteristics of the micro-bench method are shown in
Figure 10a. Displacement decreases progressively from the tunnel boundary toward the interior rock mass. The maximum displacement, reaching 165.41 mm, occurs at the interface between the upper and lower benches along the sidewall. In this region, the contours are densely clustered, indicating a steep displacement gradient and a pronounced tendency for localized deformation. The three-bench method, as shown in
Figure 10b, exhibits a displacement distribution pattern similar to that of the micro-bench method, yet it generates a considerably broader disturbance footprint. Its maximum displacement emerges near the middle bench on the sidewall and reaches 207.98 mm, which is the highest among all three scenarios.
Figure 10c shows that the reserved core soil method exhibits an asymmetric displacement pattern, with greater displacement along the right sidewall than the left. The maximum displacement is 139.40 mm, and deformation is more evenly distributed along the entire sidewall. The contours are relatively smooth and widely spaced, with no evident localized concentration.
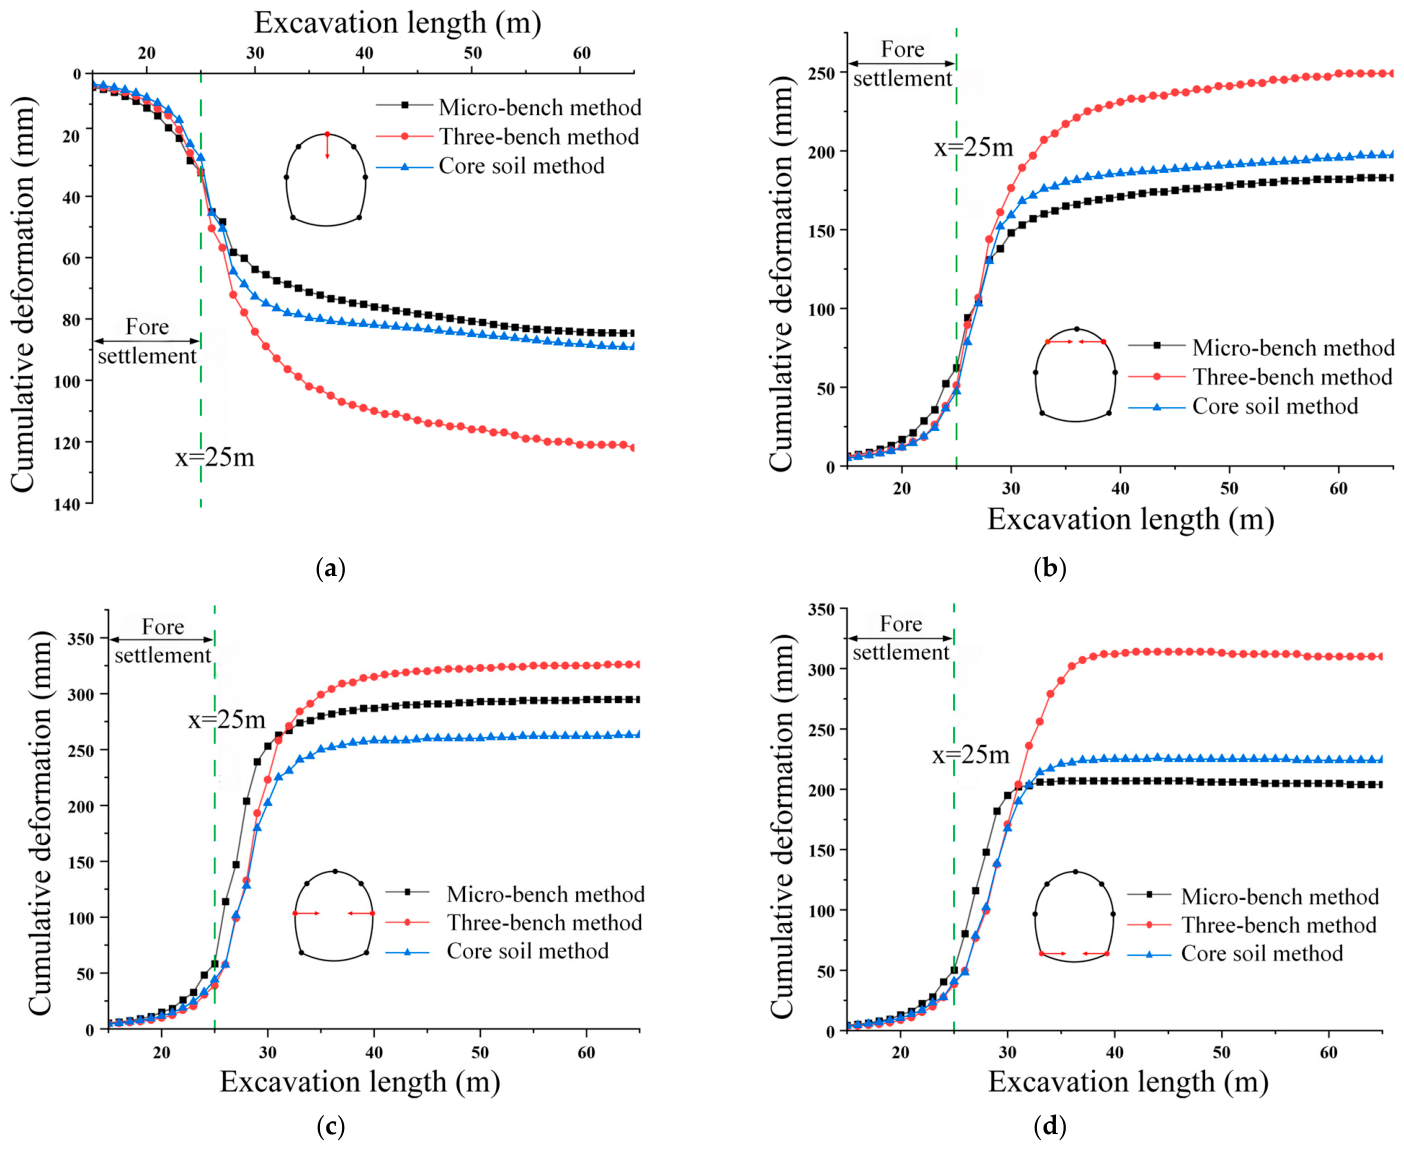
Figure 11 presents the cumulative deformation curves at the crown, shoulder, haunch, and springline for the three construction methods. Across all three methods, the cumulative deformation consistently exhibits an S-shaped growth pattern. The curves rise rapidly during the initial excavation phase and subsequently plateau following the closure of the primary support. The three-bench method produces the largest displacements at all monitoring points among the three methods, with the curves rising steeply during the excavation phase. Under the micro-bench method, the displacements at the crown, shoulder, and springline are the smallest; however, the haunch displacement reaches 295.4 mm, indicating a highly non-uniform spatial distribution of deformation across the tunnel periphery. In contrast, the reserved core soil method reduces the haunch displacement by 63.0 mm and 32.4 mm compared with the three-bench and micro-bench methods, respectively. Moreover, it exhibits the most uniform distribution of displacement among all monitoring points.
A comprehensive analysis of the above results indicates that the differences in displacement response among the three excavation methods are closely associated with the excavation sequence and the timing of support installation at the free surface. For the micro-bench method, unloading of the upper and lower benches overlaps at their interface, leading to displacement concentration in this region and a steep displacement gradient. Consequently, deformation at the haunch becomes particularly pronounced. In contrast, the three-bench method features the maximum total bench length, which substantially delays the closure of the support ring. Consequently, the deformation magnitudes at all monitoring points remain persistently high, yielding a disturbance footprint and overall magnitude that significantly exceed those of the other two methods. Regarding the reserved core soil method, the staggered excavation and sequential support of the left and right sidewalls allow the deformation to be smoothly dispersed across the entire sidewall. This method achieves the lowest maximum displacement and the gentlest displacement gradient among the three scenarios, ultimately maintaining an overall rock mass deformation state that is vastly superior to both the micro-bench and three-bench methods.
4.3. Distribution Characteristics of the Plastic Zone
The plastic zone serves as a direct indicator of the degree of damage in the surrounding rock. Variations in construction methods inherently dictate differing excavation unloading paths and timings of support, inevitably leading to discrepancies in the spatial extent, failure modes, and stability convergence of the plastic zone. Analyzing these discrepancies provides a rigorous basis for assessing the intensity of construction-induced disturbance.
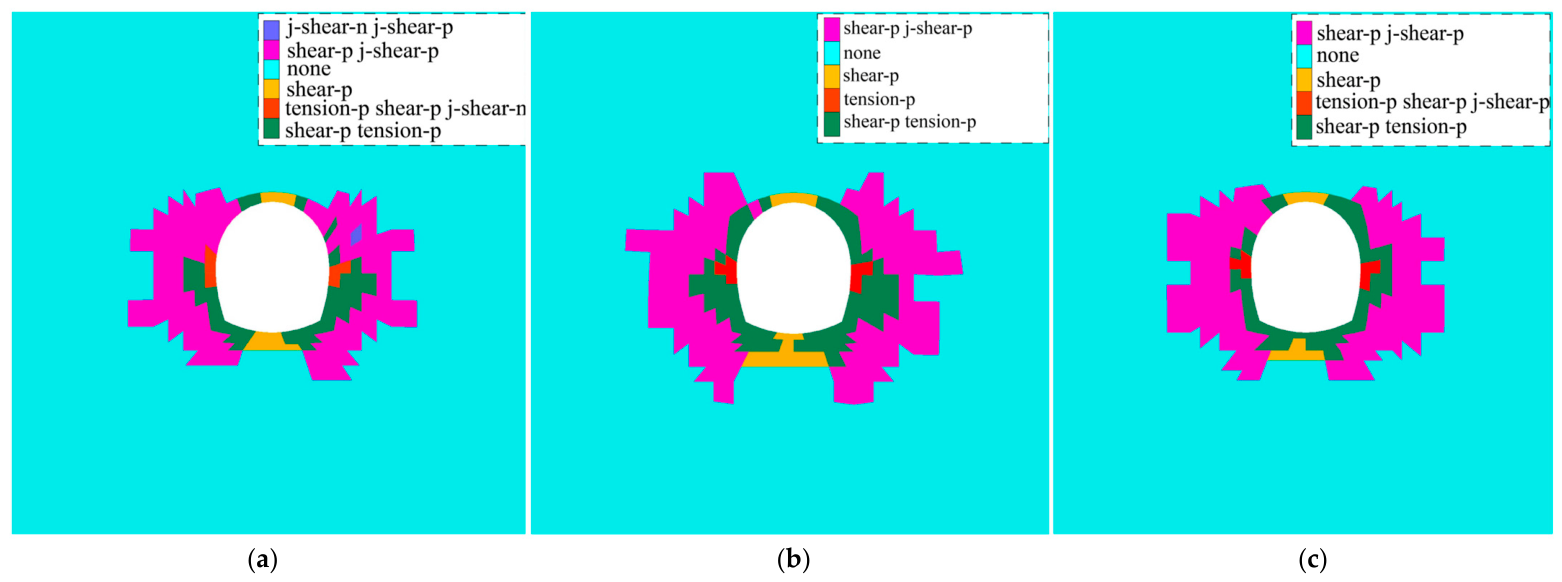
Figure 12 illustrates the distribution of the plastic zone at the cross-section located at x = 25 m for the three excavation methods following numerical simulation.
For all three methods, the plastic zones are generally symmetric about the tunnel centerline and are primarily concentrated at the invert and sidewalls. Owing to the advance support provided by the Φ60 pipe roof, the extent of the plastic zone at the crown is notably smaller than that at the sidewalls and invert, being governed primarily by the shear failure of the rock mass. The sidewalls constitute the primary regions of the plastic zone, dominated by the tensile failure of the rock matrix and the shear failure along joints, thereby posing a severe risk of interlayer deformation and slip. For the micro-bench method, as shown in
Figure 12a, although the plastic zone area is the smallest among the three, the sidewall rock mass experiences shear slip along the bedding planes, accompanied by the shear yielding of the rock matrix. Under the convergence criterion adopted in this study (a maximum unbalanced force ratio below 1 × 10
−5), the plastic zone of the micro-bench method fails to converge even after 5000 computational steps. This non-convergence indicates that irreversible shear deformation continues to develop after support installation. Numerical non-convergence alone does not constitute direct proof of long-term physical instability; however, it is consistent with the sustained deformation observed in the field and therefore highlights a non-negligible risk of long-term instability [
34]. The three-bench method, as shown in
Figure 12b, generates the most extensive plastic zone, which propagates fully at the invert due to the delayed closure of the support ring. Conversely, the reserved core soil method, as shown in
Figure 12c, exhibits a plastic zone area comparable to that of the micro-bench method. However, the plastic elements at the sidewalls successfully converge within the required computational steps, driving the surrounding rock toward a fully stable state.
In conclusion, the response of the plastic zone to the excavation methods is primarily reflected in two critical aspects: spatial extent and stability. Specifically, the micro-bench method yields the minimum plastic zone area, yet its overall stability is compromised; the superposition of the dual unloading events forces the sidewall rock mass into a state of continuous geomechanical adjustment. The three-bench method suffers from the delayed closure of the invert, allowing the plastic zone to propagate fully, thereby generating both the maximum plastic area and the largest disturbance footprint. In contrast, the reserved core soil method utilizes the core earth to effectively restrain the radial deformation of the surrounding rock. Consequently, it maintains a plastic zone area comparable to that of the micro-bench method, while enabling the rock mass to successfully transition into a stabilized state following support installation. Ultimately, this method strikes the optimal balance between minimizing the plastic zone extent and ensuring long-term stability.
4.4. Comprehensive Applicability Evaluation of the Construction Methods
For a more quantitative comparison of the construction organization, the micro-bench method adopts a bench length of approximately 4 m with an excavation advance of 2 m per cycle, and the short interval between the upper and lower benches allows the earliest closure of the support ring, with a final stress release ratio of 48.25%. The three-bench method, with the largest total bench length, delays the closure of the invert the most, permitting the largest stress release (final stress release ratio of 54.15%) and the most extensive plastic zone. The reserved core soil method excavates the top arch and the two side walls ahead of the retained core (4 m × 4 m) with an advance of 2 m per cycle, and the staggered excavation with timely support allows a rapid closure of the support ring, yielding the lowest stress release ratio (41.46%) among the three methods.
In summary, the comparative results across the three critical indicators—stress, displacement, and plastic zone—can be fundamentally attributed to discrepancies in the excavation sequences and timings of support installation. For the micro-bench method, the short bench length and the small unloading interval between the upper and lower benches lead to superposition of excavation-induced disturbances at the sidewalls. This results in pronounced stress concentration, steep displacement gradients, and difficulty in achieving convergence of plastic elements in this region. The three-bench method features the maximum total bench length and the most delayed closure of the support ring. Although it slightly reduces the peak stress, the prolonged exposure of the invert exacerbates both the stress drop and the propagation of the plastic zone, rendering it the most severely disturbed scenario among the three methods. Conversely, the reserved core soil method effectively restrains the post-excavation radial deformation by retaining the central core, enabling progressive unloading and timely support. Consequently, it outperforms the alternative methods in terms of stress, displacement, and plastic zone. Specifically, its peak stress is reduced by 4.9% compared with the micro-bench method. The maximum sidewall displacement is diminished by 15.7% and 33.0% relative to the micro-bench and three-bench methods, respectively. Furthermore, it maintains a restricted plastic zone extent comparable with that of the micro-bench method, while successfully guiding the surrounding rock into a fully stabilized state. Therefore, the reserved core soil method is highly recommended as the optimal excavation Scenario under the subvertical bedding condition (89°) for the large-deformation sections of this soft rock tunnel, and, given the reconversion cost for an existing tunnel, it should be adopted at least in the sections with the greatest large-deformation risk.
5. Optimization of Rock Bolt Length and Analysis of Differentiated Support
As established in
Section 3.2, the plastic zone at the sidewalls extends to a depth of approximately 7.5 m. Consequently, the anchorage section of the originally designed 4 m-long rock bolts is situated entirely within the plastic loosening zone, yielding a highly limited confining effect on the surrounding rock deformation. Given that the large-deformation sections of this tunnel are predominantly characterized by the subvertically bedded rock mass, this section first focuses on this dominant geological scenario. Comparative numerical simulations of various rock bolt length Scenarios are conducted to determine the optimal length, aiming to strike a balance between deformation control efficacy and economic feasibility. Furthermore, for the alternative scenario involving bedding-induced asymmetric loading, the plastic zone exhibits a highly asymmetric distribution with concentrated vulnerable regions. Therefore, the support strategy requires further targeted adjustments based on these localized characteristics. It is imperative to clarify that, although the reserved core soil method was previously identified as the superior technique for deformation control, the micro-bench method had already been designated during the construction drawing design phase. Modifying the excavation method at this stage would entail extensive equipment reallocation and severe schedule disruptions, thereby incurring prohibitive economic costs. Thus, the micro-bench method is retained for actual field construction. To accommodate both theoretical optimization and practical engineering reference, this section conducts a parallel analysis of both excavation methods.
5.1. Optimization of Rock Bolt Length
As indicated by the plastic zone and displacement contours under the subvertically bedded rock mass scenario, severe deformation predominantly concentrates at the sidewalls, whereas crown settlement remains relatively minor. Therefore, the subsequent analysis primarily focuses on optimizing the length of the sidewall rock bolts. The lengths are within the range recommended for rock-bolt support in weak rock masses by GB 50086-2015 [
34]. Four rock bolt length Scenarios (4 m, 6 m, 8 m, and 10 m) were designed for both the micro-bench method and the reserved core soil method. A uniform prestress of 60 kN was applied across all scenarios to systematically compare the influence of bolt length on rock mass deformation and the plastic zone. The optimization criterion was defined as follows: under a fixed bolt spacing (1.2 m × 1.2 m) and a uniform prestress of 60 kN, the optimal bolt length is the one at which the deformation-control benefit begins to diminish (the threshold effect) while remaining economically acceptable. The detailed rock bolt support Scenarios are summarized in
Table 6.
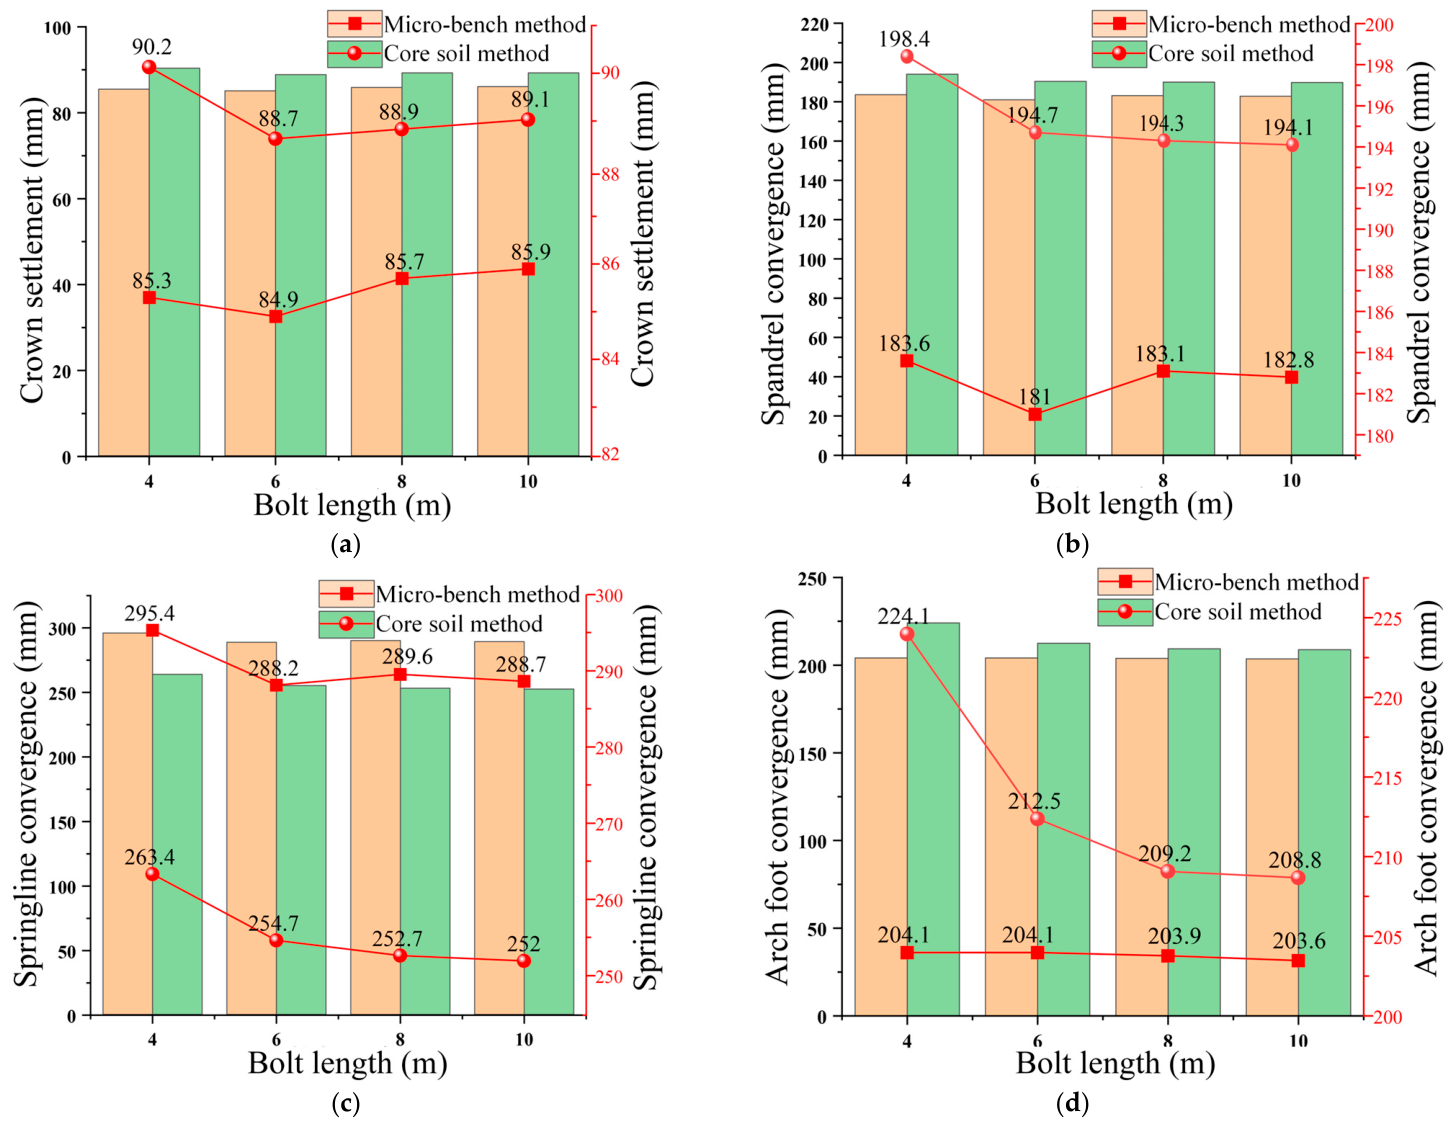
The final stabilized values of cumulative displacements at each monitoring point were extracted for comparison, as shown in
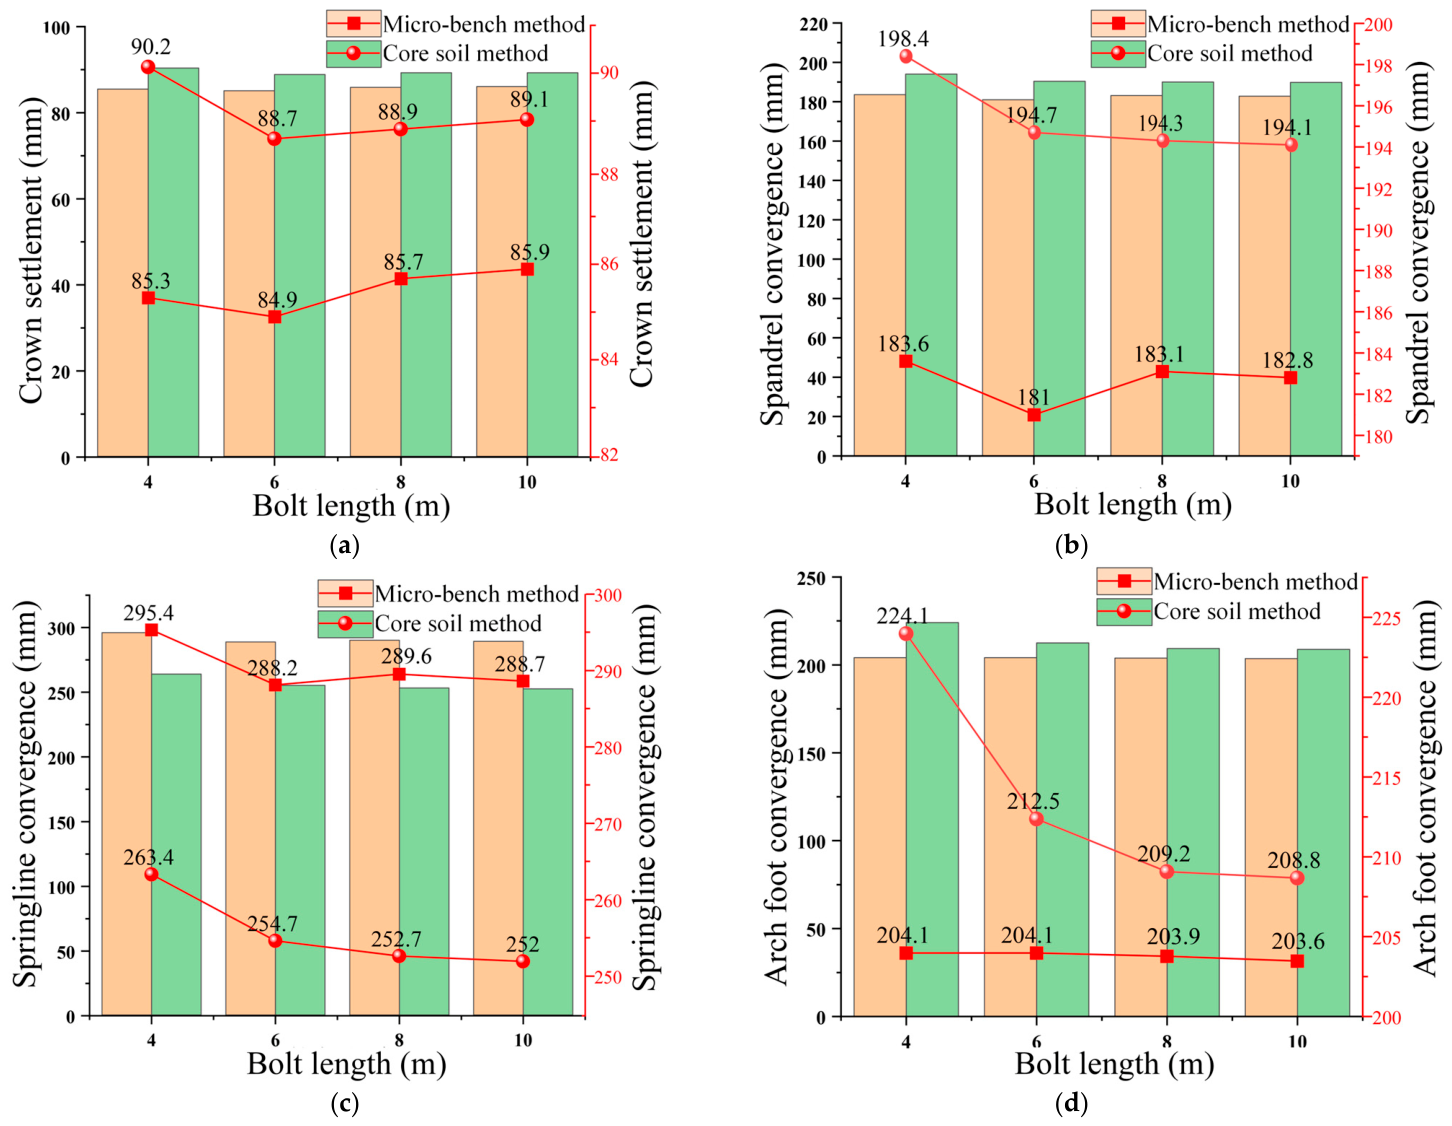
Figure 13. The results indicate a non-linear relationship between the tunnel convergence and the bolt length, suggesting a distinct threshold effect in the deformation control capacity of the bolts. Under the micro-bench method, as the bolt length increases from 4 m to 6 m, the deformations at the crown, shoulder, and haunch are reduced by 0.47%, 1.42%, and 2.44%, respectively, compared with the 4 m Scenario. However, as the length is further extended to 8 m and 10 m, the deformations at these three locations paradoxically rebound by 0.8 mm, 2.1 mm, and 1.4 mm, respectively. Taking both deformation control and economic efficiency into consideration, the 6 m Scenario emerges as the best balance point among the four tested Scenarios. Specifically, the haunch convergence is reduced by 2.44% relative to the 4 m bolts, while the total cost per bolt is reduced by 25% compared to the 8 m bolts.
Under the reserved core soil method, increasing the bolt length from 4 m to 6 m decreases the displacements at the four monitoring points by 1.5 mm, 3.7 mm, 8.7 mm, and 11.6 mm, respectively. Both the magnitude of reduction and the absolute displacement values are greater than those observed under the micro-bench method. The three-dimensional confinement provided by the retained core delays stress release, thereby allowing the bolt length effect to be more effectively mobilized. Unlike the micro-bench method, where deformation rebounds once the bolt length exceeds 6 m, the reserved core soil method continues to exhibit a positive control effect when the bolt length increases to 8 m. Nevertheless, increasing the bolt length from 6 m to 8 m raises the cost by approximately 33%, while the additional reduction in deformation is marginal. The cost comparison is based on the proportional steel consumption of the bolts, assuming that the cost is proportional to the bolt length, while installation and grouting costs are not considered. Therefore, the economic inflection point lies between 6 m and 8 m.
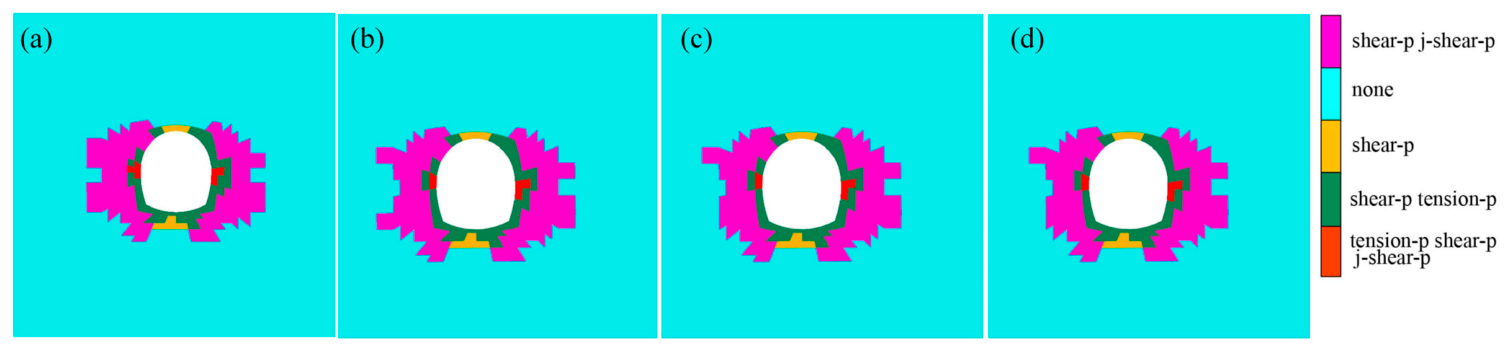
Figure 14 and
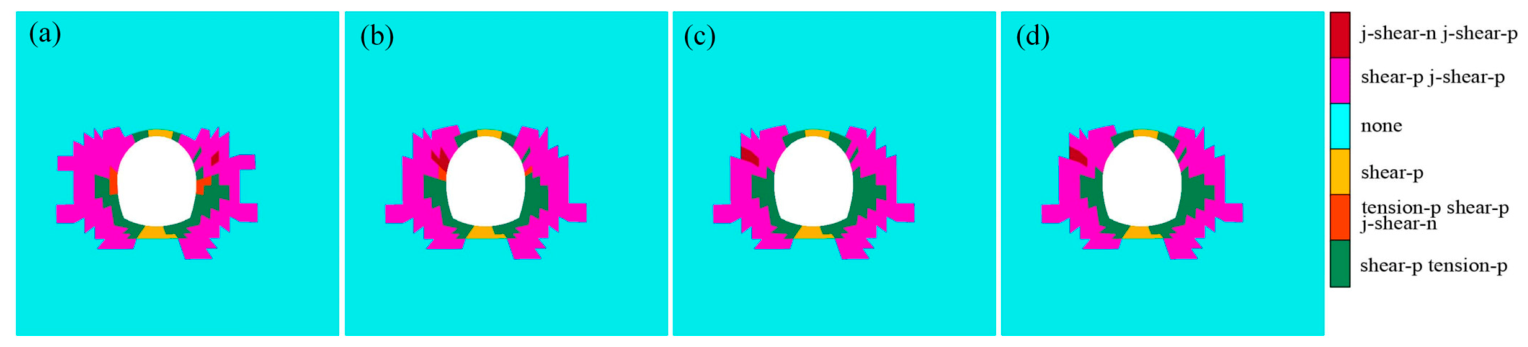
Figure 15 present the plastic zone distributions corresponding to varying bolt lengths under the two construction methods, respectively. As shown in
Figure 14, under the micro-bench method, increasing the bolt length from 4 m to 6 m results in a significant reduction in the plastic zone extent at the sidewalls. However, beyond 6 m, further increases in bolt length produce no appreciable change in the plastic zone.
Figure 15 indicates that under the reserved core soil method, the plastic zone extent decreases progressively when the bolt length increases from 4 m to 6 m. At 8 m, only a localized reduction is observed near the left springline, and the plastic zone remains essentially stable once the bolt length exceeds 8 m. The evolution of the plastic zone is consistent with the threshold behavior revealed by the displacement curves. Once the bolt length exceeds 6 m, the reduction in plastic zone extent becomes gradual, and the marginal benefit of increasing bolt length for deformation control diminishes.
These results demonstrate that the deformation control efficacy does not exhibit a positive linear correlation with the bolt length. When the bolts are too short, the anchorage section remains within the plastic loosening zone, preventing the formation of effective anchorage forces. Conversely, when the bolts are excessively long, shear stress transferred to the distal anchorage zone decreases with depth, while the axial stiffness decreases with increasing length, resulting in reduced support stiffness. Moreover, a neutral point may develop along the bolt length, characterized by a reversal of shear stress in the mid-section of the bolt. The zone of elevated stress shifts toward the tunnel wall, potentially exacerbating the interlayer shear slip [
27]. Driven by the synergistic effects of these mechanisms, a distinct threshold exists for the bolt length, beyond which the marginal gain in support efficacy continuously diminishes. These mechanisms are consistently reflected in the numerical results: the haunch convergence rebounds or plateaus once the bolt length exceeds 6 m (
Figure 13), and the plastic zone extent at the sidewalls no longer changes appreciably beyond 6 m (
Figure 14 and
Figure 15), which numerical.
To balance deformation control and economic efficiency, a 6 m bolt length is recommended as the best-performing Scenario among the tested values (4, 6, 8, and 10 m) for both excavation methods. Specifically, the micro-bench method yields a haunch convergence of 288.2 mm, achieving a 2.44% reduction compared to the 4 m Scenario. Meanwhile, the reserved core soil method restricts this convergence to 254.7 mm, representing a 4.40% decrease from the 4 m Scenario. Should stricter requirements be imposed on springline deformation, the reserved core soil method could consider extending the bolts near the springline to 8 m. Nevertheless, this decision must be carefully weighed against the 33% cost increment in exchange for only marginal improvements in deformation.
5.2. Differentiated Reinforcement Strategies Under Asymmetric Loading Conditions
As demonstrated in
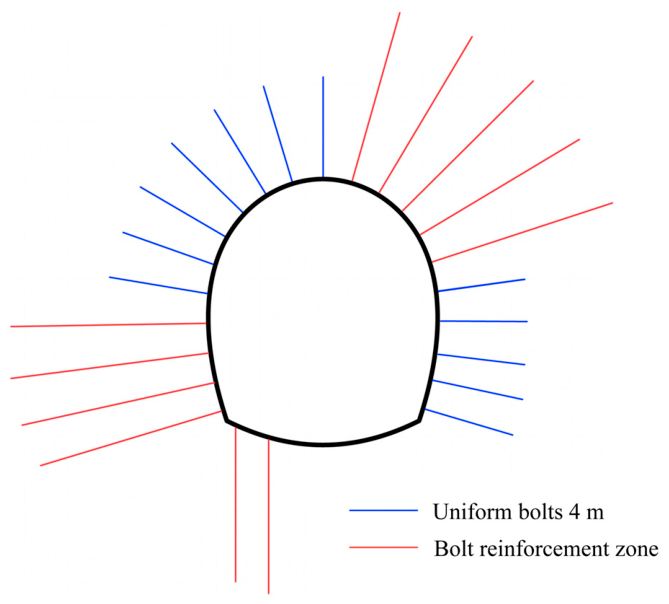
Section 3.2, under bedding-induced asymmetric loading (dip angle of 54°), the plastic zone is highly concentrated at the right shoulder and left springline, exhibiting a distinct skew-symmetric pattern. Consequently, the rock mass deformation in these specific vulnerable regions significantly exceeds that in other areas. In light of this asymmetric deformation behavior, this section proposes two comparative reinforcement Scenarios: Scenario 1 adopts a conventional symmetric reinforcement approach, utilizing equal-length rock bolts on both sidewalls; conversely, Scenario 2 implements targeted reinforcement specifically addressing the severely deformed right shoulder and left springline. To rigorously verify the applicability of the threshold effect (previously identified in
Section 5.1) under asymmetric loading conditions, both Scenarios are evaluated across three sets of bolt lengths: 6 m, 8 m, and 10 m. The detailed support parameters and bolt configurations are presented in
Table 7 and
Figure 16.
The displacement data at the monitoring points under each condition were extracted, as shown in
Figure 17. The variation of displacement with bolt length exhibits a clear threshold behavior. The most substantial reduction in deformation occurs when the bolt length is increased from 4 m to 6 m. Within this interval, the springline displacement in Scenario 2 decreases by 13.71 mm (a reduction of 6.35%), whereas the corresponding reduction in Scenario 1 is only 8.85 mm. As the bolt length is further extended from 6 m to 8 m, the magnitude of reduction diminishes sharply, with the springline displacement in the two Scenarios decreasing by a mere 0.71 mm and 0.64 mm, respectively. Beyond 8 m (up to 10 m), the deformations at all locations essentially plateau. Consequently, an inflection point emerges on the deformation curves at the 6 m mark. This observation is highly consistent with the threshold behavior previously identified for the subvertically bedded rock mass in
Section 5.1. For the same bolt length, Scenario 2 outperforms Scenario 1 across all evaluated indicators. At a bolt length of 6 m, Scenario 2 reduces springline displacement by 4.86 mm and shoulder displacement by 2.91 mm compared with Scenario 1.
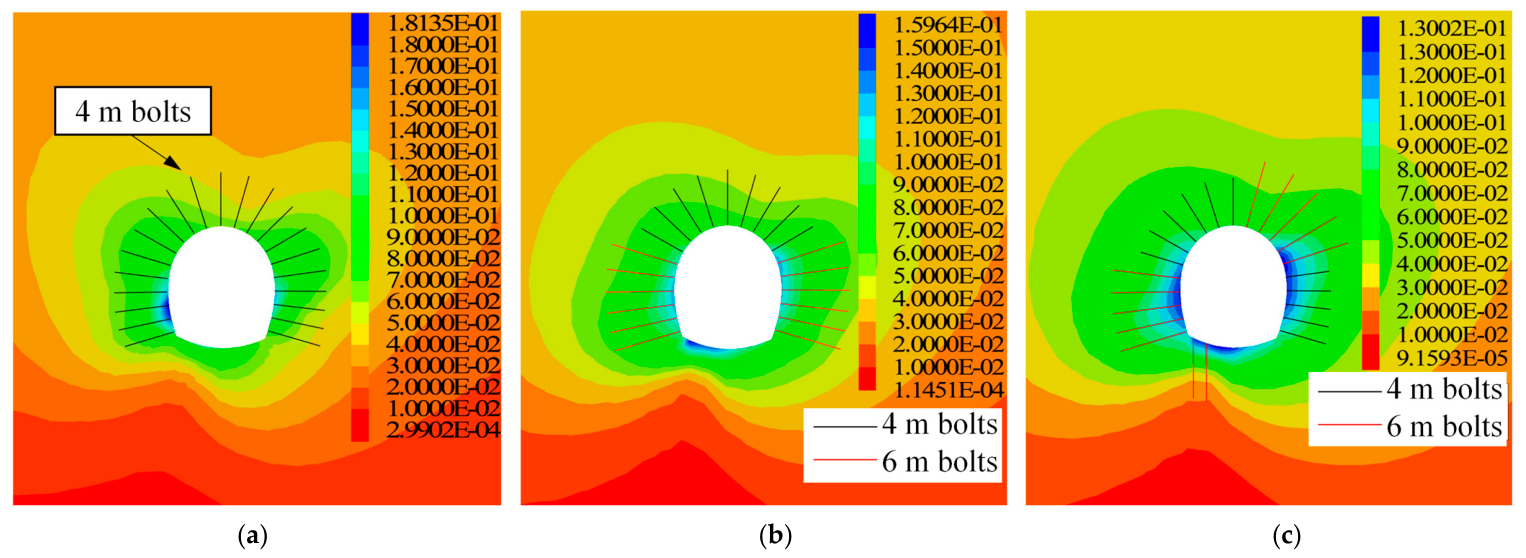
Figure 18 presents the tunnel convergence contours for different bolt Scenarios, providing spatial verification of the trends identified above. Under the baseline construction Scenario, the peripheral deformation exhibits a pronounced asymmetric pattern. The displacements are highly concentrated at the left springline and right shoulder, with the maximum displacement reaching 181.3 mm. Scenario 1, which entails a uniform densification of rock bolts across the entire cross-section, reduces the maximum displacement to 159.8 mm. However, the asymmetric distribution pattern is not fundamentally altered, and deformation remains concentrated near the left springline. Conversely, Scenario 2 implements targeted reinforcement specifically at the left springline and right shoulder—where the plastic zone propagates the deepest—while retaining the originally designed bolt lengths in the more stable regions. Consequently, the maximum displacement is reduced to 130 mm, representing a significant reduction of 18.8% and 28.3% compared to Scenario 1 and the baseline Scenario, respectively. Furthermore, the distribution of peripheral deformation becomes substantially more uniform. These comparisons demonstrate that, at the same bolt density and with the original bolt lengths retained in the stable zones, a differentiated configuration that only elongates the bolts in the vulnerable zones is notably more effective at mitigating asymmetric deformation than uniform densification under the investigated asymmetric bedding condition. By precisely allocating the support resistance to the vulnerable regions, Scenario 2 successfully avoids the economic waste associated with installing excessively long bolts in the stable zones.
In summary, under bedding-induced asymmetric loading, the threshold effect of bolt length remains valid, with 6 m continuing to represent the inflection point for deformation control efficiency. However, uniformly elongating the sidewall bolts yields only marginal improvements in the asymmetric deformation. This approach results in excessively long bolts on the stable side while providing inadequate anchorage depth on the vulnerable side, causing the deformation to remain persistently concentrated near the left springline. Conversely, Scenario 2 implements targeted reinforcement specifically at the left springline and right shoulder. In this configuration, the anchorage sections successfully penetrate the deepest plastic loosening zones in these vulnerable regions and embed themselves firmly into the stable rock mass. Given a comparable total consumption of rock bolts, the maximum displacement under Scenario 2 is reduced by 18.8% and 28.3% compared to Scenario 1 and the baseline construction Scenario, respectively. Therefore, for rock masses subjected to bedding-induced asymmetric loading, rock bolt design should not only satisfy the critical anchorage length associated with the threshold effect, but also adopt a differentiated bolt-length configuration targeting vulnerable zones governed by bedding orientation, so as to achieve an optimal support layout.
6. Conclusions
Combining field monitoring, theoretical analysis, and FLAC3D numerical simulation, this study investigated the large-deformation mechanism and control strategies of layered soft rock tunnels, with a carbonaceous slate section of a railway tunnel on the Western Sichuan Plateau as a case study. The main conclusions are as follows:
(1) The FLAC3D ubiquitous-joint model showed that the bedding dip angle governs the failure mode: under subvertical bedding (89°), the plastic zone was symmetric along the bedding-plane normal and flexural failure dominated the sidewalls. Under asymmetric bedding-induced loading, in contrast, the plastic zone concentrated at the left springline and right shoulder, producing an asymmetric composite failure mode of shallow flexural–tensile cracking with deep-seated interlayer shear; both deformation magnitude and asymmetry exceeded those under subvertical bedding. Notably, the 54° and 89° cases are the two characteristic orientations of the study section rather than the full range of possible dips; the failure modes, deformation magnitudes, and relative performance of the excavation methods at intermediate dip angles warrant further investigation.
(2) Under the subvertical bedding condition (89°), the reserved core soil method was identified as the optimal excavation method among the three Scenarios. It reduced the maximum tunnel convergence by 15.7% and 33.0% relative to the micro-bench and three-bench methods, respectively, and the peak maximum principal stress by 4.9% relative to the micro-bench method, while its plastic zone converged numerically. The micro-bench method showed continuous shear slip along the bedding planes at the sidewalls and a non-converged plastic zone; the three-bench method, owing to delayed closure of the invert, produced the largest disturbance footprint and the highest deformation.
(3) Rock bolt length exhibited a threshold effect: the deformation reduction was largest from 4 m to 6 m, and further lengthening added little. This threshold accords with the neutral-point theory of fully grouted rock bolts [
26,
27,
28] and experimental observations of prestressed anchorage [
29,
30]: the decreasing axial stiffness of longer bolts, the attenuation of distal shear stress with depth, and the neutral-point effect. A 6 m bolt length is recommended as the best-performing Scenario among the tested values (4, 6, 8, and 10 m) for the investigated geological and support conditions.
(4) Under asymmetric loading conditions, uniformly elongating the rock bolts yielded only marginal benefit. Targeted reinforcement of the vulnerable left springline and right shoulder, by contrast, reduced the maximum displacement by 18.8% and 28.3% relative to the uniform Scenario and the baseline construction Scenario, respectively. Bolt design should therefore satisfy the critical length threshold and adopt a bedding-orientation-dependent length allocation. However, the vulnerable zones depend on the relative orientation between the bedding planes and the tunnel axis, the in-situ stress field, and the excavation Scenario; consequently, the targeted zones and the bolt allocation should be re-evaluated when the strategy is applied to tunnels with different geological conditions.
Finally, the numerical framework adopted here does not include a time-dependent (creep) constitutive model; the simulated displacements thus represent the final deformation state, and the tunnel’s long-term stability should be assessed through sustained field monitoring.
Author Contributions
Conceptualization, R.G. and B.L.; methodology, R.G. and J.L.; software, J.L. and T.Y.; validation, Z.S.; formal analysis, data curation and visualization, R.G. and Z.S.; writing—original draft preparation, R.G.; writing—review and editing, R.G., J.L., T.Y. and B.L. All authors have read and agreed to the published version of the manuscript.
Funding
This research was funded by the National Natural Science Foundation of China, grant number 52474150. The APC was funded by the authors.
Institutional Review Board Statement
Not applicable.
Informed Consent Statement
Not applicable.
Data Availability Statement
All original contributions of this research are contained in the paper. Readers with additional questions may contact the corresponding author.
Conflicts of Interest
All authors of this manuscript (Ruiqi Guo, Junqi Lai, Tianzhu Ye, Zhiqiang Sun, Biao Li) declare that there are no conflicts of interest to disclose. Zhiqiang Sun is affiliated with Sinohydro Bureau 7 Co., Ltd., Chengdu, China. The company did not provide research funding, and had no participation or interference in the research, paper writing and submission. There are no competing interests affecting the research conclusions.
References
- Tian, S.M.; Wang, W.; Tang, G.R.; Li, X. Study on countermeasures for major unfavorable geological issues of tunnels on Sichuan-Tibet Railway. Tunn. Constr. 2021, 41, 697–712. (In Chinese) [Google Scholar]
- Xue, Y.G.; Kong, F.M.; Yang, W.M.; Qiu, D.H.; Su, M.X.; Fu, K.; Ma, X.M. Main unfavorable geological conditions and engineering geological problems along Sichuan-Tibet Railway. Chin. J. Rock Mech. Eng. 2020, 39, 445–468. (In Chinese) [Google Scholar]
- Cui, P.; Ge, Y.; Li, S.; Li, Z.; Xu, X.; Zhou, G.G.; Chen, H.; Wang, H.; Lei, Y.; Zhou, L.; et al. Scientific challenges in disaster risk reduction for the Sichuan-Tibet Railway. Eng. Geol. 2022, 309, 106837. [Google Scholar] [CrossRef] [Scilit]
- Zhu, Y.; Wang, X.; Liu, B.; Liu, X.; Xue, H. Effects of foliation angle on mechanical characteristics of carbonaceous slate using uniaxial compression tests. J. Rock Mech. Geotech. Eng. 2025, 17, 2091–2108. [Google Scholar] [CrossRef] [Scilit]
- Xu, G.; He, C.; Su, A.; Chen, Z. Experimental investigation of the anisotropic mechanical behavior of phyllite under triaxial compression. Int. J. Rock Mech. Min. Sci. 2018, 104, 100–112. [Google Scholar] [CrossRef] [Scilit]
- Liu, X.; Pan, P.Z.; Zhou, Y.; Wang, Z.; Xu, D. Role of foliation occurrence and stress orientation on asymmetric failure in foliated rock tunnel: Insight from numerical simulation. Eng. Fail. Anal. 2024, 160, 108174. [Google Scholar] [CrossRef] [Scilit]
- Sun, X.; Qi, Z.; Miao, C.; Wang, J.; Zhang, J.; Jiang, M. Research on the large deformation mechanism and control measures of a layered soft rock tunnel. Bull. Eng. Geol. Environ. 2023, 82, 444. [Google Scholar] [CrossRef] [Scilit]
- Zhou, Y.; Lai, H.; Liu, Y.; Hong, Q.; Li, Z. Analysis and treatments of primary support failure in large-span tunnel under a soft-hard interbedded surrounding rock mass. Eng. Fail. Anal. 2024, 156, 107755. [Google Scholar] [CrossRef] [Scilit]
- Xu, G.; He, C.; Wang, J.; Zhang, J. Study on the damage evolution of secondary tunnel lining in layered rock stratum. Bull. Eng. Geol. Environ. 2020, 79, 3533–3557. [Google Scholar] [CrossRef] [Scilit]
- Sun, X.; Zhao, C.; Tao, Z.; Kang, H.; He, M. Failure mechanism and control technology of large deformation for Muzhailing Tunnel in stratified rock masses. Bull. Eng. Geol. Environ. 2021, 80, 4731–4750. [Google Scholar] [CrossRef] [Scilit]
- Huang, C.; Li, S.; Li, G.; Yao, T.; Wu, X. Reform of deformation control technology for railway tunnels with squeezing surrounding rock: Case study of the new and existing Wushaoling tunnels in China. Front. Earth Sci. 2024, 12, 1438425. [Google Scholar] [CrossRef] [Scilit]
- Hu, Z.; Wu, B.; Xu, N.; Wang, K. Effects of discontinuities on stress redistribution and rock failure: A case of underground caverns. Tunn. Undergr. Space Technol. 2022, 127, 104583. [Google Scholar] [CrossRef] [Scilit]
- Shen, F.; Song, Y.; Zhao, W.; Wang, J.; Zheng, J.; Shao, Z. Experimental study on deformation failure mechanism of surrounding rocks for the deep-buried twin tunnels in inclined layered strata during the excavation. Rock Mech. Rock Eng. 2023, 56, 2311–2331. [Google Scholar] [CrossRef] [Scilit]
- Chen, Z.; Yao, Y.; Wang, B.; Xie, Q.; Zhou, Z.; Jiang, C. Stability analysis and failure mechanism of multiple parallel soft-rock tunnels considering the random distribution of rockmass joints. Eng. Fail. Anal. 2024, 159, 108150. [Google Scholar] [CrossRef] [Scilit]
- Aydan, O.; Akagi, T.; Kawamoto, T. The squeezing potential of rocks around tunnels: Theory and prediction. Rock Mech. Rock Eng. 1993, 26, 137–163. [Google Scholar] [CrossRef] [Scilit]
- Hoek, E.; Marinos, P. Predicting tunnel squeezing problems in weak heterogeneous rock masses. Tunn. Tunn. Int. 2000, 32, 45–51. [Google Scholar]
- Si, X.; Li, X.; Gong, F.; Huang, L.; Ma, C. Experimental investigation on rockburst process and characteristics of a circular opening in layered rock under three-dimensional stress conditions. Tunn. Undergr. Space Technol. 2022, 127, 104603. [Google Scholar] [CrossRef] [Scilit]
- Lu, S.; Sun, Z.; Zhang, D.; Liu, C.; Wang, J.; Huangfu, N. Numerical modelling and field observations on the failure mechanisms of deep tunnels in layered surrounding rock. Eng. Fail. Anal. 2023, 153, 107598. [Google Scholar] [CrossRef] [Scilit]
- Tian, H.; Chen, W.; Tan, X.; Tian, Y.; Xu, Z. Quantitative analysis of the influence of bedding planes on the deformation of layered carbonaceous slate around tunnel. Bull. Eng. Geol. Environ. 2023, 82, 10. [Google Scholar] [CrossRef] [Scilit]
- Zhou, Y.Y.; Xu, D.P.; Liu, K.; Chen, D.-F. Understanding the failure mechanism of a large underground cavern in steeply dipping layered rock mass using an enhanced ubiquitous-joint model. Bull. Eng. Geol. Environ. 2021, 80, 4621–4638. [Google Scholar] [CrossRef] [Scilit]
- Sun, Z.; Zhang, D.; Fang, Q.; Liu, D.; Dui, G. Displacement process analysis of deep tunnels with grouted rockbolts considering bolt installation time and bolt length. Comput. Geotech. 2021, 140, 104437. [Google Scholar] [CrossRef] [Scilit]
- Luo, Y.; Shi, Z.; Wang, C.; Chen, J.; Liu, W.; Li, Y.; Wu, Y. Mechanical properties of rock bolt and analysis for the full-process of sliding failure based on rock mass absolute displacement. J. Traffic Transp. Eng. (Engl. Ed.) 2022, 9, 490–506. [Google Scholar] [CrossRef] [Scilit]
- Yang, X.; Ming, W.; Zhang, W.; Zhu, C.; Mao, Y.; Wang, X.; He, M.; Tao, Z. Support on deformation failure of layered soft rock tunnel under asymmetric stress. Rock Mech. Rock Eng. 2022, 55, 7587–7609. [Google Scholar] [CrossRef] [Scilit]
- Zheng, C.; He, P.; Wang, G.; Jiang, F.; Xiao, Z.; Yan, Z.; Ma, Z. Simulation of bench stepping and optimization of bolt parameters based on multiple geological information fusion. J. Build. Eng. 2023, 79, 107941. [Google Scholar] [CrossRef] [Scilit]
- Liu, W.; Chen, J.; Chen, L.; Luo, Y.; Shang, Q.; Zhang, L.; Gao, S.; Jia, H. A rational construction method and deformation control system of tunnelling in extremely soft and fractured chlorite schist medium. Tunn. Undergr. Space Technol. 2024, 143, 105472. [Google Scholar] [CrossRef] [Scilit]
- Freeman, T.J. The behaviour of fully-bonded rock bolts in the Kielder experimental tunnel. Tunn. Tunn. 1978, 10, 37–40. [Google Scholar]
- Cai, Y.; Esaki, T.; Jiang, Y. An analytical model to predict axial load in grouted rock bolt for soft rock tunnelling. Tunn. Undergr. Space Technol. 2004, 19, 607–618. [Google Scholar] [CrossRef] [Scilit]
- Liu, Y.; Lu, A.; Zeng, X. A theoretical method of mechanical analysis for a circular tunnel reinforced by fully grouted rock bolts. Math. Mech. Solids 2022, 27, 1319–1335. [Google Scholar] [CrossRef] [Scilit]
- Yu, W.; Wang, B.; Zi, X.; Guo, X.; Wang, Z. Effect of prestressed anchorage system on mechanical behavior of squeezed soft rock in large-deformation tunnel. Tunn. Undergr. Space Technol. 2023, 131, 104782. [Google Scholar] [CrossRef] [Scilit]
- Yu, W.; Wang, B.; Liu, J.; Chen, L.; Zi, X. Mechanical properties of partially bonded rock anchors in squeezing large-deformation soft rock tunnels. Tunn. Undergr. Space Technol. 2024, 147, 105699. [Google Scholar] [CrossRef] [Scilit]
- TB 10204-2002; Code for Railway Tunnel Construction. China Railway Publishing House: Beijing, China, 2002.
- Jiang, H.P.; Jiang, A.N. Numerical analysis and application of Nishihara creep nonlinear damage model considering ubiquitous joints. Tunn. Undergr. Space Technol. 2024, 157, 106335. [Google Scholar] [CrossRef] [Scilit]
- Itasca Consulting Group, Inc. FLAC3D: Fast Lagrangian Analysis of Continua in Three Dimensions, Version 7.0, User’s Guide; Itasca Consulting Group, Inc.: Minneapolis, MN, USA, 2019. [Google Scholar]
- GB 50086-2015; Technical Code for Engineering of Ground Anchorages and Shotcrete Support. China Planning Press: Beijing, China, 2015.
Figure 1.
Exposure of carbonaceous slate (left) and deformation and failure of the sidewall support structure (right).
Figure 1.
Exposure of carbonaceous slate (left) and deformation and failure of the sidewall support structure (right).
Figure 2.
Numerical model for the micro-bench excavation method.
Figure 2.
Numerical model for the micro-bench excavation method.
Figure 3.
Plastic zone characteristics and failure mechanisms of the rock mass for the case with an 89° bedding dip angle and a 15° strike–tunnel axis angle: (a) Post-excavation distribution of the plastic zone. (b) Failure mechanisms of the rock mass.
Figure 3.
Plastic zone characteristics and failure mechanisms of the rock mass for the case with an 89° bedding dip angle and a 15° strike–tunnel axis angle: (a) Post-excavation distribution of the plastic zone. (b) Failure mechanisms of the rock mass.
Figure 4.
Plastic zone characteristics and failure mechanisms of the rock mass for the case with a 54° bedding dip angle and a 10° strike–tunnel axis angle: (a) Post-excavation distribution of the plastic zone. (b) Failure mechanisms of the rock mass.
Figure 4.
Plastic zone characteristics and failure mechanisms of the rock mass for the case with a 54° bedding dip angle and a 10° strike–tunnel axis angle: (a) Post-excavation distribution of the plastic zone. (b) Failure mechanisms of the rock mass.
Figure 5.
Layout of monitoring points.
Figure 5.
Layout of monitoring points.
Figure 6.
Comparison of the measured and simulated displacements for Case 1: (a) Time-dependent curves of crown settlement and sidewall convergence. (b) Displacement profile of the surrounding rock at cross-section x = 25 m.
Figure 6.
Comparison of the measured and simulated displacements for Case 1: (a) Time-dependent curves of crown settlement and sidewall convergence. (b) Displacement profile of the surrounding rock at cross-section x = 25 m.
Figure 7.
Comparison of the measured and simulated displacements for Case 2: (a) Time-dependent curves of crown settlement and sidewall convergence. (b) Displacement profile of the surrounding rock at cross-section x = 25 m.
Figure 7.
Comparison of the measured and simulated displacements for Case 2: (a) Time-dependent curves of crown settlement and sidewall convergence. (b) Displacement profile of the surrounding rock at cross-section x = 25 m.
Figure 8.
Numerical models of different excavation methods: (a) Three-bench method. (b) Reserved core soil method.
Figure 8.
Numerical models of different excavation methods: (a) Three-bench method. (b) Reserved core soil method.
Figure 9.
Contours of maximum principal stress: (a) Micro-bench method. (b) Three-bench method. (c) Reserved core soil method.
Figure 9.
Contours of maximum principal stress: (a) Micro-bench method. (b) Three-bench method. (c) Reserved core soil method.
Figure 10.
Contours of tunnel convergence: (a) Micro-bench method. (b) Three-bench method. (c) Reserved core soil method.
Figure 10.
Contours of tunnel convergence: (a) Micro-bench method. (b) Three-bench method. (c) Reserved core soil method.
Figure 11.
Cumulative displacement curves at monitoring points around the tunnel periphery: (a) Crown settlement. (b) Shoulder convergence. (c) Haunch convergence. (d) Springline convergence.
Figure 11.
Cumulative displacement curves at monitoring points around the tunnel periphery: (a) Crown settlement. (b) Shoulder convergence. (c) Haunch convergence. (d) Springline convergence.
Figure 12.
Distribution of the plastic zone: (a) Micro-bench method. (b) Three-bench method. (c) Reserved core soil method.
Figure 12.
Distribution of the plastic zone: (a) Micro-bench method. (b) Three-bench method. (c) Reserved core soil method.
Figure 13.
Comparison of displacements under different bolt lengths for two excavation methods: (a) Crown settlement. (b) Shoulder convergence. (c) Haunch convergence. (d) Springline convergence.
Figure 13.
Comparison of displacements under different bolt lengths for two excavation methods: (a) Crown settlement. (b) Shoulder convergence. (c) Haunch convergence. (d) Springline convergence.
Figure 14.
Plastic zone distribution under different bolt lengths for the micro-bench method: (a) 4 m; (b) 6 m; (c) 8 m; (d) 10 m.
Figure 14.
Plastic zone distribution under different bolt lengths for the micro-bench method: (a) 4 m; (b) 6 m; (c) 8 m; (d) 10 m.
Figure 15.
Plastic zone distribution under different bolt lengths for the reserved core soil method: (a) 4 m; (b) 6 m; (c) 8 m; (d) 10 m.
Figure 15.
Plastic zone distribution under different bolt lengths for the reserved core soil method: (a) 4 m; (b) 6 m; (c) 8 m; (d) 10 m.
Figure 16.
Schematic of the rock bolt layout for Scenario 2.
Figure 16.
Schematic of the rock bolt layout for Scenario 2.
Figure 17.
Tunnel convergence under different bolt lengths: (a) Crown settlement. (b) Shoulder convergence. (c) Haunch convergence. (d) Springline convergence.
Figure 17.
Tunnel convergence under different bolt lengths: (a) Crown settlement. (b) Shoulder convergence. (c) Haunch convergence. (d) Springline convergence.
Figure 18.
Tunnel convergence contours under different bolt Scenarios: (a) Micro-bench method (4 m uniform bolts). (b) Scenario 1. (c) Scenario 2.
Figure 18.
Tunnel convergence contours under different bolt Scenarios: (a) Micro-bench method (4 m uniform bolts). (b) Scenario 1. (c) Scenario 2.
Table 1.
Classification of large deformation (squeezing) in the surrounding rock [
31].
Table 1.
Classification of large deformation (squeezing) in the surrounding rock [
31].
| Deformation Class | Strength-to-Stress Ratio (Rb/σmax) | Relative Displacement η (%) |
|---|
| I (slight) | 0.25~0.5 | 3~5 |
| II (moderate) | 0.15~0.25 | 5~8 |
| III (severe) | <0.15 | >8 |
Table 2.
Mechanical parameters of the rock mass.
Table 2.
Mechanical parameters of the rock mass.
| Type | Deformation Modulus (GPa) | Unit Weight (kN/m3) | Cohesion (MPa) | Internal Friction Angle (°) | Poisson’s Ratio (μ) |
|---|
| Rock mass | 0.8 | 24 | 0.5 | 45 | 0.35 |
| Bedding plane | — | — | 0.05 | 15 | — |
Table 3.
Support parameters of the lining system.
Table 3.
Support parameters of the lining system.
| | Material | Location | Thickness (cm) | Length (m) | Spacing (m) (Circumferential × Longitudinal) |
|---|
| Primary support | C30 shotcrete | Full ring | 25 | — | — |
| Rock bolt | Crown and sidewalls | — | 4 | 1.2 × 1 |
| Advance support | Φ60 pipe roof | — | — | 9 | 0.4 × 6 |
| Secondary lining | C30 shotcrete | Full ring | 40 | — | — |
Table 4.
Mechanical parameters of the support structure materials.
Table 4.
Mechanical parameters of the support structure materials.
| Material | Unit Weight (γ, kN/m3) | Deformation Modulus (E, GPa) | Poisson’s Ratio (μ) |
|---|
| Steel rib | 78.5 | 210 | 0.27 |
| C30 shotcrete | 25 | 33.5 | 0.2 |
Table 5.
Comparison of simulated and measured displacements at the monitoring points.
Table 5.
Comparison of simulated and measured displacements at the monitoring points.
| Case | Monitoring Point | Simulated (mm) | Measured (mm) | Relative Error (%) |
|---|
| Case 1 | Crown | 90.2 | 88.3 | 2.2 |
| Shoulder | 198.4 | 203.3 | 2.4 |
| Haunch | 295.4 | 285.7 | 3.4 |
| Springline | 224.7 | 211.5 | 6.2 |
| Case 2 | Crown | 92.7 | 110.3 | 16.0 |
| Shoulder | 183.4 | 176.2 | 4.1 |
| Haunch | 280.8 | 299.3 | 6.2 |
| Springline (left + right) | 237.4 | 259.4 | 8.5 |
Table 6.
Rock bolt support Scenarios.
Table 6.
Rock bolt support Scenarios.
| Scenario No. | Location | Bolt Length (m)
(Crown and Sidewalls) | Bolt Density
(Circumferential × Longitudinal) |
|---|
| 1 | Crown and sidewalls | 4, 4 | 1.2 m × 1.2 m |
| 2 | Crown and sidewalls | 4, 6 | 1.2 m × 1.2 m |
| 3 | Crown and sidewalls | 4, 8 | 1.2 m × 1.2 m |
| 4 | Crown and sidewalls | 4, 10 | 1.2 m × 1.2 m |
Table 7.
Rock bolt support cases for moderately dipping bedding under asymmetric loading.
Table 7.
Rock bolt support cases for moderately dipping bedding under asymmetric loading.
| Scenario No. | Installation Region | Bolt Length (m)
(Crown and Sidewalls) | Bolt Density
(Circumferential × Longitudinal) |
|---|
| 1 | Sidewall | 6 | 1.2 m × 1.2 m |
| Sidewall | 8 | 1.2 m × 1.2 m |
| Sidewall | 10 | 1.2 m × 1.2 m |
| 2 | Left springline and right shoulder | 6 | 1.2 m × 1.2 m |
| Left springline and right shoulder | 8 | 1.2 m × 1.2 m |
| Left springline and right shoulder | 10 | 1.2 m × 1.2 m |
| Disclaimer/Publisher’s Note: The statements, opinions and data contained in all publications are solely those of the individual author(s) and contributor(s) and not of MDPI and/or the editor(s). MDPI and/or the editor(s) disclaim responsibility for any injury to people or property resulting from any ideas, methods, instructions or products referred to in the content. |