Article

Field-Based Semi-Empirical Analysis of Total Thrust and Cutterhead Torque in EPB Shield Tunneling During a Hard-Rock-to-Sandy-Strata Transition


1
School of Civil Engineering, Qingdao University of Technology, Qingdao 266520, China
2
School of Mechanical and Electrical Engineering, China University of Mining and Technology, Beijing 100083, China
3
State Key Laboratory for Tunnel Engineering, China University of Mining and Technology, Beijing 100083, China
4
Qingdao Metro Group Co., Ltd., Qingdao 266035, China
*
Authors to whom correspondence should be addressed.
Appl. Sci. 2026, 16(13), 6388; https://doi.org/10.3390/app16136388
Submission received: 20 May 2026 / Revised: 21 June 2026 / Accepted: 22 June 2026 / Published: 26 June 2026
(This article belongs to the Special Issue Advances in Tunnel Excavation and Underground Construction)

Featured Application

This study provides a field-data-supported semi-empirical approach for evaluating total thrust and cutterhead torque responses during EPB shield tunneling through hard-rock-to-sandy-strata transition zones.

Abstract

Existing component-based models have difficulty interpreting the field response of earth pressure balance (EPB) shield tunneling parameters when the excavation face gradually changes from hard rock to sandy strata. To address this problem, this study proposes a mechanism-informed semi-empirical analysis based on a continuous face sand fraction function, η ( z ) , which represents the evolution of the sand-bearing area fraction at the excavation face along the shield advance direction. The function is constructed from the geological profile and is used as a continuous reformulation of existing face-composition descriptors such as rock/sand ratio and composite ratio. Based on η ( z ) , engineering-equivalent models for total thrust and cutterhead torque are developed and evaluated using field tunneling data from Qingdao Metro Line 15 and Line 5. The Dandan right-line data are used for parameter calibration, while the Basi right-line data from Rings 590–650 are used for independent validation without further parameter tuning. The results show that the η-related correction term improves the independent validation performance of the total thrust model, reducing the MAPE from 22.56% to 14.25%. In contrast, cutterhead torque exhibits stronger operational variability and interval-specific baseline offset. After applying a baseline correction determined from the stable hard-rock section of the Basi interval, the ring-scale torque MAPE decreases from 44.07% to 17.25%, but the additional η -related torque contribution remains limited. These results indicate that total thrust is more sensitive to the gradual increase in face sand fraction, whereas cutterhead torque is more strongly influenced by machine condition, cutter wear, and operational control. The proposed approach provides a field-based semi-empirical reference for interpreting tunneling parameter responses in similar hard-rock-to-sandy-strata transition zones.

1. Introduction

With the continuous expansion of urban underground space development, earth pressure balance (EPB) shield tunneling has been widely used in metro tunnels, municipal tunnels, and utility corridors because of its high construction efficiency, strong adaptability to ground conditions, and relatively limited disturbance to the surrounding environment [1,2]. During EPB shield tunneling, total thrust, cutterhead torque, advance rate, cutterhead rotational speed, chamber pressure, and muck discharge are strongly coupled. These parameters are essential for maintaining face stability, controlling ground deformation, and identifying abnormal tunneling states [3,4]. Previous studies have systematically investigated EPB tunneling parameters from the perspectives of earth pressure balance control, thrust calculation, cutterhead torque decomposition, cutterhead extrusion effects, and parameter matching, thereby providing an important basis for shield design and construction control [3,4,5]. However, empirical formulas and component-based mechanical models established for homogeneous soft ground, sandy ground, or intact rock are often insufficient to explain the abrupt changes, fluctuations, and scale-dependent responses of tunneling parameters in soft–hard composite strata, particularly when an EPB shield gradually transitions from hard rock to sandy strata.
Soft–hard composite ground and mixed-face ground represent some of the most challenging conditions in mechanized tunneling. Based on TBM tunneling cases in rock–soil interface mixed ground, Tóth et al. [6] pointed out that mixed-face ground should not be defined solely by the difference in uniaxial compressive strength between materials; the proportion of different materials at the excavation face is also a key factor affecting tunneling performance. The studies and engineering reviews by Ma et al. [7], Gong et al. [8], and Shirlaw [9] showed that shield tunneling in weathered rock–residual soil, hard rock–soft ground, and rock–soil interface conditions may suffer from severe cutter wear, reduced advance efficiency, cutterhead torque fluctuation, face instability, ground loss, and shield attitude deviation. Zhao et al. [10] further demonstrated, through the Kranji tunnel case in Singapore, that frequently changing mixed ground can significantly affect cutter wear, advance efficiency, and tunneling parameter control. More recently, Kong et al. [11] conducted model tests and numerical simulations of shield bias load in upper-soft and lower-hard soil–rock compound strata and showed that the proportion of rock at the tunnel face affects the shield bias moment and attitude-control behavior. These studies indicate that the shield response in mixed-face ground is governed not only by the strength of a single material, but also by excavation-face composition, shield–ground interaction, and operational control.
To quantitatively describe the influence of excavation-face composition on shield response in mixed ground, previous studies have introduced descriptors such as face composition, rock/sand ratio, and composite ratio. Tóth et al. [6] used face composition to describe the proportion of rock and soil at the excavation face and analyzed its influence on TBM performance in rock–soil interface mixed ground. Hu et al. [12] investigated the soil response induced by EPB shield tunneling in granite-and-sand mixed-face conditions through field monitoring and laboratory model tests, focusing on the effects of the rock/sand ratio at the tunnel face, Tr/Ts, and the cover-to-diameter ratio, C/D, on chamber pressure, ground displacement, and volume loss. Their results showed that the response in mixed-face ground differs significantly from that in homogeneous ground and is particularly sensitive to the rock/sand ratio under relatively shallow cover conditions. Fu et al. [13] used the composite ratio together with layer-specific geological parameters as inputs for advance-rate prediction in mixed ground, demonstrating that explicit representation of ground composition can improve prediction performance. Zhai et al. [14] further developed thrust, torque, and power estimation models for EPB TBMs in mixed-face strata by considering the percentage of soft and hard strata, cutter layout, chamber pressure, and soil friction. These studies demonstrate that the composition of the excavation face has become an important variable for analyzing shield behavior in mixed ground. Therefore, the face sand fraction function η(z) adopted in this study is not proposed as a geological index independent of previous research. Rather, it is a continuous descriptor of the sand-bearing area fraction along the shield advance direction, formulated on the basis of existing concepts such as face composition, rock/sand ratio, and composite ratio, and constructed according to the engineering-geological geometry of the gradual transition from hard rock to sandy strata.
Extensive studies have also established component-based calculation models and engineering estimation methods for total thrust and cutterhead torque. González et al. [15] proposed a method for estimating thrust and torque components from EPB operational records in mixed-face drives and emphasized that measured total thrust and supplied torque contain multiple contributions from cutter–ground interaction, face support, shield skin friction, and chamber–cutterhead interaction. For thrust, Shi et al. [16] developed a component-based thrust calculation model by analyzing the resistance components acting on a shield machine; Su et al. [17] established a mathematical model for the total thrust of EPB shield tunneling and examined the effects of chamber pressure, cutterhead opening ratio, shield–soil contact length, and friction coefficient; and Chen et al. [18] modified thrust and cutterhead torque calculation formulas using field data from complex ground conditions. For cutterhead torque, Wang [19], Lyu and Fu [20], and Zhong et al. [21] developed torque calculation models from the perspectives of cutting, friction, mixing, and soil strength. Zhou and Zhai [22] extended an EPB TBM cutterhead torque model to mixed-face ground and analyzed torque components including frontal, circumferential, and back-surface friction torque, cutting torque, shearing torque at openings, and agitating torque. Zhao et al. [23] developed a torque fluctuation analysis and penetration prediction method for EPB TBMs in rock–soil interface mixed ground and showed that cutterhead torque and torque fluctuation are important constraints on shield advance in such conditions. In recent years, construction data and machine learning approaches have also been applied to shield parameter prediction. Godinez et al. [24] modeled EPB cutterhead torque using machine data, while Fu et al. [13] used an optimized neural network to predict EPB advance rate in mixed ground. Overall, these studies provide important foundations for thrust, torque, and tunneling performance prediction. However, most existing work focuses on parameter calculation in homogeneous ground, design-stage estimation in mixed-face conditions, performance prediction, or the modeling of a single tunneling parameter. The differential field responses of total thrust and cutterhead torque to gradual changes in excavation-face composition during the transition from hard rock to sandy strata remain insufficiently discussed, especially at different data scales.
Based on the above research background, this study uses the Dandan right-line interval for parameter calibration and the Basi right-line interval for independent validation. A continuous face sand fraction function, η ( z ) , is introduced along the shield advance direction to describe the gradual change in the sand-bearing area fraction at the excavation face. Based on this descriptor, engineering-equivalent semi-empirical models for total thrust and cutterhead torque are developed by simplifying and grouping the main terms of existing component-based thrust and torque models. Field tunneling data are then used to examine the different responses of these two parameters to changes in excavation-face composition.
It should be noted that the additional resistance term associated with η ( z ) is a semi-empirical correction identified from field data. It represents, in an engineering-equivalent manner, the combined effects of soil flow, accumulation, wrapping, and enhanced friction after sandy strata enter the excavation face. It is not an independently measured material parameter obtained from physical tests. The objective of this study is not to propose a universal mechanistic prediction framework for all soft–hard heterogeneous strata, but to provide a field-based semi-empirical interpretation of the differential responses of total thrust and cutterhead torque during a hard-rock-to-sandy-strata transition. The results can provide a reference for tunneling parameter interpretation, interface-related response identification, and construction-state assessment in similar transition zones.

2. Methodology

2.1. Continuous Representation of the Hard-Rock-to-Sandy-Strata Transition

2.1.1. Zoning of the Excavation Face

Let the shield advance direction be denoted by the z-axis. At a given advance position z, the total area of the excavation face, A , can be expressed as
A = π D 2 4
where D is the excavation diameter.
During the transition from hard rock to sandy strata, the excavation face may contain both a hard-rock region and a sand-bearing region. The hard-rock area and sand-bearing area on the excavation face are denoted as A r ( z ) and A s ( z ) , respectively. Therefore,
A = A r ( z ) + A s ( z ) ,

2.1.2. Face Sand Fraction Function

The face sand fraction function is defined as
η ( z ) = A s ( z ) A
where η ( z ) ranges from 0 to 1. Before sandy strata enter the excavation face, η ( z ) is approximately zero. Within the transition zone, η ( z ) increases with shield advance, reflecting the increasing sand-bearing proportion at the excavation face. If the shield fully enters sandy strata, η ( z ) may approach 1. However, in many field transition zones, sandy material may occupy only part of the excavation face; in this case, the maximum interpreted value of η ( z ) can be smaller than 1.
It should be noted that η ( z ) is not proposed as a completely new geological index independent of previous mixed-ground descriptors. Rather, it is a continuous engineering representation of excavation-face composition, formulated on the basis of existing concepts such as face composition, rock/sand ratio, and composite ratio. Compared with discrete or section-based descriptors, η ( z ) describes the continuous variation in the sand-bearing area fraction along the shield advance direction and can therefore be directly linked to the evolution of tunneling parameters with ring number.

2.1.3. Engineering Construction of η ( z )

In engineering application, η ( z ) can be constructed using either a geometric overlap method or a simplified interpolation method, depending on the available geological and construction information. If the geological interface and tunnel alignment are sufficiently clear, A s ( z ) can be estimated from the geometric intersection between the tunnel face and the sandy stratum. When only key control positions are available, a simplified piecewise linear transition can be used:
η ( z ) = { 0 , z z e η t z z e z t z e , z e < z < z t η t , z z t
where z e is the position at which sandy strata begin to enter the excavation face, z t is the reference position at which the interpreted sand fraction reaches η t , and η t is the corresponding face sand fraction. If the shield fully enters sandy strata, η t may approach 1. However, in partial-face transition conditions, η t can be smaller than 1. A smoother function, such as a logistic function, can also be adopted if sufficient geological control points are available.
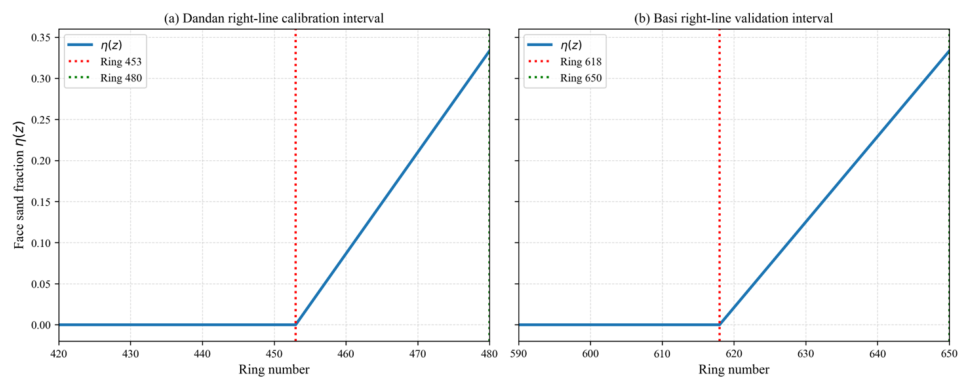
In this study, η ( z ) for the Dandan calibration interval was mainly constructed from the interpreted geological profile. Sandy strata began to enter the excavation face near Ring 453, and the face sand fraction reached approximately (1/3) near Ring 480. For the Basi validation interval, the interpreted geological profile was combined with field spoil observations. Although the sandy layer was mainly shown above the tunnel alignment in the geological profile, spoil observations indicated that sandy material locally entered the excavation face during construction. Near Ring 650, the sandy component in the spoil was observed to account for approximately one-third of the excavated material. Therefore, η ( z ) in the Basi interval was set to increase from 0 near Ring 618 to approximately (1/3) near Ring 650.
The η ( z ) function used in this study should therefore be understood as an engineering interpretation variable constrained by both pre-construction geological information and field construction feedback. It is not a directly measured real-time tunneling parameter. Real-time identification of η ( z ) from online tunneling parameters remains a topic for future work.

2.2. Mechanical Framework for Shield Tunneling Parameters

2.2.1. Basic Equilibrium Relationship

Considering the shield machine as a whole, the excavation process can be approximately regarded as a quasi-static process when the advance rate is relatively low and acceleration can be neglected. Therefore, the following equilibrium relationship can be obtained:
T = f
where T is the total thrust of the shield machine, and f is the total tunneling resistance.

2.2.2. Decomposition of Resistance Components

The total tunneling resistance can be further decomposed as
f = F 1 + F 2 + F 3 + F 4 + F 5 + F 6
where F 1 is the face resistance; F 2 is the frictional resistance between the shield shell and the surrounding ground; F 3 is the cutterhead penetration resistance; F 4 is the frictional resistance between the tail sealing brushes and the segmental lining; F 5 is the trailing equipment resistance; and F 6 is the additional resistance induced by steering correction or curved alignment construction.
Component-based shield-tunneling load frameworks and EPB operating-data decompositions [1,15] indicate that face resistance and shield skin friction are usually important components of total thrust, while local empirical formulations for EPB shield thrust have also been reported in Refs. [16,17,18]. However, because the relative contribution of each term is project-dependent, a project-specific order-of-magnitude check was further conducted for the Dandan section. In this study, the total thrust model was simplified as
T F 1 + F 2 + F a
where F a denotes the combined secondary resistance term.
It should first be clarified that the penetration-related resistance F 3 was not directly neglected. In the proposed thrust model, the effects of cutter penetration, hard-rock contact reaction, and rock breaking were incorporated into the equivalent hard-rock face resistance term. Therefore, F 3 was included in the face resistance in an engineering-equivalent manner rather than being treated as an independent resistance component.
According to the lifting and transportation weight table of the shield machine, the cutterhead assembly, front shield, middle shield, and tail shield weigh approximately 75 t, 156 t, 110 t, and 40 t, respectively. Therefore, the mass of the shield main machine was taken as 381 t. This corresponds to a weight of approximately 3738 kN. The backup gantries were not included in this value because their contribution is more closely related to trailing resistance than to the shield–ground interaction of the main machine. As a conservative estimate, if the screw conveyor, main-machine belt conveyor, and segment erector are also included, the mass increases to 449 t, corresponding to a weight of approximately 4405 kN.
For the studied section, the maximum longitudinal gradient is 27‰. The grade-induced resistance was estimated as the component of the shield weight along the tunnel axis. Using the main-machine weight of 3738 kN, the grade-induced resistance is approximately 101 kN. Using the conservative weight of 4405 kN, the grade-induced resistance is approximately 119 kN. Compared with the measured thrust level of approximately 11,000–18,000 kN, the grade-induced resistance accounts for only about 0.6–1.1%.
The minimum horizontal curve radius of the studied section is 1200 m. The curve-related additional resistance was estimated using the shield body length of 8.475 m and an equivalent shield–ground friction coefficient of 0.25. The estimated curve-related resistance is approximately 6.6 kN for the main-machine weight and approximately 7.8 kN for the conservative weight. This is less than 0.1% of the measured thrust level.
The engineering reserve term F a used in the model was 300 kN, which represents tail seal friction, trailing resistance, and other minor secondary resistance components in a lumped form. This value accounts for approximately 1.7–2.7% of the measured thrust range. When the estimated grade resistance, curve-related resistance, and F a are considered together, the combined secondary resistance is approximately 408 kN, or 427 kN under the conservative weight assumption. This corresponds to approximately 2.3–3.9% of the measured thrust level. The estimated values and relative proportions of these secondary resistance terms are summarized in Table 1.
Therefore, for the present Dandan section, the secondary resistance terms are much smaller than the dominant face resistance and shield skin friction terms within the accuracy level targeted in this semi-empirical analysis. They were not modeled individually but were grouped into the engineering reserve term F a . This simplification is valid only as an order-of-magnitude approximation for the studied section and should not be generalized without project-specific verification.

2.2.3. Response Characteristics and Modeling Strategy

Field data demonstrate that total thrust and cutterhead torque exhibit different response characteristics during the gradual transition of the shield machine from hard rock to sandy strata. Specifically, the total thrust shows a clear trend of variation with the increase in the face sand fraction, whereas the cutterhead torque changes more gently overall but exhibits stronger fluctuations. These differences show that, although both tunneling parameters are affected by ground variation, their response mechanisms differ significantly in terms of temporal and spatial scales.
To provide a unified description of the geometric variation in soft–hard heterogeneous strata, the face sand fraction function η ( z ) is introduced to characterize the ground composition at the excavation face. Based on this variable, theoretical models and engineering-equivalent validation models are developed for total thrust and cutterhead torque, respectively. The different responses of these two parameters to η ( z ) are then analyzed.

2.3. Total Thrust Model

2.3.1. Basic Components of Face Resistance

Following the component-based thrust decomposition adopted in shield tunneling design and operating-data interpretation [1,15], and retaining local empirical refinements for EPB tunneling [16,17,18], the face resistance was treated as the sum of contributions from hard-rock and sandy regions. For pure sandy strata, the face resistance is mainly governed by the balance between earth–water pressure at the excavation face and chamber pressure. In contrast, for hard rock strata, in addition to in situ rock stress, the face resistance is more strongly associated with the contact reaction induced by cutterhead penetration and rock fragmentation. Therefore, under soft–hard heterogeneous ground conditions, especially during the transition from hard rock to sandy strata, the face resistance can be expressed in a zonal integral form as
F 1 ( z ) = A r ( z ) q r ( x , y ; z ) d A + A s ( z ) q s ( x , y ; z ) d A
where q r and q s denote the equivalent face resistance in the hard rock region and the sandy strata region, respectively. If the average equivalent resistance is adopted within each region, Equation (8) can be simplified as
F 1 ( z ) = q r ( z ) A r ( z ) + q s ( z ) A s ( z )
According to Equations (2), (3), and (9), the following expression can be obtained:
F 1 ( z ) = A [ ( 1 η ( z ) ) q r ( z ) + η ( z ) q s ( z ) ]
Let
Δ q ( z ) = q r ( z ) q s ( z )
Then
F 1 ( z ) = A [ q r ( z ) η ( z ) Δ q ( z ) ]

2.3.2. Equivalent Resistance Expressions for Hard Rock and Sandy Strata

  • Equivalent Resistance in the Sandy Strata Region
In the sandy strata region, the face resistance is mainly controlled by the balance between earth–water pressure at the excavation face and chamber pressure. Therefore, the equivalent resistance in the sandy strata region can be expressed as
q s = ( 1 ξ ) p f + ξ p c h
where ξ is the cutterhead opening ratio; p f is the equivalent frontal pressure in the sandy strata region, which can be expressed as a combined term of lateral earth pressure, groundwater pressure, and surface surcharge, or interpreted as the equivalent average pressure corresponding to the earth–water pressure at the excavation face; and p c h is the chamber pressure.
2.
Equivalent Resistance in the Hard Rock Region
In the hard rock region, the face resistance is mainly governed by the normal reaction caused by cutter penetration, rock crushing, and block detachment. For engineering modeling, the equivalent face resistance in the hard rock region is expressed as
q r = q r 0 + k r δ
where q r 0 represents the in situ rock stress and the basic contact resistance; δ is the equivalent cutter penetration depth; and k r is the equivalent contact stiffness coefficient of the hard rock. Since the penetration depth is related to the advance rate v and cutterhead rotational speed ω , it can be written as
δ = c δ v ω
Substituting Equation (15) into Equation (14) gives
q r = q r 0 + k r c δ v ω

2.3.3. Shield Skin Friction Model

For soft–hard heterogeneous ground composed of hard rock and sandy strata, the shield skin friction can be divided into the frictional resistance in the hard rock section and that in the sandy strata section:
F 2 ( z ) = F 2 r ( z ) + F 2 s ( z )
In the hard rock section, due to the relatively high integrity of the surrounding rock, the contact between the shield shell and the ground is more likely to be characterized by local contact and rock-block friction. In the sandy strata section, the contact is closer to a continuously distributed frictional interaction. To establish a unified expression, a zonal weighted form is adopted:
F 2 ( z ) = L c ( z ) π D [ ( 1 η ( z ) ) τ r + η ( z ) τ s ]
where L c ( z ) is the effective contact length between the shield shell and the surrounding rock or soil; τ r is the equivalent frictional resistance per unit area in the hard rock section; and τ s is the equivalent frictional resistance per unit area in the sandy strata section.
Let
τ r = μ r σ r , τ s = μ s σ s
Then
F 2 ( z ) = L c ( z ) π D [ ( 1 η ( z ) ) μ r σ r + η ( z ) μ s σ s ]
Equation (20) indicates that the shield skin friction does not necessarily decrease as the shield enters sandy strata. In sandy strata, the contact between the shield shell and the ground tends to become more continuous. When the chamber pressure is high or soil conditioning is insufficient, the equivalent friction term μ s σ s may increase. On the other hand, in hard rock sections, local contact, rock-block jamming, and extrusion may also induce considerable local friction. Therefore, during the transition from hard rock to sandy strata, the shield skin friction may not necessarily decrease; instead, it may fluctuate or even increase, depending on the combined effects of ground conditions and construction control parameters.

2.3.4. Equivalent Total Thrust Expression

Substituting Equations (10) and (20) into Equation (7) gives
T ( z ) = A [ q r ( z ) η ( z ) Δ q ( z ) ] + L c ( z ) π D [ ( 1 η ( z ) ) μ r σ r + η ( z ) μ s σ s ] + F a
Substituting Equation (16) into Equation (21) gives
T ( z ) = A [ q r 0 + k r c δ v ω η ( z ) Δ q ( z ) ] + L c ( z ) π D [ ( 1 η ( z ) ) μ r σ r + η ( z ) μ s σ s ] + F a
Equation (22) is the equivalent mechanical model of total thrust established in this study for the transition from hard rock to sandy strata. To highlight the key variables, it can be further written as
T ( z ) = T 0 ( z ) A η ( z ) Δ q ( z ) + Δ F 2 ( z )
where
T 0 ( z ) = A ( q r 0 + k r c δ v ω ) + L c ( z ) π D μ r σ r + F a ,
and
Δ F 2 ( z ) = L c ( z ) π D η ( z ) ( μ s σ s μ r σ r )
It can be seen that the total thrust is mainly composed of face resistance, shield skin friction, and secondary resistance. These components can all be expressed as functions of the face sand fraction η ( z ) . Therefore, the total thrust can be regarded as an amplitude-response parameter that primarily reflects the overall variation in ground composition.

2.4. Cutterhead Torque Model

2.4.1. Decomposition of Cutterhead Torque

Following the cutterhead torque decomposition used in mixed-face EPB drives by González et al. [15] and Zhou and Zhai [22], together with empirical torque formulations in Refs. [18,19,20,21], the cutterhead torque of an earth pressure balance (EPB) shield can be decomposed as
M = M f + M n + M m
where M f is the friction torque generated by the contact between the cutterhead panel and the soil or rock mass, M n is the cutting or rock-breaking torque generated by the cutters, and M m is the mixing torque.

2.4.2. Friction Torque

If the contact pressure acting on the cutterhead is assumed to be uniformly distributed, the friction torque is related to the contact pressure, cutterhead opening ratio, and the cube of the cutterhead diameter. Its general expression can be written as
M f = π μ f p c o n ( 1 ξ n ) D 3 12
When the contact pressures acting on both the front and back sides of the cutterhead are considered, the expression can be further modified as
M f = π μ f ( 2 p 0 + Δ p 2 ) ( 1 ξ n ) D 3 12
where μ f is the friction coefficient; ξ is the cutterhead opening ratio; n is a correction coefficient related to the cutterhead configuration, with 1 ≤   n < 1.5. For a spoke-type cutterhead, n is generally taken as 1, whereas for a panel-type cutterhead, n can be taken as 1–1.5 depending on the opening distribution. A larger value of n is generally adopted when more openings are distributed near the cutterhead center. In addition, D is the cutterhead diameter, p c o n is the contact pressure acting on the cutterhead, p 0 is the original lateral earth pressure, and Δ p 2 is the additional pressure induced by cutterhead extrusion, which can be calculated according to Ref. [17].
For the soft–hard heterogeneous ground considered in this study, the contact pressure can no longer be represented by a single average value. Instead, it should be expressed in a zonally averaged form. Let p r and p s denote the contact pressures corresponding to the hard rock region and the sandy strata region, respectively. The friction torque can then be approximated as
M f ( z ) = π μ f D 3 12 ( 1 ξ n ) [ ( 1 η ( z ) ) p r + η ( z ) p s ]
Although panel friction is not necessarily dominant in the hard rock section, the contact pressure is usually higher in this region. Therefore, during the transition from hard rock to sandy strata, if the contact pressure in the sandy strata region is significantly lower than that in the hard rock region, the friction torque tends to decrease overall.

2.4.3. Rock-Breaking and Cutting Torque

Existing cutterhead-torque formulations describe the cutting or rock-breaking torque as a component related to cutter–ground interaction and to operational parameters such as penetration rate and cutterhead rotational speed [19,22]. Its basic form can be expressed as
M n q D 2 v ω
where q is the cutting pressure.
For soft–hard heterogeneous ground composed of hard rock and sandy strata, the rock-breaking mechanism in the hard rock region and the cutting mechanism in the sandy strata region should be distinguished. Let k n r and k n s denote the equivalent rock-breaking coefficient in the hard rock region and the equivalent cutting coefficient in the sandy strata region, respectively. The cutting or rock-breaking torque can then be expressed as
M n ( z ) = D 2 v ω [ ( 1 η ( z ) ) k n r q r + η ( z ) k n s q s ]
In general, the unit-area rock-breaking energy consumption in the hard rock region is much higher than the granular cutting energy consumption in the sandy strata region, namely,
k n r q r k n s q s
Therefore, as η ( z ) increases, the cutterhead cutting torque usually decreases significantly. However, if mixed cutting of rock blocks and sandy soil occurs in the transition zone, or if nonuniform cutter engagement develops, M n ( z ) may exhibit intensified short-term fluctuations.

2.4.4. Mixing Torque

In empirical and component-based torque models, the arrangement of mixing bars or openings can generate additional agitating or mixing torque [19,22]. Its expression can be written as
M m = γ H 0 D b L b R b f
where γ is the unit weight of the soil, H 0 is the soil cover depth above the mixing blade, D b is the diameter of the mixing blade, L b is the length of the mixing blade, R b is the distance from the mixing blade to the center of the shield machine, and f is the mixing resistance of the mixing bar.
For the hard rock section, the mixing effect is relatively weak. In contrast, for sandy strata and granular flow inside the chamber, the mixing effect becomes more significant. For simplification, this study defines
M m ( z ) = η ( z ) M m s
where M m s is the equivalent mixing torque under the pure sandy strata condition.

2.4.5. Equivalent Cutterhead Torque Expression

Based on Equations (29), (31), and (34), the cutterhead torque can be obtained as
M ( z ) = π μ f D 3 12 ( 1 ξ n ) [ ( 1 η ) p r + η p s ] + D 2 v ω [ ( 1 η ) k n r q r + η k n s q s ] + η M m s
Equation (35) can be further written as
M ( z ) = M r ( z ) η ( z ) Δ M 1 ( z ) η ( z ) Δ M 2 ( z ) + η ( z ) M m s
For engineering validation, the theoretical torque model is grouped according to the ground type and expressed in an equivalent form as
M ( z ) = M r ( 1 η ( z ) ) + M s η ( z ) + M e x t r a η ( z )
where
M r ( z ) = π μ f D 3 12 ( 1 ξ n ) p r + D 2 v ω k n r q r
and
M s = π μ f D 3 12 ( 1 ξ n ) p s + D 2 v ω k n s q s
Here, M r denotes the basic torque in the hard rock section, M s denotes the basic torque in the sandy strata section, and M e x t r a is an additional torque term used to describe soil flow, mixing, and accumulation effects in sandy strata.
It can be seen that cutterhead torque is affected not only by ground composition but also by operational parameters such as penetration rate, cutterhead rotational speed, and the flow state of the excavated material. Therefore, its variation cannot be explained by a single geological variable. Instead, it reflects the combined effects of ground conditions and operational parameters, and can be regarded as a coupled-response parameter influenced by both η ( z ) and tunneling operation parameters.

3. Case Study and Data Processing

3.1. Project Background and Selected Tunneling Intervals

This study is based on two shield tunneling intervals with hard-rock-to-sandy-strata transition conditions in Qingdao Metro projects. The Dandan–Dandan South right-line interval of Qingdao Metro Line 15 was used for model calibration, whereas the Bahaomatou–Sifangchang right-line interval of Qingdao Metro Line 5, hereinafter referred to as the Basi interval, was used for independent validation.
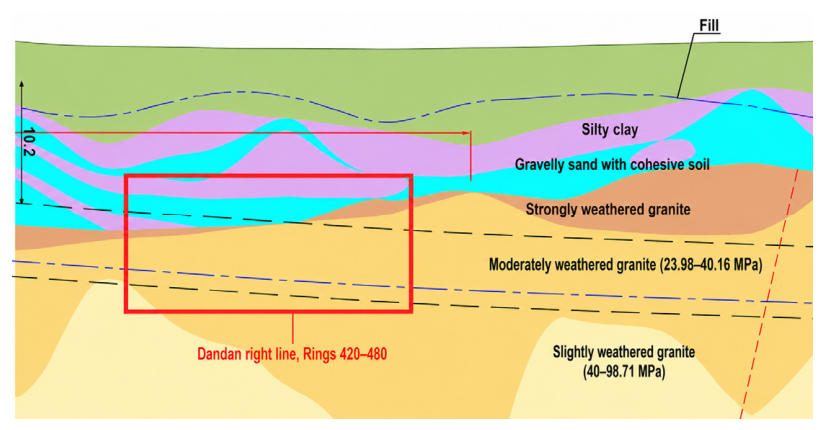
The geological profile of the Dandan–Dandan South right-line calibration interval is shown in Figure 1. In this interval, the right-line data from Rings 420–480 were selected for parameter identification. According to the interpreted geological profile, sandy strata began to enter the excavation face near Ring 453, and the face sand fraction reached approximately one-third near Ring 480. Therefore, this interval was used to calibrate the semi-empirical parameters of the total thrust and cutterhead torque models.
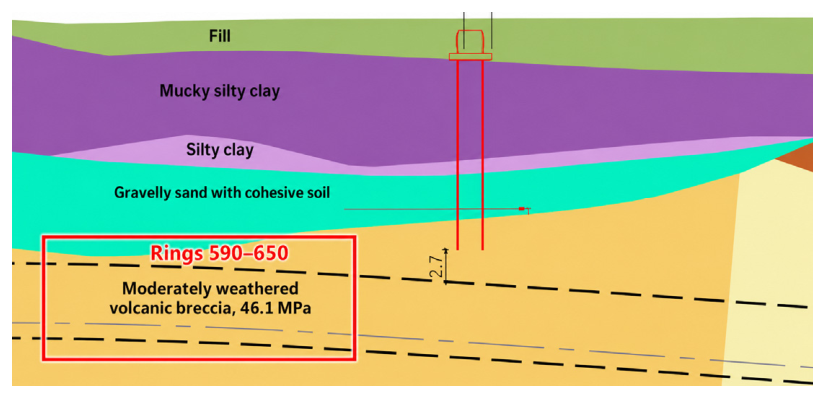
The geological profile of the Basi right-line validation interval is shown in Figure 2. According to the design and investigation documents, the Basi interval extends from Bahaomatou Station to Sifangchang Station. The right-line tunnel is approximately 1000.869 m long, the left-line tunnel is approximately 1004.246 m long, the minimum horizontal curve radius is 450 m, the line spacing varies from approximately 14 m to 17 m, and the tunnel burial depth ranges from approximately 20.6 m to 30.3 m. The interval was constructed in EPB shield mode. The surrounding environment is complex, and the tunnel passes beneath or near several existing structures, including an oil station area, Hang’an Viaduct, Haipo River, residential buildings, historical buildings, and the Jiaoji Railway.
The strata in the Basi interval include artificial fill, marine sand, muddy silty clay, clayey and sandy deposits, and granite-dominated bedrock. Although the interpreted geological profile shows that the sandy layer is mainly located above the tunnel alignment in the highlighted validation segment, field spoil observations indicated that sandy material locally entered the excavation face during construction. Near Ring 650, the sandy component in the spoil was observed to account for approximately one-third of the excavated material. Therefore, the Basi right-line data from Rings 590–650 were selected as the independent validation dataset, with the face sand fraction η set to increase from 0 near Ring 618 to approximately 1/3 near Ring 650. This validation interval was not used for parameter calibration.
Both the Dandan and Basi intervals were excavated using ϕ6450 mm composite earth pressure balance shield machines manufactured by China Railway Construction Heavy Industry Corporation Limited. Therefore, the main shield-machine parameters listed in Table 2 are representative of the machines used in both intervals.

3.2. Data Acquisition and Preprocessing

A Web service interface is deployed on the industrial computer of the shield machine to communicate with the ground monitoring program. The industrial computer is equipped with an upper-level control program, which periodically communicates with the programmable logic controller (PLC) to obtain shield machine data and updates these data to the Web service interface in real time. The ground monitoring program then periodically calls the Web service interface through the network to acquire real-time shield tunneling data.
The real-time data obtained from the interface include sensor measurements from all subsystems of the shield machine, pre-alarm data, cumulative material consumption data for each ring, and parameter settings.
The raw data recorded by the shield construction monitoring system usually have a high sampling frequency, large data volume, and considerable noise. In addition, different parameters may suffer from time asynchrony or abnormal records. Therefore, data preprocessing is required before model analysis, mainly including the identification and removal of abnormal data. The abnormal data processing methods adopted in this study include the following two categories:
(a)
Missing data, such as unrecorded or incomplete data points, were processed by deletion or interpolation.
(b)
Physically unreasonable data were removed, such as negative thrust pressure, thrust pressure obviously exceeding the rated pressure, or negative cutterhead rotational speed.
To ensure that the tunneling parameters were consistent with the actual construction process and could adequately reflect parameter variation trends, the dataset was constructed according to the following principles:
(a)
For the Dandan calibration dataset, data from Rings 420–480 were retained; for the Basi validation dataset, data from Rings 590–650 were retained.
(b)
Rows with a cutterhead rotational speed of zero were removed, while the row immediately before the rotational speed changed from zero to nonzero and the row at which the rotational speed changed from nonzero to zero were retained.
After data cleaning, the Dandan calibration dataset contained 23,177 time-scale samples, and the Basi validation dataset contained 36,227 time-scale samples. For the ring-scale torque analysis, the cleaned time-scale data were further averaged by ring number, resulting in 61 ring-scale samples for each interval.

3.3. Data Division, Independent Validation, and Evaluation Metrics

To avoid circular validation and to distinguish parameter identification from predictive evaluation, the field data were divided into a calibration dataset and an independent validation dataset. The Dandan–Dandan South right-line data from Rings 420–480 were used for parameter calibration. Within this interval, Rings 420–450 were regarded as a stable hard-rock section and were used to determine the baseline terms of the total thrust and cutterhead torque models. The transition from hard rock to sandy strata began near Ring 453, and the face sand fraction reached approximately one-third near Ring 480. Therefore, the data from this interval were used to identify the semi-empirical parameters associated with the η-related response terms.
The Basi right-line data from Rings 590–650 were reserved as an independent validation dataset. This interval was not used in the calibration of k e x t r a , Δ q , τ r , τ s , M 0 , k p , k n , or k η . According to the geological profile, sandy strata began to enter the excavation face near Ring 618, and the face sand fraction reached approximately one-third at Ring 650. Therefore, η was set to zero at Ring 618 and to one-third at Ring 650, with linear interpolation between these two rings. All parameters calibrated from the Dandan interval were kept fixed when applied to the Basi validation interval.
For total thrust, the model was evaluated by directly applying the fixed parameters to the Basi interval. For cutterhead torque, two validation modes were reported. The first was strict independent validation, in which the Dandan-calibrated parameters were directly applied to the Basi data without any correction. The second was an engineering diagnostic validation with an interval-specific baseline offset, which was determined only from the stable hard-rock section of the Basi interval before sandy strata entered the excavation face. This baseline correction was used to account for differences in machine condition, cutter wear, operator control, and local lithology between intervals; it did not change the η-related model parameters.
The root mean square error (RMSE), mean absolute error (MAE), mean absolute percentage error (MAPE), and coefficient of determination (R2) were used as evaluation metrics. In addition, the absolute prediction errors of the models with and without η -related terms were compared to evaluate whether the η -related correction improved model performance. The main purpose of the proposed models is to interpret the field response of tunneling parameters during a hard-rock-to-sandy-strata transition rather than to provide high-precision real-time prediction of instantaneous tunneling parameters.
To further evaluate whether the η -related correction term significantly reduced the prediction error, a Wilcoxon signed-rank test was performed on the paired absolute errors of the models with and without the η-related term. A one-sided test was used to examine whether the absolute error of the model without the η -related term was significantly larger than that of the model with the η -related term.

4. Results

4.1. Calibration and Independent Validation of the Total Thrust Model

To evaluate the applicability of the total thrust model while avoiding circular validation, the Dandan right-line data from Rings 420–480 were used for parameter calibration, and the Basi right-line data from Rings 590–650 were used for independent validation. All model parameters were identified only from the Dandan interval and were then kept fixed when the model was applied to the Basi interval.

4.1.1. Modified Total Thrust Model

When the theoretical total thrust model described above was compared with the field data, it was found that the calculated total thrust was generally consistent with the measured values in the hard rock section. However, after the sandy strata began to intrude into the excavation face, the calculated total thrust was generally lower than the measured total thrust. This shows that the proposed theoretical model cannot fully describe the actual loading state of the shield machine in soft–hard heterogeneous strata.
This deviation is considered to be mainly caused by the additional resistance induced by sandy soil flow, accumulation, wrapping, and mixing effects. This additional resistance increases gradually with the growth of the face sand fraction, but it is difficult to characterize directly using traditional mechanical parameters. Therefore, the total thrust model proposed above is modified by introducing an additional resistance term, k e x t r a η ( z ) , which represents the additional contribution of sandy soil wrapping, flow, accumulation, and mixing effects to the total thrust. The modified total thrust model is expressed as
T ( z ) = A ( q r 0 + k p e n v ω η ( z ) Δ q ) + L c π D [ ( 1 η ( z ) ) τ r + η ( z ) τ s ] + F a + k e x t r a η ( z )
The parameters of the modified model were determined as follows: q r 0 was back-calculated from the stable hard rock section of Rings 420–450; Δ q was determined based on the variation characteristics of thrust in the transition section; τ r and τ s were selected based on empirical values and adjusted through comparison; and the coefficient k e x t r a was identified from the Dandan calibration interval only. It is an empirical correction coefficient used to represent the additional resistance associated with sandy soil flow, accumulation, wrapping, and enhanced friction after sandy strata enter the excavation face. It should not be interpreted as an independently measured material parameter.

4.1.2. Results and Comparison

Figure 3 shows the piecewise linear construction of the face sand fraction function, η ( z ) , for the Dandan calibration interval and the Basi independent validation interval. For the Dandan right-line calibration interval, sandy strata were interpreted to begin entering the excavation face near Ring 453, and η ( z ) was set to increase linearly from 0 at Ring 453 to approximately (1/3) at Ring 480. This interval was used only for parameter calibration.
For the Basi right-line validation interval, the interpreted geological profile was combined with field spoil observations. Sandy material was judged to begin locally entering the excavation face near Ring 618, and the sandy component in the spoil was observed to account for approximately one-third of the excavated material near Ring 650. Therefore, η ( z ) was set to increase linearly from 0 at Ring 618 to approximately (1/3) at Ring 650. The Basi interval was not used for parameter calibration and was reserved for independent validation.
It should be noted that η ( z ) is not a directly measured construction parameter. Rather, it is a continuous engineering interpretation variable constrained by the geological profile, tunnel alignment, ring position, and field construction feedback such as spoil observations.
The total thrust model was first calibrated using the Dandan right-line data. The stable hard-rock section of Rings 420–450 was used to determine the baseline resistance term, and the transition section was used to identify the η -related additional resistance coefficient. The back-calculated baseline parameter was q r 0 = 282.76 kPa, and the fitted additional resistance coefficient was k e x t r a = 15,591.15 kN. After these parameters were determined, they were kept fixed and directly applied to the Basi right-line validation interval. No Basi data were used to fit q r 0 , k e x t r a , Δ q , τ r , or τ s .
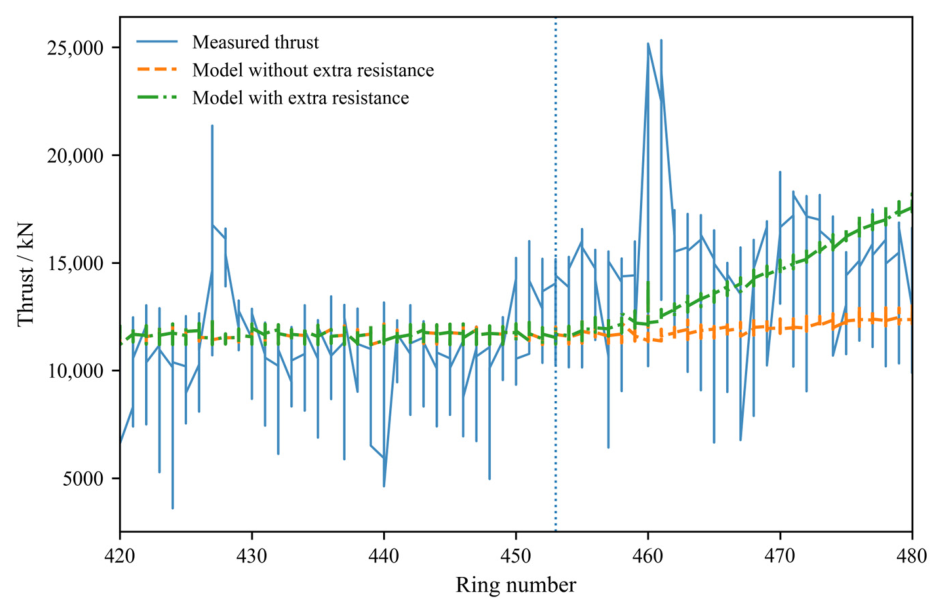
Figure 4 compares the measured and calculated total thrust in the Dandan calibration interval. In the stable hard-rock section, the calculated thrust was generally consistent with the measured thrust, indicating that the baseline resistance was reasonably identified. After the shield entered the hard-rock–sandy-strata transition zone, the model without the η -related additional resistance underestimated the measured total thrust. After introducing the additional resistance term k e x t r a η ( z ) , the calculated thrust increased in the transition section and became closer to the measured values. Quantitatively, for the Dandan calibration interval, the RMSE decreased from 3178.2 kN to 2518.9 kN, the MAE decreased from 2396.4 kN to 1725.7 kN, and the MAPE decreased from 15.87% to 11.74%. The coefficient of determination R2 increased from −0.426 to 0.104. These results indicate that the η -related correction term improved the description of the thrust increase within the calibration interval.
The local thrust peak near Ring 460 was not interpreted as an independent deterministic indicator of sandy-strata intrusion, because the thrust at this scale may also be affected by chamber pressure adjustment, shield attitude correction, cutter engagement, cutter wear, and short-term operational control. Therefore, this peak was treated as a local fluctuation superimposed on the overall increasing trend associated with the hard-rock-to-sandy-strata transition.
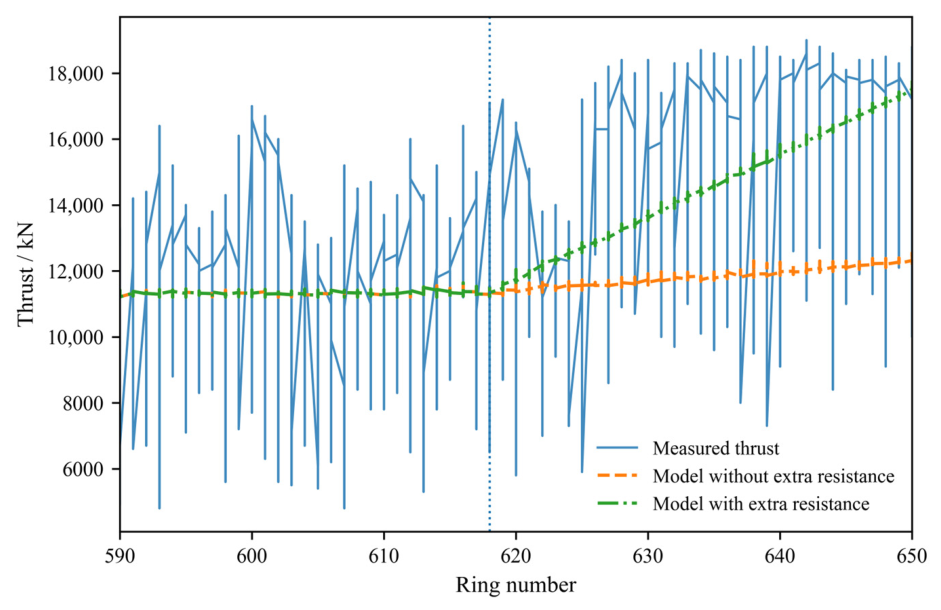
The calibrated model was then evaluated using the independent Basi right-line data from Rings 590–650, as shown in Figure 5. In this interval, the shield advanced from a hard-rock section into a hard-rock–sandy-strata transition zone. In the stable hard-rock section of Rings 590–617, the measured mean thrust was 13,216.4 kN, whereas the calculated mean thrust was 11,322.8 kN, indicating a baseline difference between the Dandan and Basi intervals. This difference may be related to variations in construction control, machine condition, chamber pressure setting, shield attitude adjustment, and local geological conditions. Despite this baseline difference, the model with the η -related additional resistance term significantly improved the validation performance. In the Basi validation interval, the RMSE decreased from 4222.4 kN to 2588.7 kN, the MAE decreased from 3672.7 kN to 2202.8 kN, and the MAPE decreased from 22.56% to 14.25% after introducing k e x t r a η ( z ) . The R2 value increased from −1.975 to −0.118.
The section-averaged comparison further supports this interpretation. In the Dandan calibration interval, the measured mean thrust increased from 11,616.2 kN in the hard-rock section to 15,889.2 kN in the sandy transition section, while the corresponding calculated values were 11,616.2 kN and 16,232.0 kN. In the Basi validation interval, the measured mean thrust increased from 13,216.4 kN in the hard-rock section to 17,759.5 kN in the sandy transition section, while the calculated values were 11,322.8 kN and 16,493.3 kN. Although the Basi interval exhibited an interval-specific baseline offset, the thrust increase associated with the growth of η (z) was captured more reasonably after the additional resistance term was introduced. The error metrics of the total thrust model in the calibration and independent validation intervals are summarized in Table 3.
A Wilcoxon signed-rank test was further performed on the paired absolute errors of the models with and without the η-related additional resistance term. For the Dandan calibration interval, the median absolute error decreased from 2035.41 kN to 1230.09 kN, corresponding to a reduction of 39.57% (one-sided p < 0.001). For the independent Basi validation interval, the median absolute error decreased from 4251.45 kN to 2095.79 kN, corresponding to a reduction of 50.70%; the mean absolute error also decreased from 3672.67 kN to 2202.81 kN, corresponding to a reduction of 40.02% (one-sided p < 0.001). These results indicate that the improvement introduced by the η -related additional resistance term is statistically significant and has a clear engineering magnitude.
Overall, the independent validation results indicate that the η-related additional resistance term is useful for describing the increase in total thrust during the transition from hard rock to sandy strata. However, the remaining error and the negative R2 value in the Basi interval show that the model should be interpreted as a mechanism-informed semi-empirical model rather than a universal high-precision prediction model. The absolute thrust level may still be affected by interval-specific factors such as chamber pressure control, shield attitude adjustment, cutter wear, and local ground disturbance.

4.2. Calibration, Independent Validation, and Baseline Effect of the Cutterhead Torque Model

4.2.1. Engineering-Equivalent Torque Model and Parameter Calibration

Cutterhead torque is influenced not only by excavation-face composition, but also by penetration rate, cutterhead rotational speed, cutter engagement, muck flow state, chamber condition, and short-term operational control. Therefore, compared with total thrust, cutterhead torque usually contains stronger high-frequency fluctuations and is more difficult to describe using a single geological variable. Because the individual torque components cannot be identified separately from the field monitoring data, an engineering-equivalent torque model was adopted:
M ( z ) = M 0 + k p ( P R P R 0 ) + k n ( ω ω 0 ) + k η η ( z )
where M 0 is the basic torque in the stable hard rock section; P R is the penetration rate; ω is the cutterhead rotational speed, ω 0 is the reference cutterhead rotational speed, taken as the mean cutterhead rotational speed in the stable hard-rock section used for parameter identification; ( ω ω 0 ) therefore represents the deviation of cutterhead rotational speed from the reference hard-rock tunneling condition; and k p , k n , and k η are parameters to be fitted. This equation can be regarded as a low-dimensional equivalent expression of the theoretical cutterhead torque model at the ring scale.
To avoid circular validation, all torque-model parameters were identified only from the Dandan right-line calibration interval. The Basi right-line interval from Rings 590–650 was used exclusively for independent validation and was not involved in the fitting of M 0 , k p , k n , or k η . For the ring-scale model, the fitted coefficients were M 0 = 3100.43, k p = 37.23, k n = −1395.42, and k η = 377.78. For the original time-scale data, the fitted k η was only 0.57, indicating that the η -related torque contribution is difficult to identify from high-frequency raw data.

4.2.2. Strict Independent Validation Using the Basi Interval

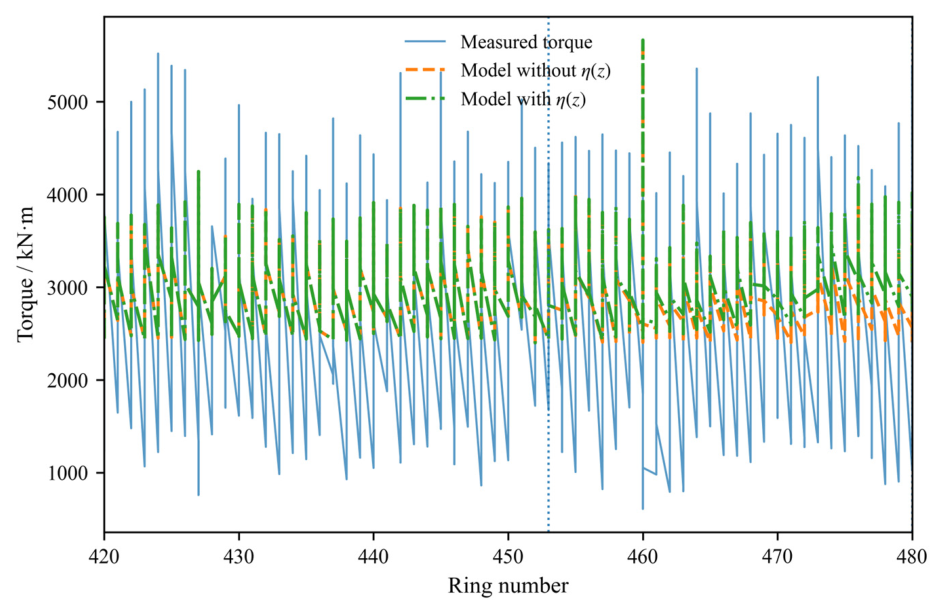
Figure 6 shows the time-scale calibration result of the cutterhead torque model in the Dandan right-line interval. This figure is retained to illustrate the behavior of the torque model at the original data scale. It should be emphasized that this is a calibration result rather than an independent validation result. The measured torque exhibits strong high-frequency fluctuations, and the model mainly follows the mean torque level rather than the instantaneous variations.
For the Dandan calibration interval at the time scale, the MAPE values of the models without and with the η-related term were both 18.35%, and the corresponding R2 values were both approximately 0.149. This indicates that introducing the η -related torque term did not improve the model performance at the original data scale. When the Dandan-calibrated model was directly applied to the independent Basi validation interval, the MAPE values of the models without and with the η -related term were 49.37% and 49.36%, respectively. The corresponding R2 values were −4.595 and −4.593. These results show that the η -related term has almost no identifiable contribution to the raw time-scale torque data.
The poor performance at the time scale is mainly attributed to the strong operational variability of cutterhead torque. Instantaneous torque is affected by penetration-rate adjustment, cutterhead rotational-speed fluctuation, shield attitude correction, cutter engagement, muck accumulation, and chamber flow condition. These factors can mask the relatively weak geological signal associated with the gradual increase in η (z). Therefore, the original time-scale torque data are not suitable for directly evaluating the geological contribution of the face sand fraction.

4.2.3. Ring-Scale Independent Validation and Baseline Correction

To reduce the influence of high-frequency operational fluctuations, the original torque data were averaged by ring number, and the ring-scale torque model was then evaluated. Ring-scale averaging reduces the variance of the measured data and makes the mean torque trend clearer. However, this statistical smoothing effect should not be interpreted as direct evidence that the torque model fully captures the geological signal.
In the strict independent validation using the Basi ring-scale data, the Dandan-calibrated torque model still showed a clear systematic deviation. For Rings 590–650, the MAPE values of the models without and with the η -related term were 48.52% and 44.07%, respectively. For the transition section of Rings 618–650, the corresponding MAPE values were 41.60% and 37.54%. Although the η -related term slightly reduced the prediction error at the ring scale, the strict validation error remained large. This indicates that the absolute torque level in the Basi interval could not be directly reproduced using the torque baseline identified from the Dandan interval.
A clear interval-specific baseline offset was observed in the Basi validation interval. In the stable hard-rock section of Rings 590–617, the measured mean torque was 2628.57 kN·m, whereas the strict model prediction was 1245.57 kN·m. This indicates that the Basi interval had a higher torque baseline than the Dandan calibration interval. The difference may be related to machine condition, cutter wear, operator control, chamber pressure setting, muck flow state, and local lithological differences.
To diagnose this effect, a constant baseline offset was introduced:
M c o r r = M m o d e l + b M
where b M is the interval-specific torque baseline offset. It was determined only from the stable hard-rock section of the Basi interval:
b M = M ¯ measured , hard M ¯ model , hard
where M ¯ measured , hard and M ¯ model , hard are the mean measured torque and the mean model-predicted torque in the stable hard-rock section of the Basi interval, respectively. This correction does not change the coefficients M 0 , k p , k n , or k η calibrated from the Dandan interval. It only compensates for the overall torque-level difference between the two intervals.
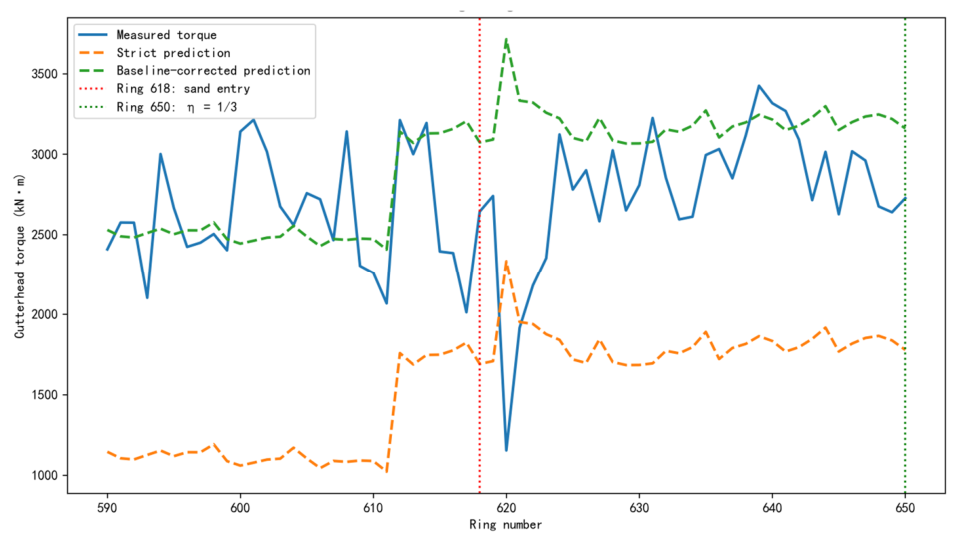
As shown in Figure 7, the strict prediction obtained using the Dandan-calibrated torque model was systematically lower than the measured torque in the Basi validation interval. After adding the baseline offset b M , determined from the stable hard-rock section of Rings 590–617, the predicted torque level became much closer to the measured ring-scale torque. This indicates that the cross-interval torque error was mainly caused by an interval-specific baseline difference.
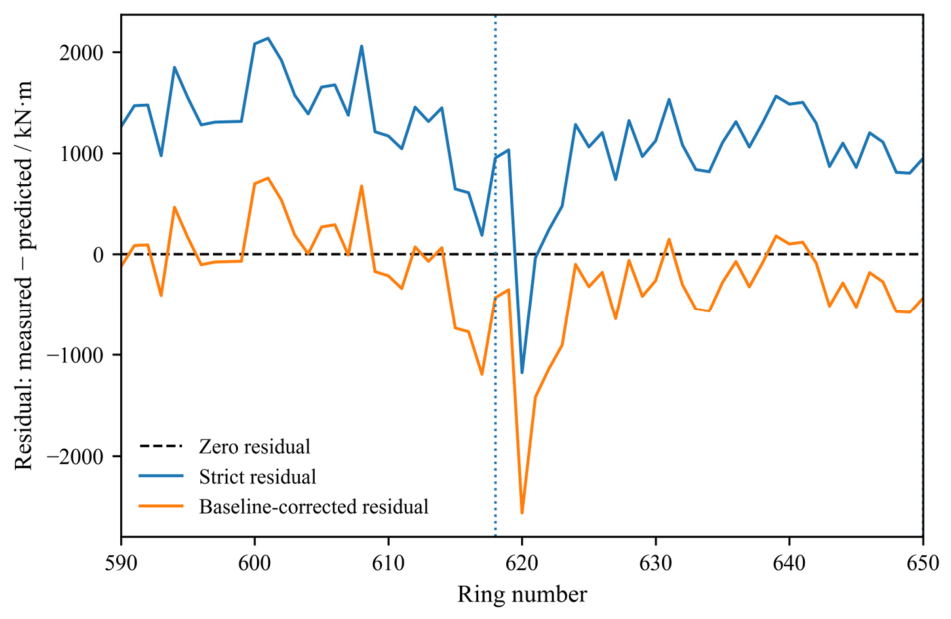
The residual comparison in Figure 8 further confirms this interpretation. Before baseline correction, the residuals were mainly positive, reflecting systematic underestimation of the Basi torque level. After baseline correction, the residuals were substantially reduced and fluctuated around zero, although local residual variations remained because of short-term operational variability, cutter engagement, muck flow state, and construction control.
The calibration and validation errors of the cutterhead torque model are summarized in Table 4. After baseline correction, the ring-scale validation MAPE over Rings 590–650 decreased from 44.07% to 17.25% for the model with the η -related term. For the transition section of Rings 618–650, the MAPE decreased from 37.54% to 21.52%. These results show that the baseline offset is the dominant source of cross-interval torque error. However, the additional improvement introduced by the η -related torque term after baseline correction was limited. For Rings 590–650, the MAPE decreased only from 17.78% without the η term to 17.25% with the η term. For Rings 618–650, the MAPE decreased from 22.20% to 21.52%. Therefore, the η -related torque contribution is much weaker than the corresponding η -related thrust contribution.
A Wilcoxon signed-rank test was also performed on the paired absolute errors of the torque models with and without the η -related term. For the Dandan ring-scale calibration interval, the η -related term did not significantly reduce the absolute prediction error (one-sided p = 0.575), and the MAPE slightly increased from 10.379% to 10.432%. In the strict Basi validation over Rings 590–650, the η -related term reduced the absolute error (one-sided p < 0.001), but the overall validation error remained high, with the MAPE decreasing only from 48.520% to 44.070%. After applying the interval-specific baseline correction, the MAPE over Rings 590–650 decreased from 17.781% to 17.248%, and the median absolute error decreased by only 3.67% (one-sided p = 0.014). For the transition section of Rings 618–650, the baseline-corrected MAPE decreased from 22.198% to 21.524%, with a median absolute error reduction of only 2.70% (one-sided p = 0.049). These results indicate that the η -related torque contribution is statistically detectable in the Basi validation interval, but its engineering improvement is limited. Therefore, cutterhead torque should still be interpreted as a weakly η -correlated response parameter dominated by interval-specific baseline effects and operational variability.

4.2.4. Interpretation of the Torque Response

The above results indicate that cutterhead torque should be regarded as a weakly η-correlated response parameter. At the original time scale, the measured torque is dominated by high-frequency operational fluctuations, and the η -related term provides almost no improvement. At the ring scale, data averaging suppresses part of the operational noise and makes the mean trend clearer. However, the improvement in apparent model performance is mainly caused by noise reduction and baseline correction, rather than by a strong independent contribution of η (z).
Compared with total thrust, cutterhead torque is more sensitive to machine condition, cutter wear, penetration-rate adjustment, cutterhead rotational-speed fluctuation, chamber state, and muck flow behavior. The geological signal associated with the gradual increase in face sand fraction exists, but it is weaker than the operational and interval-specific effects. Therefore, the cutterhead torque model in this study should be interpreted as an auxiliary semi-empirical diagnostic model rather than a high-precision prediction model based solely on excavation-face composition.

5. Discussion

In this study, mechanism-informed semi-empirical models and engineering-equivalent validation models were established for total thrust and cutterhead torque, respectively.

5.1. Differential Responses of Total Thrust and Cutterhead Torque

5.1.1. Total Thrust as a Strongly Correlated Response Parameter

The total thrust shows a clear increasing trend with the increase in the face sand fraction η ( z ) . Its variation is mainly governed by face resistance and additional resistance. After the additional resistance term was introduced, the model fitting accuracy was markedly improved. This demonstrates that the additional resistance induced by soil flow, accumulation, and wrapping effects after sandy strata enter the excavation face cannot be neglected.

5.1.2. Cutterhead Torque as a Weakly Correlated Response Parameter

At the time scale, cutterhead torque is strongly affected by construction operations and exhibits pronounced fluctuations. At the ring scale, however, its variation trend shows a certain consistency with ground variation. The model validation results reveal that the response of cutterhead torque to ground variation is weaker than that of total thrust. Its variation is affected not only by ground properties, but also by penetration rate, cutterhead rotational speed, and soil flow conditions.

5.2. Engineering-Equivalent Interpretation of Additional Resistance and Additional Torque

In the total thrust model, the introduction of the additional resistance term k e x t r a η ( z ) effectively corrects the underestimation of the traditional model in the sandy strata section. From a mechanical perspective, this additional term can be interpreted as the combined effect of flow resistance, accumulation resistance, and shield-wrapping effects generated after sandy strata enter the excavation face.
The additional resistance can be further expressed as the integral of the additional resistance per unit area within the sandy strata region:
F e x t r a ( z ) = A s ( z ) q e x t r a ( x , y ; z ) d A
Equation (44) can be simplified as
F e x t r a ( z ) = k e x t r a η ( z )
This transformation should be interpreted as an engineering-equivalent parameterization rather than an independent physical derivation. The term k e x t r a η ( z ) is introduced to represent, in a lumped form, the additional resistance associated with soil flow, accumulation, wrapping, and enhanced friction after sandy strata enter the excavation face. The coefficient k e x t r a is calibrated from field data and therefore remains a semi-empirical correction parameter rather than an independently measured material property.

5.3. Scale Effect and Interpretation of Cutterhead Torque Response

The comparison between the time-scale and ring-scale torque results indicates that cutterhead torque is strongly affected by data scale. At the original time scale, the measured torque contains pronounced short-term fluctuations caused by penetration-rate adjustment, cutterhead rotational-speed variation, cutter engagement, muck flow state, chamber condition, shield attitude correction, and operational control. These fluctuations can mask the relatively weak response associated with the gradual change in excavation-face composition. Therefore, the η ( z ) -related torque contribution is difficult to identify directly from high-frequency raw data.
After averaging the torque data by ring number, the high-frequency fluctuations are reduced and the mean torque trend becomes clearer. However, this ring-scale treatment should be interpreted as a smoothing and diagnostic procedure rather than direct evidence that the torque model fully captures the geological signal. Aggregation reduces the variance of the measured data and may improve apparent error metrics even when the model mainly follows the mean torque level. Therefore, the improvement observed at the ring scale should not be overinterpreted as a purely mechanistic improvement of the torque model.
The independent Basi validation further shows that the absolute torque level is strongly affected by interval-specific baseline differences. In the strict validation, the Dandan-calibrated torque model underestimated the Basi torque level. After introducing an interval-specific baseline offset determined from the stable hard-rock section of the Basi interval, the predicted torque became closer to the measured ring-scale torque. This indicates that cross-interval torque error is dominated by baseline effects associated with machine condition, cutter wear, chamber pressure setting, muck flow state, operator control, and local lithological differences. Given that the interval-specific baseline offset b M is approximately 1383 kN·m, which is on the order of 55% of the measured torque level in the stable hard-rock section of the Basi interval, the torque model should be interpreted as capturing the relative η -related response rather than directly transferring the absolute torque level across projects without recalibration.
Compared with total thrust, cutterhead torque exhibits a much weaker and less stable correlation with the face sand fraction η ( z ) . The η ( z ) -related torque term is statistically detectable in the Basi validation interval, but its engineering improvement after baseline correction is limited. Therefore, cutterhead torque should be interpreted as a weakly η ( z ) -correlated coupled-response parameter, rather than a direct amplitude-response parameter controlled mainly by excavation-face composition. In practical tunneling interpretation, torque variation should be analyzed together with operational parameters such as penetration rate, cutterhead rotational speed, chamber pressure, muck condition, and cutter wear state.

5.4. Limitations and Future Work

Although the proposed models can explain the tunneling response characteristics within the studied hard-rock-to-sandy-strata transition, several limitations remain. First, the η -related additional resistance coefficient k e x t r a is a semi-empirical correction parameter calibrated from field data. It represents the combined effects of soil flow, accumulation, wrapping, and enhanced friction in an engineering-equivalent form, but it is not an independently measured material parameter. Second, although the Basi interval was introduced as an independent validation dataset, the calibration data were obtained from Qingdao Metro Line 15, whereas the validation data were obtained from Qingdao Metro Line 5 and correspond to similar hard-rock-to-sandy-strata transition conditions. Therefore, the proposed model should not be regarded as a universal prediction framework for all soft–hard heterogeneous strata. The negative R2 values obtained in the independent Basi validation, including R2 = −0.118 for the thrust model with the η -related term and R2 = −0.998 for the baseline-corrected ring-scale torque model, further indicate that the models can reflect the η -driven response trend but cannot reproduce absolute load levels in an independent project without project-specific recalibration, which is consistent with their semi-empirical formulation. Third, several ground and operation-related parameters, such as Δ q , chamber pressure, soil conditioning state, and cutter wear, were simplified or not explicitly considered. Fourth, the cutterhead torque model showed a clear interval-specific baseline offset, indicating that torque is strongly influenced by machine condition, cutter wear, operator behavior, and operational control.
Future work should include additional tunneling intervals with different geological and operational conditions, incorporate chamber pressure and cutter wear indicators, and develop probabilistic or data-driven methods for identifying η (z) and baseline offsets during construction.

6. Conclusions

This study investigated the mechanical response characteristics of shield tunneling parameters in soft–hard heterogeneous strata. Mechanism-informed semi-empirical models and engineering-equivalent validation models were developed for total thrust and cutterhead torque, respectively, and were systematically validated using field tunneling data.
(1)
A continuous face sand fraction function η (z) was introduced as a mechanism-informed geometric descriptor of excavation-face composition during the transition from hard rock to sandy strata. This function is a continuous reformulation of existing face-composition concepts such as rock/sand ratio and composite ratio, rather than a completely independent geological index.
(2)
The total thrust model calibrated using the Dandan right-line data was independently validated using the Basi right-line data from Rings 590–650. The η -related semi-empirical correction reduced the validation MAPE from 22.56% to 14.25%, indicating that the increase in total thrust during the hard-rock-to-sandy-strata transition can be partly explained by the growth of the face sand fraction.
(3)
Cutterhead torque showed a much weaker response to the face sand fraction than total thrust. In strict cross-interval validation, the torque error was large because of interval-specific baseline differences. After applying a baseline correction determined from the Basi hard-rock section, the ring-scale MAPE decreased from 44.070% to 17.248%. The η -related torque term produced only a limited additional improvement, reducing the baseline-corrected MAPE from 17.781% to 17.248%. Although this reduction was statistically detectable in the Basi validation interval, the magnitude of improvement was small, indicating that cutterhead torque is mainly governed by operational variability, machine condition, and cutter wear rather than by face sand fraction alone.
(4)
The proposed approach should be regarded as a field-based, mechanism-informed semi-empirical analysis method for similar hard-rock-to-sandy-strata transition zones. It provides a practical reference for interpreting tunneling parameter responses and identifying interface-related changes, but it should not be generalized as a universal prediction framework without further validation in additional projects and geological settings.

Author Contributions

Conceptualization, G.Z., X.W., and D.W.; methodology, G.Z.; formal analysis, G.Z.; validation, G.Z., D.W. and X.W.; investigation, M.J., Z.W. and J.Z.; resources, X.W., D.W., and M.J.; data curation, G.Z. and M.J.; writing—original draft preparation, G.Z., and D.W.; writing—review and editing, X.W. and D.W.; visualization, G.Z.; supervision, X.W. and D.W.; project administration, X.W. and D.W. All authors have read and agreed to the published version of the manuscript.

Funding

This research was funded by the National Key Research and Development Program of China, grant number 2023YFC2907601; the National Natural Science Foundation of China, grant number 52204115; the Fundamental Research Funds for the Central Universities, grant number 2024XJJD01; and China University of Mining and Technology (Beijing) Training Program of Innovation and Entrepreneurship for Undergraduates, grant number 202513006 & 202513007.

Institutional Review Board Statement

Not applicable.

Informed Consent Statement

Not applicable.

Data Availability Statement

The data supporting the findings of this study are available from the corresponding author upon reasonable request. However, the data are not publicly available due to restrictions related to the engineering project and data-use agreements under which the data were obtained.

Acknowledgments

The authors would like to thank the project teams of the Dandan–Dandan South shield tunnel section of Qingdao Metro Line 15 and the Bahaomatou–Sifangchang shield tunnel section of Qingdao Metro Line 5 for providing geological information and shield tunneling monitoring data.

Conflicts of Interest

Author Mingtao Ji was employed by Qingdao Metro Group Co., Ltd. The remaining authors declare that the research was conducted in the absence of any commercial or financial relationships that could be construed as a potential conflict of interest.

References

  1. Maidl, B.; Herrenknecht, M.; Anheuser, L. Mechanised Shield Tunnelling; Ernst & Sohn: Berlin, Germany, 1996. [Google Scholar]
  2. Japan Society of Civil Engineers. Standard Specifications for Shield Tunneling and Commentary; Zhu, W., Translator; China Architecture & Building Press: Beijing, China, 2001. (In Chinese) [Google Scholar]
  3. Wang, H.X.; Fu, D.M. Study on the mathematical and physical model of earth pressure balance shield tunneling and the relationship among tunneling parameters. China Civ. Eng. J. 2006, 39, 86–90. (In Chinese) [Google Scholar]
  4. Hu, G.L.; Gong, G.F.; Yang, H.Y. Realization of earth pressure balance in shield tunneling machine. J. Zhejiang Univ. Eng. Sci. 2006, 40, 874–877. (In Chinese) [Google Scholar]
  5. Wang, H.X.; Fu, D.M. Theory and experimental study on balance control of earth pressure balance shield tunneling. China Civ. Eng. J. 2007, 40, 61–68. (In Chinese) [Google Scholar]
  6. Tóth, Á.; Gong, Q.; Zhao, J. Case studies of TBM tunneling performance in rock–soil interface mixed ground. Tunn. Undergr. Space Technol. 2013, 38, 140–150. [Google Scholar] [CrossRef]
  7. Ma, H.; Yin, L.; Gong, Q.; Wang, J. TBM tunneling in mixed-face ground: Problems and solutions. Int. J. Min. Sci. Technol. 2015, 25, 641–647. [Google Scholar] [CrossRef]
  8. Gong, Q.; Yin, L.; Ma, H.; Zhao, J. TBM tunnelling under adverse geological conditions: An overview. Tunn. Undergr. Space Technol. 2016, 57, 4–17. [Google Scholar] [CrossRef]
  9. Shirlaw, J.N. Pressurised TBM tunnelling in mixed face conditions resulting from tropical weathering of igneous rock. Tunn. Undergr. Space Technol. 2016, 57, 225–240. [Google Scholar] [CrossRef]
  10. Zhao, J.; Gong, Q.M.; Eisensten, Z. Tunnelling through a frequently changing and mixed ground: A case history in Singapore. Tunn. Undergr. Space Technol. 2007, 22, 388–400. [Google Scholar] [CrossRef]
  11. Kong, X.; Tang, L.; Ling, X.; Li, H. Development of shield model test system for studying the bias load of shield in soil-rock compound strata. Tunn. Undergr. Space Technol. 2024, 143, 105464. [Google Scholar] [CrossRef]
  12. Hu, X.; Wang, J.; Fu, W.; Ju, J.W.; He, C.; Fang, Y. Laboratory test of EPB shield tunneling in mixed-face conditions. Int. J. Geomech. 2021, 21, 04021161. [Google Scholar] [CrossRef]
  13. Fu, X.; Gong, Q.; Wu, Y.; Zhao, Y.; Li, H. Prediction of EPB shield tunneling advance rate in mixed ground condition using optimized BPNN model. Appl. Sci. 2022, 12, 5485. [Google Scholar] [CrossRef]
  14. Zhai, S.; Song, Y.; Tian, H. Development of thrust, torque, and power estimation model, and prediction performance of earth pressure balance tunnel boring machine in mixed-face strata. Appl. Sci. 2024, 14, 5887. [Google Scholar] [CrossRef]
  15. González, C.; Arroyo, M.; Gens, A. Thrust and torque components on mixed-face EPB drives. Tunn. Undergr. Space Technol. 2016, 57, 47–54. [Google Scholar] [CrossRef]
  16. Shi, H.; Gong, G.F.; Yang, H.Y.; Wang, H. Determination of thrust force for shield tunneling machine. J. Zhejiang Univ. Eng. Sci. 2011, 45, 126–131. (In Chinese) [Google Scholar]
  17. Su, J.X.; Gong, G.F.; Yang, H.Y. Calculation and experimental research for tunneling total thrust of earth pressure balance shield. Constr. Mach. Equip. 2008, 39, 13–16. (In Chinese) [Google Scholar]
  18. Chen, R.P.; Liu, Y.; Tang, L.J.; Zhou, B.S. Research on calculation of thrust and cutterhead torque on shield in complex strata. J. Undergr. Space Eng. 2012, 8, 26–32. (In Chinese) [Google Scholar]
  19. Wang, H.X. Calculation of cutterhead torque for EPB shield and its relationship with shield construction parameters. China Civ. Eng. J. 2009, 42, 109–113. (In Chinese) [Google Scholar]
  20. Lyu, Q.; Fu, D.M. Experimental study on cutterhead torque of earth pressure balance shield machine. Chin. J. Rock Mech. Eng. 2006, 25, 3137–3143. (In Chinese) [Google Scholar]
  21. Zhong, X.C.; Lin, J.; Liu, H.Z. Mechanical model of cutterhead torque for earth pressure balance shield machine. Rock Soil Mech. 2006, 27, 821–824. (In Chinese) [Google Scholar]
  22. Zhou, X.P.; Zhai, S.F. Estimation of the cutterhead torque for earth pressure balance TBM under mixed-face conditions. Tunn. Undergr. Space Technol. 2018, 74, 217–229. [Google Scholar] [CrossRef]
  23. Zhao, Y.; Gong, Q.; Tian, Z.; Zhou, S.; Jiang, H. Torque fluctuation analysis and penetration prediction of EPB TBM in rock–soil interface mixed ground. Tunn. Undergr. Space Technol. 2019, 91, 103002. [Google Scholar] [CrossRef]
  24. Godinez, R.; Yu, H.; Mooney, M.; Gharahbagh, E.A.; Frank, G. Earth pressure balance machine cutterhead torque modeling: Learning from machine data. In Proceedings of the Rapid Excavation and Tunneling Conference, New Orleans, LA, USA, 7–10 June 2015; pp. 1261–1271. [Google Scholar]
Figure 1. Geological profile of the Dandan–Dandan South right-line calibration interval, with the calibration segment of Rings 420–480 highlighted. The colored bands indicate different strata, the black dashed lines denote the tunnel profile, and the red box highlights the selected calibration segment.
Applsci 16 06388 g001
Figure 2. Geological profile of the Bahaomatou–Sifangchang right-line validation interval, with Rings 590–650 highlighted. The colored bands indicate different strata, the black dashed lines denote the tunnel profile, and the red box highlights the selected validation segment.
Applsci 16 06388 g002
Figure 3. Piecewise linear construction of the face sand fraction function η(z): (a) Dandan right-line calibration interval, where η(z) increases from 0 at Ring 453 to 1/3 at Ring 480; (b) Basi right-line validation interval, where η(z) increases from 0 at Ring 618 to 1/3 at Ring 650.
Applsci 16 06388 g003
Figure 4. Calibration result of the total thrust model in the Dandan right-line interval. The blue dashed line indicates the position where sandy strata began to enter the excavation face near Ring 453.
Applsci 16 06388 g004
Figure 5. Independent validation of the total thrust model in the Basi right-line interval.
Applsci 16 06388 g005
Figure 6. Time-scale calibration result of the cutterhead torque model in the Dandan right-line interval.
Applsci 16 06388 g006
Figure 7. Independent validation of the ring-scale cutterhead torque model in the Basi right-line interval before and after baseline correction.
Applsci 16 06388 g007
Figure 8. Residual comparison of the cutterhead torque model in the Basi validation interval.
Applsci 16 06388 g008
Table 1. Order-of-magnitude estimation of secondary resistance terms in the Dandan section.
TermTreatment or Estimation MethodEstimated Value/kNPercentage of Measured Thrust
Penetration-related resistance F 3 Incorporated into the equivalent hard-rock face resistance
Grade-induced resistanceMain-machine weight, 381 t100.90.56–0.92%
Grade-induced resistance, conservative estimateMain-machine-related weight, 449 t118.90.66–1.08%
Curve-related resistance μ = 0.25, shield length = 8.475 m, curve radius = 1200 m6.60.04–0.06%
Curve-related resistance, conservative estimateConservative weight, 449 t7.80.04–0.07%
Tail seal, trailing, and other secondary resistance Included   in   F a 3001.7–2.7%
Combined secondary resistance Grade + curve + F a 407.52.3–3.7%
Combined secondary resistance, conservative estimateConservative weight426.72.4–3.9%
Table 2. Main parameters of the ϕ 6450 mm composite earth pressure balance (EPB) shield machine.
SystemParameterValue
Main drive systemMain bearing typeThree-row cylindrical roller bearing
Main bearing diameter3610 mm
Drive typeElectric drive
Number of drive motors8
Power per motor250 kW
Total power2000 kW
Rotation speed0–5.34 rpm
Rated torque7200 kN·m
Maximum torque7920 kN·m
Main bearing sealing2 finger seals + 1 lip-type polyurethane seal
Shield bodyFront shield diameter6450 mm
Middle shield diameter6440 mm
Tail shield diameter6430 mm
Tail sealing3 rows of tail brushes
Thrust systemNumber of hydraulic cylinders23
Cylinder specification260/190–2150 mm
Maximum working pressure35 MPa
Maximum advance rate80 mm/min
Articulation systemArticulation typeActive articulation
Number of articulation cylinders14
Cylinder specification310/210–200 mm
Maximum thrust36,964 kN
Sealing typeDouble combined seals
Maximum pressure resistance1 MPa
Table 3. Error metrics of the total thrust model in the calibration and independent validation intervals.
DatasetModelRMSE/kNMAE/kNMAPE/%R2
Dandan calibrationwithout extra term3178.22396.415.87−0.426
Dandan calibrationwith extra term2518.91725.711.740.104
Basi validationwithout extra term4222.43672.722.56−1.975
Basi validationwith extra term2588.72202.814.25−0.118
Table 4. Calibration and validation results of the cutterhead torque model.
Data ScaleDatasetValidation TypeModelMAPE/%R2
Time scaleDandan calibrationCalibration without   η 18.3450.149
Time scaleDandan calibrationCalibration with   η 18.3450.149
Time scaleBasi 590–650Strict validation without   η 49.372−4.595
Time scaleBasi 590–650Strict validation with   η 49.364−4.593
Time scaleBasi 590–650Baseline-corrected with   η 25.767−0.256
Ring scaleDandan calibrationCalibration without   η 10.3790.214
Ring scaleDandan calibrationCalibration with   η 10.4320.219
Ring scaleBasi 590–650Strict validation without   η 48.520−10.978
Ring scaleBasi 590–650Strict validation with   η 44.070−8.973
Ring scaleBasi 590–650Baseline-corrected without   η 17.781−1.171
Ring scaleBasi 590–650Baseline-corrected with   η 17.248−0.998
Ring scaleBasi 618–650Strict validation without   η 41.603−7.073
Ring scaleBasi 618–650Strict validation with   η 37.539−5.584
Ring scaleBasi 618–650Baseline-corrected without   η 22.198−1.613
Ring scaleBasi 618–650Baseline-corrected with   η 21.524−1.419
Disclaimer/Publisher’s Note: The statements, opinions and data contained in all publications are solely those of the individual author(s) and contributor(s) and not of MDPI and/or the editor(s). MDPI and/or the editor(s) disclaim responsibility for any injury to people or property resulting from any ideas, methods, instructions or products referred to in the content.