Article

A Fault Diagnosis Framework for Rolling Bearings Based on PPCA-AR Anti-Interference Preprocessing and LSTM

by
Shenglin Song
1,2,
Chunhui Zhu
2,
Shilong Zhang
2,
Wangshen Hao
2,*,
Jieang Zhao
1 and
Song Jin
1
1
Jinhua Special Equipment Inspection and Testing Institute, Jinhua 321000, China
2
School of Mechanical and Power Engineering, Zhengzhou University, Zhengzhou 450001, China
*
Author to whom correspondence should be addressed.
Appl. Sci. 2026, 16(17), 8878; https://doi.org/10.3390/app16178878
Submission received: 24 June 2026 / Revised: 30 August 2026 / Accepted: 3 September 2026 / Published: 7 September 2026

Abstract

Prevailing rolling bearing fault diagnosis frameworks based on long short-term memory (LSTM) are susceptible to noise interference under industrial strong-noise working conditions, suffering from insufficient feature extraction capability and low diagnostic precision. To address these limitations, this paper proposes a fault diagnosis framework integrating deep learning with signal processing, which consists of probabilistic principal component analysis (PPCA) for noise suppression, the autoregressive (AR) model for discrete interference elimination, spectral kurtosis (SK) for fault feature enhancement, and LSTM-based intelligent classification. To improve the signal-to-noise ratio (SNR) of vibration signals, the proposed method first estimates and suppresses noise via PPCA, and then eliminates periodic discrete frequency interferences represented by gear meshing components using the AR model. Following interference suppression, the SK method is adopted to implement multi-scale resonant frequency band screening and envelope demodulation. Finally, the demodulated features are learned by the LSTM to realize intelligent fault diagnosis of rolling bearings. This novel approach not only improves fault diagnosis accuracy but also enhances the model interpretability with the aid of signal processing techniques. Experimental results on the Case Western Reserve University (CWRU) and industrial field datasets demonstrate that the proposed method achieves superior accuracy compared with state-of-the-art approaches under various SNR conditions. It effectively mitigates the accuracy degradation of deep learning diagnostic models in strong-noise environments, providing a reliable technical solution for the intelligent diagnosis of rolling bearings.

1. Introduction

Rolling bearings serve as indispensable core supporting components for a wide range of equipment, including lifting machinery, elevator traction mechanisms and industrial vehicles [1,2,3]. Subjected to long-term variable-load operation in lifting machinery, frequent start–stop cycles of elevator traction systems, and transient road impact loads during the operation of industrial vehicles, rolling bearings undergo accelerated wear under such harsh operating conditions, which eventually leads to various types of local structural damage. Once bearing failure occurs, it not only causes economic losses arising from equipment shutdown, but also triggers severe safety hazards such as equipment damage and personal injury [4,5,6]. Accordingly, research into rolling bearing fault detection and recognition bears prominent practical engineering value. Among existing fault diagnosis technologies, vibration signals are the most widely adopted monitoring medium in this field, as they can directly capture periodic impulse features induced by local bearing defects. Nevertheless, field-measured vibration data are contaminated by multiple interference components such as ambient noise and gear meshing harmonics [7,8]. Weak impulse signatures originating from incipient bearing faults are easily submerged by background noise, which severely degrades the diagnosis accuracy of conventional diagnostic models. For this reason, the development of anti-interference fault diagnosis algorithms is of vital practical significance for engineering applications.
Local faults in rolling bearings generate impulse pulse signals characterized by quasi-periodic exponential attenuation [9]. To interpret fault information embedded in such vibration signals, early diagnostic studies adopted signal decomposition approaches including wavelet transform and empirical mode decomposition. Multi-scale decomposition of collected vibration signals enables the separation of fault-related components, thereby achieving effective extraction of bearing damage features. Jia et al. [10] constructed a multi-scale wavelet convolution module to divide signal frequency bands, and adaptively adjusted the weight of each fault feature channel via a kurtosis-oriented mechanism to mine damage characteristics. Bai et al. [11] integrated wavelet denoising, variational mode decomposition and a sparrow search algorithm to realize hierarchical signal decomposition and reconstruction, which improved the signal-to-noise ratio of bearing vibration signals and the accuracy of fault identification. To address the inherent limitations of empirical wavelet transform in handling non-stationary vibration signals, Gao et al. [12] introduced an amplitude distribution spectrum to remove the constraint of the preset decomposition mode number in this algorithm. Liang et al. [13] combined wavelet analysis with an improved domain-adaptive semi-supervised diagnostic network. They extracted deep damage features through a multi-source domain-adaptive network and realized fault classification based on pseudo-marginal vectors. As an efficient feature extraction tool for non-stationary vibration signals developed subsequent to wavelet analysis, spectral kurtosis quantifies the prominence of impulse pulses in the time–frequency plane and accurately locates the resonant frequency band corresponding to fault impulses. Rohan et al. [14] extracted impulse features by combining envelope spectrum analysis with the spectral kurtosis algorithm, and realized fault pattern diagnosis using a log-likelihood ratio classifier. Park et al. [15] integrated deep learning with traditional signal processing methods and optimized the interpretability of the intelligent diagnostic model via spectral kurtosis, thus realizing fault detection of rolling bearings under variable speed and variable-load conditions. Considering that strong noise and aperiodic interfering pulses severely degrade the analytical reliability of the traditional fast kurtogram, Wang et al. [16] proposed an energy spectral kurtosis indicator combined with high-order symmetric difference analysis.
In recent years, driven by the progressive evolution of a new generation of artificial intelligence technologies, intelligent online diagnosis techniques based on neural networks have triggered a research upsurge in the field of fault diagnosis. Breaking the limitations of traditional fault diagnosis methods that rely on manual feature extraction, such approaches have attracted extensive attention from researchers worldwide owing to their outstanding capability in adaptive feature mining for online equipment fault diagnosis. For rolling bearing fault diagnosis, Shao et al. [17] constructed an integrated hybrid diagnosis framework by combining the variational mode decomposition-discrete wavelet transform algorithm with a depthwise separable convolutional BiLSTM network embedded with a hybrid attention mechanism, which enables rolling bearing fault diagnosis across multiple datasets. Wu et al. [18] developed an intelligent diagnosis model integrating multi-scale convolutional neural networks, LSTM units and an attention mechanism. The proposed model can resist interferences from load fluctuations and ambient noise, thereby guaranteeing fault diagnosis accuracy under complex operating conditions. To address the drawbacks of the local mean decomposition method, Liang et al. [19] combined this method with a BiLSTM network, which effectively avoided waveform distortion during signal decomposition. Wu et al. [20] introduced a physics-driven feature enhancement strategy and performed fault diagnosis via an attention-optimized LSTM network, breaking through the technical bottlenecks of poor interpretability and limited generalization ability existing in conventional data-driven models. Based on image fusion technology and deep learning algorithms, Qiu et al. [21] designed an adaptive bearing fault diagnosis strategy to tackle practical engineering challenges, including the difficulty in extracting implicit features from vibration signals and data loss caused by sensor failures.
In summary, signal analysis algorithms such as wavelet transform and spectral kurtosis can reveal the inherent physical laws governing the fault evolution of rolling bearings. Nevertheless, their parameter configuration relies on manual operation, which imposes high requirements on the professional theoretical knowledge of researchers [22,23]. Data-driven diagnostic models constructed based on neural networks enable real-time online fault detection, whereas such purely data-driven approaches suffer from insufficient model interpretability [24,25]. At present, collaborative diagnostic strategies combining signal processing and deep learning are confronted with the following challenges. First, under the strong background noise of equipment operation, high-frequency noise degrades the discriminative capability of spectral kurtosis for fault features and reduces the diagnosis accuracy of deep learning models simultaneously [26,27,28,29], indicating that existing diagnostic algorithms possess weak robustness against noise interference. Second, a single neural network architecture fails to extract multi-scale fault features synchronously, and the model lacks the learning capacity to adaptively weight and focus on fault features.
To address the above issues, this paper proposes an intelligent diagnosis framework for rolling bearings integrating signal processing and deep learning. In the proposed framework, the PPCA and AR models are employed to eliminate noise and gear meshing interference components. Guided by multi-scale spectral kurtosis analysis, the framework adaptively extracts frequency bands containing fault impulses from interference-suppressed signals, and combines envelope demodulation with LSTM to realize online intelligent diagnosis of rolling bearings. Compared with the methods reported in [10,11,12,13,14,15,16], the proposed method develops an integrated processing framework combining feature selection and intelligent recognition, which enables the adaptive selection of critical parameters and the automatic output of fault diagnosis results. In contrast to those in [17,18,19,20,21], the proposed method fully accounts for the interference caused by on-site background noise and discrete harmonics. It maintains high diagnosis accuracy under low SNR working conditions and simultaneously improves the physical interpretability of the intelligent model. The main contributions of this work are summarized as follows:
  • A novel online intelligent diagnosis framework for rolling bearings is proposed. Free from manual parameter tuning, the framework possesses strong adaptability and stable diagnostic performance. It can maintain high diagnosis accuracy under low SNR conditions, overcoming the limitation that traditional diagnostic methods rely heavily on manually preset parameters.
  • Spectral kurtosis and envelope spectrum analysis modules are embedded into the proposed framework to improve the physical interpretability of the diagnostic method. Multi-scale feature mining of vibration signals is implemented via spectral kurtosis, and fault impulse features in the original signals are further enhanced by envelope spectrum analysis.
  • The PPCA and AR models are integrated into the diagnosis framework to strengthen the anti-interference capability of the intelligent diagnosis method. Such an integrated architecture simultaneously achieves dual objectives of background noise suppression and fault feature enhancement under various operating conditions.
  • Spectral kurtosis is utilized to adaptively determine the principal component dimension of the PPCA model, which eliminates the reliance on empirically manual parameter selection and improves the automation level of the model.

2. Methodology

2.1. PPCA Adaptive Denoising

PPCA is a noise reduction method based on a probabilistic framework. By maximizing the likelihood estimation of observed data, it projects high-dimensional time-domain data into a low-dimensional principal component subspace to realize noise separation [30,31,32]. Compared with traditional principal component analysis, PPCA introduces a Gaussian noise model, which enables more robust processing of data contaminated by strong noise.
Let the raw vibration signal matrix X = x 1 , x 2 , , x m R n × m be the observed data matrix, where x m denotes a one-dimensional signal, n is the length of raw data, and m represents the matrix dimension. The PPCA model is formulated as:
X = P · u + E ,
where P = { p 1 , p 2 , , p k } R n × k is the parameter matrix, k is the number of principal components satisfying the constraint k < n , u = { u 1 , u 2 , , u m } R k × m denotes the latent variable, and E is Gaussian noise with u N ( 0 , I ) , E N ( 0 , σ 2 I ) . Here, I is the identity matrix and σ 2 denotes the variance parameter of the noise. Accordingly, the observed data matrix X obeys the following Gaussian distribution:
X N 0 , P P T + σ 2 I .
The prior distribution of latent variable u is given by:
p ( u ) = ( 2 π ) k / 2 exp 1 2 σ 2 X T X .
The conditional prior probability distribution of observed data X given latent variable u is expressed as:
p ( X | u ) = ( 2 π ) n / 2 exp 1 2 σ 2 X P · u 2 .
From Equations (3) and (4), the probability distribution of the observed data X can be derived as:
p ( X ) = p ( X | u ) p ( u ) d X = ( 2 π ) n / 2 C 1 / 2 exp 1 2 X T C 1 X ,
where C = P P T + σ 2 I denotes the n × n covariance matrix jointly determined by parameters P and σ 2 .
The expectation-maximization method [33] is adopted to estimate parameters P and σ 2 of the above model, and the iterative update formulas are expressed as:
P ˜ = S P σ 2 I + M 1 P T S P 1 ,
σ ˜ 2 = 1 n tr S S P M 1 P ˜ T ,
where S = 1 m i = 1 m x i x i T is the covariance matrix of observed data, and M = P T P + σ 2 I is the k × k matrix after dimensionality reduction; tr ( · ) represents the trace of the matrix.
Parameters P and σ 2 can be obtained via iterative computation. Once these two parameters are determined, the PPCA model is constructed to extract principal component data, and the denoised signal is acquired through the following linear transformation:
u i = p i T X .
As shown in Equation (8), each principal component corresponds to the projection of the raw observed data X along the direction of the basis vector p i . This procedure realizes the separation of valid signal components and noise. With this linear projection transformation, the dimension-reduced PPCA denoising model is established to achieve the noise suppression goal for the original vibration signal.

2.2. Prewhitening Based on AR Model

Fault signals of rolling bearings are essentially stochastic rather than periodic, which distinguishes them from deterministic periodic components embedded in measured signals [9,34]. Although cyclostationary models are widely adopted to characterize such signals, bearing fault signals fail to satisfy the strict cyclostationary condition. Slight deviations commonly exist in bearing fault characteristic frequencies: variations in the position of rolling elements inside the bearing alter contact angles, and the ratio of local radial load to axial load continuously fluctuates during equipment operation [9]. Affected by the above factors, the fluctuation range of fault characteristic frequencies is approximately 1–2%. Unlike periodic gear vibration signals, bearing fault signals can be processed via various preprocessing algorithms to filter out periodic components and retain only transient impulses carrying fault information as well as stationary noise [35].
Linear prediction models are capable of extracting deterministic periodic components inside signals. The principle of this algorithm is summarized as follows: historical samples of time-series signals are employed to construct a prediction model, which is then used to infer the theoretical future sampled values of the time series. The residual signal that cannot be fitted by periodic rules is finally obtained by subtracting the predicted output from the original measured signal.
The AR model leverages its ability to fit the autocorrelation characteristics of signals to suppress periodic discrete frequency interferences such as gear meshing harmonics. The constructed AR model is expressed as:
x ( t ) = p = 1 q a ( p ) x ( t p ) + v ( t ) ,
where a ( p ) denotes the coefficient of the AR model, v ( t ) represents the residual signal, and t is the discrete time index. The AR coefficients are solved via the Yule–Walker equations, and the residual signal v ( t ) corresponds to the fault impulse-dominated signal after eliminating discrete periodic interferences. The model order q can be determined by information criteria or practical engineering requirements.
According to the convolution property of signals, the frequency-domain expression of Equation (9) is written as:
v ( f ) = x ( f ) a ( f ) ,
where f denotes the frequency variable. It can be concluded from Equation (10) that only stochastic components, i.e., transient impulses and stationary noise, are preserved. The time-domain signal v ( t ) corresponding to v ( f ) is defined as the prewhitened signal, and the above procedure is generally referred to as prewhitening.

2.3. Spectral Kurtosis-Based Fault Feature Enhancement

Spectral kurtosis is adopted to quantify the intensity of transient impulses embedded in time-frequency-domain signals. A larger SK value indicates more prominent fault impulse components within the measured signal [9,35]. Considering the Wold–Cramér decomposition for non-stationary stochastic processes, a zero-mean non-stationary random process x ( t ) can be formulated as:
x ( t ) = 1 / 2 + 1 / 2 H ( t , f ) e j 2 π f t d Z x ( f ) ,
where H ( t , f ) denotes the Fourier transform of the time-varying impulse response function, which can be regarded as the complex envelope of signal x ( t ) at frequency f; d Z x ( f ) represents the spectral increment. The term H ( t , f ) e j 2 π f t d Z x ( f ) is interpreted as the output of an infinitely narrow-band filter centered at frequency f at time instant t. Spectral kurtosis is defined as the fourth-order normalized cumulant of non-stationary stochastic processes:
K x ( f ) = H ( t , f ) 4 H ( t , f ) 2 2 2 ,
where · denotes the time-averaging operator, and the constant 2 is subtracted to compensate for the complex nature of H ( t , f ) .
Band-pass filtering is implemented on the frequency band corresponding to the maximum spectral kurtosis value to enhance weak fault impulse features. Multiple groups of impulse responses induced by rolling bearing faults cannot be directly separated via spectral analysis. Envelope demodulation is therefore performed on such signals to extract modulation information, which provides effective diagnostic evidence for fault classification [36]. The envelope spectrum can be obtained by applying the Hilbert transform to the filtered signal, so as to extract fault characteristic frequencies. The analytic signal of x ( t ) is constructed as:
z x ( t ) = x ( t ) + j x ˜ ( t ) ,
where x ˜ ( t ) is the signal obtained by shifting the phase of x ( t ) by 90 . The corresponding envelope signal of x ( t ) is written as:
z x ( t ) = x 2 ( t ) + x ˜ 2 ( t ) .

2.4. Intelligent Diagnosis Based on LSTM Network

The LSTM network is a special variant of the recurrent neural network (RNN). It inherits the capability of the RNN in establishing correlation models for time-series data. Meanwhile, by leveraging gated recurrent units to regulate the transmission of historical information among neurons, the LSTM network effectively addresses the vanishing and exploding gradient problems existing in traditional RNNs.
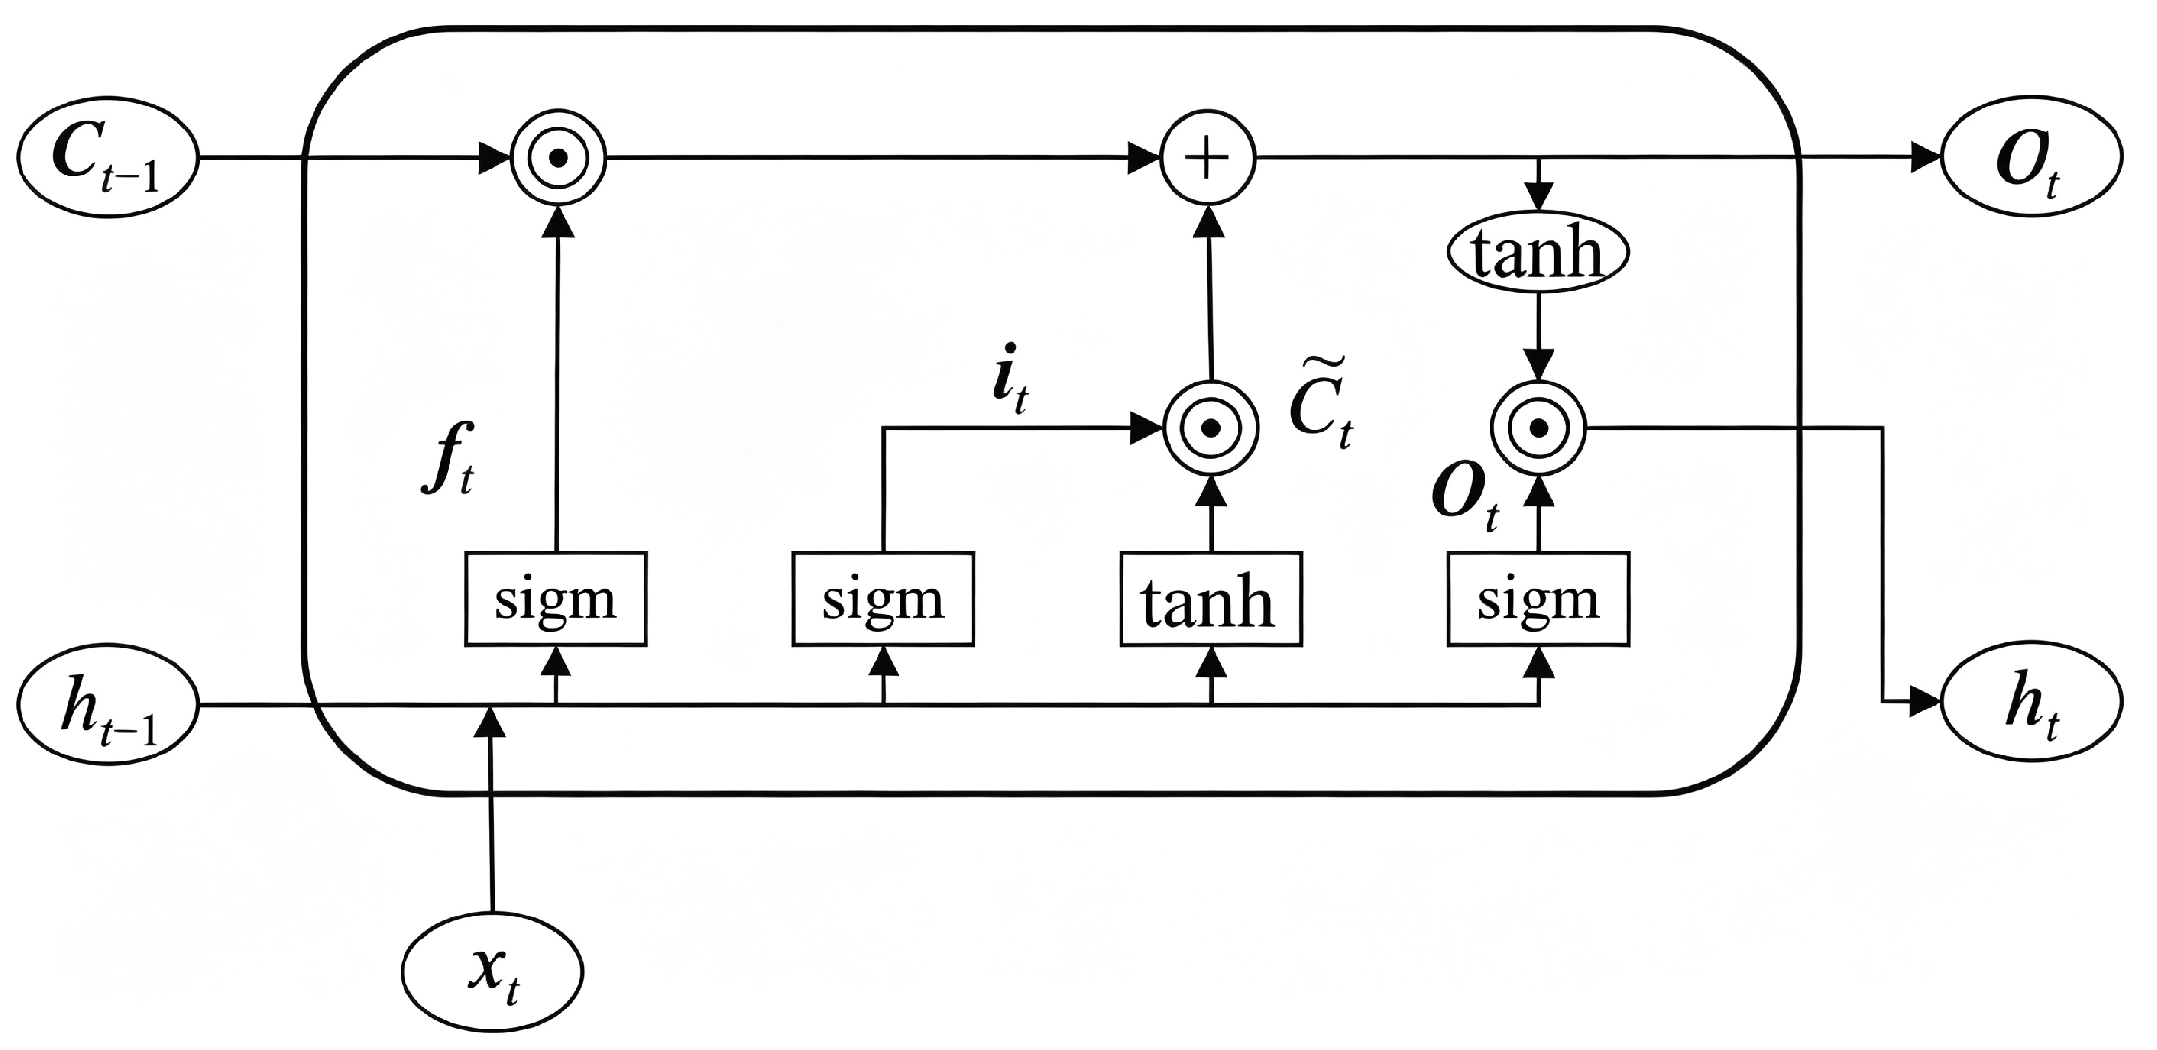
The LSTM is capable of modeling and analyzing long-term dependency information embedded within signals, and this prominent advantage has been extensively verified in existing research [37,38]. Figure 1 illustrates the most widely adopted standard LSTM cell structure. A novel memory cell C t is introduced in LSTM, which acts as an information transmission channel. It can not only transmit time-series information through linear recurrent loops, but also output feature information to the external hidden state h t via nonlinear mapping. The input gate i t , forget gate f t and output gate O t jointly govern the entire information flow path. The forget gate screens historical information to be discarded. It first reads the previous hidden state h t 1 and the current input signal x t , then assigns weight coefficients to the previous cell state C t 1 after data computation. The output of the forget gate ranges from 0 to 1, where 0 means complete discarding of historical information, and 1 represents full retention of historical information. The expression is as follows:
f t = sigm W f · [ h t 1 , x t ] + b f ,
where f t denotes the forget-gate output, sigm ( · ) represents the Sigmoid activation function, W f is the forget-gate weight matrix, and b f represents its bias parameter.
The input gate filters newly added feature information to be stored into the memory cell, which consists of two computational branches. The first branch adopts the Sigmoid function to assign input weights, while the second branch generates a brand-new candidate feature vector through nonlinear mapping with the tanh activation function. The corresponding formulas are given as follows:
i t = sigm W i · [ h t 1 , x t ] + b i ,
where W i and b i are the weight matrix and bias parameter of the input gate, respectively. The new candidate state C ˜ t of the memory cell is expressed as:
C ˜ t = tanh W c · [ h t 1 , x t ] + b c ,
where W c and b c represent the weight matrix and bias parameter for cell state updating.
The input gate completes the state iteration of the memory cell from C t 1 to C t . To constrain the interference of early memory on subsequent time-series features, the element-wise product is first calculated between the previous cell memory C t 1 and the forget-gate output f t , then the result is superimposed with i t · C ˜ t :
C t = f t · C t 1 + i t · C ˜ t .
The output gate filters the current cell state and outputs the hidden feature. This computation includes two steps: the Sigmoid function calculates the proportion of information to be output from the cell state, and the tanh function normalizes the cell state values. The final hidden output is obtained by element-wise multiplication of the two results:
O t = sigm W o · [ h t 1 , x t ] + b o ,
h t = O t · tanh C t ,
where W o and b o denote the weight matrix and bias parameter of the output gate.

3. Proposed Intelligent Diagnosis Framework

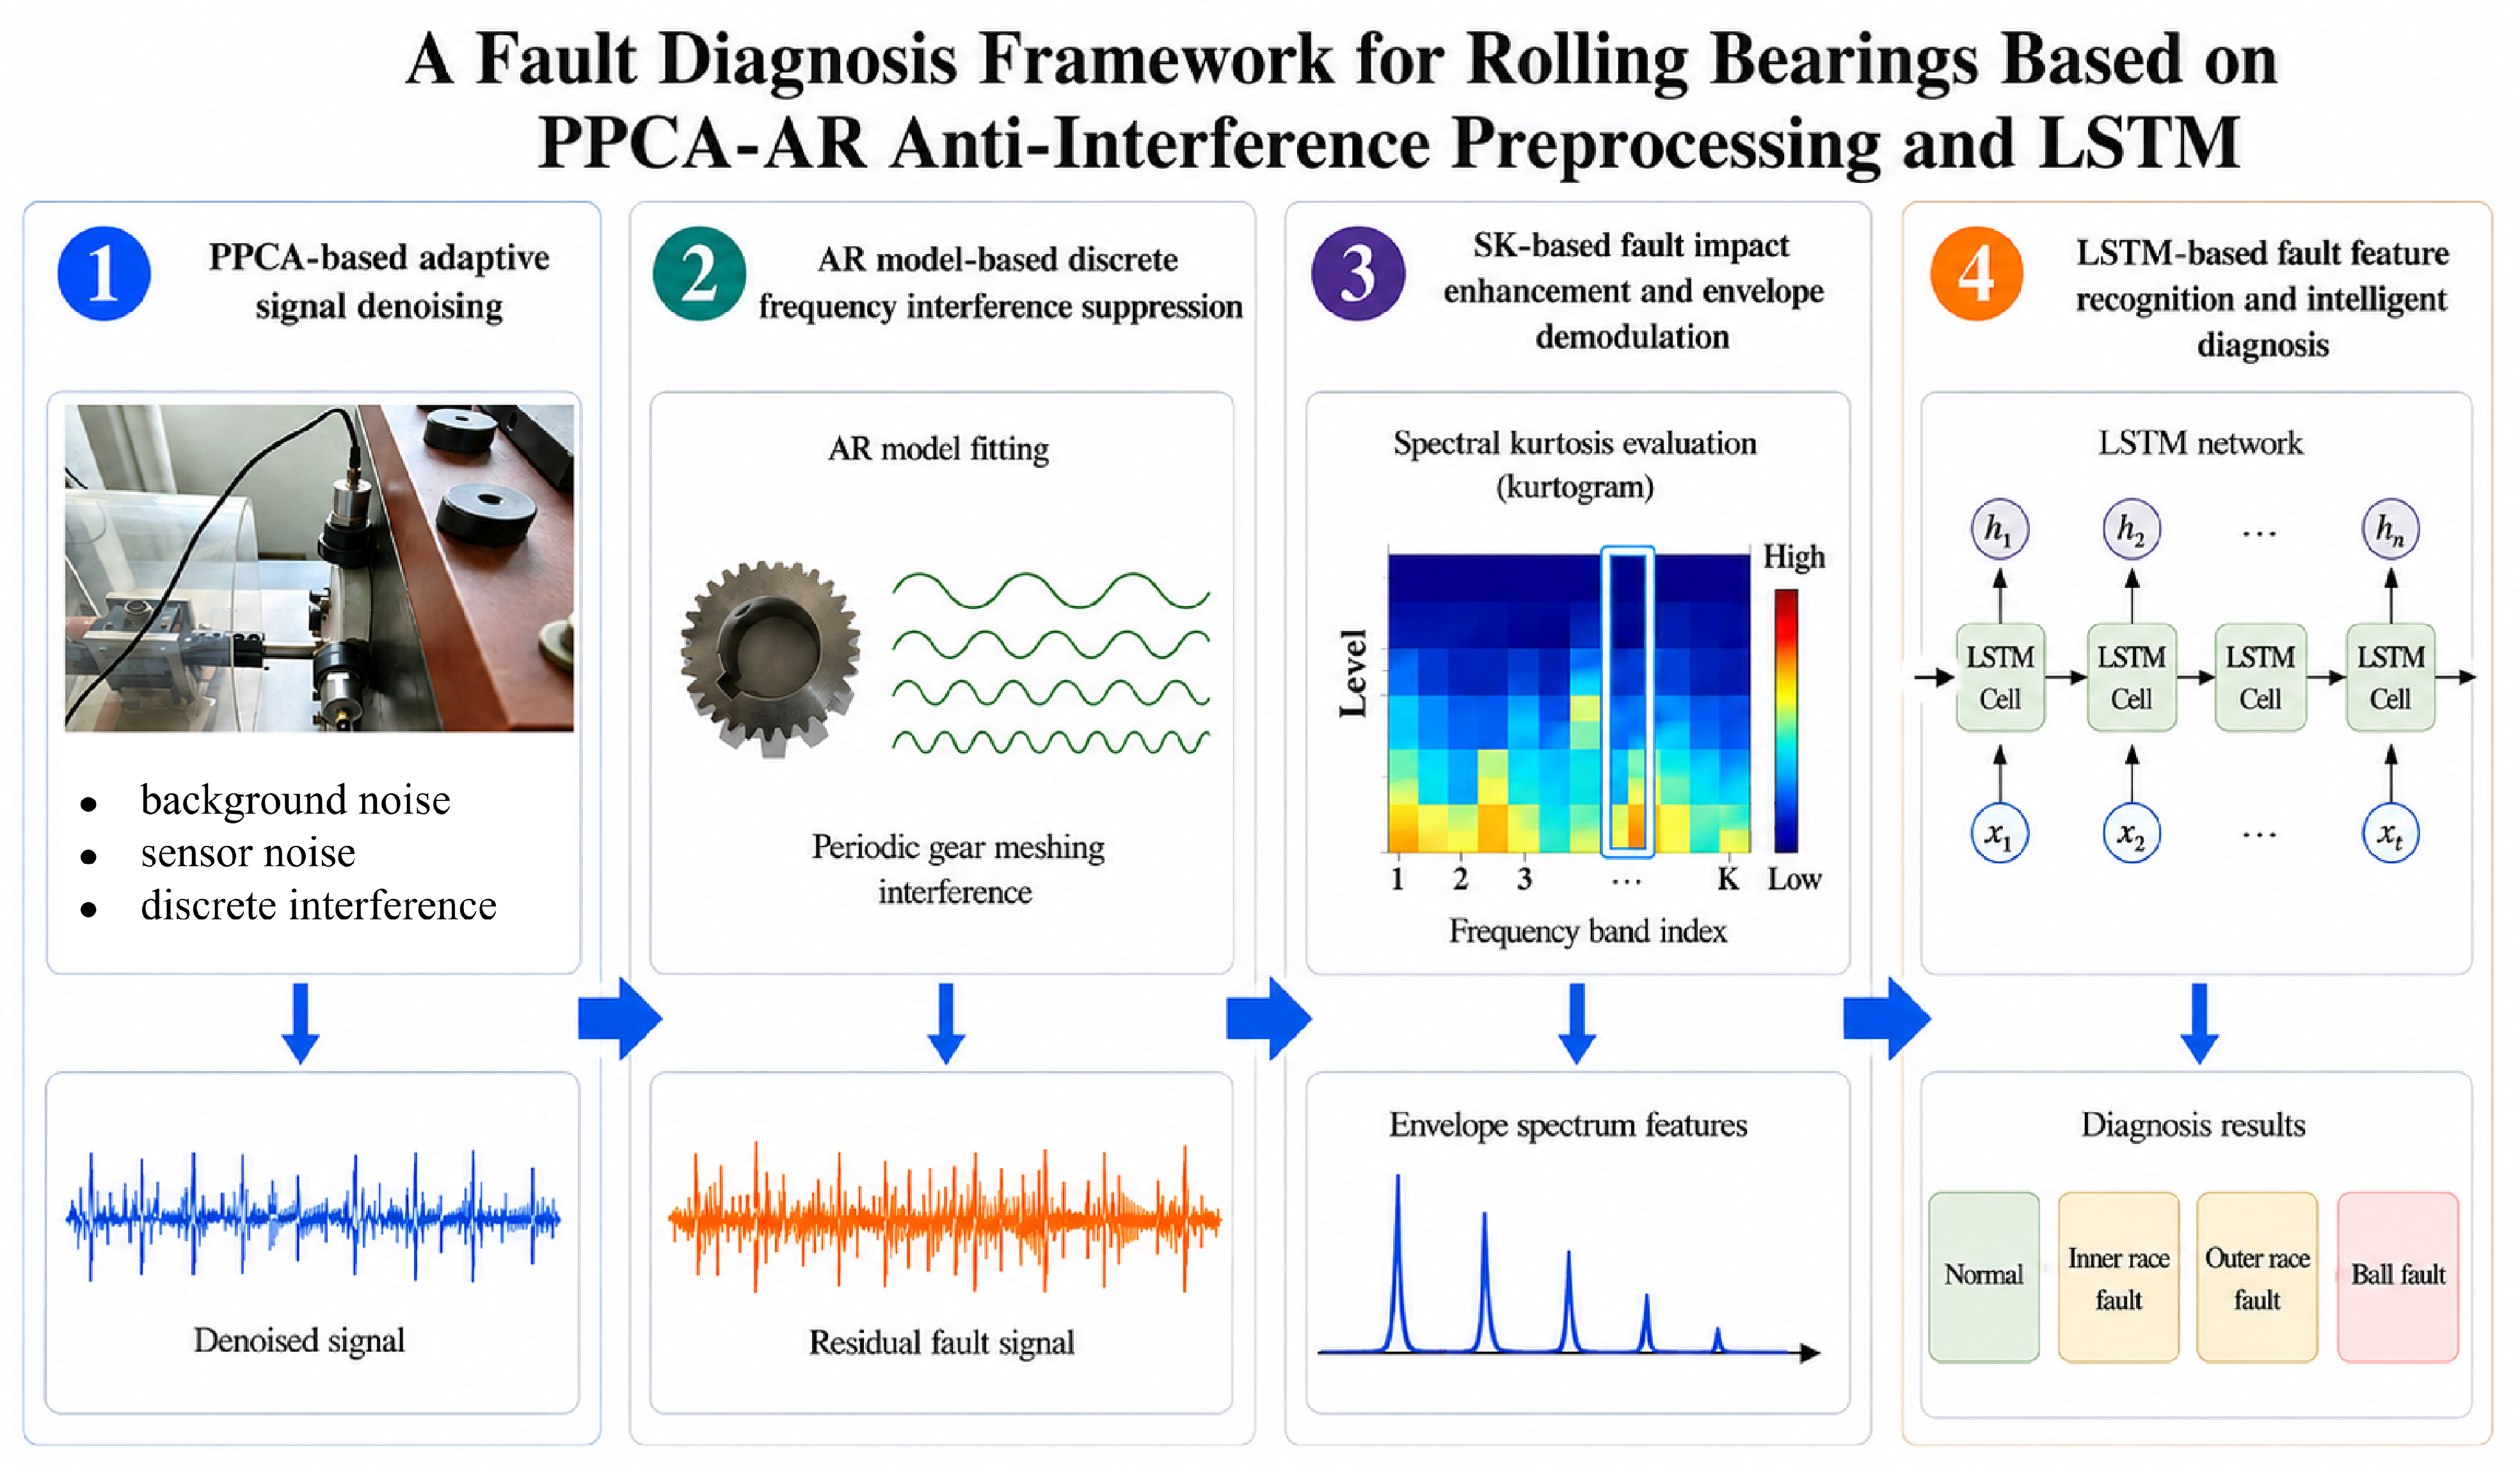
Aiming at the challenges of extracting fault features from rolling bearing vibration signals and the low online diagnosis accuracy induced by complex interferences under practical operating conditions, this paper develops a rolling bearing intelligent diagnosis system embedded with an anti-interference preprocessing module via signal processing theories and deep learning techniques. The proposed system comprises four core functional modules: the PPCA-based adaptive denoising module, the discrete interference suppression module using AR model prewhitening, the SK-based fault feature enhancement and envelope demodulation module, and the intelligent fault identification module based on the LSTM network. Noise interference degrades the analytical performance of spectral kurtosis and impairs the effectiveness of intelligent diagnosis algorithms. To address this issue, noise reduction and anti-interference processing are implemented as a preprocessing step in the proposed method to preferentially suppress noise components contained in raw signals. In this work, the spectral kurtosis index is adopted to adaptively determine the optimal principal component dimension for PPCA. By incrementally increasing the number of principal components, the minimum dimension where the spectral kurtosis value stabilizes is selected as the optimal number of valid principal components. The overall technical flowchart of the proposed method is illustrated in Figure 2.
The detailed implementation steps are elaborated as follows:
  • Adaptive signal denoising based on the PPCA model. Raw vibration signals collected from industrial sites usually contain various interference components with a low overall signal-to-noise ratio, so bearing fault impulse features are easily submerged by background noise. In this paper, the PPCA model is adopted to improve the denoising performance of raw vibration signals. With the spectral kurtosis indicator serving as the feedback evaluation criterion, the principal component dimension is adaptively optimized to separate fault signals from noise and suppress background noise accurately.
  • Discrete frequency interference suppression based on the AR model. Discrete frequency interference caused by gear meshing often masks bearing fault features and deteriorates the extraction accuracy of fault characteristics. To address this problem, the AR model is employed to fit preprocessed signals, so as to separate periodic components from stochastic components contained in the signal. The residual signal carrying equipment fault information is preserved, while discrete frequency interference originating from gear meshing is eliminated, which further facilitates the extraction of fault-related signals.
  • Fault impulse feature enhancement and envelope demodulation based on SK. In this work, multi-scale decomposition is performed on vibration signals after denoising and interference suppression. The spectral kurtosis of each decomposed scale component is calculated to quantitatively characterize the intensity of impulse features within different frequency bands. In line with the optimal spectral kurtosis criterion, frequency bands abundant in fault information are adaptively screened, and band-pass filtering is implemented to amplify weak fault impulse features. Accordingly, envelope demodulation is conducted on the filtered signals to extract envelope spectrum features for characterizing diverse fault patterns.
  • Fault feature recognition and intelligent diagnosis based on LSTM. To realize the intelligent identification of bearing faults, the extracted envelope spectrum features are input into the constructed LSTM model. Benefiting from the powerful feature mining and nonlinear fitting capacity of the LSTM network, the mapping relationship between spectral features and various bearing fault modes is automatically established, which enables accurate classification and identification of different fault types. Finally, high-precision online intelligent diagnosis for the operating states of rolling bearings is achieved.

4. Simulation Case

4.1. Bearing Fault Signal with Noise Interference

To verify the capability of the preprocessing module of the proposed method in extracting rolling bearing fault features under strong background noise, simulation signals conforming to the vibration acceleration characteristics of local inner race faults in rolling bearings are constructed in MATLAB R2023b. When local damage occurs in a rolling bearing, periodic damped impulse responses are generated in vibration signals, which are further contaminated by additive Gaussian white noise. The simulated signal is defined as:
x ( t ) = s ( t ) + e ( t ) ,
where e ( t ) denotes Gaussian white noise, and the bearing fault impulse response s ( t ) is a second-order damped oscillatory signal recurring with a fault period T, whose expression is given by:
s ( t ) = n = 0 e B ( t n T ) cos 2 π f n ( t n T ) · u ( t n T ) ,
where f n is the natural frequency of the bearing system; B = 2 π f n ξ represents the attenuation coefficient; ξ is the damping ratio; T stands for the fault impulse period corresponding to the fault characteristic frequency f 0 = 1 / T ; u ( · ) denotes the unit step function that ensures each impulse is activated only when t n T .
The key simulation parameters are set as follows: sampling frequency f s = 40,960 Hz , total sampling points N = 81,920, fault impulse period T = 0.01 s , bearing natural frequency f n = 4000 Hz , damping ratio ξ = 0.02387 , and the standard deviation of Gaussian noise e ( t ) is set to 0.5 . The SNR is formulated as:
SNR = 10 log 10 P s P n ,
where P s = E s 2 ( t ) and P n = E e 2 ( t ) represent the power of the fault impulse signal and the noise component, respectively. E · denotes the mathematical expectation operator. The SNR of the constructed simulated signal is set to 5 dB .
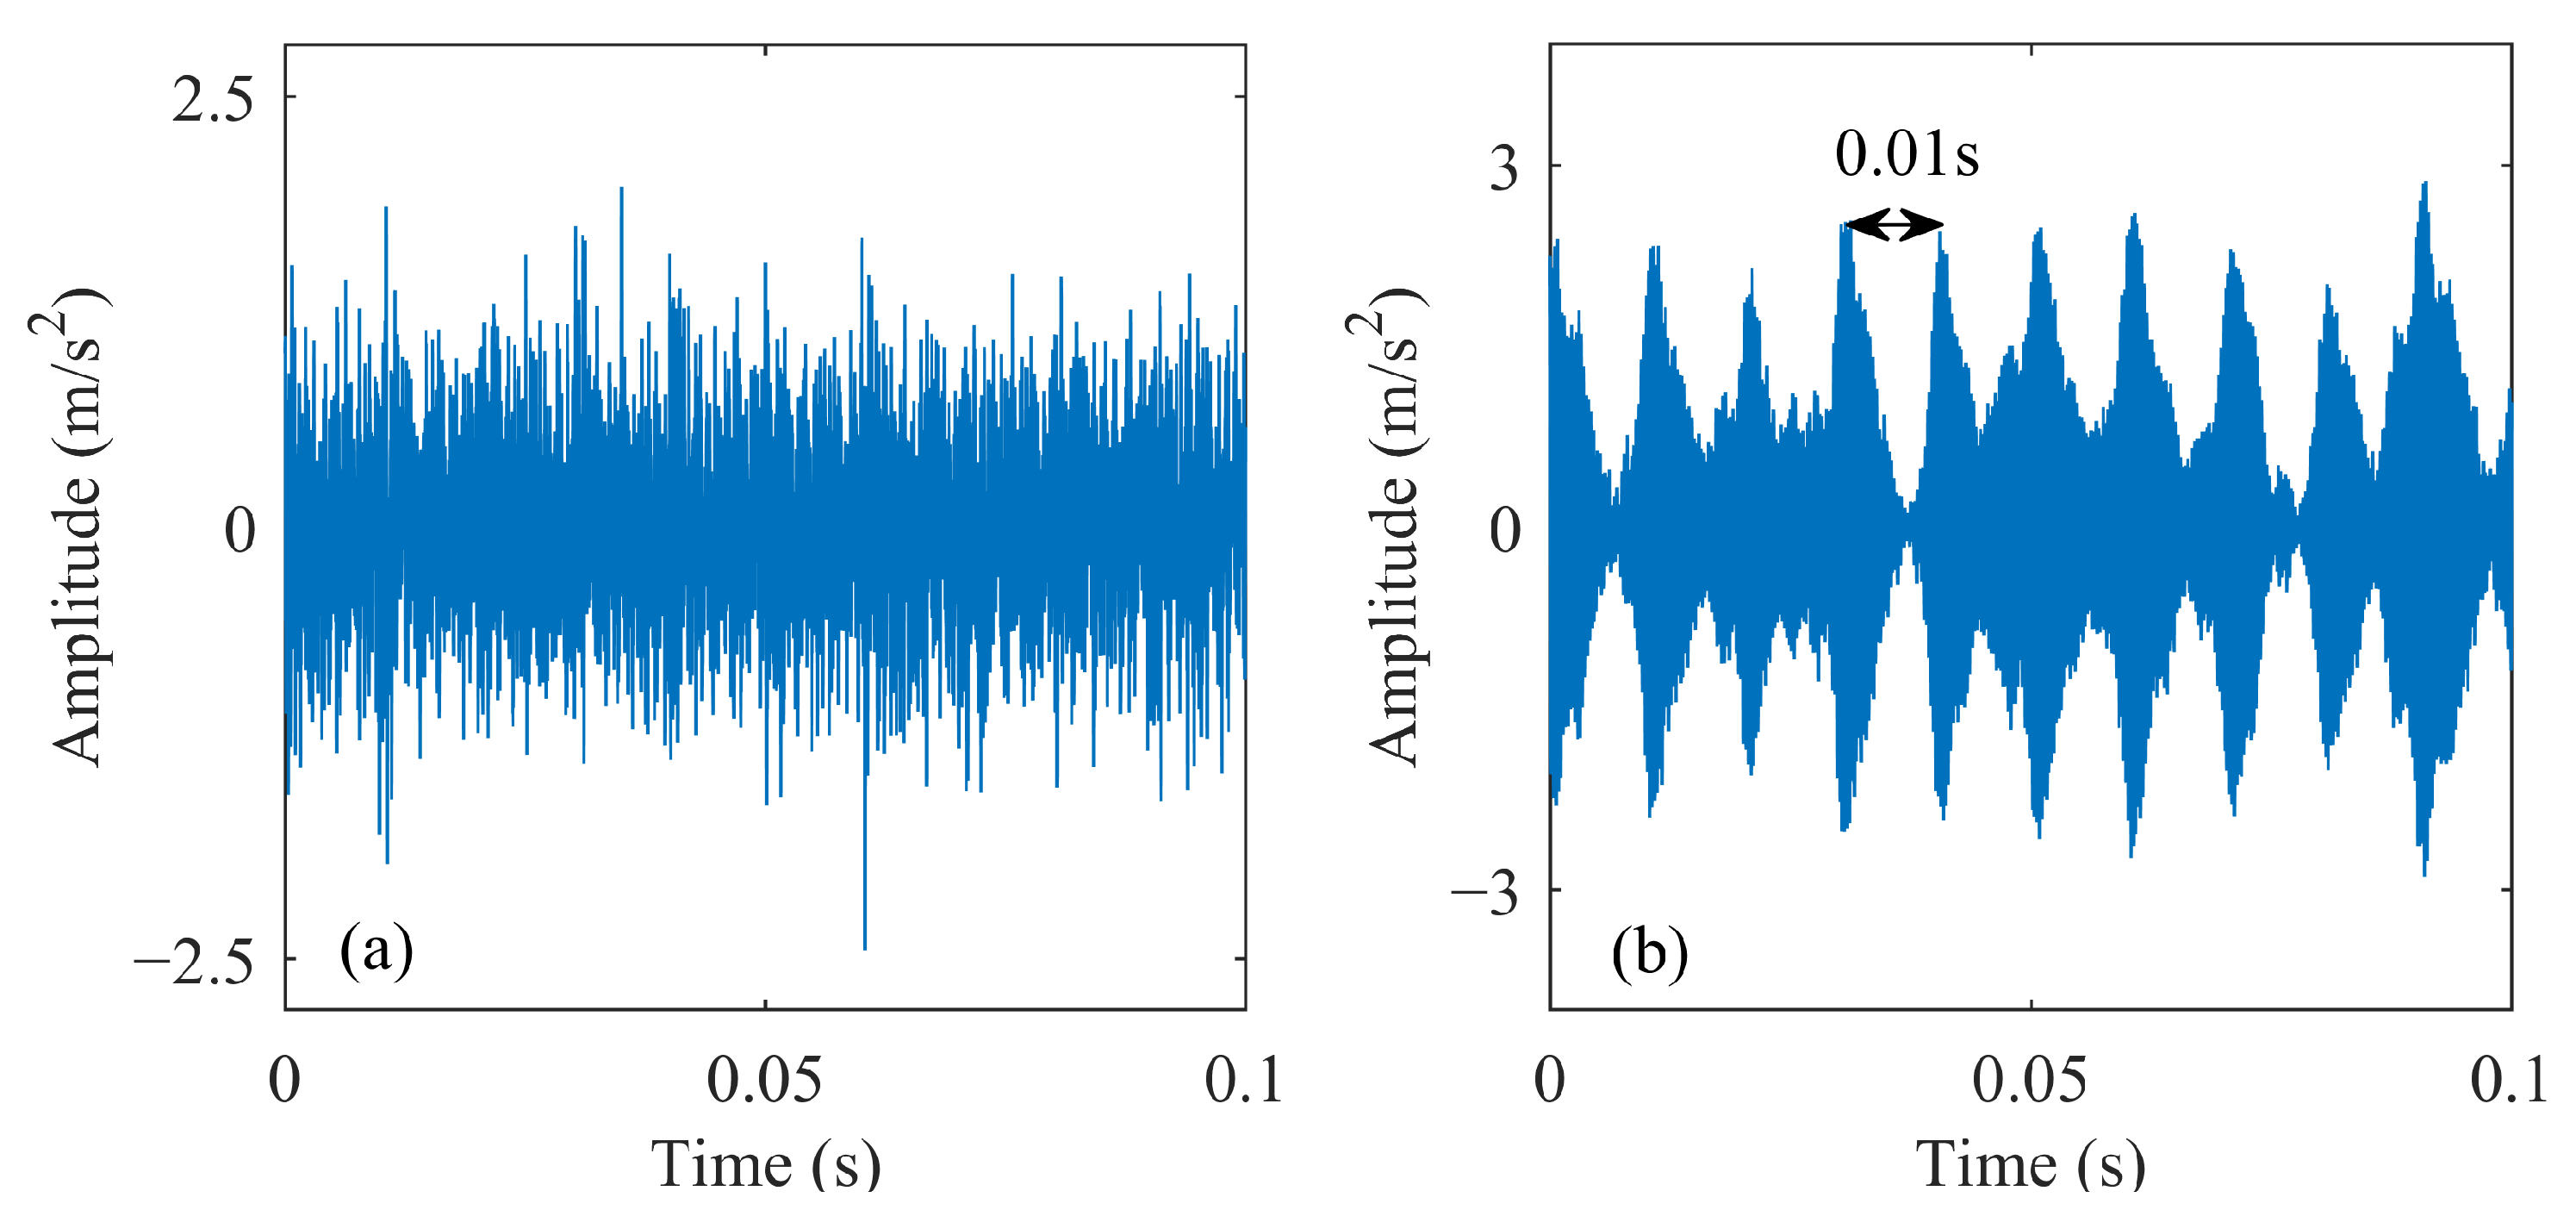
The raw simulated waveform and denoised results are illustrated in Figure 3. As shown in Figure 3a, the periodic fault impulses induced by local bearing damage are completely submerged by heavy background noise in the raw noisy time-domain waveform. Distinct periodic characteristics fail to emerge in the time-domain waveform, so the fault impulse period cannot be directly identified from the original signal. Following adaptive denoising preprocessing based on the PPCA algorithm, the periodic fault impulses become clearly distinguishable in Figure 3b. The labeled impulse interval of 0.01 s is perfectly consistent with the preset fault period in the simulation setup.
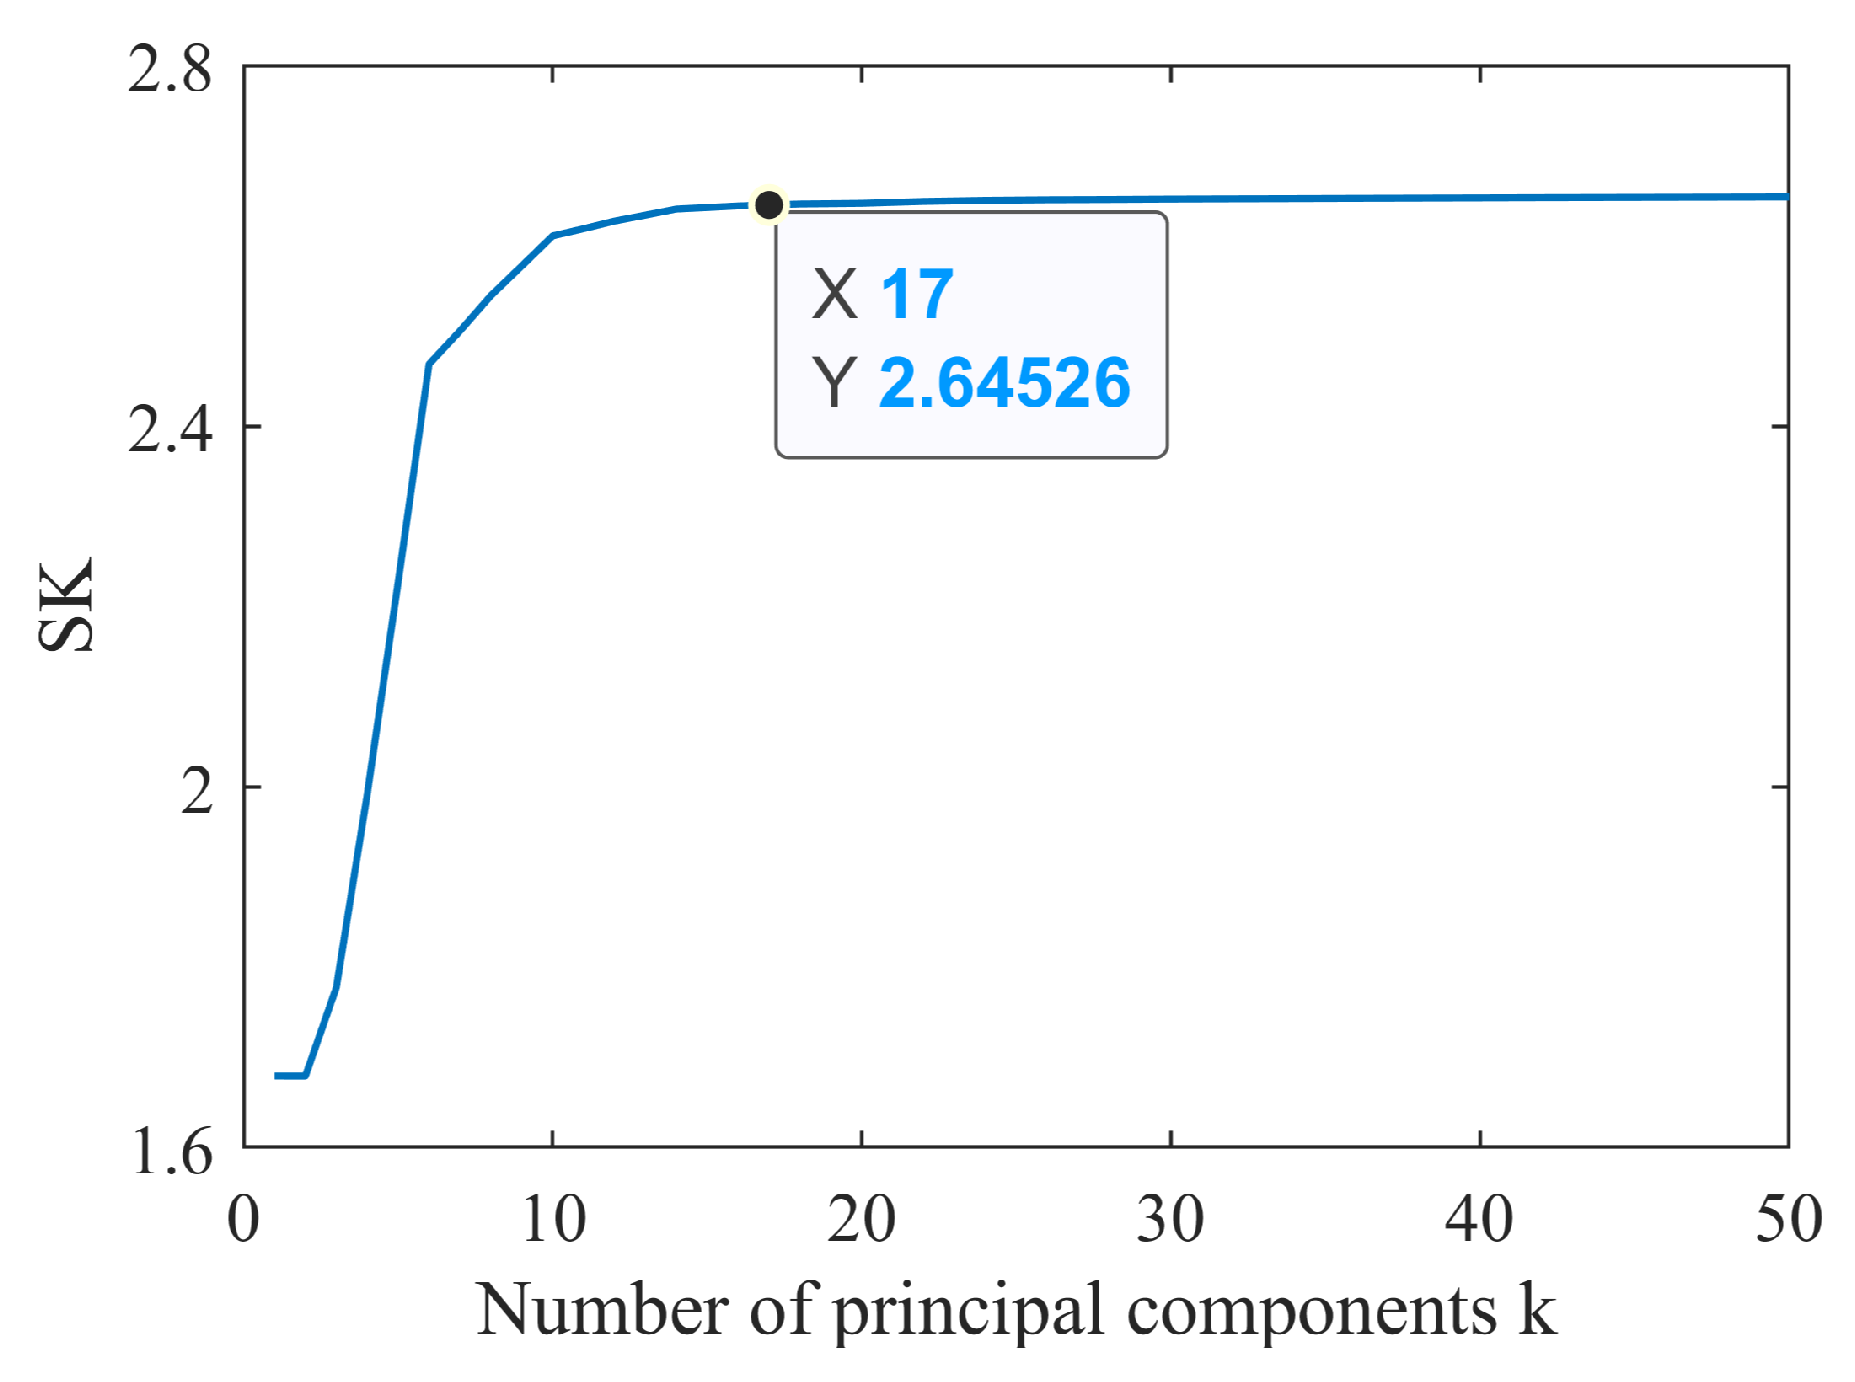
This paper employs spectral kurtosis to adaptively determine the optimal principal component dimension, as shown in Figure 4. Low principal component dimensions discard bearing fault signal components, resulting in low spectral kurtosis values. As the dimension increases, fault information is gradually retained, and the spectral kurtosis rises rapidly. To determine the number of PPCA principal components, the relative change metric of spectral kurtosis is defined as | S K ( k ) S K ( k 1 ) | / S K ( k 1 ) . The preset convergence threshold is set to 1 × 10⁻³. We take 17 as the optimal principal component number, where this metric first drops below the predefined threshold. The computed metrics under different principal component numbers are summarized in Table 1.
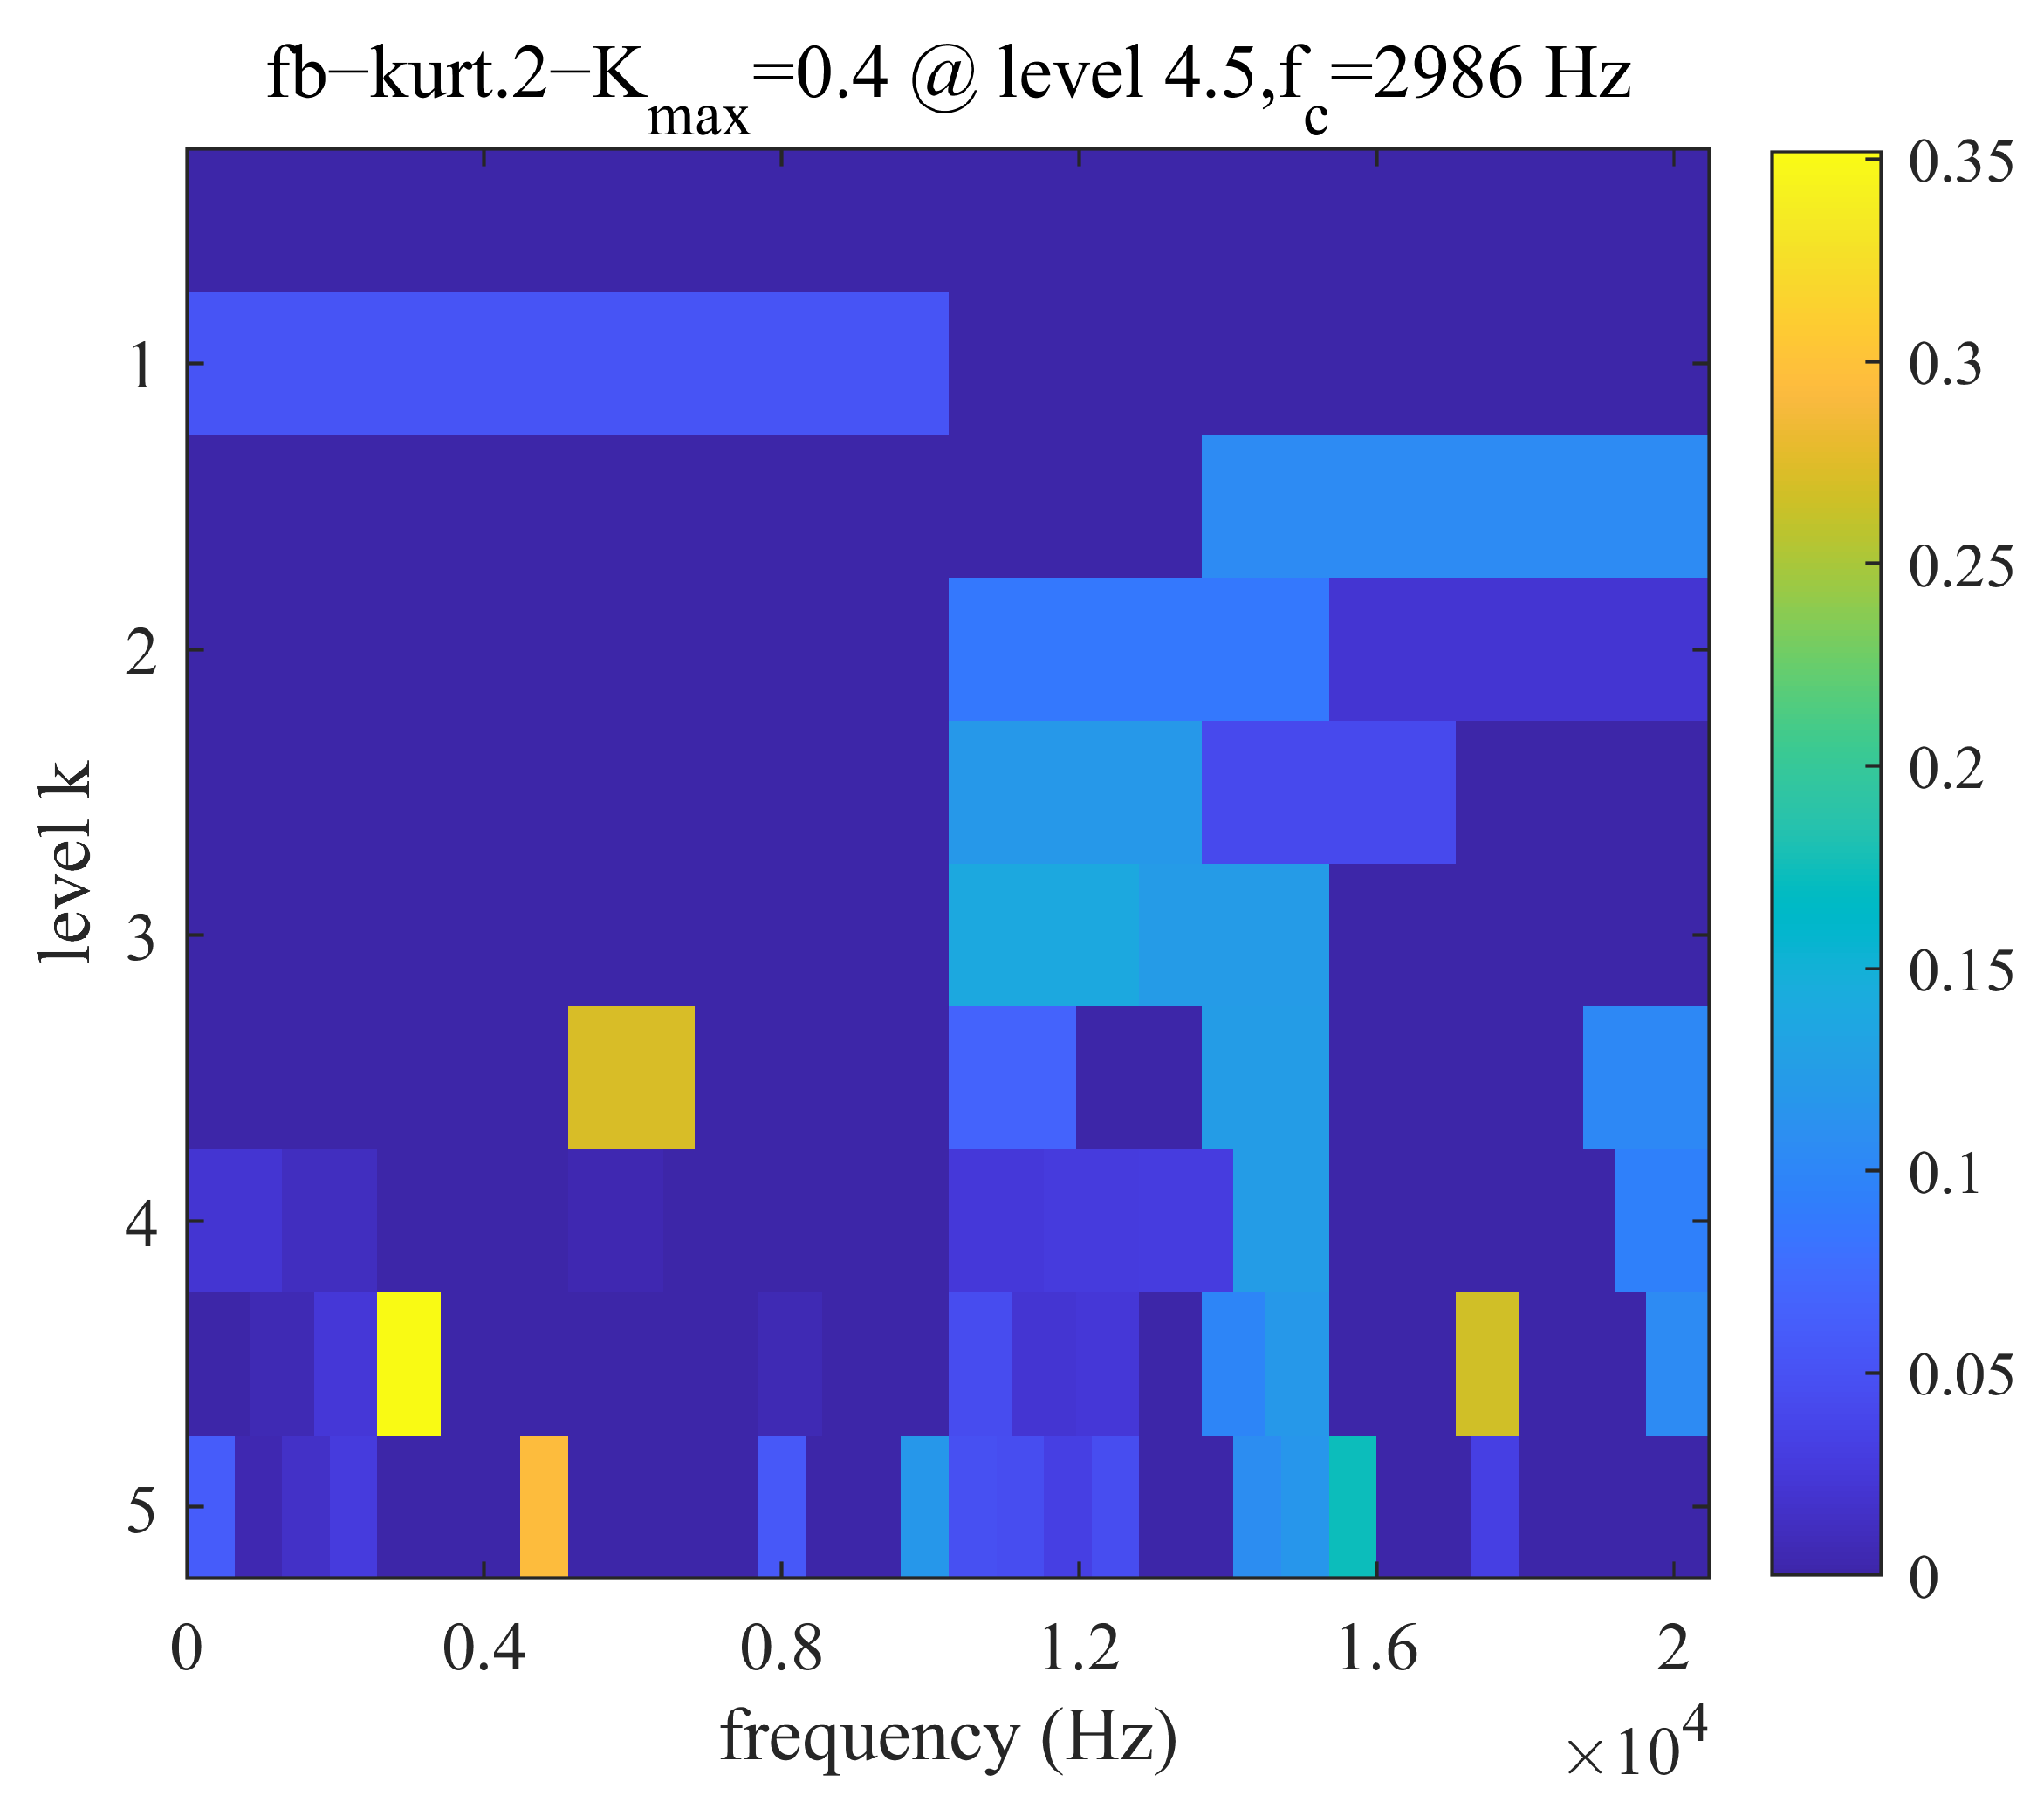
Following background noise elimination, the spectral kurtosis algorithm is utilized to screen the optimal resonant frequency band corresponding to bearing faults. The center frequency and bandwidth of the band-pass filter are determined according to the maximum spectral kurtosis value of each frequency band, thereby enabling the accurate extraction of rolling bearing fault impulse components. The spectral kurtosis analysis result of the simulated signal is presented in Figure 5, where the brightness of colored blocks reflects the severity of impulse features in different frequency bands. The global maximum spectral kurtosis appears at the decomposition level of 4.5 with a center frequency f c = 2986 Hz . The band-pass filter is constructed with these parameters to implement signal band-pass filtering.
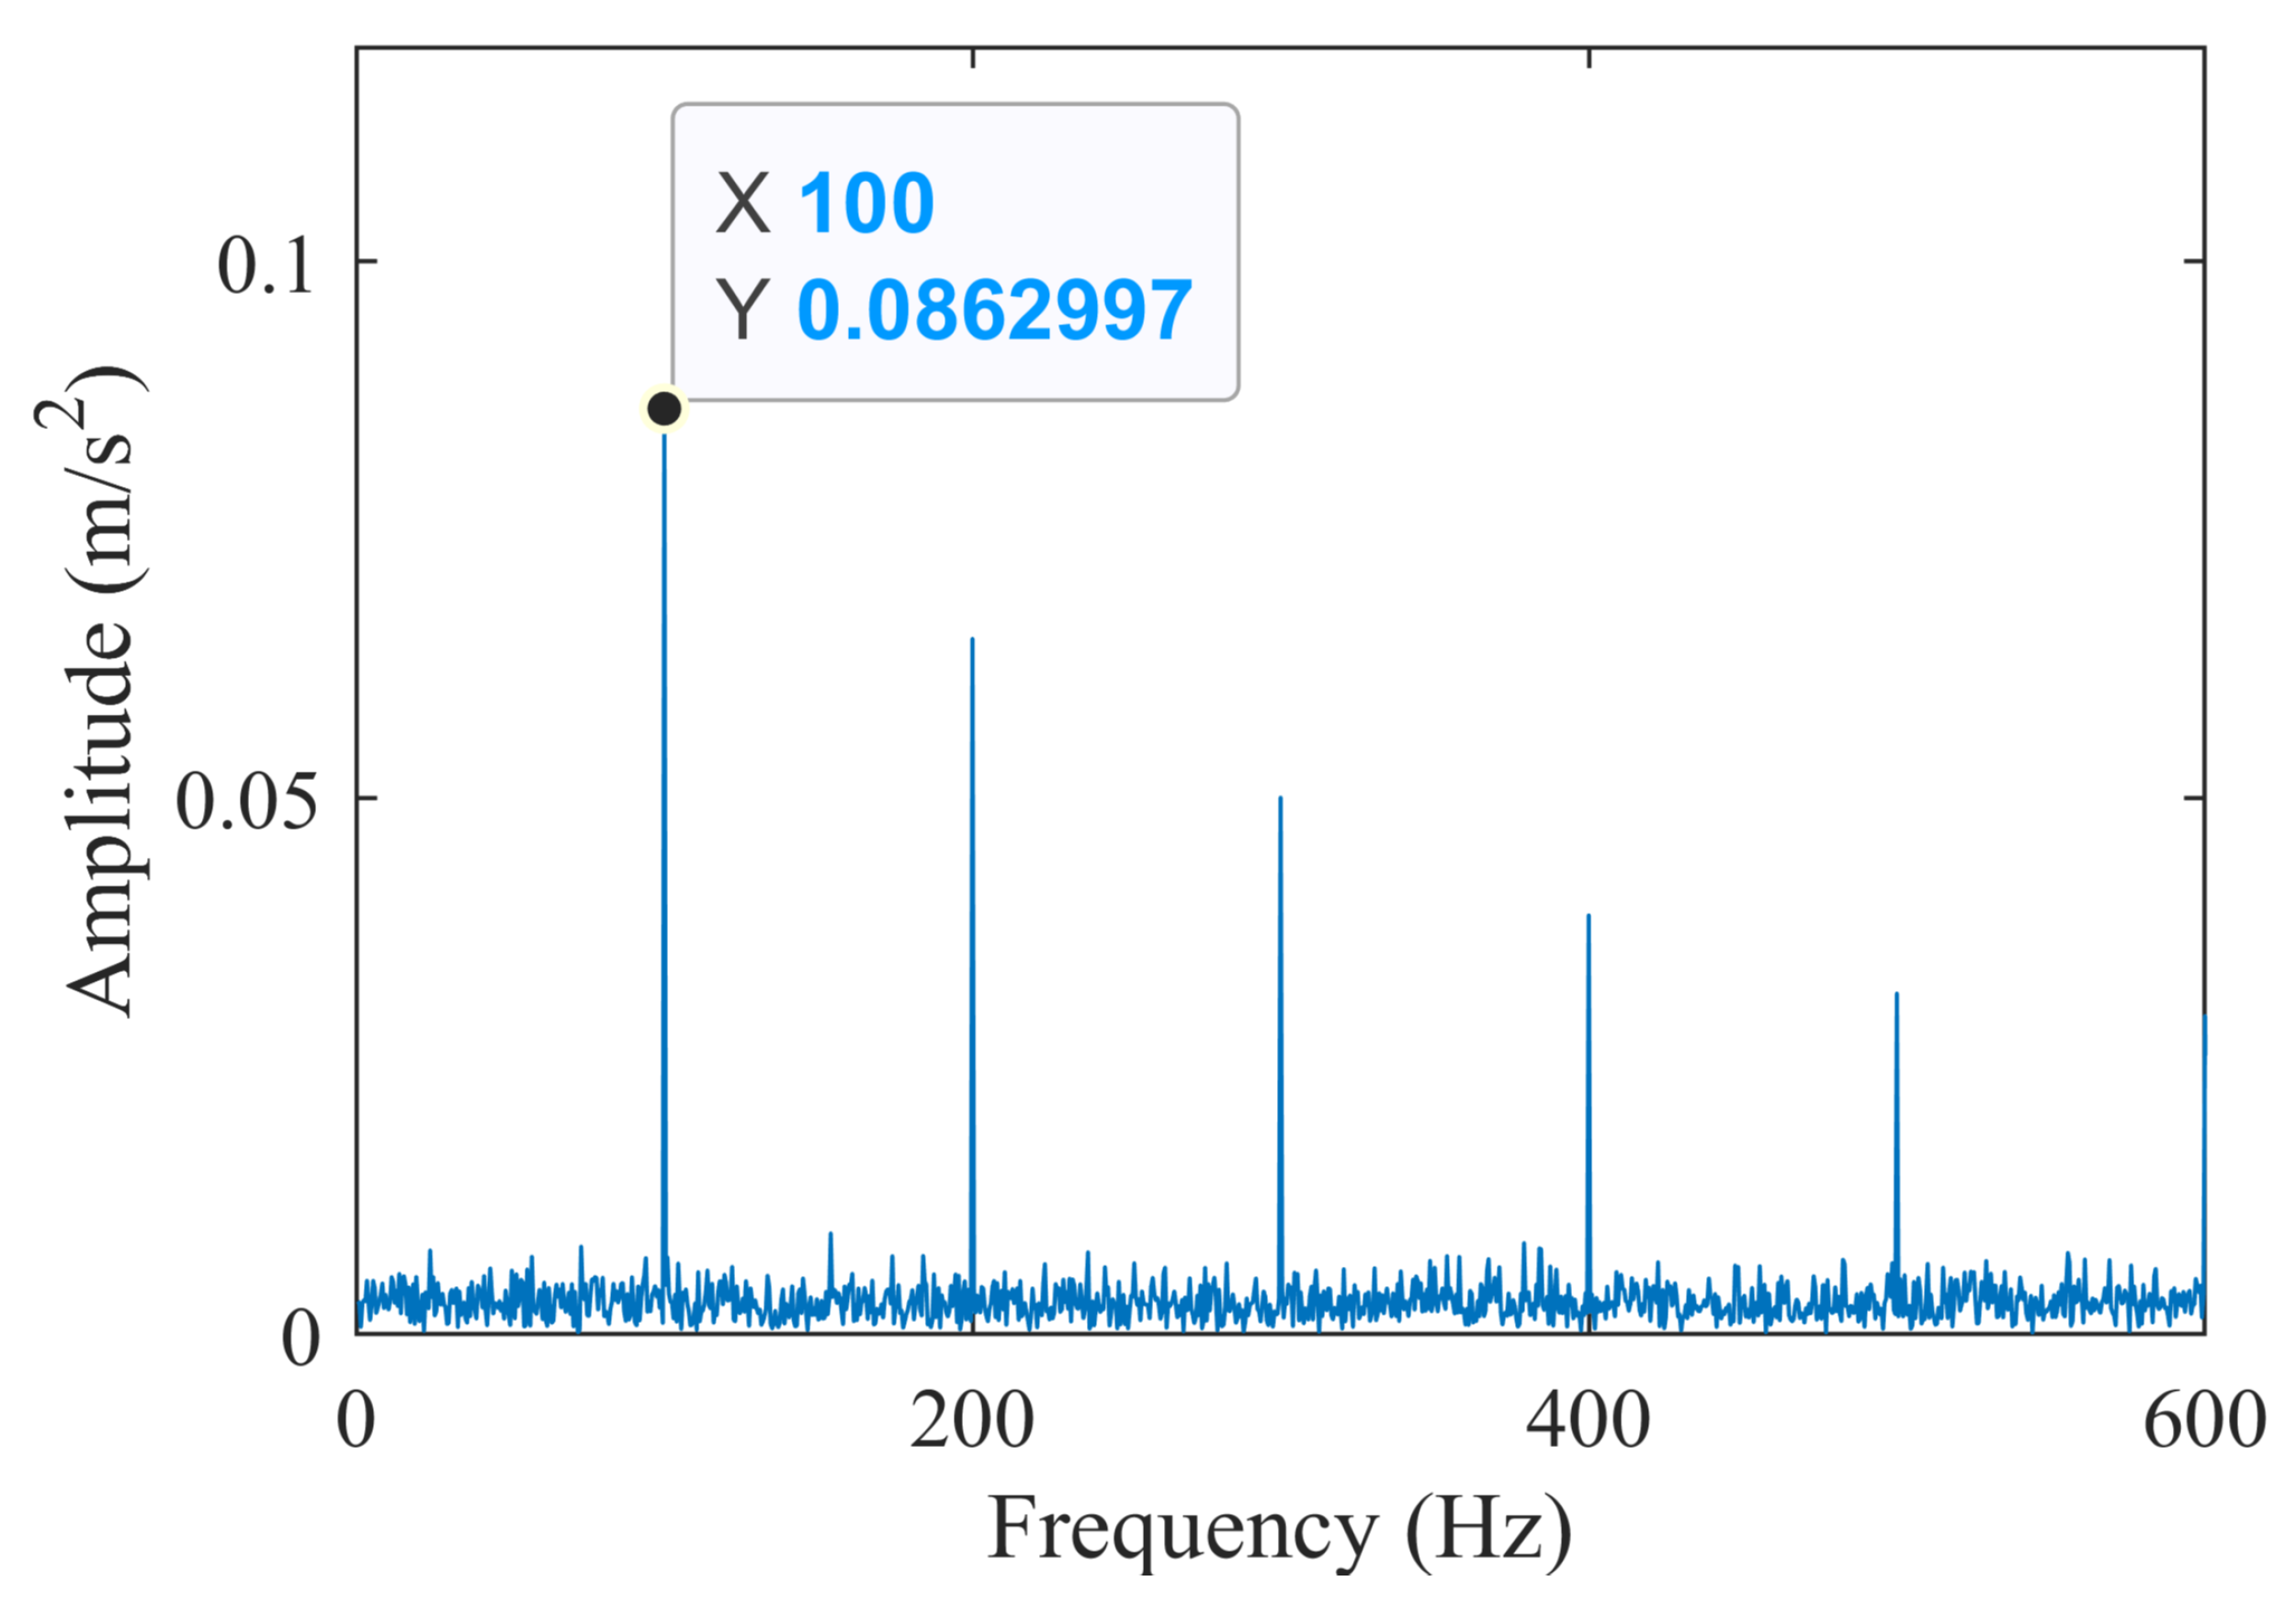
Envelope demodulation is performed on the filtered bearing signal, and the corresponding envelope spectrum is illustrated in Figure 6. A prominent spectral peak can be observed at 100 Hz in the spectrum, which is highly consistent with the preset bearing fault characteristic frequency in this simulation. This 100 Hz component is derived from the time interval of inner race fault impulses shown in Figure 3, i.e., 1 / 0.01 s = 100 Hz . In addition, the spectral peaks at 200 Hz, 300 Hz and 400 Hz are high-order harmonics of the inner race fault characteristic frequency. These harmonics are excited by periodic fault impacts.

4.2. Bearing Fault Signal with Discrete Interference

Vibration signals of rolling bearings are usually contaminated by rotational frequency and its harmonic interferences, which generally include the first, second and third harmonics of the shaft rotational frequency. The mathematical expression of such discrete interference components is given as:
c ( t ) = A 1 sin 2 π f θ t + A 2 sin 4 π f θ t + A 3 sin 6 π f θ t ,
where f θ denotes the rotational frequency of the shaft, and A 1 , A 2 , A 3 represent the amplitudes of each harmonic component.
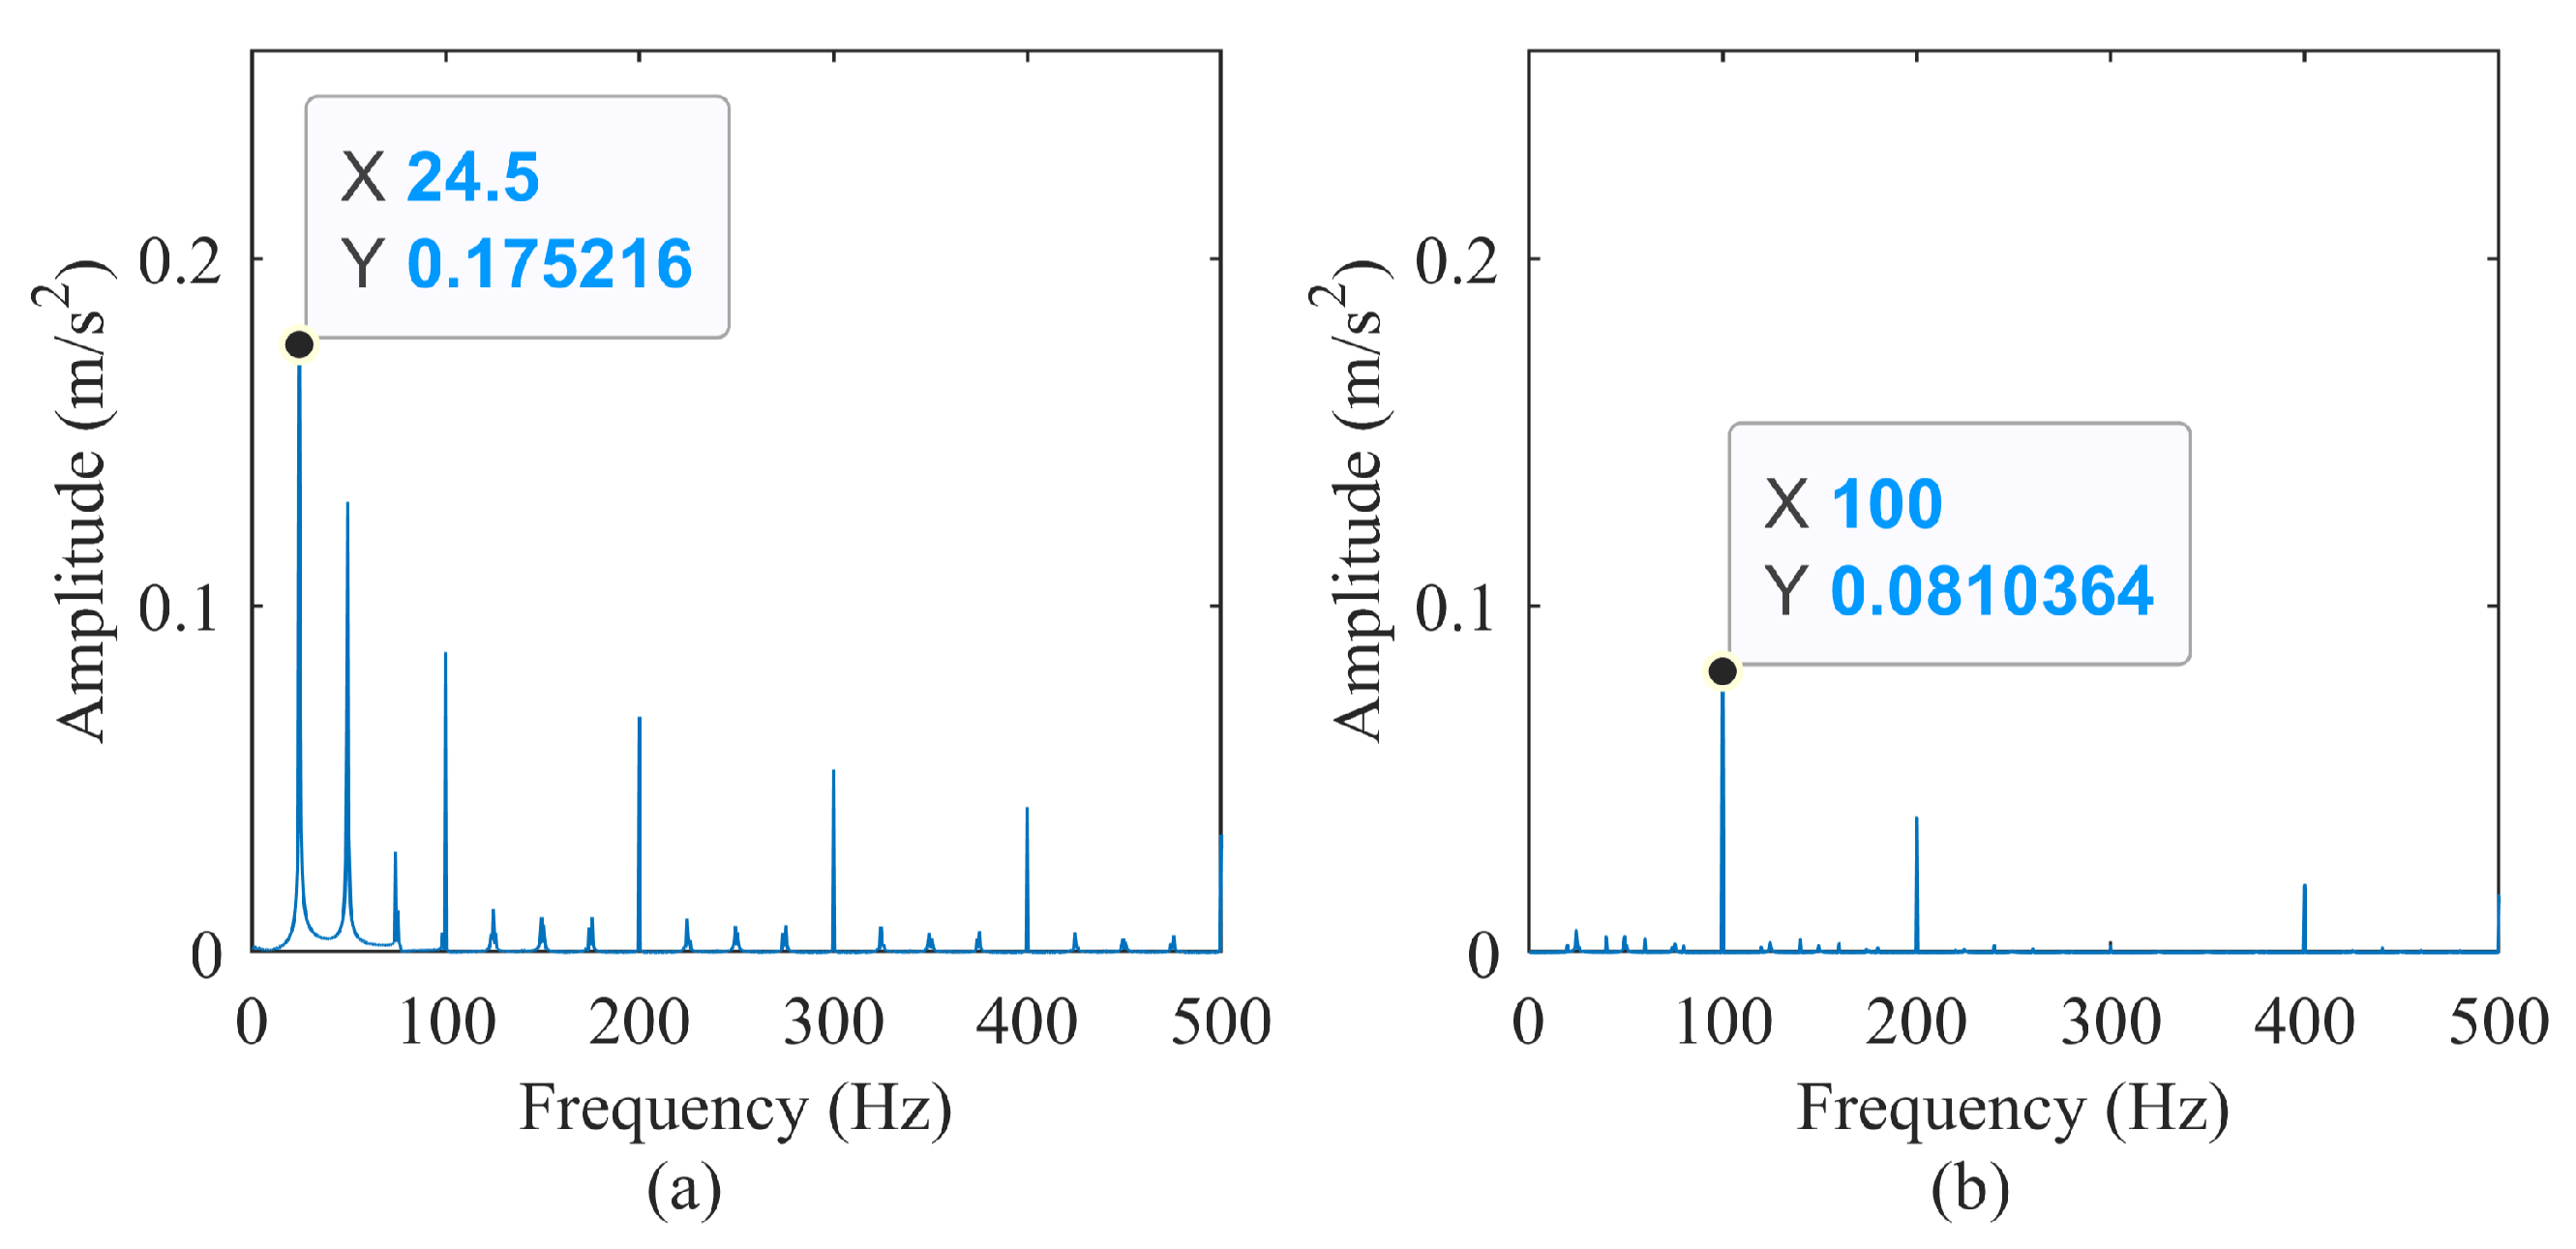
Based on the bearing fault simulation signal constructed in Section 4.1, the above shaft harmonic interference components are superimposed. The shaft rotational frequency is set to f θ = 24.67 Hz , and the interference amplitudes are set to A 1 = 0.5 , A 2 = A 3 = 0.2 . The envelope spectrum analysis result of the signal with discrete interference is displayed in Figure 7a. High-amplitude interference spectral peaks appear at 24.67 Hz and 49.34 Hz , which exactly correspond to the first and second harmonics of the shaft rotational frequency. Such high-amplitude harmonic components submerge the fault-related spectral peaks, making it impossible to identify bearing fault features from the frequency spectrum.
To eliminate the adverse effect of harmonic interferences, the AR model is adopted to preprocess the noisy signal via prewhitening. Based on the maximum kurtosis of the prewhitened residual signal, the model order is selected as 35, as shown in Table 2. The envelope spectrum after prewhitening and SK is shown in Figure 7b. Compared with Figure 7a, the energy of the rotational frequency interference peak at 24.67 Hz (shown as 24.5 Hz in the spectrum due to 0.5 Hz frequency resolution) and its harmonics are greatly suppressed. A distinguishable prominent spectral peak is formed at the bearing fault characteristic frequency, and multiple fault harmonic components can also be clearly recognized.

5. Experimental Case

5.1. Dataset

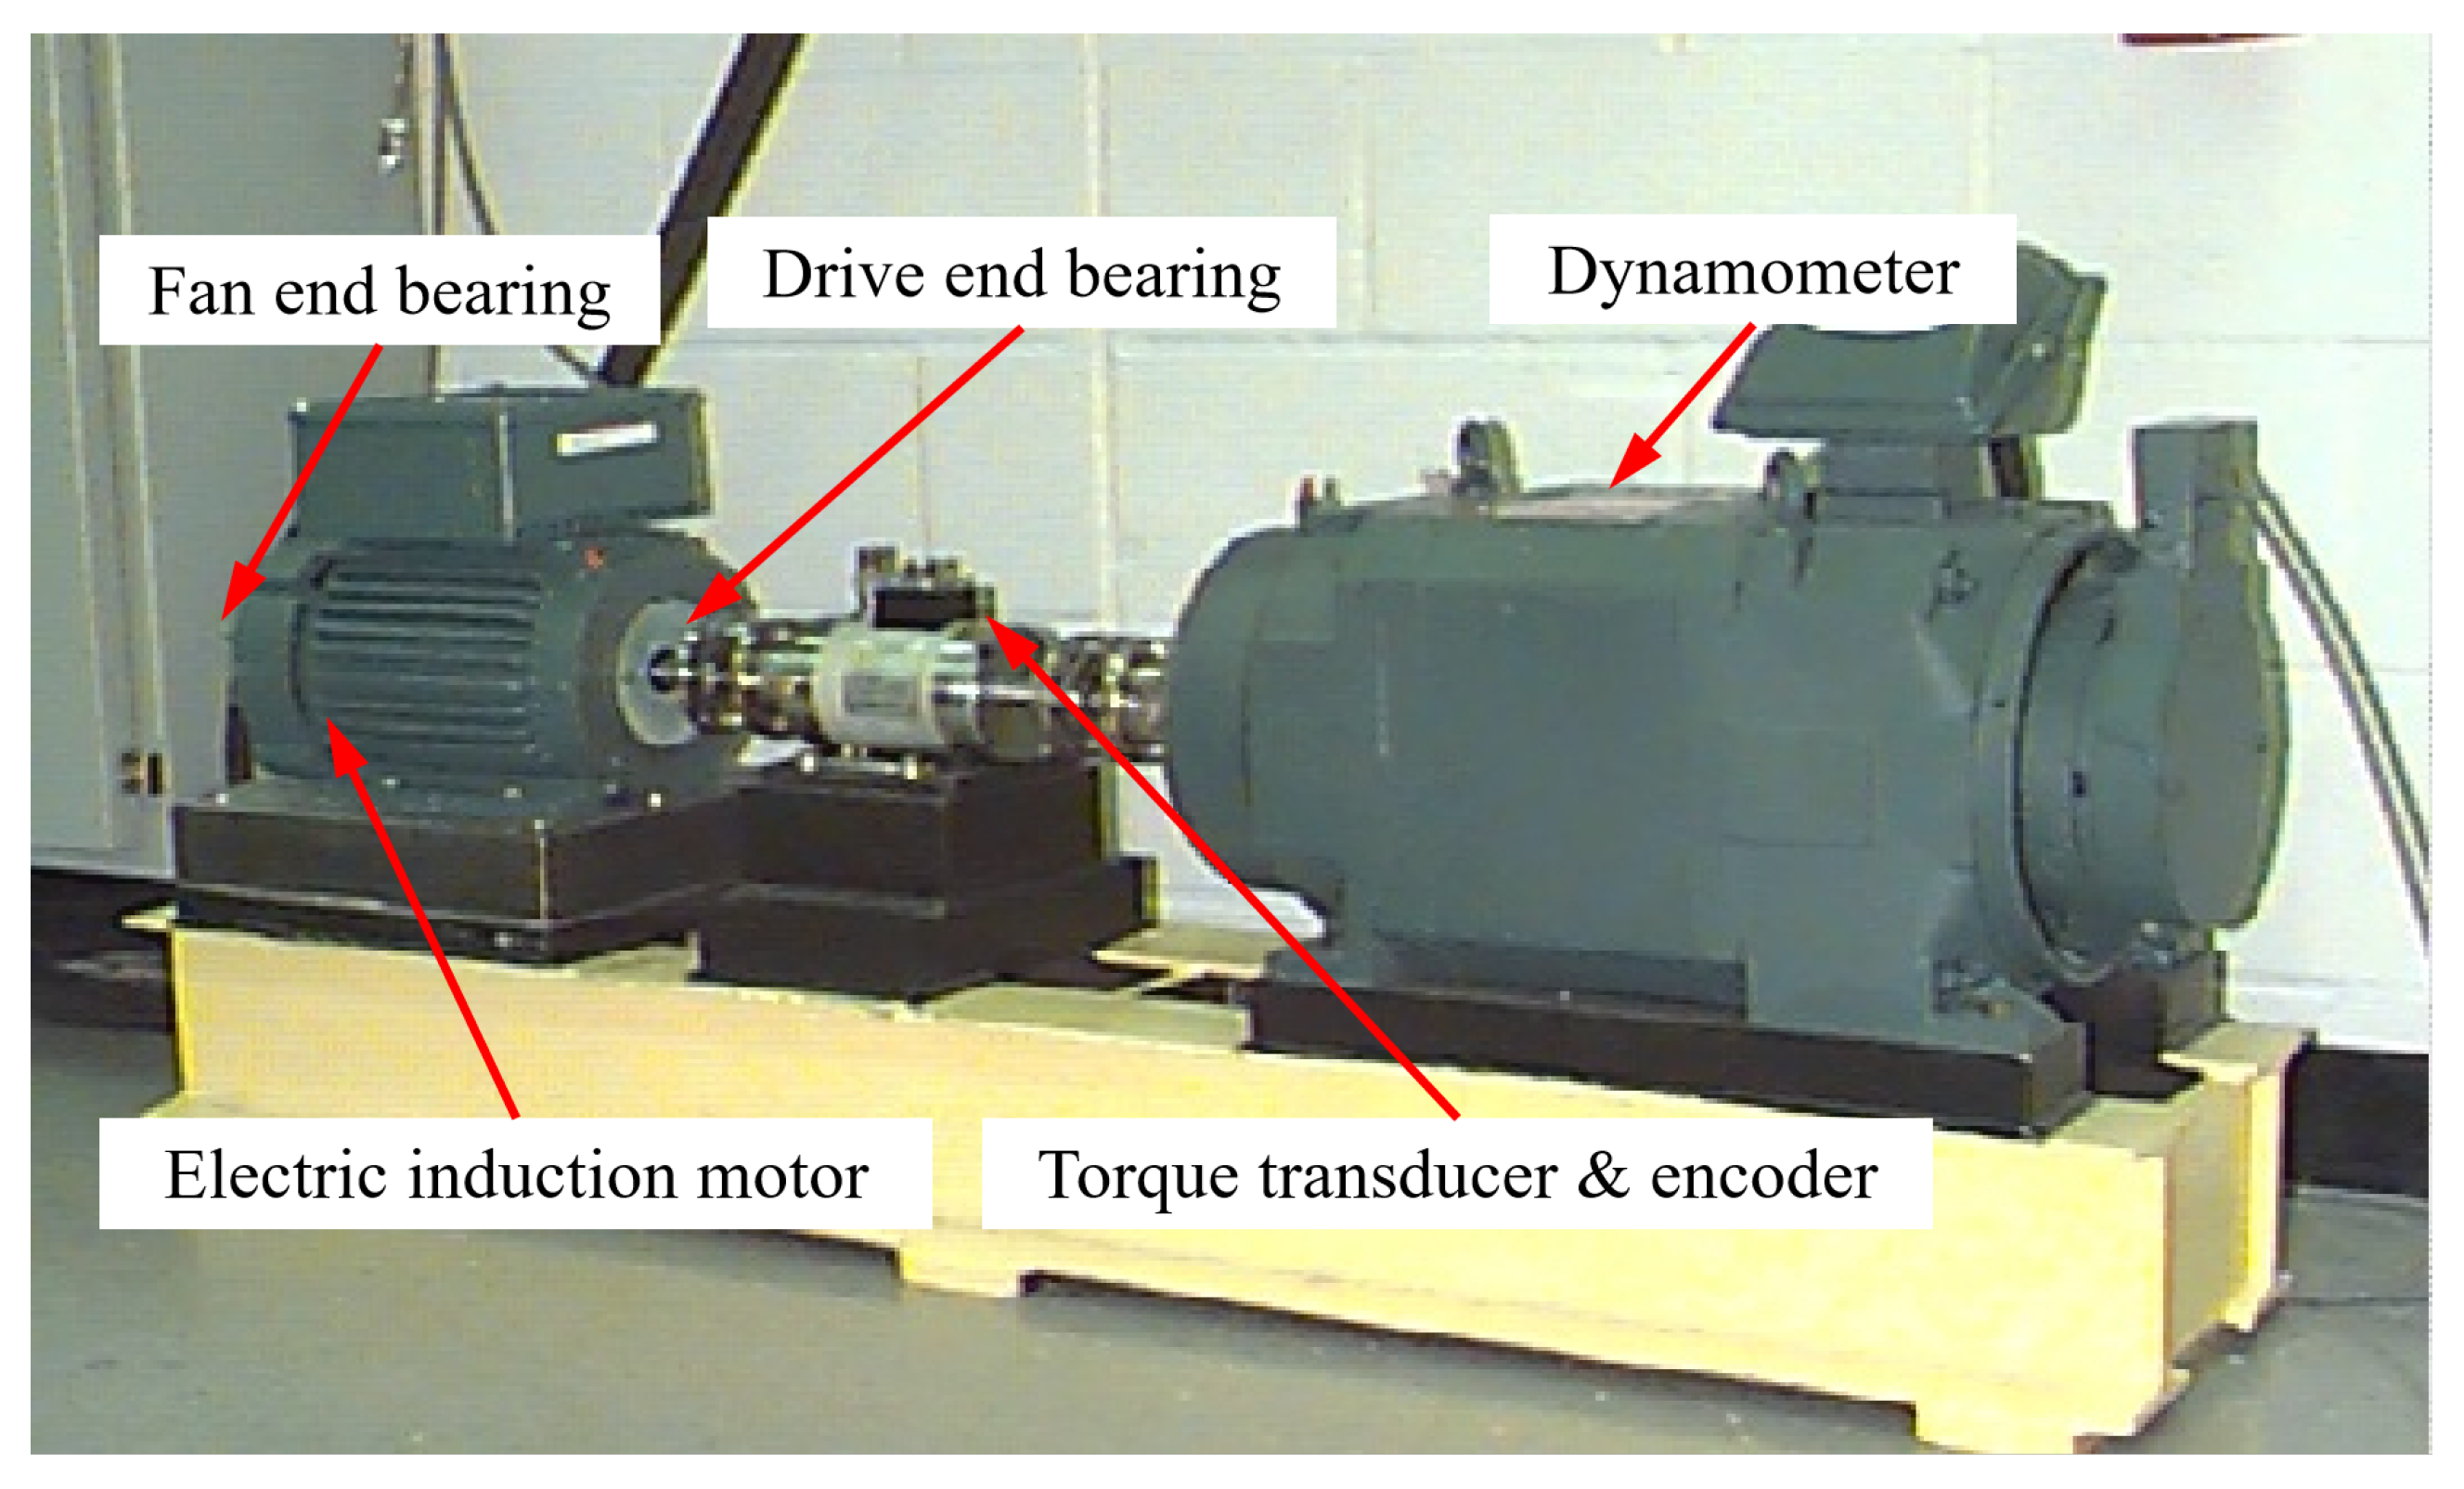
To verify the accuracy of the proposed fault diagnosis method, the publicly available standard rolling bearing fault dataset from CWRU is adopted for experimental validation. The configuration of the experimental test bench is shown in Figure 8. The test system mainly consists of a 2 hp driving motor, a torque sensor and a dynamometer. The vibration signals collected from the drive-end bearing of the motor are used in this experiment, with a sampling frequency of 48 kHz.
The dataset covers four operating conditions of rolling bearings, namely, normal condition, inner race fault, outer race fault and ball fault. Combined with three different fault damage diameters and four operating loads, the dataset is finally divided into 10 sample categories. The detailed sample partition is listed in Table 3. Taking the sample label DE_IR007_0 as an example, it denotes the inner race fault on the motor drive-end bearing with a fault diameter of 0.007 inches under the 0 hp operating load. The original dataset is split into an independent training set and validation set. Samples are segmented by a sliding window with a window length of 10,240 (large enough for multi-scale analysis) and a 50% overlap rate. Gaussian white noise with a SNR of 20 dB is added to all samples. The detailed sample numbers of each category are summarized in Table 3.

5.2. Model Parameter Settings

The experiments are carried out on a laptop equipped with an Intel Core Ultra 9 275HX processor (Santa Clara, CA, USA) running at 2.70 GHz. The experimental software environment is built based on Anaconda, with Python 3.10 adopted as the primary programming language. The proposed deep learning model is implemented on the TensorFlow/Keras framework. To guarantee the reproducibility of experimental results, the key network architecture and training hyperparameters of the proposed neural network are listed in Table 4. Only the first 4096 data points containing the fault frequency are taken.

5.3. Fault Diagnosis Performance Verification

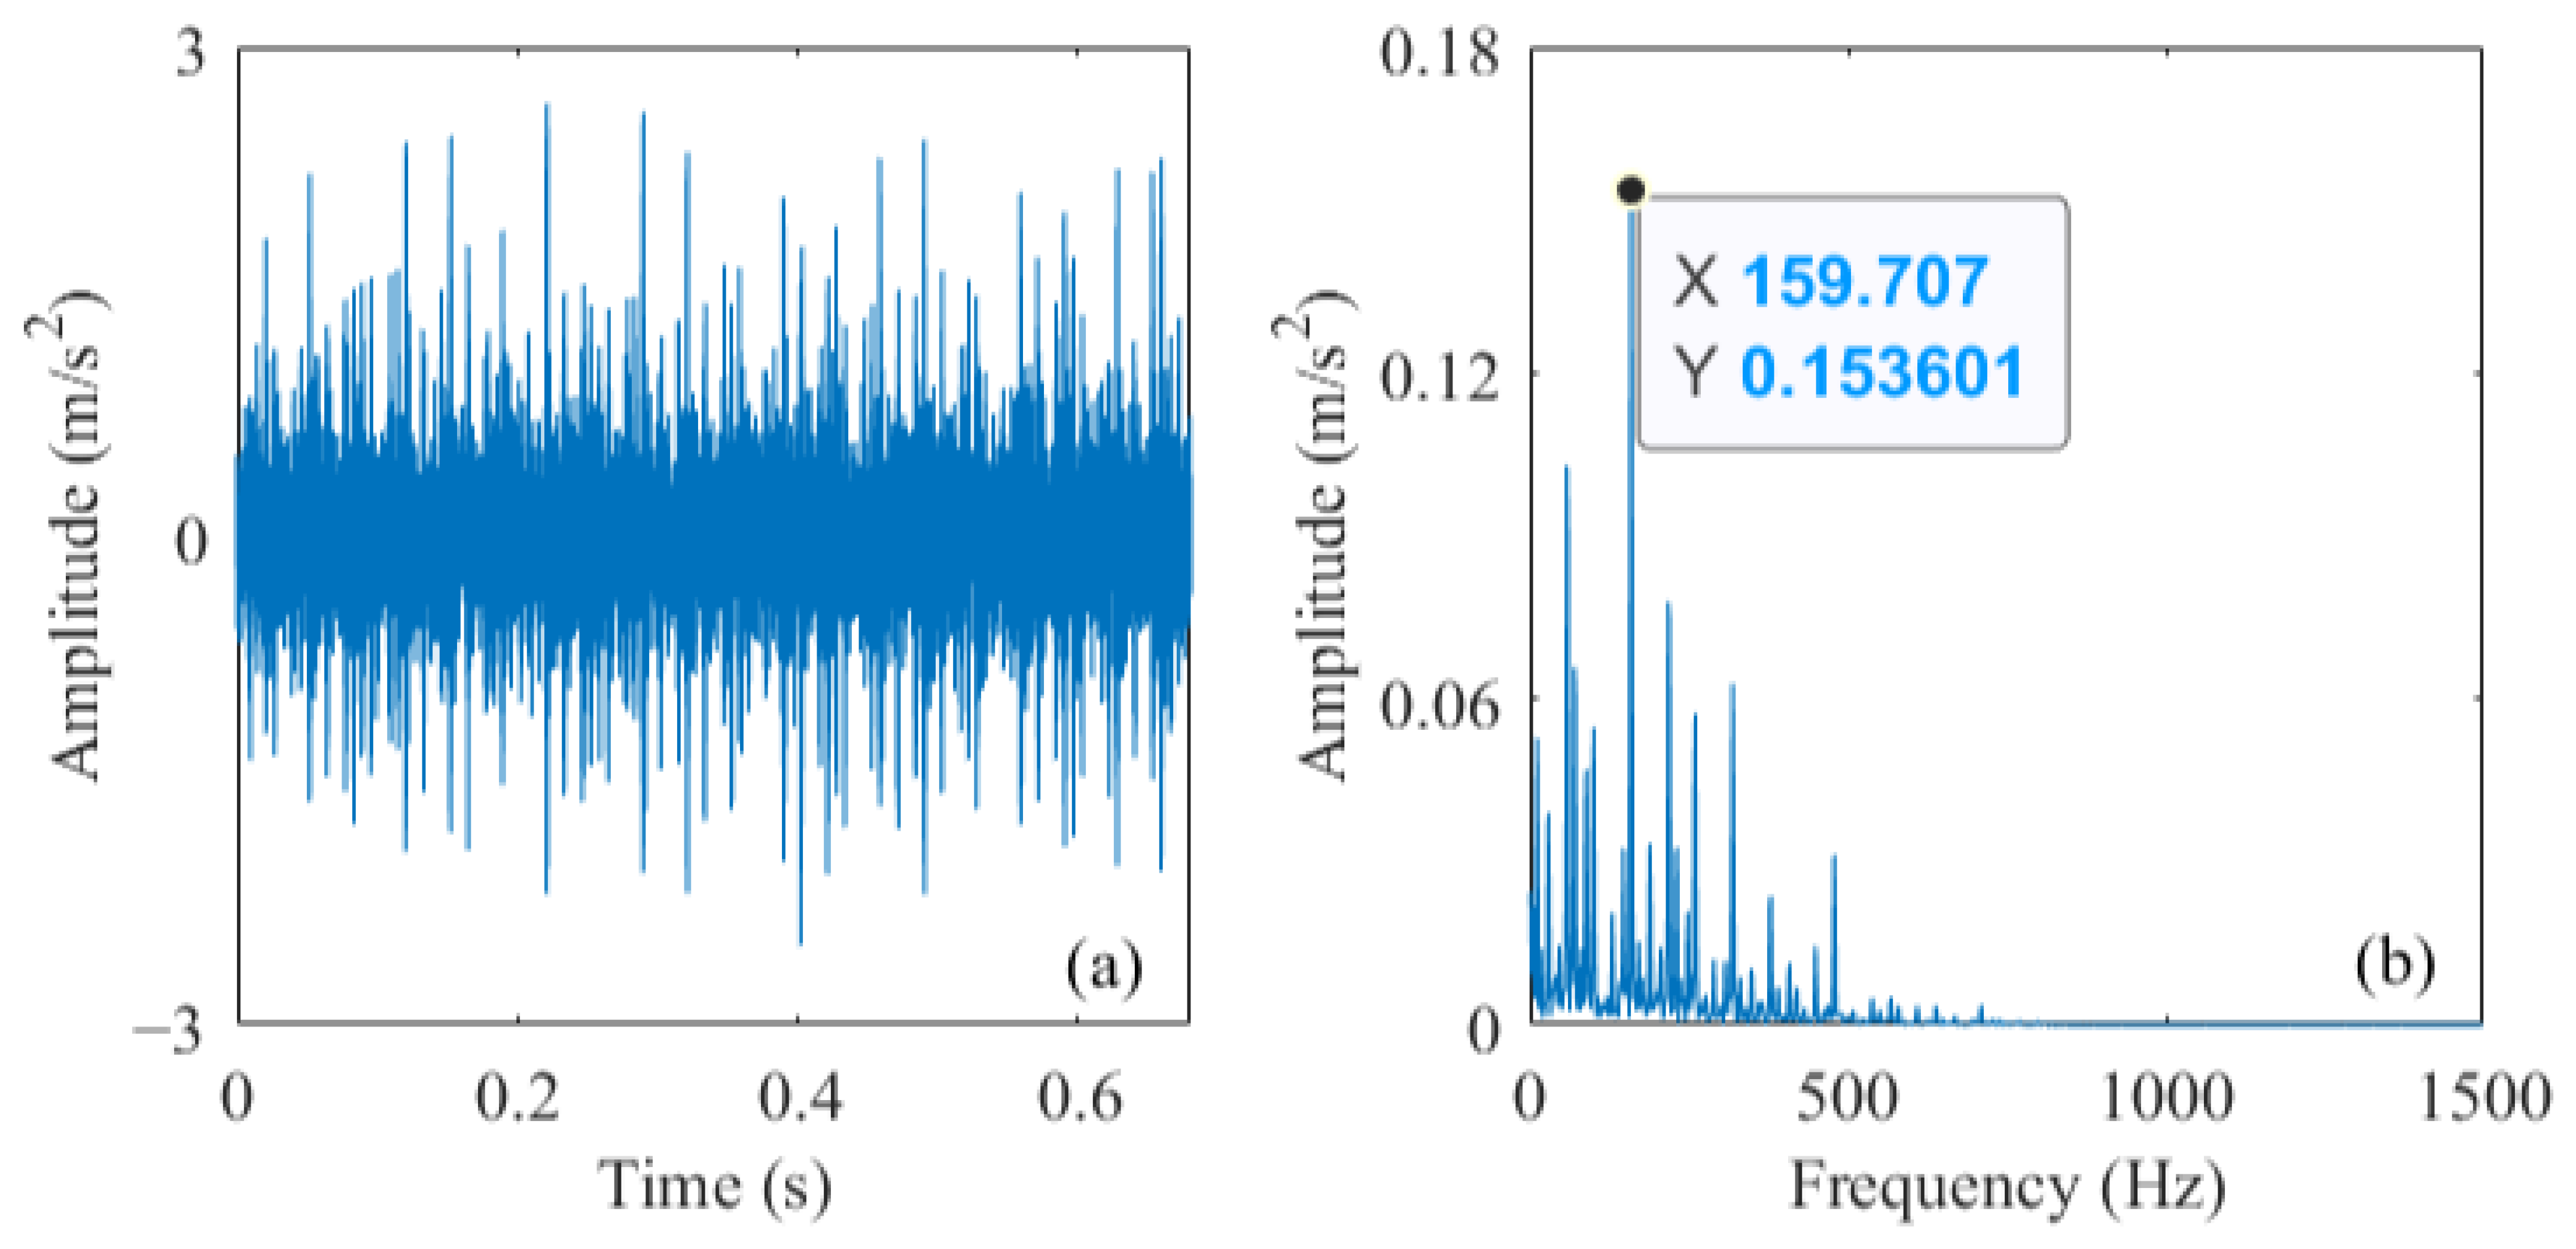
Taking the bearing inner race fault signal from the CWRU dataset as an example, Figure 9 shows the analysis results. Figure 9a presents the time-domain vibration acceleration signal acquired from experiments. With the preprocessing method proposed in this paper, we obtain the corresponding envelope spectrum in Figure 9b. It can be observed from the envelope spectrum that interfering noise is effectively suppressed, and fault features are significantly enhanced. The resulting envelope spectrum is further used as the input to perform bearing fault identification via intelligent classification algorithms.
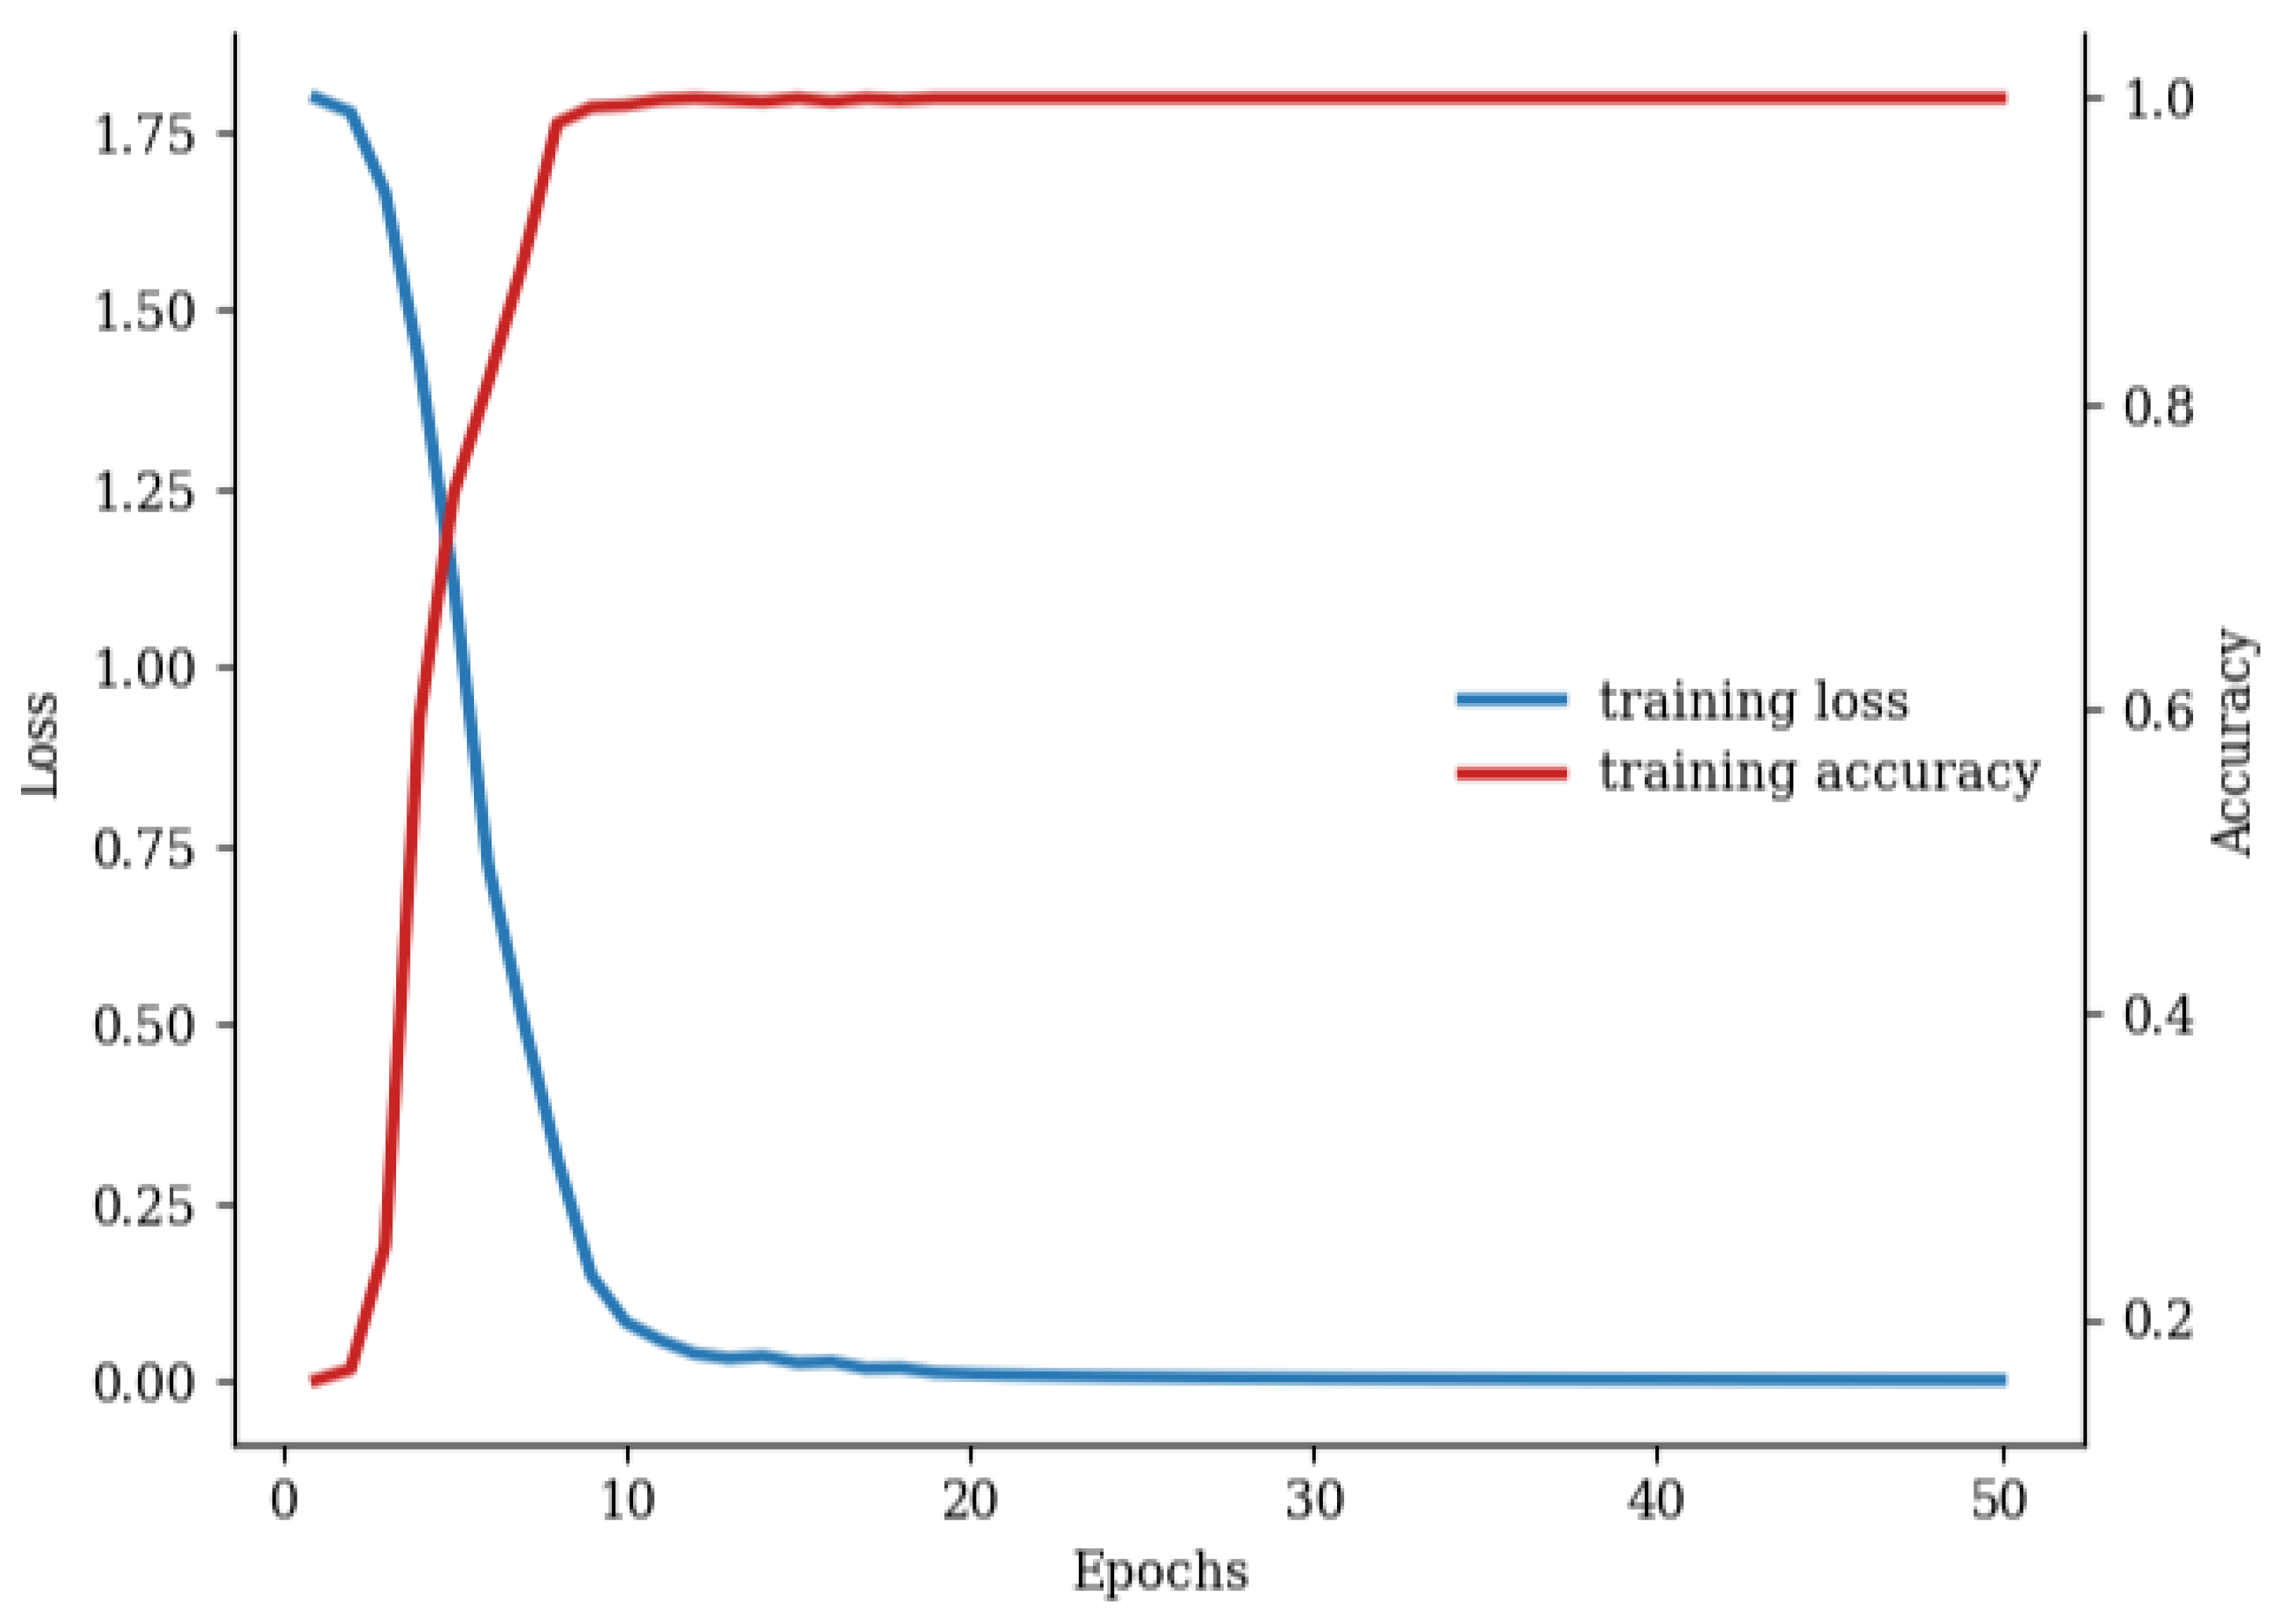
To verify the training convergence performance of the proposed method, the changing trends of training loss and training accuracy during the 50 training epochs are recorded, as illustrated in Figure 10. In the initial stage of the training iteration, the training loss decreases rapidly with the increase in training epochs, while the training accuracy rises synchronously and rapidly. This phenomenon indicates that the proposed model can efficiently capture the mapping relationship of fault features in the early training stage and possesses fast fitting capability. When the number of training epochs reaches approximately 15, the training loss gradually converges to a stable range close to zero, and the training accuracy tends to saturate synchronously, finally stabilizing at a high accuracy level nearly reaching 100%.
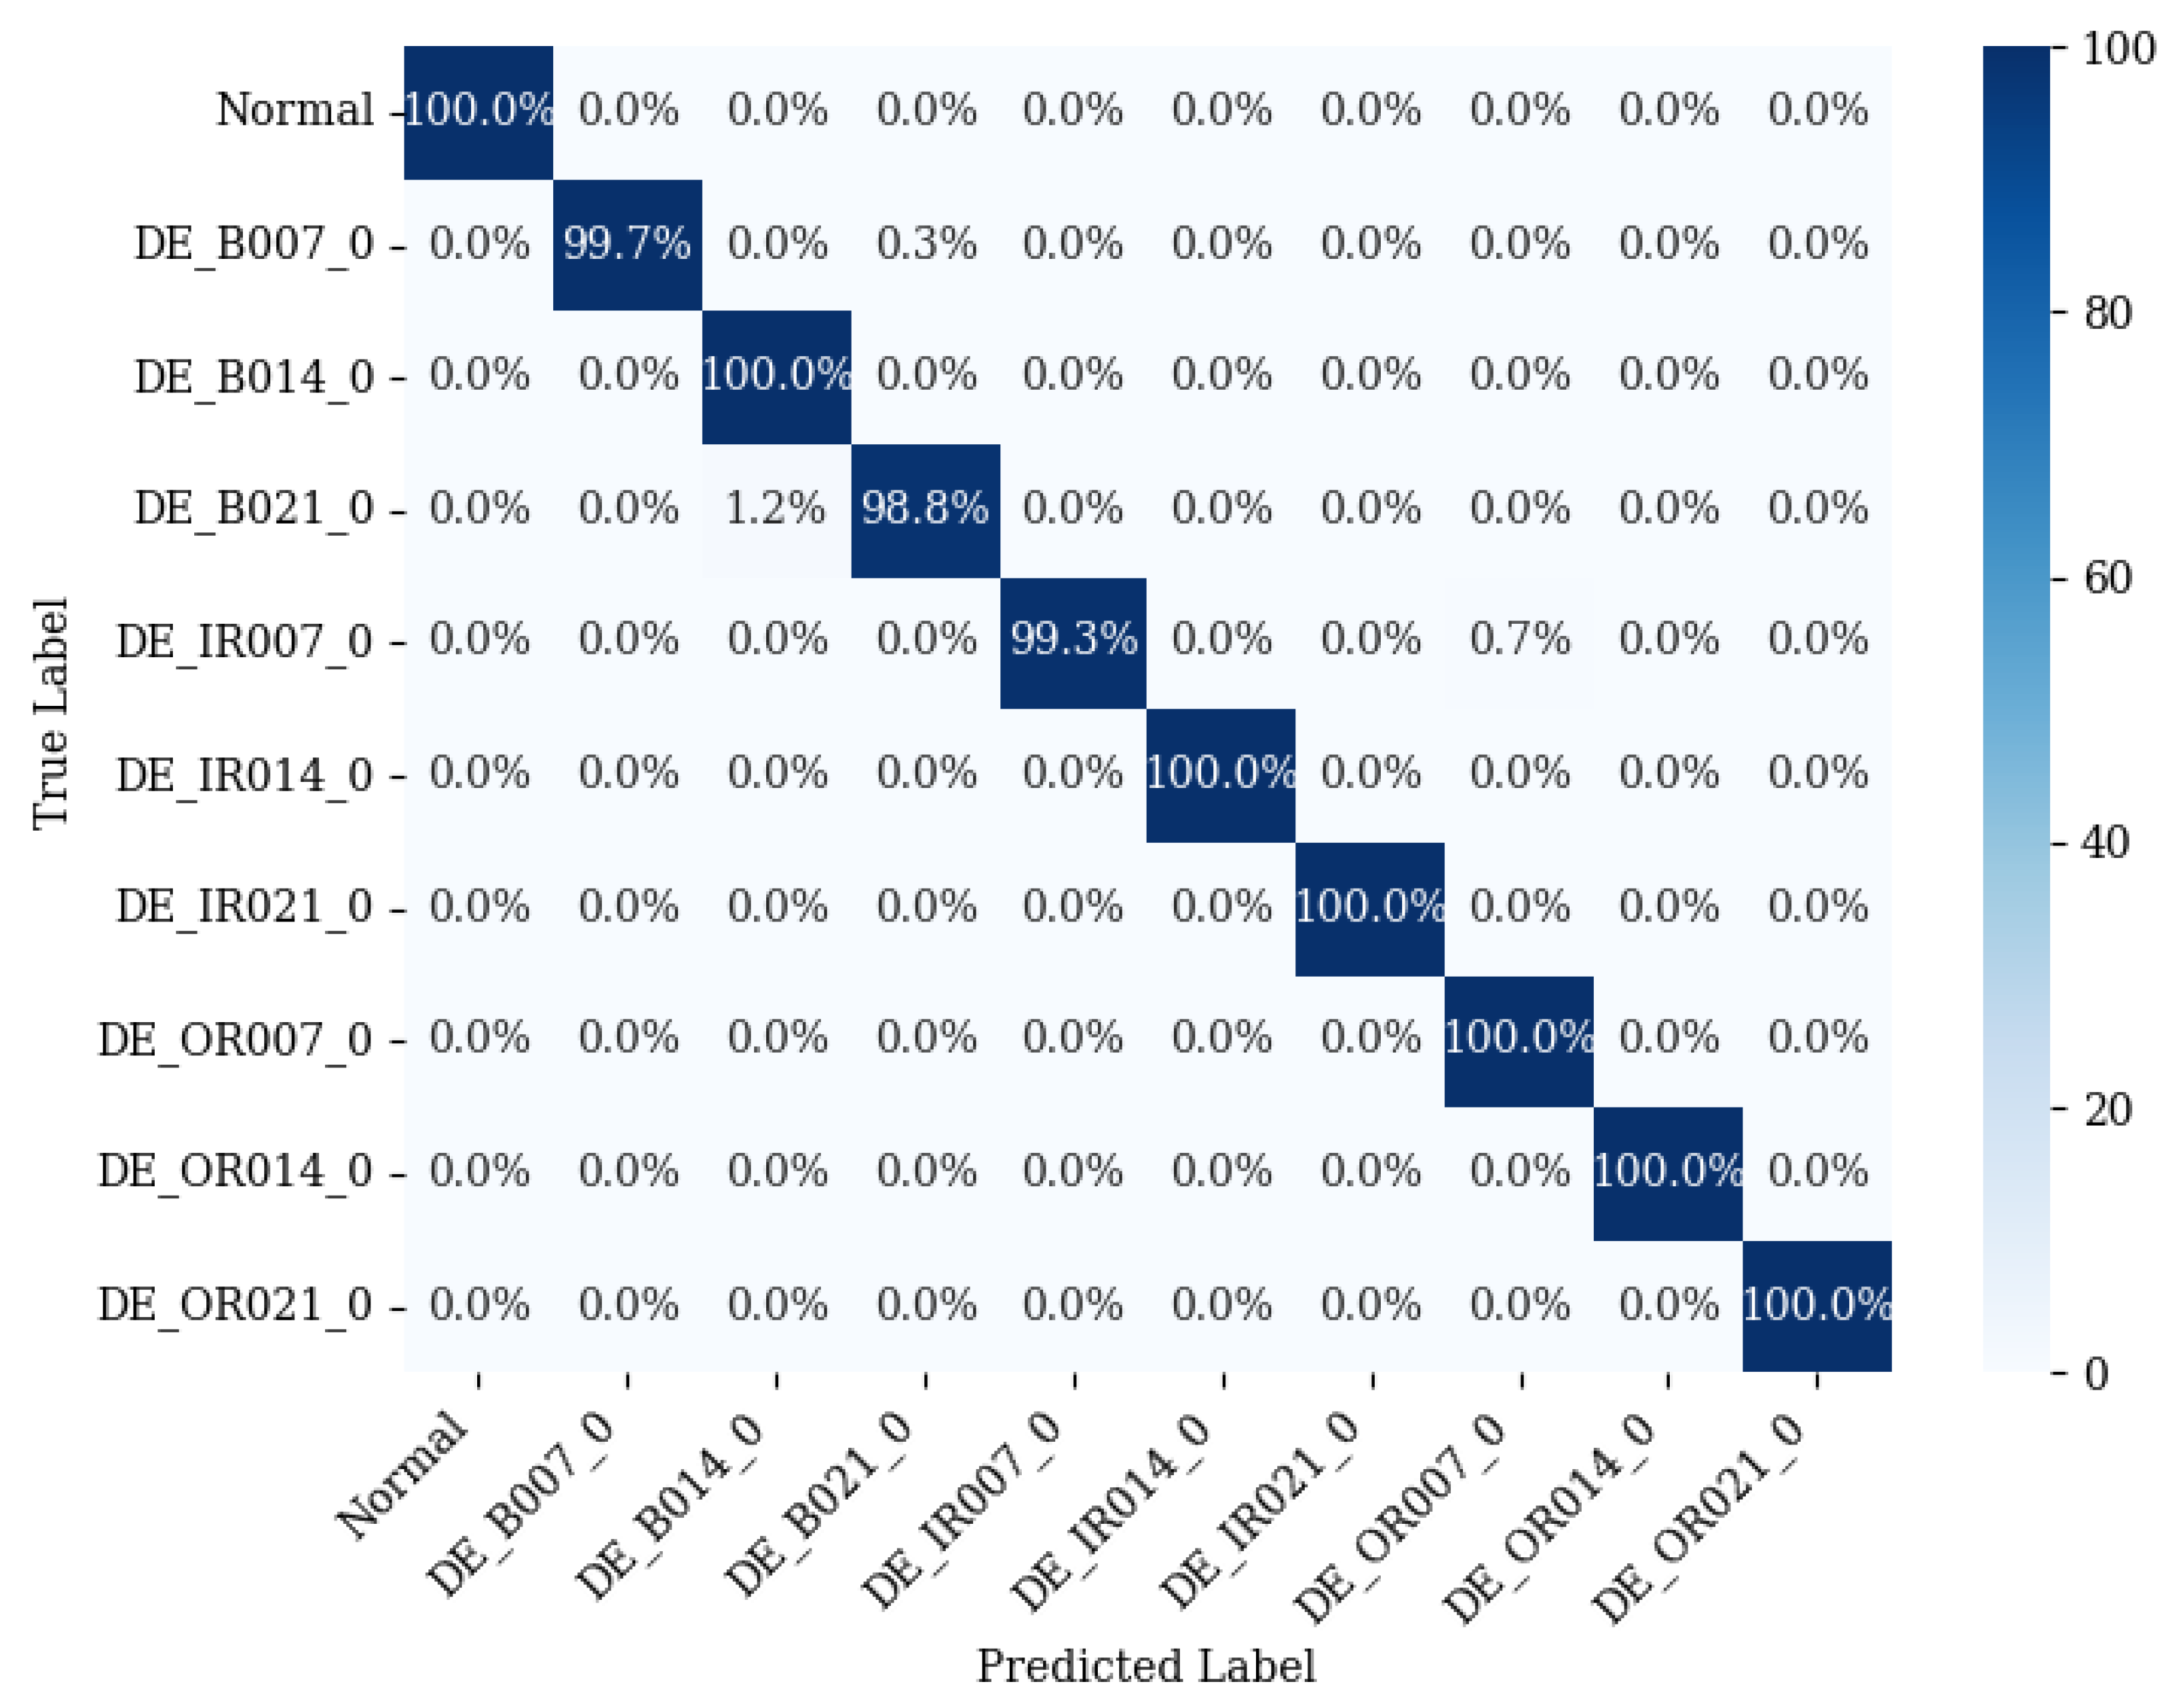
To intuitively evaluate the fault classification performance of the proposed method on the CWRU rolling bearing dataset, a normalized confusion matrix is plotted and presented in Figure 11. The diagonal elements of the confusion matrix represent the correct recognition proportion of each operating condition, while the off-diagonal elements denote the misclassification ratio of samples. The proposed method achieves high recognition accuracy for all ten bearing operating conditions in the dataset. Specifically, 100% classification accuracy is obtained for the normal condition and seven types of bearing faults. Only three categories, namely, DE_B007_0, DE_B021_0 and DE_IR007_0, suffer from a small number of misclassified samples, with the maximum misclassification ratio only reaching 1.2%. Such a low overall misclassification rate demonstrates that the proposed method can accurately identify bearing faults with different damage locations and severities.

5.4. Anti-Noise Performance Verification

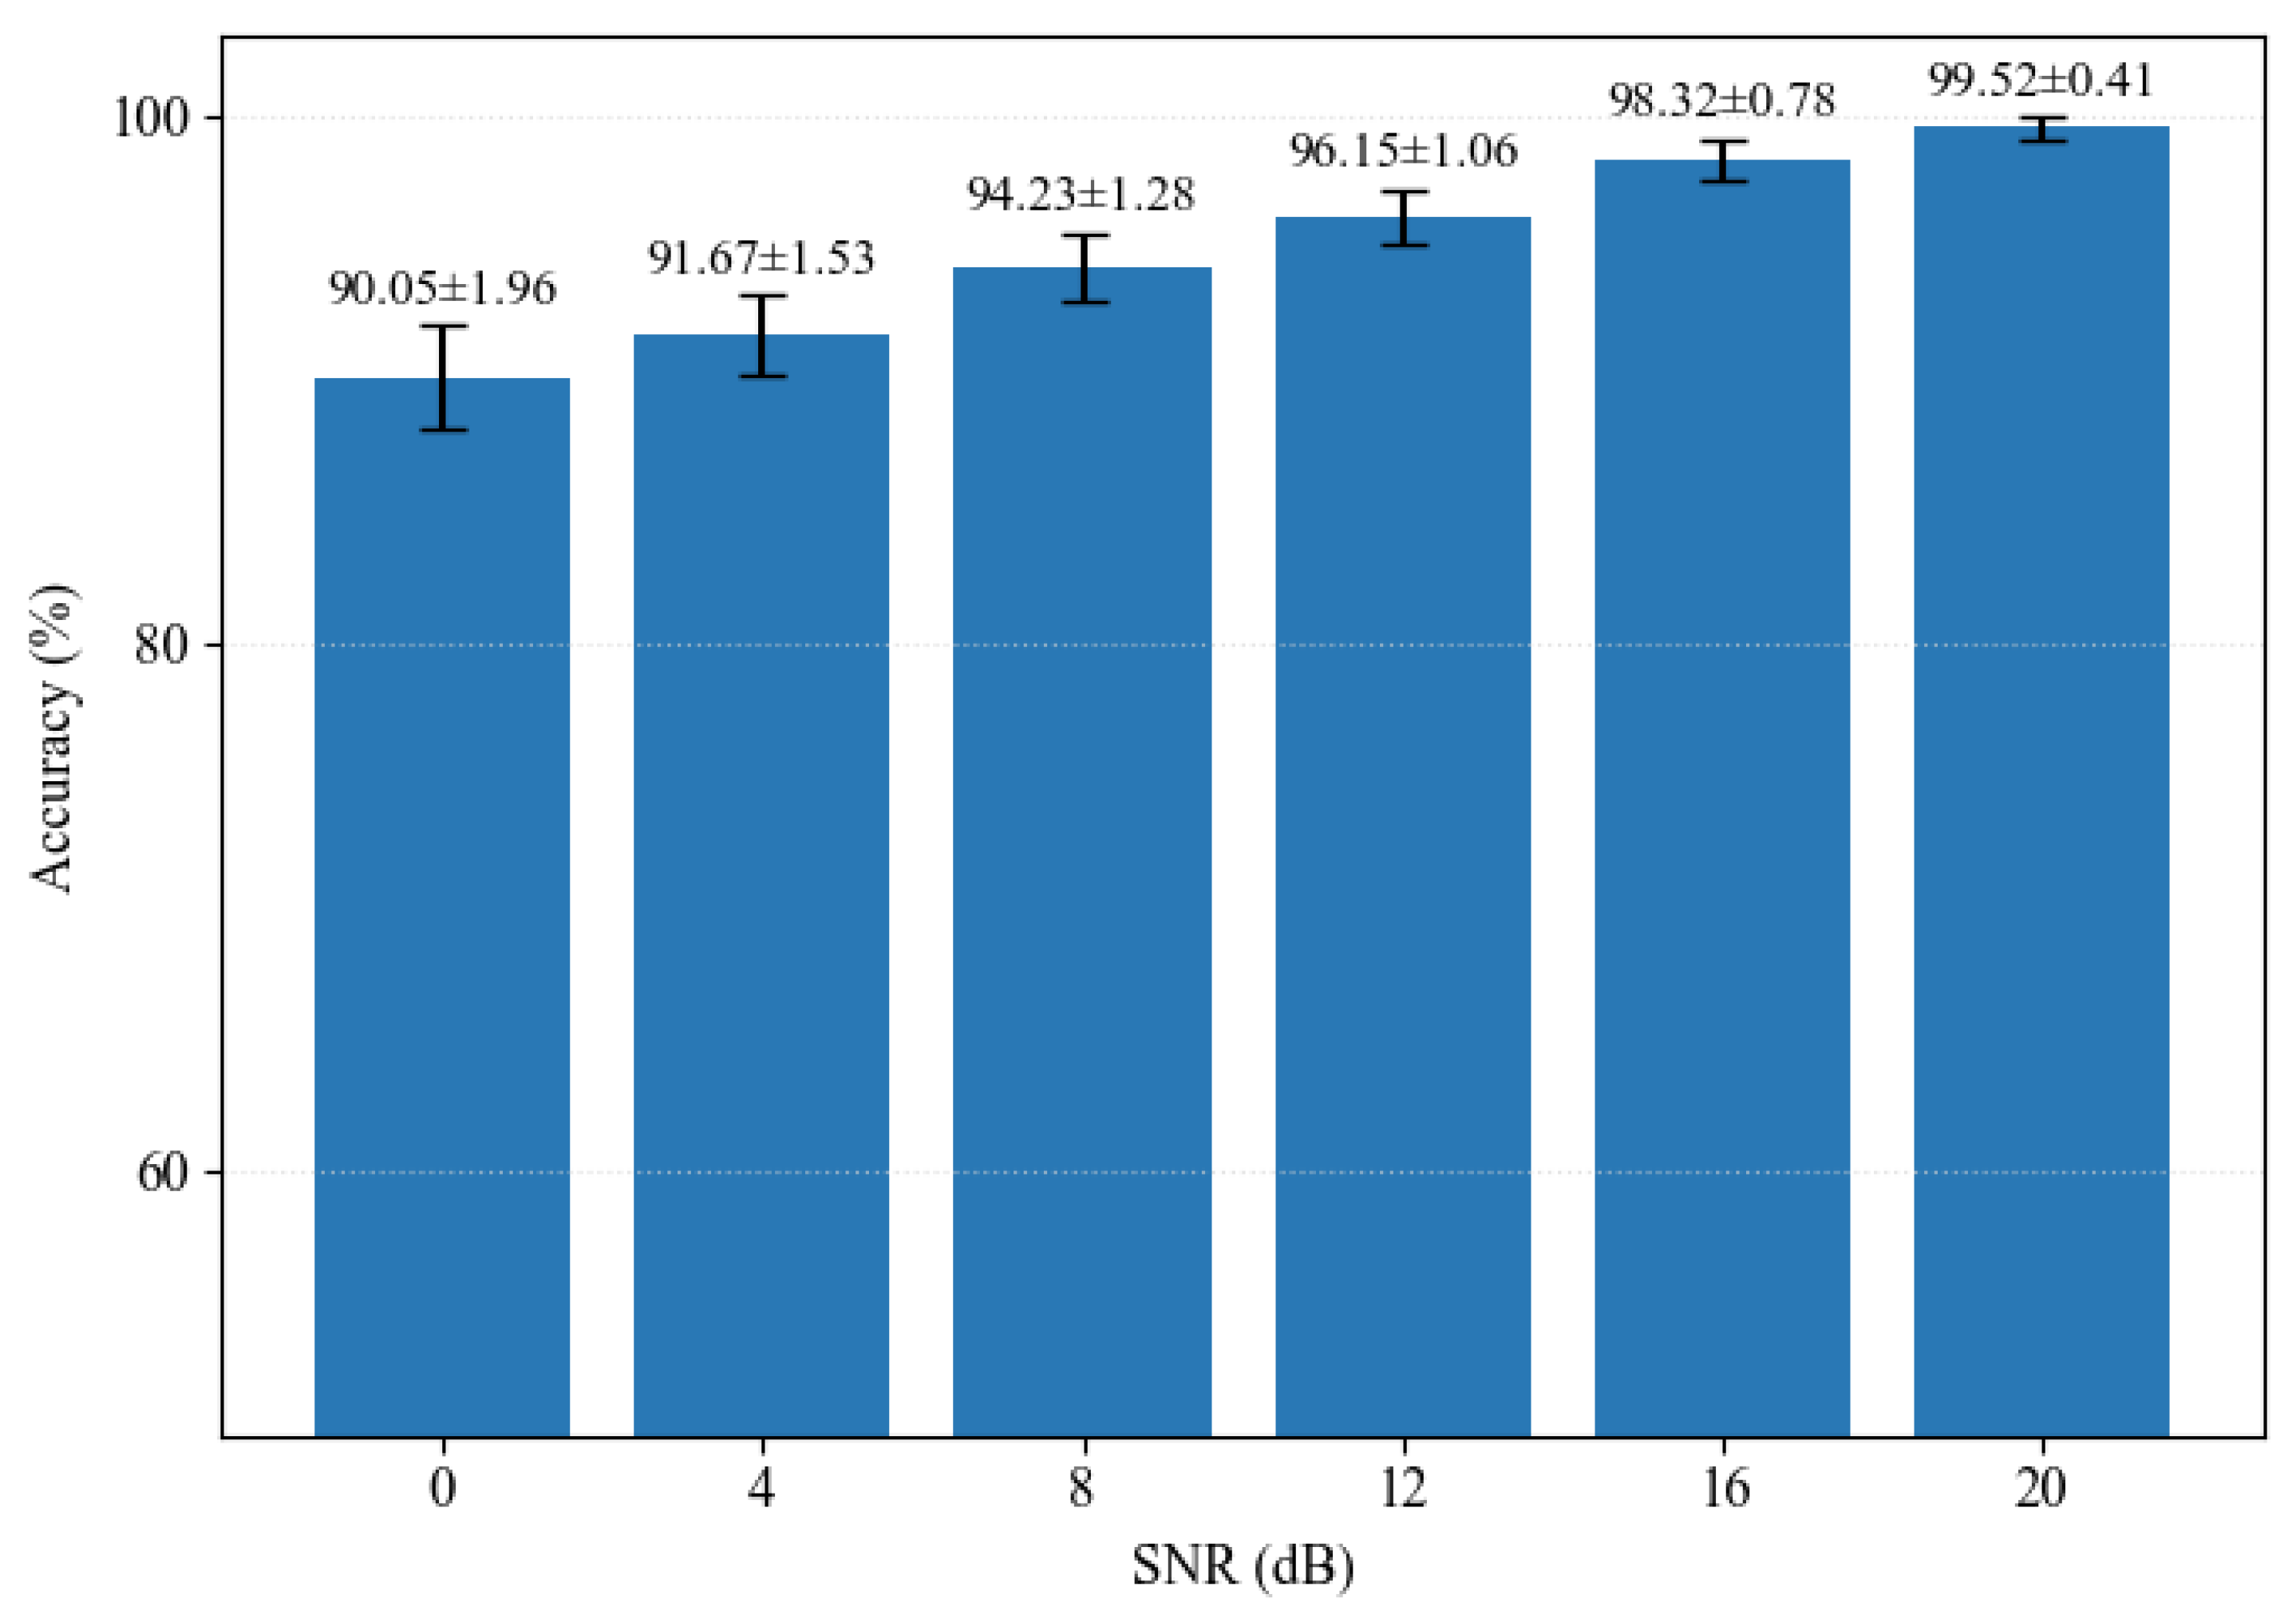
To verify the anti-noise interference capability of the proposed method, the fault classification accuracy of the model is tested under different SNR conditions. The mean and standard deviation of classification accuracy obtained from five independent runs are presented in Figure 12. Overall, the classification accuracy of the proposed method presents a steady upward trend as the SNR increases. Under low-SNR conditions, strong noise tends to submerge the original fault features. Nevertheless, the proposed method can effectively suppress the adverse effects caused by noise, with the classification accuracy maintained above 90.05%. As the SNR gradually increases, the interference of noise on effective fault features is continuously weakened; the recognition accuracy of the model is further improved and finally converges to a stable level within the high-SNR region.

5.5. Ablation Study

An ablation experiment is carried out at a SNR of 16 dB to verify the effectiveness of each module embedded in the proposed method, and the experimental results are summarized in Table 5. Model A corresponds to the complete proposed method in this paper; Model B, Model C and Model D are the comparative models with the PPCA module, AR module and SK module removed respectively; Model E is the baseline model constructed only by the LSTM network.
The proposed method achieves the optimal values among all evaluation metrics, which demonstrates that the designed framework can significantly boost the recognition performance for various bearing fault categories. The baseline Model E with only the LSTM network obtains the lowest metrics, indicating that the single LSTM network has limited capability in extracting fault features under noisy environments. After sequentially introducing the SK, AR and PPCA modules, the evaluation metrics of Model B, C and D are improved to varying degrees. Specifically, Model B without the PPCA module suffers the most obvious performance degradation, which verifies that the PPCA denoising module plays the most critical role in optimizing fault features under noisy interference scenarios.

5.6. Comparison with Existing Models

To further verify the effectiveness of the proposed method under noisy environments, comparative experiments are conducted between the proposed approach and four mainstream diagnostic algorithms, namely, 1DCNN-Transformer [39], WDCNN [40], Conv-ET [41], and Bayesian-SVM [42], under the SNR condition of 16 dB. The evaluation metrics of all comparative models are listed in Table 6.
Under the 16 dB noisy condition, the fault diagnosis accuracy of 1DCNN-Transformer, WDCNN, Conv-ET and Bayesian-SVM still has room for improvement. The proposed method achieves the optimal performance in all four evaluation metrics, including accuracy, precision, Recall and F1-Score, which demonstrates its superior comprehensive diagnostic capability over the above deep learning comparison algorithms. Traditional CNN-based models generally extract features directly from raw vibration signals through shallow convolutional layers. This approach tends to submerge effective fault features and trigger sample misclassification under noisy interference. In the Bayesian-SVM method, noise contaminates signal-derived features and interferes with the parameter-searching procedure of Bayesian optimization. Consequently, the obtained parameters deviate from the true optimal solution, which eventually leads to degraded fault diagnosis accuracy. By contrast, the proposed method can eliminate noisy redundant components in signals to highlight weak fault features. The LSTM network is further adopted to deeply mine fault-related features, thus improving the recognition accuracy of the model under noisy operating conditions.

5.7. Industrial Data Verification

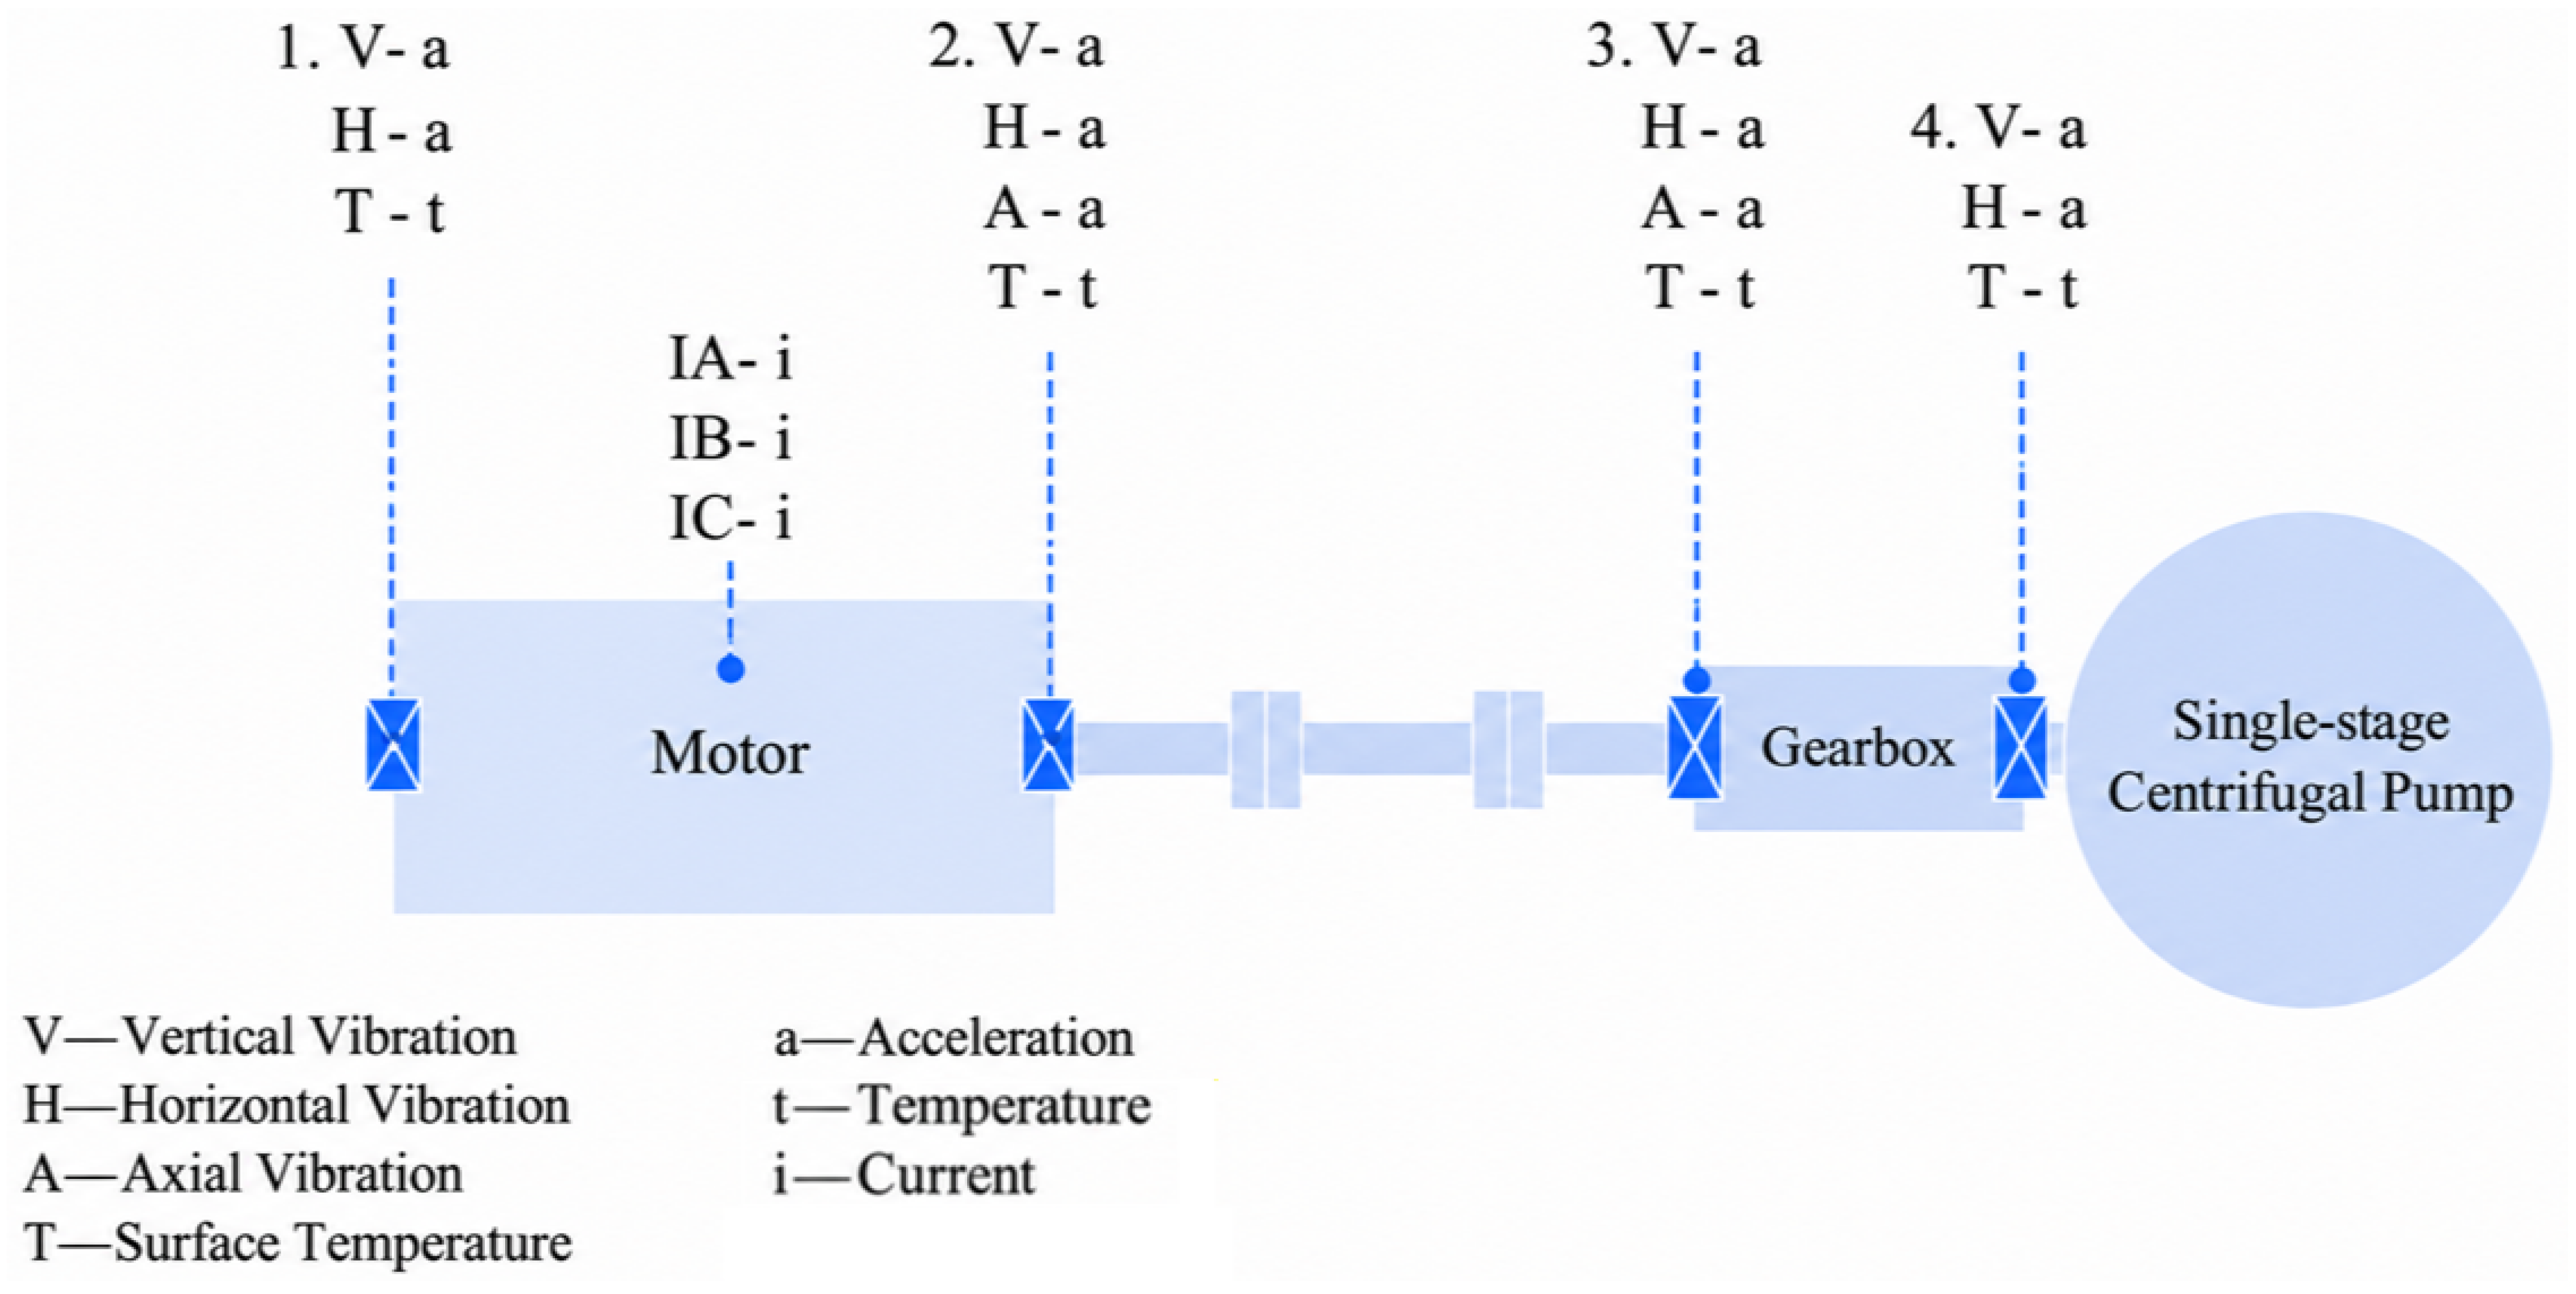
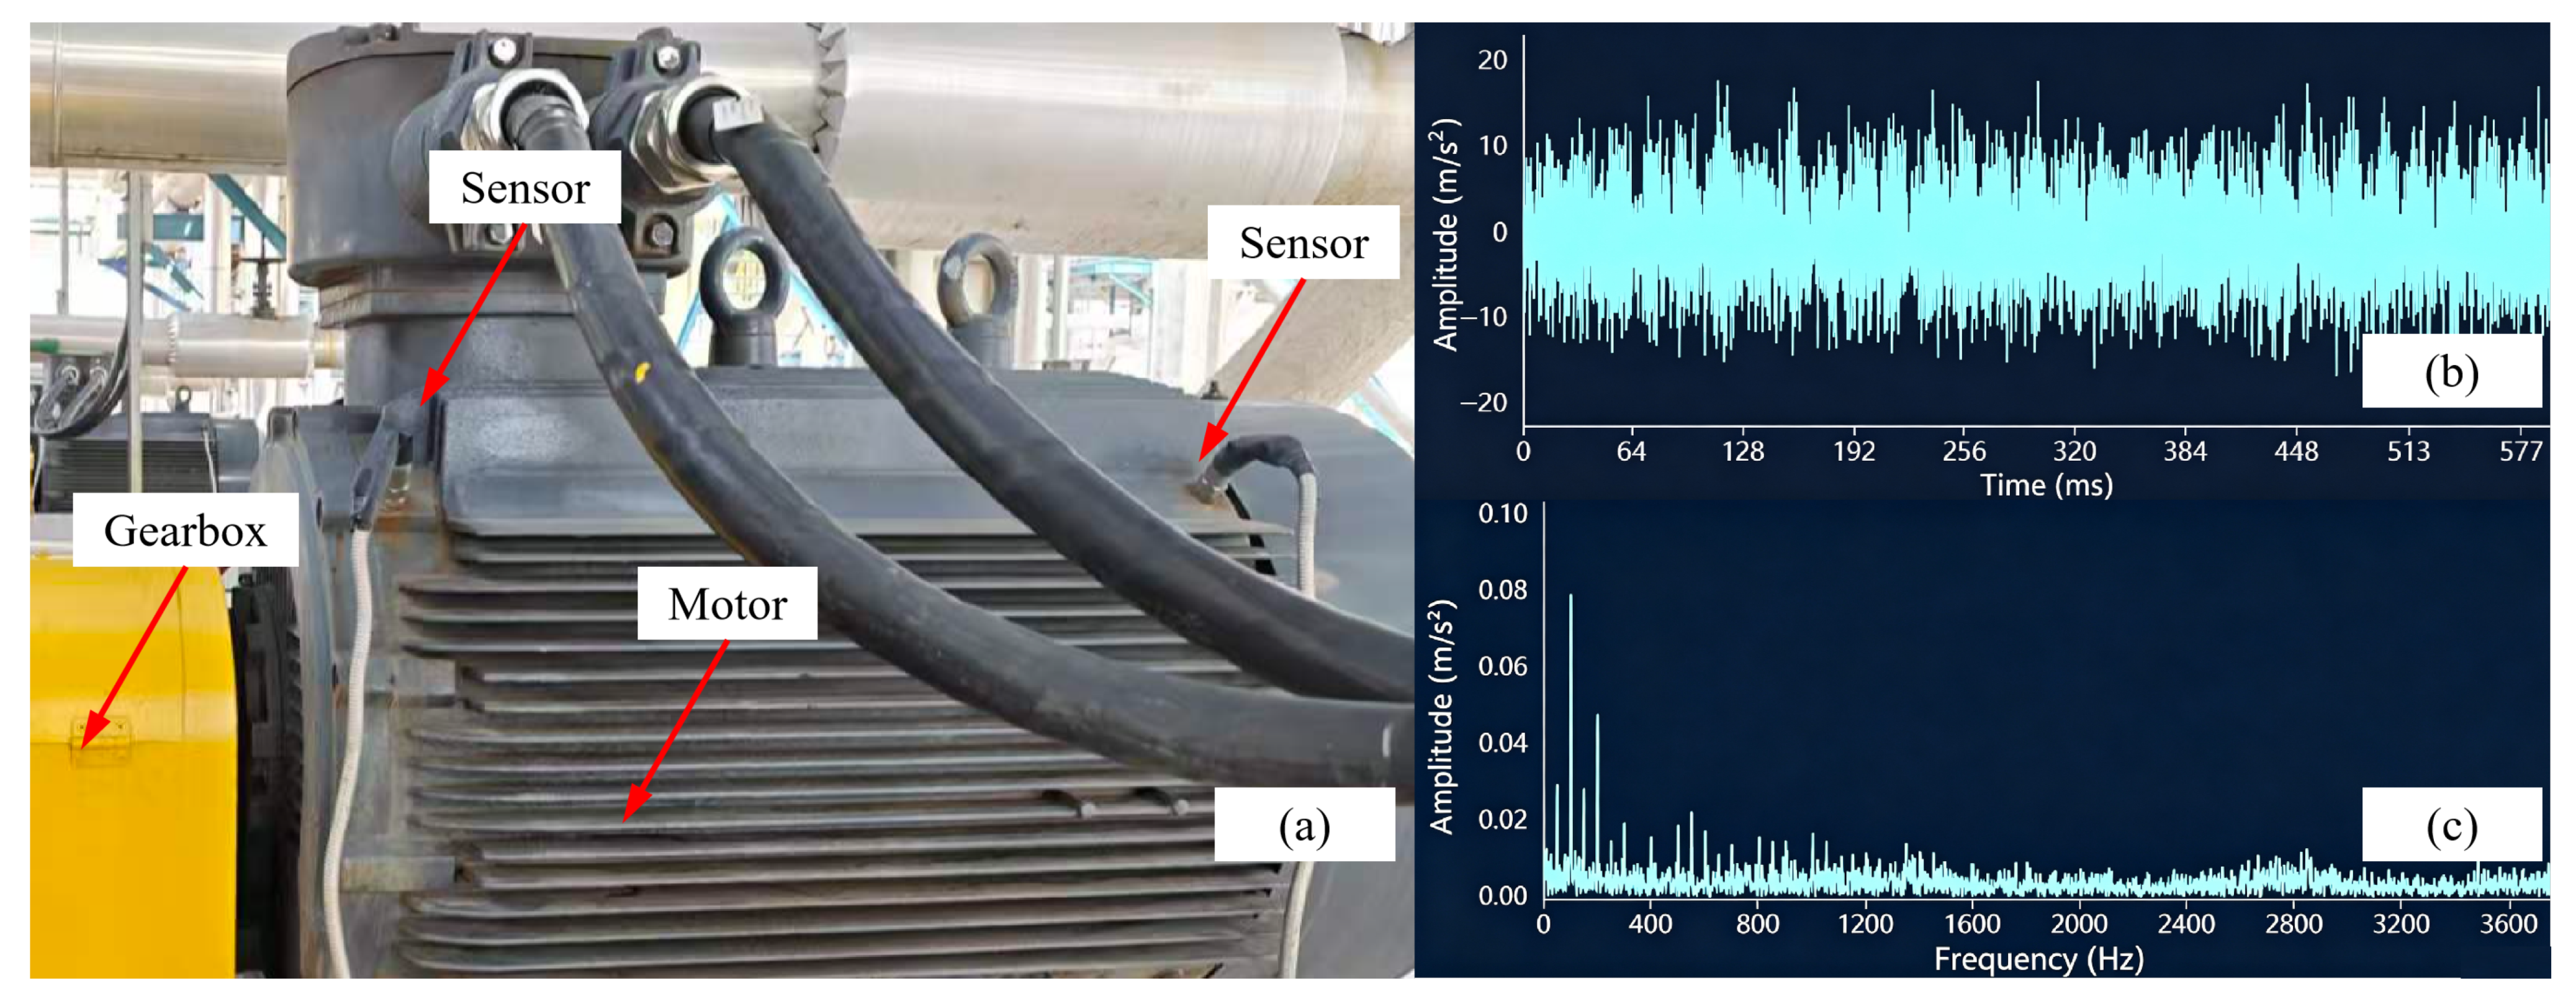
To validate the engineering practicability of the proposed method in industrial scenarios, field-measured operating data from high-temperature condensation pumps are adopted for practical case verification. The schematic diagram of the experimental test system is shown in Figure 13. The physical test setup and vibration acceleration data acquisition procedure are illustrated in Figure 14. In Figure 14a, vibration acceleration sensors are deployed for data collection. Figure 14b,c present the time and frequency-domain analysis of the acquired data. The sampling frequency is set to 12 kHz, and the rotating speed of the pump unit is 2981 r/min. The experimental data are collected from the drive-end bearing measuring points of P-2101A and P-2101B. Four typical operating conditions are covered, including normal operation, poor lubrication, overload and loose component fitting. A total of 400 groups of equipment condition samples are acquired. Sample labels are assigned according to the historical operation and maintenance records of the equipment. The dataset is divided into a training set containing 280 samples for model training and a test set with the remaining 120 samples for model performance evaluation.
The evaluation metrics of the comparative methods and the proposed approach on the industrial field dataset are summarized in Table 7. Under practical industrial working conditions contaminated by background noise, the fault diagnosis accuracy of the three competitive models (1DCNN-Transformer, WDCNN, Conv-ET and Bayesian-SVM) can be further improved. By contrast, the proposed method achieves optimal values across all four evaluation metrics. Compared with conventional deep learning models, the proposed method can effectively extract discriminative fault features from industrial vibration signals corrupted by background noise, which greatly improves the fault diagnosis accuracy under practical strong-noise industrial scenarios.
In practical industrial applications, the trained LSTM model can be embedded into the diagnosis system shown in Figure 14. This system collects vibration acceleration signals from monitored equipment in real time. Using the framework proposed in this work, noise interference is suppressed, and fault-related features are enhanced. Subsequently, envelope spectrum features are extracted and input into the pre-trained neural network model to generate real-time online diagnosis outputs. Experimental tests yield a diagnosis latency of 86 ms. Compared with the latency metrics reported in [43], the proposed method satisfies real-time operation requirements.

6. Conclusions

Aiming at the low fault identification accuracy of traditional LSTM-based rolling bearing fault diagnosis under industrial strong-noise operating conditions, this paper proposes a novel rolling bearing fault diagnosis framework integrating PPCA denoising, AR discrete interference suppression, spectral kurtosis feature enhancement and LSTM-based intelligent fault recognition. In the proposed method, the spectral kurtosis metric is adopted to adaptively determine the principal component dimension of PPCA for effective background noise removal. The AR model is utilized to suppress discrete harmonic interference, and spectral kurtosis resonance demodulation is further employed to amplify weak fault-induced impulse features.
Experimental results on the CWRU dataset demonstrate that the presented approach accurately identifies bearing faults with diverse fault locations and damage severities. It maintains favorable diagnostic performance under strong-noise conditions and outperforms comparative deep learning models in comprehensive evaluation metrics, which improves the industrial practicability of LSTM.
Beyond validation on public datasets, the proposed framework is further evaluated using real-world industrial measurement data. Experimental results verify that the developed method is adaptable to complex practical industrial working conditions and achieves satisfactory diagnostic performance, satisfying the on-site application requirements for rolling bearing fault diagnosis.
In future research, few-shot learning can be adopted to tackle insufficient labeled fault samples in industrial practice. Related research under variable working conditions will be performed to handle challenges arising from feature frequency variations. Meanwhile, lightweight network modifications will be implemented to reduce computational consumption. Furthermore, an integrated model for fault diagnosis and remaining useful life prediction can be constructed. Real-time operational data of machinery will be leveraged to explore fault evolution mechanisms, enabling dynamic life assessment of equipment alongside accurate fault category identification.


Author Contributions

Conceptualization, S.S. and W.H.; methodology, S.S. and W.H.; software, C.Z. and S.Z.; validation, S.S. and W.H.; formal analysis, S.S.; investigation, C.Z. and S.Z.; resources, W.H. and J.Z.; data curation, C.Z. and S.Z.; writing—original draft preparation, S.S.; writing—review and editing, S.S. and W.H.; visualization, S.S.; supervision, J.Z.; project administration, S.J.; funding acquisition, S.J. All authors have read and agreed to the published version of the manuscript.

Funding

This work was supported by the Scientific Research Project of the Zhejiang Provincial Market Regulation Technology Innovation Alliance (LM2026034): Research on Fault Diagnosis of Elevator Traction Machine Bearings Based on Multi-source Heterogeneous Data Fusion, and the Zhejiang Provincial Science and Technology Plan Project (2025C02001).

Institutional Review Board Statement

Not applicable.

Informed Consent Statement

Not applicable.

Data Availability Statement

The CWRU bearing dataset is publicly available at https://engineering.case.edu/bearingdatacenter (accessed on 30 May 2026). Further inquiries can be directed to the corresponding author.

Conflicts of Interest

The authors declare no conflicts of interest.

Abbreviations

The following abbreviations and parameters are used in this manuscript:
Abbreviations
LSTMLong short-term memory
PPCAProbabilistic principal component analysis
ARAutoregressive
SKSpectral kurtosis
SNRSignal-to-noise ratio
CWRUCase Western Reserve University
RNNRecurrent neural network
Parameters
X Observed raw vibration signal matrix, m / s 2 C t Memory cell state of LSTM network
x m One-dimensional vibration signal sample, m / s 2 C t 1 Previous memory cell state
nLength of raw vibration data C ˜ t Candidate cell state of LSTM
mSample dimension of signal matrix h t Hidden state at time step t
P Parameter matrix of PPCA model h t 1 Previous hidden state
kNumber of principal components x t Network input at time step t
u Latent variable matrix f t Forget-gate output
E Gaussian noise matrix, m / s 2 i t Input-gate output
N ( · ) Gaussian normal distribution O t Output-gate output
I Identity matrix sigm ( · ) Sigmoid activation function
σ 2 Variance in Gaussian noise tanh ( · ) Hyperbolic tangent activation function
C Covariance matrix W f Weight matrix of forget gate
p ( u ) Prior probability density of latent variable b f Bias parameter of forget gate
p ( X | u ) Conditional probability density W i Weight matrix of input gate
p ( X ) Marginal probability density of observed data b i Bias parameter of input gate
P ˜ Updated parameter matrix by EM algorithm W c Weight matrix for cell state updating
σ ˜ 2 Estimated noise variance b c Bias parameter for cell state updating
S Covariance matrix of observed vibration data W o Weight matrix of output gate
M Intermediate k × k matrix in iteration b o Bias parameter of output gate
tr ( · ) Trace operator of matrix s ( t ) Fault impulse response signal, m / s 2
u i Projection vector of ith principal component e ( t ) Gaussian white noise, m / s 2
p i Basis vector of PPCA model f n Natural frequency of bearing system, Hz
tDiscrete time indexBAttenuation coefficient
qModel order of AR model ξ Damping ratio
a ( p ) Coefficient of AR modelTFault impulse period, s
v ( t ) Residual prewhitened signal, m / s 2 f 0 Fault characteristic frequency, Hz
fFrequency variable, Hz u ( · ) Unit step function
x ( f ) Frequency domain of raw signal, m / s 2 f s Sampling frequency, Hz
v ( f ) Frequency domain of prewhitened signal, m / s 2 NTotal number of sampling points
H ( t , f ) Time-varying impulse response function SNR Signal-to-noise ratio, dB
d Z x ( f ) Spectral increment P s Power of fault impulse signal
K x ( f ) Spectral kurtosis of original signal P n Power of noise component
· Time-averaging operator c ( t ) Shaft harmonic interference component, m / s 2
z x ( t ) Analytic signal of x ( t ) , m / s 2 f θ Shaft rotational frequency, Hz
x ˜ ( t ) Hilbert transformed signal, m / s 2 A 1 , A 2 , A 3 Amplitude of harmonic interference, m / s 2

References

  1. Zhou, B.; Shen, X.; Bao, J. Large language model with integrated ontology and inference chain constraints for generative information extraction from metallurgical lifting equipment failure reports. Appl. Sci. 2026, 16, 6178. [Google Scholar] [CrossRef] [Scilit]
  2. Neupane, D.; Bouadjenek, M.R.; Dazeley, R.; Aryal, S. Data-driven machinery fault diagnosis: A comprehensive review. Neurocomputing 2025, 627, 129588. [Google Scholar] [CrossRef] [Scilit]
  3. Garcia, J.; Rios-Colque, L.; Peña, A.; Rojas, L. Condition monitoring and predictive maintenance in industrial equipment: An NLP-assisted review of signal processing, hybrid models, and implementation challenges. Appl. Sci. 2025, 15, 5465. [Google Scholar] [CrossRef] [Scilit]
  4. Afshar, M.; Heydarzadeh, M.; Akin, B. A comprehensive investigation of fault signatures and spectrum analysis of vibration signals in distributed bearing faults. IEEE Trans. Ind. Appl. 2025, 61, 515–526. [Google Scholar] [CrossRef] [Scilit]
  5. Khorram, A.; Khalooei, M.; Rezghi, M. End-to-end CNN+LSTM deep learning approach for bearing fault diagnosis. Appl. Intell. 2019, 51, 736–751. [Google Scholar] [CrossRef] [Scilit]
  6. Sharma, R.B.; Parey, A. Modelling of acoustic emission generated in rolling element bearing. Appl. Acoust. 2019, 144, 96–112. [Google Scholar] [CrossRef] [Scilit]
  7. Atmaji, F.T.D.; Jamasri; Yuniarto, H.A.; Miasa, I.M. Experimental investigation of shaft misalignment effects on bearing reliability through vibration signal analysis using machine learning and deep learning. Results Eng. 2025, 27, 106754. [Google Scholar] [CrossRef] [Scilit]
  8. Barszcz, T.; Jabłoński, A. A novel method for the optimal band selection for vibration signal demodulation and comparison with the Kurtogram. Mech. Syst. Signal Process. 2011, 25, 431–451. [Google Scholar] [CrossRef] [Scilit]
  9. Randall, R.B.; Antoni, J. Rolling element bearing diagnostics—A tutorial. Mech. Syst. Signal Process. 2011, 25, 485–520. [Google Scholar] [CrossRef] [Scilit]
  10. Jia, Y.R.; Yao, D.C.; Yang, J.W.; Jia, L.M.; Zhou, T.; Long, Q.Y. A multi-scale wavelet and spectral kurtosis-guided framework for noise-resistant rolling bearing fault diagnosis. Mech. Syst. Signal Process. 2026, 242, 113662. [Google Scholar] [CrossRef] [Scilit]
  11. Bai, X.C.; Wang, Y.X.; Zhang, C.F. Research on denoising of rolling bearing vibration signals based on the ISSA-VMD-JWTD method. Digit. Signal Process. 2026, 173, 105912. [Google Scholar] [CrossRef] [Scilit]
  12. Gao, Z.Q.; Zheng, J.D.; Pan, H.Y.; Cheng, J.; Tong, J.Y. Adaptive generalized empirical wavelet transform and its application to fault diagnosis of rolling bearing. Measurement 2025, 249, 116958. [Google Scholar] [CrossRef] [Scilit]
  13. Liang, P.F.; Tian, J.Y.; Wang, S.Y.; Yuan, X.M. Multi-source information joint transfer diagnosis for rolling bearing with unknown faults via wavelet transform and an improved domain adaptation network. Reliab. Eng. Syst. Saf. 2024, 242, 109788. [Google Scholar] [CrossRef] [Scilit]
  14. Rohan, A.I.; Ridita, T.A.; Anonto, H.Z.; Hossain, M.I.; Shufian, A.; Mahin, M.S.R.; Islam, M.A. Intelligent fault diagnosis in rolling element bearings: Combining envelope spectrum and spectral kurtosis for enhanced detection. Results Eng. 2025, 27, 106899. [Google Scholar] [CrossRef] [Scilit]
  15. Park, J.; Yoo, J.; Kim, T.; Kim, M.; Ha, J.M.; Youn, B.D. Spectral kurtosis attention network (SKAN): Synergizing signal processing and deep learning for fault diagnosis of rolling element bearings. Expert Syst. Appl. 2025, 292, 128581. [Google Scholar] [CrossRef] [Scilit]
  16. Wang, J.G.; Zhao, Y.; Han, L.C.; Shen, Y.J.; Yuan, W.R. Application of fast high-order symmetric difference analytic energy spectrum kurtosis for wind power drive chain fault localization. Digit. Signal Process. 2026, 169, 105708. [Google Scholar] [CrossRef] [Scilit]
  17. Shao, L.C.; Zhao, B.; Kang, X.T. Rolling bearing fault diagnosis based on VMD-DWT and HADS-CNN-BiLSTM hybrid model. Machines 2025, 13, 423. [Google Scholar] [CrossRef] [Scilit]
  18. Wu, C.M.; Zheng, S.P. Fault diagnosis method of rolling bearing based on MSCNN-LSTM. CMC-Comput. Mater. Con. 2024, 79, 4395–4411. [Google Scholar] [CrossRef] [Scilit]
  19. Liang, J.H.; Wang, L.P.; Wu, J.; Liu, Z.G.; Yu, G. Elimination of end effects in LMD by Bi-LSTM regression network and applications for rolling element bearings characteristic extraction under different loading conditions. Digit. Signal Process. 2020, 107, 102881. [Google Scholar] [CrossRef] [Scilit]
  20. Wu, L.; Ding, N.X.; Wang, L.L.; Li, J.W.; Zhang, H.Y. Physics-informed attention LSTM: A dual-knowledge fusion framework for interpretable bearing fault diagnosis under small data scenarios. Measurement 2026, 263, 120216. [Google Scholar] [CrossRef] [Scilit]
  21. Qiu, B.B.; Liu, S.Q.; Li, W.D.; Wang, X.V.; Wang, L.H. Dynamic adaptive fault diagnosis using multi-channel image fusion and deep learning in channel failure occasions on rolling bearings. Adv. Eng. Inform. 2025, 68, 103631. [Google Scholar] [CrossRef] [Scilit]
  22. Kumar, R.; Singh, M. Outer race defect width measurement in taper roller bearing using discrete wavelet transform of vibration signal. Measurement 2013, 46, 537–545. [Google Scholar] [CrossRef] [Scilit]
  23. Bastami, A.R.; Vahid, S. Estimating the size of naturally generated defects in the outer ring and roller of a tapered roller bearing based on autoregressive model combined with envelope analysis and discrete wavelet transform. Measurement 2020, 159, 107767. [Google Scholar] [CrossRef] [Scilit]
  24. Cerrada, M.; Sánchez, R.-V.; Li, C.; Pacheco, F.; Cabrera, D.; de Oliveira, J.V.; Vásquez, R.E. A review on data-driven fault severity assessment in rolling bearings. Mech. Syst. Signal Process. 2018, 99, 169–196. [Google Scholar] [CrossRef] [Scilit]
  25. Plakias, S.; Boutalis, Y.S. Fault detection and identification of rolling element bearings with Attentive Dense CNN. Neurocomputing 2020, 405, 208–217. [Google Scholar] [CrossRef] [Scilit]
  26. Brzostowski, K. Sparse reconstruction for enhancement of the empirical mode decomposition-based signal denoising. IEEE Access 2020, 8, 111566–111584. [Google Scholar] [CrossRef] [Scilit]
  27. Moshrefzadeh, A.; Fasana, A. The Autogram: An effective approach for selecting the optimal demodulation band in rolling element bearings diagnosis. Mech. Syst. Signal Process. 2018, 105, 294–318. [Google Scholar] [CrossRef] [Scilit]
  28. Tapia, E.; Lopez-Novoa, U.; Sastoque-Pinilla, L.; López-de-Lacalle, L.N. Comparison of federated learning frameworks for discrete event manufacturing systems. Int. J. Data Sci. Anal. 2026, 22, 228. [Google Scholar] [CrossRef] [Scilit]
  29. Luu, T.T.; Huynh, D.A. An efficient lightweight multi-scale CNN framework with CBAM and SPP for bearing fault diagnosis. Intell. Syst. Appl. 2026, 29, 200628. [Google Scholar] [CrossRef] [Scilit]
  30. Bellas, A.; Bouveyron, C.; Cottrell, M.; Lacaille, J. Model-based clustering of high-dimensional data streams with online mixture of probabilistic PCA. Adv. Data Anal. Classif. 2013, 7, 281–300. [Google Scholar] [CrossRef] [Scilit]
  31. Zuccolotto, P. Principal component analysis with interval imputed missing values. AStA-Adv. Stat. Anal. 2012, 96, 1–23. [Google Scholar] [CrossRef] [Scilit]
  32. Cardoso, F.R.; Achcar, J.A.; Piratelli, C.L.; Hermosilla, J.L.G.; Barbosa, J.G. Bayesian analysis of employee suggestions in a food company. Int. J. Adv. Manuf. Technol. 2014, 70, 2059–2070. [Google Scholar] [CrossRef] [Scilit]
  33. McLachlan, G.; Krishnan, T. The EM Algorithm and Extensions, 2nd ed.; Wiley: New York, NY, USA, 2008; pp. 41–75. [Google Scholar]
  34. Wang, D.; Tse, P.W.; Tsui, K.L. An enhanced Kurtogram method for fault diagnosis of rolling element bearings. Mech. Syst. Signal Process. 2013, 35, 176–199. [Google Scholar] [CrossRef] [Scilit]
  35. Antoni, J. Blind separation of vibration components: Principles and demonstrations. Mech. Syst. Signal Process. 2005, 19, 1166–1180. [Google Scholar] [CrossRef] [Scilit]
  36. Mauricio, A.; Gryllias, K. Cyclostationary-based multiband envelope spectra extraction for bearing diagnostics: The combined improved envelope spectrum. Mech. Syst. Signal Process. 2021, 149, 107150. [Google Scholar] [CrossRef] [Scilit]
  37. Althobiani, F. A novel framework for robust bearing fault diagnosis: Preprocessing, model selection, and performance evaluation. IEEE Access 2024, 12, 59018–59036. [Google Scholar] [CrossRef] [Scilit]
  38. Roy, S.S.; Chatterjee, S.; Roy, S.; Bamane, P.; Paramane, A.; Rao, U.M. Accurate detection of bearing faults using difference visibility graph and bi-directional long short-term memory network classifier. IEEE Trans. Ind. Appl. 2022, 58, 4542–4551. [Google Scholar] [CrossRef] [Scilit]
  39. Liu, S.H.; Wu, Z.W.; Gao, J.X.; Sun, W.L.; Yuan, Y.P.; Fan, L.K. Rolling bearing fault diagnosis method based on an improved 1DCNN-transformer. Machines 2026, 14, 629. [Google Scholar] [CrossRef] [Scilit]
  40. Song, X.; Cong, Y.; Song, Y.; Chen, Y.; Liang, P. A bearing fault diagnosis model based on CNN with wide convolution kernels. J. Ambient Intell. Hum. Comput. 2022, 13, 4041–4056. [Google Scholar] [CrossRef] [Scilit]
  41. Zhou, H.X.; Huang, X.; Wen, G.R.; Dong, S.Z.; Lei, Z.H.; Zhang, P.; Chen, X.F. Convolution enabled transformer via random contrastive regularization for rotating machinery diagnosis under time-varying working conditions. Mech. Syst. Signal Process. 2022, 173, 109050. [Google Scholar] [CrossRef] [Scilit]
  42. Song, X.M.; Wei, W.H.; Zhou, J.B.; Ji, G.J.; Hussain, G.; Xiao, M.H.; Geng, G.S. Bayesian-optimized hybrid kernel SVM for rolling bearing fault diagnosis. Sensors 2023, 23, 5137. [Google Scholar] [CrossRef] [Scilit]
  43. Duan, Z.L.; Zhang, W.B.; Zhang, H.F.; Yang, F.Y. Research on intelligent fault diagnosis of rotating machinery for edge computing platforms. Mech. Syst. Signal Process. 2025, 237, 113101. [Google Scholar] [CrossRef] [Scilit]
Figure 1. Structure diagram of the LSTM network unit.
Applsci 16 08878 g001
Figure 2. Flowchart of the proposed intelligent fault diagnosis framework.
Applsci 16 08878 g002
Figure 3. Raw rolling bearing signal and denoised result: (a) original noisy signal; (b) signal processed by PPCA denoising.
Applsci 16 08878 g003
Figure 4. Relationship between the number of PPCA principal components and spectral kurtosis.
Applsci 16 08878 g004
Figure 5. Fast kurtogram for optimal bandwidth selection.
Applsci 16 08878 g005
Figure 6. Envelope spectrum of the bearing fault signal.
Applsci 16 08878 g006
Figure 7. Envelope spectrum results before and after prewhitening: (a) envelope spectrum with discrete harmonic interference; (b) envelope spectrum after prewhitening.
Applsci 16 08878 g007
Figure 8. Configuration of the CWRU experimental test bench.
Applsci 16 08878 g008
Figure 9. Time and frequency-domain results for the CWRU bearing inner race fault: (a) time-domain waveform of the inner race fault; (b) envelope spectrum of the inner race fault.
Applsci 16 08878 g009
Figure 10. Training loss and accuracy curves of the proposed method.
Applsci 16 08878 g010
Figure 11. Normalized confusion matrix of the proposed method on the CWRU dataset.
Applsci 16 08878 g011
Figure 12. Diagnostic accuracy of the proposed method at various SNR levels.
Applsci 16 08878 g012
Figure 13. Experimental system schematic of P-2101A/B high-temperature condensation pumps.
Applsci 16 08878 g013
Figure 14. Practical fault diagnosis system: (a) sensor installation position; (b) time-domain data analysis module; and (c) envelope spectrum analysis module.
Applsci 16 08878 g014
Table 1. Relative change metric corresponding to different principal component numbers.
Principal component number1314151617181920
Relative change metric3.64 × 10 3 3.94 × 10 3 2.72 × 10 3 2.78 × 10 3 7.27 × 10 4 7.51 × 10 4 3.29 × 10 4 3.56 × 10 4
Table 2. Time-domain kurtosis of residual signals under different AR orders.
AR order3132333435363738
Residual kurtosis0.841.321.872.412.762.621.620.50
Table 3. Sample distribution of the bearing dataset with various fault types and damage diameters.
Operating ConditionLabelDamage DiameterTraining SamplesValidation Samples
NormalNormal280120
Inner Race FaultDE_IR007_00.007 inches280120
Outer Race FaultDE_OR007_00.007 inches280120
Ball FaultDE_B007_00.007 inches280120
Inner Race FaultDE_IR014_00.014 inches280120
Outer Race FaultDE_OR014_00.014 inches280120
Ball FaultDE_B014_00.014 inches280120
Inner Race FaultDE_IR021_00.021 inches280120
Outer Race FaultDE_OR021_00.021 inches280120
Ball FaultDE_B021_00.021 inches280120
Table 4. Network structure and hyperparameter configuration of the LSTM fault diagnosis model.
Layer NameOutput ShapeParametersDescription
Input Signal(Batch, 4096)Window length = 4096Sliding-window segmented 1D input signal
Data Reshape Layer(Batch, 128, 32)seq_len = 128; input_dim = 32Reshape 1D signal to 3D structured data for LSTM
LSTM Layer(Batch, 128, 64)input_size = 32; hidden_size = 64; num_layers = 2; dropout = 0.3Stacked LSTMs extract temporal features; dropout prevents overfitting
FC Hidden Layer(Batch, 16)Linear(64, 16); ReLUHigh-level feature mapping via ReLU nonlinear activation
Classification Layer(Batch, 10)Linear(16, 10)Predict probabilities for 10-type bearing fault classification
Loss FunctionCrossEntropyLossCross-entropy loss for multi-classification
OptimizerAdam; learning rate = 0.001Adam optimizer for parameter updating
Training SettingsEpochs = 50; batch size = 64; random seed = 42Trained over 50 epochs with batch size 64
Table 5. Comparison of evaluation metrics among different models in ablation experiments.
Model NameAccuracy (%)Precision (%)Recall (%)F1-Score (%)
Model A98.54 ± 0.7698.57 ± 0.7998.46 ± 0.7198.50 ± 0.78
Model B92.87 ± 1.2492.71 ± 1.2892.89 ± 1.2192.74 ± 1.25
Model C97.16 ± 0.7897.14 ± 0.8197.05 ± 0.8497.13 ± 0.79
Model D96.47 ± 0.9296.28 ± 0.9596.29 ± 0.9796.30 ± 0.93
Model E86.18 ± 2.1886.64 ± 2.2386.55 ± 2.2686.54 ± 2.21
Table 6. Diagnostic accuracy of different models under 16 dB noisy environment.
Model NameAccuracy (%)Precision (%)Recall (%)F1-Score (%)
1DCNN-Transformer93.01 ± 1.1292.66 ± 1.1792.69 ± 1.1492.68 ± 1.15
WDCNN93.28 ± 1.0493.25 ± 1.0893.17 ± 1.0693.08 ± 1.07
Conv-ET94.11 ± 0.9194.07 ± 0.9493.88 ± 0.9693.89 ± 0.93
Bayesian-SVM95.59 ± 0.8695.24 ± 0.8995.11 ± 0.8195.16 ± 0.88
Proposed Method98.52 ± 0.7698.55 ± 0.7898.43 ± 0.7098.48 ± 0.75
Table 7. Performance comparison of fault diagnosis for different models on the industrial field dataset.
Model NameAccuracy (%)Precision (%)Recall (%)F1-Score (%)
1DCNN-Transformer92.41 ± 1.4392.12 ± 1.4792.14 ± 1.4592.13 ± 1.46
WDCNN93.03 ± 1.3193.01 ± 1.3492.82 ± 1.3392.83 ± 1.32
Conv-ET93.32 ± 1.1893.33 ± 1.2193.04 ± 1.2393.02 ± 1.20
Bayesian-SVM94.88 ± 0.9794.91 ± 0.9994.76 ± 1.0294.81 ± 0.98
Proposed Method97.61 ± 0.6497.60 ± 0.6697.62 ± 0.6897.61 ± 0.65
Disclaimer/Publisher’s Note: The statements, opinions and data contained in all publications are solely those of the individual author(s) and contributor(s) and not of MDPI and/or the editor(s). MDPI and/or the editor(s) disclaim responsibility for any injury to people or property resulting from any ideas, methods, instructions or products referred to in the content.