1. Introduction
Sport climbing performance is influenced by physiological, technical, and biomechanical factors [
1,
2,
3]. During climbing, athletes generate and regulate interaction forces through multiple contacts between the hands, feet, climbing holds, and wall. These forces depend on body position, the number and location of supporting contacts, and the movement strategy adopted by the climber [
4,
5,
6]. Finger strength and grip conditions have also been investigated using force-based measurements because of their importance to climbing performance [
7,
8,
9]. Quantitative measurement of the forces applied to climbing holds can provide information that cannot be obtained from movement trajectories alone and may contribute to biomechanical analysis, technique assessment, and coaching support.
Body posture and movement trajectories during climbing can be measured using optical motion capture systems, wearable sensors, and image-based pose estimation [
10,
11,
12]. However, these approaches primarily describe the kinematics of the climber and do not directly quantify the mechanical interaction between the climber and the climbing environment. Direct measurement of the forces applied to individual holds is important for understanding how athletes support and accelerate their bodies during climbing movements.
Several systems have been developed to measure forces applied to climbing holds. One approach is to fabricate dedicated instrumented holds with integrated force sensors [
6,
8,
13,
14]. Such systems have been used to investigate force application during climbing-specific movements, including dynamic maneuvers [
15]. Another approach is to install force sensors between the hold and the climbing wall or to integrate them into a wall-side measurement structure [
16]. Although these systems can provide detailed force information, sensors or mounting structures inserted between the hold and the wall increase the wall–hold distance and may create a gap at the interface. Changes in hold geometry or position may affect the difficulty of the climbing task, the posture adopted by the climber, and the resulting force-generation strategy. A measurement system that can be applied to existing holds, including small footholds, without increasing the wall–hold distance is desirable for field measurements.
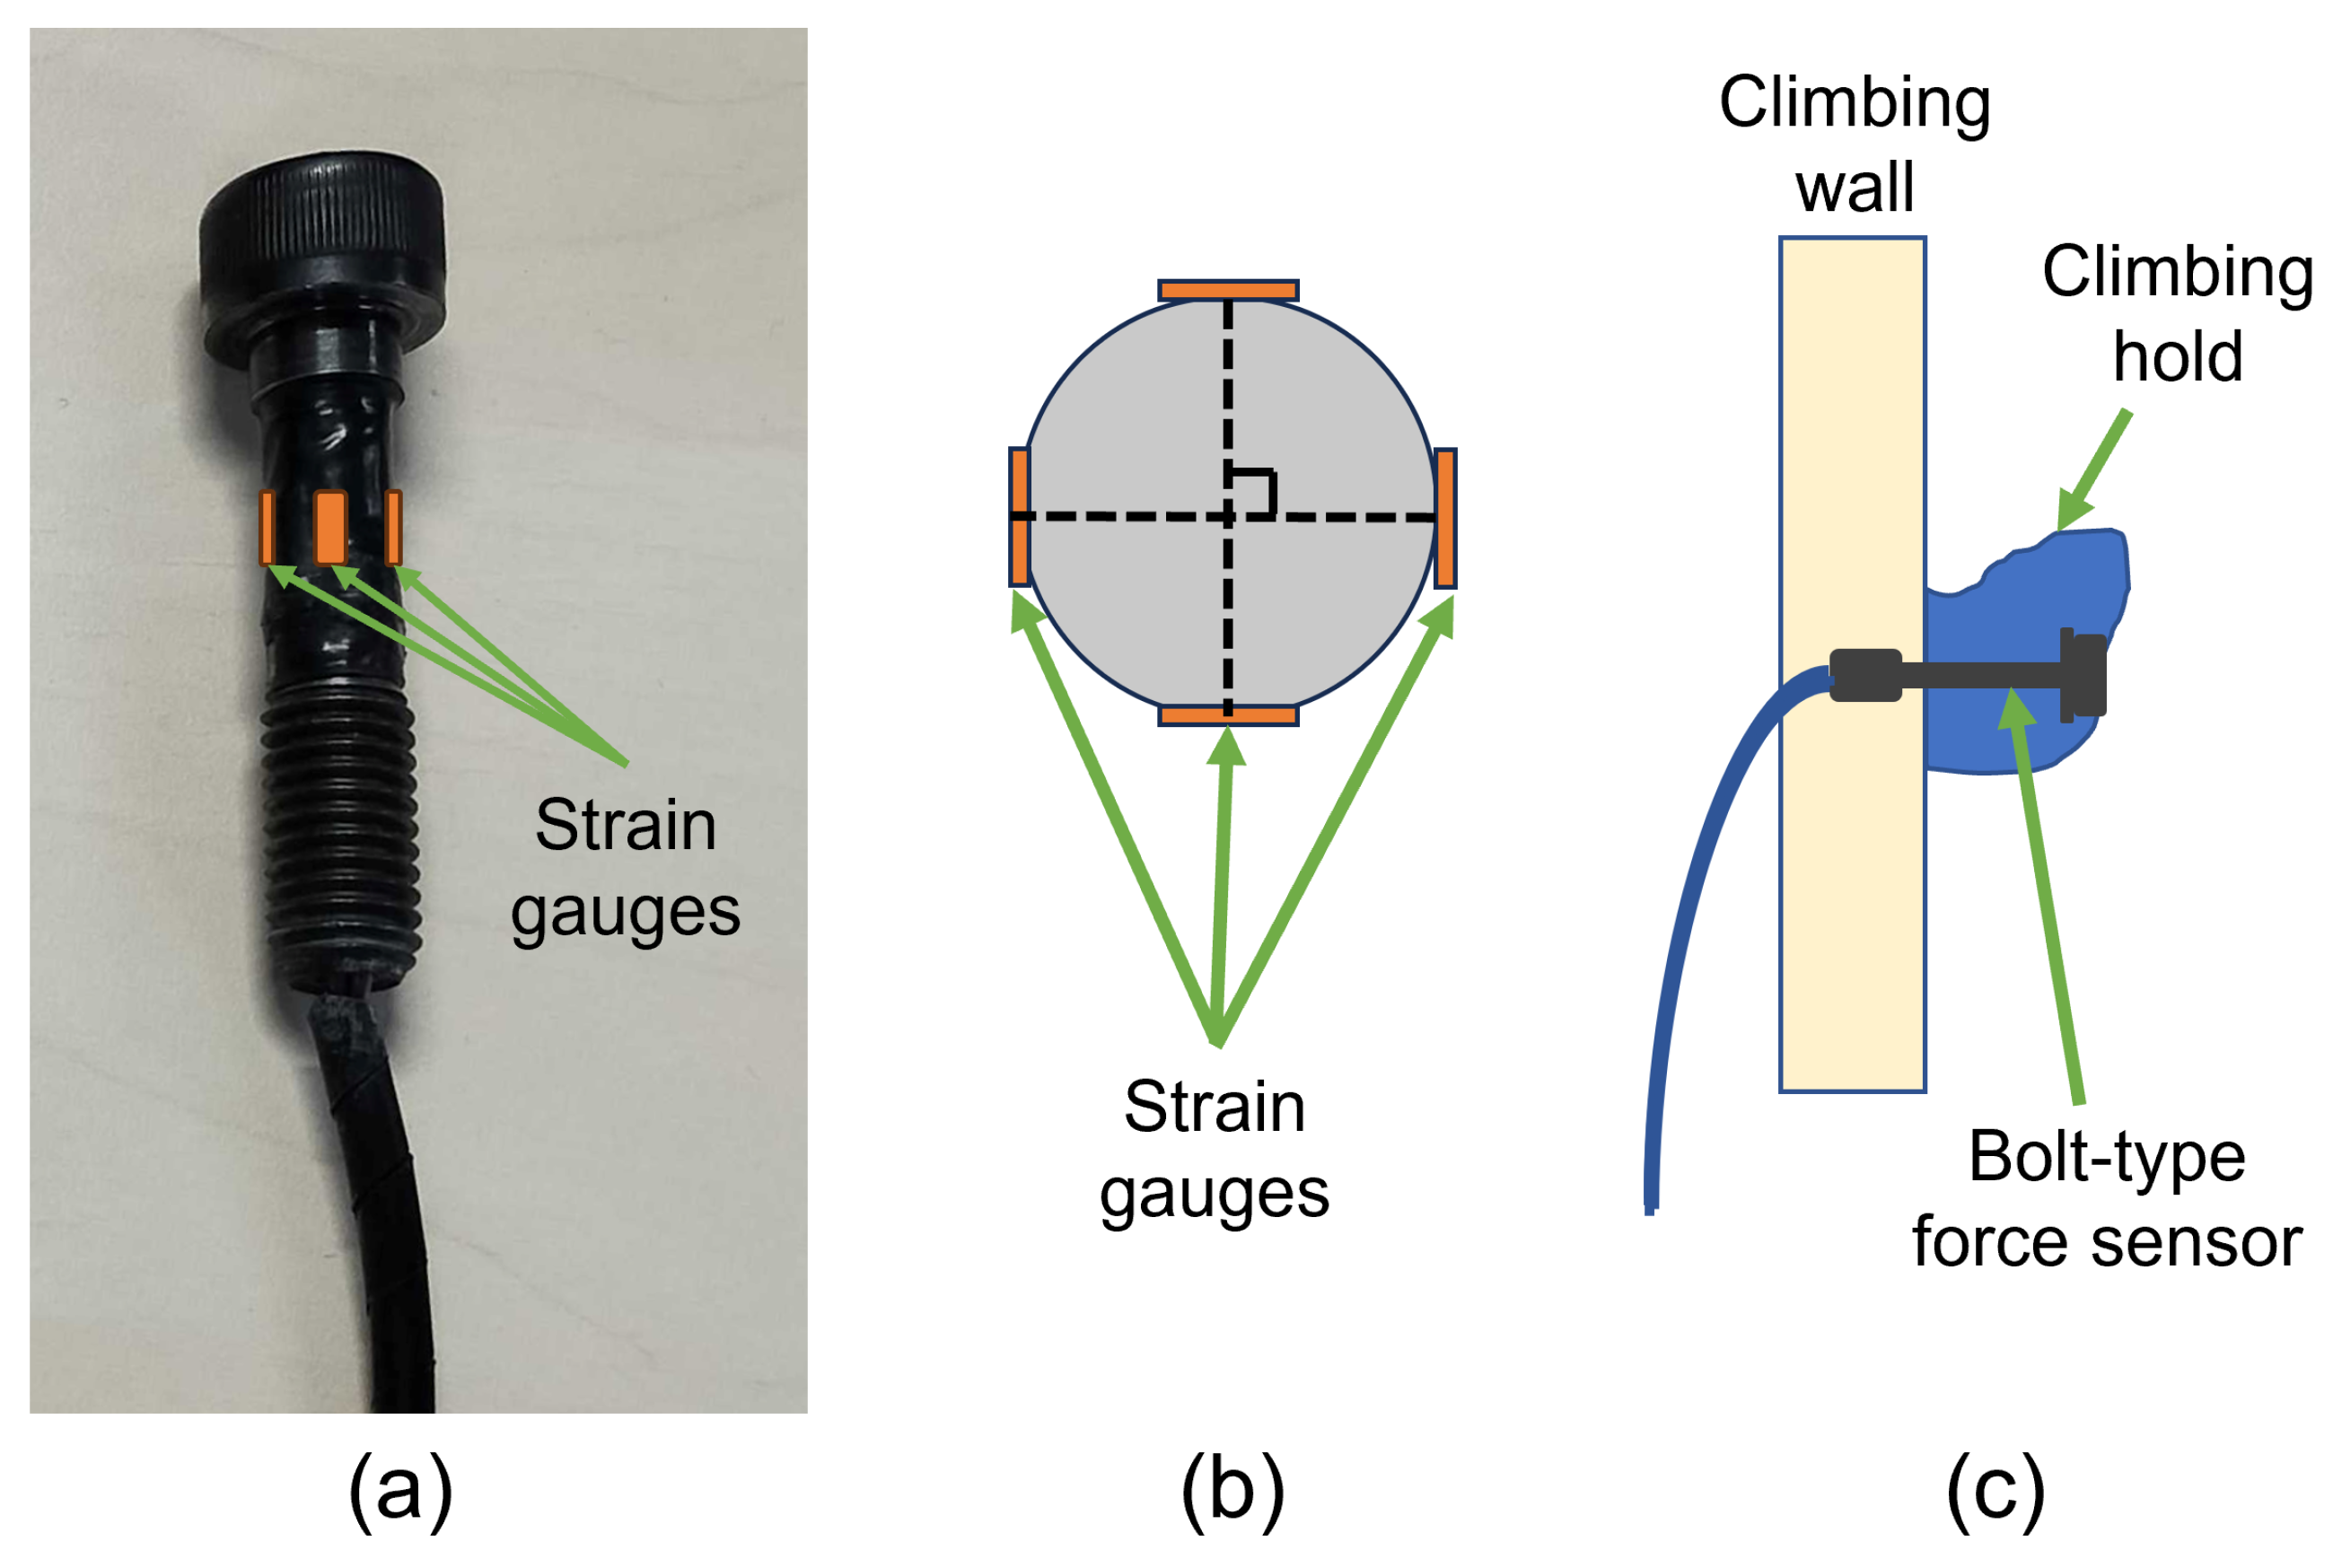
Artificial climbing holds are generally attached to the wall using fixing bolts. This attachment structure provides an opportunity to integrate sensing capability into the hold–wall connection without modifying the external shape of the hold. Based on this concept, we first developed a bolt-type force sensor in which four strain gauges were attached to an M10 bolt, and its three-axis force-estimation performance was evaluated using a reference force sensor [
17]. A subsequent study introduced an internal wiring structure that routed the sensor cable to the rear side of the wall and evaluated force estimation during climbing in an actual gym using co-installed six-axis force sensors [
18]. Although that study confirmed sensor-level force estimation during climbing movements, the reference sensors, their protective structures, and associated wiring remained on the climbing surface. This paper extends our earlier conference contributions [
17,
18]. The sensing principle and the internal wiring structure were reported in those studies, whereas the present work addresses the deployment and continuous operation of the complete measurement system on a standardized speed climbing wall after the reference sensors and calibration fixtures have been removed.
Related screw-type sensing approaches have also been investigated. Pernus and Munro presented a preliminary measurement system for performance analysis in sport climbing [
19], and Pernus Weber et al. developed an instrumented mounting screw and evaluated calibration methods for estimating the magnitude and direction of applied forces [
20]. Their system also avoided exposed wiring on the climbing side, and its calibration performance was evaluated on a climbing wall; measurements during actual climbing were reported as remaining for future work. In our own line of work, the internal wiring structure introduced in [
18] likewise removed the wiring from the climbing side. For the proposed bolt-type sensor system, the remaining issue was whether the complete measurement chain could be operated repeatedly on a standardized speed climbing wall by climbers after removing the reference sensors and calibration fixtures that had remained on the climbing surface in that earlier study.
The objective of this study was to evaluate the system-level applicability of the bolt-type force measurement approach on a standardized speed climbing wall after removal of the reference sensors and calibration fixtures. The sensing principle and internal wiring structure themselves were established in our previous conference studies [
17,
18] and are not presented here as new contributions. Instead, the present study addresses the transition from sensor-level evaluation to the final measurement configuration, in which the bolt-type sensors alone serve as the fixing bolts of the footholds. Two sensors were calibrated using a reference six-axis force sensor at the same wall locations subsequently used for the field measurements. The reference sensor and calibration fixtures were then removed, and the system was operated during 27 start trials performed by five competitive climbers. The study evaluates the practical transfer from calibration to field installation and repeated multi-sensor operation under actual speed-climbing conditions. The field experiment was not designed to provide an independent validation of absolute force-estimation accuracy under actual climbing conditions or to compare force-production strategies among participants.
The contributions of this study are as follows:
A complete bolt-type force measurement system, comprising the sensors, rear-side wiring, signal conditioning, and data acquisition, was deployed on a standardized speed climbing wall with no measurement equipment or wiring exposed on the climbing side.
The transition from calibration to the final field configuration was examined by performing calibration at the same wall locations, using the same holds and tightening torque, matching the distance from the strain-gauge section to the threaded engagement, and recording and compensating for differences in bolt orientation between the two configurations. Differences that remained between the calibration and field configurations are explicitly considered as limitations of the force estimates.
Simultaneous signal acquisition from two instrumented footholds was maintained throughout 27 start trials performed by five competitive climbers, allowing the system-level operability and time-varying estimated-force responses to be evaluated under actual speed-climbing conditions.
3. Experiments and Results
3.1. Calibration Experiment
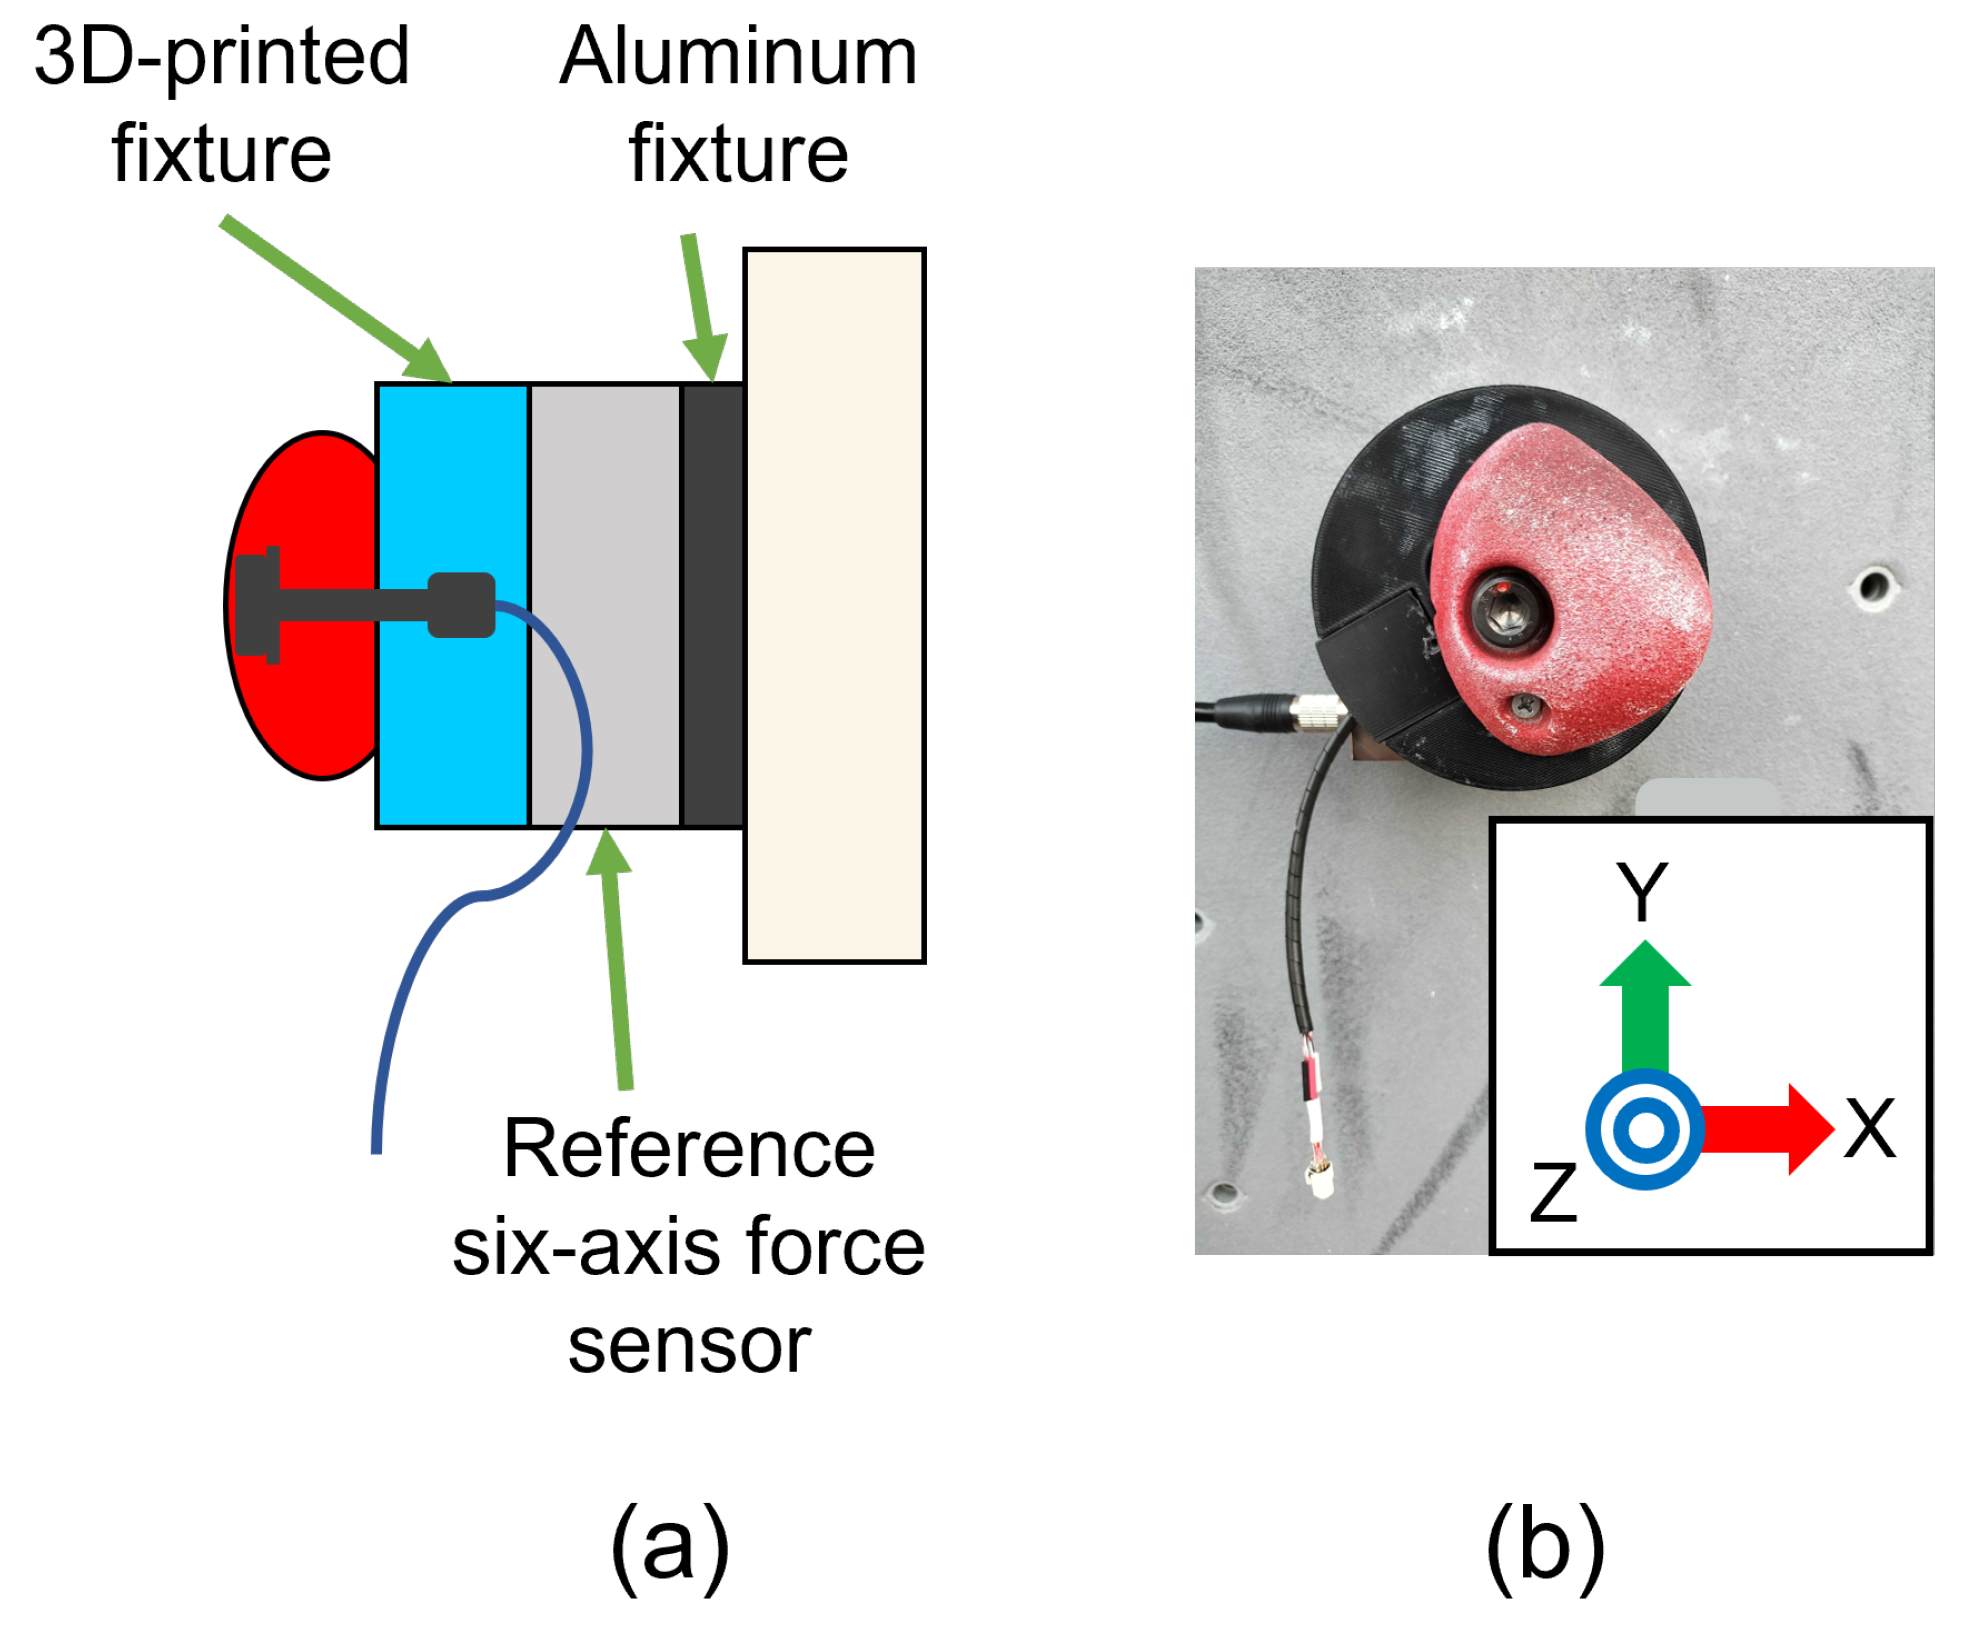
Calibration experiments were conducted before the field measurements to determine the calibration matrix for each bolt-type force sensor. The calibration was carried out on the same standardized speed climbing wall as the field experiment, with each instrumented hold assembly mounted at the bolt hole later used for the field measurements. The wall inclination and the orientation of each hold were the same in the calibration and field configurations. A six-axis force sensor (FFS100YS302U6, Leptrino Co., Ltd., Nagano, Japan) was installed between the wall and the climbing-hold assembly, as shown in
Figure 3. The fixture adjacent to the climbing hold was fabricated by 3D printing and included an internal passage for routing the sensor cable. The fixture adjacent to the wall was made of aluminum. The bolt-type force sensor was threaded into a metal nut embedded in the 3D-printed fixture, and the distance from the strain-gauge section of the bolt to the nut was set to the same value as in the subsequent wall installation. To maintain a consistent tightening condition between calibration and field installation, the bolt was tightened with a torque wrench to 25 N m in both configurations. The effect of tightening torque was not investigated in the present study, and 25 N m should therefore be regarded as a fixed experimental condition rather than an optimized or generally recommended value. For each sensor, the calibration measurement contained six loading cycles. Forces were applied manually to each hold at contact locations comparable to those used during climbing, primarily in the loading directions expected during the start motion, while the applied directions were adjusted so that all three axes were excited. The maximum absolute reference force obtained for each axis is listed in
Table 1. The force components measured by the reference sensor and the outputs of the four strain gauges attached to the bolt-type force sensor were recorded simultaneously. The rated capacities of the reference sensor were
N for
and
,
N for
,
N m for
and
, and
N m for
. Only the three force components were used to determine and evaluate the calibration matrix. The
X-,
Y-, and
Z-axes of the reference sensor coordinate system were defined as shown in
Figure 3, and the corresponding force components were denoted by
,
, and
, respectively.
Two bolt-type force sensors were individually calibrated for the two footholds used during the start phase of speed climbing, denoted as Foot 1 and Foot 2 and specified in
Section 3.2. The calibration matrix for each sensor was selected from the paired structured-strain and reference-force data using the particle-filter-based procedure described in
Section 2.3. The estimated force components were compared with the corresponding reference-force components using the same calibration dataset employed to select the calibration matrix.
Table 1 summarizes the resulting in-sample mean absolute error, maximum absolute reference force, and error ratio for each axis. For Foot 1, the mean absolute errors were 14.8, 13.5, and 5.9 N for
,
, and
, respectively. The corresponding error ratios were 11.8%, 2.9%, and 2.5%. For Foot 2, the mean absolute errors were 10.8, 15.0, and 8.7 N, and the corresponding error ratios were 27.1%, 5.1%, and 6.6%. Within the calibration dataset, the error ratio for
, which was the principal loading direction during calibration, was below 6% for both sensors. The error ratios for
were 2.5% and 6.6% for Foot 1 and Foot 2, respectively. Larger normalized error ratios were obtained for
, particularly for Foot 2. This was primarily associated with the smaller reference-force range in this direction rather than with a substantially larger absolute estimation error. The maximum absolute reference forces for
were 125.4 and 39.8 N for Foot 1 and Foot 2, respectively, whereas the corresponding mean absolute errors were 14.8 and 10.8 N. For Foot 2, the relatively small reference-force range caused the normalized error ratio to increase to 27.1%, although the absolute error remained comparable to those of the other force components. The normalized error ratios should be interpreted together with both the absolute error and the reference-force range.
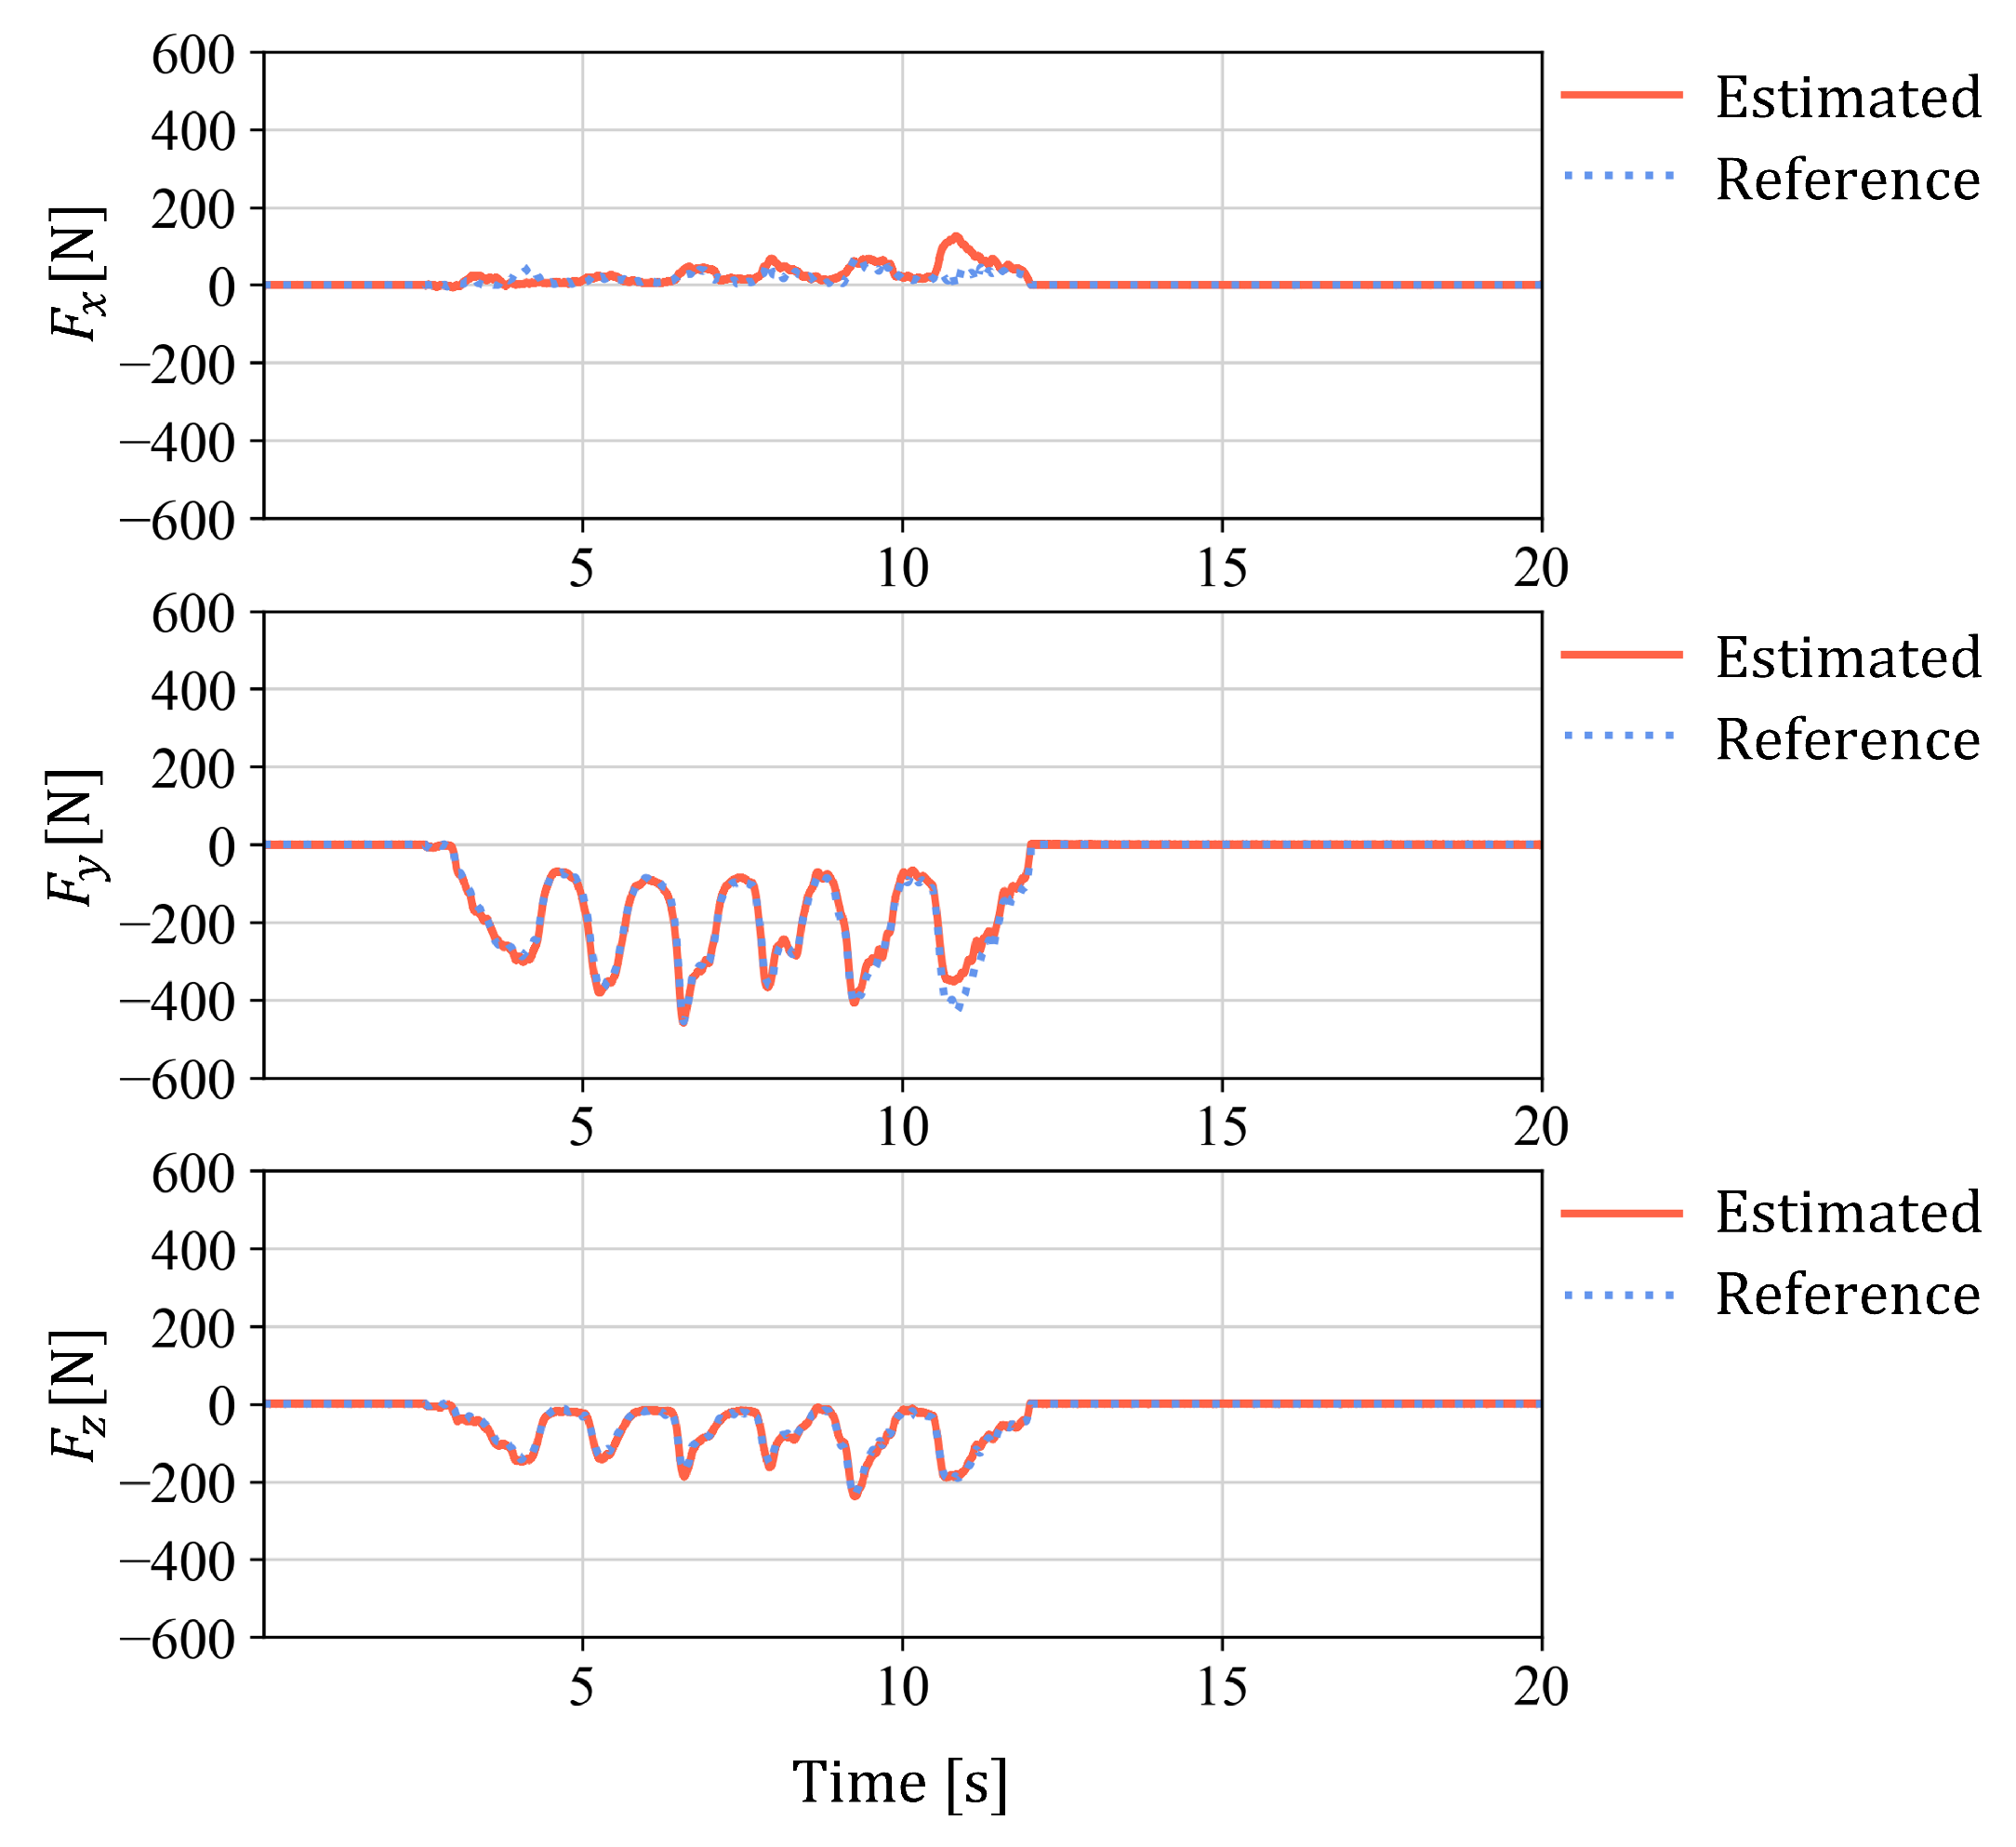
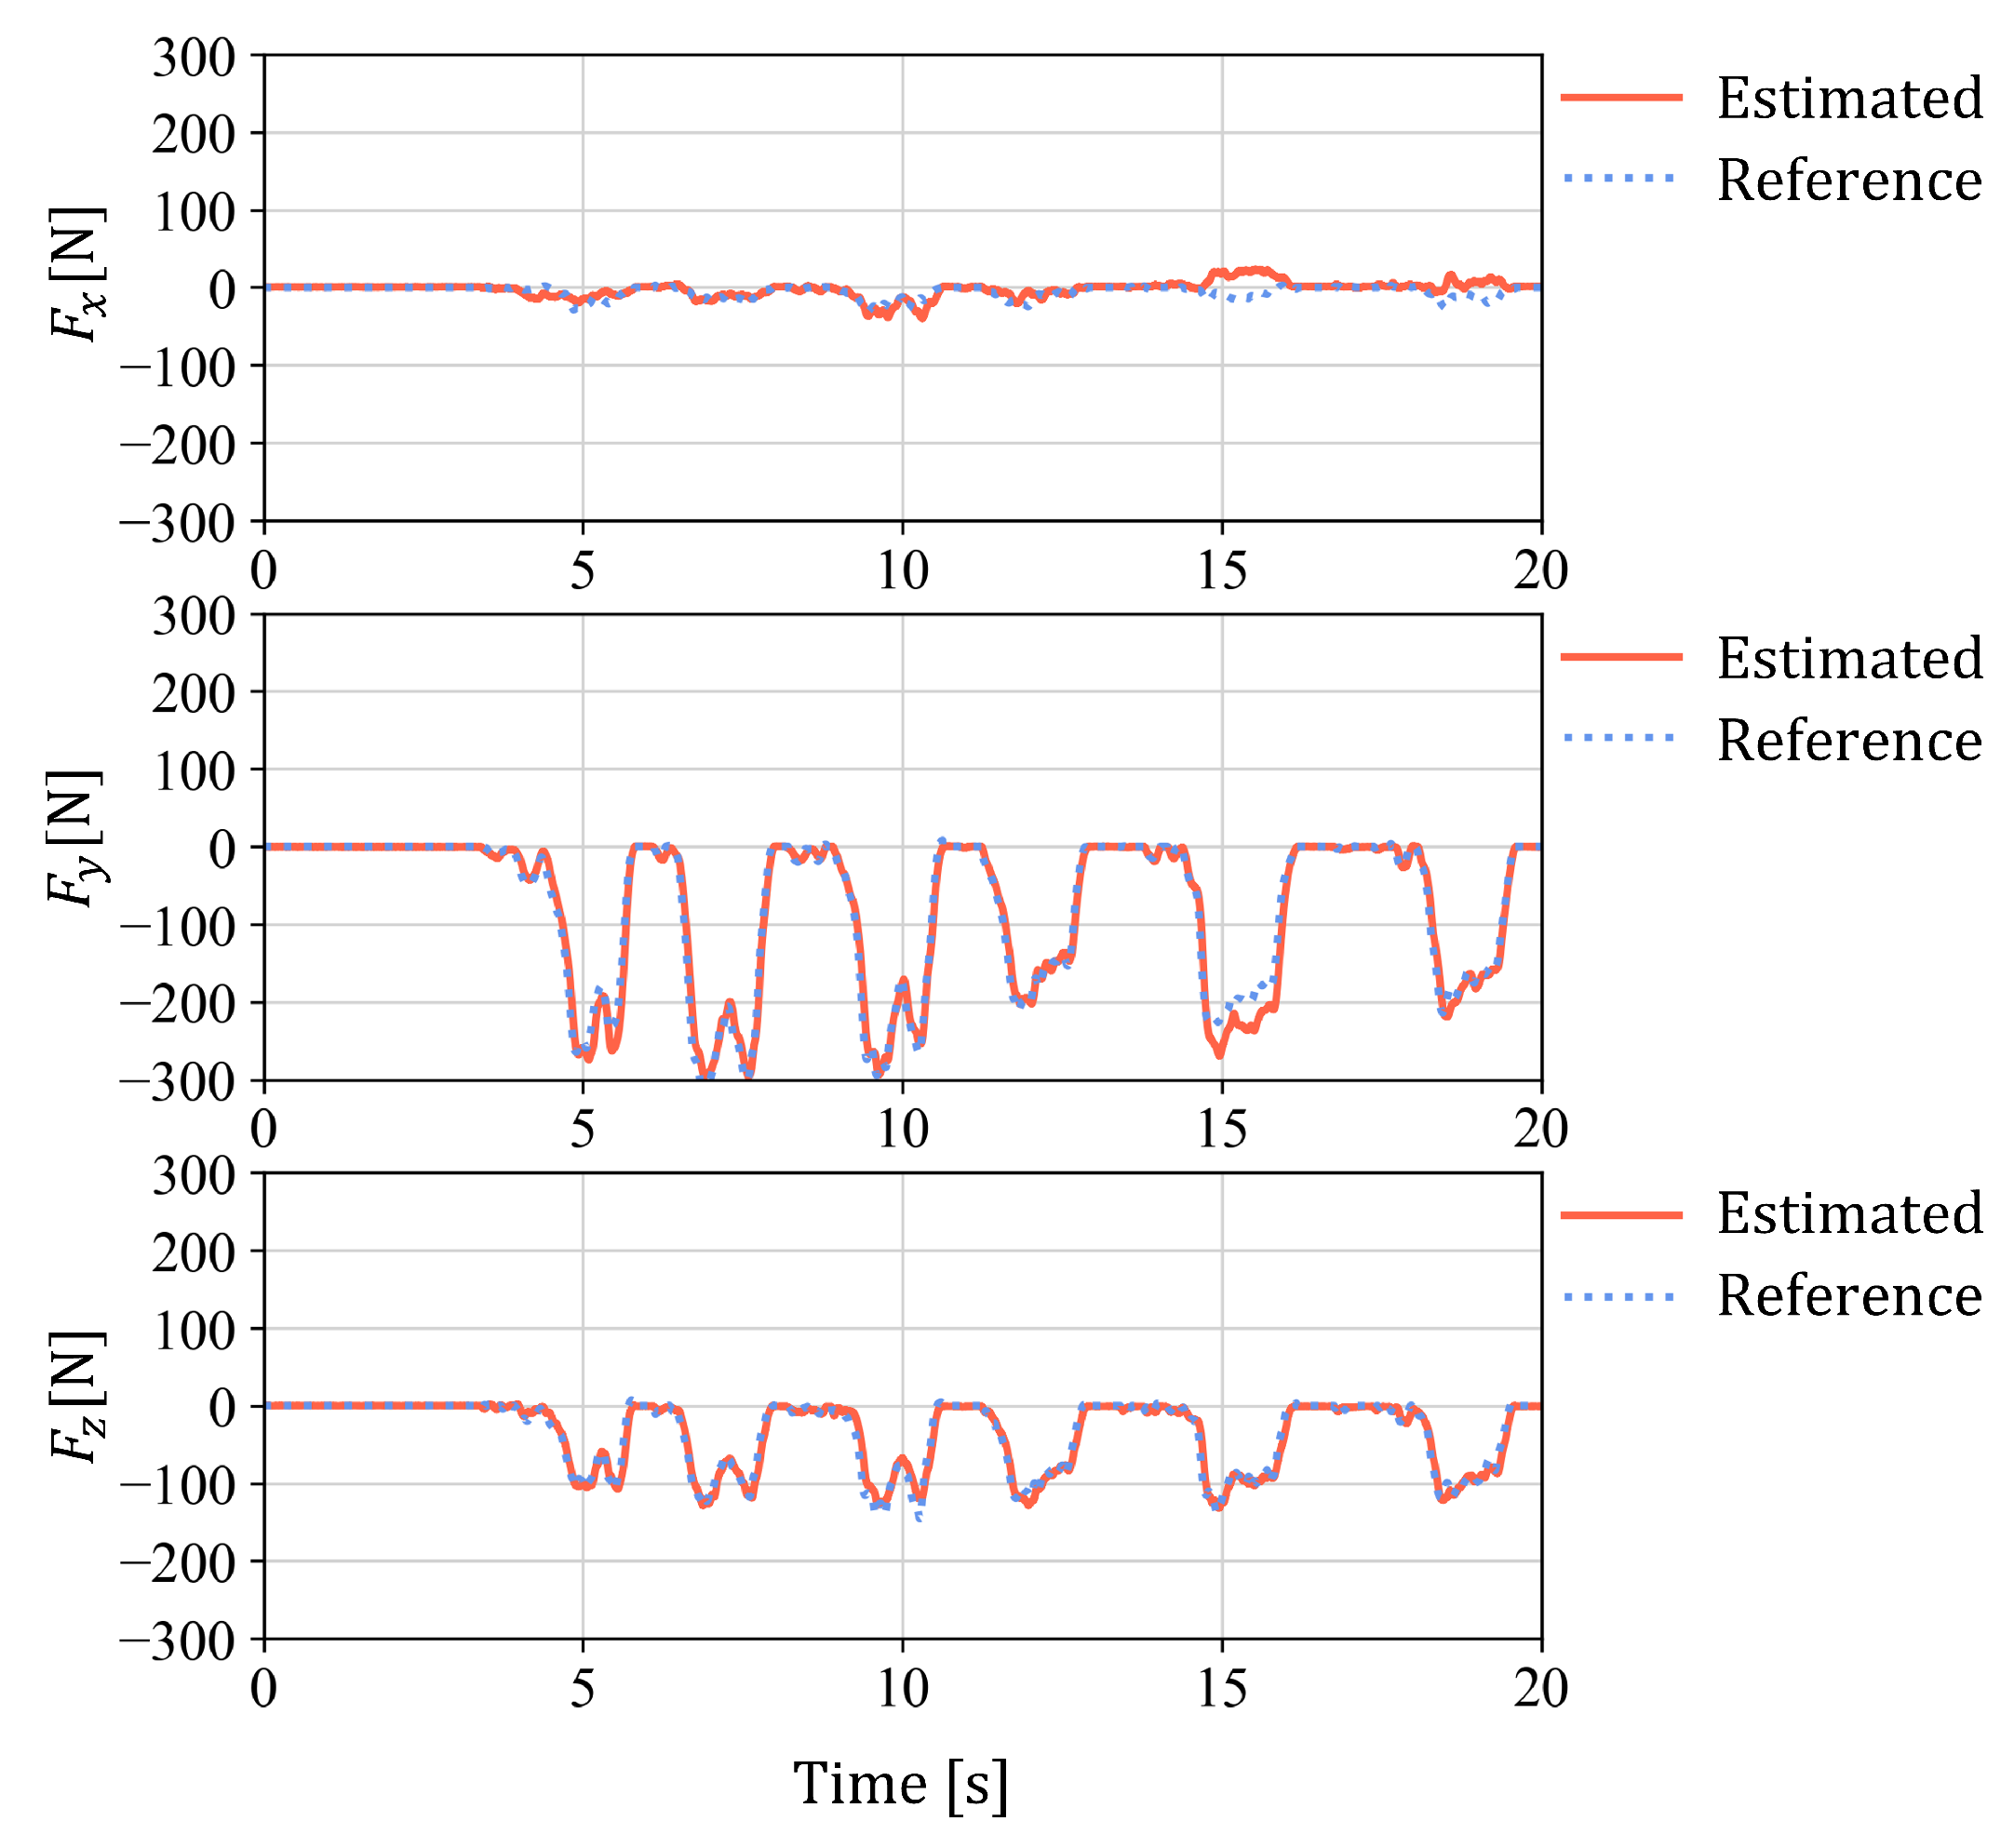
Figure 4 and
Figure 5 show the time-series comparisons between the estimated and reference force components for Foot 1 and Foot 2, respectively. The quantitative in-sample errors for both sensors are summarized in
Table 1.
As an additional assessment, the two-way hold-out analysis described in
Section 2.3 was performed, and the resulting RMSE, MAE, and error ratio values are summarized in
Table 2. The errors differed substantially between the two directions of the split, particularly for the
and
components. These results provide a more conservative indication of the sensitivity of calibration performance to the selection of loading cycles than the in-sample errors in
Table 1. However, because both subsets were obtained from the same calibration measurement, the hold-out analysis should still be regarded as a supplementary assessment rather than an independent validation of the calibration procedure.
3.2. Field Experiment on a Speed Climbing Wall
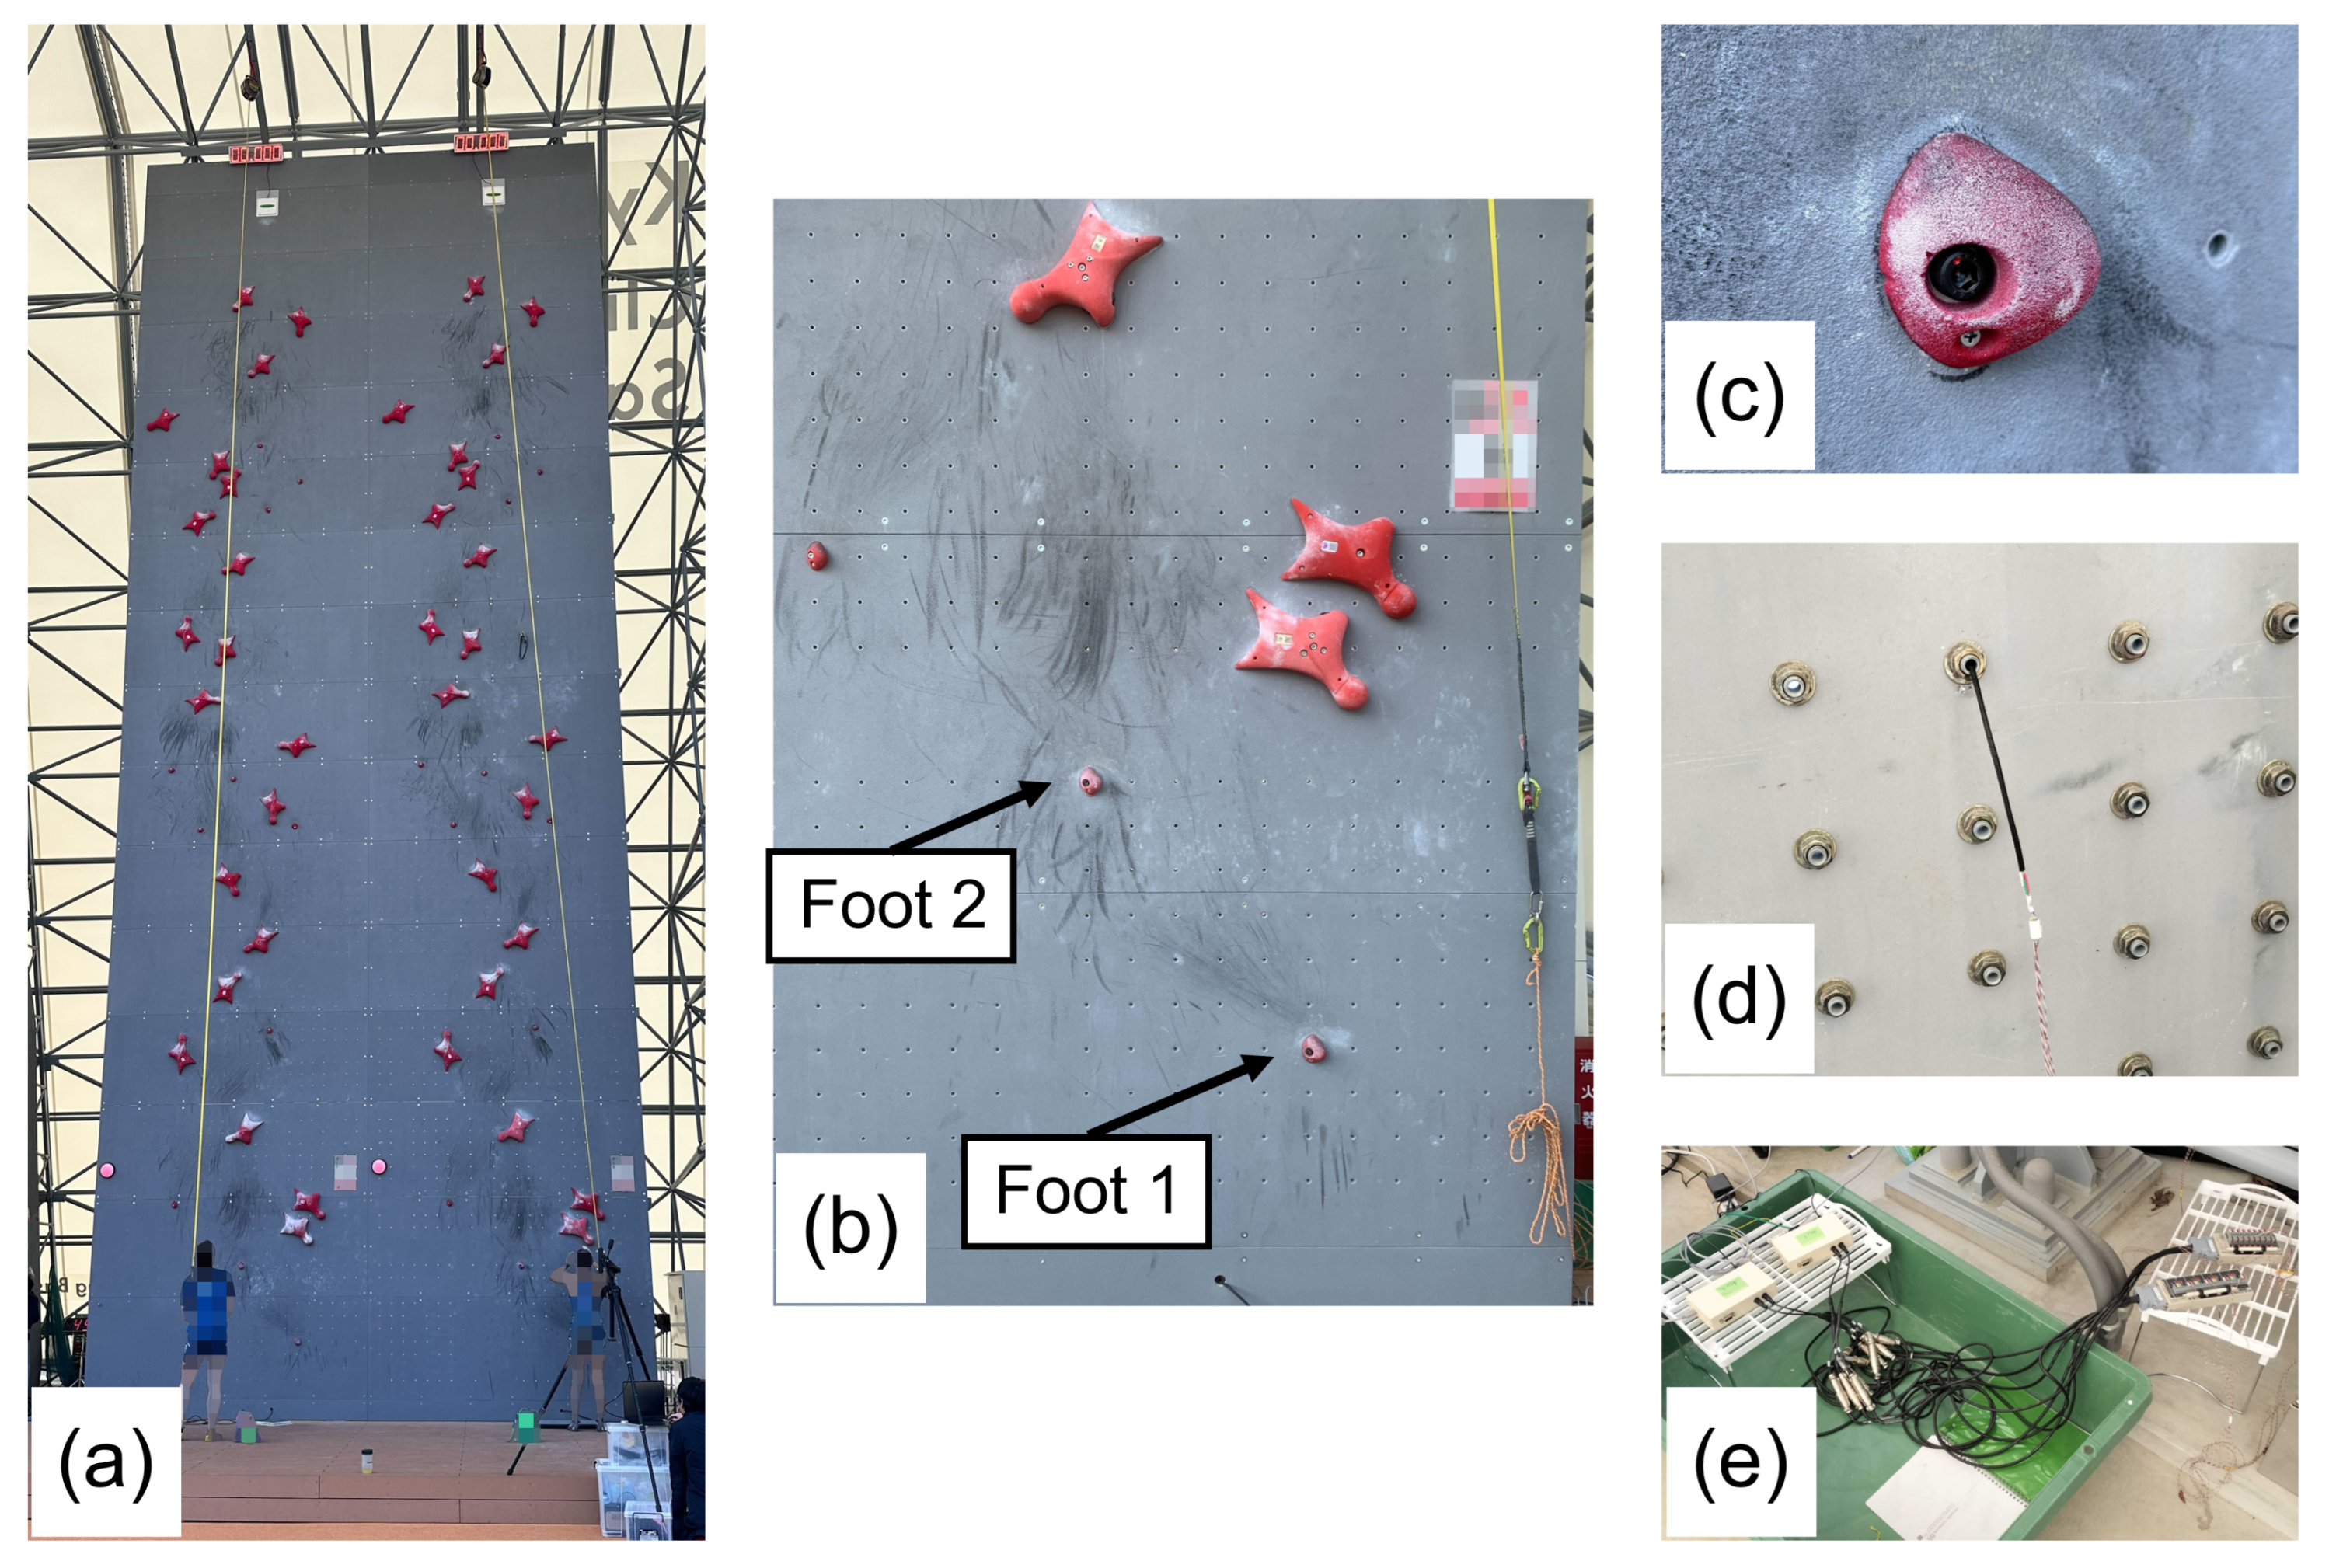
A field experiment was conducted at Kyushu Climbing Base SAGA (Saga, Japan) to evaluate the installation feasibility and continuous operation of the proposed measurement system under actual speed-climbing conditions. The standardized speed climbing wall was 15 m high, overhanging by 5° (that is, inclined at 95°), and had a fiber-reinforced plastic surface. The sensors were installed on the right-side speed climbing wall.
Two bolt-type force sensors were installed in the two footholds located on the DX1 panel of the official speed route. Their hold positions are specified as F4 and A10 in Section 1.2.4 and Appendix I of the official route plan [
21]; these footholds are denoted as Foot 1 and Foot 2, respectively, in this study. These holds were selected because they were loaded during the start motion and were expected to exhibit substantial time-varying force responses under realistic climbing conditions.
After calibration, the reference six-axis force sensor and the calibration fixtures were removed. The Foot 1 and Foot 2 holds were then attached directly to the climbing wall using the bolt-type force sensors as their fixing bolts. The cables extending from the threaded sides of the sensors were routed through the bolt holes to the rear side of the wall. The same climbing holds used in the calibration experiment were mounted on the wall, and the sensors were threaded into threaded holes formed directly in the fiber-reinforced plastic wall panel. Each bolt was tightened with a torque wrench to the same torque as in the calibration experiment, and the distance from the strain-gauge section to the threaded engagement was kept identical to the calibration configuration. The angular position of each bolt after tightening was recorded using the markings described in
Section 2.3. The recorded angular positions during calibration were
for Foot 1 and 50° for Foot 2, whereas those during the field installation were
and 210°, respectively. The angular differences compensated in the field force estimates were 0° for Foot 1 and 160° for Foot 2. With this installation, no sensor wiring or signal-conditioning equipment was exposed on the climbing surface, and neither the standardized wall surface nor the external configuration of the holds required modification.
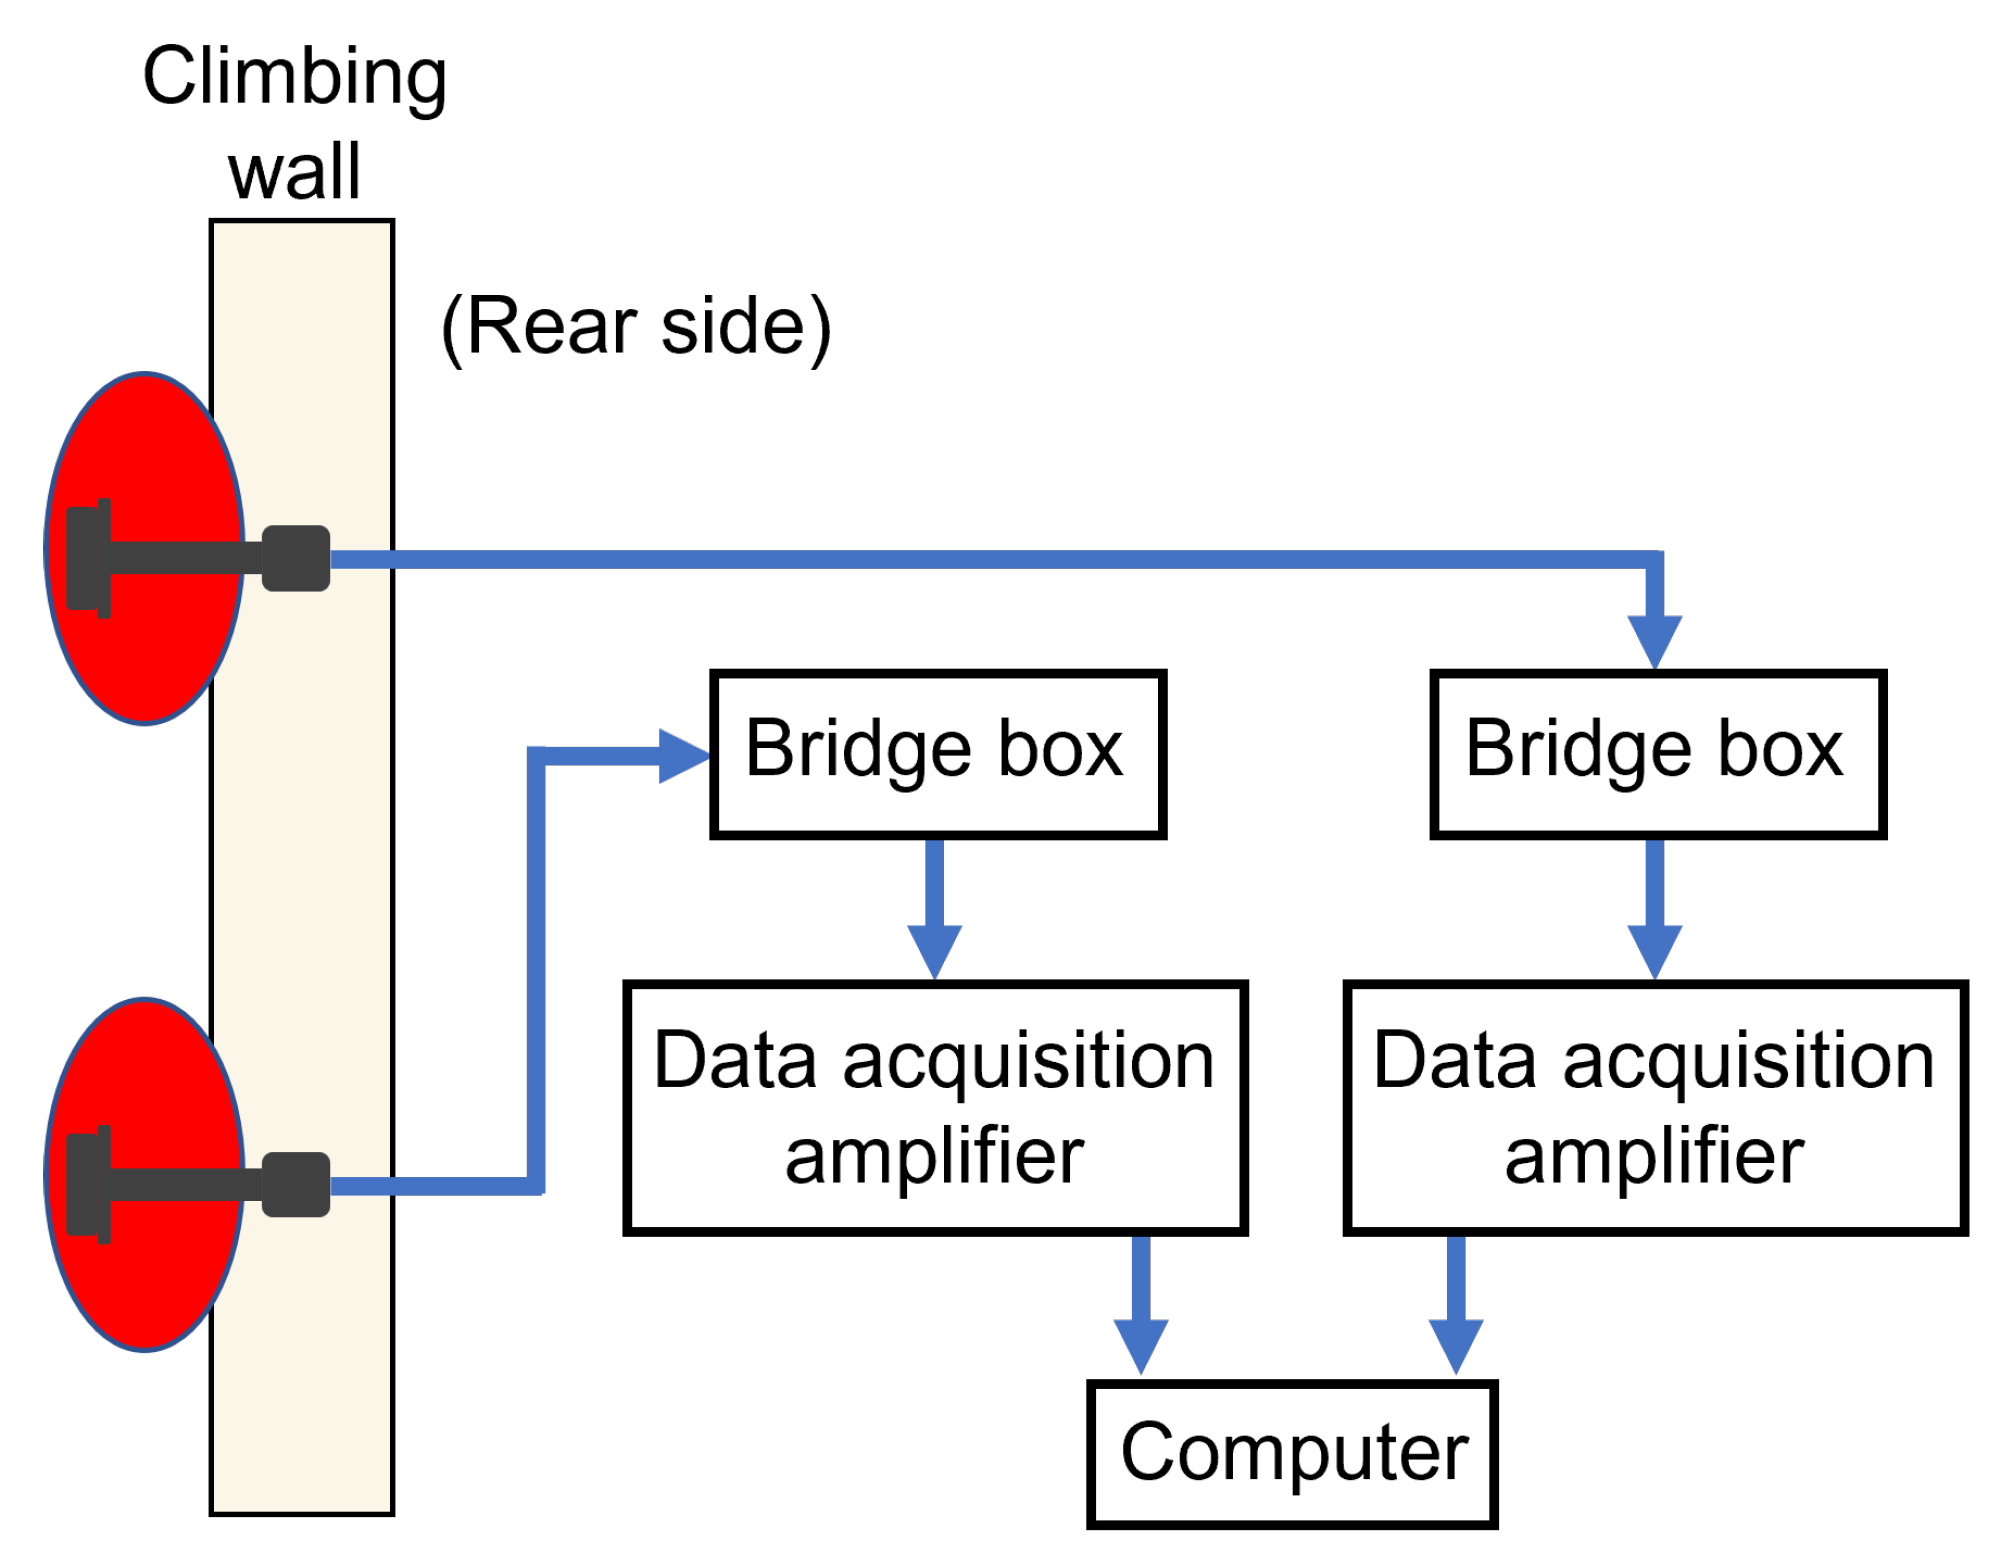
Figure 6 shows the instrumented hold locations, the installation of the bolt-type force sensors, and the rear-side wiring and measurement equipment used in the field experiment.
Five competitive climbers, comprising three men and two women and ranging in age from 17 to 22 years, participated in the experiment. Their mean body mass was 58.1 ± 8.1 kg. Each participant performed five or six start trials, yielding a total of 27 trials. During each trial, the strain outputs from the sensors installed in the Foot 1 and Foot 2 holds were recorded simultaneously at 1.0 kHz. The recorded time-series data were processed using the digital low-pass filter described in
Section 2.2. The amplifiers were zeroed before each trial while the instrumented holds were unloaded, and no additional offset correction was applied to the recorded signals. The force estimates represent changes from the unloaded state at the beginning of each trial rather than absolute bolt loads, which include the preload introduced by tightening.
The recorded signals were converted into three-axis force estimates using the calibration matrix determined for each sensor. These force components are expressed in the right-handed coordinate system defined during calibration and shown in
Figure 3b. The X- and Y-axes lie in the plane of the wall, with the positive X-axis directed toward the climber’s right and the positive Y-axis directed upward along the wall, while the positive Z-axis is directed away from the wall. Accordingly, a negative
represents a downward force applied by the climber to the hold, and a negative
represents a force directed into the wall. A force plate placed beneath the left foot was recorded synchronously with the bolt-type sensor signals, but it was not used as a ground-truth force reference for evaluating the bolt-type sensors. Its sole purpose in the present analysis was to provide a reproducible temporal event for aligning the trials. Specifically, the analysis start time was defined as the first instant at which the vertical force measured by the force plate fell below 30 N, indicating release of the left foot from the starting plate. The estimated force profiles from the bolt-type sensors were aligned to this event.
All 27 trials were used only to evaluate system deployment and continuous signal acquisition. For the force-profile analyses, including the comparison between the ranges of the field force estimates and the reference-force ranges represented in the calibration dataset, a trial was included only when the video recording confirmed both that the intended start motion was completed and that the foot was placed on the Foot 1 hold rather than on the adjacent wall surface. The numbers of trials satisfying these conditions were 3, 4, 3, 2, and 3 for Participants 1–5, respectively, yielding 15 trials in total. For each participant, the first such trial was used for the force-profile comparison presented in
Section 3.3.
Video recordings were obtained concurrently with the force measurements. The videos were used to identify the approximate timing of foot contact, loading, body-weight transfer, and release from the instrumented holds. The field experiment was designed to evaluate whether the complete measurement system could be deployed and operated during actual climbing movements, rather than to compare force-production strategies among participants.
The two sensors and the associated signal-conditioning and data-acquisition equipment operated simultaneously throughout all 27 trials. Force-related strain responses were recorded from both instrumented holds for all five participants.
3.3. Estimated Force Profiles During Climbing
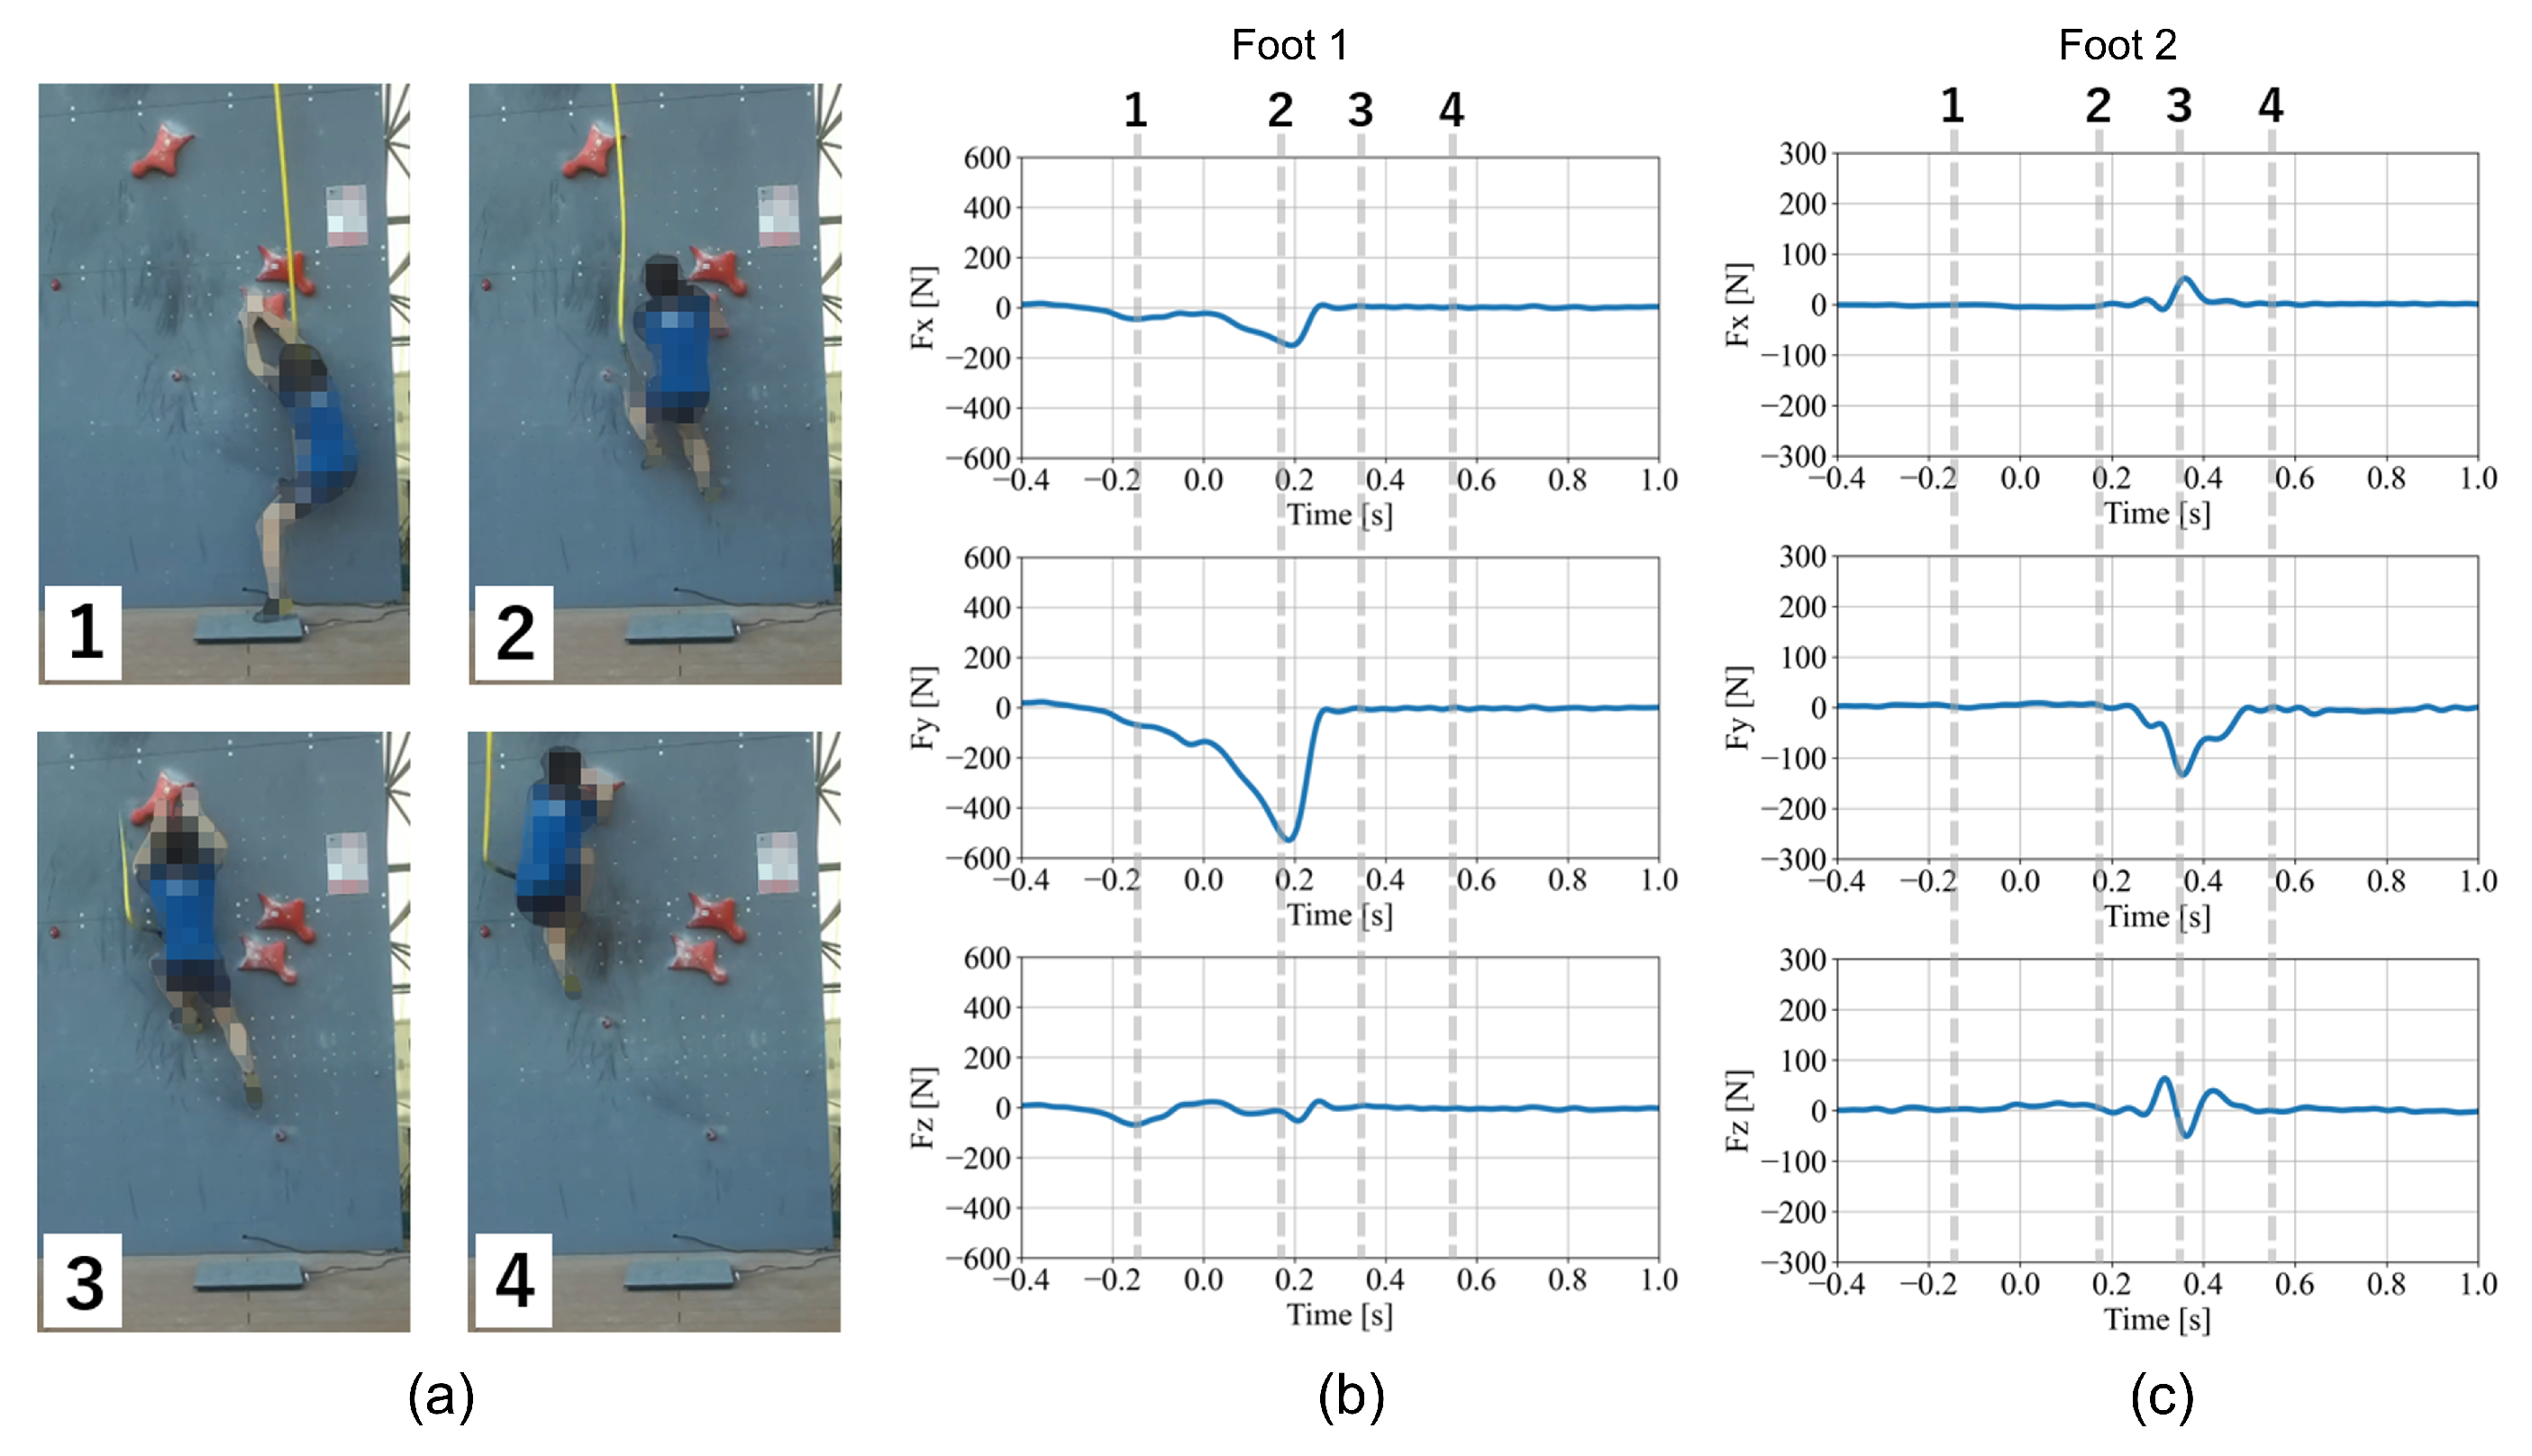
Figure 7 presents illustrative estimated force profiles obtained during one speed-climbing start trial. The figure shows the sequence of the observed climbing motion together with the corresponding time-varying three-axis force estimates from Foot 1 and Foot 2. The numbered frames correspond to the vertical dashed lines in both sets of force profiles. These profiles are presented to illustrate the sensor responses during field operation and are not intended to provide an evaluation of absolute force-estimation accuracy or participant-specific force-production strategies.
For Foot 1, the estimated force components changed in accordance with the sequence of foot contact, loading, body movement, and release observed in the video recording. The correspondence between the observed motion and the time-varying sensor response supports the interpretability of the Foot 1 profile under the field measurement conditions, but does not constitute a quantitative accuracy validation.
The Foot 2 sensor also recorded clear motion-related responses during the start trials. However, inspection of the video recordings suggested that the climber’s foot could contact the instrumented hold while also contacting the adjacent wall surface near the wall–hold boundary. Under such conditions, the sensor would record the load transmitted through the instrumented hold, but this load may not necessarily represent the complete reaction force acting on the foot. The Foot 2 profiles should be interpreted with this contact limitation in mind.
No ground-truth force measurements were available after removal of the reference sensor for the climbing trials. Accordingly, the field experiment distinguishes between three aspects of system performance: successful deployment, continuous acquisition of motion-related sensor responses, and quantitative force-estimation accuracy. The present results directly demonstrate the first two aspects but do not independently establish the third.
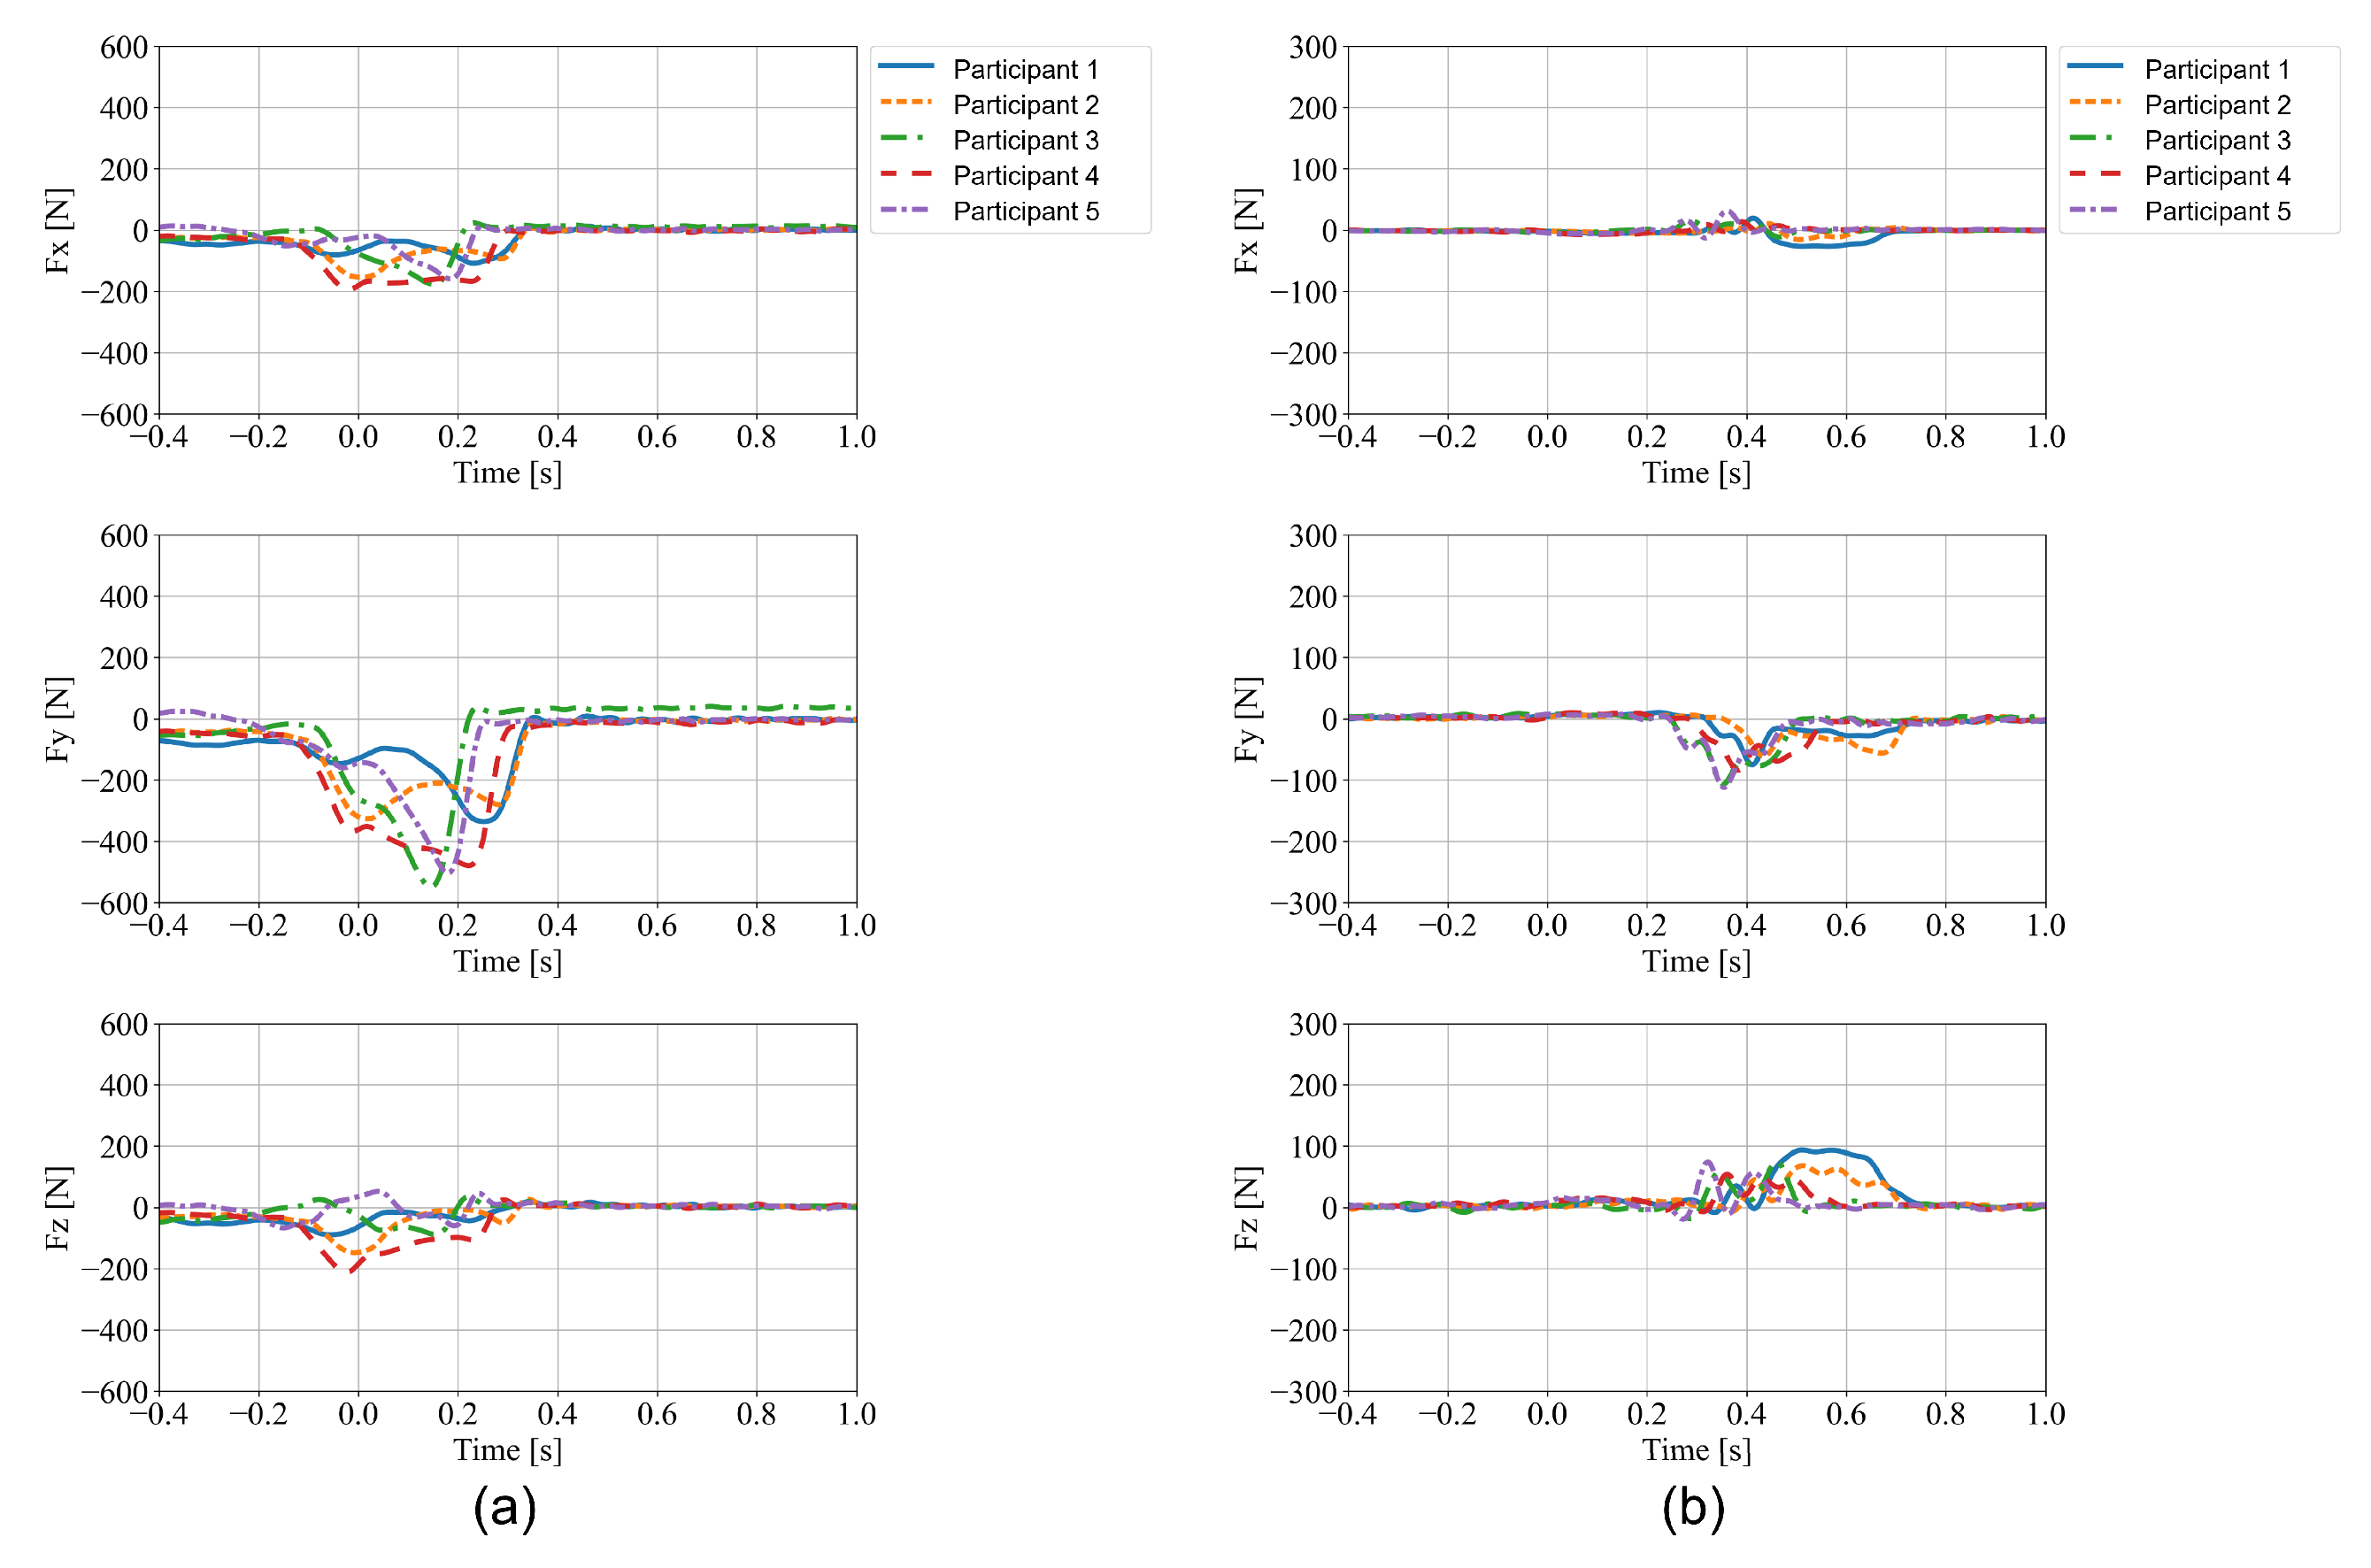
Figure 8 presents, for each of the five participants, the first trial that satisfied the Foot 1 contact conditions defined in
Section 3.2. The Foot 1 and Foot 2 profiles were aligned to the analysis start time defined from the force plate beneath the left foot, as described in
Section 3.2. Motion-related changes were observed in the force components recorded by both sensors for all participants, although the waveform magnitudes and shapes differed among participants. The Foot 2 profiles are presented to illustrate simultaneous sensor operation and remain subject to the contact limitation described above.
To examine whether the field estimates remained within the loading conditions represented during calibration, the signed force ranges from the 15 trials satisfying the criteria in
Section 3.2 were compared with the corresponding reference-force ranges in the calibration dataset. For Foot 1, the calibration ranges for
,
, and
were 1.8 to 125.4 N,
to 1.8 N, and
to 1.4 N, respectively, whereas the corresponding field ranges were
to 38.2 N,
to 75.1 N, and
to 40.1 N. For Foot 2, the calibration ranges were
to 23.0 N,
to 0.7 N, and
to 1.7 N, compared with field ranges of
to 52.2 N,
to 17.8 N, and
to 132.3 N, respectively. Several field estimates extended beyond the loading directions or ranges represented during calibration, most notably negative
and negative
for Foot 1 and positive
for Foot 2. These estimates constitute extrapolation beyond the calibration dataset.
The sensitivity of the peak force estimates to the cutoff frequency was also examined using the five trials shown in
Figure 8. Across the three force components and five trials, the maximum absolute differences from the 15 Hz peak values for Foot 1 were 10.2 N at 10 Hz and 7.4 N at 20 Hz. For Foot 2, the corresponding maximum differences were 25.9 N and 14.8 N, respectively.
4. Discussion
This study developed and field-tested a bolt-type force measurement system on an actual standardized speed climbing wall. By replacing conventional hold-fixing bolts with bolt-type force sensors and routing the cables through the bolt shafts to the rear side of the wall, the system could be installed without exposing wiring on the climbing surface or modifying the external shape of the holds. Two sensors were operated simultaneously during 27 start trials performed by five competitive climbers. These results demonstrate the feasibility of deploying the complete measurement system under actual climbing conditions.
The calibration results showed relatively small in-sample errors in the principal loading direction. The error ratios for were 2.9% and 5.1% for Foot 1 and Foot 2, respectively, and those for were 2.5% and 6.6%. The error ratios for were higher, particularly for Foot 2, where the maximum absolute reference force was only 39.8 N. Although the mean absolute error for in Foot 2 was 10.8 N and was comparable in magnitude to those for the other force components, normalization by this narrow reference-force range yielded an error ratio of 27.1%. Because the same calibration dataset was used to select the calibration model and calculate these errors, the reported values represent agreement within the calibration data rather than independent validation performance. The results indicate that the structured linear model reproduced the force components represented in the calibration dataset, but they do not establish its accuracy for loading conditions outside that dataset.
As a supplementary assessment, the two-way hold-out analysis evaluated force estimation using loading cycles that were not used to determine the corresponding calibration matrix. The resulting RMSE and MAE values differed between the two directions of the split, particularly for and , showing that the estimated errors depended on which three loading cycles were used for calibration. Because each calibration subset contained only three loading cycles and all six cycles were obtained within the same calibration measurement, this analysis should be regarded as a supplementary assessment rather than an independent validation of the calibration procedure. Given the large hold-out MAE ratios for Foot 2 (45.9% and 87.5%), the Foot 2 estimates should not be interpreted quantitatively.
The comparison between the calibration and field ranges further showed that the loading envelope represented during calibration did not fully encompass the field loading conditions. The calibration protocol emphasized
, which was expected to be the principal loading component during the start motion, and consequently represented
over a relatively limited range. In addition, the wall-normal
loading envelope under actual climbing conditions was not known a priori. The field measurements revealed loading outside the represented ranges, most notably negative
for Foot 1 and positive
for Foot 2. Accordingly, the in-sample errors reported in
Table 1 cannot be assumed to apply to these extrapolated field estimates. Future calibration should include bidirectional loading over a broader range on all three axes based on the field loading envelope identified in the present experiment.
During the field experiment, both sensors recorded time-varying responses associated with the speed-climbing start motion. For Foot 1, changes in the estimated force components were qualitatively consistent with the sequence of contact, loading, body movement, and release observed in the video recording.
Figure 8 further showed motion-related responses from both sensors in one trial from each participant, supporting simultaneous system operation across all five participants without providing a basis for quantitative interparticipant comparison. The cutoff-frequency sensitivity analysis showed that changing the cutoff frequency from 15 Hz to 10 or 20 Hz produced maximum absolute differences in peak force of 10.2 and 7.4 N, respectively, for Foot 1, and 25.9 and 14.8 N for Foot 2. At 20 Hz, higher-frequency fluctuations remained in some trials during periods in which the estimated force was close to zero. The 15 Hz cutoff was therefore retained to suppress these fluctuations while preserving the principal time-varying force responses. Foot 2 also had a less suitable contact condition for interpreting the estimated force as the complete foot reaction force because the climber’s foot could contact the instrumented hold together with the adjacent wall surface near the wall–hold boundary. Under this condition, part of the foot reaction force may have been transmitted directly to the adjacent wall surface rather than through the instrumented hold. The Foot 2 estimates should therefore be interpreted as the force transmitted through the hold rather than as the complete foot reaction force. This observation also has implications for future sensor placement strategies, which should depend on the purpose of the measurement. If the objective is to estimate the complete foot reaction force, locations where simultaneous contact with the surrounding wall is likely should preferably be avoided or supplemented by additional sensing. In contrast, because the proposed sensor measures the force transmitted specifically through the instrumented hold, such measurements may also be useful for investigating how effectively a climber applies force to the intended hold rather than to the surrounding wall. Quantifying this distribution would require additional measurement of the force transmitted directly to the wall and remains a topic for future investigation.
Compared with dedicated instrumented holds [
6,
8,
13,
14], the proposed system can be applied to existing hold shapes because the sensing element is incorporated into the fixing bolt. In contrast to systems that insert a force sensor between the hold and the wall [
16], the proposed configuration does not introduce a separate sensor layer that increases the wall–hold distance. Rear-side cable routing also reduces interference with the climber and avoids exposed wiring on the climbing surface. These characteristics support the applicability of the system to field measurements in which preservation of the original climbing environment is important.
Screw-type sensing approaches have also been reported. Pernus and Munro presented a preliminary hold measurement system for performance analysis [
19], and Pernus Weber et al. developed an instrumented mounting screw (IMS) with six strain gauges arranged as two triplets and evaluated analytical and neural-network-based calibration methods [
20]. Because the IMS and the present bolt-type system share the concept of incorporating sensing into the hold-fixing screw while avoiding exposed wiring on the climbing side, their main methodological differences are summarized in
Table 3.
The two approaches address different aspects of screw-based force sensing. The IMS study provides a more detailed evaluation of calibration behavior, including the influence of contact location, whereas the present study focuses on deployment of the complete measurement system after removal of the reference sensor and calibration fixtures and on repeated simultaneous operation of two sensors during actual speed-climbing trials. The present configuration also preserves direct contact between the hold and wall without introducing an additional washer. These differences should be considered when comparing the reported calibration performance and intended applications of the two systems.
Several limitations should be considered. First, although the calibration and field measurements were performed on the same climbing wall and at the same bolt holes, and although the same holds, tightening torque, distance from the strain-gauge section to the threaded engagement, and compensation for the angular position of the bolt were used in both configurations, the mechanical boundary condition at the threaded connection differed. During calibration, the bolt-type sensor was threaded into a metal nut embedded in the calibration fixture, whereas during the field measurements it was threaded directly into the fiber-reinforced plastic wall panel. This difference may alter the load transfer and local compliance around the threaded connection. In particular, the axial component of the structured strain vector may be more sensitive than the bending-related components to differences in load sharing between the bolt and the clamped members. Because this effect was not independently quantified, the calibration obtained with the metal-nut fixture cannot be assumed to transfer without error to the final wall installation. The field force estimates, particularly the axial component , should be interpreted with this limitation in mind. The present study did not evaluate repeatability after repeated sensor removal and reinstallation, installation by different operators, or changes in tightening torque. Future work should quantify the effects of these factors through repeated installation tests and determine whether a standardized installation procedure or recalibration after reinstallation is required for practical use. The calibration loads were applied manually and were therefore quasi-static relative to the rapid loading observed during the speed-climbing start. The dynamic response of the modified bolt, mounting interface, and complete measurement chain was not independently characterized; therefore, the present calibration results should not be assumed to establish force-estimation accuracy under rapidly varying loading conditions.
A second limitation concerns the angular correction applied between the calibration and field configurations. The angular differences were 0° for Foot 1 and 160° for Foot 2. The in-plane rotation is a coordinate transformation rather than a small-angle approximation and is therefore mathematically valid for the 160° offset, provided that the sensor orientation is correctly defined. This correction assumes that the rotational relationship between the sensor and the hold remains unchanged during force application. Because the sensor itself serves as the fixing bolt, appreciable rotation of the sensor would be expected to involve corresponding rotation or slip of the hold and is therefore considered mechanically unlikely. However, such rotation was not directly monitored, and small load-induced changes cannot be excluded. The accuracy of the 160° correction applied to Foot 2 was not independently validated under the present field conditions. No ground-truth force values were available during the climbing trials, and the present experiment focused on system deployment and continuous signal acquisition rather than on absolute force-estimation accuracy or statistical comparisons among participants.
A further limitation concerns the contact location on the hold. Because the bending components of the structured strain vector depend on the moment arm from the strain-gauge section to the point of force application, changes in contact location can alter the strain–force relationship even when the applied force is unchanged. A previous study on an instrumented mounting screw reported that force-estimation error varied with the center of pressure on the hold [
20]. In speed climbing, the standardized route and start configuration constrain the likely foot-contact region and loading directions more strongly than in less constrained climbing situations such as bouldering. In the present experiment, however, contact location was not controlled during the climbing trials, and position-specific calibration data sufficient for a retrospective sensitivity analysis were not retained. Consequently, the present data do not allow a contact region to be defined within which a specific quantitative accuracy can be guaranteed. Controlled calibration and validation at multiple contact locations will be required to quantify this dependence in future work.
5. Conclusions
This study developed and field-tested a bolt-type force measurement system for sport climbing holds. The bolt-type force sensors functioned as hold-fixing bolts, and their cables were routed through the bolt shafts to the rear side of the climbing wall. This configuration enabled the system to be installed without exposed wiring on the climbing surface or substantial modification of the external hold configuration.
Two sensors were calibrated using a reference six-axis force sensor and installed in two footholds on a standardized speed climbing wall. The in-sample error ratios for , the principal loading direction during calibration, were 2.9% and 5.1% for Foot 1 and Foot 2, respectively, whereas those for were 11.8% and 27.1%. During 27 start trials performed by five competitive climbers, the system simultaneously recorded strain responses from both instrumented holds and converted them into time-varying three-axis force estimates. The responses obtained from Foot 1 were qualitatively consistent with the sequence of contact, loading, body movement, and release observed in the video recordings. The Foot 2 responses confirmed simultaneous system operation, but they were not interpreted as a complete representation of the foot reaction force because the climber’s foot may also have contacted the adjacent wall surface.
These findings demonstrate the feasibility of installing and operating the complete bolt-type force measurement system under actual speed-climbing conditions. However, comparison of the signed force ranges showed that some field estimates extended beyond the loading directions or ranges represented in the calibration dataset. Although the supplementary hold-out analysis evaluated separate loading cycles for calibration-matrix determination and error calculation, all loading cycles were obtained within the same calibration measurement. In addition, no ground-truth force measurements were available during climbing. The present results therefore do not establish the absolute accuracy of the field force estimates. Future work should broaden the bidirectional calibration loading range based on the field loading envelope identified here, improve the repeatability of the installation and calibration procedures, and develop a validation method that reproduces the actual wall installation and loading conditions as closely as possible.