Article

Three-Dimensional Stability Analysis of a Tunnel Roof at Varying Burial Depths in Saturated Hoek–Brown Rock Masses


College of Architecture and Civil Engineering, Beijing University of Technology, Beijing 100124, China
*
Author to whom correspondence should be addressed.
Appl. Sci. 2026, 16(17), 8769; https://doi.org/10.3390/app16178769
Submission received: 28 July 2026 / Revised: 26 August 2026 / Accepted: 31 August 2026 / Published: 3 September 2026
(This article belongs to the Special Issue Advanced Drilling, Cementing and Completion Technologies)

Abstract

This study investigates the stability of three-dimensional (3D) tunnel roofs with varied burial depth in saturated rock strata following the Hoek–Brown (HB) failure criterion. Within the framework of limit analysis, a 3D kinematic collapse mechanism for tunnel roofs, incorporating the existence of pore water pressure, is developed, and corresponding stability indices are formulated. Numerical methods are utilized to determine the optimal solutions of these indices. A comprehensive parametric study evaluates the influence of 3D geometric characteristics, HB parameters, and burial depth on tunnel stability. Results demonstrate the evolution of tunnel-roof stability as the critical depth-to-span ratio C/R increases from shallow- to deep-buried conditions; for the parameter combinations examined in this study, the critical C/R separating the two mechanisms ranges approximately from 0.15 to 2.0, depending on the rock-mass properties, pore-pressure condition, and tunnel geometry. Furthermore, stability charts correlating supporting pressure and factor of safety (FoS) in saturated strata are proposed to offer practical design guidance. Findings indicate that neglecting pore water pressure may significantly underestimate the structural stability, thereby emphasizing the necessity of incorporating hydrogeological effects in tunnel design. The proposed stability assessment framework provides theoretical support for the safe development of deep underground spaces under complex geological conditions, including deep energy exploitation, underground storage facilities, and related geotechnical engineering applications.

1. Introduction

Tunnel engineering, as a key technology for constructing underground passages under complex geological conditions, is widely applied in urban infrastructure, mountainous transportation, and hydraulic projects. The stability of the tunnel roof is directly associated with construction, safety and service life. Accordingly, a systematic and scientifically grounded evaluation of tunnel roof stability constitutes a matter of substantive significance, as it underpins both the assurance of construction safety and the preservation of structural integrity over extended service periods. Among the commonly employed tunnel roof stability analysis approaches, the limit analysis method based on variational principles has been extensively used to evaluate tunnel roof stability, as it enables the derivation of analytical expressions for collapse mechanisms and failure geometries. On the basis of this theoretical framework, a considerable body of research has focused on examining the stability of tunnel roofs in Hoek-Brown (HB) rock strata [1,2,3,4,5,6,7,8,9,10]. Nevertheless, the majority of existing studies have concentrated on delineating the potential collapse region of the tunnel roof. In contrast, comprehensive and systematic quantitative assessments of its stability are still comparatively scarce. Compared with qualitative assessments, quantitative stability indices offer enhanced comparability and provide a more solid basis for engineering design and safety evaluation. To address this gap, a segmented failure mechanism for tunnel roofs has been established [11,12,13], and a quantitative analytical framework has been proposed for evaluating tunnel roof stability. Moreover, the effects of tunnel size parameters and the HB criterion parameters on the stability of the tunnel roof were analyzed. With the development of deep underground space utilization and underground energy storage technologies, underground structures are increasingly constructed at greater depths. Therefore, accurate evaluation of structural stability under different burial depths is of great significance for ensuring the safety of deep underground engineering [14].
With the rapid expansion of underground space utilization, urban subsurface environments have become increasingly congested, and the scale of shallow-buried tunnel construction has continued to grow. Owing to the limited overburden depth and strong environmental disturbances, shallow tunnels often fail to develop a fully formed collapse mechanism, which makes their roofs particularly vulnerable to instability. Consequently, the stability analysis of shallow-buried tunnel roofs has attracted increasing attention [15,16].
Roof stability in shallow tunnels is highly sensitive to groundwater conditions. In saturated ground, the presence of pore water diminishes the strength of the surrounding rock mass. In addition, it may give rise to seepage-induced failures and impose abnormal loads on the tunnel support system. These combined effects substantially heighten the likelihood of instability at the tunnel roof [17]. Accordingly, the stability of the tunnel roof differs considerably between dry environments and water-bearing states, making it essential to incorporate hydrogeological effects into engineering design and analysis to guarantee structural safety and long-term stability.
In studies focusing on groundwater-induced stability reduction, the HB criterion has often been integrated with the limit analysis method based on variational principles to derive analytical collapse mechanisms and corresponding numerical solutions for tunnels and slopes under pore water pressure [15,18,19,20,21]. With respect to groundwater mechanisms, research has gradually evolved from static pore water pressure effects to more complex issues involving seepage forces and multiphase media. For example, Qin et al. [22,23] were the first to incorporate seepage forces as external loads into the upper-bound limit analysis framework and, based on the HB criterion, investigated tunnel roof collapse under seepage conditions, providing a novel perspective for analyzing tunnel stability under hydrodynamic pressures. Subsequently, groundwater table fluctuations were considered to reflect more realistic engineering scenarios, and an innovative “progressive collapse” model comprising upper and lower water domains was proposed.
Although numerous studies have investigated the stability of deeply buried tunnels under complex hydrogeological conditions, research specifically targeting shallow-buried tunnels is still relatively limited. In particular, research on the three-dimensional (3D) collapse mechanisms of tunnel roofs under the effects of pore water pressure remains limited. Few studies have systematically investigated this phenomenon, leaving a gap in the understanding of how pore water pressure influences roof stability. Therefore, examining the stability of tunnels situated within saturated soils—particularly focusing on the stability of the tunnel roof—is of considerable theoretical and practical significance.
Therefore, this study examines the stability of 3D tunnel roofs with varied burial depth in saturated rock strata by applying the HB failure criterion within a limit analysis framework. A fixed coefficient ru is first introduced to evaluate the subsurface pore water pressure, and the 3D failure mechanism of shallow-buried tunnel roofs is employed to explicitly account for groundwater effects [24]. Based on the energy balance equation, this study derives and optimizes the critical solutions for three key indicators of tunnel roof stability. Furthermore, the effects of the tunnel’s intrinsic parameters were also analyzed. To facilitate the estimation of the stability indicators required for tunnel crowns by researchers and engineers, corresponding stability charts are provided. The findings of this work offer theoretical support for the design of tunnels in saturated ground. Furthermore, the proposed stability assessment method is not limited to conventional tunnel engineering but can also provide theoretical references for the safety evaluation of deep underground spaces, underground energy storage facilities, and other long-term underground structures [25,26,27]. The derived stability indices and design charts can assist engineers in predicting potential instability risks, optimizing support strategies, and improving the overall safety level of underground engineering systems.
Several analytical components adopted in the present study have established origins and should be distinguished from the specific contributions of this work. Park and Michalowski [11] developed the fundamental 3D kinematic collapse mechanism for circular tunnel roofs in rock, whereas Xu et al. [24] extended the mechanism to shallow-buried cylindrical tunnels by accounting for the restriction imposed by the ground surface. The multi-cone discretization and nonlinear-strength formulations used in 3D rock-slope and retaining-structure analyses were also reported in References [28] and [29], respectively. These studies provide the geometric and analytical foundations for the present formulation.
The present study retains the established multi-cone kinematic geometry and upper-bound limit-analysis framework to ensure theoretical continuity with the previous studies. However, the physical problem addressed and the resulting stability solutions are different from those reported previously. Specifically, the work rate of pore-water pressure is formulated for a three-dimensional tunnel-roof mechanism with varying burial depth, and the corresponding stability number N, normalized supporting pressure p/γR, and factor of safety FoS are evaluated for saturated Hoek–Brown rock masses. The analysis further describes the evolution of the collapse mechanism with C/R, identifies the critical C/R separating shallow- and deep-buried conditions under different pore-pressure conditions, and develops stability charts for the preliminary estimation of the required supporting pressure and FoS. Therefore, the contribution of this study lies in the saturated-ground formulation, the burial-depth-dependent stability solutions, and their engineering interpretation, rather than in reintroducing the previously established collapse geometry.

2. Failure Mechanism of 3D Tunnel Roofs in Saturated HB Rock Masses

2.1. The Hoek-Brown Criterion

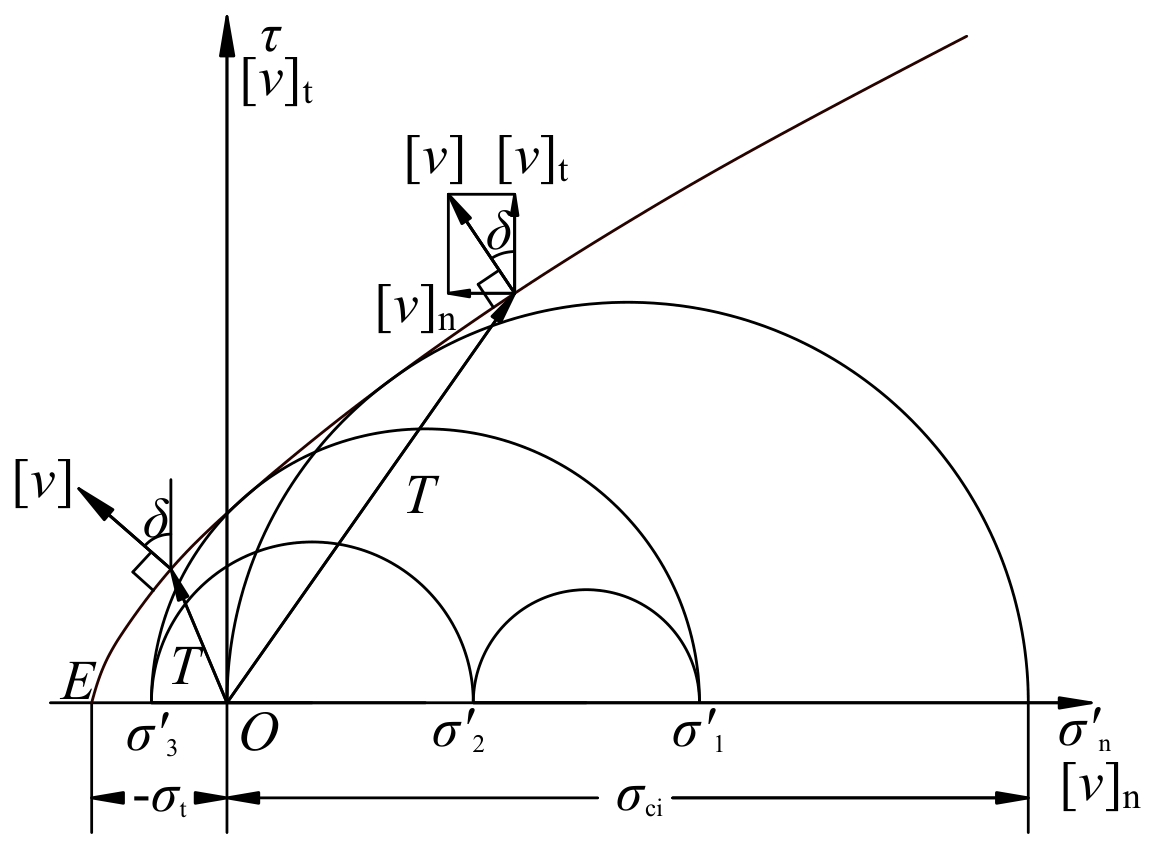
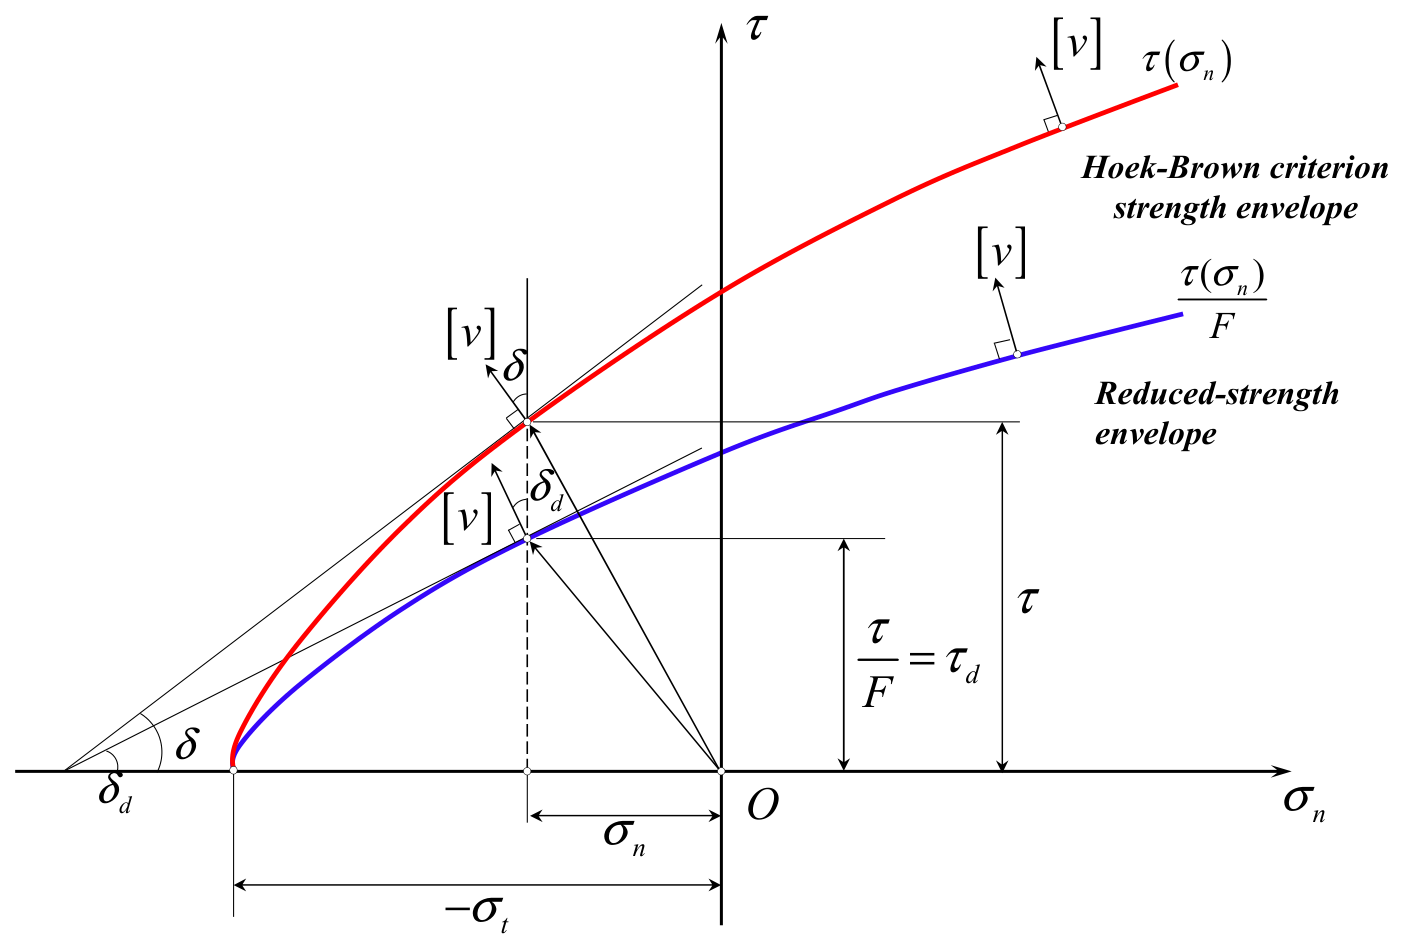
The HB criterion, as illustrated in Figure 1, offers a dependable characterization of the mechanical behavior of rock masses and allows for versatile implementation in numerical analyses [30]. This criterion integrates the benefits of readily accessible parameters, broad applicability, and operational practicality. To facilitate the subsequent stability analyses, this study adopts the parameterized formulation of the HB criterion. The expression of this formulation is illustrated in the accompanying figure and can be written as follows [28,31,32]:
σ n = σ c i 1 m b + sin δ m b a m b a ( 1 sin δ ) 2 sin δ 1 1 a s m b
τ = σ c i cos δ 2 m b a ( 1 sin δ ) 2 sin δ a 1 a
Here, σn and τ denote the normal stress and the shear stress, respectively. The term σci represents the uniaxial compressive strength of the intact rock, while δ is the rupture angle determined by the HB criterion; mb and s are rock mass parameters; and a is the exponent parameter, which are defined as follows:
m b = m i e G S I 100 28 14 D
a = 1 2 + 1 6 e G S I 15 e 20 3
s = e G S I 100 9 3 D
In the equations, GSI = 5~100 (Geological Strength Index), mi = 5~30 (parameter reflecting rock type), and D = 0~1 (disturbance factor) [33,34]. This study considers the case where D = 0, corresponding to undisturbed rock mass.

2.2. Failure Mechanism for 3D Tunnel Roofs in Saturated Rock Masses

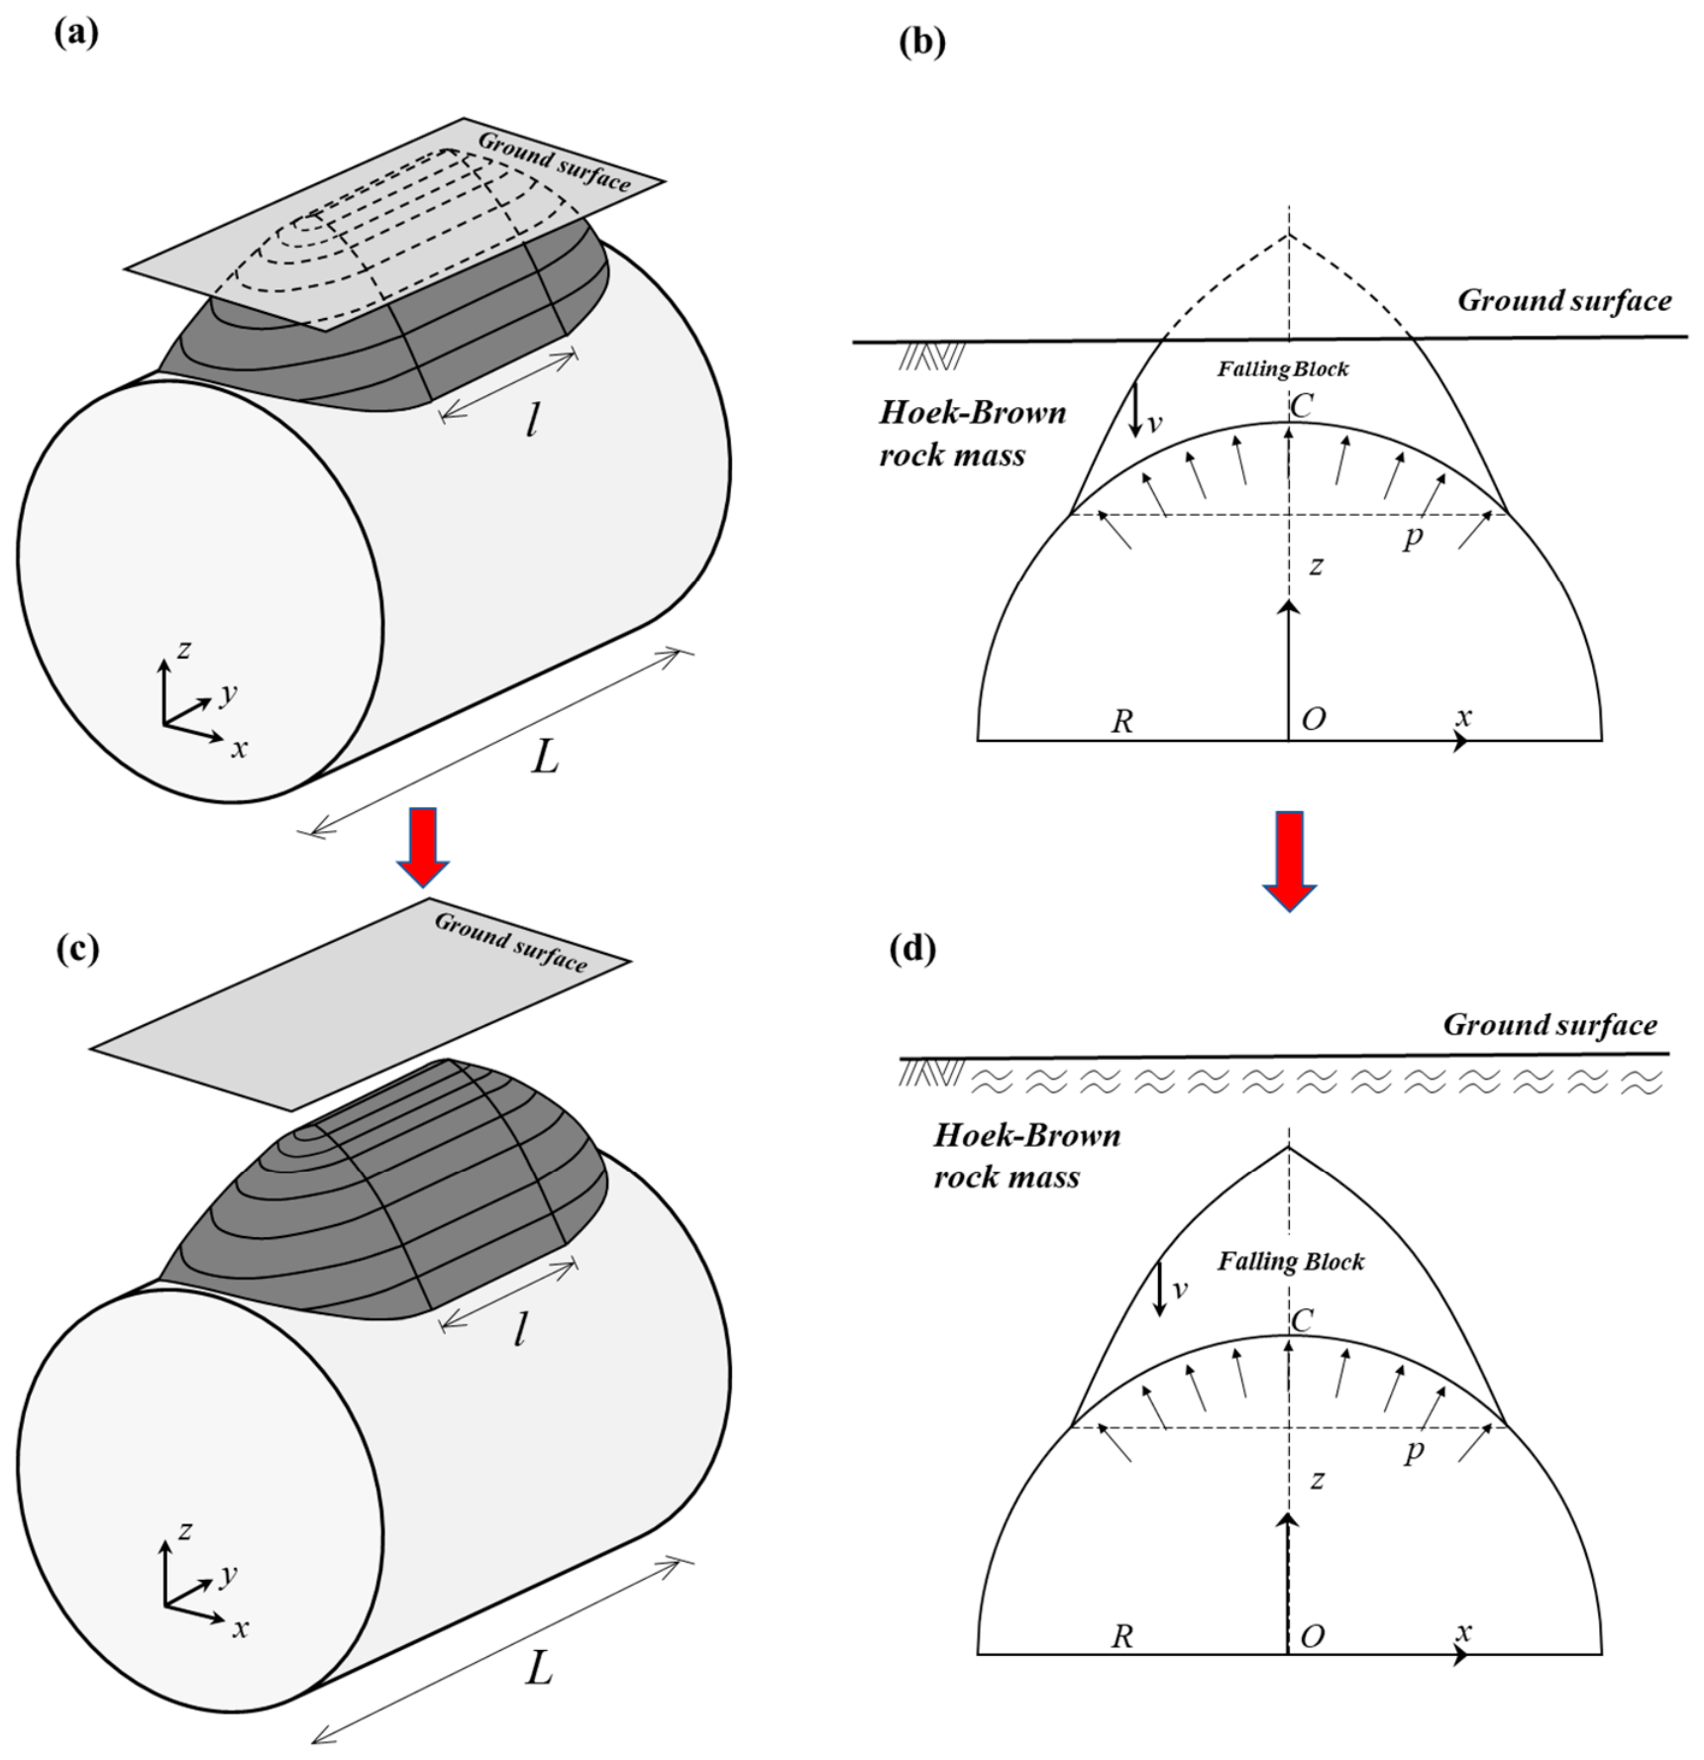
Figure 2 illustrates the 3D collapse mechanisms of the tunnel roof under shallow- and deep-buried conditions, together with their corresponding vertical sections. Figure 2a shows the 3D collapse mechanism under the shallow-buried condition. Because of the relatively small overburden depth, the upper part of the potential collapse mechanism is truncated by the ground surface, resulting in an incomplete failure mechanism. Figure 2b presents the corresponding vertical section, in which R denotes the tunnel radius, z represents the vertical coordinate, and p denotes the supporting pressure acting on the tunnel roof.
As the tunnel burial depth increases, the influence of the ground surface on the collapse mechanism gradually decreases, and the potential failure region progressively develops into a complete form. As noted by Xu et al. [24], when the burial depth reaches a critical value, the apex of the complete collapse mechanism just reaches the ground surface. This burial depth is defined as the critical tunnel roof depth, which marks the transition from the shallow-buried to the deep-buried failure mode. Figure 2c shows the complete 3D collapse mechanism under the deep-buried condition, where the entire failure region is located beneath the ground surface. Figure 2d presents its corresponding vertical section. Once the burial depth exceeds the critical tunnel roof depth, further increases in burial depth do not significantly alter the morphology of the collapse mechanism.
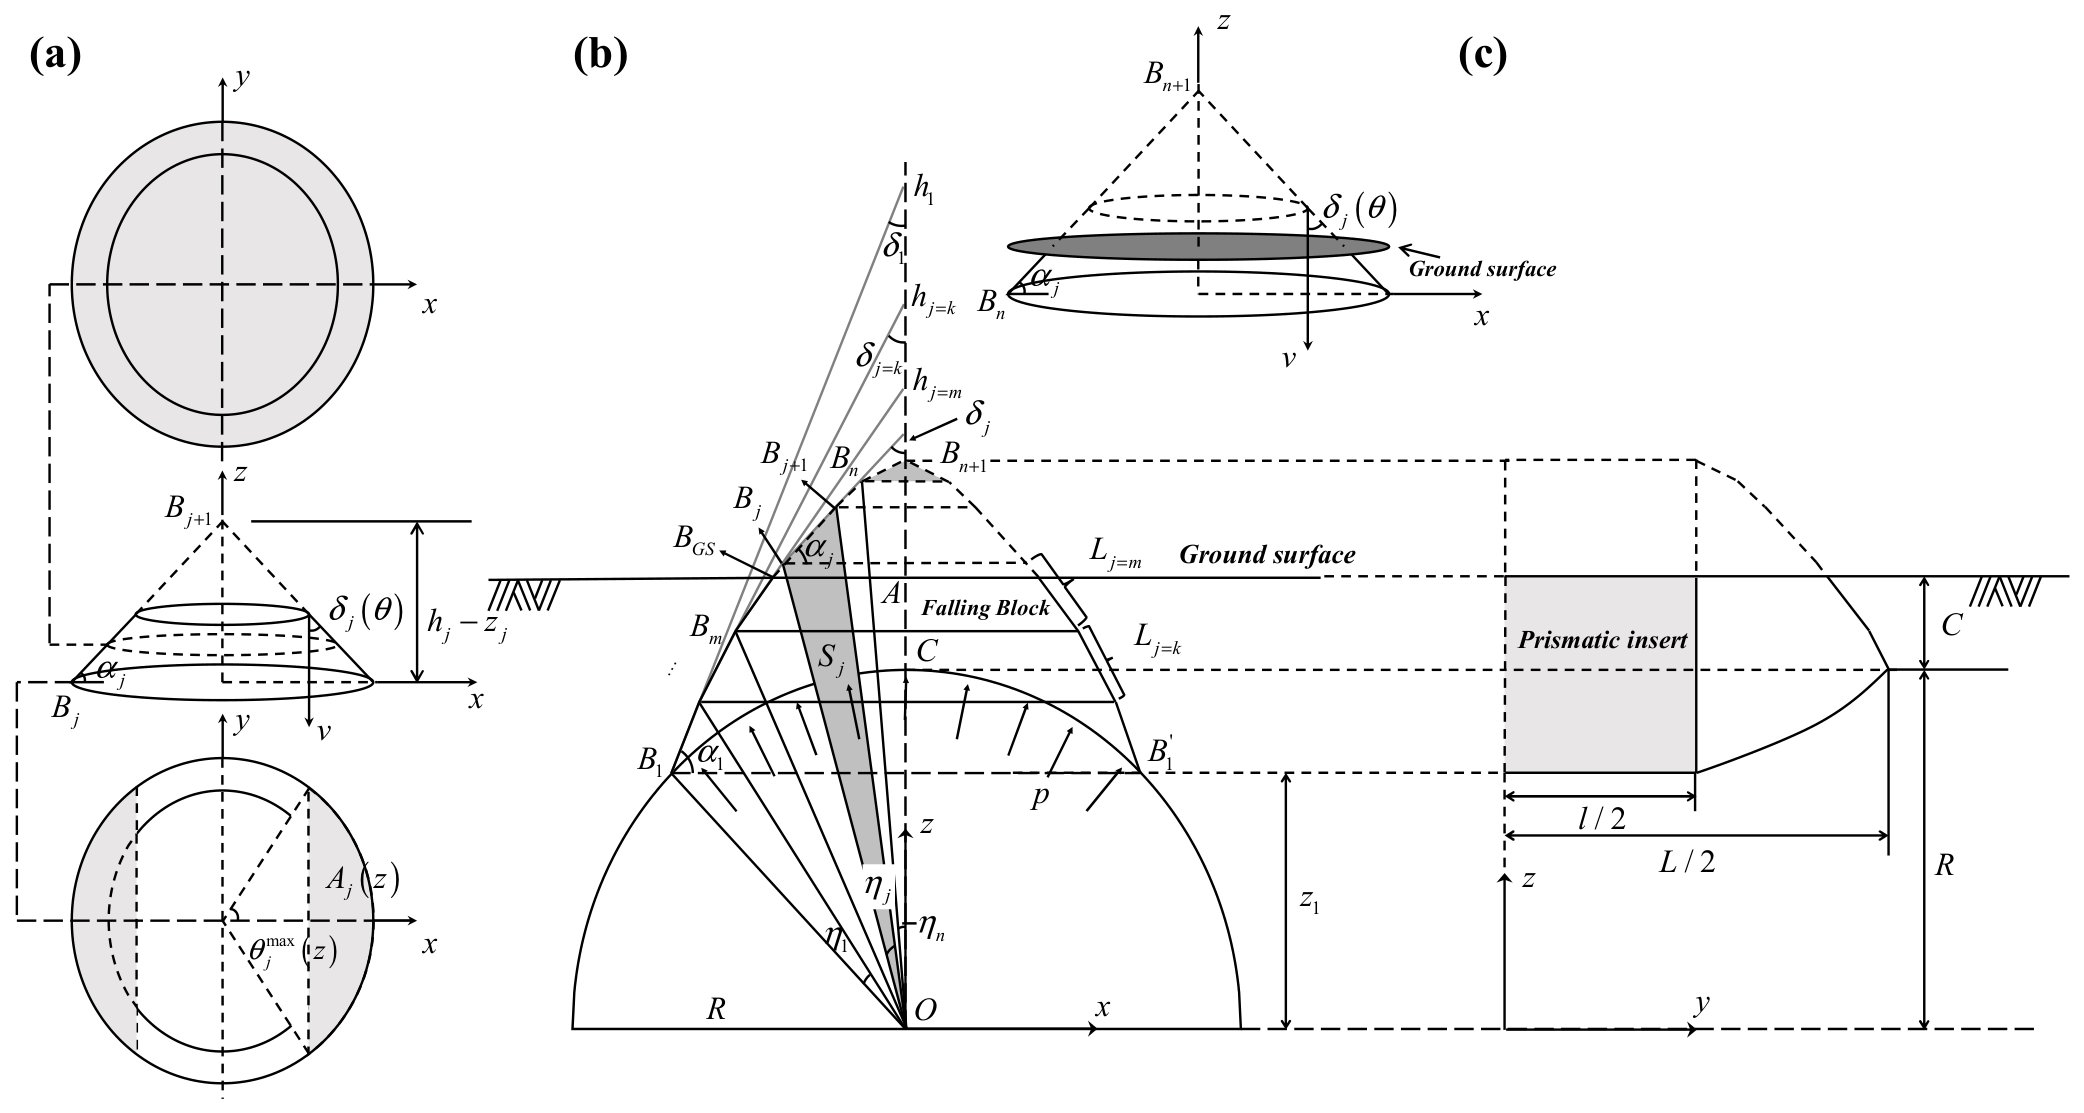
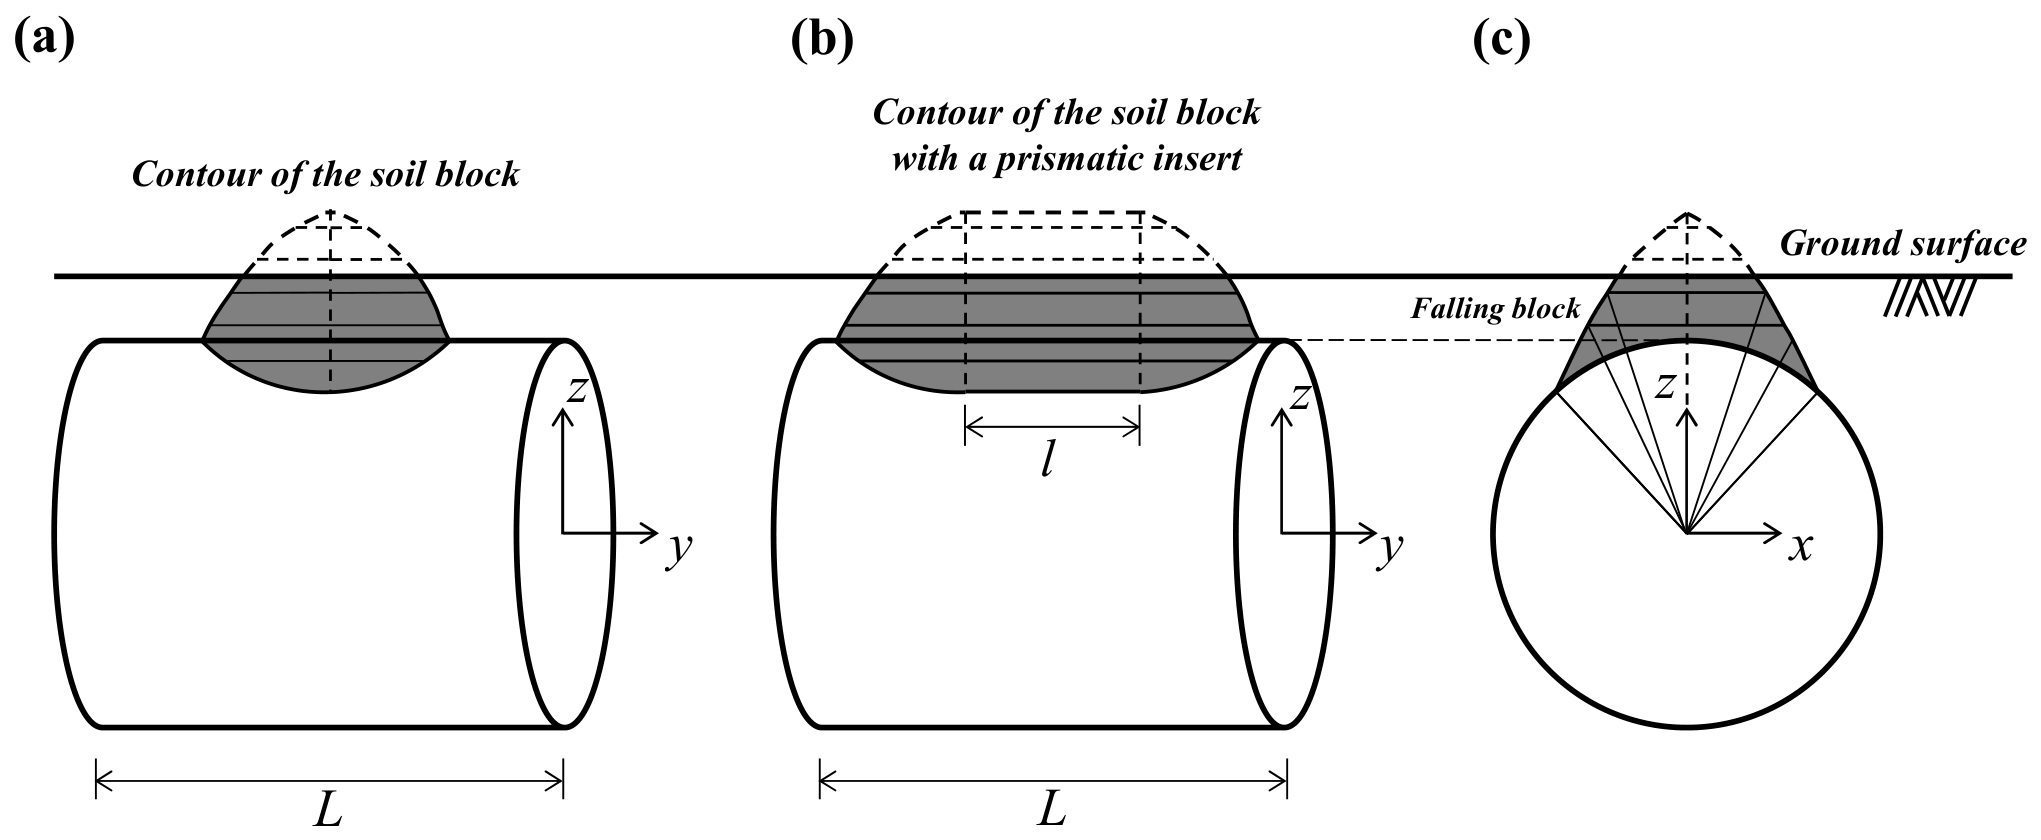
As illustrated in Figure 3, the 3D collapse mechanism of the roof of a cylindrical tunnel with varying burial depth is established based on the model proposed by Park and Michalowski [11]. Figure 3a shows the circular cross-section of the cylindrical tunnel, which is characterized by the tunnel radius R, tunnel length L measured along the longitudinal axis, and overburden depth C. Figure 3b illustrates the geometric characteristics of the elliptical cross-section of the failure mechanism, where Aj(z) denotes the cross-sectional area of the j-th elliptical cone at a given vertical coordinate z.
The detailed geometric construction of the collapse mechanism is presented in Figure 3c. The potential failure region is discretized into a series of n right-inclined elliptical cones, each characterized by a distinct generatrix inclination angle αj and height hj (j = 1, 2, …, n). A Cartesian coordinate system is introduced with its origin O located at the center of the cylindrical tunnel, where the x- and z-axes denote the horizontal and vertical directions, respectively. The supporting pressure p acts normal to the tunnel roof boundary. In addition, a prismatic insert is introduced along the longitudinal direction of the tunnel to extend the cross-sectional collapse mechanism into a 3D failure mechanism. Based on the geometric relationships shown in Figure 3c, the surface of each elliptical cone can be mathematically expressed by the following equation:
x 2 a 2 + y 2 b 2 = ( z h ) 2 h 2
Here, a and b represent the minor and major radii of the elliptical cone in the x and y directions, respectively. The parameter h denotes the height of the cone, as illustrated in Figure 3. Moreover, the expression given in Equation (7) can be reformulated as a function of the generatrix inclination angle αj, which yields the following form:
x 2 + y 2 λ 2 = z h j 2 tan 2   α j
Here, α j = tan - 1 h / a and λ = b / a . When a particular criterion is satisfied: λ = 1, the geometry of the elliptical cone degenerates into that of a circular cone.
In this study, δj denotes the rupture angle corresponding to the j-th right-inclined elliptical cone, consistent with the definition of the rupture angle δ in Figure 1. According to the normality flow rule, δj is geometrically represented as the angle between the generatrix of the j-th cone and the vertical velocity v, as illustrated in Figure 3. Accordingly, δj = π/2 − αj and can be expressed as a function of the angle θ, as shown in the following equation:
δ j ( θ ) = π 2 cos 1 1 cos θ cot α j 2 + sin θ λ cot α j 2 + 1
To provide the 3D collapse mechanism with a clear geometric interpretation, an insertion plane of length l is introduced into the plane of symmetry of the mechanism, as illustrated in Figure 4. Figure 4a shows the collapse mechanism with a relatively short insertion length, while Figure 4b illustrates the corresponding geometric configuration as the insertion length l increases. The introduction of the insertion plane extends the collapse mechanism along the longitudinal direction while preserving the geometric characteristics of its cross-section. Figure 4c presents the limiting case of the mechanism. When the specified geometric condition is satisfied, l the influence of the longitudinal dimension vanishes, and the 3D collapse mechanism degenerates into the corresponding 2D mechanism.
In this study, C denotes the vertical cover depth measured from the ground surface to the tunnel roof, and R denotes the tunnel radius. The shallow- or deep-buried condition is defined according to the geometry of the optimized collapse mechanism rather than by a predetermined absolute burial depth. When the potential collapse mechanism is truncated by the ground surface, and a complete collapse arch cannot be formed, the tunnel is classified as shallow-buried. The critical burial condition is reached when the apex of the corresponding complete collapse mechanism just reaches the ground surface. When the entire optimized collapse mechanism is located beneath the ground surface, and a complete collapse arch is formed, the tunnel is classified as deep-buried. Accordingly, the critical depth-to-span ratio C/R varies with the rock-mass properties, pore-pressure condition, and tunnel geometry [15,24].

3. Stability Indices for Tunnel Roofs

The geometric discretization of the collapse mechanism and the derivations of the gravitational work rate, support-pressure work rate, and internal energy dissipation follow the established upper-bound frameworks reported in References [11,24,28,29]. In the present study, the work rate associated with pore-water pressure is formulated for the adopted three-dimensional tunnel-roof mechanism at varying burial depths. This term is incorporated into the energy balance to determine N, p/γR, and FoS under saturated conditions.

3.1. Work Rates Calculation

Within the framework of limit analysis, the stability of the system is governed by the energy balance equation: W γ + W p + W r u = D . In this expression, Wγ represents the external work performed by the gravitational force of the surrounding rock mass, Wru represents the external work done by pore water pressure, and Wp corresponds to the external work contributed by the support pressure. Finally, D represents the rate of internal energy dissipation that occurs along the failure surface. The relevant derivation process is presented in Appendix A. Based on this energy balance equation, the solutions of the stability evaluation indices—namely N (stability number), p/γR (required support pressure), and FoS (factor of safety)—can be obtained, thereby providing a quantitative assessment of the stability of 3D tunnel roofs.

3.1.1. The Stability Number N

N, the stability number, serves as a dimensionless metric for evaluating tunnel roof stability. N represents the ratio of the rock mass strength necessary to maintain stability to the applied overburden stress. A larger N indicates that a higher normalized intact-rock strength is required to prevent collapse and therefore corresponds to a less stable roof condition. Conversely, a smaller N indicates a lower required strength demand and hence a more stable roof condition. The critical stability number is obtained from the energy balance equation W γ + W r u = D , is expressed as follows:
N = σ c i γ R c r i t

3.1.2. The Required Supporting Pressure p/γR

The support pressure, denoted by p, serves as an additional indicator for evaluating tunnel stability. In this study, tunnel support is idealized as a uniformly distributed load passively acting on the tunnel roof. Its function is to counteract the surrounding rock mass’s tendency to collapse, thereby maintaining the roof in a state of limit equilibrium. Notably, the support acts exclusively on the portion of the roof intersected by the collapse mechanism. In other words, the mobilization of support is confined to the roof section directly involved in the failure zone, namely the B1CB1’ segment illustrated in Figure 3. By incorporating the work performed by this support pressure into the overall energy balance equation, the dimensionless parameter of required support pressure, p/γR, can be derived and is given as follows: W γ + W r u = D + W p .

3.1.3. Factor of Safety

In this study, FoS is adopted as the ultimate stability index. It serves to quantify the balance between the intrinsic strength of the rock mass and the structural requirements needed to maintain stability. Specifically, FoS is defined as the ratio of the actual shear strength of the rock mass τ to the shear strength necessary to keep the tunnel roof in ultimate equilibrium τ d , as shown in Figure 5, and is expressed as:
F o S = τ τ d
The required shear strength for equilibrium ( τ d ) is defined as:
τ d = τ F = σ c i F cos δ j 2 m b a ( 1 sin δ j ) 2 sin δ j a 1 a
Subsequently, an optimization procedure may be applied, which is formulated on the basis of the strength reduction method. This approach is used to determine the Factor of Safety associated with the stability of the tunnel roof.

3.2. Optimization Process for the Stability Indices

For each prescribed set of geometric and material parameters, the optimization procedure searches the feasible combinations of the 2n + 1 independent variables subject to the geometric and kinematic constraints in Equation (12). The optimization criterion is defined by the critical values of the stability indices: the maximum values of N and p/γR and the minimum value of FoS are sought. The corresponding vector x = (α1, …, αn, η1, …, ηn, λ) T that produces an extremal value is regarded as the optimal solution associated with the critical collapse condition.
The constrained optimization was implemented using the built-in genetic algorithm solver GA in the MATLAB R2024a Global Optimization Toolbox. Because GA is formulated as a minimization solver, N and p/γR were used as the objective functions when determining the maximum values of N and p/γR, whereas FoS was minimized directly. The design variables were subjected to the linear inequalities Ax ≤ b and to the lower and upper bounds LB ≤ x ≤ UB. For n = 10, the 21-component design vector was bounded by 0.01 ≤ αj, ηj ≤ π/2 − 0.01 and 0 ≤ λ ≤ 10. The population size was set to 50, the objective-function tolerance was 10−8, and the initial seed was αj = ηj = 0.02 rad and λ = 1. The remaining individuals were generated by the solver within the prescribed bounds. To reduce the influence of the stochastic search, five independent GA runs were performed for each parameter set, and the most critical result was retained.
0 < α j + 1 < α j < π 2 j = 2 , 3 , 4 , n 1 0 < j = 1 n η j < π 2   j = 1 , 3 , 4 , n

4. Results and Discussion

To make the structure of the parametric program more explicit, Table 1 classifies the adopted parameters according to their physical roles and clearly distinguishes the parameters examined in the parametric analyses from the fixed modeling and numerical settings. For each parameter, its adopted values or range, its role in the analyses, and the basis for its selection are provided. The captions and accompanying descriptions of Figure 6, Figure 7, Figure 8, Figure 9, Figure 10, Figure 11, Figure 12 and Figure 13 further specify which parameters are varied and which are maintained constant in each individual analysis.
The selected parameters cover the effects of rock-mass quality, intact-rock characteristics, pore-water pressure, overburden depth, 3D tunnel geometry, and the relative magnitude of intact-rock strength to gravitational loading. The values of GSI and mi were selected according to the conventional parameter ranges of the Hoek–Brown criterion. Specifically, GSI values of 10, 20, 40, 60, 80, and 100 were adopted to cover a broad range of rock-mass conditions, while mi values of 5, 10, 15, 20, and 25 were adopted to represent intact rocks with different lithological and mechanical characteristics [33,34]. The disturbance factor was maintained at D = 0 to represent an undisturbed rock mass [33,34].
The pore-pressure coefficient ru was varied from 0 to 0.5 to represent conditions ranging from the absence of pore-water pressure to relatively pronounced pore-pressure effects within the adopted simplified formulation [18,19,20,21,22,23,24]. The representative values ru = 0.25 and 0.5 were used in the stability charts. The overburden ratio C/R was increased from a very shallow condition until the calculated stability index reached the corresponding deep-buried plateau. Therefore, the upper limit of C/R differs among the analyses because the critical overburden ratio depends on the rock-mass properties, pore-pressure condition, and tunnel geometry [24].
The longitudinal geometric ratio L/R was varied from 0.5 to 5.0, together with the corresponding two-dimensional (2D) limiting condition, to evaluate the transition from a 3D tunnel-roof response to the plane-strain condition [11,24]. The dimensionless strength parameter σci/γR was examined over a broad range to account for different combinations of intact-rock strength, rock-mass unit weight, and tunnel size [11,12,13,24].

4.1. Stability Number

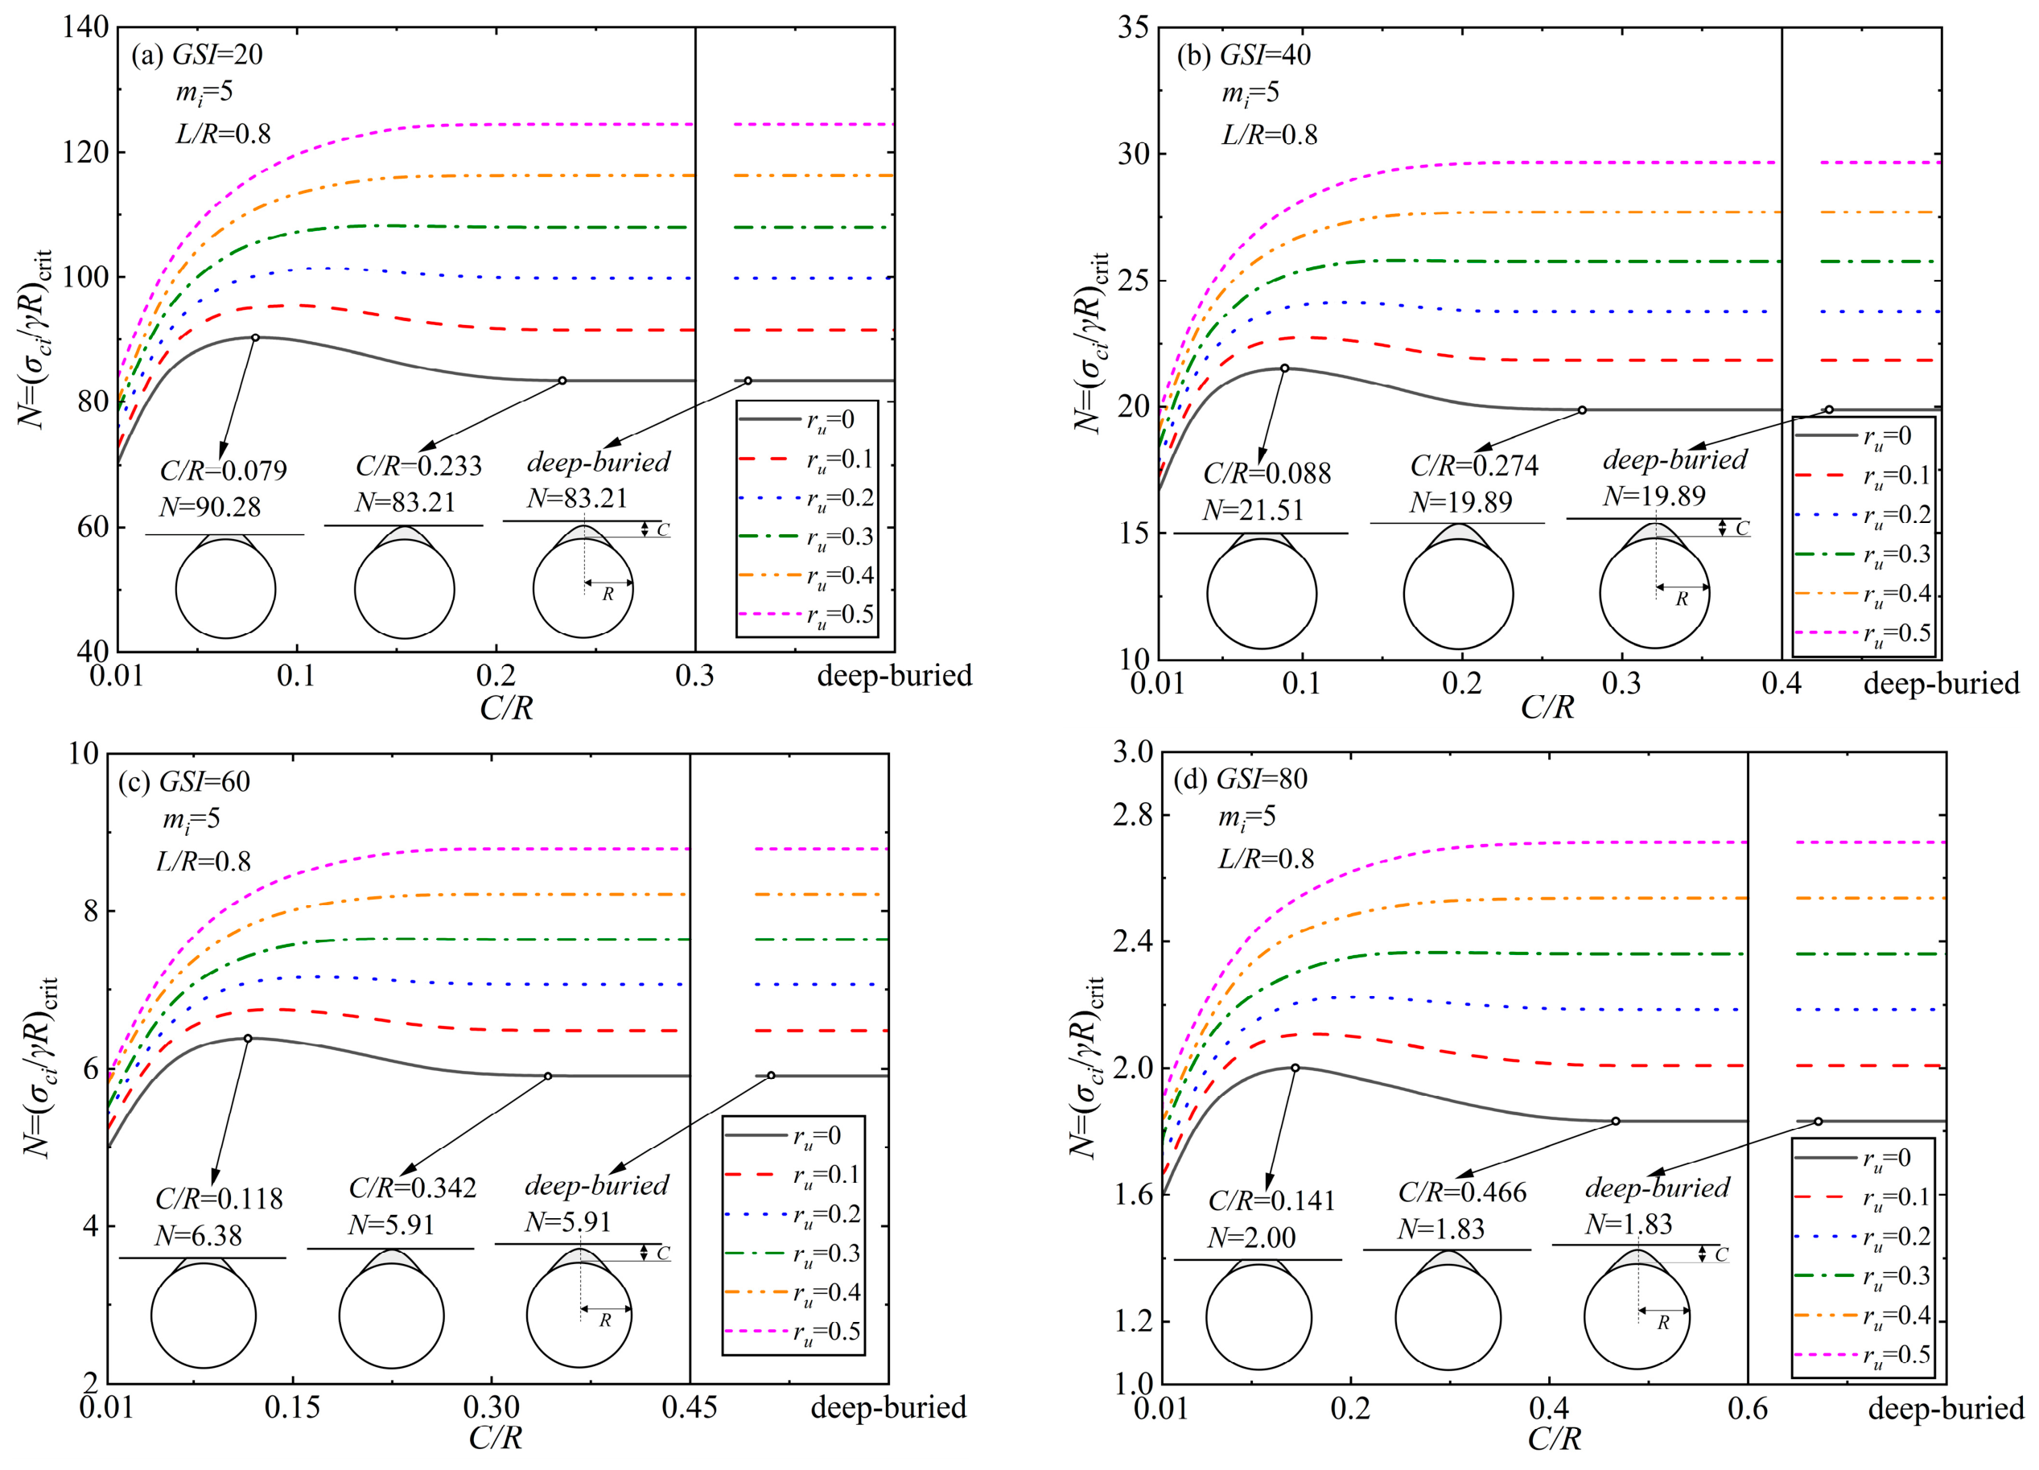
The effects of the HB criterion parameters on tunnel stability were systematically evaluated by considering GSI, the depth-to-radius ratio (C/R), and the pore pressure coefficient ru. Figure 6 illustrates the variations in the critical stability number, N, with respect to C/R under varying GSI and ru conditions, while maintaining constant values of mi = 5 and L/R = 0.8. The computational results reveal a clear trend: N increases significantly with higher values of ru. This underscores the detrimental effect of pore water pressure, which reduces the effective stress and necessitates a higher required rock mass strength to maintain tunnel stability. Furthermore, the evolution of N with C/R exhibits distinct patterns depending on the magnitude of ru. Under relatively low pore pressure conditions (e.g., ru ≤ 0.2), N initially increases with C/R to a peak value, then experiences a slight decrease before ultimately plateauing at a constant value. This constant N marks the transition of the collapse mechanism from a shallow cover to a deep-buried condition, where the failure zone no longer extends to the ground surface and is independent of further increases in overburden depth. Conversely, under high pore pressure conditions (ru ≥ 0.4), N increases monotonically and stabilizes without displaying a descending branch. Finally, comparing the subplots across different rock mass qualities reveals that an increase in GSI dramatically reduces the overall magnitude of the required stability number N, reflecting the enhanced self-supporting capacity of higher-quality rock masses. Concurrently, the critical C/R ratio corresponding to the transition into the deep-buried collapse mechanism shifts to larger values as GSI increases.
Figure 6. Stability number for 3D shallow-buried tunnel roofs under pore water pressure versus C/R under mi = 5.0, L/R = 0.8 and: (a) GSI = 20; (b) GSI = 40; (c) GSI = 60; (d) GSI = 80.
Applsci 16 08769 g006
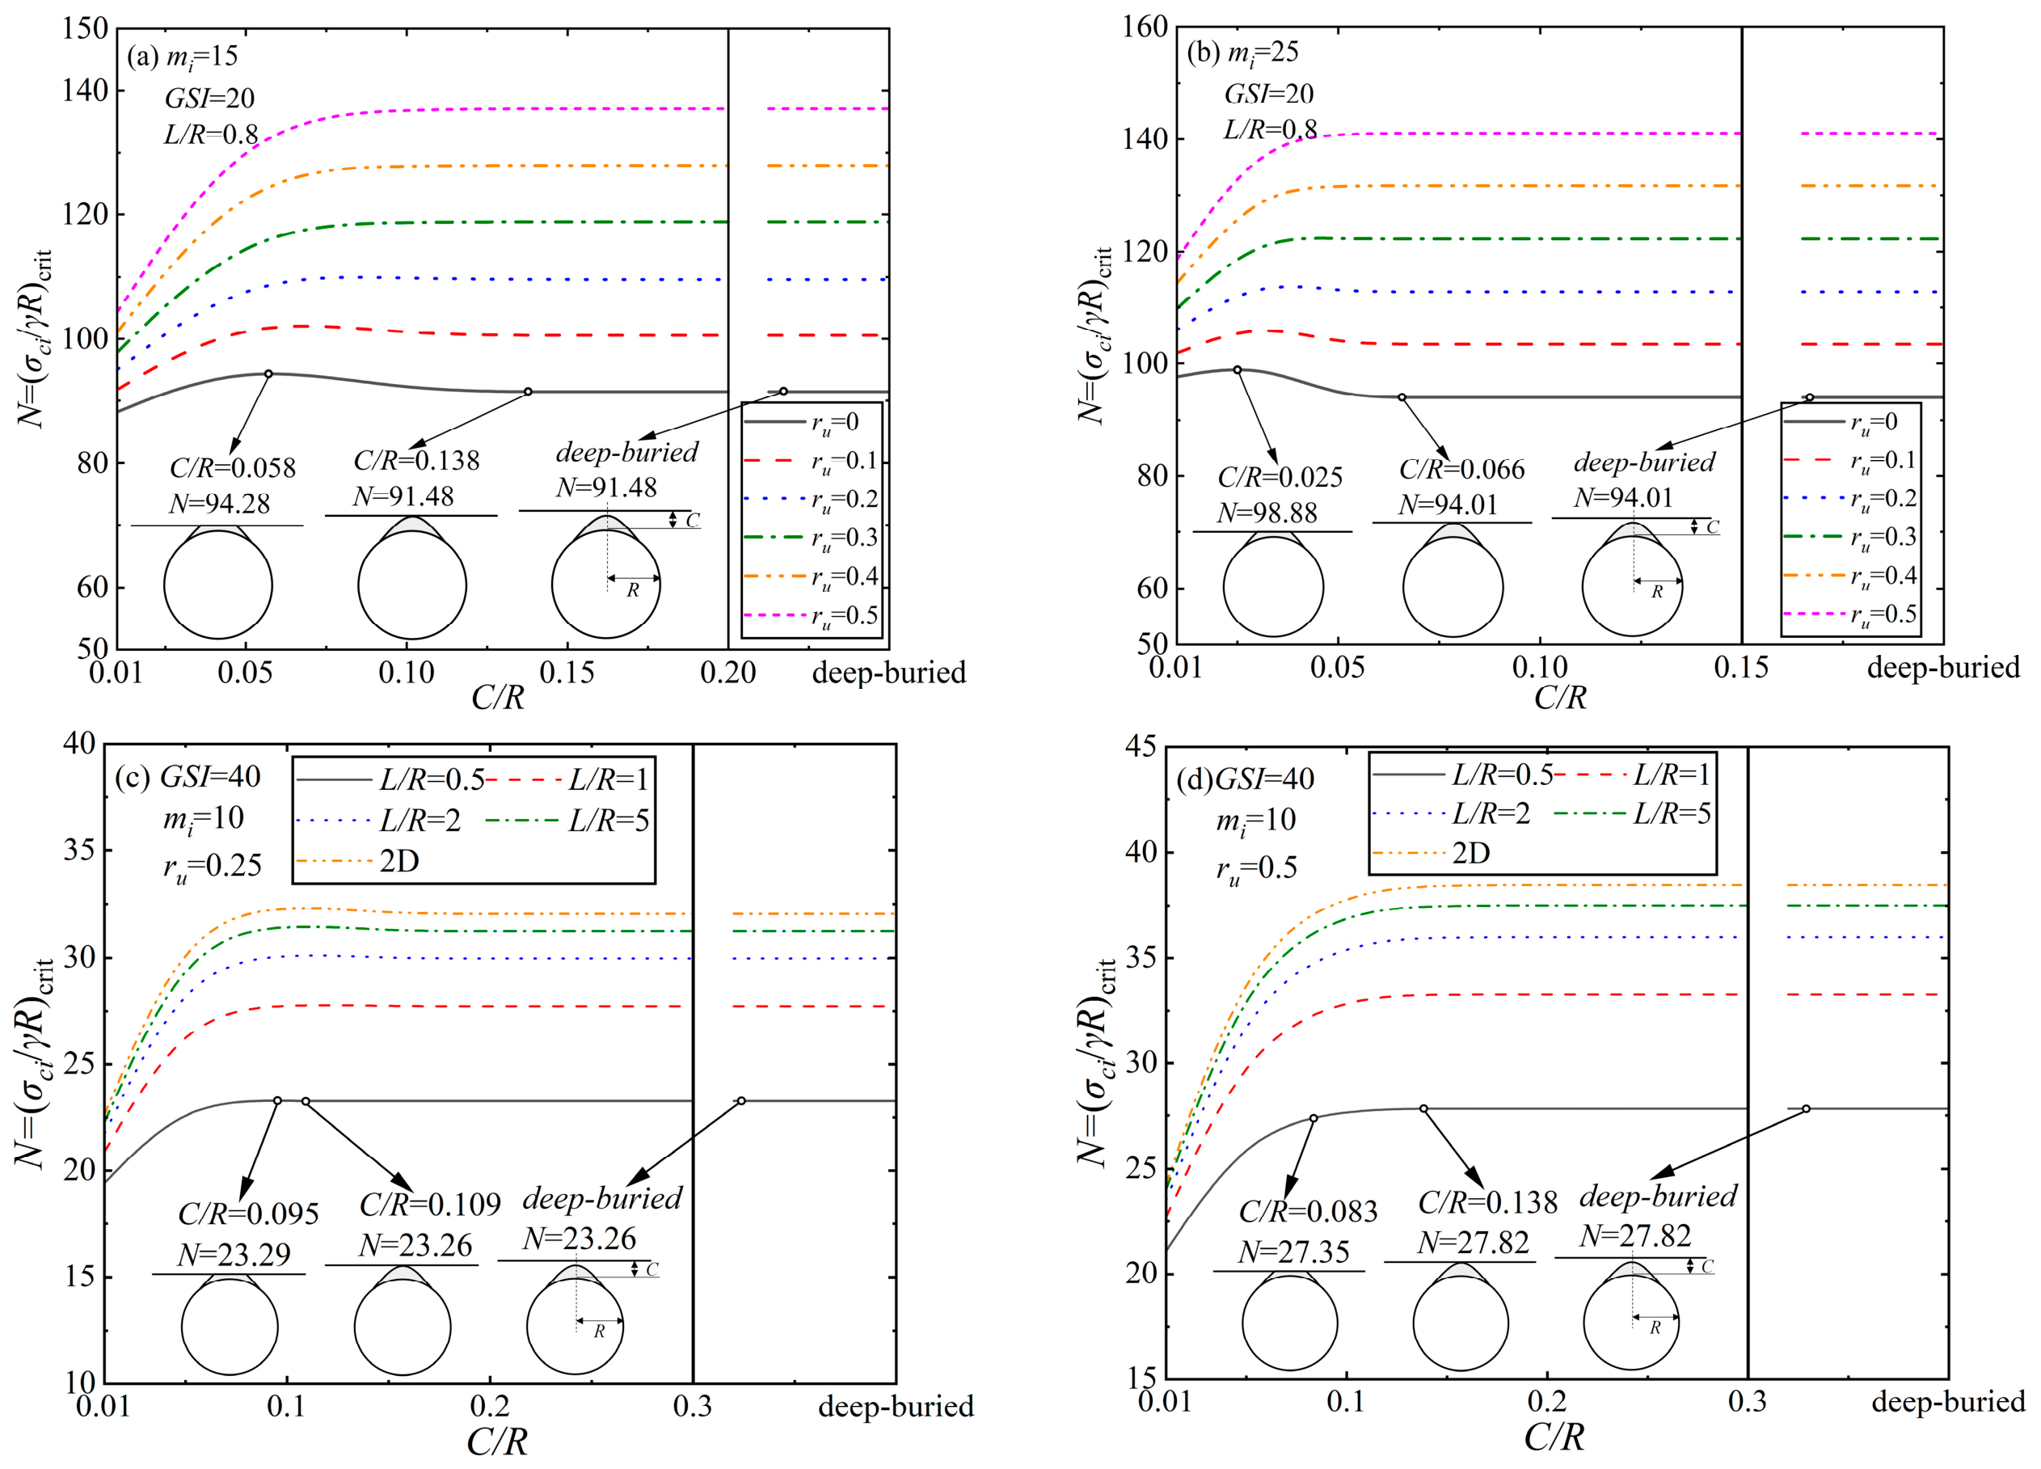
Figure 7a,b illustrate the variation in the critical stability number N with respect to C/R under varying ru and mi values (mi = 15 and 25), while keeping L/R = 0.8 and GSI = 20 constant. The overarching trend of N in relation to ru and C/R is highly consistent with that observed in Figure 6: under low ru conditions, N exhibits an initial rise followed by a decline to a plateau, whereas under higher ru, it monotonically increases to a plateau without any descending branch. However, a comparative analysis reveals a distinct mechanism regarding the intact rock parameter mi. Contrary to the effect of an increasing GSI, an increase in mi substantially decreases the critical C/R ratio at which the tunnel transitions from a shallow to a deep-buried collapse mode. Furthermore, while elevating GSI from 20 to 80 precipitates a dramatic, order-of-magnitude reduction in N, increasing mi from 5 to 25 only yields a marginal increase in the required stability number. This indicates that the macroscopic rock mass quality exerts a predominantly stronger influence on global tunnel stability than mi. Crucially, to provide a comprehensive evaluation of the 3D spatial effects, Figure 7c,d depict the influence of L/R. The results explicitly demonstrate that as L/R increases, the 3D stability number progressively escalates and asymptotically approaches the 2D plane-strain solution, underscoring that larger unsupported excavation advances severely deteriorate face stability and demand significantly higher rock mass strengths.
Figure 7. Stability number for 3D shallow-buried tunnel roofs under pore water pressure versus C/R and: (a) mi = 15 and (b) mi = 25 with GSI = 20, L/R = 0.8; (c) ru = 0.25 and (d) ru = 0.5 with GSI = 40, mi = 10.
Applsci 16 08769 g007
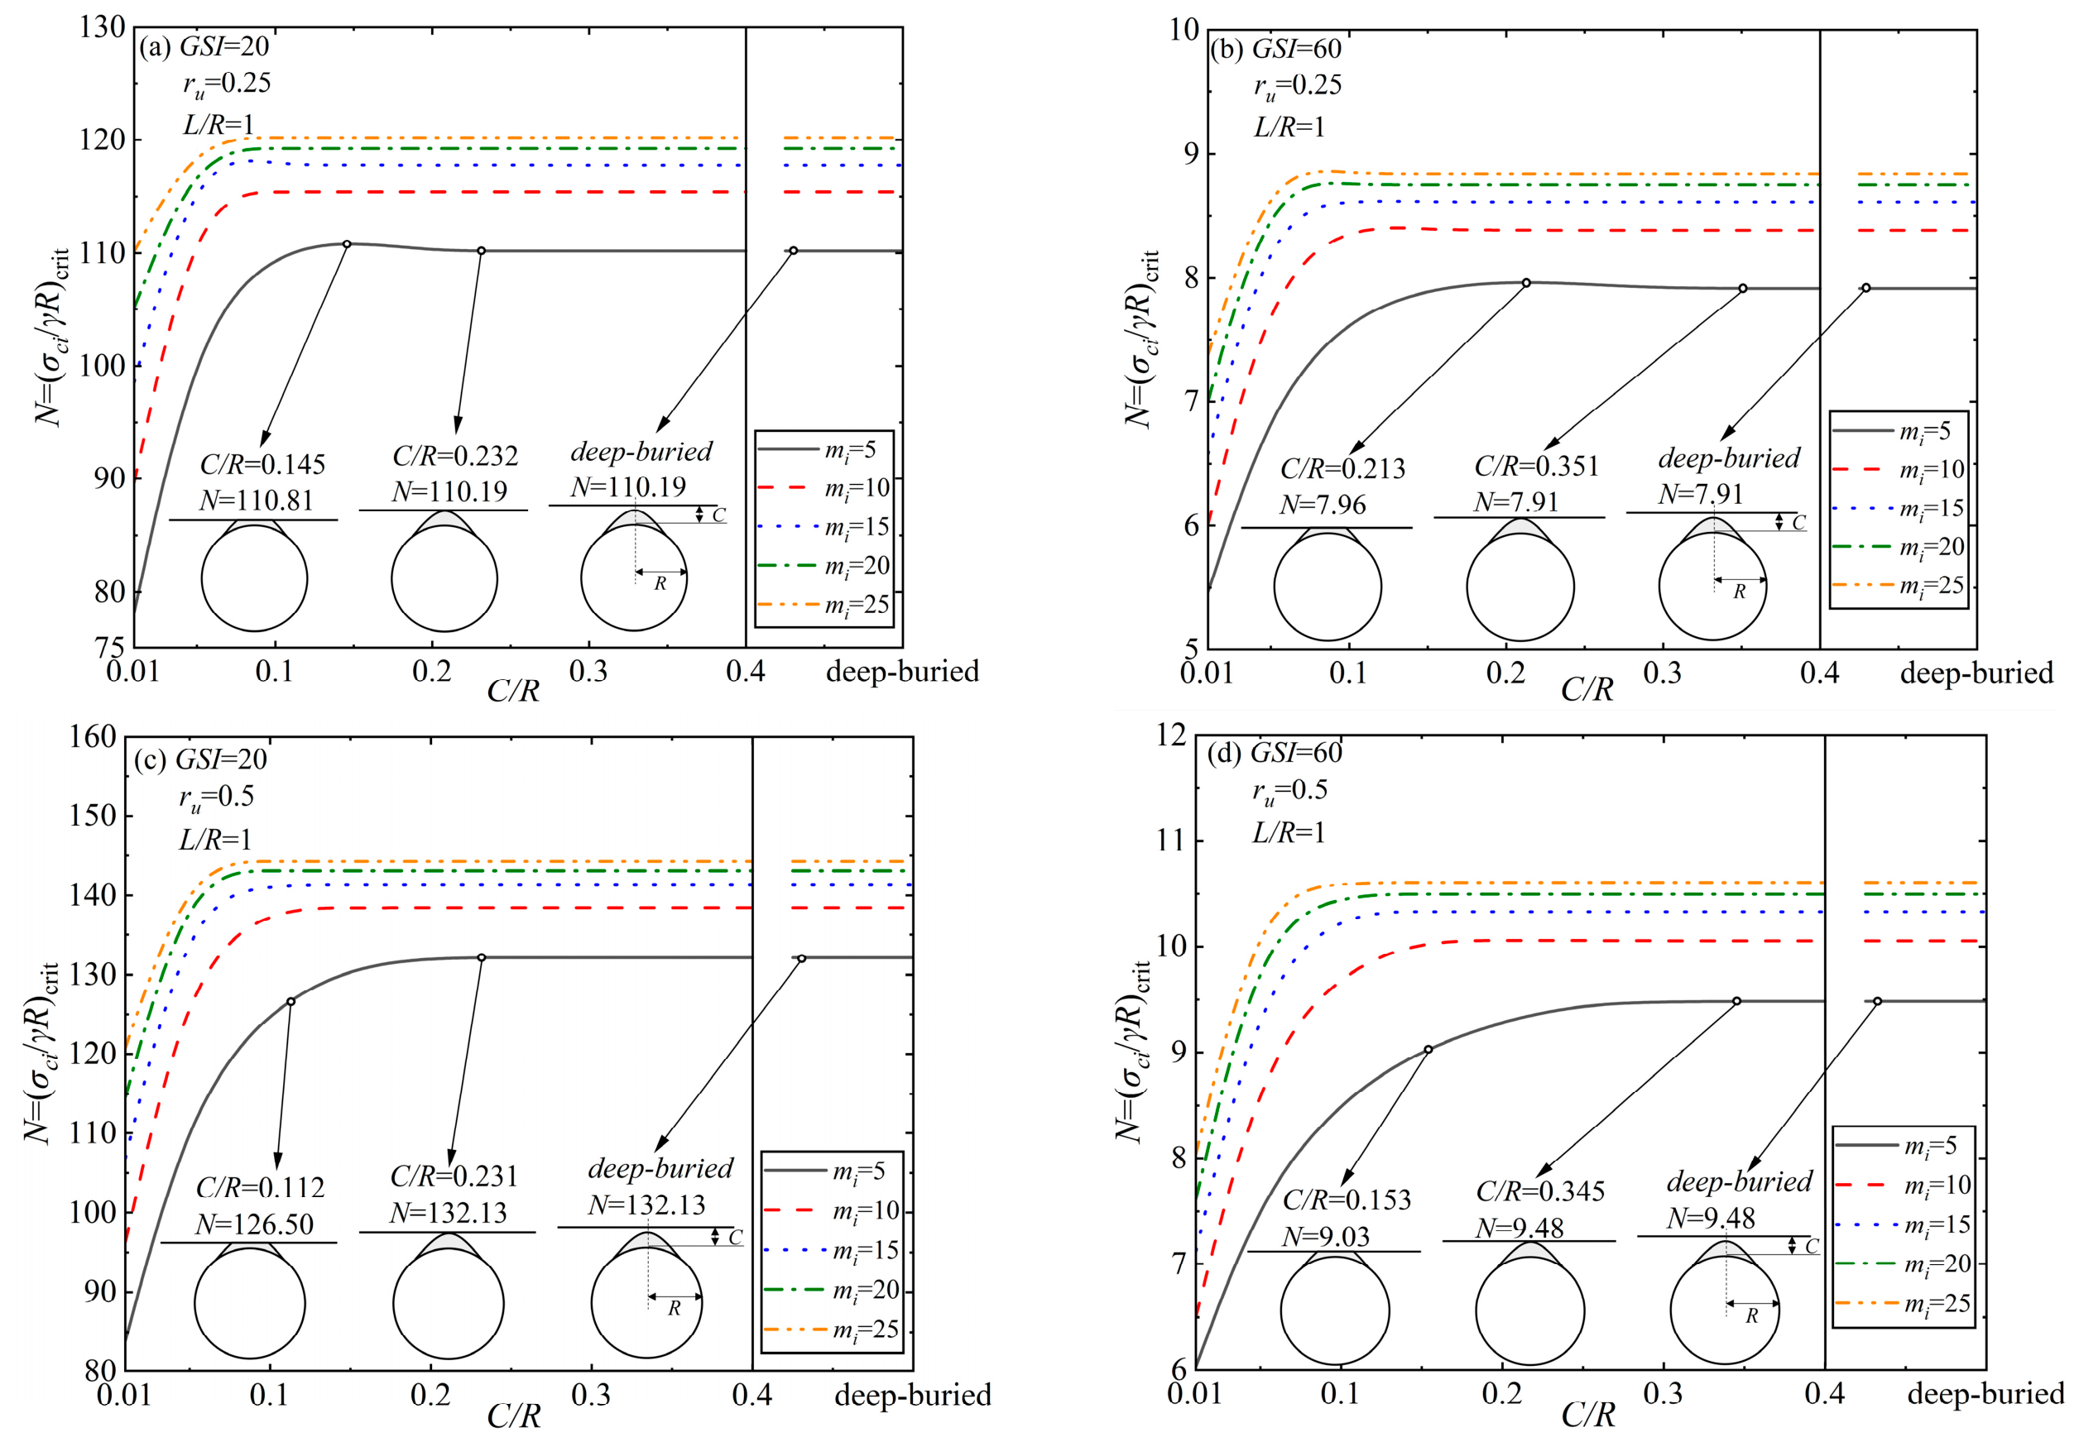
As illustrated in Figure 8, the critical stability number N for a 3D tunnel roof (with a fixed unsupported span ratio L/R = 1) is depicted as a function of the normalized cover depth C/R under the coupled influence of ru, mi, and GSI. A comparative analysis of the subplots reveals several prominent geomechanical behaviors. First, consistent with previous observations, elevating the rock mass quality (increasing GSI from 20 to 60, as seen when comparing Figure 8a with Figure 8b, or Figure 8c with Figure 8d) precipitates a drastic, order-of-magnitude reduction in N, reaffirming GSI as the dominant factor governing overall tunnel stability. Second, introducing higher intact rock parameter values mi monotonically increases the required N across all examined conditions; however, this effect exhibits a distinct non-linear sensitivity. Specifically, as mi incrementally increases, the vertical spacing between adjacent N curves progressively narrows, indicating that the marginal deteriorating effect of mi on face stability gradually diminishes. Third, the aggravation of pore water pressure (increasing ru from 0.25 to 0.5, comparing Figure 8a to Figure 8c) substantially elevates the absolute magnitude of N necessary to prevent collapse. While the critical C/R ratio triggering the transition to the deep-cover failure mechanism experiences a slight, almost negligible reduction under these elevated ru conditions, this minor geometric shift is overwhelmingly superseded by the severe amplification of the required rock mass strength, further emphasizing the critical threat posed by groundwater in tunneling operations.
Figure 8. Stability number for 3D shallow-buried tunnel roofs under pore water pressure versus C/R under L/R = 1.0 and: (a) GSI = 20, ru = 0.25; (b) GSI = 60, ru = 0.25; (c) GSI = 20, ru = 0.5; (d) GSI = 60, ru = 0.5.
Applsci 16 08769 g008

4.2. Required Supporting Pressure
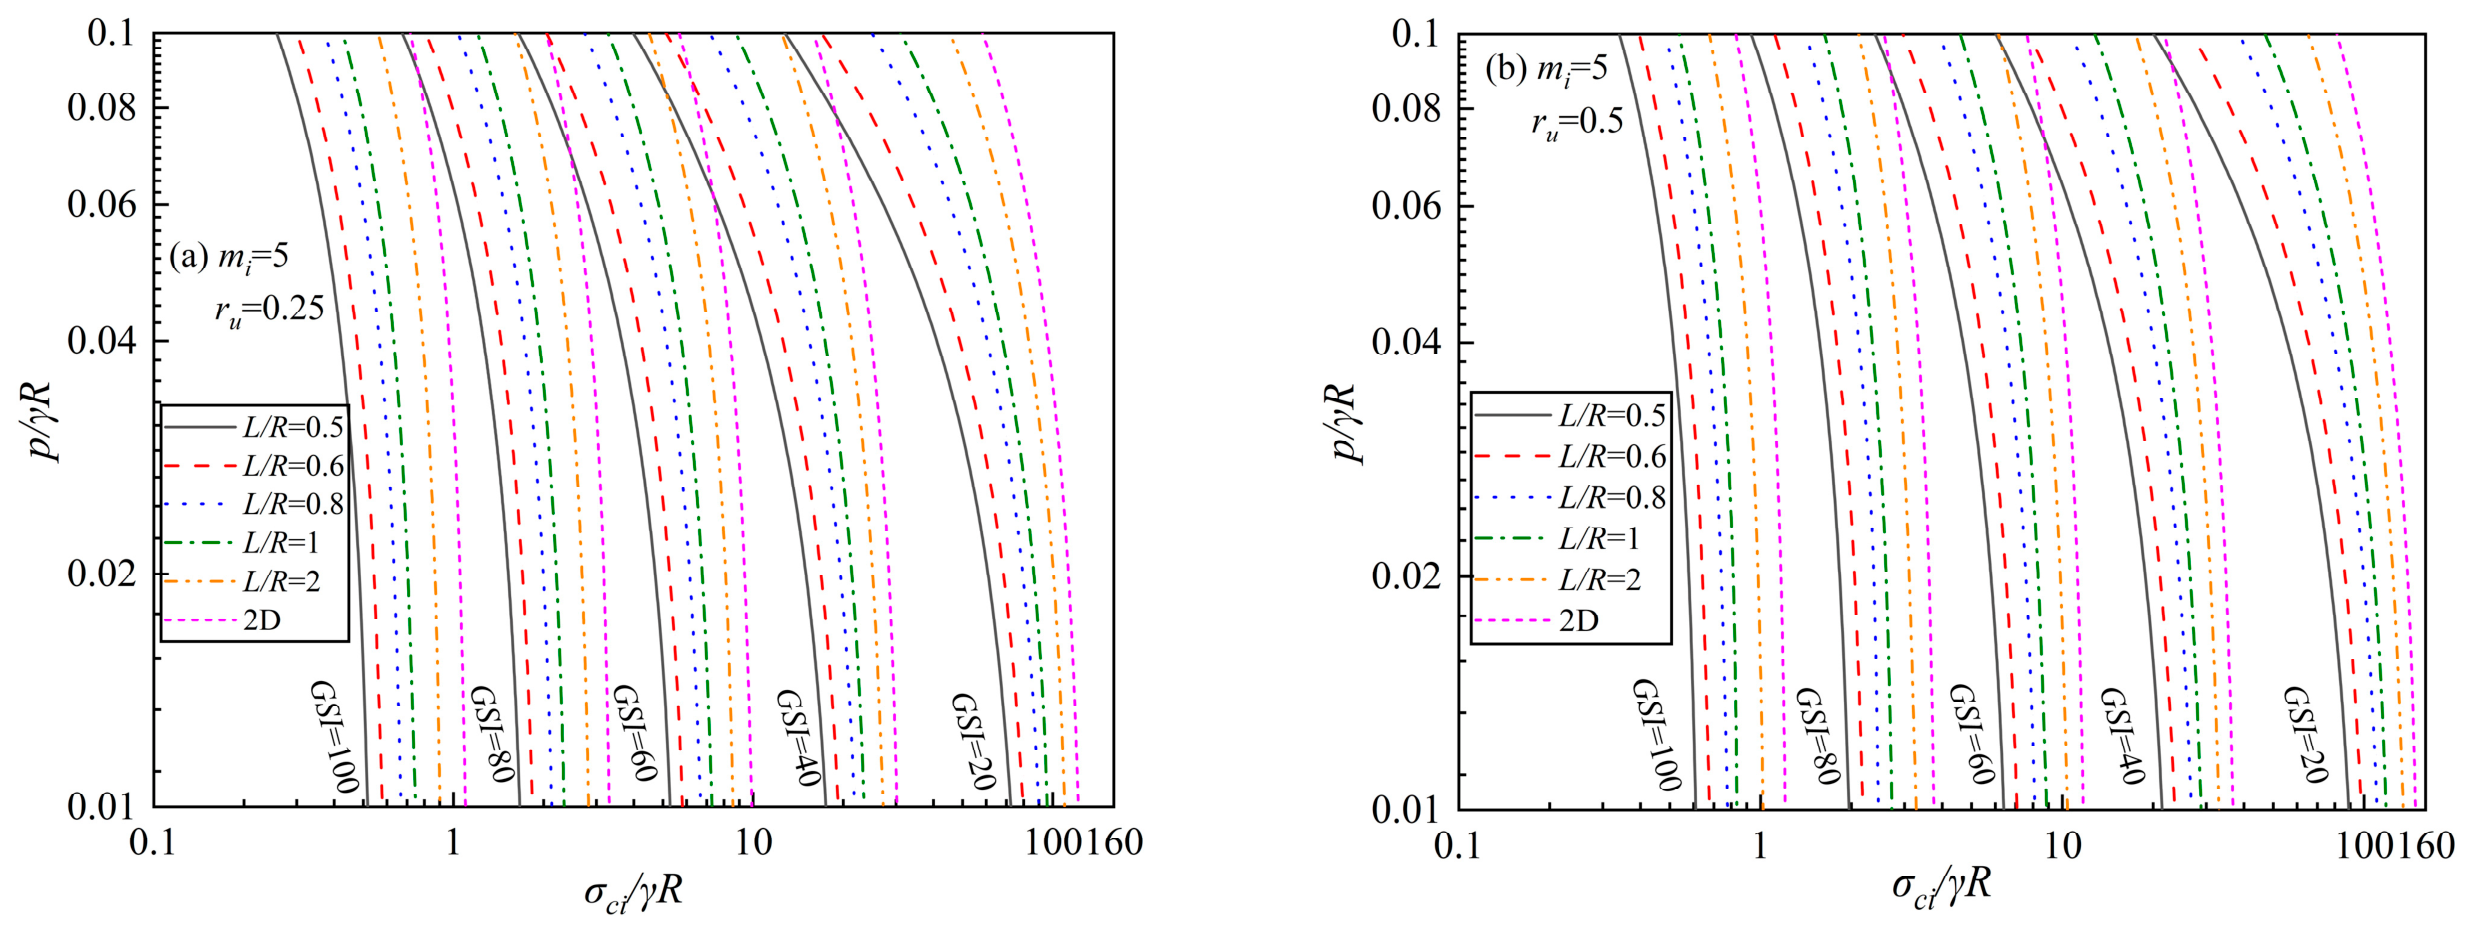
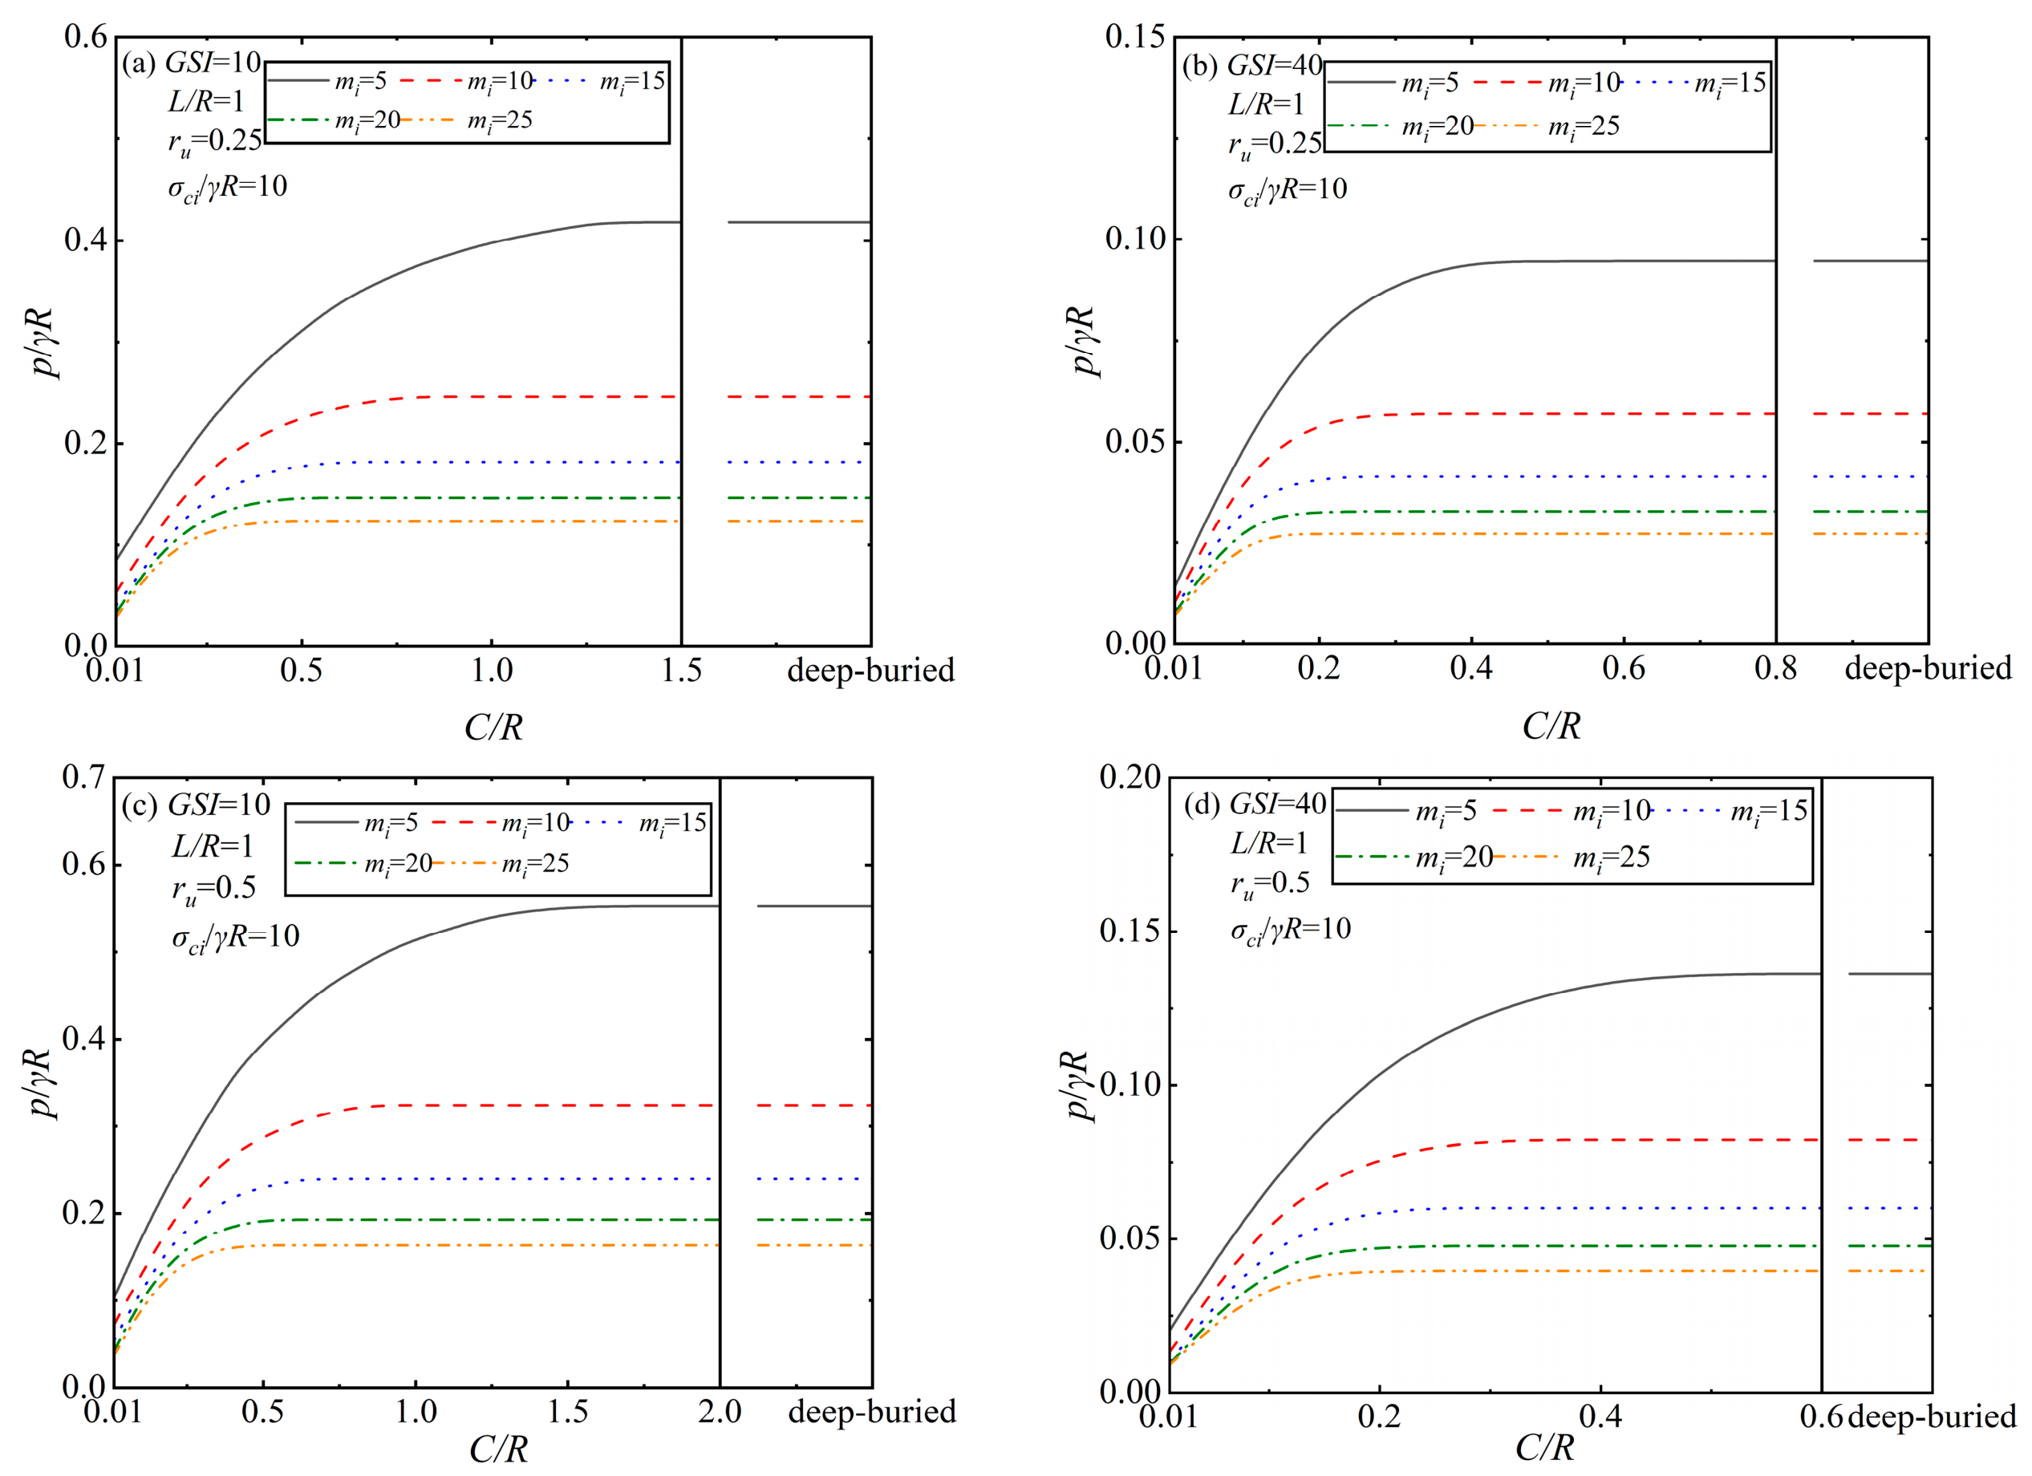
Figure 9 illustrates the variation in the normalized required support pressure, p/γR, for a 3D tunnel roof with respect to C/R across various combinations of GSI, mi, and ru, given fixed conditions of L/R = 1 and σci/γR = 10. As a universal trend across all subplots, p/γR increases monotonically with deepening burial depth until it reaches a critical C/R threshold. Beyond this juncture, marking the transition from a shallow to a deep-cover collapse mechanism, the necessary support pressure plateaus and becomes independent of further overburden accumulation. Examining the rock mass parameters reveals that enhancing the rock quality—either via a higher GSI (e.g., comparing Figure 9a to Figure 9b) or an increased intact rock parameter mi—substantially mitigates the required support pressure. However, the influence of mi displays a diminishing marginal effect; as mi increases, the spacing between adjacent curves narrows, reflecting a converging stabilization in the mechanical response. Furthermore, an increase in GSI effectively contracts the shallow-cover influence zone, progressively decreasing the critical C/R ratio defining the deep-cover onset. Conversely, the exacerbation of pore water pressure (increasing ru from 0.25 to 0.5, as seen between Figure 9a and Figure 9c not only universally demands a higher p/γR to maintain face stability but also actively expands the shallow-cover failure domain in poor rock masses (e.g., delaying the critical C/R transition from 1.5 to 2.0 when GSI = 10), underscoring the severe threat groundwater poses in expanding the failure zone towards the surface.
Figure 9. The required supporting pressure p/γR for 3D shallow-buried tunnel roofs under pore water pressure versus C/R under L/R = 1.0, σci/γR = 10.0 and: (a) GSI = 10, ru = 0.25; (b) GSI = 40, ru = 0.25; (c) GSI = 10, ru = 0.5; (d) GSI = 40, ru = 0.5.
Applsci 16 08769 g009
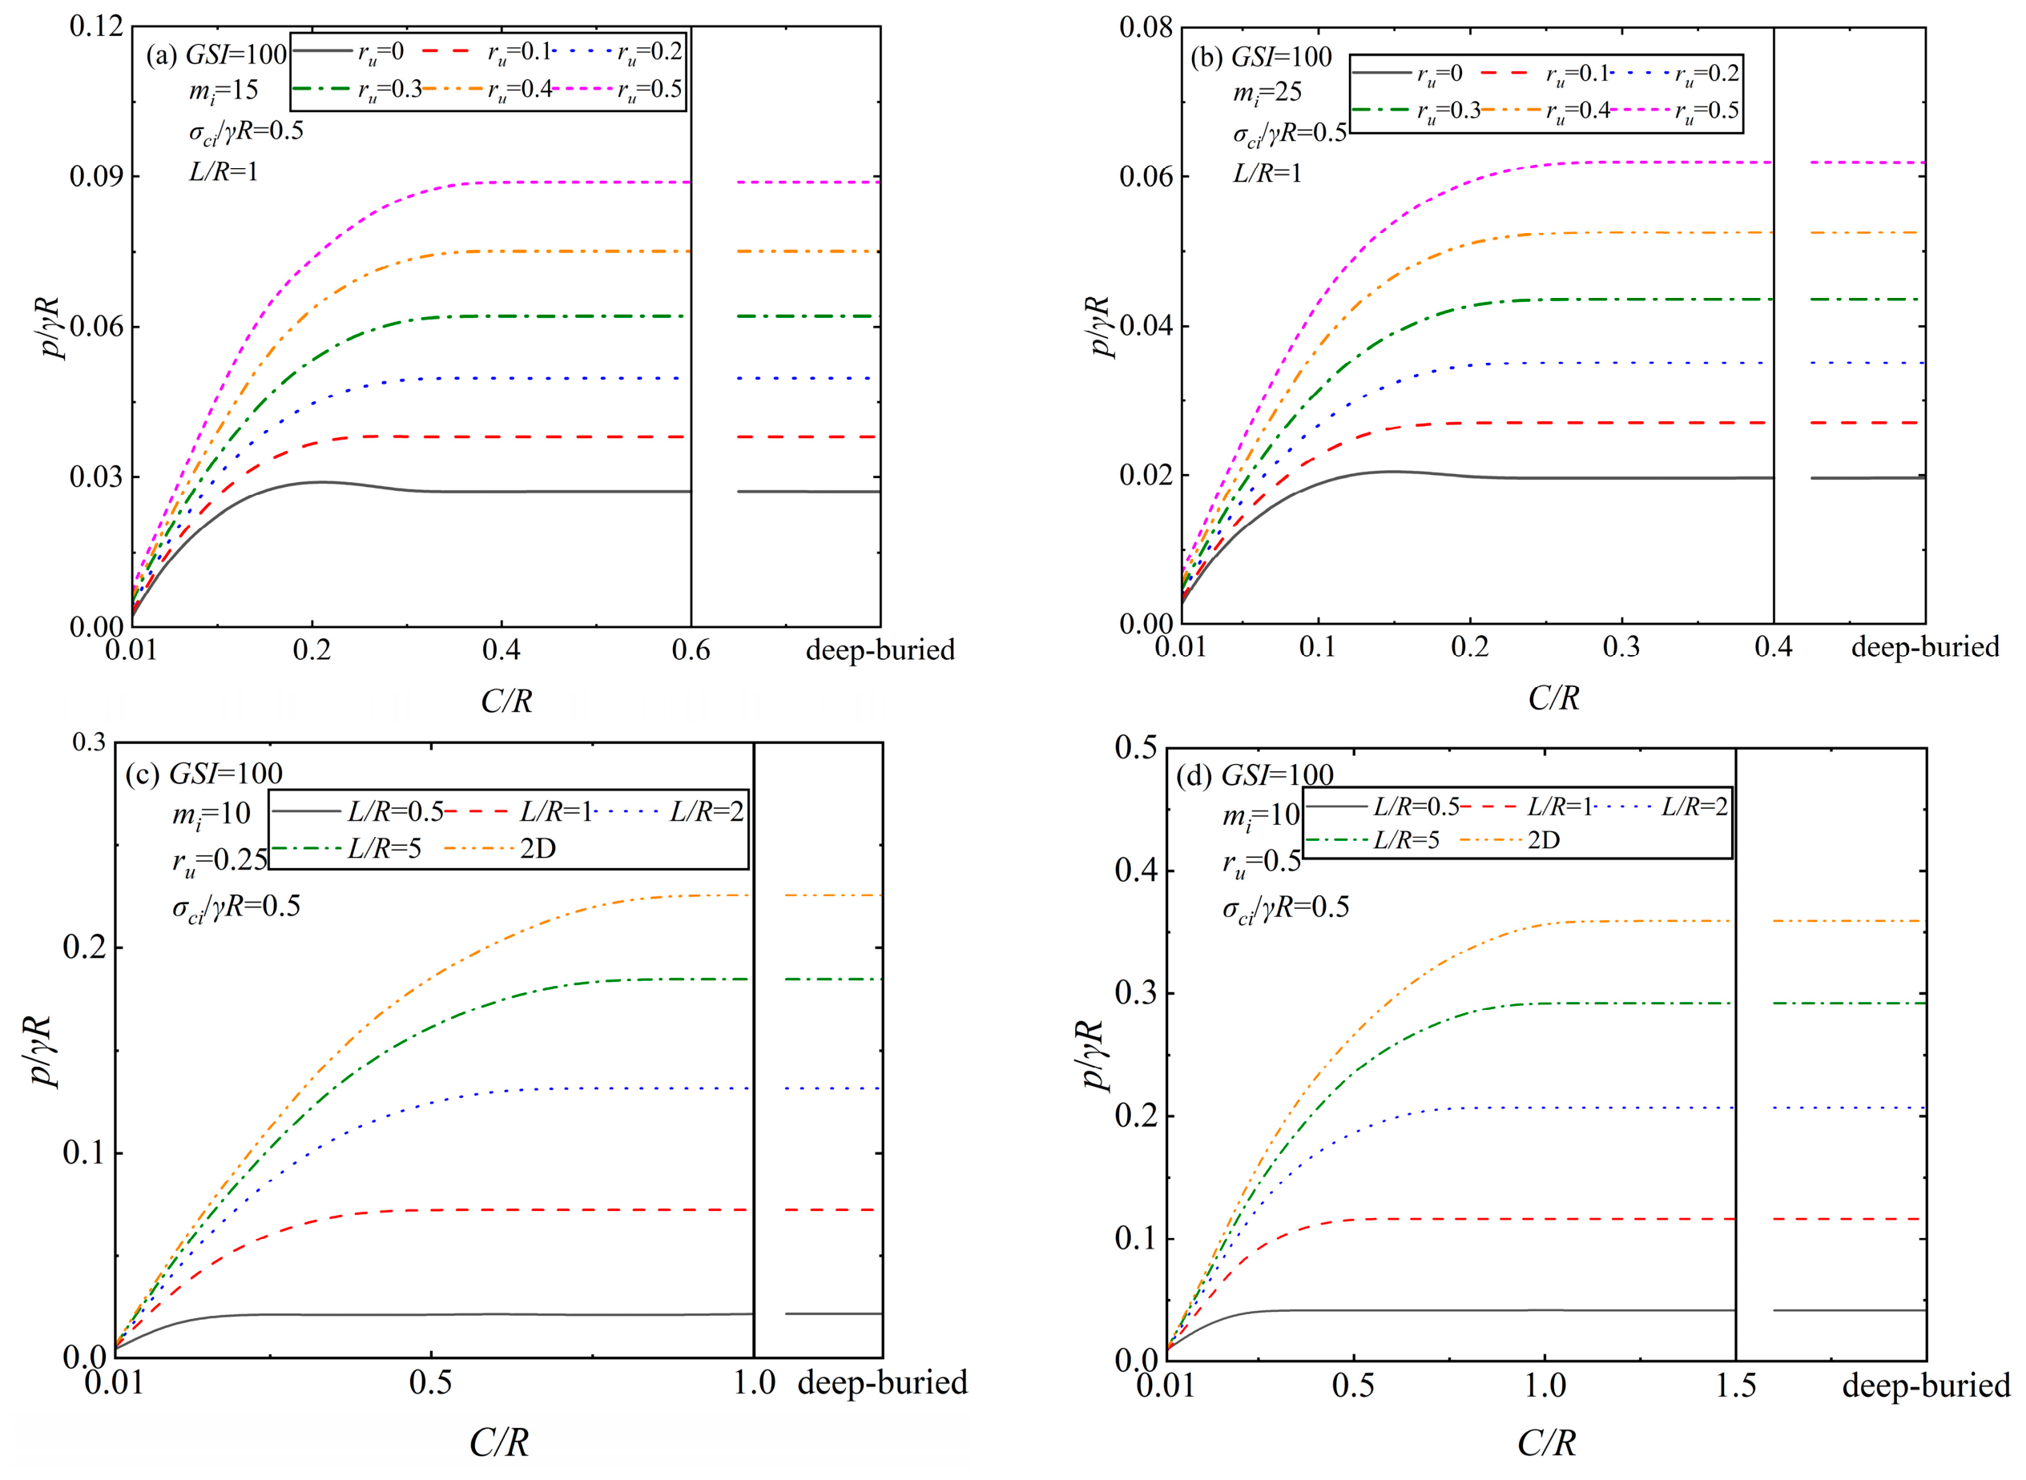
Figure 10a,b illustrate how p/γR of the 3D tunnel roof varies with C/R. The analysis is conducted under different pore water pressure conditions and for a range of mi values. The results show that with no pore water pressure (ru = 0), the characteristic trend of the required support pressure with C/R is: it initially increases, subsequently decreases, and finally stabilizes. However, under pore water pressure, the descending segment is absent. Concurrently, the required support pressure increases with increasing ru. From the observations presented in Figure 9 and Figure 10a,b, it can be seen that the critical overburden depth corresponding to the transition of a tunnel into the deep cover condition becomes smaller as the parameter mi increases. Figure 10c,d show how p/γR of the 3D tunnel roof varies with C/R under different pore water pressure conditions and varying L/R ratios. Evidently, consistent with the previous conclusions, the required support pressure increases as ru increases. The required support pressure exhibits an upward trend as the ratio of L/R increases. At the same time, the overburden depth necessary for the tunnel to reach the deep-cover condition also becomes larger.
Figure 10. The required supporting pressure p/γR for 3D shallow-buried tunnel roofs under pore water pressure versus C/R under GSI = 100 and: (a) mi = 15 and (b) mi = 25 with σci/γR = 0.5 and L/R = 1.0; (c) ru = 0.25 and (d) ru = 0.5 with σci/γR = 0.5 and mi = 10.
Applsci 16 08769 g010
Figure 11. The required supporting pressure p/γR for 3D shallow-buried tunnel roofs under pore water pressure with C/R = 0.3 and: (a) mi = 5, ru = 0.25; (b) mi = 5, ru = 0.5; (c) mi = 15, ru = 0.25; (d) mi = 15, ru = 0.5; (e) mi = 25, ru = 0.25; (f) mi = 25, ru = 0.5.
Applsci 16 08769 g011aApplsci 16 08769 g011b
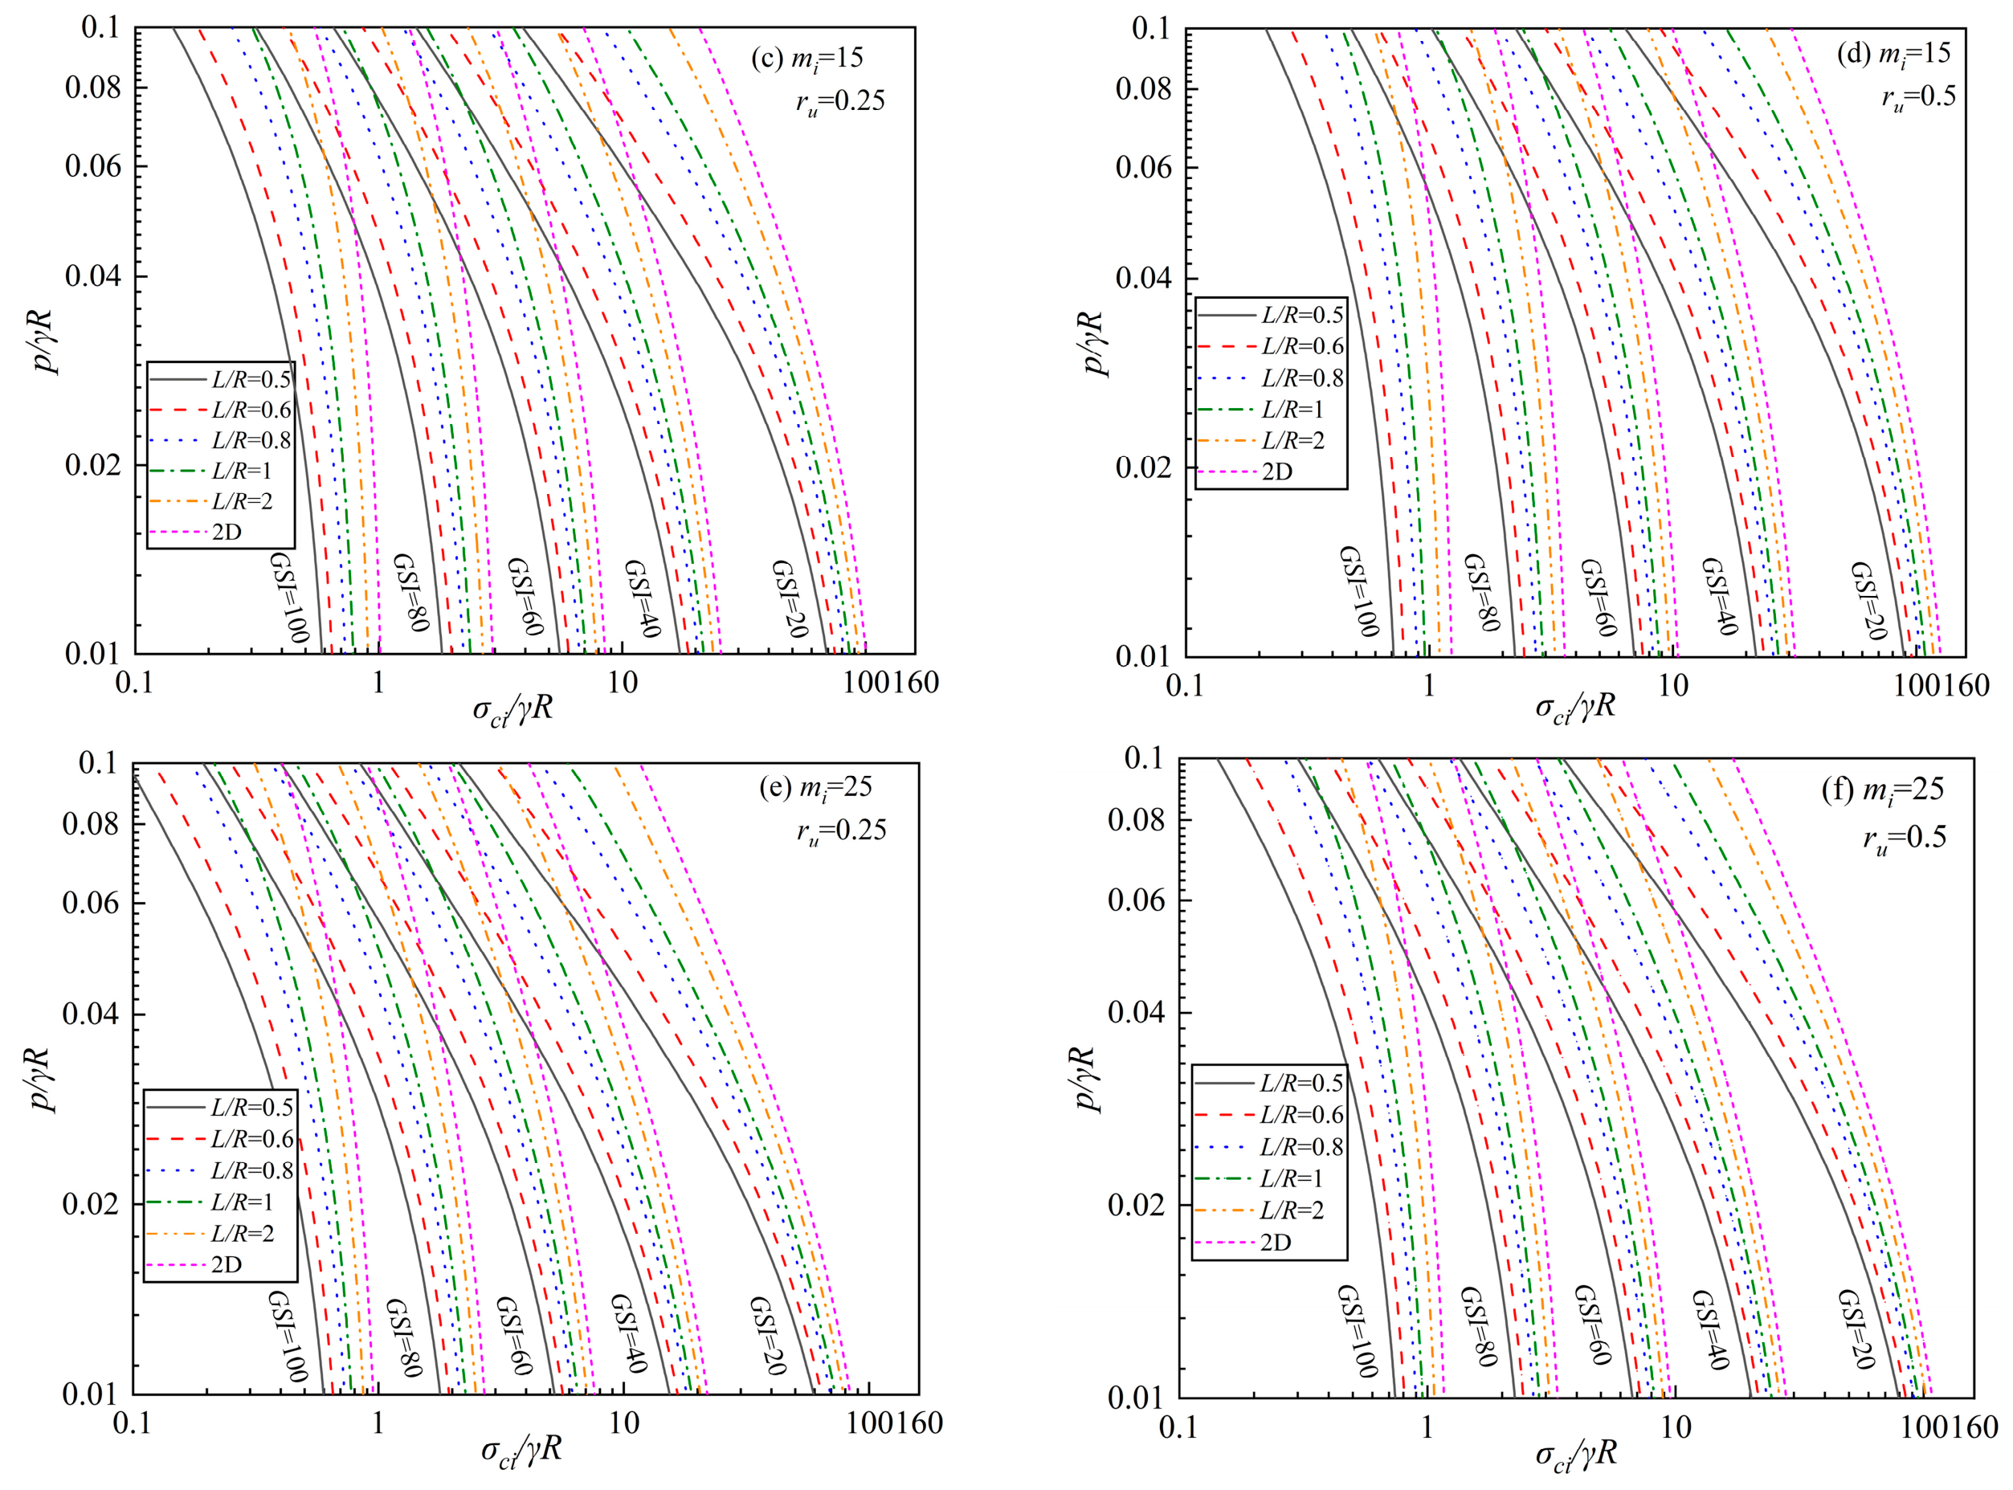
To enable a more transparent assessment of how the HB parameters affect the support pressure required at the tunnel roof, Figure 11 proposes a simplified method for researchers and engineers to directly estimate p/γR. Both axes are set to logarithmic scales, with σci/γR as the abscissa. Stability number diagrams are used to plot curves for different GSI values on a single chart, examining variations under different mi and ru conditions. Taking Figure 11a,b as examples, the required tunnel roof support pressure under pore water pressure continuously decreases as σci/γR increases. p/γR also increases with increasing L/R. For the same p/γR value, a higher GSI requires a smaller σci/γR under otherwise identical conditions. When ru increases, a larger σci/γR is required for the tunnel roof to achieve the same p/γR. Comparing Figure 11a and Figure 11c, it is seen that as mi increases, the rate at which p/γR decreases with increasing σci/γR becomes slower, manifesting graphically as a gentler slope (less steep curve).

4.3. Factor of Safety

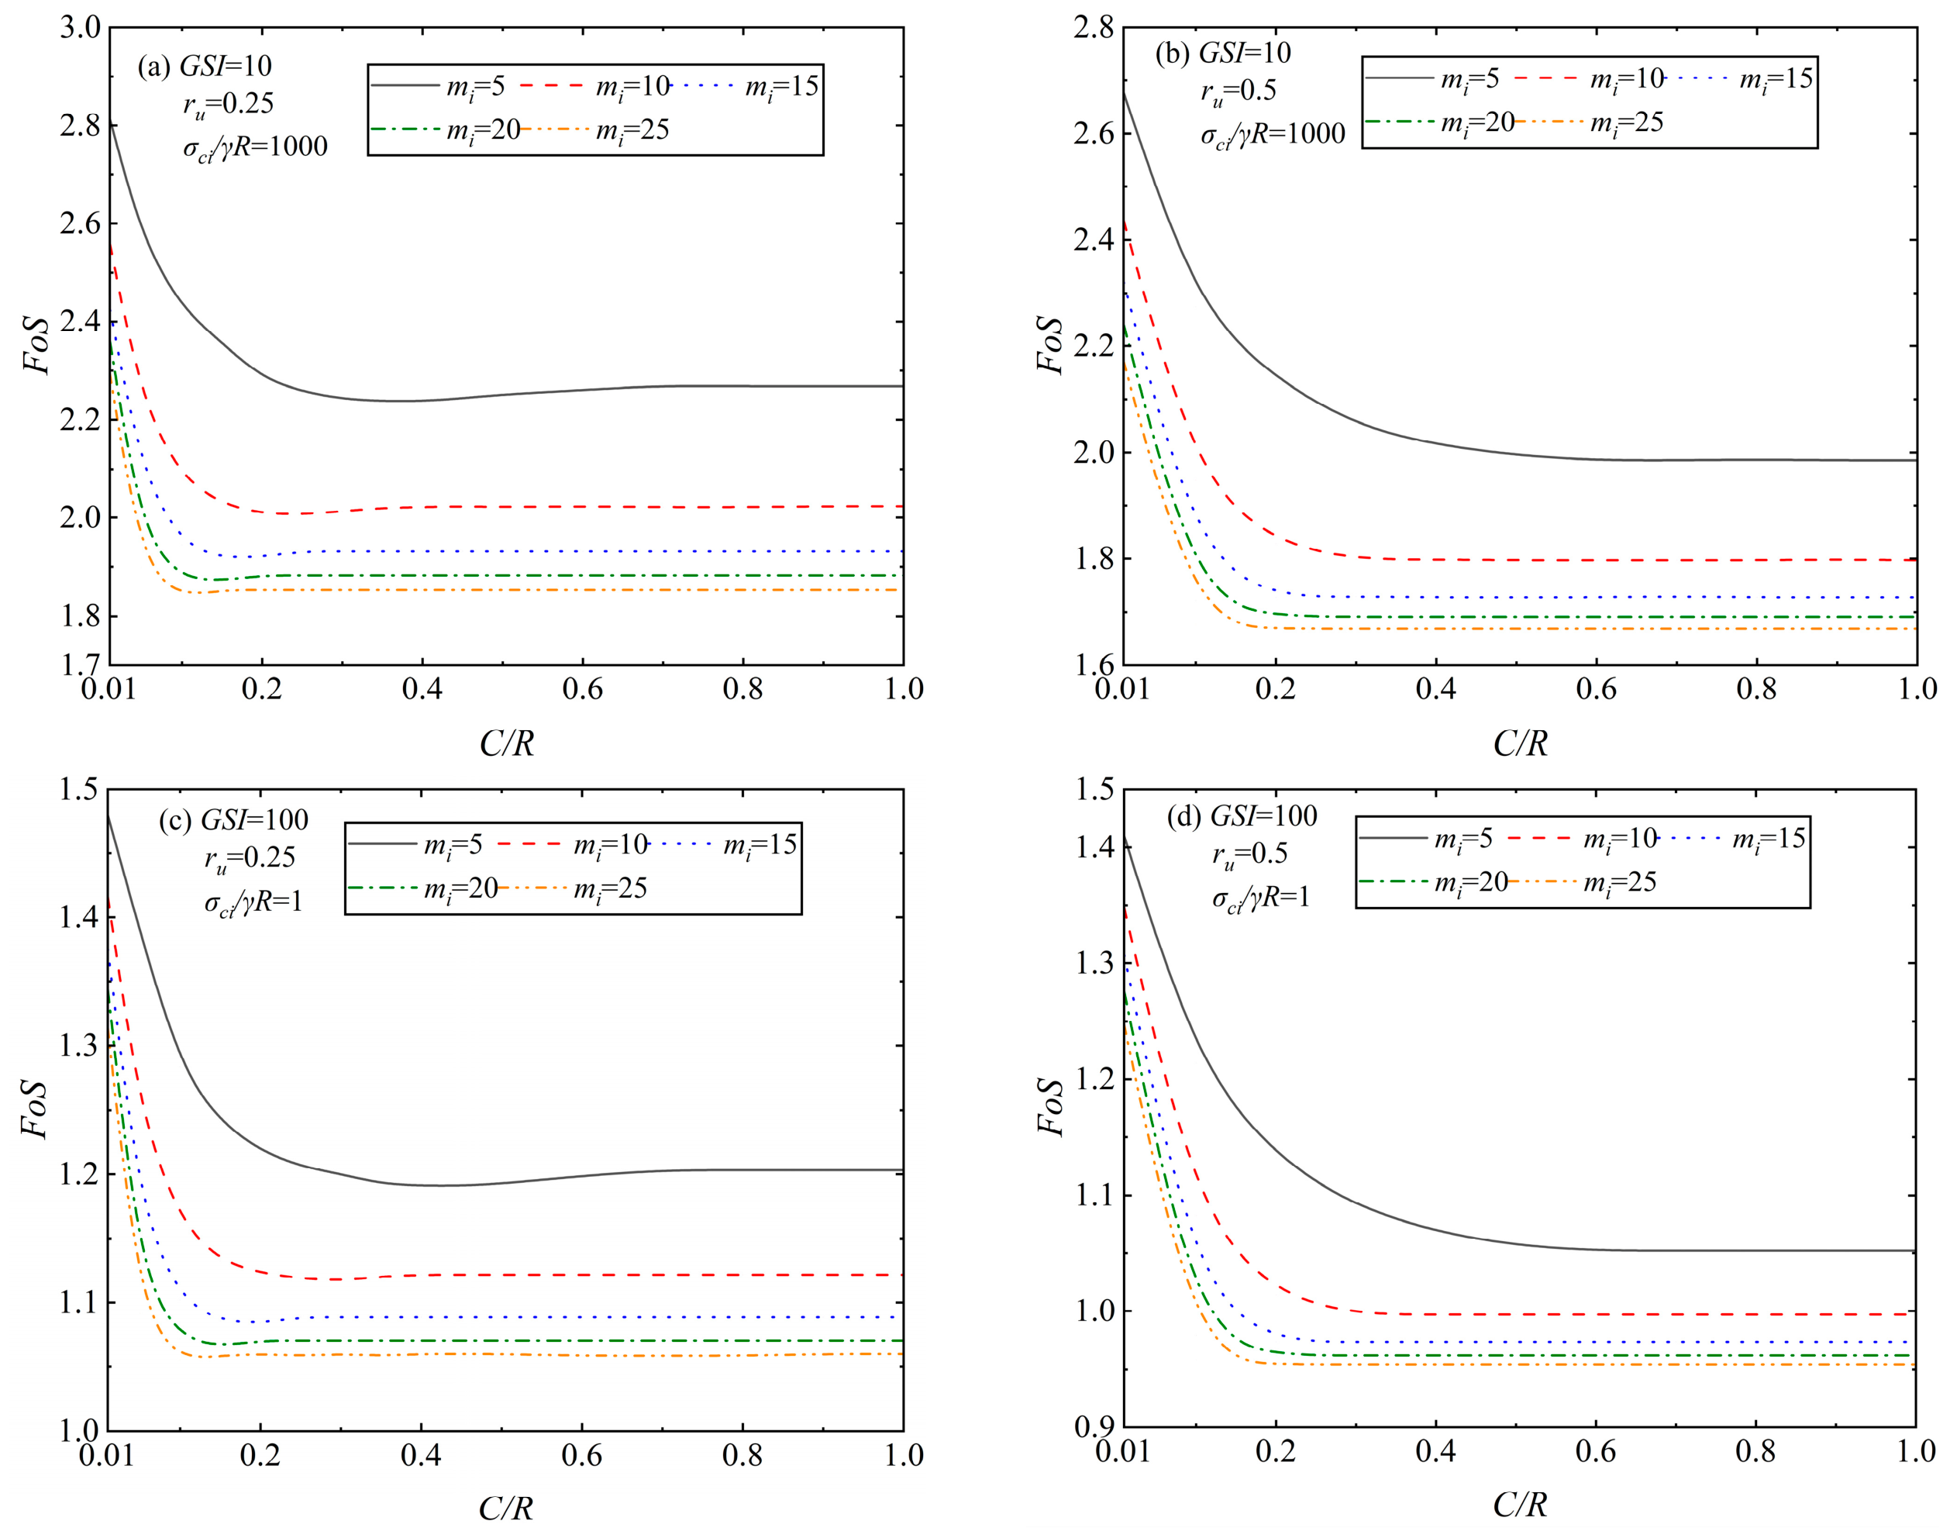
Figure 12 illustrates how FoS of the 3D tunnel roof varies with the overburden depth ratio under different conditions of GSI, pore water pressure coefficient, σci/γR, and parameter mi. As illustrated in Figure 12, FoS varies with the ratio of cover depth to tunnel radius (C/R) in a pattern that is opposite to the trend observed for N with respect to C/R, as shown in Figure 8: When ru is relatively small, FoS initially decreases, then increases, and subsequently tends to stabilize, remaining constant. When ru is large, FoS decreases initially and then stabilizes, remaining constant, exhibiting no ascending segment. FoS decreases with increasing mi, and the spacing between curves for different mi values decreases as mi increases. From Figure 12a,b, it is evident that FoS decreases with increasing ru.
Figure 12. The FoS solutions for a 3D shallow-buried tunnel under pore water pressure versus C/R with L/R = 1 and: (a) ru = 0.25, σci/γR = 1000; (b) ru = 0.5, σci/γR = 1000; (c) ru = 0.25, σci/γR = 1; (d) ru = 0.5, σci/γR = 1.
Applsci 16 08769 g012
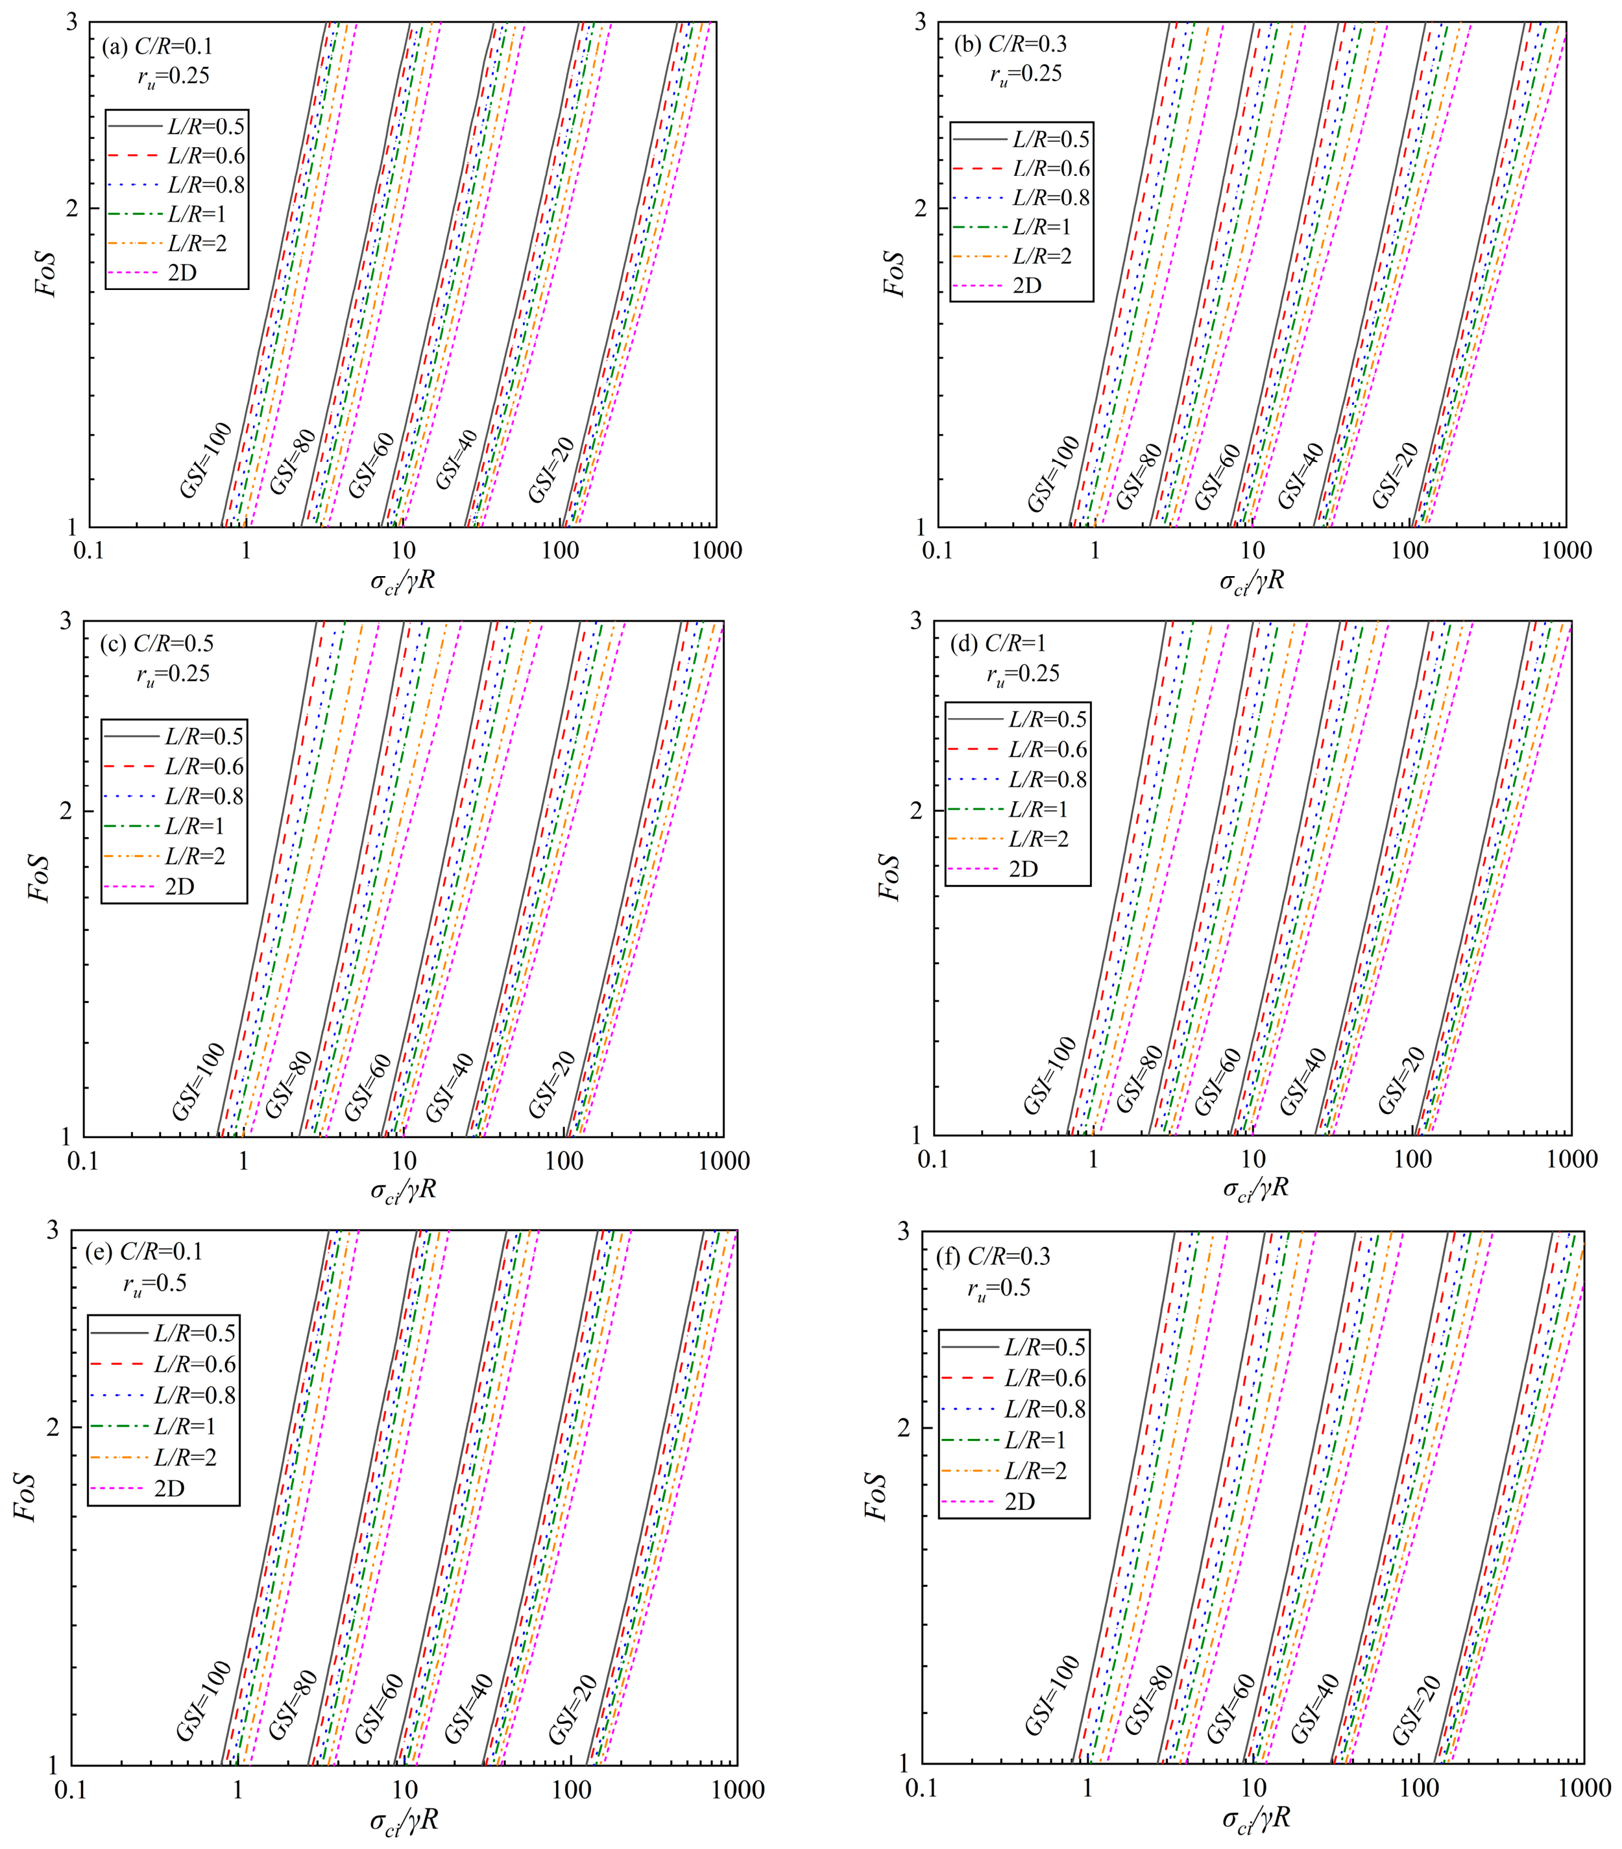
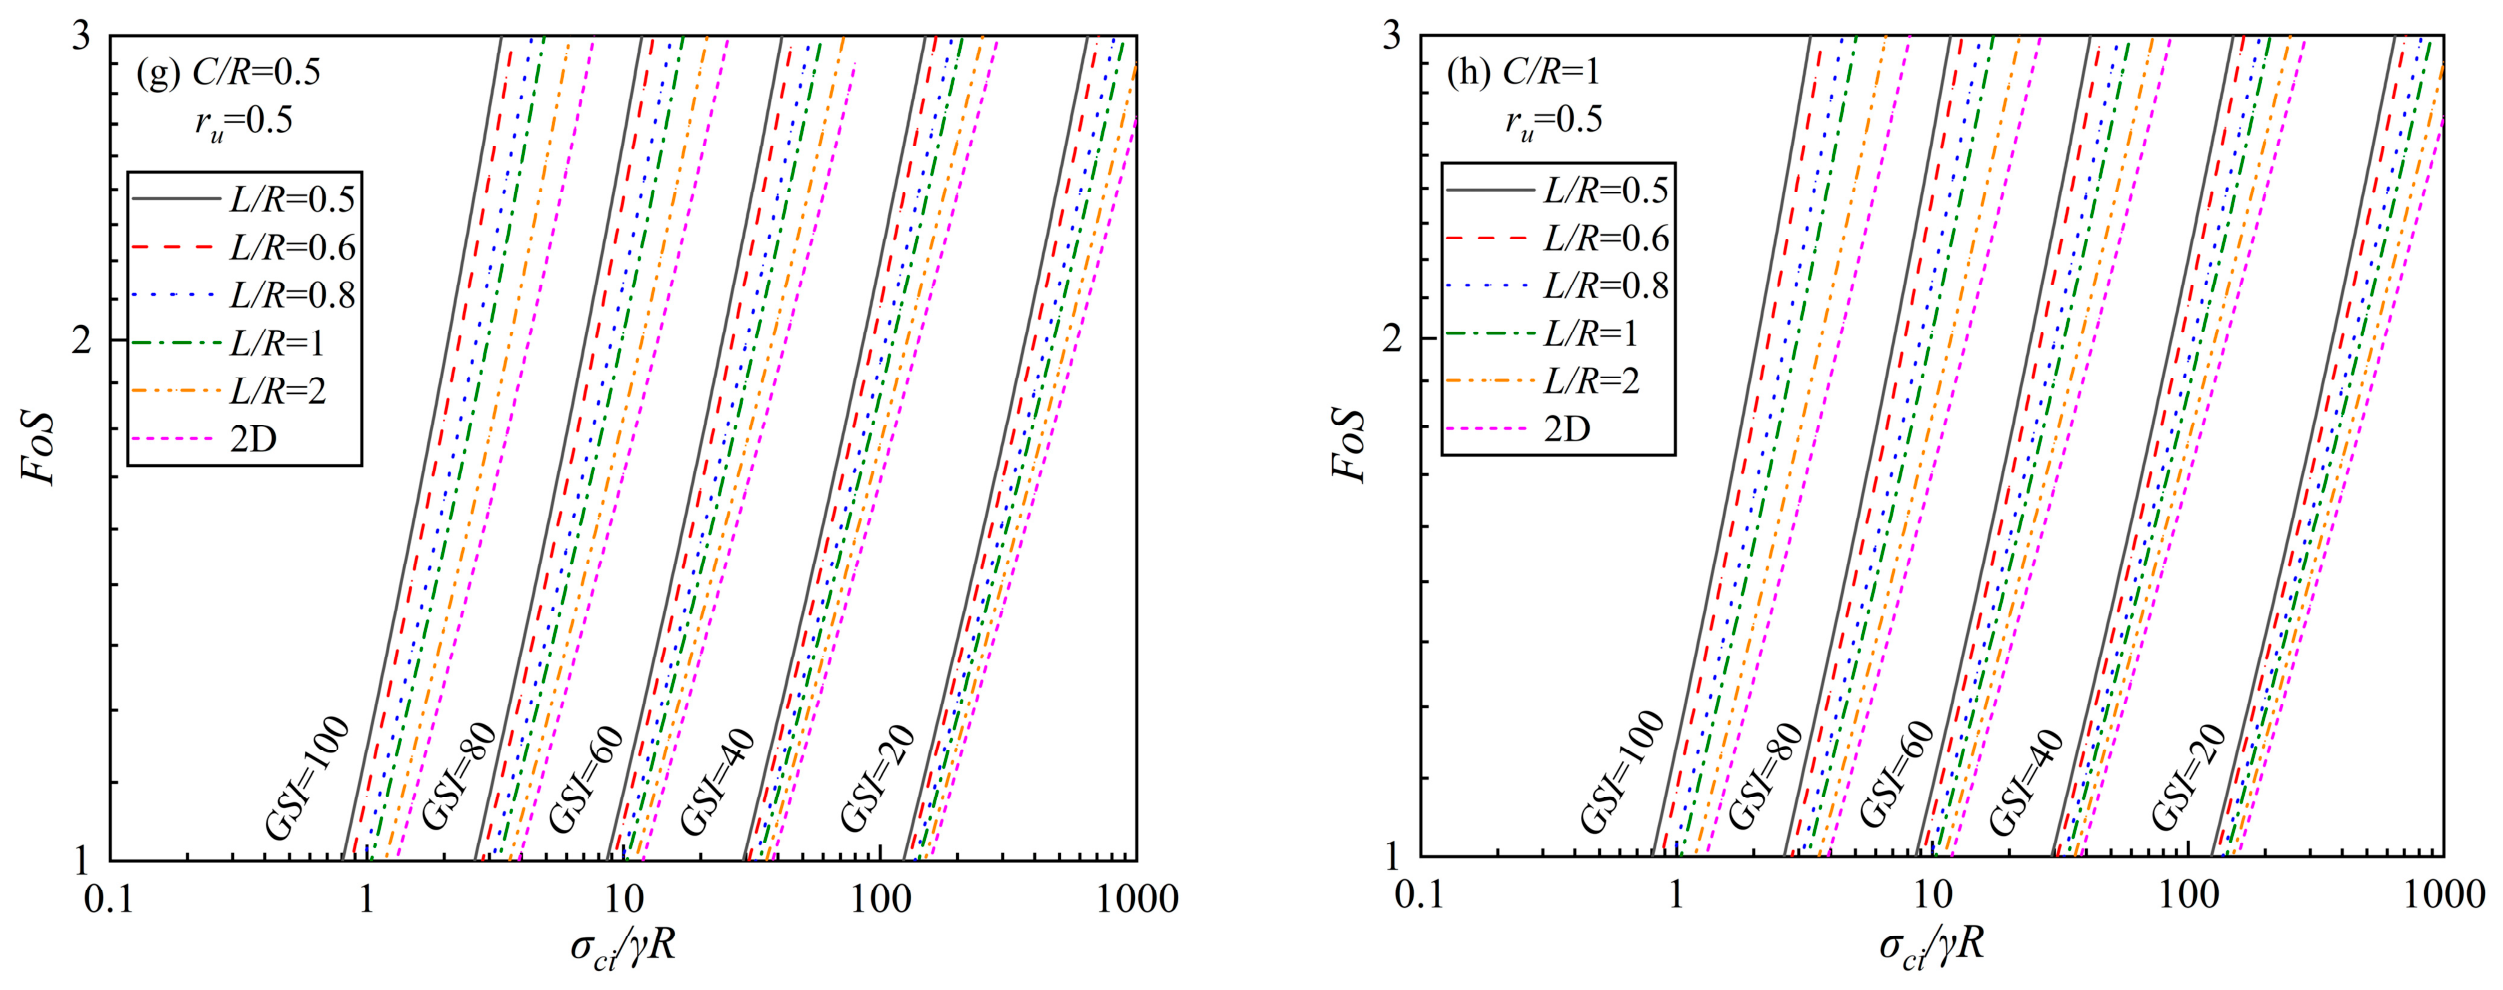
Analogous to Figure 11, Figure 13 is provided to enable a more systematic examination of how the parameters of the HB criterion influence FoS. Specifically, it illustrates how FoS varies with GSI and L/R under different conditions of C/R and pore pressure ratio ru. As shown in Figure 13, FoS continuously increases with increasing GSI, but decreases with increasing L/R.
Figure 13. The FoS solutions for a 3D shallow-buried tunnel under pore water pressure with mi = 15 and: (a) C/R = 0.1, ru = 0.25; (b) C/R = 0.3, ru = 0.25; (c) C/R = 0.5, ru = 0.25; (d) C/R = 1, ru = 0.25; (e) C/R = 0.1, ru = 0.5; (f) C/R = 0.3, ru = 0.5; (g) C/R = 0.5, ru = 0.5; (h) C/R = 1, ru = 0.5.
Applsci 16 08769 g013aApplsci 16 08769 g013b

4.4. Application Example

To examine the computational reliability of the developed program, benchmark comparisons were conducted between the present results and the previously published solutions of Park and Michalowski [11]. Only the parameter combinations common to both studies were selected, and the geometric parameters, rock-mass parameters, boundary conditions, and definitions of the stability indices were made consistent to the greatest extent possible. The comparisons were performed separately for the normalized required supporting pressure p/γR and the factor of safety FoS.
Table 2 compares the normalized required supporting pressure p/γR calculated using the present program with the corresponding results reported by Park and Michalowski [11]. A total of 30 benchmark cases were examined. The relative differences range from 0.004% to 4.048%, with an average value of 1.979%, and all differences remain below 4.1%.
A similarly close agreement is observed for the factors of safety listed in Table 3. For the 24 comparisons, the absolute relative differences range from 0.71% to 4.32%, with a mean value of 1.54%.
Figure 6, Figure 11 and Figure 13 provide complementary representations of the stability results obtained from the present saturated-rock-mass formulation. In Figure 6, C/R is adopted as the governing horizontal coordinate because it directly describes the evolution of the collapse mechanism from shallow- to deep-buried conditions and allows the critical transition and subsequent plateau to be clearly identified. Figure 11 and Figure 13 recast the calculated results into engineering-oriented stability charts, allowing the normalized supporting pressure p/γR and FoS to be preliminarily estimated from the relevant dimensionless parameters. Although these figures employ familiar curve-based and stability-chart formats, all the curves are newly calculated using the present pore-pressure formulation and represent stability responses associated with the combined consideration of saturated conditions and varying burial depth, which were not addressed together in the previous studies.
After the benchmark comparisons, the stability diagrams shown in Figure 11 and Figure 13 provide a practical approach for estimating the normalized p/γR and FoS for tunnel roofs. To illustrate, consider a rock tunnel with the following properties: spacing between adjacent ribs L = 50 m, tunnel radius R = 50 m, unit weight of the rock mass γ = 20 kN/m3, uniaxial compressive strength σci = 40 MPa, overburden depth above the tunnel roof C = 15 m, GSI = 20, material constant mi = 15, and a pore pressure coefficient ru = 0.25. The value of p/γR can be determined as follows. First, σci/γR is calculated: σci/γR = 40,000/(20 × 50) = 40. Then, by referring to Figure 11c, one finds that p/γR ≈ 0.036.
The FoS may be determined using a similar analytical approach. Maintaining R = 50 m, γ = 20 kN/m3, σci = 40 MPa, and C = 15 m, but with adjusted parameters: support rib spacing L = 30 m, GSI = 40, mi = 15, and ru = 0.5. The dimensionless parameter σci/γR remains constant at 40. Consulting Figure 13f then yields a FoS ≈ 1.116.
The preceding examples are intended to illustrate the engineering application procedure of the proposed stability chart rather than to validate a specific case study. In practical applications, the geometric parameters L, R, and C can be determined based on tunnel design and geological cross-sections. The unit weight γ and the intact rock strength σci can be obtained from laboratory testing. The GSI may be evaluated through field geological mapping and characterization of rock mass structure and discontinuity conditions. The material constant mi can be determined experimentally or estimated according to the lithology of intact rock. The pore pressure ratio ru can be assessed from hydrogeological investigations and in situ pore pressure measurements.
In Example 1, the parameter γR is calculated as 20 × 50 = 1000 kPa. Accordingly, a normalized support pressure of p/γR ≈ 0.036 corresponds to an equivalent support pressure of approximately 36 kPa. In Example 2, a factor of safety of FoS ≈ 1.116 indicates that, under the assumed conditions, the tunnel crown is theoretically stable; however, the available safety margin is relatively limited. These results should be interpreted as preliminary stability indicators within the framework and assumptions of the adopted analytical model, rather than as direct design values.
The close agreement in both the normalized supporting pressure and FoS demonstrates that the proposed computational procedure has been implemented correctly and can consistently reproduce the published benchmark solutions. On this basis, the following application example is presented to illustrate the use of the proposed design charts. Nevertheless, the benchmark comparison represents a numerical verification rather than validation using field measurements or experimental data. Further validation against well-documented field cases should therefore be undertaken when compatible monitoring data become available.

5. Conclusions

The stability of 3D tunnel roofs with varying burial depth in saturated rock mass is analyzed in this study by the kinematic approach of limit analysis. Based on the HB strength criterion, a 3D collapse mechanism that incorporates the influence of pore water pressure in burial depth-varied rock strata was developed. The expressions for the stability indices were derived, and computational codes were developed to determine the optimal solutions, that is, the maximum values of N and p/γR, as well as the minimum values of FoS. A parametric investigation was conducted to examine the variation in the stability indices with respect to pore water pressure, 3D geometric parameters including burial depth, and rock mass strength properties. Stability charts were proposed as a practical tool for the preliminary estimation of the required support pressure and the corresponding FoS. The comparisons of p/γR and FoS with Park and Michalowski [11] showed good agreement, supporting the reliability of the developed program. The specific conclusions can be summarized as follows:
  • The influence of burial depth on tunnel-roof stability is not simply monotonic. At relatively low pore-pressure coefficients (ru ≤ 0.2), N initially increases to a local maximum and subsequently decreases toward a constant deep-buried value, while FoS follows the opposite trend. At higher pore-pressure coefficients (ru ≥ 0.4), the descending branch of N and the corresponding recovery branch of FoS disappear. Once the critical C/R is exceeded, the collapse mechanism becomes independent of the ground surface, and the stability indices remain essentially constant with further increases in burial depth.
  • Pore-water pressure affects both the magnitude of the stability demand and the shallow-to-deep failure transition. For GSI = 20, mi = 5, and L/R = 1, increasing ru from 0.25 to 0.5 increases the deep-buried N from 110.19 to 132.13, corresponding to an increase of approximately 19.9%. For GSI = 60 under the same mi and L/R conditions, N increases from 7.91 to 9.48, representing a comparable increase of approximately 19.8%. In the required-support-pressure analysis with GSI = 10, L/R = 1, and σci/γR = 10, the same increase in ru shifts the critical C/R from approximately 1.5 to 2.0, thereby expanding the shallow-cover influence zone by approximately 33.3%. Therefore, the change in the critical burial ratio should be evaluated according to the selected rock-mass conditions and stability measure.
  • GSI is considerably more influential than mi in controlling the magnitude of N. At ru = 0.25, mi = 5, and L/R = 1, increasing GSI from 20 to 60 reduces the deep-buried N from 110.19 to 7.91, corresponding to a reduction of approximately 92.8%. By comparison, for GSI = 20, L/R = 0.8, and ru = 0, increasing mi from 15 to 25 increases the deep-buried N from 91.48 to 94.01, an increase of only approximately 2.8%. However, the C/R ratio associated with the local maximum of N decreases from 0.058 to 0.025, indicating that mi has a more pronounced influence on the location of the failure-mode transition than on the magnitude of the deep-buried stability number.
  • As L/R increases from finite-length 3D cases toward the 2D limit, N and p/γR increase, whereas FoS decreases. The results progressively approach their corresponding plane-strain limits, indicating that a 2D model may provide a more conservative stability demand for tunnel roofs with a finite longitudinal extent. The proposed stability charts can therefore be used for preliminary estimation of the required support pressure and FoS and for identifying the shallow- or deep-buried collapse mechanism.

Author Contributions

Methodology, J.X.; software, J.X.; validation, J.X., Z.H., L.Q. and Q.R.; formal analysis, J.X., Z.H., L.Q. and Q.R.; data curation, J.X., Z.H., L.Q. and Q.R.; writing—original draft preparation, J.X., Z.H. and L.Q.; visualization, J.X., Z.H., L.Q. and Q.R.; supervision, J.X. All authors have read and agreed to the published version of the manuscript.

Funding

This research was made possible due to the support from the Chongqing Natural Science Foundation (Grant No. CSTB2025NSCQ-GPX0408) and the National Natural Science Foundation of China (52578546).

Institutional Review Board Statement

Not applicable.

Informed Consent Statement

Not applicable.

Data Availability Statement

The data sets in the current study are available from the corresponding author upon reasonable request.

Conflicts of Interest

The authors declare no conflicts of interest.

Abbreviations

List of abbreviations and symbols used in this study
AbbreviationFull name
2DTwo-dimensional
3DThree-dimensional
FoSFactor of safety
GSIGeological Strength Index
HBHoek–Brown
NThe stability number
CCover depth measured from the tunnel roof to the ground surface
pUniform supporting pressure acting on the tunnel roof
RTunnel radius or characteristic tunnel dimension
LSpacing between adjacent ribs
αGeneratrix inclination angle of the j-th elliptical cone
ξTension cut-off coefficient
miIntact rock material constant in the Hoek-Brown criterion
σciUniaxial compressive strength of intact rock
γUnit weight of rock mass
σnNormal stress on the rupture surface
τShear stress on the rupture surface
DDisturbance factor of rock mass
mbReduced Hoek-Brown material constant for rock mass
sHoek-Brown empirical constant for rock mass
aHoek-Brown empirical constant for rock mass
vVelocity of the moving collapse block
nNumber of discretized segments in the collapse mechanism
ruPore water pressure coefficient
δRupture angle associated with the parametric HB strength envelope and the normality flow rule.

Appendix A

In this study, the assumed collapsing block is a rigid body undergoing vertical motion, and the unit energy dissipation on its collapse surface can be expressed as:
d = v ( τ cos δ σ n sin δ )
Meanwhile, the unit area d S on the collapse surface can be expressed as:
d S = E j H j G j 2 d θ d z
where E j ( θ ) , G j ( z , θ ) , and H j ( z , θ ) are as expressed follows:
E j ( θ ) = 1 + cot 2 α j cos 2 θ + λ 2 sin 2 θ
G j ( z , θ ) = h j z cot 2 α j 1 λ 2 cos θ sin θ
H j ( z , θ ) = h j z 2 cot 2 α j sin 2 θ + λ 2 cos 2 θ
The elemental volume of work done by a tunnel collapse block dV can be expressed as:
  d V = A j ( z ) d z
where
A j ( z ) = λ cot 2 α j h j z 2 2 θ j max ( z )   tan 1 ( λ 1 ) cot α j h j z sin 2 θ j max ( z ) ( λ + 1 ) cot α j h j z + ( λ 1 ) cot α j h j z cos 2 θ j max ( z ) x ( z ) y ( z ) 2
The work done by the geostatic self-weight of a 3D collapse block and the 2D collapse insertion block can be expressed in Equations (A8) and (A9), respectively:
W γ 3 D = γ v 4 j = 1 k 1 z j z j + 1 A j ( z ) d z   + 4 z k R A k ( z ) d z + π 3 λ cot 2 α k h k R 3 h k z k + 1 3   + j = k + 1 m - 1 π 3 λ cot 2 α j h j z j 3 h j z j + 1 3   + π 3 λ cot 2 α m h m z m 3 h m C + R 3
and
W γ 2 D = l γ v j = 1 n S j π 2 β R 2 S A B G S B n + 1
where S j is the shaded area in Figure 3. Thus, the work by the geostatic self-weight of the entire tunnel arching collapse block can be expressed as:
W γ = W γ 3 D + W γ 2 D
The work rate by pore pressure on the failure surface of the tunnel roof in saturated rock mass can be expressed as:
W r u = S u v sin δ d S
Especially, for the 2D inserted block, it gives
W r u 2 D = S u v sin δ d S = S r u γ h 2 D v tan δ d z = v γ r u j = 1 n z j z j + 1 h 2 D tan δ d z
where
h 2 D z = z R 2 z h j 2 cot 2 α j
For the 3D end caps,
W r u 3 D = S u v sin δ d S = S r u γ h 3 D v sin δ d S
where h 3 D z , θ = z R 2 z h j 2 cot 2 α j 1 + tan 2 θ / λ 2 is the vertical distance from the failure surface to the tunnel roof.
More specifically, Equation (A14) can be expressed as:
W r u 3 D = 4 v γ r u j = 1 k 1 z j z j + 1 0 θ j u z g j z ,   θ d θ d z + z k R 0 θ k u z g k z ,   θ d θ d z + R z k + 1 0 π / 2 g k z ,   θ d θ d z + j = k + 1 m 1 z j z j + 1 0 π / 2 g j z ,   θ d θ d z + z m C + R 0 π / 2 g m z ,   θ d θ d z
Equations (A16) and (A17) represent the work done by the applied support pressure on the 3D tunnel arching and 2D insertion blocks, respectively:
W p 3 D = 4 p v j = 1 k 1 z j z j + 1 λ z cot 2 α j h j z 2 R 2 z 2 1 d z + z k R λ z cot 2 α k h k z 2 R 2 z 2 1 d z
And
W p 2 D = l p v R cos β
Therefore, the work done by the support pressure on the entire tunnel arching is expressed as:
W p = W p 3 D + W p 2 D
The internal dissipation rate of the 3D collapse block shown in Figure 3 and Figure 4 can be expressed as:
D 3 D = 4 v j = 1 k 1 z j z j + 1 0 θ j max ( z ) f j ( z , θ ) d θ d z + z k R 0 θ k max ( z ) f k ( z , θ ) d θ d z +   + R z k + 1 0 π / 2 f k ( z , θ ) d θ d z + j = k + 1 m 1 z j z j + 1 0 π / 2 f j ( z , θ ) d θ d z + z m C + R 0 π / 2 f k ( z , θ ) d θ d z
where θ j max ( z ) = tan 1 y z x z = tan 1 λ cot 2 α j h j z 2 R 2 z 2 1 , 1 j k , and f j ( z , θ ) = τ j ( θ ) cos δ j ( θ ) σ n j ( θ ) sin δ j ( θ ) E j H j G j 2 .
While the internal dissipation rate for the 2D insertion block is:
D 2 D = v j = 1 m 1 τ j cos δ j σ n j sin δ j L j + τ m cos δ m σ n m sin δ m L B m B G S
where L j is the length of the segment B j B j + 1 in Figure 3.
Therefore, the internal dissipation rate of the entire collapse block is:
D = D 3 D + D 2 D

References

  1. Fraldi, M.; Guarracino, F. Limit analysis of collapse mechanisms in cavities and tunnels according to the Hoek–Brown failure criterion. Int. J. Rock Mech. Min. Sci. 2009, 46, 665–673. [Google Scholar] [CrossRef] [Scilit]
  2. Fraldi, M.; Guarracino, F. Analytical solutions for collapse mechanisms in tunnels with arbitrary cross sections. Int. J. Solids Struct. 2010, 47, 216–223. [Google Scholar] [CrossRef] [Scilit]
  3. Fraldi, M.; Guarracino, F. Evaluation of impending collapse in circular tunnels by analytical and numerical approaches. Tunn. Undergr. Space Technol. 2011, 26, 507–516. [Google Scholar] [CrossRef] [Scilit]
  4. Fraldi, M.; Guarracino, F. Limit analysis of progressive tunnel failure of tunnels in Hoek–Brown rock masses. Int. J. Rock Mech. Min. Sci. 2012, 50, 170–173. [Google Scholar] [CrossRef] [Scilit]
  5. Yang, X.L.; Huang, F. Three-dimensional failure mechanism of a rectangular cavity in a Hoek–Brown rock medium. Int. J. Rock Mech. Min. Sci. 2013, 61, 189–195. [Google Scholar] [CrossRef] [Scilit]
  6. Yang, X.L.; Yao, C. Stability of tunnel roof in nonhomogeneous soils. Int. J. Geomech. 2018, 18, 06018002. [Google Scholar] [CrossRef] [Scilit]
  7. Huang, F.; Yang, X.L.; Ling, T.H. Prediction of collapsing region above deep spherical cavity roof under axis-symmetrical conditions. Rock Mech. Rock Eng. 2014, 47, 1511–1516. [Google Scholar] [CrossRef] [Scilit]
  8. Qin, C.B.; Chian, S.C.; Yang, X.L. 3D limit analysis of progressive collapse in partly weathered Hoek–Brown rock banks. Int. J. Geomech. 2017, 17, 04017011. [Google Scholar] [CrossRef] [Scilit]
  9. Qin, C.B.; Chian, S.C. 2D and 3D stability analysis of tunnel roof collapse in stratified rock: A kinematic approach. Int. J. Rock Mech. Min. Sci. 2017, 100, 269–277. [Google Scholar] [CrossRef] [Scilit]
  10. Qin, C.B.; Li, Y.Y.; Yu, J.; Chian, S.C.; Liu, H.L. Closed-form solutions for collapse mechanisms of tunnel crown in saturated non-uniform rock surrounds. Tunn. Undergr. Space Technol. 2022, 126, 104529. [Google Scholar] [CrossRef] [Scilit]
  11. Park, D.; Michalowski, R.L. Three-dimensional roof collapse analysis in circular tunnels in rock. Int. J. Rock Mech. Min. Sci. 2020, 128, 104275. [Google Scholar] [CrossRef] [Scilit]
  12. Park, D.; Michalowski, R.L. Roof stability in flat-ceiling deep rock cavities and tunnels. Eng. Geol. 2022, 303, 106651. [Google Scholar] [CrossRef] [Scilit]
  13. Park, D.; Michalowski, R.L. Spatial distribution of rock disturbance in assessment of roof stability in flat ceiling cavities. Rock Mech. Rock Eng. 2023, 56, 4445–4461. [Google Scholar] [CrossRef] [Scilit]
  14. Zhang, Q.; Zhang, X.; Hu, X. Deep underground engineering and rock mechanics: Challenges and perspectives. Eng. Geol. 2020, 267, 105477. [Google Scholar] [CrossRef] [Scilit]
  15. Yang, X.L.; Huang, F. Collapse mechanism of shallow tunnel based on nonlinear Hoek–Brown failure criterion. Tunn. Undergr. Space Technol. 2011, 26, 686–691. [Google Scholar] [CrossRef] [Scilit]
  16. Liang, J.Y.; Cui, J.; Lu, Y.; Li, Y.D.; Shan, Y. Limit analysis of shallow tunnels collapse problem with optimized solution. Appl. Math. Model. 2022, 109, 98–116. [Google Scholar] [CrossRef] [Scilit]
  17. Lee, I.M.; Nam, S.W. The study of seepage forces acting on the tunnel lining and tunnel face in shallow tunnels. Tunn. Undergr. Space Technol. 2001, 16, 31–40. [Google Scholar] [CrossRef] [Scilit]
  18. Viratjandr, C.; Michalowski, R.L. Limit analysis of submerged slopes subjected to water drawdown. Can. Geotech. J. 2006, 43, 802–814. [Google Scholar] [CrossRef] [Scilit]
  19. Kim, J.; Salgado, R.; Yu, H.S. Limit analysis of soil slopes subjected to pore water pressure. J. Geotech. Geoenviron. Eng. 1999, 125, 49–58. [Google Scholar] [CrossRef] [Scilit]
  20. Yang, X.L.; Zou, J.F. Stability factors for rock slopes subjected to pore water pressure based on the Hoek–Brown failure criterion. Int. J. Rock Mech. Min. Sci. 2006, 43, 1146–1152. [Google Scholar] [CrossRef] [Scilit]
  21. Buhan, P.; Cuvillier, A.; Dormieux, L.; Maghous, S. Face stability of shallow circular tunnels driven under the water table: A numerical analysis. Int. J. Numer. Anal. Methods Geomech. 1999, 23, 79–95. [Google Scholar] [CrossRef] [Scilit]
  22. Qin, C.B.; Sun, Z.B.; Liang, Q. Limit analysis of roof collapse in tunnels under seepage forces condition with three-dimensional failure mechanism. J. Cent. South Univ. 2013, 20, 2314–2322. [Google Scholar] [CrossRef] [Scilit]
  23. Qin, C.B.; Chian, S.C.; Yang, X.L.; Du, D.C. 2D and 3D limit analysis of progressive collapse mechanism for deep-buried tunnels under the condition of varying water table. Int. J. Rock Mech. Min. Sci. 2015, 80, 255–264. [Google Scholar] [CrossRef] [Scilit]
  24. Xu, J.S.; Wang, X.R.; Tian, Y.; Du, X.L. Roof stability analysis for a shallow-buried cylindrical tunnel in Hoek–Brown rock strata. Comput. Geotech. 2024, 175, 106685. [Google Scholar] [CrossRef] [Scilit]
  25. Li, Y.X.; Wang, W.; Yan, S.H.; Du, J.X. Theoretical Analysis on the Effectiveness of Pipe Roofs in Shallow Tunnels. Appl. Sci. 2022, 12, 9106. [Google Scholar] [CrossRef] [Scilit]
  26. Liu, Y.Q.; Zheng, P.Q.; Xu, L.Q.; Li, W.J.; Sun, Y.Q.; Sun, W.W.; Yuan, Z. Mechanism of Roof Deformation and Support Optimization of Deeply Buried Roadway under Mining Conditions. Appl. Sci. 2022, 12, 12090. [Google Scholar] [CrossRef] [Scilit]
  27. Jing, L. A review of techniques, advances and outstanding issues in numerical modelling for rock mechanics and rock engineering. Int. J. Rock Mech. Min. Sci. 2003, 40, 283–353. [Google Scholar] [CrossRef] [Scilit]
  28. Xu, J.S.; Du, X.L. Seismic stability of 3D rock slopes based on a multi-cone failure mechanism. Rock Mech. Rock Eng. 2023, 56, 1595–1605. [Google Scholar] [CrossRef] [Scilit]
  29. Xu, J.S.; Wang, X.R.; Du, X.L. Seismic active earth pressure for 3D earth retaining structure following a nonlinear failure criterion. Comput. Geotech. 2024, 165, 105902. [Google Scholar] [CrossRef] [Scilit]
  30. Hoek, E.; Brown, E.T. Empirical strength criterion for rock masses. J. Geotech. Eng. Div. 1980, 106, 1013–1035. [Google Scholar] [CrossRef] [Scilit]
  31. Kumar, P. Shear failure envelope of Hoek–Brown criterion for rock mass. Tunn. Undergr. Space Technol. 1998, 13, 453–458. [Google Scholar] [CrossRef] [Scilit]
  32. Balmer, G. A general analysis solution for Mohr’s envelope. Proc. ASTM 1952, 52, 1260–1271. [Google Scholar]
  33. Marinos, P.; Hoek, E. GSI: A geologically friendly tool for rock mass strength estimation. In Proceedings of the GeoEng2000: An International Conference on Geotechnical & Geological Engineering, Melbourne, Australia, 19–24 November 2000; Volume 1, pp. 1422–1446. [Google Scholar]
  34. Hoek, E.; Carranza-Torres, C.; Corkum, B. Hoek–Brown failure criterion—2002 edition. In Proceedings of the 5th North American Rock Mechanics Symposium and 17th Tunnelling Association of Canada Conference (NARMS–TAC 2002), Toronto, ON, Canada, 7–10 July 2002; Volume 1, pp. 267–273. [Google Scholar]
Figure 1. Strength envelope and the rupture angle δ from the HB criterion (Reproduced from Reference [24]. Copyright 2024 Elsevier Ltd.; reused under the original authors’ retained rights).
Applsci 16 08769 g001
Figure 2. The 3D roof collapse mechanism for cylindrical tunnels in saturated rock mass: (a) 3D collapse mechanism under the shallow-buried condition; (b) corresponding vertical section under the shallow-buried condition; (c) 3D collapse mechanism under the deep-buried condition; (d) corresponding vertical section under the deep-buried condition. (The theoretical framework follows Park and Michalowski [11], and the graphical illustration is adapted from Reference [24].).
Applsci 16 08769 g002
Figure 3. Collapse mechanism of a shallow-buried 3D tunnel roof saturated rock masses: (a) Horizontal xOy plane; (b) Vertical xOz plane; and (c) Longitudinal yOz plane. (The theoretical framework follows Park and Michalowski [11], and the graphical illustration is reproduced from Reference [24]).
Applsci 16 08769 g003
Figure 4. Collapse mechanism of a 3D shallow-buried cylindrical tunnel roof: (a) without insert plane; (b) with insert plane; (c) cross-section of the insert plane. (The theoretical framework follows Park and Michalowski [11], and the graphical illustration is reproduced from Reference [24]).
Applsci 16 08769 g004
Figure 5. The HB strength criterion and the reduced strength envelope. (Reproduced from Reference [24]. Copyright 2024 Elsevier Ltd.; reused under the original authors’ retained rights).
Applsci 16 08769 g005
Table 1. Classification, adopted values, and roles of the parameters used in the parametric analyses.
CategoryParameterAdopted Values or RangeAnalysis RoleSelection Basis
Rock-mass propertiesGSI10, 20, 40, 60, 80, and 100VariedRepresents rock masses ranging from very poor to very good quality within the conventional HB range [33,34].
mi5, 10, 15, 20, and 25VariedCovers intact rocks with different lithological and mechanical characteristics within the conventional HB range [33,34].
D0Fixed modeling assumptionReference condition for an undisturbed rock mass [33,34].
Hydrogeological conditionru0–0.5; representative chart values of 0.25 and 0.5VariedCovers conditions from no pore-water pressure to pronounced pore-pressure effects [18,19,20,21,22,23,24].
Burial and tunnel geometryC/RFrom approximately 0.01 to the deep-buried plateau; representative values of 0.1, 0.3, 0.5, and 1.0VariedCaptures the transition from shallow- to deep-buried failure mechanisms [24].
L/R0.5, 0.6, 0.8, 1, 2, and 5, together with the 2D limitVariedRepresents different degrees of 3D influence and the transition toward plane-strain conditions [11,24].
Normalized rock strengthσci/γR0.1–160 for the support-pressure charts and 0.1–1000 for the FoS chartsVariedCovers broad combinations of intact-rock strength, unit weight, and tunnel size [11,12,13,24].
Numerical discretizationn10Fixed numerical settingSelected to balance the geometric representation of the collapse mechanism and computational efficiency, as described in Section 3.2.
Table 2. Comparison of the present required supporting pressures with the results from Park and Michalowski [11] under a deep-buried case.
σci/γRGSImiSolutionsL/R
0.50.60.812D
10205Park and Michalowski [11]90.35107.54143.47174.87485.32
Present research89.37105.44138.76170.10485.58
15Park and Michalowski [11]45.3652.9266.0076.66138.35
Present research44.1751.3964.1174.34138.30
25Park and Michalowski [11]32.4237.1844.8750.5578.62
Present research31.7336.3843.9249.5478.61
1605Park and Michalowski [11]109.67128.71188.62233.17904.84
Present research111.86133.92181.87230.49906.18
15Park and Michalowski [11]57.5666.3489.15103.65253.37
Present research56.6266.4985.81102.99253.38
25Park and Michalowski [11]42.2649.3261.8872.31140.33
Present research40.8347.6459.9069.97140.35
Table 3. Comparison of the present FoS with the results from Park and Michalowski [11] under a deep-buried case.
σci/γRGSImiSolutionsL/R
0.50.60.8122D
1002015Park and Michalowski [11]1.111.081.041.020.990.97
Present research1.1171.0851.0511.0321.0020.977
25Park and Michalowski [11]1.091.081.061.051.020.97
Present research1.0771.0571.0341.0210.9990.979
106015Park and Michalowski [11]1.401.341.271.231.161.12
Present research1.4091.3471.2761.2381.1761.129
25Park and Michalowski [11]1.391.311.261.241.201.12
Present research1.3291.2851.2351.2091.1651.132
Disclaimer/Publisher’s Note: The statements, opinions and data contained in all publications are solely those of the individual author(s) and contributor(s) and not of MDPI and/or the editor(s). MDPI and/or the editor(s) disclaim responsibility for any injury to people or property resulting from any ideas, methods, instructions or products referred to in the content.