1. Introduction
The rapid development of mobile infrastructure, from 2G/3G to 4G LTE and 5G NR, has led to a significant increase in the number of base transceiver stations (BTSs) in urban areas and, consequently, increased public exposure to radiofrequency electromagnetic fields (RF-EMF) [
1,
2]. With the expansion of mobile networks, systematic RF-EMF monitoring has a dual importance: as a tool for verifying compliance with permissible exposure limits, and as a source of baseline epidemiological data for assessing long-term health risks.
International regulatory bodies, including ICNIRP, which has progressively refined its exposure framework from the 1998 general guidelines [
2] through the 2010 revision addressing sub-100 kHz fields [
3] to the current radiofrequency-specific 2020 guidelines [
1], the Federal Communications Commission (FCC) [
4], the Institute of Electrical and Electronics Engineers (IEEE) [
5], and the European Union [
6], have established reference limits based on scientifically established thermal and non-thermal effects. Although major epidemiological studies have not identified adverse health effects at exposure levels within ICNIRP limits, public transparency and disclosure of measured exposure levels remain both a scientific and a regulatory priority [
1,
2].
From a physical standpoint, RF-EMF exposure assessment is grounded in the far-field propagation of electromagnetic waves radiated by BTS antennas, where the electric field strength
E (V/m) is directly related to the equivalent plane-wave power density S through S =
E2/Z
0, with Z
0 ≈ 377 Ω, the free-space wave impedance. At the sensor height and operator distances used in this study (
Section 2.2), measurement points lie in the radiating far field of the surveyed macro-cell antennas, where field strength decays approximately with the inverse of distance (Friis-type free-space attenuation, modulated by urban multipath, diffraction, and shadowing). Because the six investigated services operate on non-overlapping carrier frequencies transmitted by physically independent, mutually incoherent sources, their instantaneous fields are statistically uncorrelated; consequently, their contributions combine additively in power rather than in amplitude, which is the physical justification for the root-sum-square (RSS) combination rule used throughout this work (
Section 2.3, Equation (1)) and for the ICNIRP multi-frequency summation formula (Equation (2)). This physical framework also underlies the distinction, developed later in this study, between continuously radiating Frequency Division Duplex (FDD) carriers and pulsed Time Division Duplex (TDD) transmissions, whose duty-cycle-dependent peak-to-average power ratio is a direct consequence of electromagnetic wave physics rather than of network traffic alone.
The principal monitoring techniques include selective spectrum analyzers [
7,
8], broadband personal exposure meters [
9,
10,
11], and isotropic probes [
12,
13]. Geographic Information Systems (GIS) have become a standard tool for spatial visualization of exposure and identification of high-exposure areas [
14,
15]. Temporal variations driven by diurnal and weekly network traffic patterns have been widely documented [
16,
17,
18,
19].
In recent years, the deployment of 5G NR mid-band (3.4–3.8 GHz) with Time Division Duplex (TDD) architecture has introduced new methodological challenges: during active downlink slots, instantaneous power is high but time-limited (<1 ms/slot), generating
Emax/
Eact ratios (5–6×) considerably higher than those observed in Frequency Division Duplex (FDD) systems [
11,
20,
21,
22], a duty-cycle effect also confirmed in dedicated urban 5G base-station surveys [
23] and addressed through reference-signal-based extrapolation methods developed to predict maximum theoretical exposure from short-duration measurements [
24]. Recent studies conducted in four [
25] and ten [
26] European countries confirm that 5G NR exposure levels remain below ICNIRP 2020 limits even in areas of high BTS density. This phenomenon requires calibrated time-averaging measurement methodologies.
Despite a growing international literature [
7,
8,
9,
10,
11,
12,
13,
14,
15,
16,
17,
18,
20], multi-band spatial mapping of RF-EMF exposure remains virtually undocumented in Albania and the wider Balkan region, with the notable exception of a spatially and temporally resolved urban survey conducted in Belgrade [
27]. This work addresses that regional data gap through measurements at two landmark squares in central Tirana. Its contribution is not limited to geographic novelty: it integrates selective multi-band measurements, physically justified RSS aggregation, cross-validated spatial interpolation, percentile-based hotspot mapping, temporal comparisons, and ICNIRP multi-frequency compliance assessment within an open and reproducible Python/GIS pipeline. This integrated framework can be transferred to other urban settings where heterogeneous networks, limited sampling resources, and the coexistence of FDD and TDD services create similar monitoring challenges.
This study aims to evaluate: (I) whether measured RF-EMF exposure differs between weekdays (WD) and weekends (WE) across the six investigated bands; and (II) whether the observed 5G NR 3600 temporal and peak-to-average characteristics are consistent with TDD operation. The operational objectives are: (i) to develop multi-band spatial exposure maps from selective-analyzer measurements using an openly documented Python/GIS workflow; (ii) to select the primary spatial interpolation method through band- and site-specific LOOCV; (iii) to identify elevated-exposure zones using an explicit percentile-based criterion; (iv) to quantify temporal contrasts using multiplicity-controlled non-parametric statistics; and (v) to assess multi-frequency compliance with ICNIRP 2020 reference levels.
2. Materials and Methods
2.1. Study Area
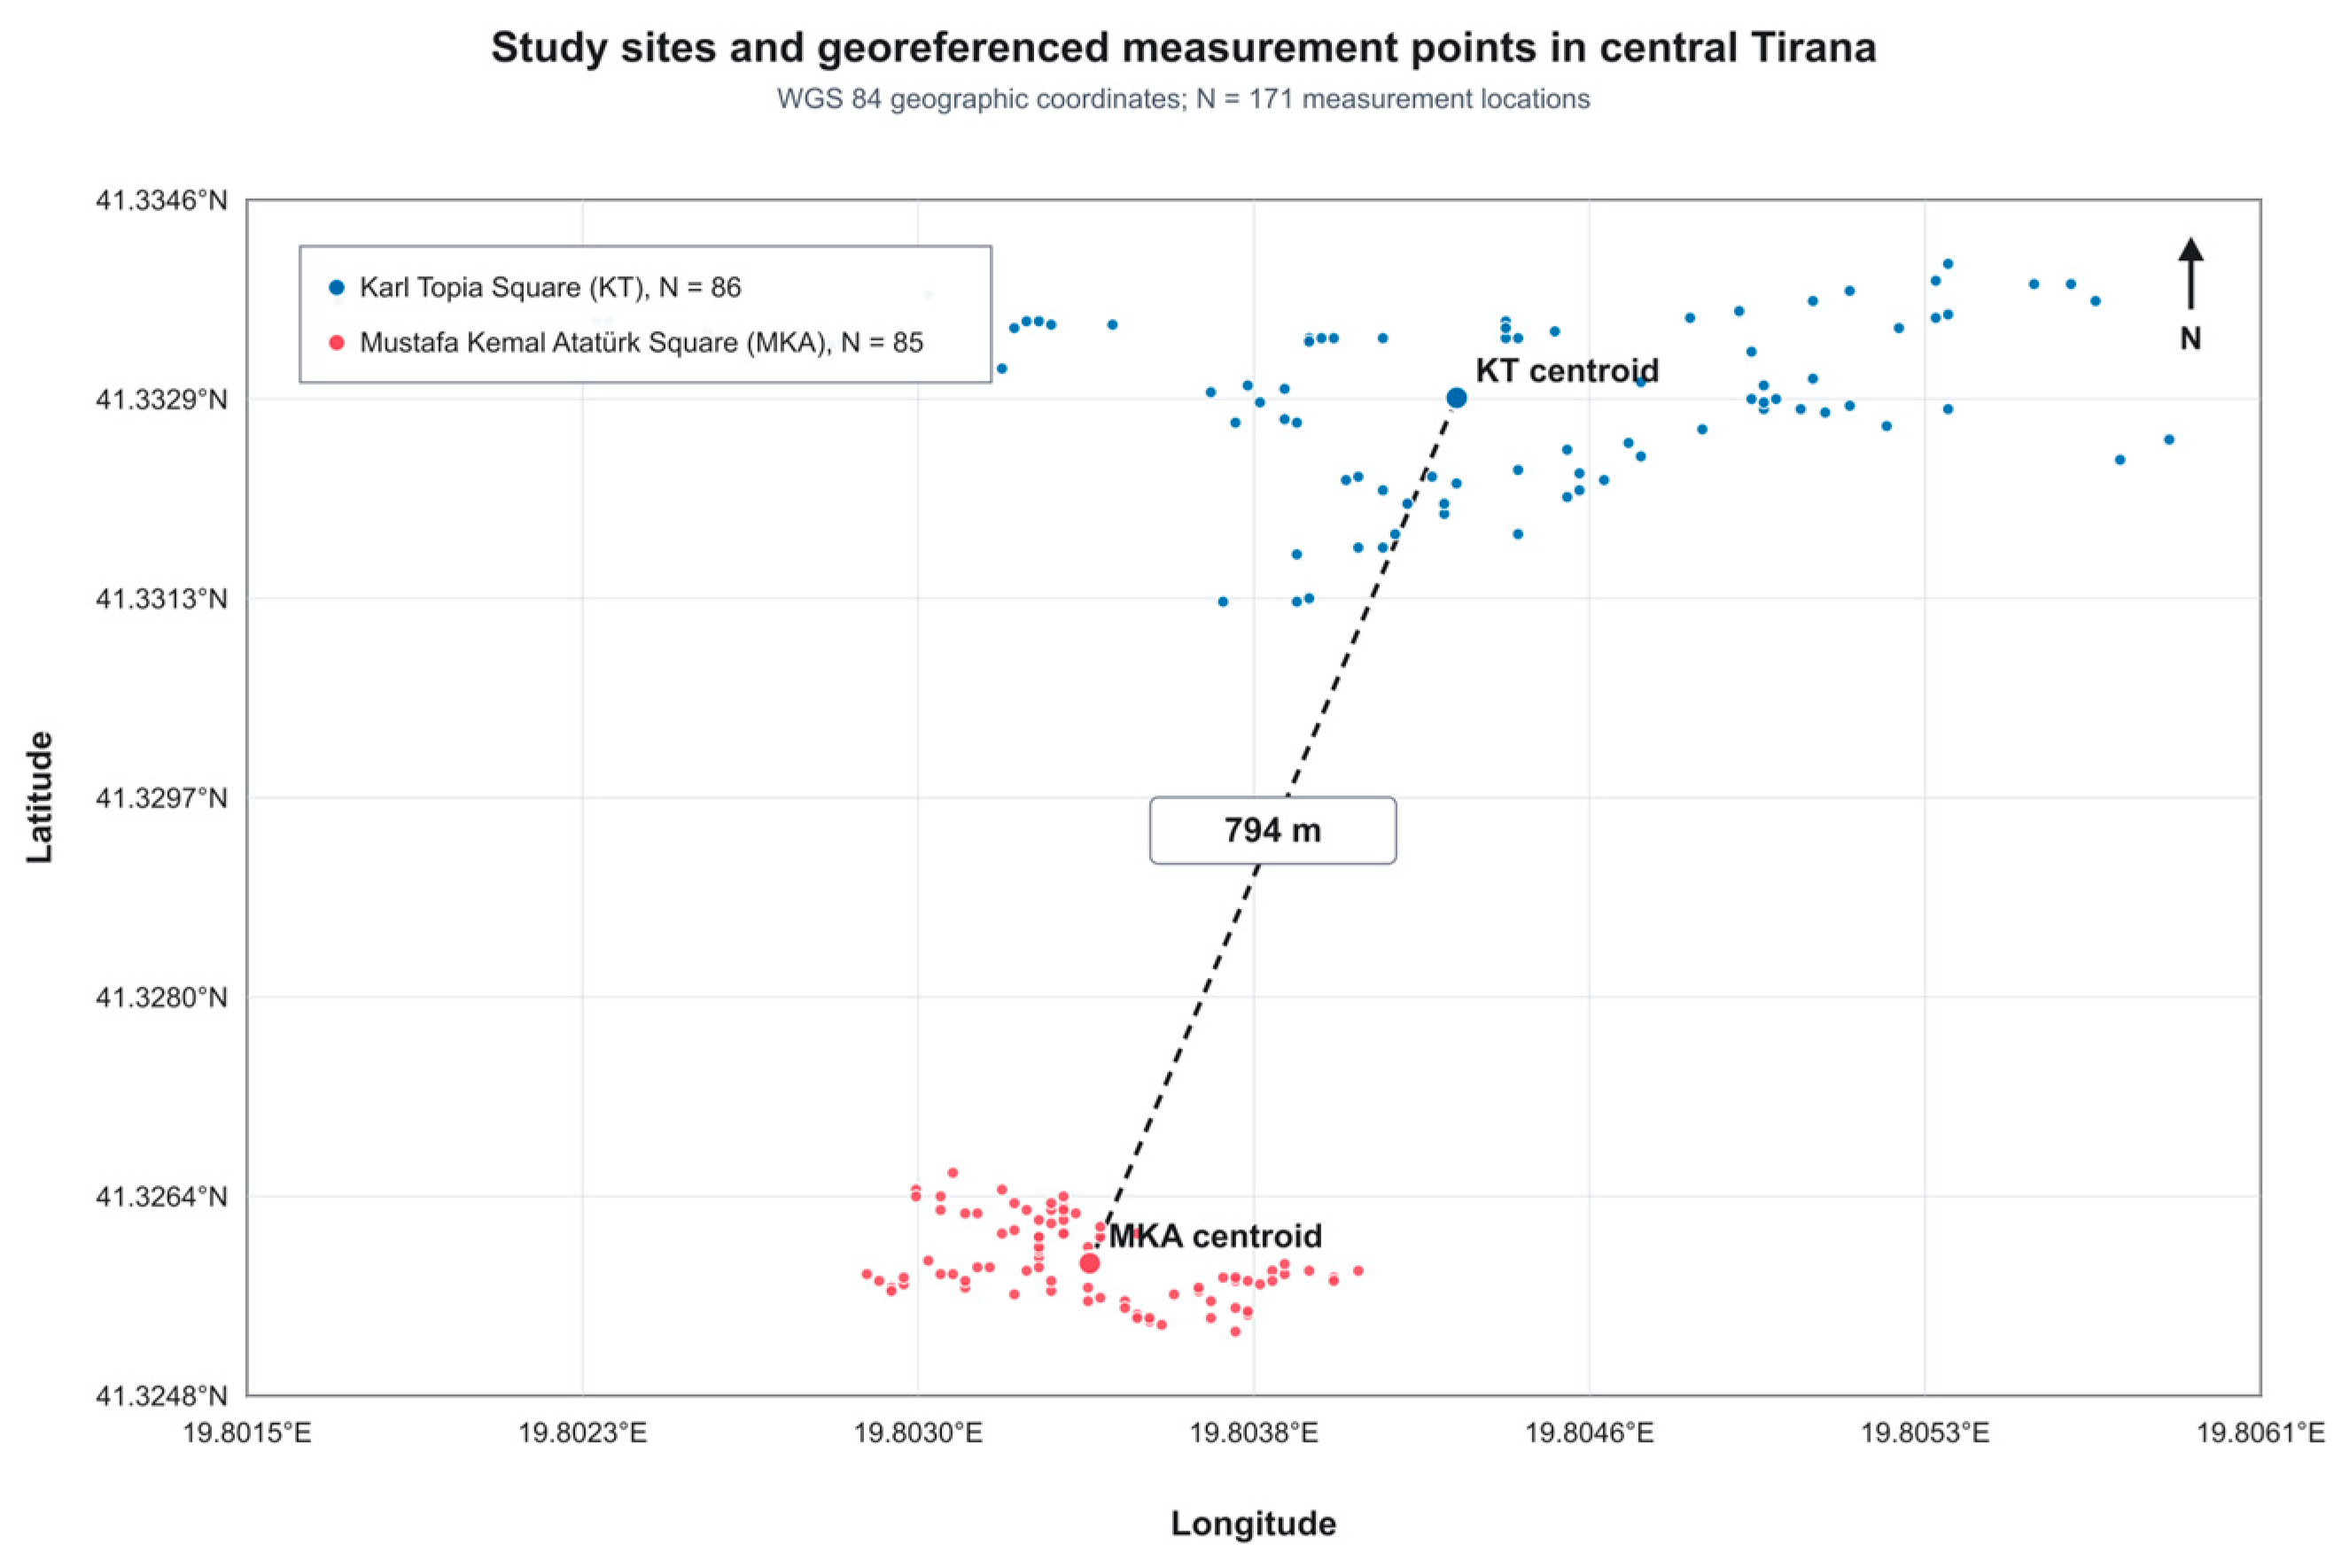
Measurements were conducted in two central urban areas of Tirana: Karl Topia Square (KT) (
N = 86, 41.332954° N, 19.804250° E) and Mustafa Kemal Atatürk Square (MKA) (
N = 85, 41.325840° N, 19.803421° E). The sites were selected purposively before data collection because they are high-occupancy public spaces with dense pedestrian and vehicular activity, contrasting street/building geometries, nearby cellular infrastructure, safe pedestrian access for repeated tripod measurements, and a short separation (794 m) that permits comparison under broadly similar metropolitan conditions. They were not selected as suspected worst-case exposure locations; rather, they form two intensively used urban microenvironments suitable for a reproducible first campaign (
Figure 1).
A total of 171 georeferenced measurement locations were distributed nearly equally between the two study areas (KT, 86; MKA, 85). Within each square, points were selected to span road intersections, pedestrian walkways, open areas, building edges, different street orientations, and varying proximity and line-of-sight conditions relative to visible telecommunications infrastructure. This design supports within-site spatial characterization but is not a probability sample of Tirana or Albania.
Measurement points were mainly positioned along pedestrian walkways, road intersections, open spaces, and areas of high public occupancy, following a real-world field sampling strategy aimed at maximizing environmental representativeness rather than maintaining a regular spatial grid.
2.2. Instrument and Measurement Procedure
The electric field strength (
E, in V/m) was measured using the NARDA SRM-3006 selective analyzer (tri-axial, isotropic; Narda Safety Test Solutions, Pfullingen, Germany) [
28]. The instrument is certified to international standards and provides band-selective measurements with high spectral resolution, a significant advantage over broadband exposure meters. Instrument configuration parameters and expanded measurement uncertainty are summarized in
Table 1.
The expanded measurement uncertainty U = ±1.5 dB (
k = 2, coverage probability 95%) was adopted according to ETSI TR 102 273 [
29]. The principal contributions considered were probe calibration (±0.5 dB), positioning (±0.8 dB), and temperature variation (±0.7 dB); their root-sum-square combination yields ±1.2 dB, and the slightly more conservative manufacturer-specified value of ±1.5 dB was adopted throughout.
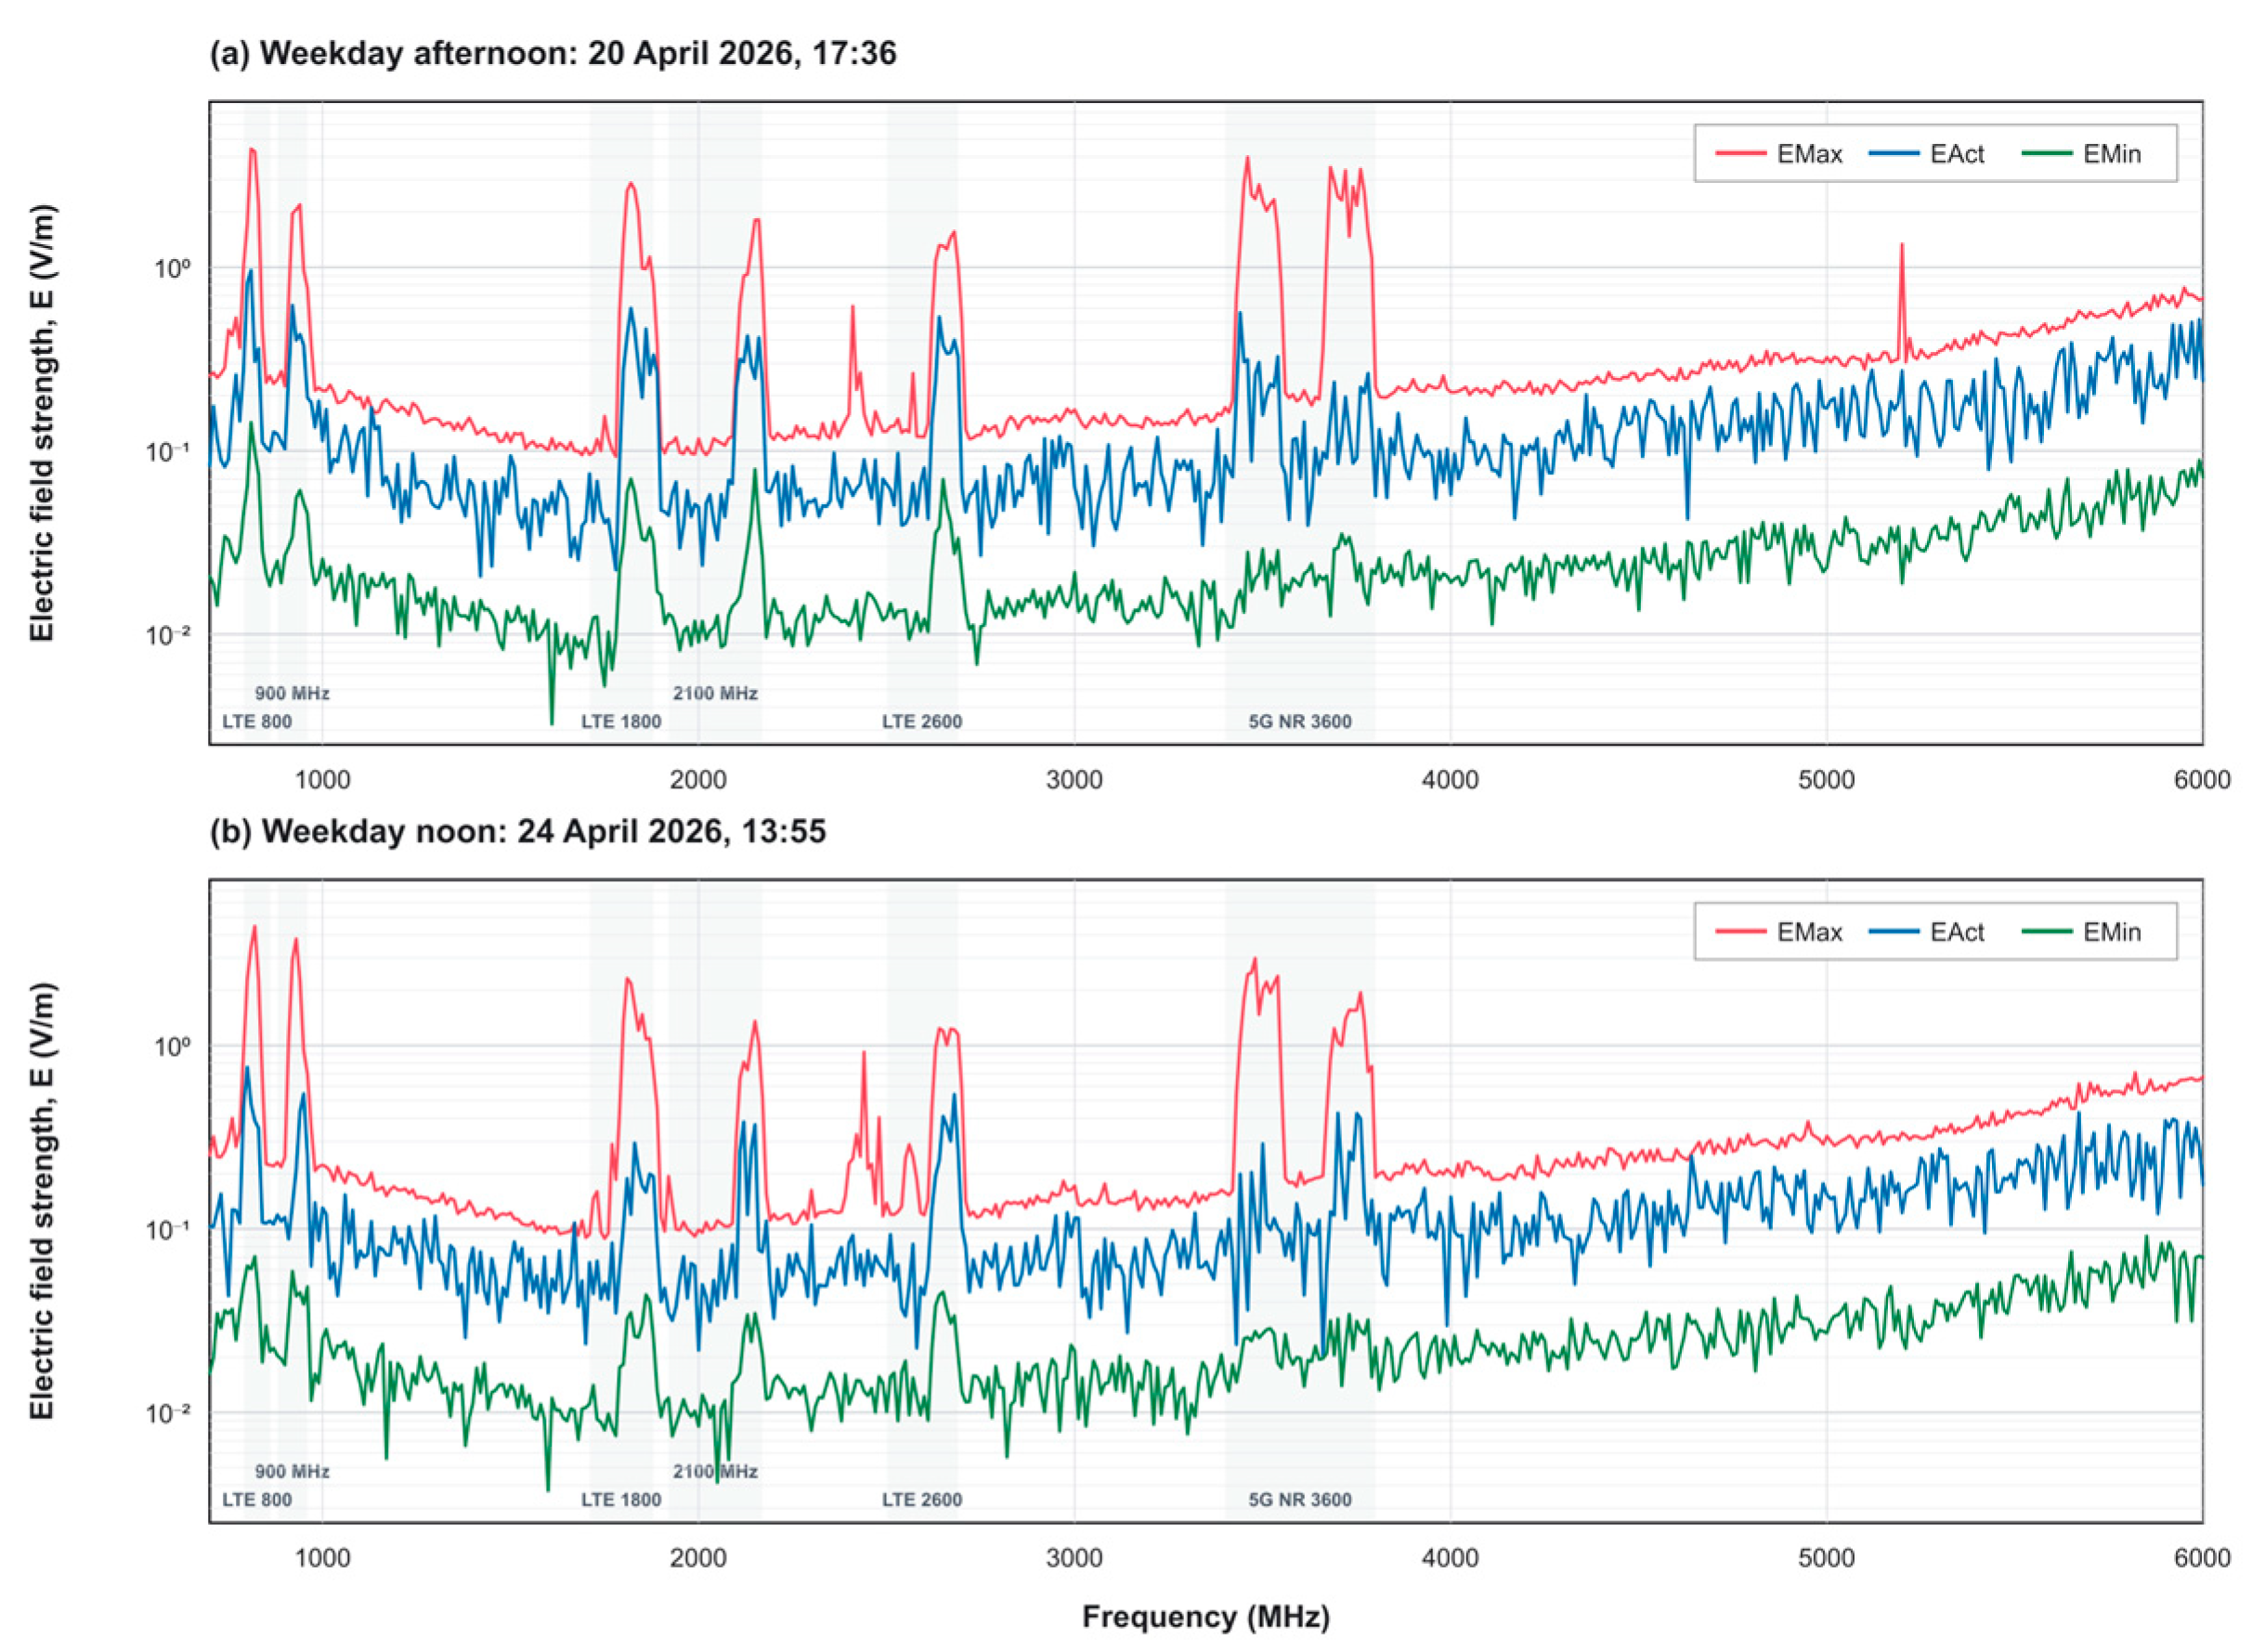
Measurements followed the ICNIRP methodology: (i) probe mounted on a tripod in a fixed, stable position; (ii) sensor height of 1.5 m; (iii) operator distance ≥ 1 m to eliminate body-shadowing effects; (iv) data recorded after each 6 min averaging window (360 s, RSS method) (
Figure 2). Measurements were performed on both weekdays and weekends within a nominal 08:00–18:00 daytime window during April-May 2026 (actual session times 08:26–18:35 local time), yielding 171 sessions in total (80 weekdays; 91 weekends), each comprising 531 spectral bins at a 10 MHz step across the 700 MHz-6 GHz analyzer span, consistent with the summation index in Equation (1) and confirmed by the raw instrument spectrum exports for each measurement point. Each of the 171 points was surveyed in a single 360 s session; throughout this article, the terms measurement point and session therefore correspond one-to-one, and all
N values refer to measurement points.
All measurement sessions were classified by day type. The field campaign was carried out on eight calendar days in April-May 2026: KT was surveyed on Sunday 19 April (20 points), Monday 20 April (31 points), Friday 24 April (15 points), and Sunday 26 April (20 points), and MKA on Saturday 2 May (15 points), Sunday 3 May (36 points), Monday 4 May (24 points), and Tuesday 5 May (10 points). The Weekday group (WD) therefore comprises
N = 80 points (Mondays, one Tuesday, and one Friday; KT 46, MKA 34), and the Weekend group (WE)
N = 91 points (Saturdays and Sundays; KT 40, MKA 51). Wednesday and Thursday could not be covered within the field-campaign schedule (
Section 3.7 (iii)); the WD/WE imbalance and the unequal representation of the two squares within each group likewise arise from field-scheduling constraints. The Mann–Whitney U test is unaffected by unequal group sizes, while the spatial composition of the temporal groups is discussed as a limitation in
Section 3.7 (viii).
Sessions were further classified by diurnal window: Morning (08:00–10:00,
N = 46), Late Morning (10:00–13:00,
N = 52), Noon (13:00–16:00,
N = 41), and Afternoon (16:00–18:00,
N = 32). Each 360 s measurement session was assigned to exactly one diurnal window based on its start time, ensuring mutually exclusive, non-overlapping classification (46 + 52 + 41 + 32 = 171). Window boundaries were chosen a priori to follow the characteristic phases of urban activity (morning ramp-up, business morning, midday, and late-afternoon commute) while keeping each window populated with enough points for the non-parametric tests; the windows are therefore of unequal duration (2 h/3 h/3 h/2 h). One session (KT, 20 April, 18:29–18:35) slightly exceeded the nominal 18:00 endpoint and was assigned to the Afternoon window. The analyzed frequency bands are listed in
Table 2.
The labels in
Table 2 identify frequency intervals used for band-selective exposure aggregation; the SRM-3006 sweep measures spectral field strength but does not decode the transmitted radio-access protocol. Consequently, energy in the 900 and 2100 MHz intervals is reported using frequency-centric labels and should not be interpreted as proof that a particular 2G or 3G service remained operational. Modern base-station sites may support several co-sited or software-configured radio-access technologies, and spectrum may be reframed over time [
30,
31,
32].
2.3. Data Processing and GIS Spatial Analysis
For each measurement point and each frequency band, the composite electric field was calculated using the power-sum method,
where
Ei denotes the
Eact value (V/m) in the
ith non-overlapping 10 MHz spectral bin and
N is the number of bins assigned to the band. Each spectral bin was included once, and the quadratic sum assumes mutually incoherent frequency-separated components whose time-averaged powers add. It does not imply independence of spatial observations. The resulting band-integrated value is conditional on the 10 MHz binning, detector, sweep range, and 360 s averaging. Comparisons with studies based on channel-power integration, reference-signal extrapolation, broadband probes, personal exposimeters, or different temporal averaging must therefore be interpreted as protocol-dependent rather than as direct evidence of geographical differences.
Data processing was performed in Python 3.11.9 following the sequence: (i) importing raw Excel files; (ii) splitting by frequency band and assembling the multi-band dataset; and (iii) merging with each point’s WGS84 geographic coordinates (latitude/longitude, EPSG:4326). Spatial interpolation was performed separately for each square using inverse-distance weighting (IDW, power = 2). IDW was selected as the primary mapping method after band- and square-specific leave-one-out cross-validation showed a lower RMSE than linear interpolation in 11 of the 12 comparisons (pooled mean NRMSE: 19.7% for IDW vs. 21.7% for linear interpolation;
Table S2). Surfaces were restricted to the convex hull of each square’s sampling points to avoid extrapolation beyond the observed footprint. High-exposure areas (hotspots) were delineated as cyan contours at the 85th-percentile threshold of each band’s measured values. Maps were produced with Matplotlib 3.10.8; measurement points and site boundaries were displayed explicitly. All scripts and results are publicly available via Zenodo and GitHub [
33]. The multi-frequency compliance quotient
QTh was calculated according to the ICNIRP formula [
2],
where
Ei is the electric field measured in band i, and
Eref,i is the ICNIRP 2020 reference level. Compliance is confirmed when
QTh < 1.
The unadjusted WE−WD comparison used the two-sided Mann–Whitney U test after Shapiro–Wilk testing indicated non-normality. Because weekday and weekend observations were not equally distributed between KT and MKA, a prespecified sensitivity analysis fitted a log-linear model separately for each band: log(E) = beta0 + beta1(weekday) + beta2(site) + beta3–5(time window). The weekday coefficient was transformed to 100[exp(beta1) − 1] and reported with a 95% confidence interval. Cluster-robust standard errors were calculated by campaign day (eight day-site clusters) to acknowledge within-day spatial dependence. Site-stratified Mann–Whitney comparisons were also reported. These adjusted analyses reduce, but cannot eliminate, confounding caused by the non-random spatial and temporal sampling design.
3. Results and Discussion
3.1. Overall Exposure Levels and ICNIRP Compliance
Table 3 summarizes the descriptive statistics for all 171 measurement points (pooled WD + WE) and the percentage of the applicable ICNIRP 2020 reference level. All measured E-field values are well within regulatory limits: the highest mean was recorded for LTE 800 (1.4497 V/m, corresponding to 3.67% of the ICNIRP reference level of 39.52 V/m). The highest individual time-averaged peak was
Eact,peak = 5.6175 V/m for LTE 2600 (9.15% of its applicable limit), well below the reference level.
3.2. RF Exposure Levels by Frequency Band
Table 4 presents full descriptive statistics (
Eavg, σ,
Emin, 25th, 50th, 75th, 95th percentiles, and
Emax) of electric field values
E (V/m) by frequency band and time group (WE/WD). Statistically significant differences (Mann–Whitney U,
p < 0.05) are noted.
The LTE 800 band records the highest mean exposure (
Eavg = 1.366–1.546 V/m), consistent with its role as the primary macro coverage layer and the high BTS B20 density in the study area. This exceeds the 0.08–0.35 V/m reported by Loizeau et al. [
17] for Swiss urban environments and the 0.05–0.28 V/m reported by Rufo-Pérez et al. [
20] for Spain, placing Tirana at the higher end of documented European values. Beyond local BTS density, part of this gap may also be methodological: the RSS composite used here sums all co-located carriers within each band at a given location, whereas some cited studies report narrower per-operator or per-channel values, which would tend to yield lower composite field levels for a physically comparable exposure environment. For transparency,
Table S1 (Supplementary).
Mid- and high-frequency bands (LTE 1800-5G NR 3600) exhibited lower pooled mean values (Eavg = 0.687–1.169 V/m). The comparatively large variability of LTE 2600 and 5G NR 3600 is compatible with spatially heterogeneous antenna geometry, traffic-dependent scheduling, and measurement location. Because the campaign did not include protocol decoding or matched repeated locations, the observed variability cannot be uniquely attributed to TDD beamforming or network load.
3.3. Weekday-Weekend Comparison: Statistical Tests and Mean Field Deviations
Table 5 and
Table 6 present the pooled, unadjusted WD-WE comparison for all six bands. Shapiro–Wilk testing indicated non-normality, supporting Mann–Whitney U tests for this descriptive first-stage analysis. BH-FDR-corrected
p-values and effect sizes are reported transparently, but statistical significance in these pooled tests does not control for site composition, time window, or spatial clustering; the adjusted sensitivity model is therefore treated as the principal evidence for temporal interpretation.
The unadjusted analysis showed higher weekday values in all six bands, but the unequal site composition means that these pooled differences cannot be attributed solely to network traffic. In the site- and time-adjusted log-linear sensitivity model with campaign-day-clustered standard errors, statistical evidence at p < 0.05 remained for the 900 MHz mobile band, 2100 MHz mobile band, LTE 2600, and 5G NR 3600. The adjusted estimates for all bands are reported regardless of significance. Site-stratified results showed that effect direction and magnitude varied between KT and MKA, confirming that spatial context contributes materially to the pooled weekday-weekend contrast. Accordingly, the temporal findings are interpreted as associations within this sampling campaign, not causal weekday effects.
The pooled LTE 800 (+13.19%) and 900 MHz (+14.46%) contrasts illustrate why adjustment is necessary: the LTE 800 adjusted estimate was smaller and not statistically significant, whereas the 900 MHz estimate remained borderline significant. These patterns may reflect a combination of coverage-layer transmission, site composition, and campaign timing and should not be assigned solely to traffic loading.
The 5G NR 3600 mean levels reported here (
Eavg = 1.006–1.238 V/m,
Table 6) are markedly higher than the <0.5 V/m typically reported by Deprez et al. [
25] across four European countries. This difference in absolute levels does not, by itself, indicate any departure from regulatory compliance: both studies report exposure well within the ICNIRP 2020 reference levels. This gap is best explained methodologically rather than physically: Deprez et al. [
25] used SS-RSRP reference-signal extrapolation, a code-power-based approach that estimates maximum theoretical exposure from a small, standardized signal fraction and tends to under-represent field levels during moderate-to-high traffic, whereas the present study used direct 360 s RSS time-averaging that captures full band occupancy, including active downlink slots, in line with recent multi-method intercomparisons of downlink RF-EMF exposure assessment in urban environments [
34,
35]. The two Tirana squares were also deliberately selected as high-density nodes close to multiple macro-cell sites, whereas the four-country survey averaged exposure across a broader, more heterogeneous set of microenvironments. Site density, antenna proximity, and measurement/extrapolation methodology therefore account for the gap without implying any departure from ICNIRP compliance, which both studies confirm.
The present 700 MHz–3.8 GHz measurements do not characterize millimeter-wave 5G. At frequencies above approximately 24 GHz, higher free-space loss, stronger sensitivity to blockage and building-entry loss, and frequency-dependent gaseous attenuation generally reduce coverage distance, while narrow beamforming and denser small-cell deployment may create highly localized, time-varying maxima. Thus, the present spatial patterns cannot be extrapolated to mmWave systems. A dedicated campaign would require suitable mmWave instrumentation, finer spatial sampling, beam- and traffic-aware temporal measurements, and power-density/local-exposure metrics consistent with the applicable high-frequency guidelines [
36,
37].
3.4. Diurnal Analysis: Temporal Profile and Statistical Tests
Table 7 presents mean electric field values (
Eavg) across four diurnal time windows, Morning (08:00–10:00), Late Morning (10:00–13:00), Noon (13:00–16:00), and Afternoon (16:00–18:00), for each frequency band.
All bands exhibit progressive increases during active hours, with minimum levels in the morning (08:00–10:00), consistent with the diurnal cycle of mobile network traffic. LTE 800 peaks at Late Morning (+28.93%), reflecting the mid-morning surge in 4G traffic. 900 MHz mobile band peaks during Late Morning (+15.29%), consistent with its voice-dominant traffic profile. Mid-capacity bands (LTE 1800, 2100 MHz mobile bands) peak in the Afternoon (+30.95% and +31.89%, respectively), consistent with increased loading during the afternoon urban commute. LTE 2600 also peaks in the Afternoon (+36.39%), reflecting progressive saturation of this high-capacity hotspot band throughout the working day.
The 5G NR 3600 band exhibits a progressive diurnal increase (Late Morning: +13.88%; Noon: +20.23%; Afternoon: +25.76%). Its Emax/Eact ratio of 6.8×, compared with 1.7–3.5× in the other bands, is consistent with burst-like, duty-cycle-dependent transmission such as TDD downlink operation. However, a peak-to-average ratio is not protocol-specific: traffic bursts, beam scheduling, and measurement settings can produce similar behavior. Because no slot-resolved or protocol-decoded temporal trace was recorded, the manuscript does not claim confirmation of TDD behavior; such attribution requires dedicated time-domain evidence.
Kruskal–Wallis
H-test results for the four diurnal windows are summarized in
Table 8. Four of six bands showed statistically significant diurnal variation: LTE 1800 (
H = 16.463,
p = 0.0009, η
2 = 0.0806, medium effect), 5G NR 3600 (
H = 14.026,
p = 0.0029, η
2 = 0.066), 2100 MHz mobile band (
H = 9.488,
p = 0.0235), and LTE 2600 (
H = 9.750,
p = 0.0208). LTE 800 and 900 MHz mobile bands showed no significant diurnal variation (
p > 0.17), suggesting coverage-layer transmissions are time-invariant.
Post hoc pairwise Mann–Whitney tests with BH-FDR correction identified six significant window pairs across four bands (
Table 9). The dominant contrast is Morning (08:00–10:00) vs. Afternoon (16:00–18:00), present in all four significant bands, with the largest effect in LTE 1800 (
r = 0.401, Afternoon median 47.4% higher than Morning). 5G NR 3600 showed a progressive monotonic increase from 0.863 V/m (Morning) to 1.132 V/m (Afternoon), with two significant contrasts (Morning vs. Noon and Morning vs. Afternoon; the Morning vs. Late Morning contrast is no longer significant after correction,
padj = 0.056).
3.5. Exposure Levels and Compliance with ICNIRP 2020 Limits
Table 10 presents the maximum measured values for each band and their corresponding percentage of the ICNIRP 2020 reference levels. All measured
Eact values are well below the applicable limits.
The highest recorded peak time-averaged (360 s RSS) value,
Eact,peak = 5.6175 V/m (LTE 2600), corresponds to 9.15% of the ICNIRP 2020 limit of 61.40 V/m; peak values for LTE 800 (4.0133 V/m) and 5G NR 3600 (2.8807 V/m) remain similarly well below their respective limits (39.52 V/m and 61.40 V/m). This study-wide absolute maximum was recorded at a single measurement point in the central MKA cluster during a weekend afternoon session and represents a localized spatial maximum (band-wise
p95 = 1.79 V/m) rather than a systematic feature of the exposure distribution. The multi-frequency compliance quotient
QTh = 0.0269 [Equation (2)] confirms full regulatory compliance. Karl Topia and Mustafa Kemal Atatürk squares are classified as very-low-exposure environments, consistent with European studies [
16,
17,
18,
20,
35], with Tyrakis et al. [
11] (0.1–4.5% of the ICNIRP limit for Greek urban areas), and with the more recent Greek bystander survey of Tyrakis et al. [
38,
39] during active 5G rollout, which reports comparably low margins and supports the generality of these findings beyond the early-deployment stage. Nevertheless, continued monitoring remains important for sensitive population groups and in anticipation of 5G NR SA expansion, where exposure in the 3.4–3.8 GHz band is expected to increase [
25,
26], particularly for individuals in close proximity to base stations [
39].
For an equivalent plane wave in free space, power density can be estimated as Seq =
E2/377. Applied to the band-wise
Eact peaks, Seq ranges from 0.00713 W/m
2 (2100 MHz) to 0.08368 W/m
2 (2600 MHz) (
Table 11). These values remain below the selected ICNIRP, US FCC, and Indian DoT public-reference values. India’s mobile-base-station power-density limits are one-tenth of the ICNIRP values, whereas the FCC uses its own frequency-dependent limits and averaging provisions; therefore, comparisons across frameworks must retain the applicable frequency, averaging time, spatial averaging, and legal context [
1,
40,
41].
Table 12 reports the corresponding weekday–weekend sensitivity analysis discussed in
Section 3.3 above, adjusted for study site and diurnal window with campaign-day-clustered standard errors.
3.6. Spatial Distribution and GIS Mapping
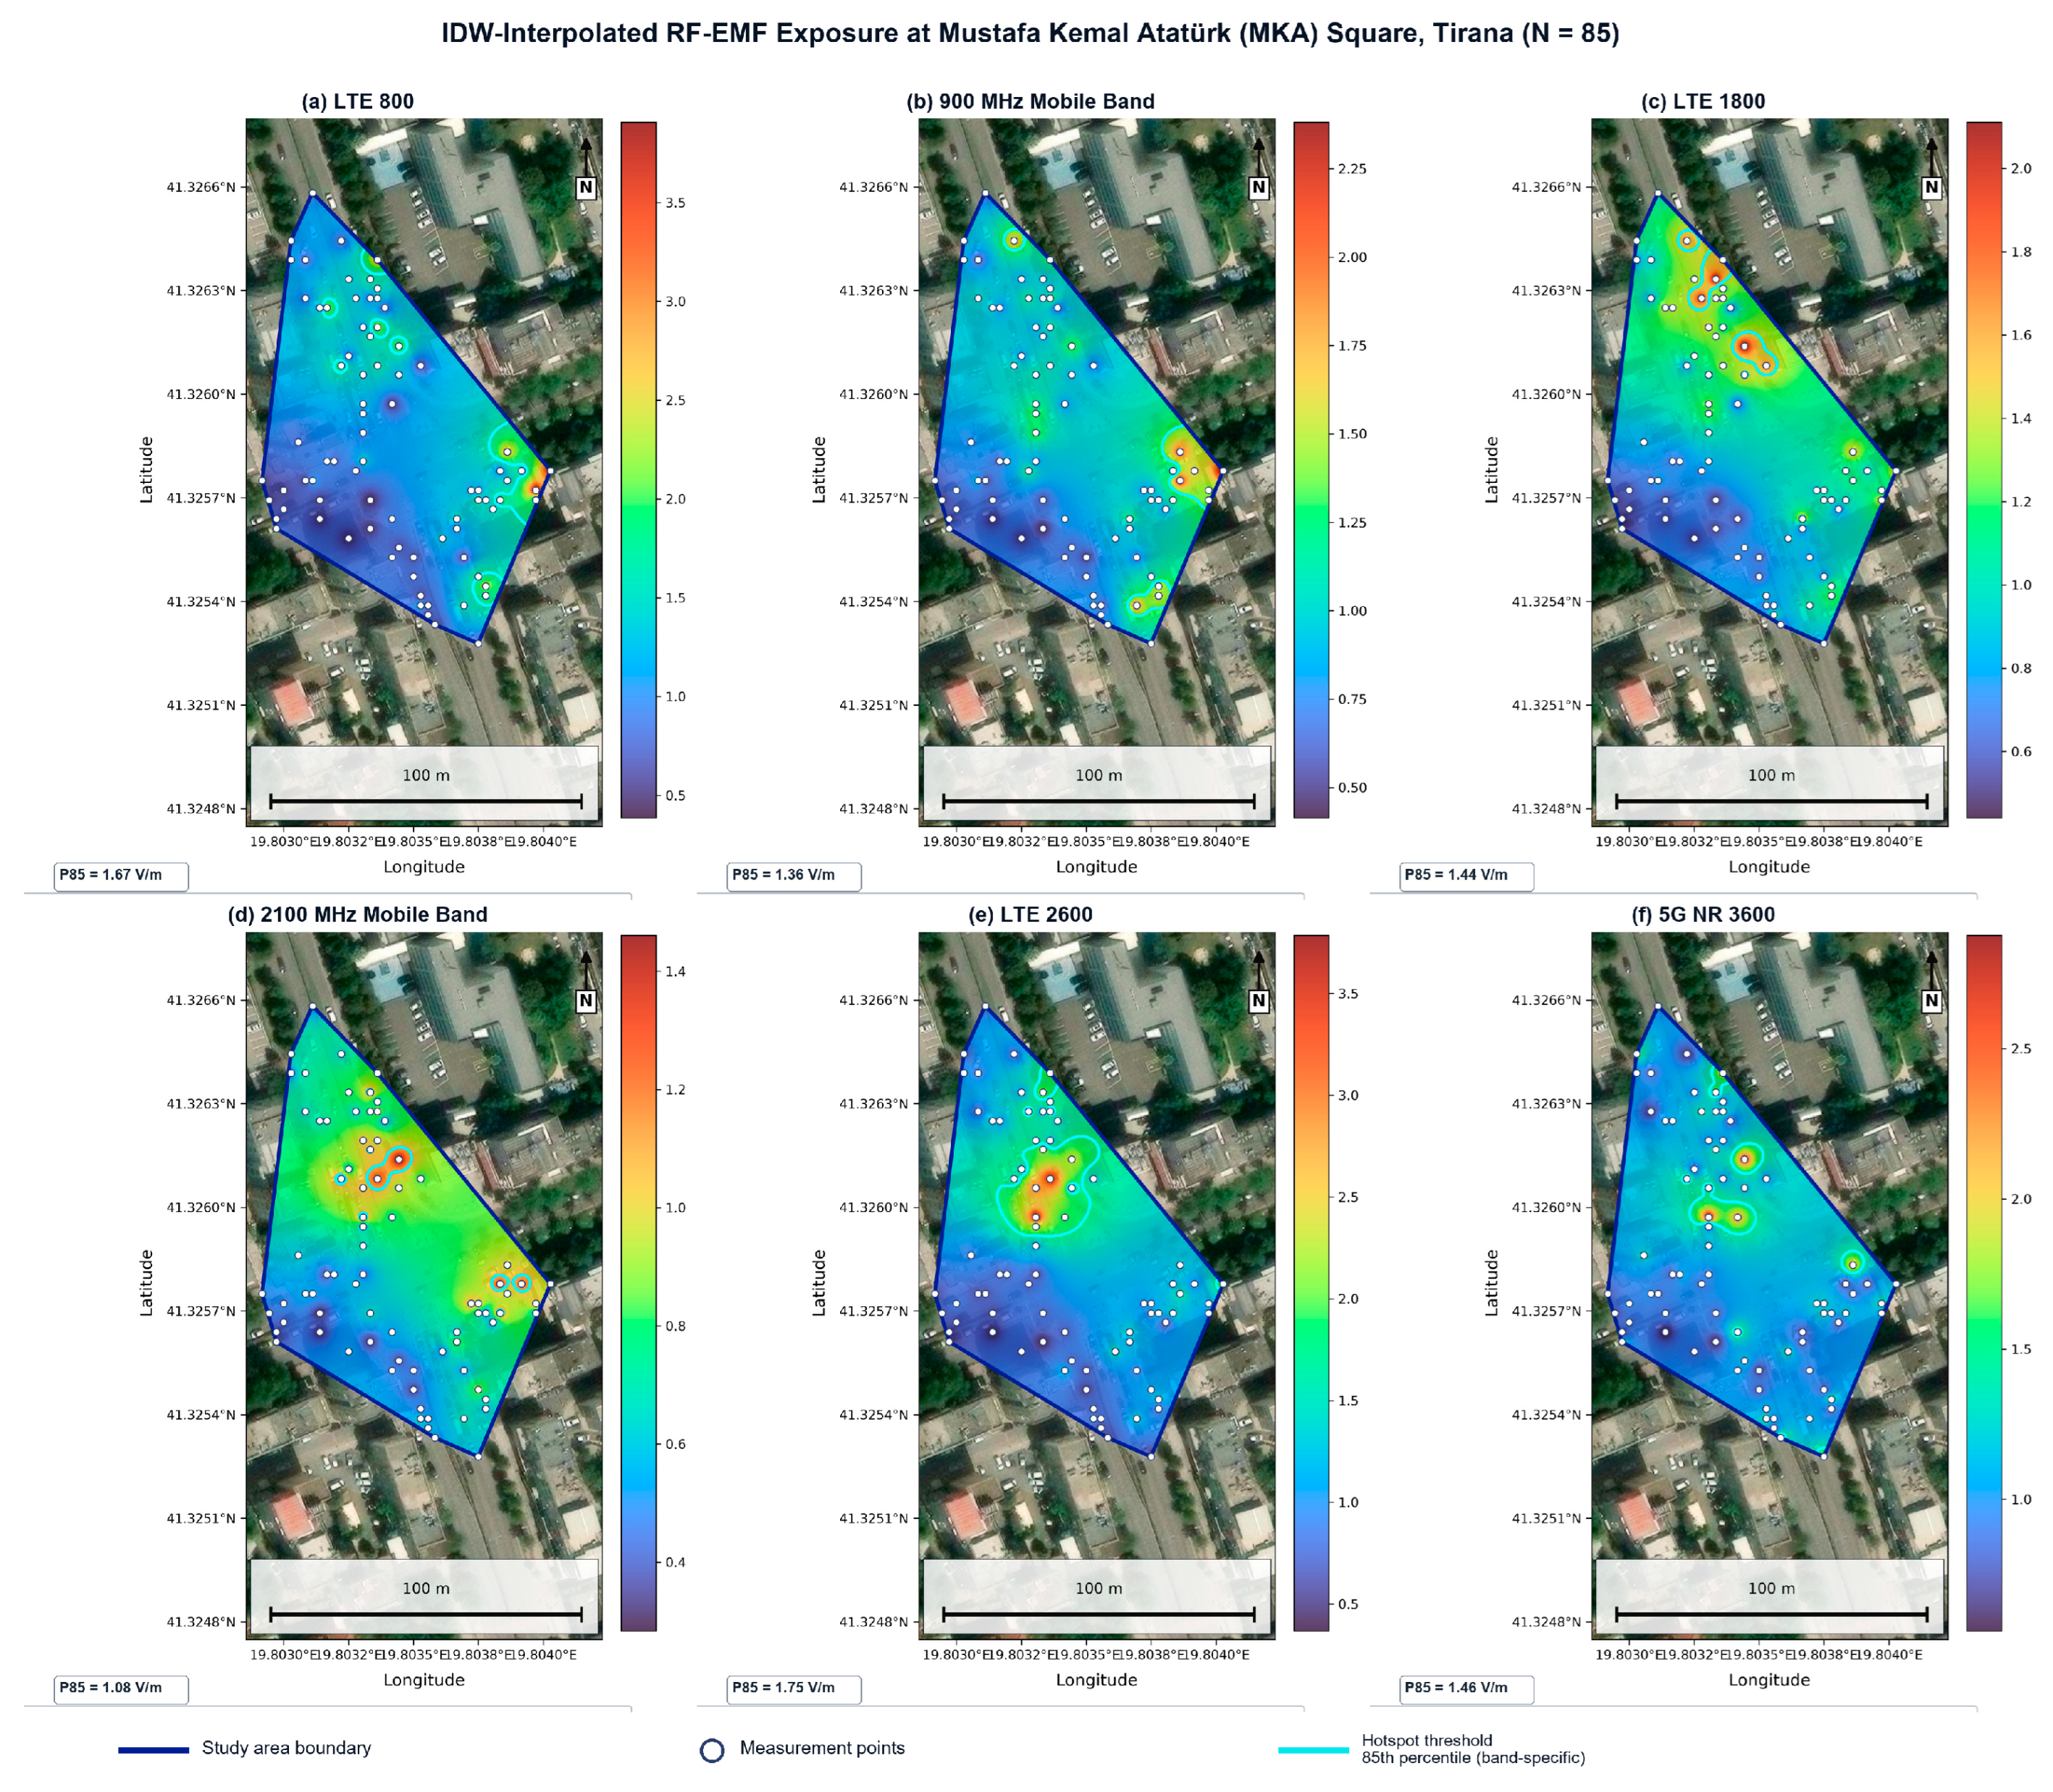
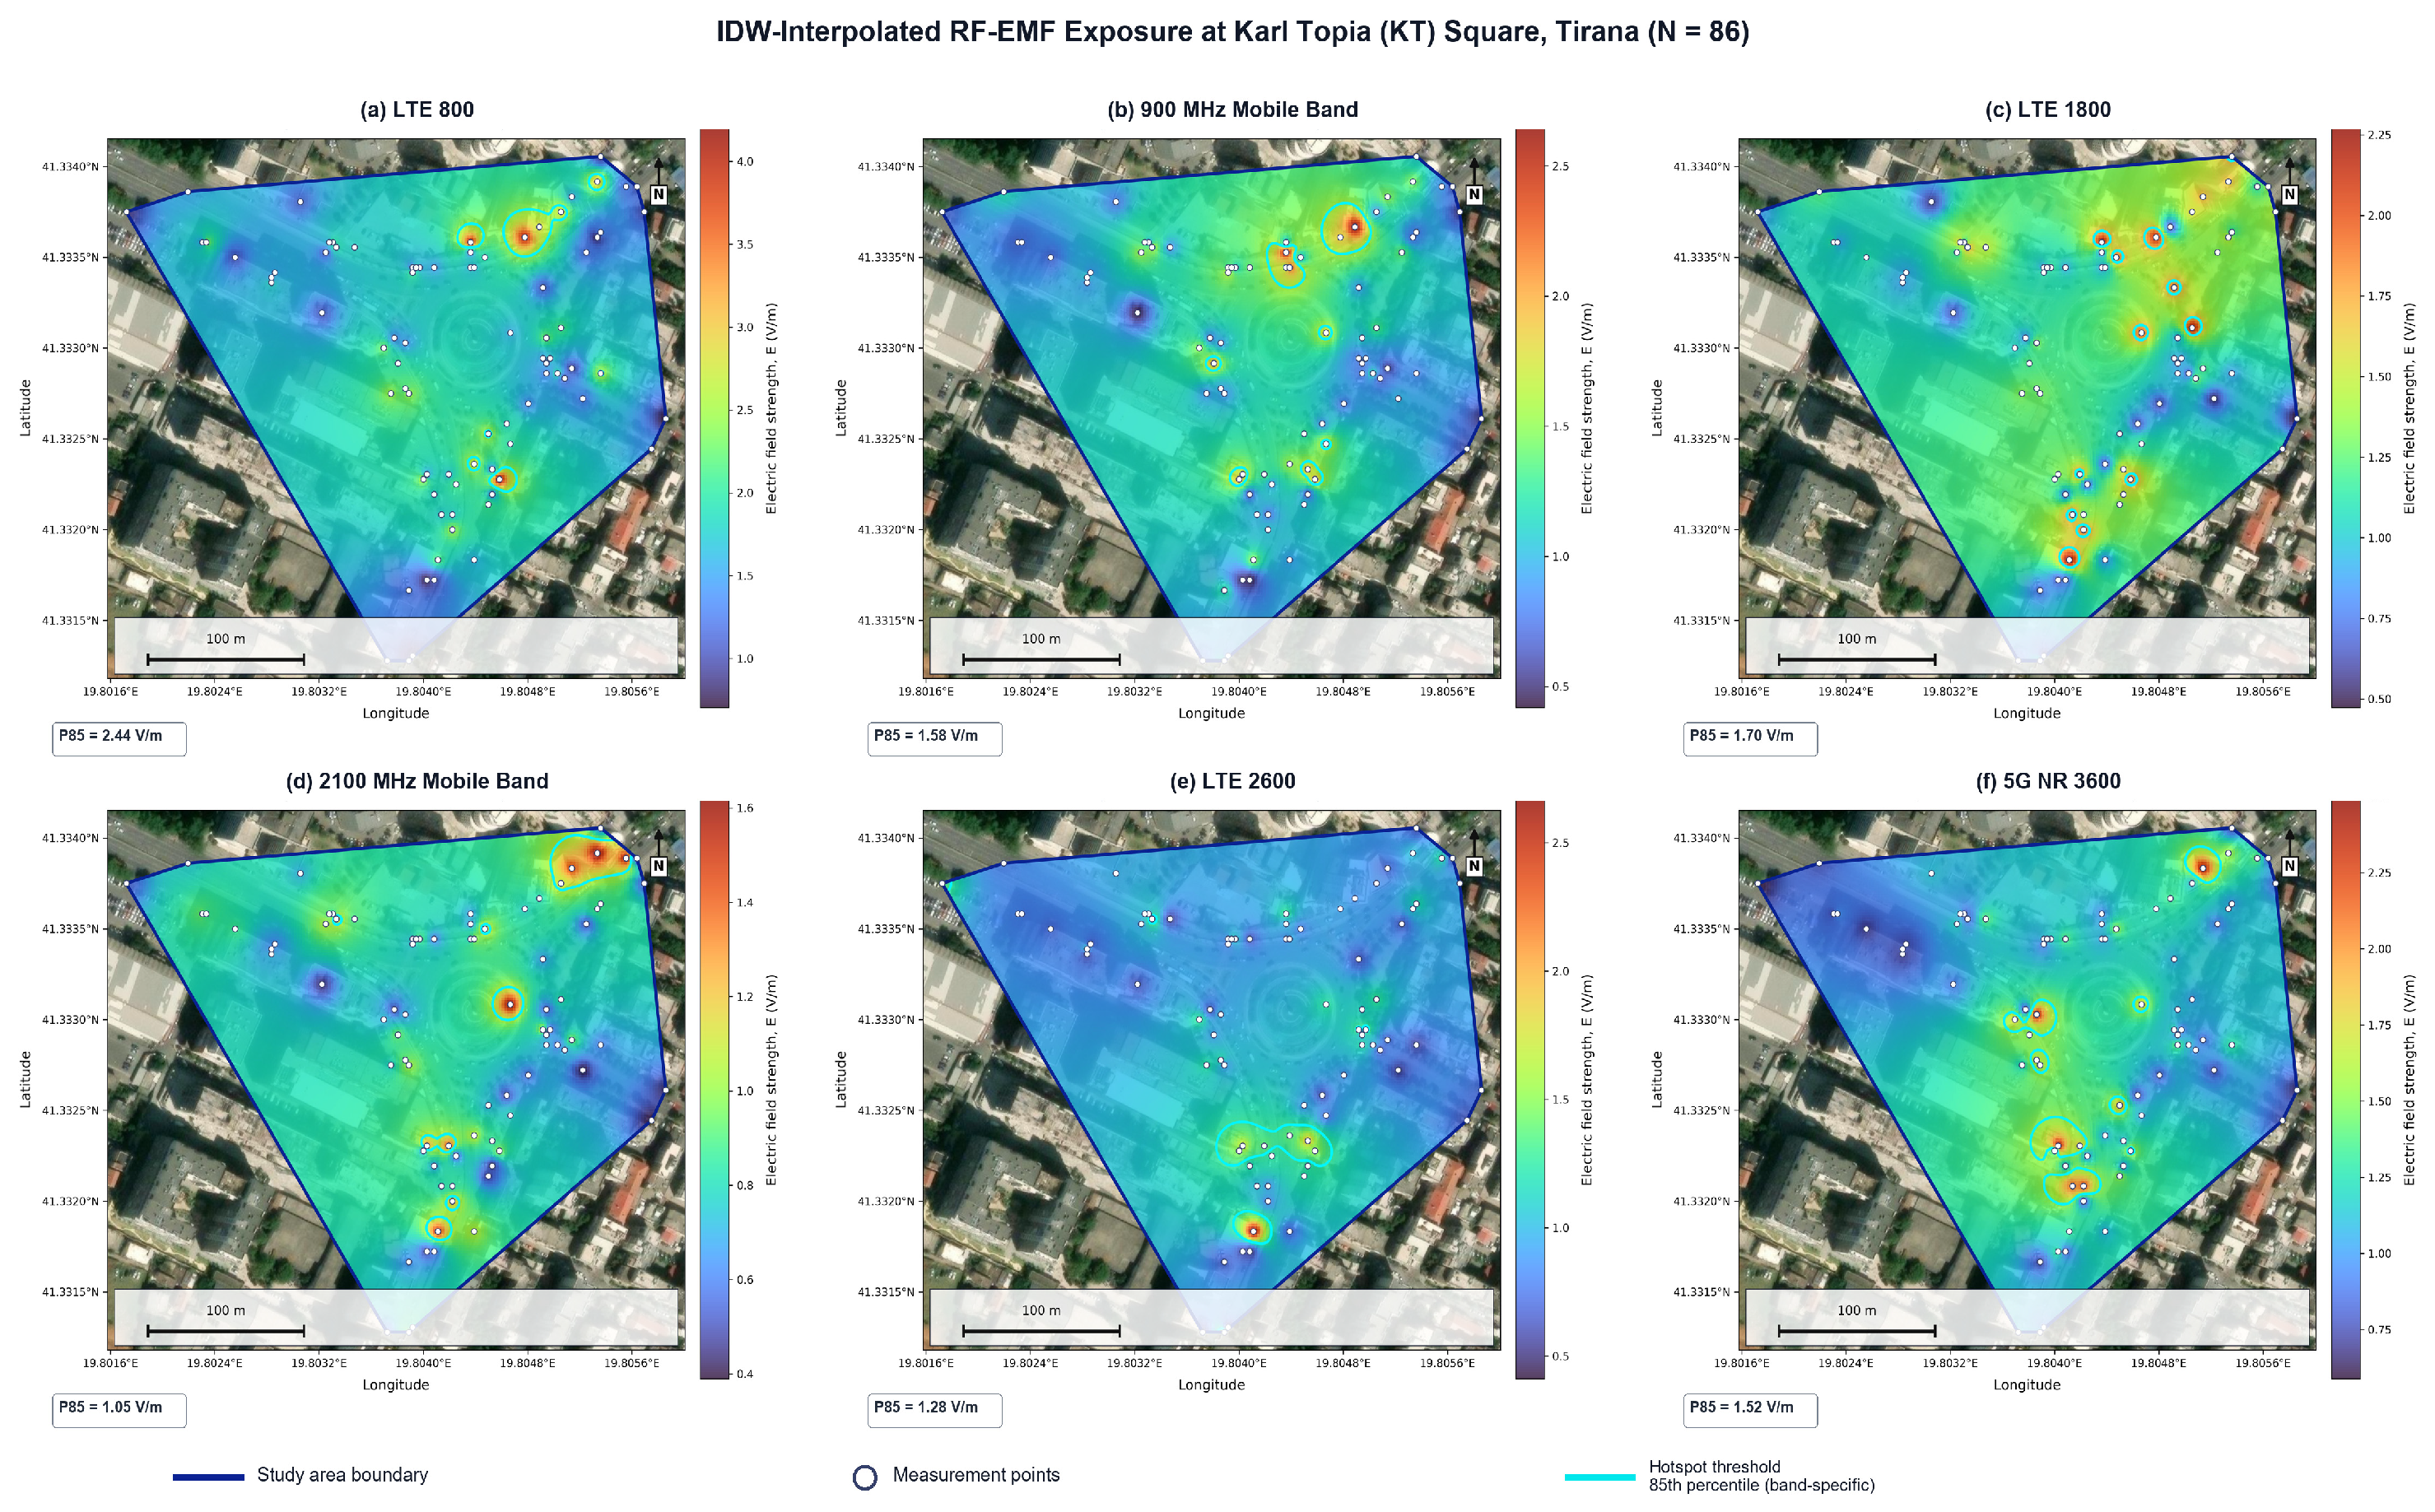
Figure 3 and
Figure 4 present the spatial distribution of RF-EMF exposure separately for the two study sites, Mustafa Kemal Atatürk (MKA,
N = 85) and Karl Topia (KT,
N = 86) squares, using each measurement point’s original WGS84 geographic coordinates (latitude/longitude, EPSG:4326) rather than a shared or anonymized coordinate frame. Because both squares are already identified by name throughout this article and their relative location is shown in
Figure 1, mapping each site independently in its true geographic frame avoids the geometric distortion that would result from combining two spatially separated clusters onto one shared local axis, and allows the spatial pattern within each square to be read directly against its own footprint.
IDW interpolation (power = 2) was performed independently for each square and bounded by its sampling convex hull, so the sites were never interpolated across their separation. The P85 contour was retained as a descriptive screening threshold, chosen before mapping to identify an upper-tail area while retaining enough observations for a spatially interpretable core (approximately 13 points per site-band). It is not a biological or regulatory threshold. Sensitivity analyses at P75, P90, and P95 are reported in
Table 13; all hotspot language refers to relatively high-exposure areas within a site-band distribution, not exceedance of an exposure guideline.
The interpolated maps reveal substantial spatial heterogeneity within each square and clear differences between the two sites. At MKA, mean band levels range from 0.71 V/m (2100 MHz mobile band) to 1.21 V/m (LTE 800), with LTE 2600 recording the highest single-point maximum (5.62 V/m) and its 85th-percentile hotspot threshold (1.75 V/m) concentrated near the eastern edge of the sampling cluster (
Figure 3). At KT, mean levels are generally higher for the lower-frequency layers, LTE 800 (1.69 V/m), 900 MHz mobile band (1.13 V/m), and LTE 1800 (1.20 V/m), consistent with a denser or closer macro-cell configuration at this node, while 2100 MHz mobile band (0.81 V/m) and LTE 2600 (0.99 V/m) remain comparatively modest; the KT LTE 800 hotspot threshold (2.44 V/m) is the highest 85th-percentile value recorded at either site (
Figure 4). In both squares, LTE 800 and LTE 1800 exhibit broader regions of elevated electric field strength, consistent with their macro-coverage role, whereas the 900 MHz mobile band, 2100 MHz mobile band, LTE 2600, and 5G NR 3600 display more localized high-field regions, reflecting the influence of site-specific propagation conditions, antenna radiation characteristics, and the surrounding urban morphology.
For each square, the cumulative RF-EMF exposure, computed as the root-sum-square (RSS) of the six band-level fields, identifies areas where the combined contribution of multiple wireless services results in increased overall exposure. In both MKA and KT, localized exposure maxima are evident, but the spatial distribution remains heterogeneous across each site, confirming that total RF-EMF levels are governed by the superposition of multiple coexisting communication systems rather than by a single dominant source or band.
For each site-band, the P75, P85, P90, and P95 exceedance sets contained 22, 13, 9, and 5 measured points, respectively. Because these sets are necessarily nested, stability was assessed using centroid displacement relative to P85. Across all band-site combinations, the maximum displacement was 53.4 m (median 17.9 m). Thus, the broad hotspot cores were not created solely by the P85 choice, although the number and boundary of flagged points remain threshold-dependent.
3.7. Limitations
This study has the following limitations: (i) measurements were limited to outdoor conditions at 1.5 m; indoor exposure was not assessed; (ii) the two purposively selected squares are not a statistical sample of Tirana, Albania, or the Balkan region; (iii) weekday and weekend sessions were taken mostly at different coordinates and were unequally distributed between sites, so adjusted and stratified analyses reduce but do not eliminate spatial confounding; (iv) eight daytime campaign days cannot represent full weekly, nocturnal, or seasonal variability; (v) the 360 s average cannot resolve sub-second scheduling, and the Emax/Eact ratio alone cannot confirm TDD; (vi) the campaign did not cover mmWave 5G; (vii) RSS aggregation, bandwidth, detector, sampling strategy, and exposure metric constrain direct comparison with other studies; and (viii) hotspot boundaries depend on interpolation and percentile choice, although P75–P95 sensitivity was examined.
(ix) A leave-one-out cross-validation (LOOCV) was performed for each band at each square using IDW (power = 2) and linear interpolation (SciPy griddata). Linear interpolation was undefined for withheld edge points outside the reduced convex hull (7 of 86 at KT and 8 of 85 at MKA), whereas IDW predicted all withheld points. Averaged across the six bands, LOOCV yielded RMSE = 0.51 V/m (NRMSE = 23.4%) for linear interpolation versus RMSE = 0.46 V/m (NRMSE = 21.2%) for IDW at KT, and RMSE = 0.50 V/m (NRMSE = 20.0%) versus RMSE = 0.46 V/m (NRMSE = 18.2%) for IDW at MKA (
Table S2). IDW produced the lower RMSE in 11 of 12 band × square comparisons and was therefore adopted for the revised primary maps. The modest pooled NRMSE improvement (21.7% to 19.7%) also shows that the broad spatial interpretation is not dependent on a single interpolation algorithm. A full comparison with variogram-based kriging, including model selection and LOOCV, is planned for a future campaign with denser and repeated spatial sampling. (x) Cross-study comparisons should be interpreted cautiously because measurement protocols differ. (xi) Because temporal groups contain different spatial points and unequal site representation, temporal contrasts may partly reflect spatial composition; repeated measurements at fixed points are planned.
4. Conclusions
This study provides a site-specific spatial and temporal characterization of multi-band RF-EMF exposure (700 MHz–3.8 GHz) at two central urban squares in Tirana. It establishes an initial reference for these surveyed microenvironments and demonstrates a transferable selective-measurement/Python/GIS workflow; it should not be interpreted as a national Albanian exposure baseline. Four main conclusions are drawn.
- (i)
Spatial heterogeneity: RF-EMF exposure is highly non-uniform and frequency-dependent, consistent with the free-space propagation and urban multipath physics outlined in
Section 1. Low-frequency bands (LTE 800, 900 MHz mobile band) produce spatially uniform background exposure, whereas high-frequency bands (LTE 2600, 5G NR 3600) generate highly localized hotspots in proximity to BTSs, reflecting the shorter effective propagation range and narrower beamforming footprint physically associated with higher carrier frequencies. LTE 800 mean levels (
Eavg = 1.366–1.546 V/m) exceed the typical European range of 0.08–0.35 V/m [
17,
20], likely reflecting the high BTS density at this urban node.
- (ii)
Weekday-weekend association: Pooled unadjusted values were higher on weekdays in all six bands, but site-stratified and site/time-adjusted analyses showed that part of this contrast reflects spatial composition and campaign timing. The results support a weekday association for selected bands within the sampled campaign, not a universal or causal network-traffic effect.
- (iii)
Diurnal 5G NR pattern: The 3600 MHz band increased from Morning to Afternoon (+25.76%) and showed an Emax/Eact ratio of 6.8×. This peak-to-average behavior is consistent with burst-like TDD characteristics but is not, by itself, protocol-level confirmation. Slot-resolved measurements are needed to attribute it specifically to the TDD frame structure.
- (iv)
Regulatory context: All measured values (
Eact,peak = 5.6175 V/m for LTE 2600;
QTh = 0.0269 < 1) were below the ICNIRP 2020 reference levels and also below the contextual FCC and Indian DoT power-density values considered in
Table 11. This compliance result is scientifically and regulatorily useful even when exposure is low: it documents actual conditions at highly occupied sites and provides a benchmark for future network changes. Compliance with exposure limits, however, is not equivalent to proving or disproving possible long-term health effects below those limits.
The multi-band Python/GIS workflow is reproducible and transferable, but the empirical results are site- and protocol-specific. The present data constitute an initial reference for two central Tirana squares under daytime outdoor conditions. Future work should use repeated measurements at matched coordinates across day types, balanced site sampling, more campaign days and seasons, spatial or mixed-effects models, slot-resolved 5G measurements, and harmonized cross-study protocols.