Article

A Machine Learning-Powered Solution for Safe Autonomous Robotic Ground Navigation in Cyber-Contested Environments

Electrical and Computer Engineering Department, Purdue University Northwest, Hammond, IN 46323, USA
*
Author to whom correspondence should be addressed.
Appl. Sci. 2026, 16(15), 7666; https://doi.org/10.3390/app16157666
Submission received: 1 July 2026 / Revised: 28 July 2026 / Accepted: 29 July 2026 / Published: 2 August 2026

Featured Applications

Detection and classification of cyberattacks targeting autonomous ground vehicles, particularly those with fixed-route navigation, find applications in public transportations.

Abstract

In this article, machine learning (ML) is proposed as a solution to detect and classify false message injection attacks in autonomous ground navigation. First, multiple trajectories are designed and simulated to collect authentic feature samples offered by the odometry and inertial measurement unit (IMU) of an autonomous ground vehicle (UGV). Then, a dataset comprising these samples and other injected samples that simulate two cyberattacks, namely path modification (PM) and velocity drift (VD), is created to train, validate, and benchmark various ML classification models. These include decision tree (DT), k-nearest neighbors (KNN), multi-layer perceptron (MLP), random forest (RF), and support vector machine (SVM). The optimum classification model is experimentally evaluated using a UGV platform, and results suggest that the proposed solution allows the detection of authentic and attacked messages with more than 98% average accuracy and sub-millisecond prediction time. Thus, this solution is ideal for real-time classification, especially in fixed-route applications, e.g., public transportation.

1. Introduction

The adoption of autonomous unmanned ground vehicles (UGVs) has been witnessing exponential growth recently for their benefits in a multitude of applications, including scientific expeditions, search and rescue missions, exploring hard-to-reach terrains, and the auto industry [1,2,3,4,5,6,7,8]. This growth had been backed by a market size of USD 3.12B in 2025, which is projected to reach USD 79.83B by 2034 [9]. This increase in market size is attributed to the continued demand for automation and rapid advancement in enabling software and hardware technologies (e.g., navigation protocols, sensory equipment). Therefore, state-of-the-art research has dedicated significant attention to promoting autonomous navigation, especially in dynamic environments, with the use of data fusion techniques [10,11,12,13], collaborative vehicle-to-vehicle (V2V) networking [14,15,16,17], route optimization algorithms [18,19,20,21], and most recently, artificial intelligence (AI) [22,23,24,25]. Fusion techniques focus on multimodal sensor integration strategies to provide accurate environmental perception and localization, enabling vehicles to navigate complex landscapes while minimizing collisions. On the other hand, V2V networking facilitates cooperative perception and decentralized coordination to allow real-time data exchange that offers navigation within a network of autonomous vehicles. Furthermore, bio-inspired optimization algorithms use nature-mimicking mechanisms, e.g., swarm intelligence, to address multi-objective navigation challenges that achieve enhanced navigation efficiency and adaptability in highly dynamic environments. Lastly, AI-driven navigation leverages machine learning (ML), deep learning (DL), and reinforcement learning to enable adaptive autonomy via continuous policy optimizations.
Although much attention has been paid to continuously refining the accuracy and trustworthiness of autonomous navigation solutions, fewer research efforts have addressed the associated cybersecurity concerns. These concerns stem from the proneness of UGVs to cyberattacks at the physical layer, e.g., denial-of-service (DoS), location spoofing, and false message injections. Such attacks potentially result in irreversible consequences featuring compromising sensitive data, capturing payloads, damaging properties, or worse, leading to human casualties. For instance, the vulnerabilities of a self-driving vehicle, e.g., Tesla car, was demonstrated in [26,27] by jeopardizing its engine control unit. Moreover, in [28,29], counterfeit satellite signals were subtly broadcasted to drastically alter a vehicle’s perceived coordinates, forcing it to deviate from its intended path or enter hazardous zones. The injection of false sensory data or application of adversarial perturbations to deceive perception systems into making incorrect decisions, e.g., emergency braking or failing to stop at a traffic sign, was presented in [30]. In addition, unauthorized steering, acceleration, or total remote takeover via intercepting and maliciously modifying the control instructions sent to a vehicle was showcased in [31,32]. Also, interference, or network flooding, was used to block critical navigation-related communications, leading to connectivity loss or remote disabling of an entire vehicle fleet [33]. Hence, developing cybersecurity solutions to mitigate attacks targeting autonomous UGV navigation is of utmost importance. These solutions must not be invasive to existing standards, while at the same time be compatible with legacy platforms. They must also introduce minimum to no modifications to the readily available hardware (e.g., antennas, cameras, radars).
Recent UGV security approaches exploited proportional-integral observers and residual analysis to identify malicious data injections [34,35,36,37]. While these approaches provide low latency, they are frequently constrained by their high sensitivity to environmental noise and abrupt changes in kinematics. To mitigate these constraints, hardware and signal integrity approaches were developed to leverage visual-inertial odometry as a trust anchor or to monitor signal characteristics, e.g., Doppler shifts and angle of arrival [38,39,40,41]. However, they often suffer from cumulative sensor drift during extended missions and impose significant computational overhead. Other approaches introduced architectures for systematically reviewing simulated attacks or historical attack records to establish defense guidelines [42,43,44,45]. However, because these approaches primarily depend on attack records, they often struggle to adapt to sophisticated, evolving navigation threats. This has led to data-driven approaches, featuring network-based intrusion detection with DL to identify DoS and man-in-the-middle attacks [46,47,48,49]. Nevertheless, such approaches often overlook subtle navigational deviations. Temporal state anomaly detection approaches with sequential modeling, e.g., long short-term memory encoding and online learning, were explored to identify sensor tampering and location manipulation [50,51,52,53]. Yet, existing detection models struggle to distinguish between physical fluctuations and malicious injections in complex navigation scenarios, such as sharp turns or rapid speed changes. Furthermore, given the challenges of background noise within robotic sensors, maintaining the robustness in distinguishing between authentic navigation and anomalous state transitions remains a critical hurdle. The solution proposed herein presents an approach to detect and classify malicious injection attacks, specifically designed for UGVs on fixed routes, e.g., public transportations.
Under normal operating conditions, a rigid physical consistency and mathematical coupling exist between wheel-derived odometry and the vehicle’s inertial responses. When cyberattacks or anomalies inject erroneous values into the odometry, e.g., fake linear velocities or fabricated steering angles, the untampered inertial measurement unit (IMU) data continue to reflect the vehicle’s authentic physical kinematics. By evaluating the instantaneous correlations between these two heterogeneous streams, i.e., odometry and IMU, ML can promptly and efficiently detect the instances where odometry data violate the established physical coupling boundaries. This targeted interlocking strategy enables the reliable isolation of odometry tampering without relying on complex temporal filtering, ensuring a high-precision and sub-millisecond navigation verification. The proposed solution differs from those reported in literature in the following aspects:
  • Unlike multi-sensor fusion approaches that necessitate added hardware, e.g., antenna arrays or external infrastructure [10,11], the proposed solution leverages existing onboard telemetry to provide reliable detection of malicious injections.
  • The proposed solution maintains protocol integrity and compatibility with legacy platforms, allowing for convenient integration with established robotic navigation stacks. In contrast, cooperative approaches or those comprising architectural overhauls require continuous network-wide database synchronization or a fundamental redesign of their core communication logic, both of which pose prohibitive implementation barriers for standalone or legacy systems [17,42].
  • The proposed solution is independent of weather conditions as it uses kinematic telemetry data. Hence, it maintains consistent anomaly detection performance as compared to perception-based approaches with visual or LiDAR data, which impacts their precision in degraded conditions, e.g., fog, rain, or low-light [11,13].
  • Compared to AI-based temporal and vision-centric approaches, the proposed solution offers a high computational efficiency and low overhead, ensuring sub-millisecond real-time prediction without high-end computing resources [23,25].
  • The proposed solution utilizes a systematic and lightweight data acquisition and control procedure to enable precise logging of internal sensor states during autonomous navigation. It also facilitates controlled injections of malicious cyberattacks, ensuring rigorous experimentations and reproducibility. On the other hand, other approaches were restricted by third-party datasets [46,48].
  • Lastly, all resources developed in this work (i.e., training and validation datasets, classification models) are made publicly accessible to serve as a standardized benchmark for future UGV navigation security research [54].
This article is organized as follows: Section 2 describes the setup for extracting telemetry feature samples (with and without cyberattacks) and creating the training dataset. Section 3 details the development and comparative analysis of multiple AI-based anomaly detection and classification models. Section 4 elaborates the experiments for validating the optimum model in real-time. Finally, conclusions and future work are offered in Section 5.

2. Setup for Extracting Feature Samples and Creating Dataset

In the feature extraction setup elaborated herein, a four-wheeled robot from Clearpath Robotics is exploited, which is equipped with a six-degrees-of-freedom IMU for linear and angular motion sensing, along with wheel encoders for obtaining odometry data [55,56]. Four distinct routes are configured with the high-fidelity Gazebo simulation tool [57]. It enables visual simulations and incorporates complex multi-modal noise characteristics, e.g., additive white Gaussian noise, into IMU data. It also introduces quantization errors to the encoders, creating a realistic setup for extracting features.

2.1. Preliminaries for Creating Autonomous Navigation

A controller algorithm for mission-driven autonomous navigation, shown in Figure 1, is used within the Robot Operating System 2 (ROS2) platform. It is built as a sequential state machine to execute heterogeneous navigational primitives, including linear displacement, reactive obstacle avoidance, and precise heading transitions. It operates at a 50-Hz sampling rate, i.e., 20-ms per sample, and data acquisition via “Idle”, “Running”, and “Done” phases. During initialization in the Idle phase, the controller establishes a communication node with the UGV via a namespace-based subscription mechanism to capture filtered odometry, raw IMU data, and LiDAR scans. To maintain data stability, a three-second buffer, i.e., 150 samples, is enforced before the mission begins, followed by ½-second intervals i.e., 25 samples, between navigation tasks to allow Gazebo and sensor biases to reach steady state and prevent data spikes. Upon transitioning to the Running phase, the controller retrieves navigation primitives from a predefined queue and executes the logic for each task. Once all tasks are finalized, the controller enters the Done phase to terminate the mission by canceling the control timer, closing the data repository, and shutting down the node.
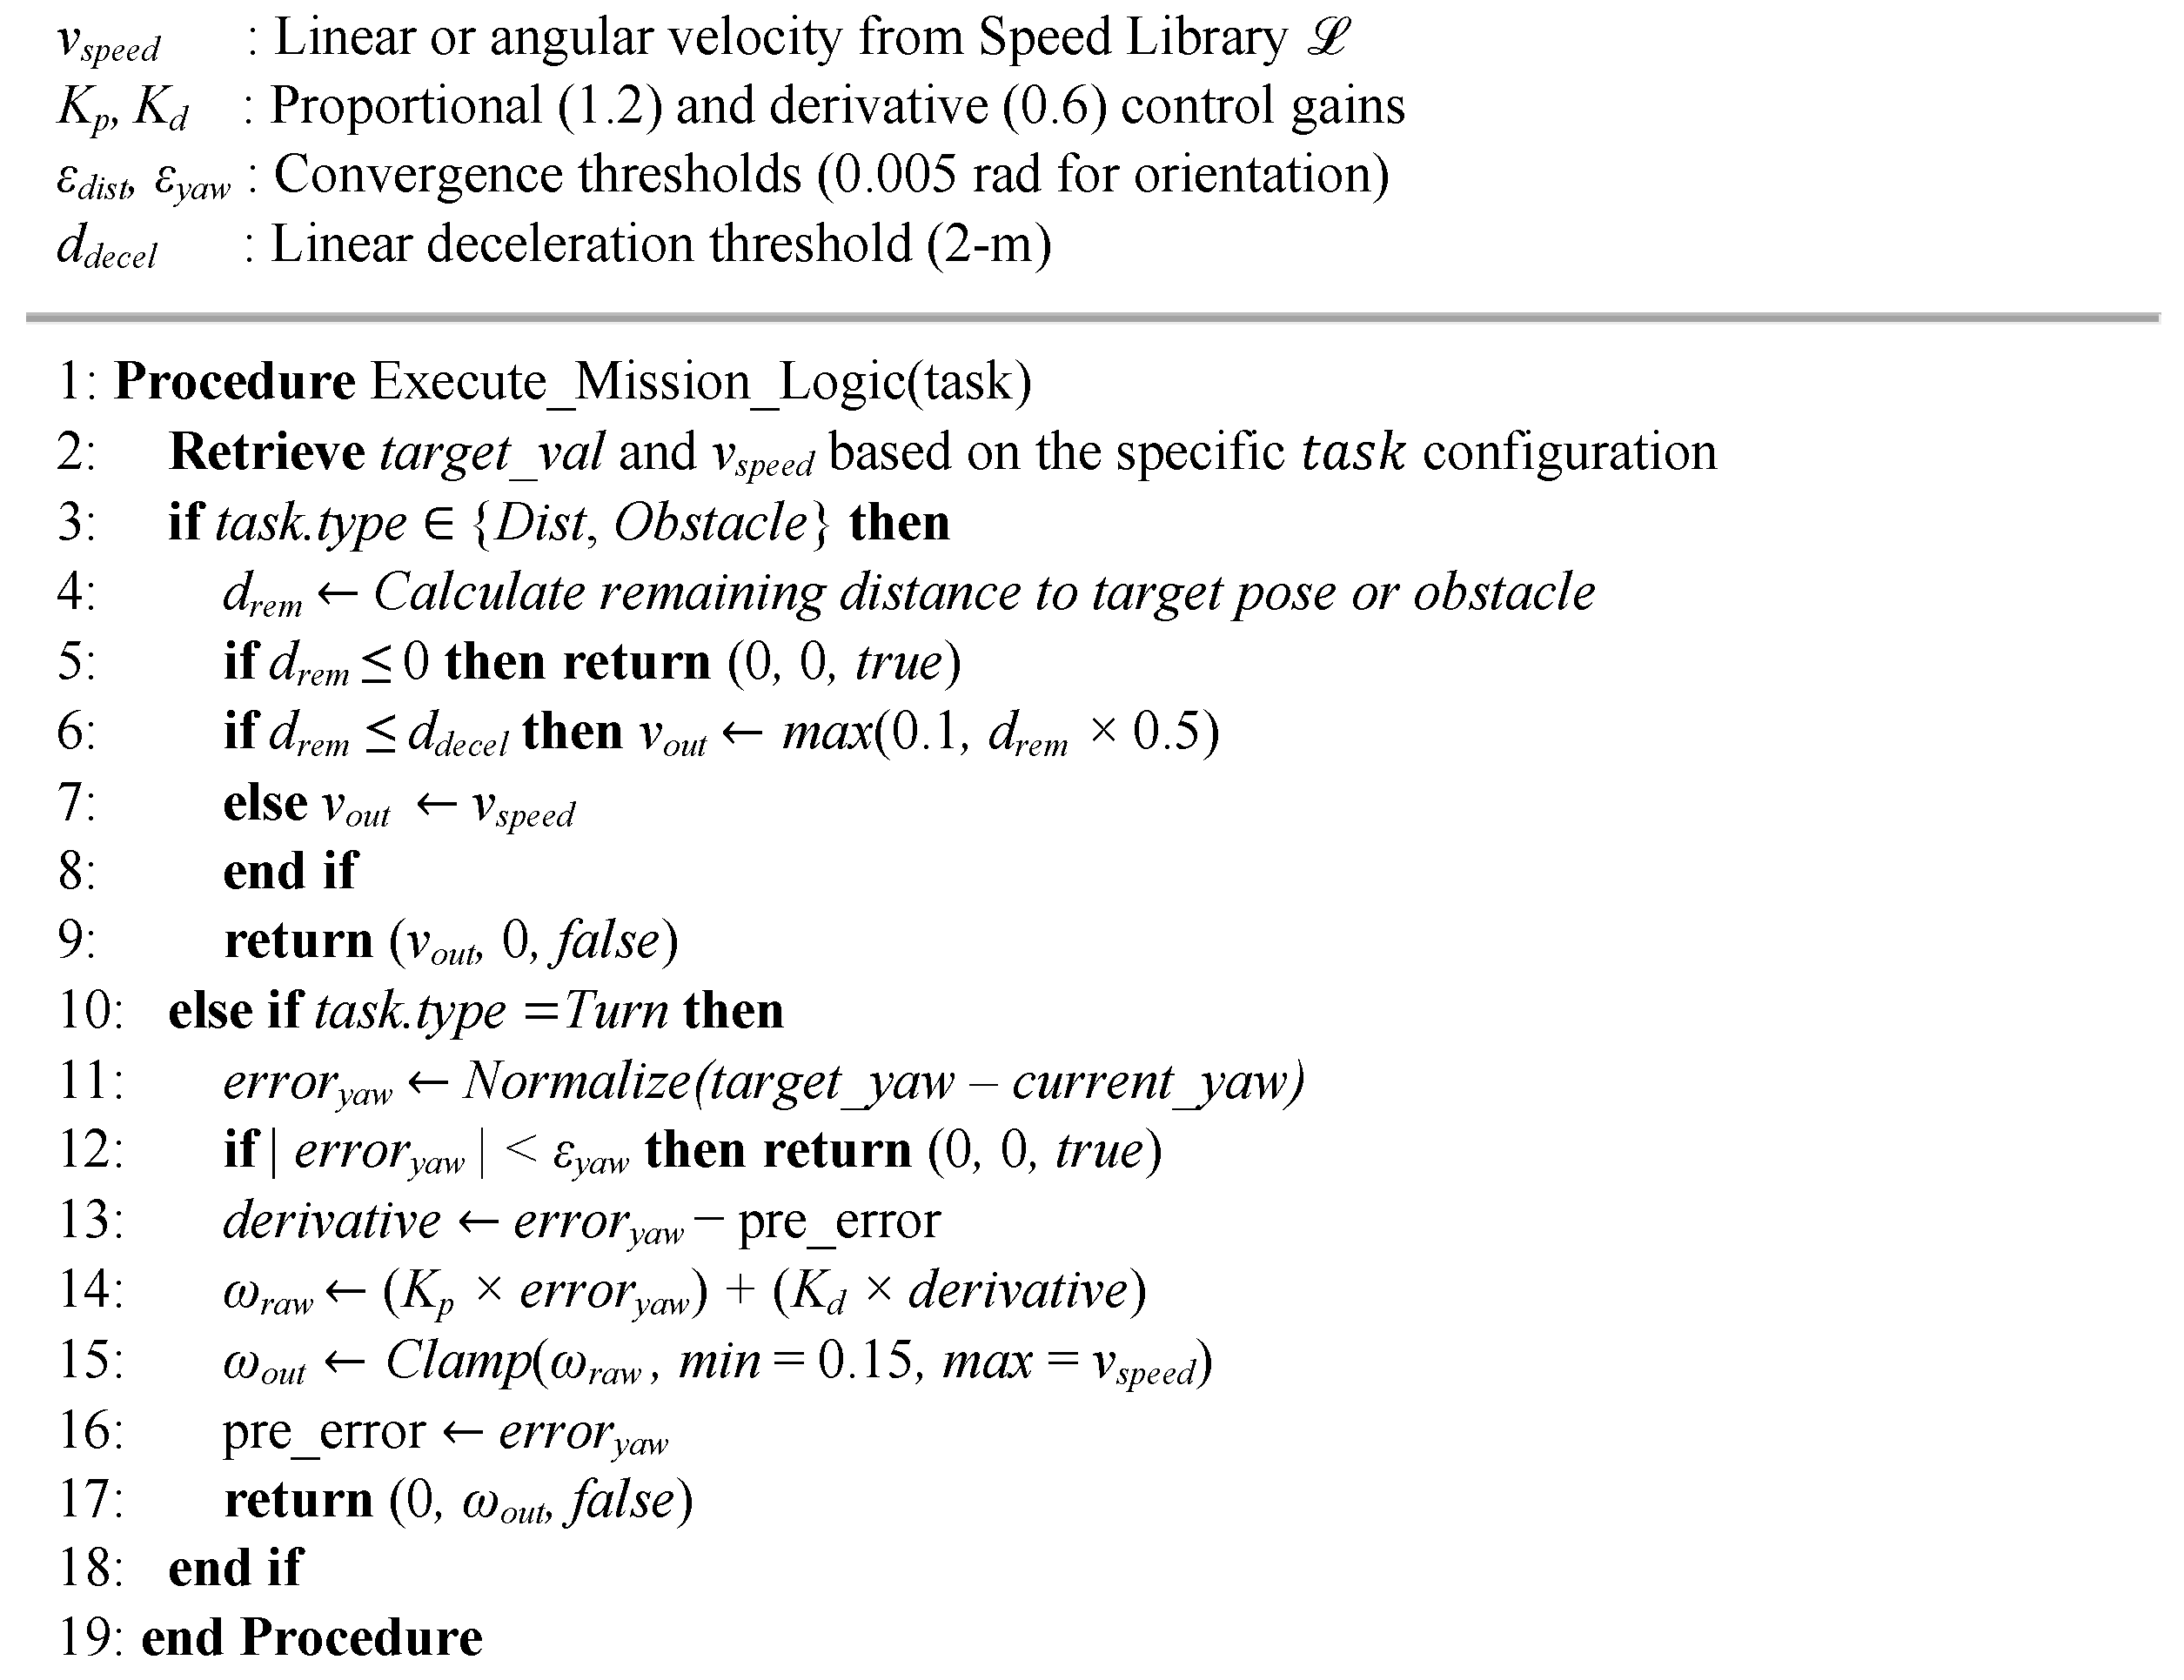
A mission-driven autonomous navigation algorithm, shown in Figure 2, is executed during the Running phase, which retrieves navigational primitives from a predefined queue to fulfill mission requirements. It differentiates between three main tasks: “Obstacle”, “Dist”, and “Turn”. Linear navigation is managed with a dual-stage velocity scheduling strategy for Dist, i.e., fixed distance, and Obstacle, i.e., proximity-based, tasks. The UGV cruises at a constant velocity obtained from a predefined speed library. The controller monitors the relative displacement and implements a proactive deceleration mechanism as the UGV approaches target, i.e., verified with LiDAR or odometrical displacement.
Since motors are susceptible to stalling at low speeds due to simulated resistance, a clamping mechanism is employed to maintain a minimum velocity until the target tolerance is achieved. As for Turn tasks, the controller switches to rotational logic using proportional-derivative strategy to align UGV heading. The proportional component generates the torque to drive the UGV toward target heading, while the derivative component provides active damping to suppress inertial oscillations. By normalizing angular errors within a [−π, π] manifold and enforcing a stringent 0.005-radian tolerance, the controller achieves sub-degree rotational accuracy. The Obstacle task utilizes a centralized scanning window to filter LiDAR clouds, creating a safety buffer that triggers a controlled halt upon proximity detection. Throughout execution, the controller maintains a continuous feedback loop that validates task completion by evaluating the data transmitted from the subscribed sensor nodes, i.e., filtered odometry, IMU, LiDAR. Once the specific convergence criteria are met based on sensor feedback, the controller transitions back to a stabilization state before proceeding to the next mission segment.

2.2. Collection of Authentic Feature Samples

Authentic IMU and odometry samples are collected from Gazebo simulations, which are parameterized to replicate non-ideal sensor noise profiles. These features are detailed in Table 1 and include the timestamp (Ts), task type (Tt), command linear velocity in the x-axis (Clvx), command angular velocity in the z-axis (Cavw), odometry positions (Opx, Opy, Opz), heading angle, i.e., yaw (Θ), odometry orientations (Oorx, Oory, Oorz, Oorw), odometry linear velocity in x-axis (Olvx), odometry angular velocity in z-axis (Oavw), IMU linear velocities (Ilvx, Ilvy, Ilvz), IMU angular velocities (Iavx, Iavy, Iavz), and IMU orientations (Iorx, Iory, Iorz, Iorw). Ts denotes the cumulative simulation time for temporal sequencing. Tt indicates the designated driving sequence or mission profile. Clvx and Cavw are used to create authentic trajectories. Opx, Opy, and Opz denote the estimated Cartesian coordinates of the vehicle within the global reference frame. Θ is analytically derived from odometry data and is used to facilitate visual inspection. Oorx, Oory, Oorz, and Oorw are estimated by the wheel encoders. Olvx and Oavw are also estimated from wheel encoders, which represent velocity. Ilvx, Ilvy, and Ilvz are measured by the IMU accelerometer onboard in simulations. Iavx, Iavy, and Iavz are measured by the IMU gyroscope onboard in simulations. Iorx, Iory, Iorz, and Iorw denote the vehicle’s attitude synthesized via filtering accelerometer and gyroscope measurements.
The label represents the type of data, i.e., authentic or malicious. The trajectory label represents trajectories 1 through 4. It is worthy to point out that Opz, Ilvz, Iavx, Iavy, Oorx, Oory, Iorx, and Iory are not included in the dataset, as the simulations are in a 2-D plane. Each data point is tabulated and indexed by nanosecond timestamps to ensure absolute temporal alignment between control commands and the UGV response. This allows for the precise characterization of sensor biases and baseline noise, particularly during the Idle phase, which serves as a reference for authentic sensor behavior. To enhance the robustness of the dataset and prevent subsequent classifiers from overfitting, a two-tiered generalization is built. First, dynamic velocity profiles are integrated into the control logic to introduce variations in UGV velocity across different mission segments. These variations capture non-linearities in the sensor suite and mechanical latency under different kinetic loads. Second, the spatial diversity of the dataset is expanded by considering four distinct trajectories, i.e., separate routes. This ensures that the learning process captures motion patterns and potential attack signatures, e.g., anomalies between commanded and observed velocity, rather than memorizing coordinates. The resulting dataset maintains a high-frequency temporal consistency, providing a granular and representative foundation for motion analysis and security research.

2.3. Collection of Attack Data

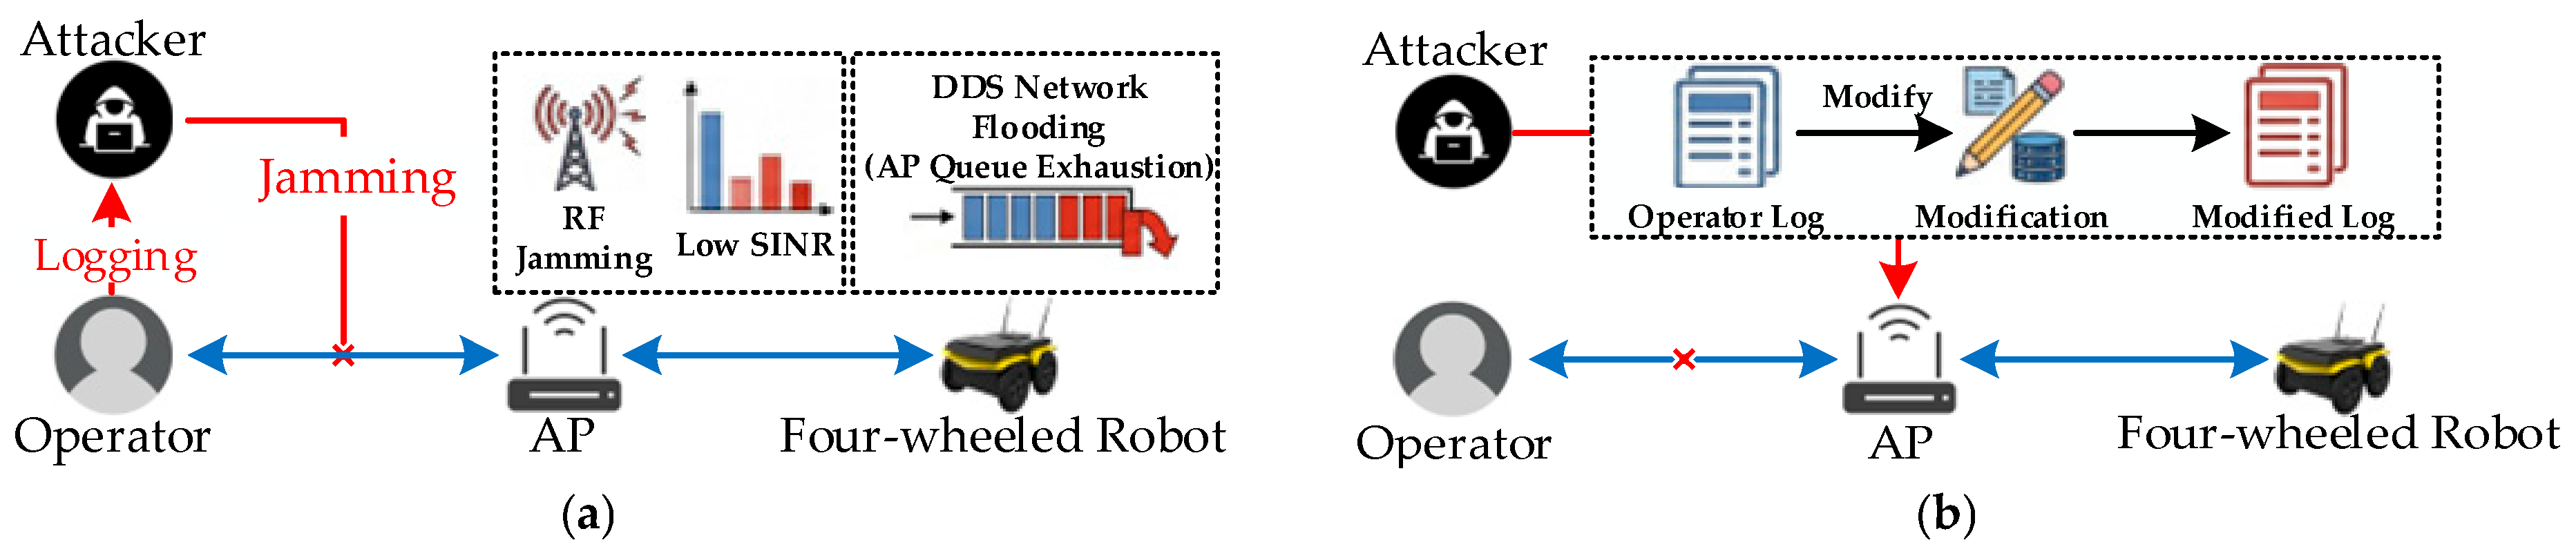
Figure 3 illustrates a two-step scenario for launching malicious message injection cyberattacks. In step 1, the attacker interrupts communications between the operator and access point (AP) to deliberately disrupt their connection while simultaneously logging navigation commands prompted by the operator, as depicted in Figure 3a. This is achieved by injecting radio frequency interference to degrade the signal to interference plus noise ratio (SINR) and force continuous backoff, rendering the operator unable to control the UGV. This can also be achieved by flooding the local data distribution service (DDS) network, exhausting the communication queues of AP control commands or via domain name system cache poisoning, interrupting the remote command stream during handshake. In step 2, the attacker maliciously modifies logged commands, e.g., velocity, prior to launching them to the target UGV, as demonstrated in Figure 3b. This two-step scenario assumes that the odometry stream transmitted over ROS/ROS2 topics can be tampered with physical- or network-level attacks, while the IMU stream remains authentic due to physical connection with the onboard microcontroller. If both odometry and IMU streams are compromised, the quality of attack detection will be degraded, leading to lower detection rates, higher misdetection rates, and/or higher false alarms. Hence, this single-stream assumption is a possible limitation of the proposed attack scenario, and that defense against multi-hardware stream tampering is beyond the scope of this work.
Two simulated types of malicious injection attacks are studied in this work: path modification (PM) and velocity drift (VD). PM is concerned with changing the UGV heading by calculating new coordinates selected by the attacker. This is performed recursively (new coordinate is based on previous calculated one) and is realized by altering the orientation and position features. On the other hand, VD is concerned with modifying UGV linear velocity and position features, which eventually causes inaccuracies in the estimated position. Such attacks are generated by tampering sensory data, i.e., wheel odometry, without inducing jamming at the physical layer due to safety and liability concerns.
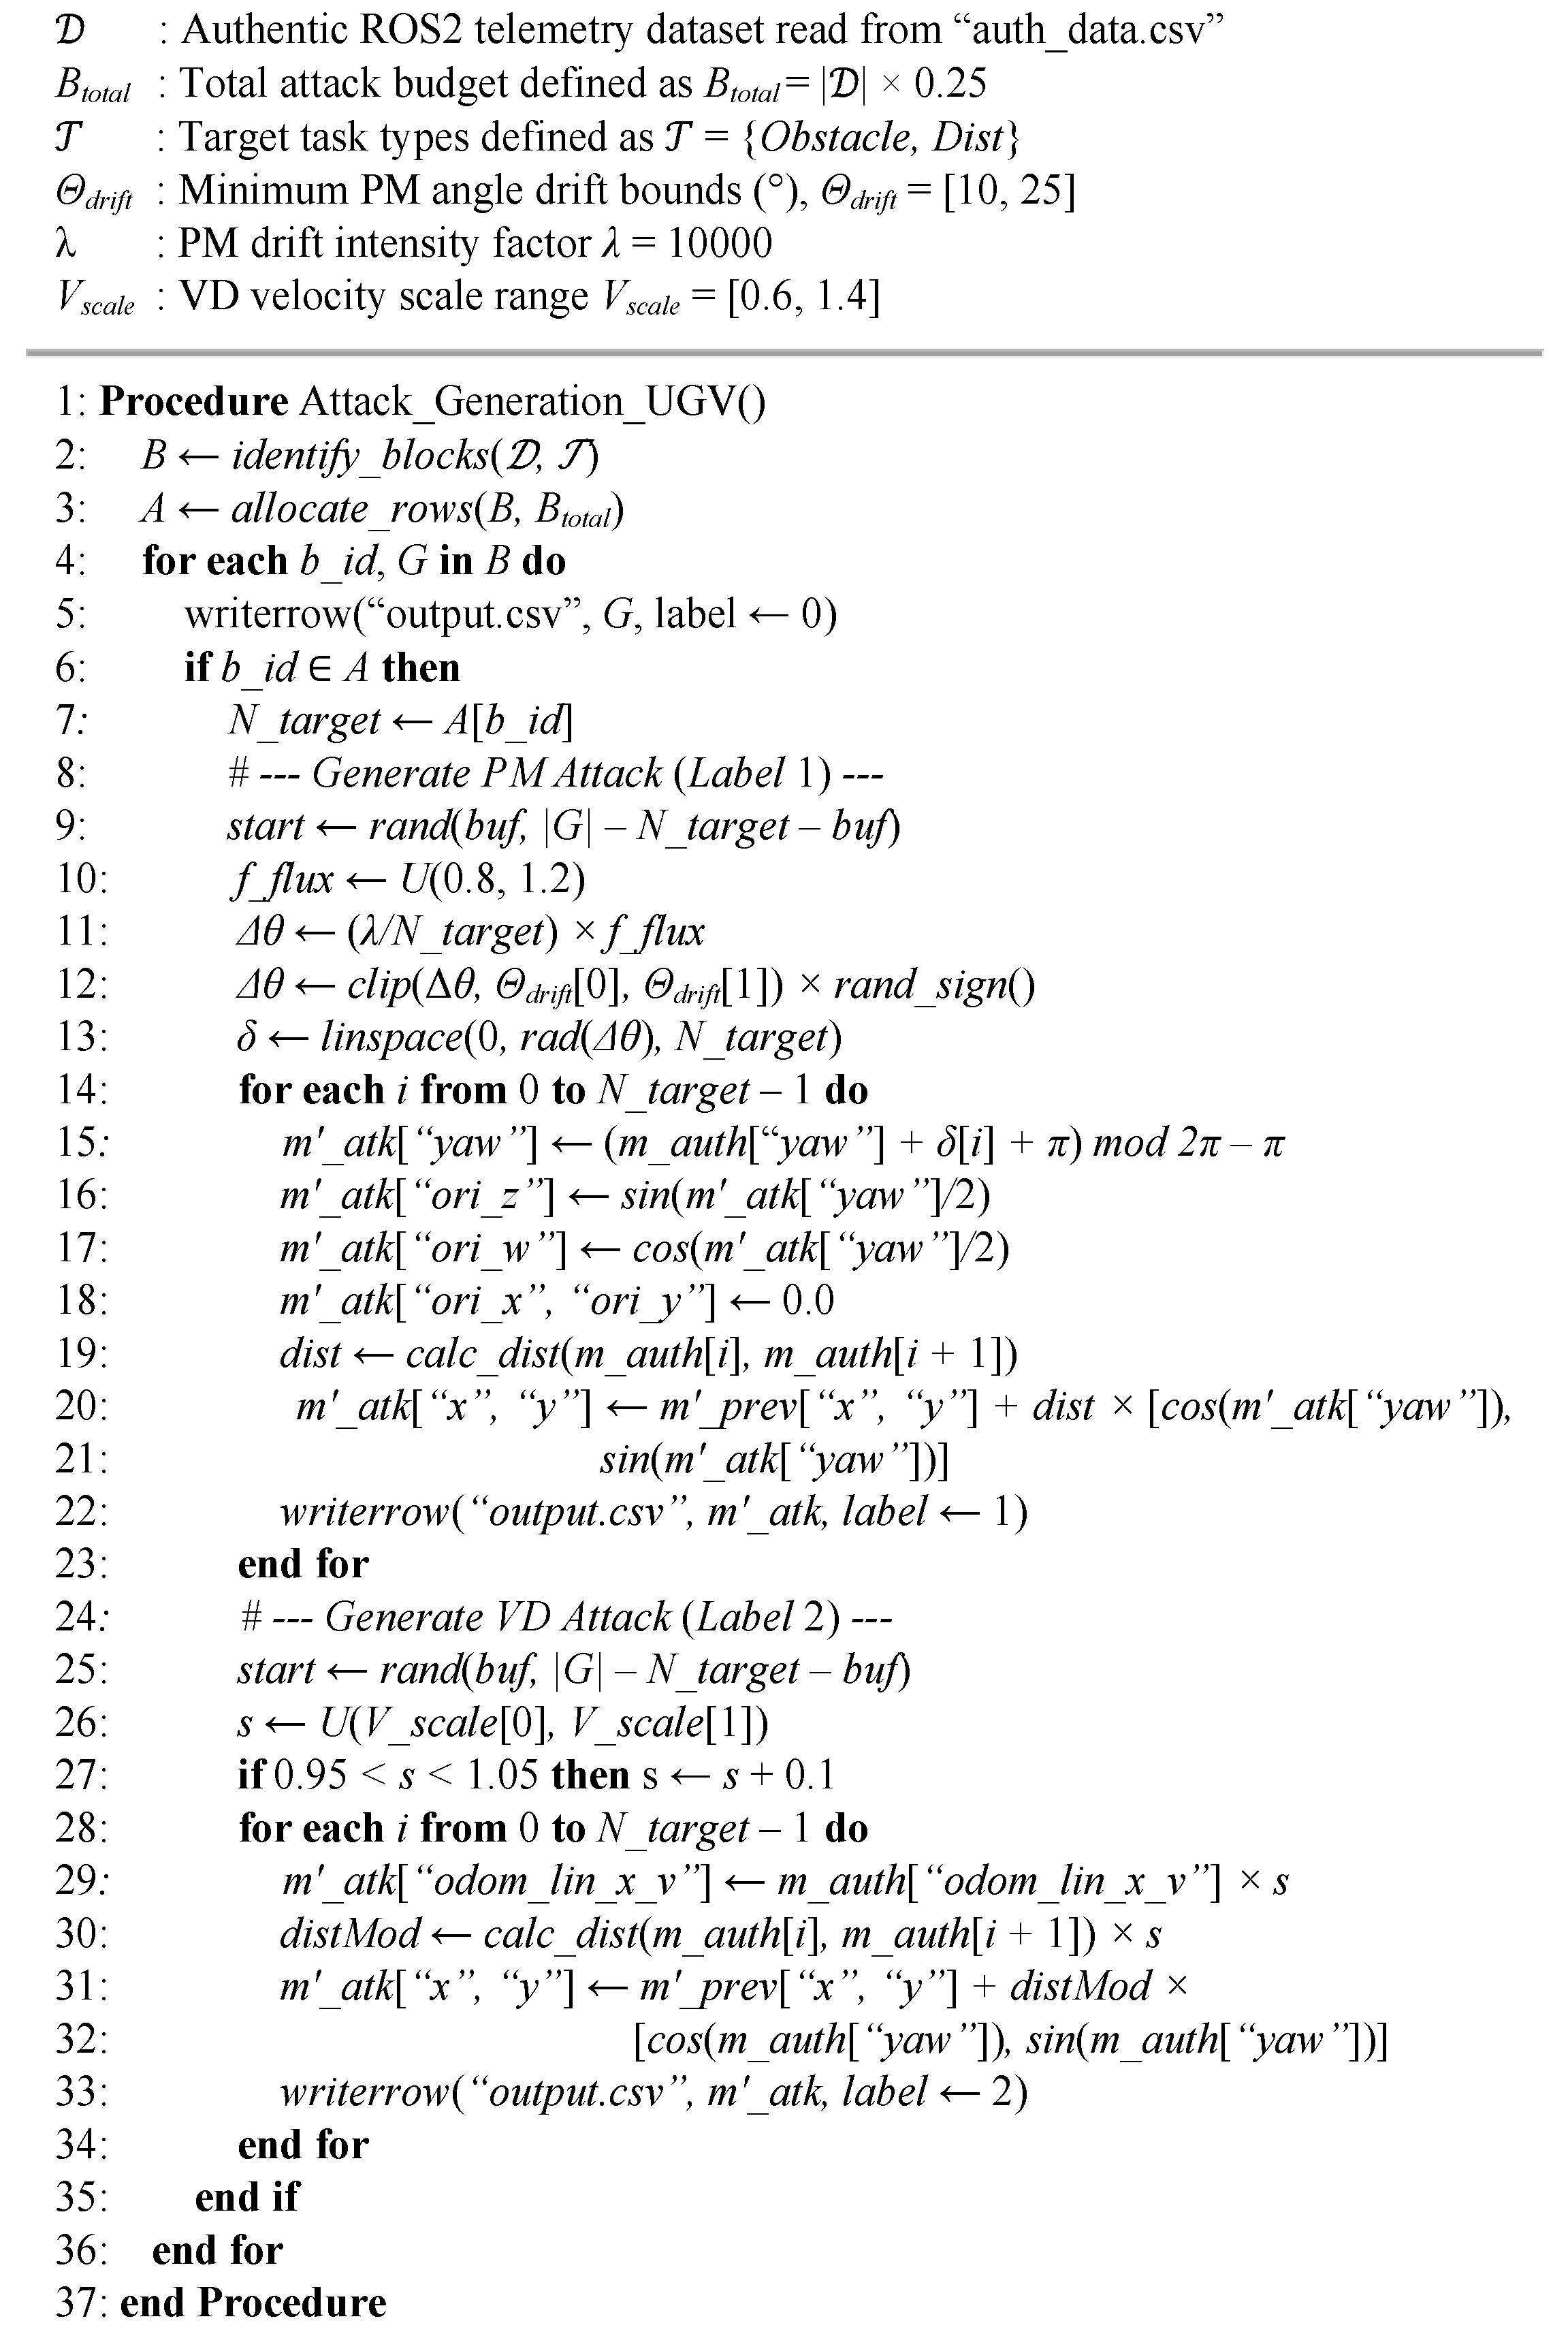
Both attacks are distributed across trajectories 1–4 and adjusted to provide sufficient data to train the detection and classification models. Figure 4 depicts a pseudocode for generating PM and VD, whereas Table 2 summarizes the distribution of authentic, PM, and VD samples. For each trajectory, the number of authentic samples is around 10,000. The dataset maintains a consistent 2:1:1 ratio for authentic, PM, and VD samples, respectively, i.e., 50% authentic and 50% malicious. This ratio is selected to mitigate class imbalances that often leads to overtraining or undertraining, ensuring classifiers will establish well-defined decision boundaries with no bias towards a specific class. Rare attack instances in practical deployments have no impact on classification performance as the use of balanced datasets in training allows the development of classifiers with optimal decision boundaries for all classes, resulting in high detection rates and low false alarms as will be discussed in detail in Section 3.2. It is paramount to point out that because sequential operation is assumed, PM and VD are independent and do not occur simultaneously.
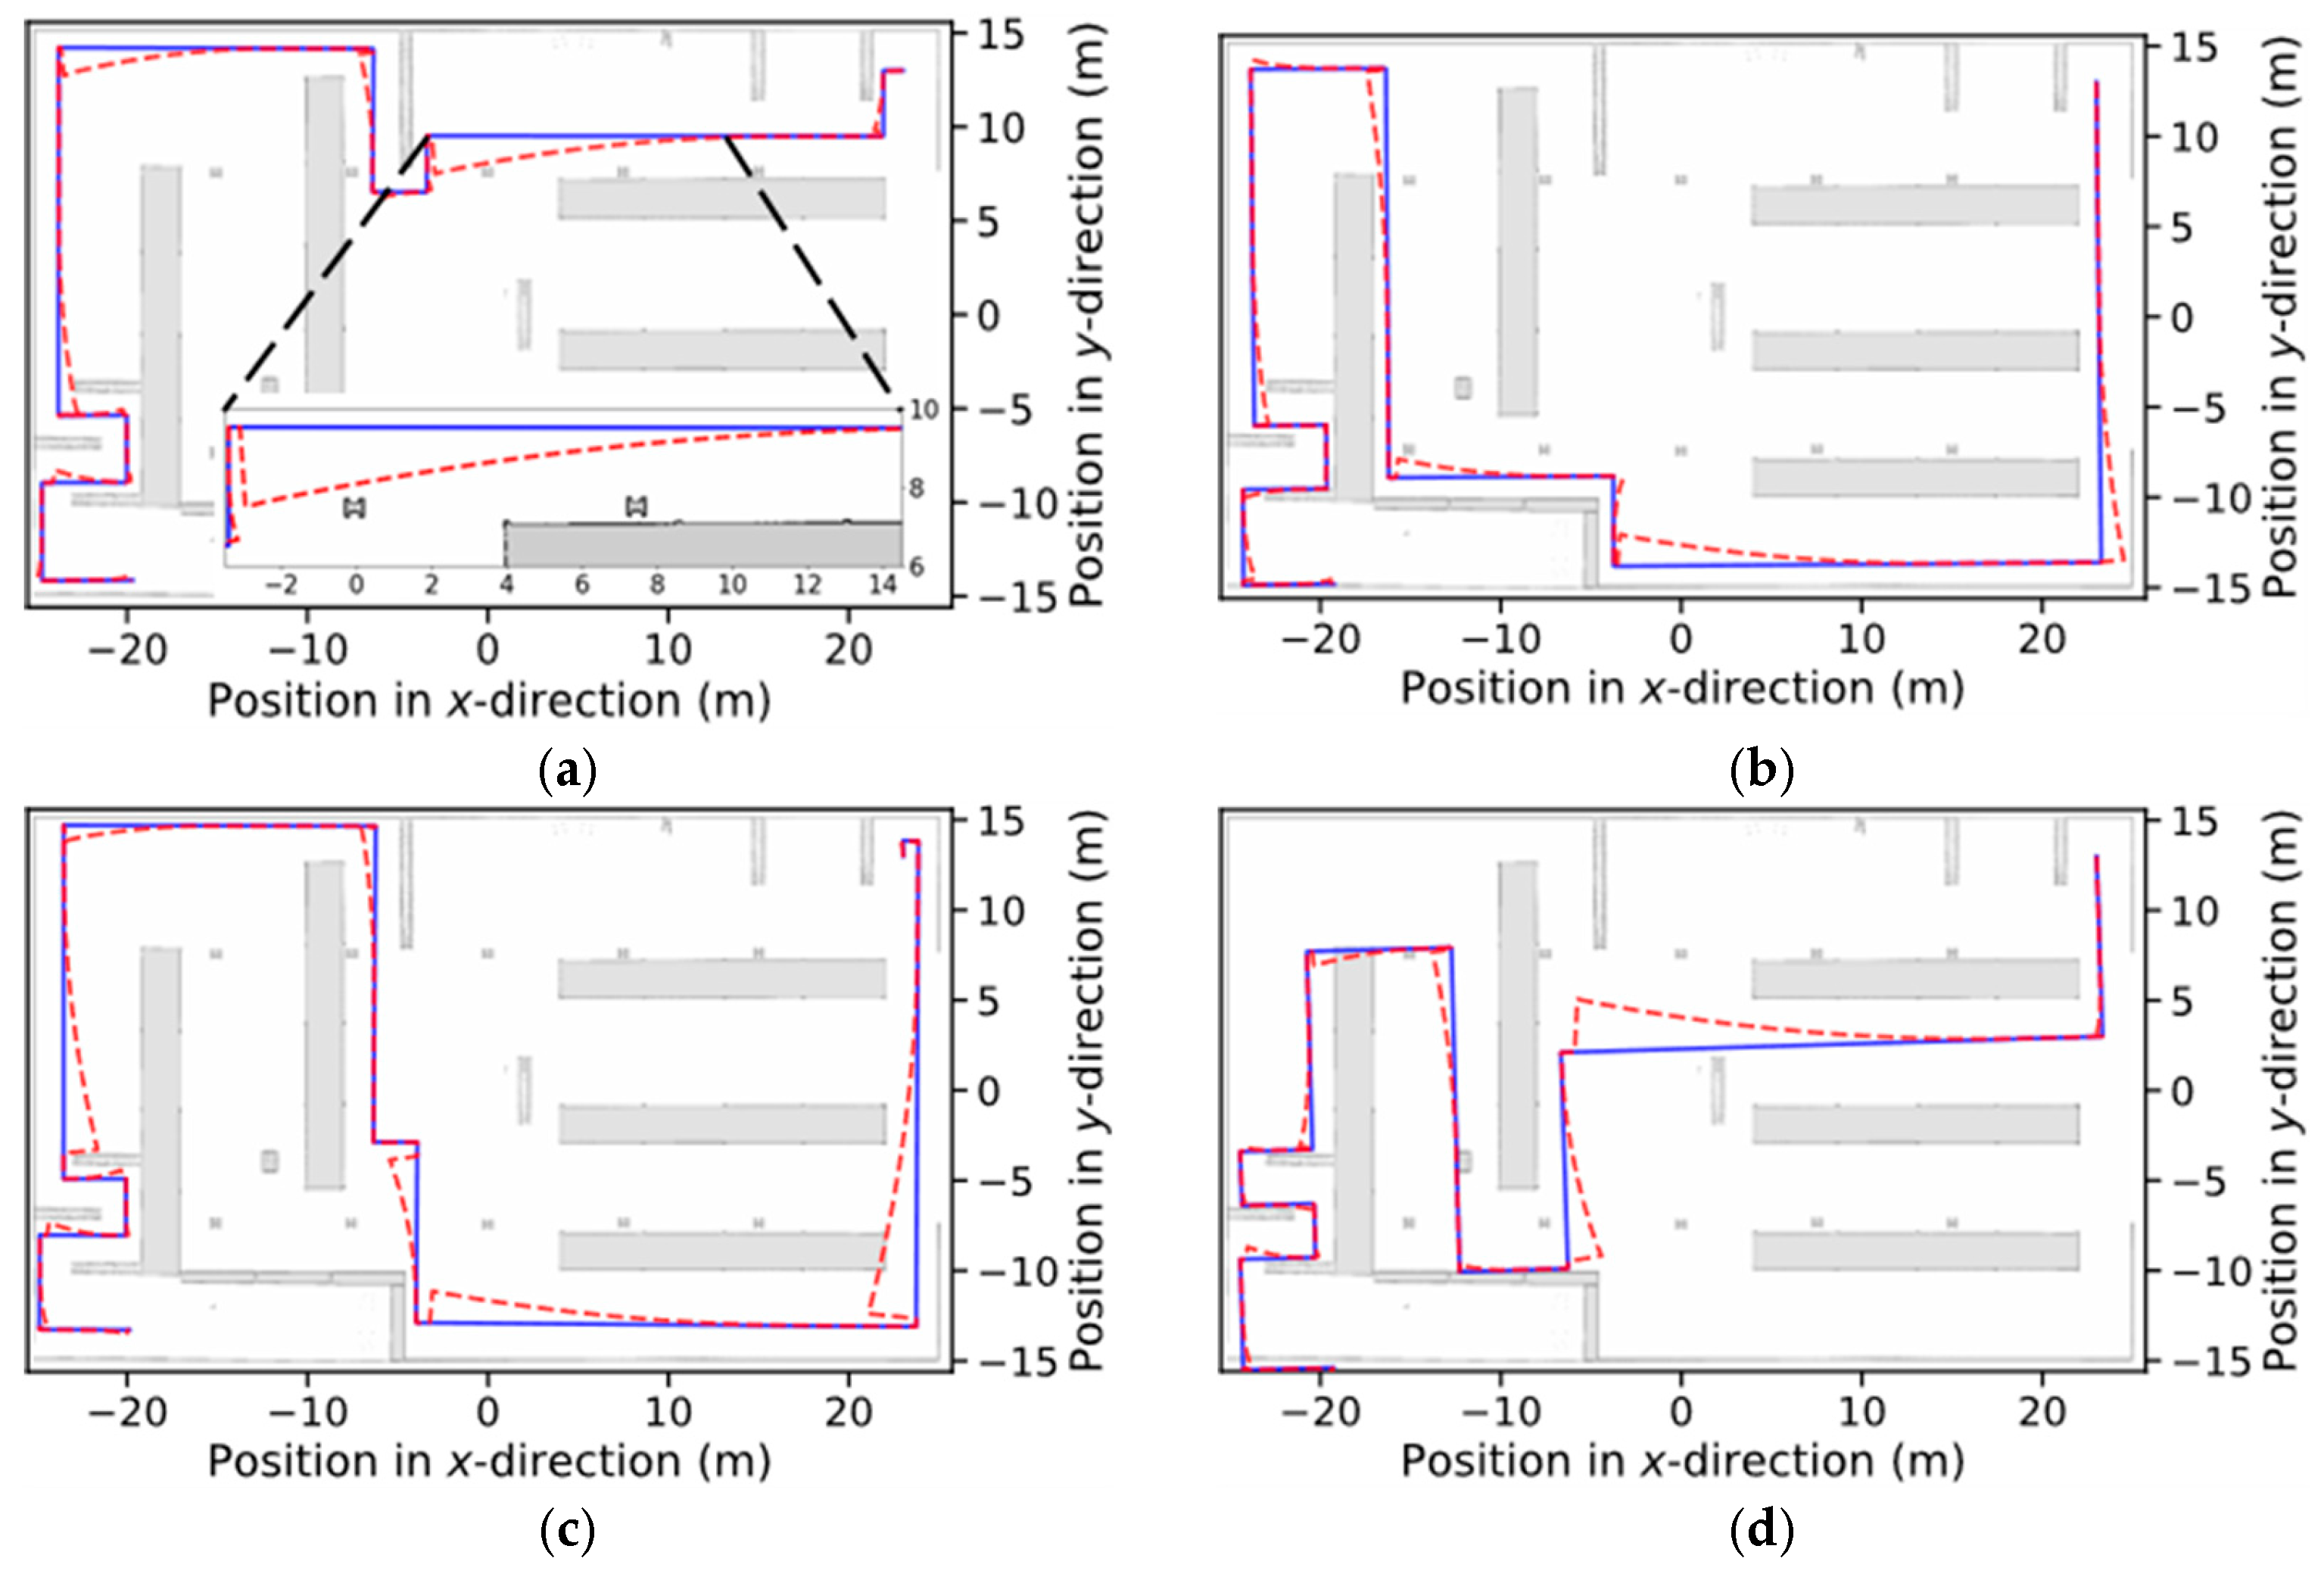
Also, compound attacks induce simultaneous spatial and kinematic outliers. Because compound tampering distorts cross-sensor telemetry, i.e., IMU and odometry, in multiple features at once, the feature vector drifts significantly, immediately triggering a fail-safe strategy. Table 3 elaborates trajectories 1–4, all of which have the same start and destination positions. Travel distances, velocities, and task sequences are varied to contribute to the diversity and inclusivity of the dataset, ensuring a comprehensive evaluation. Table 4 shows the selected range of values for the features in the dataset that lead to PM and VD cyberattacks. Moreover, Figure 5 shows the impact of PM attacks on trajectories 1–4. It is worth noting that demonstration videos for PM and VD can be found in [54].

3. Development and Evaluation of Detection and Classification Models

This section details the development of the ML models for detecting and classifying PM and VD cyberattacks. It also benchmarks these models against each other to evaluate their performance. Here, five models are developed using the following classifiers: decision tree (DT), k-nearest neighbors (KNN), multi-layer perceptron (MLP), random forest (RF), and support vector machine (SVM). By exploiting the instantaneous variation between the IMU and odometry data, such models are trained to detect the presence of an attack and classify its type. Subsequent subsections highlight feature analysis and hyperparameter configurations, followed by comprehensive performance analysis addressing classification accuracy, robustness against background noise, and prediction latency.

3.1. Feature Correlation and Importance Analysis

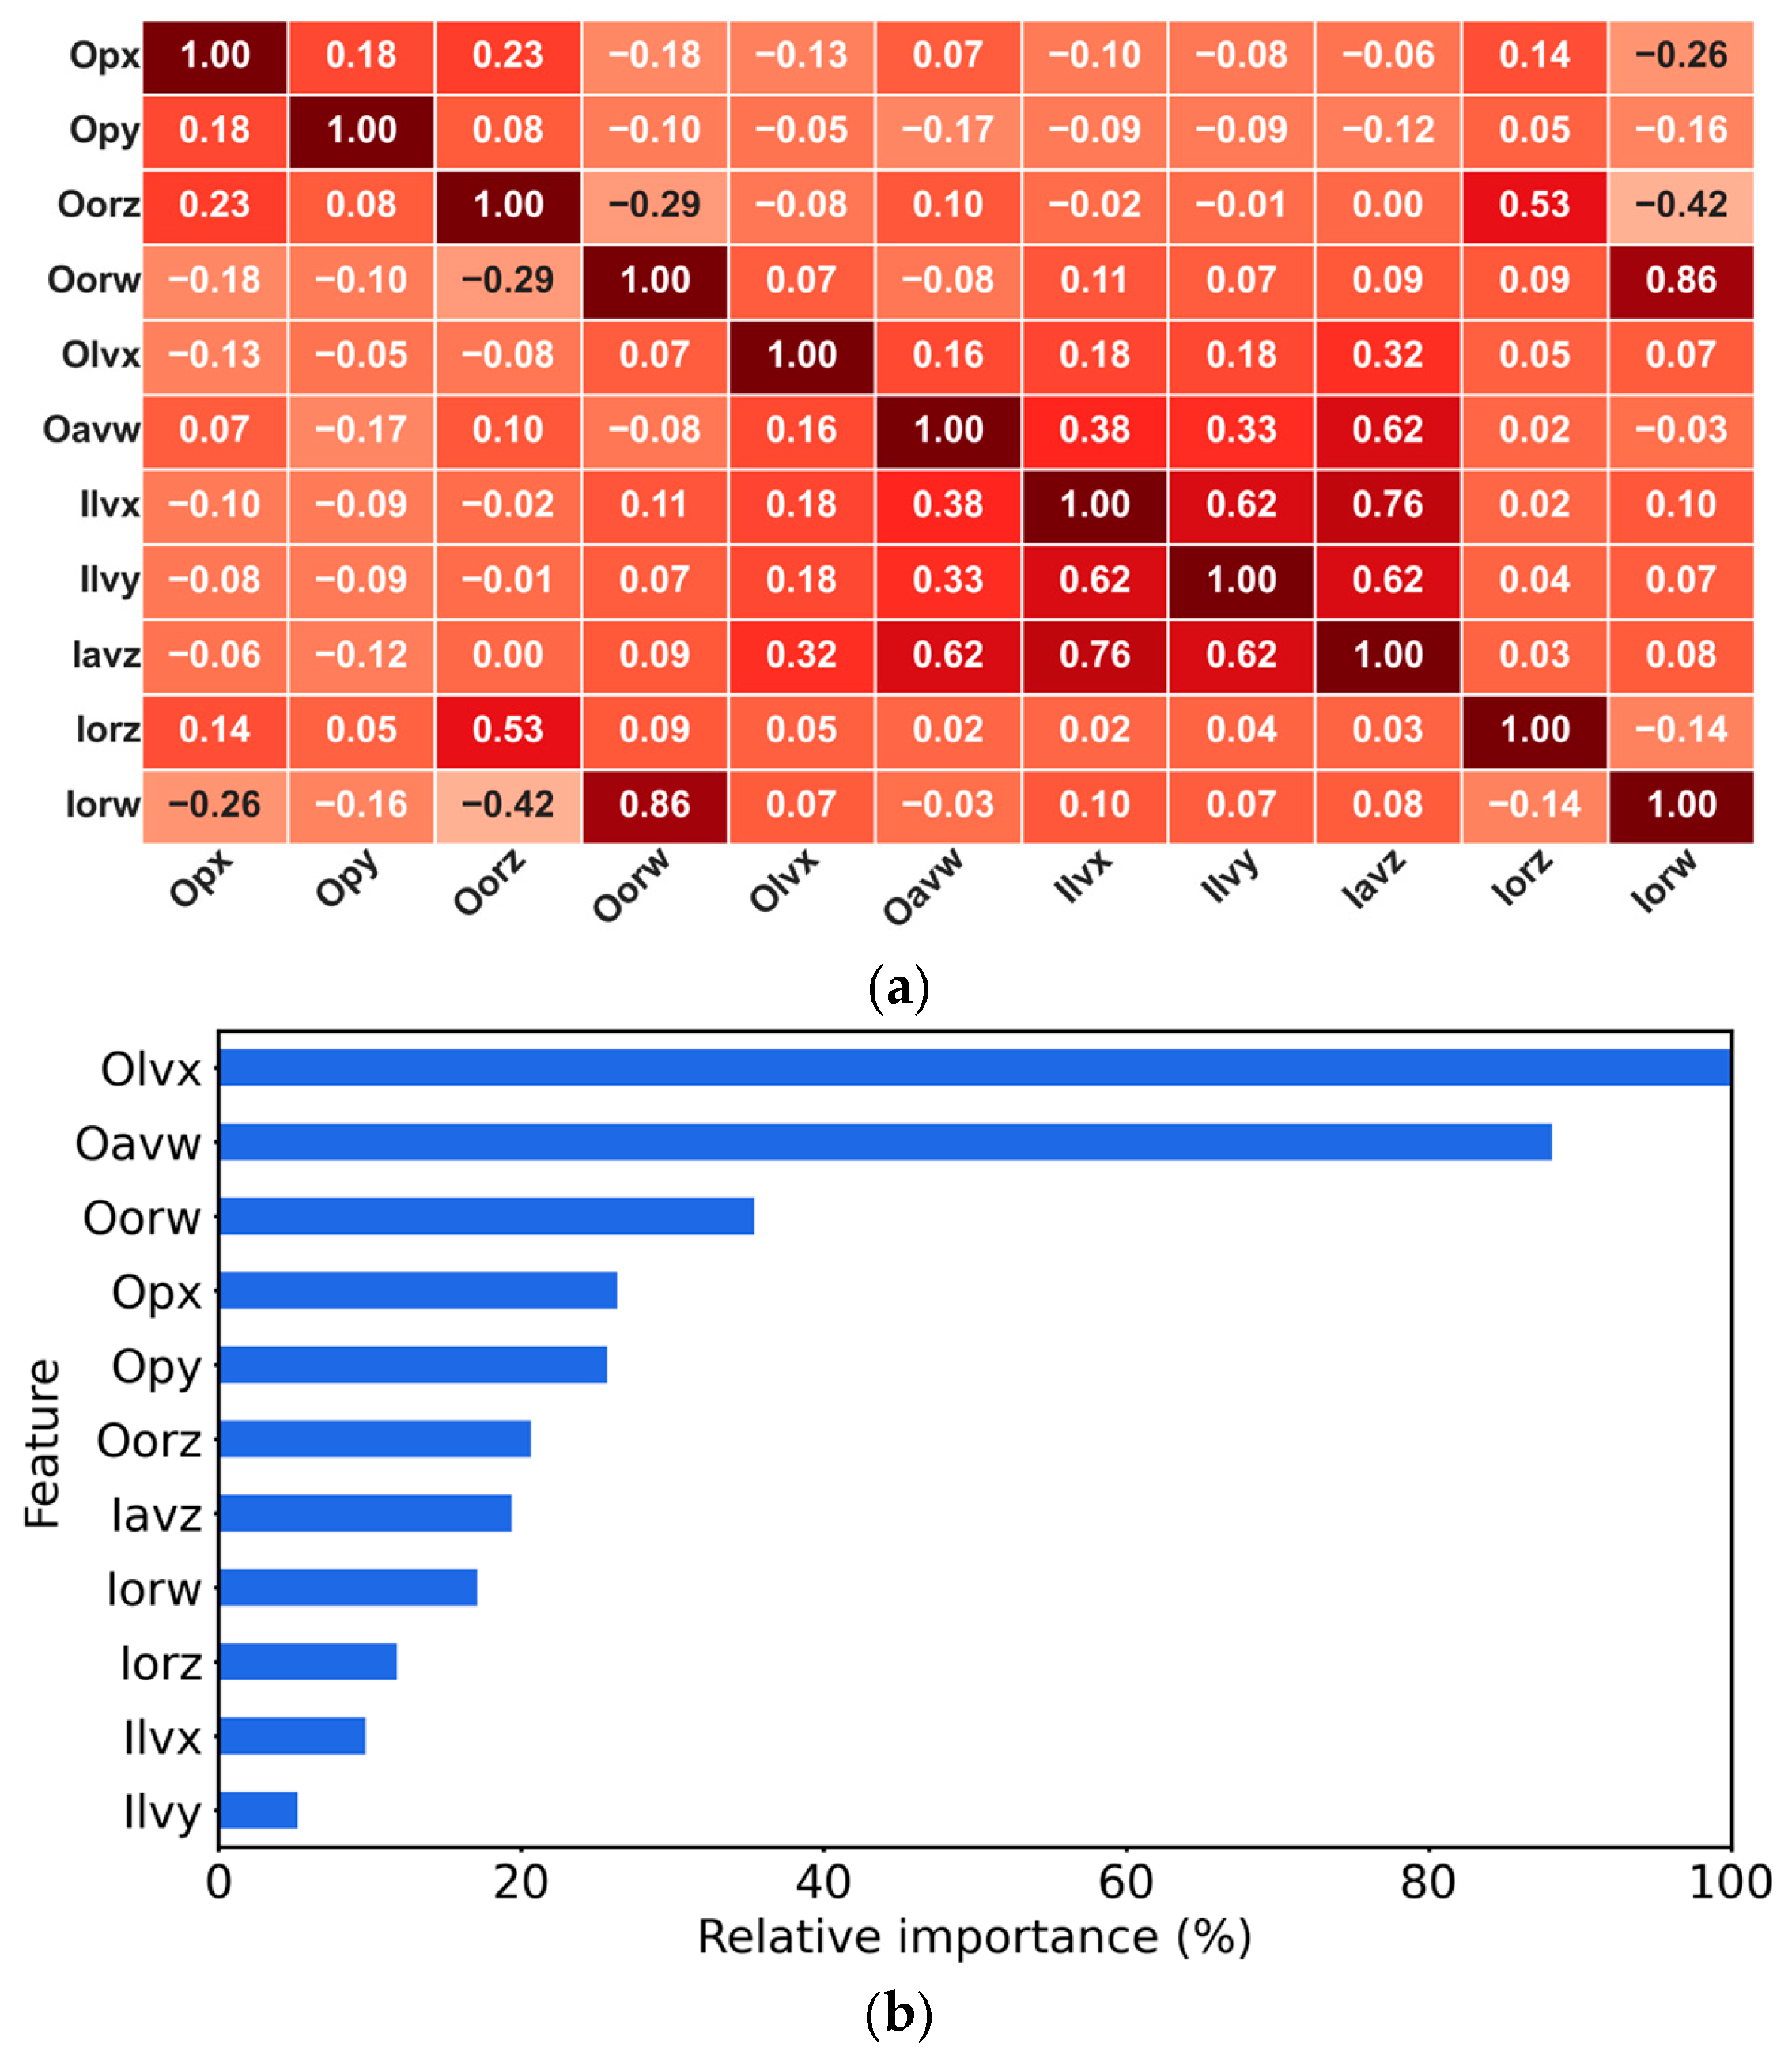
The correlation heatmap of the extracted features, computed using the Spearman correlation algorithm, is illustrated in Figure 6a. It allows for the identification of correlated features to discard those with the least impact on training models, thereby reducing dimensionality that could otherwise affect the training quality and time. A correlation factor |c| ≥ 0.8 is considered in this work, resulting in the identification of one feature pair as strongly correlated: (Iorw, Oorw). Therefore, a feature importance analysis, shown in Figure 6b, is carried out with the mean decrease in impurity algorithm. After the relative importance scores within the aforementioned correlated pair are compared, Iorw is discarded from the dataset. As a result, the final dataset that is used for training and validating the ML classifiers contains the following features: Opx, Opy, Oorz, Oorw, Olvx, Oavw, Ilvx, Ilvy, Iavz, Iorz, and, trajectory_label for split; and label for target. Both feature correlation and feature importance analyses contribute to (i) the prevention of tree-based classifiers, e.g., RF, from potentially making random or unstable node splits because of correlated features, and (ii) the reduction of feature dimensionality without losing essential kinematic information. This leads to faster training convergence, less memory consumption, and subsequently, more efficient classifiers.

3.2. ML Training and Validation

Upon finalizing the dataset, the ML classifiers are trained to detect and classify PM and VD within a unified framework. Each classifier is optimized using the random search algorithm, which allows for the systematic evaluation of combinations of hyperparameters from a predefined range. During the training phase, each hyperparameter combination is evaluated on 70% of the dataset using 10-fold cross-validation to ensure model robustness and prevent overfitting. Then, the model with the optimum hyperparameter combination is tested on the remaining 30% of the dataset.
Although the samples in the finalized dataset are continuous in time, the introduced fluctuations, sensor noises, and data exchange rates during simulations impose fewer temporal dependencies between such samples. Hence, the random 70–30 split provides a valid feature-space baseline without severely compromising classifier optimization. To assess the impact of temporal correlation on classifier development, real-time validations are performed with a physical ground vehicle platform across routes featuring no temporal, spatial, or otherwise sample-derivation overlap with the finalized dataset, ensuring the solution’s true generalization and scalability. Details on such an assessment are presented in Section 4. Table 5 presents the optimized hyperparameters of the models.
The performance of such models is assessed using the validation accuracy (VA), precision (PR), F-score (FS), detection rate (DR), misdetection rate (MDR), false alarm rate (FAR), as well as training time (TT) and prediction time (PT). These are computed as follows:
V a l i d a t i o n   A c c u r a c y   ( V A ) = T P + T N T P + F P + T N + F N
P r e c i s i o n   ( P R ) = T P T P + F P
F s c o r e   ( F S ) = 2 × P r e c i s i o n × R e c a l l P r e c i s i o n + R e c a l l
D e t e c t i o n   R a t e   ( D R ) = T P T P + F N
M i s d e t e c t i o n   R a t e   ( M D R ) = F N T P + F N
F a l s e   A l a r m   R a t e   ( F A R ) = F P F P + T N
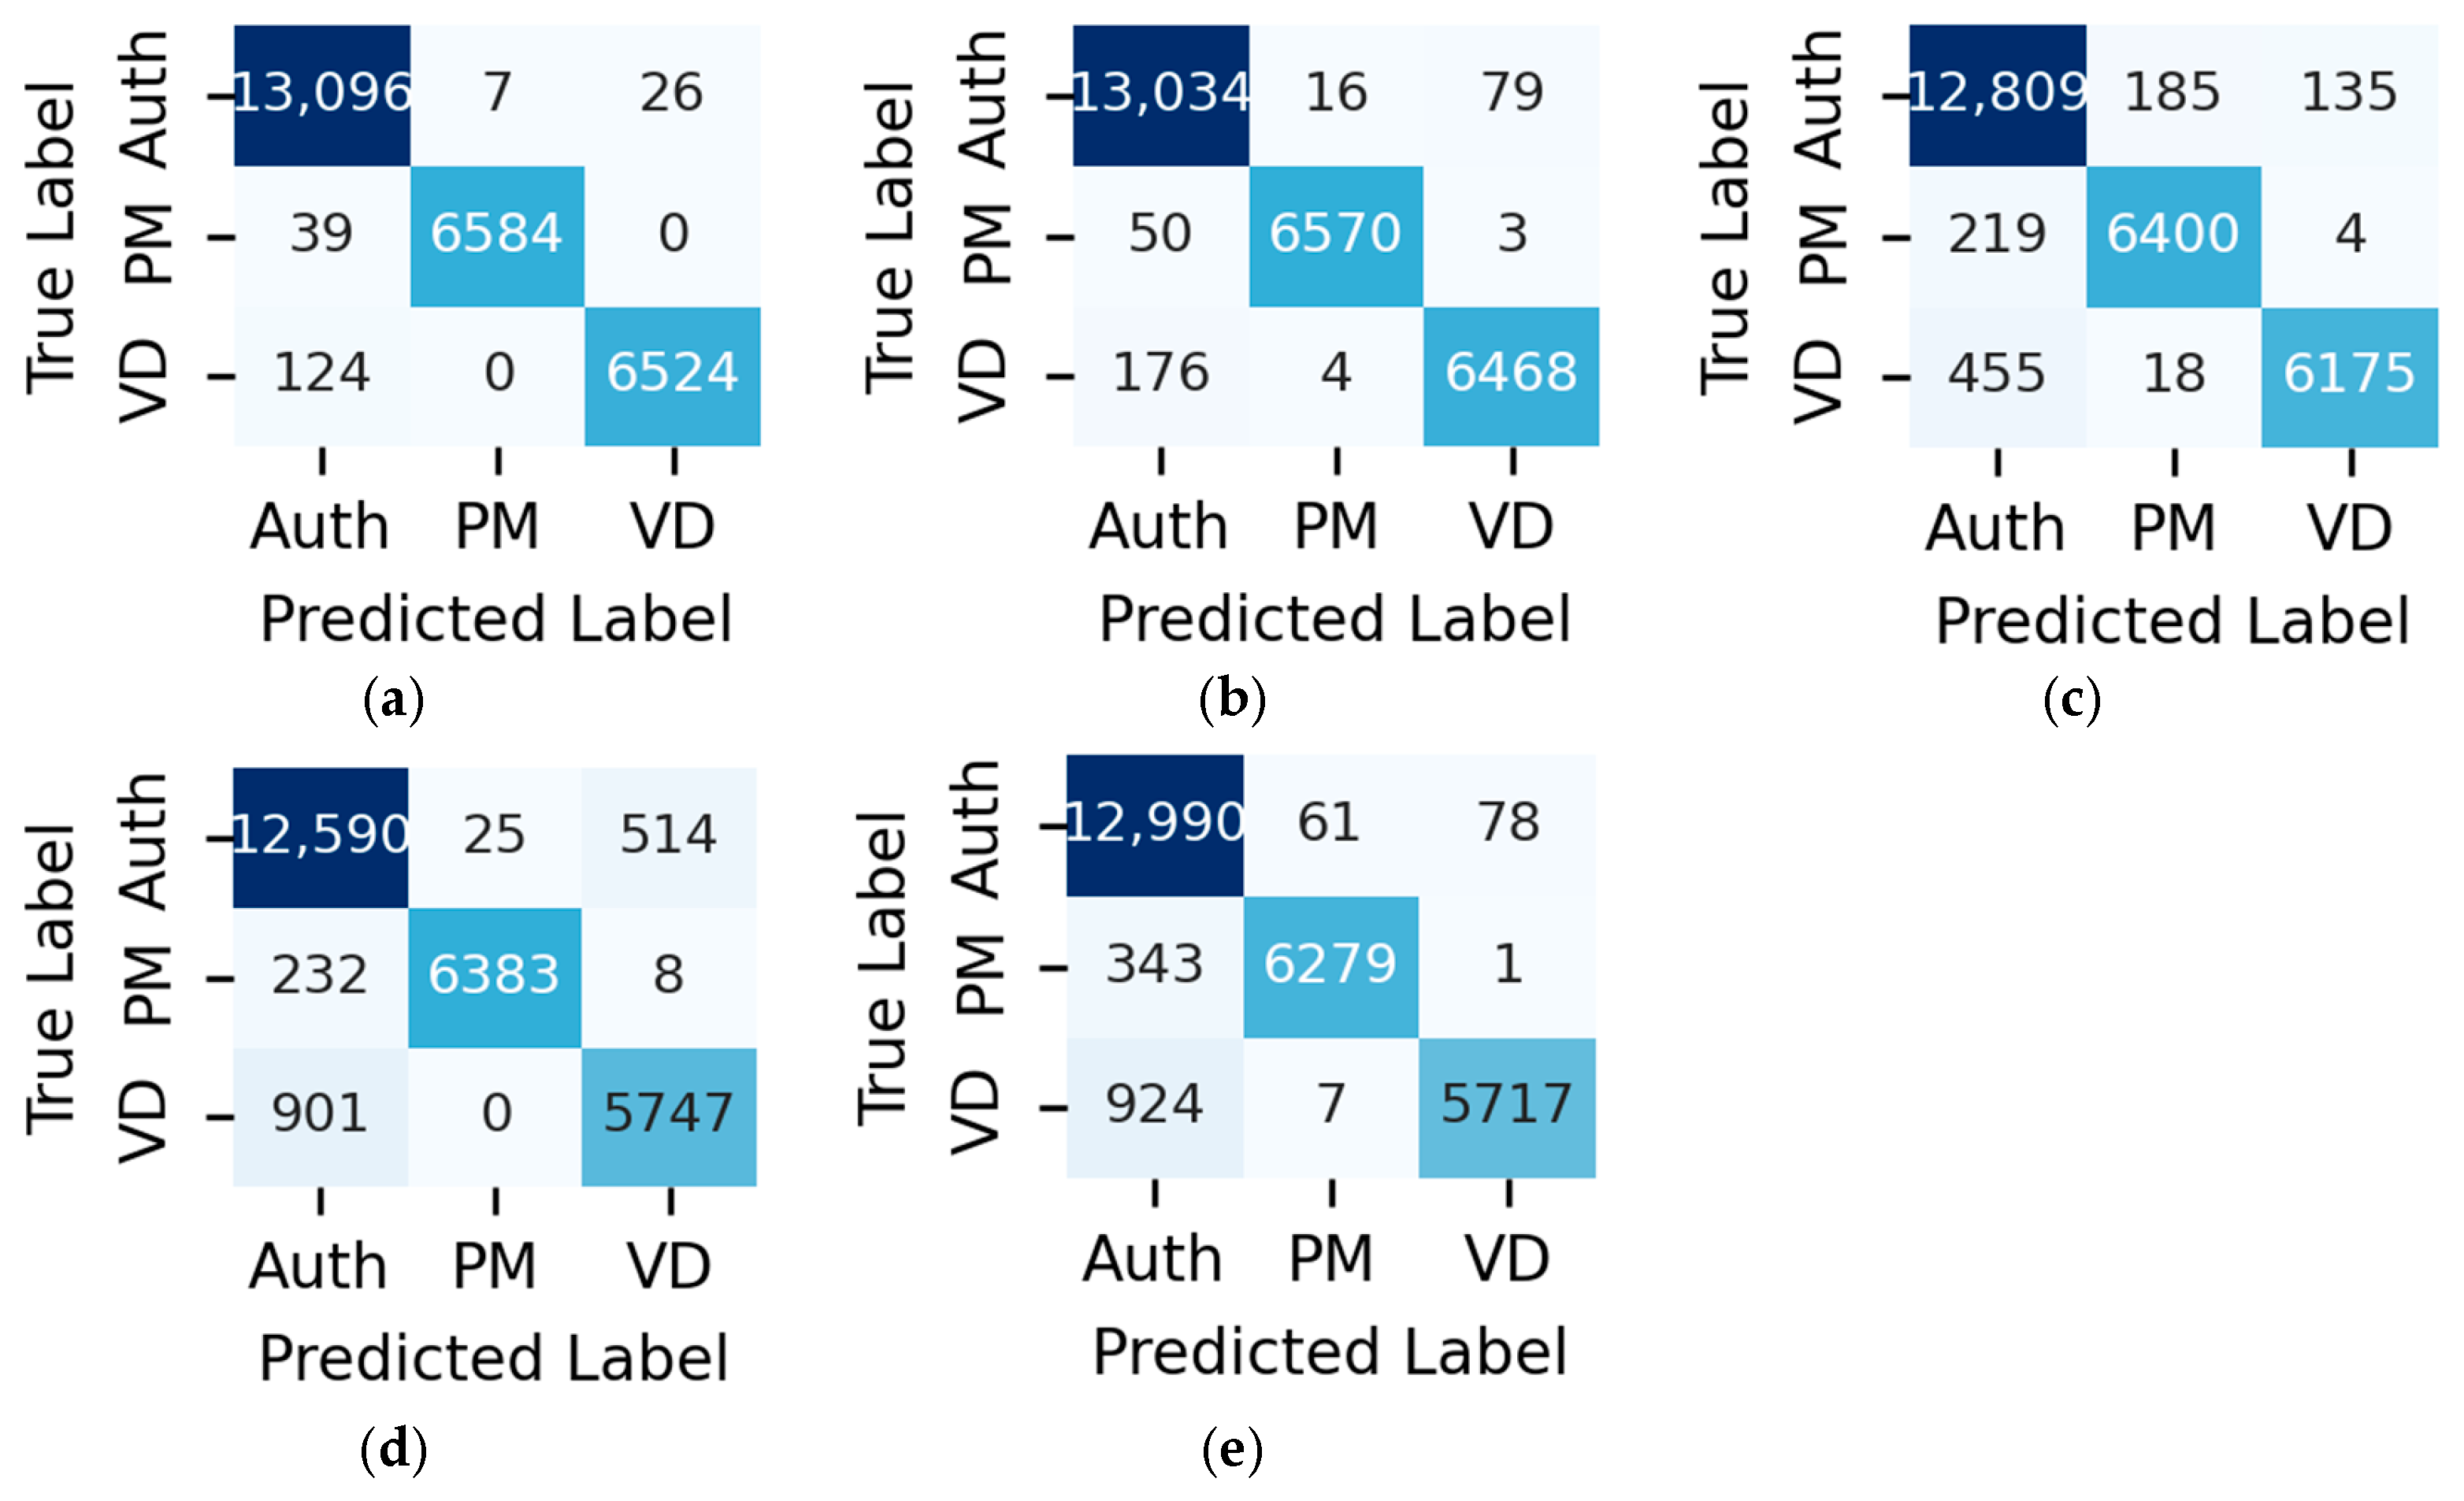
where TP, TN, FP, and FN are the true positive, true negative, false positive, and false negative predictions, respectively. PR measures the exactness of detected anomalies, while FS is for evaluating dataset imbalance. DR and MDR evaluate the class-specific detection accuracies and misclassification rates, respectively, whereas FAR indicates the frequency at which authentic labels are falsely flagged as attacks. Table 6 depicts a qualitative analysis of the aforementioned evaluation metrics, along with the computational efficiency measured by the TT and PT. A Windows 11 PC with an Intel i9-13980HX CPU @ 2.20 GHz and 16 GB of DDR5 4800 MHz SODIMM memory is used for training and validation. MLP exhibits the lowest VA in comparison to other models and is associated with the lowest class-specific DR, MDR, and FAR. On the other hand, RF is found to outperform other classifiers, with VA and class-specific DR greater than 98% together with class-specific MDR and FAR less than 2%. Also, its PT is 156.32 ms, obtained via testing 30% of the dataset (i.e., 26,400 samples). This leads to a PT of 5.9 µs per sample, enabling real-time detection. Figure 7 shows the confusion matrices of the five developed classifiers. Resulting RF and DT matrices showcased in Figure 7a,b, respectively, demonstrate minimum misclassification across all classes, i.e., authentic, PM, VD, suggesting the ability of tree-structured models to identify discrete anomaly signatures. Conversely, Figure 7c depicts the performance of the KNN classifier, which exhibits more misclassifications. For example, it misclassifies 219 PM samples and 455 VD samples as authentic, while falsely flags 185 authentic samples as PM. Lastly, Figure 7d,e show that MLP and SVM have the highest misclassifications and false alarms.

4. Real-Time Experimentations

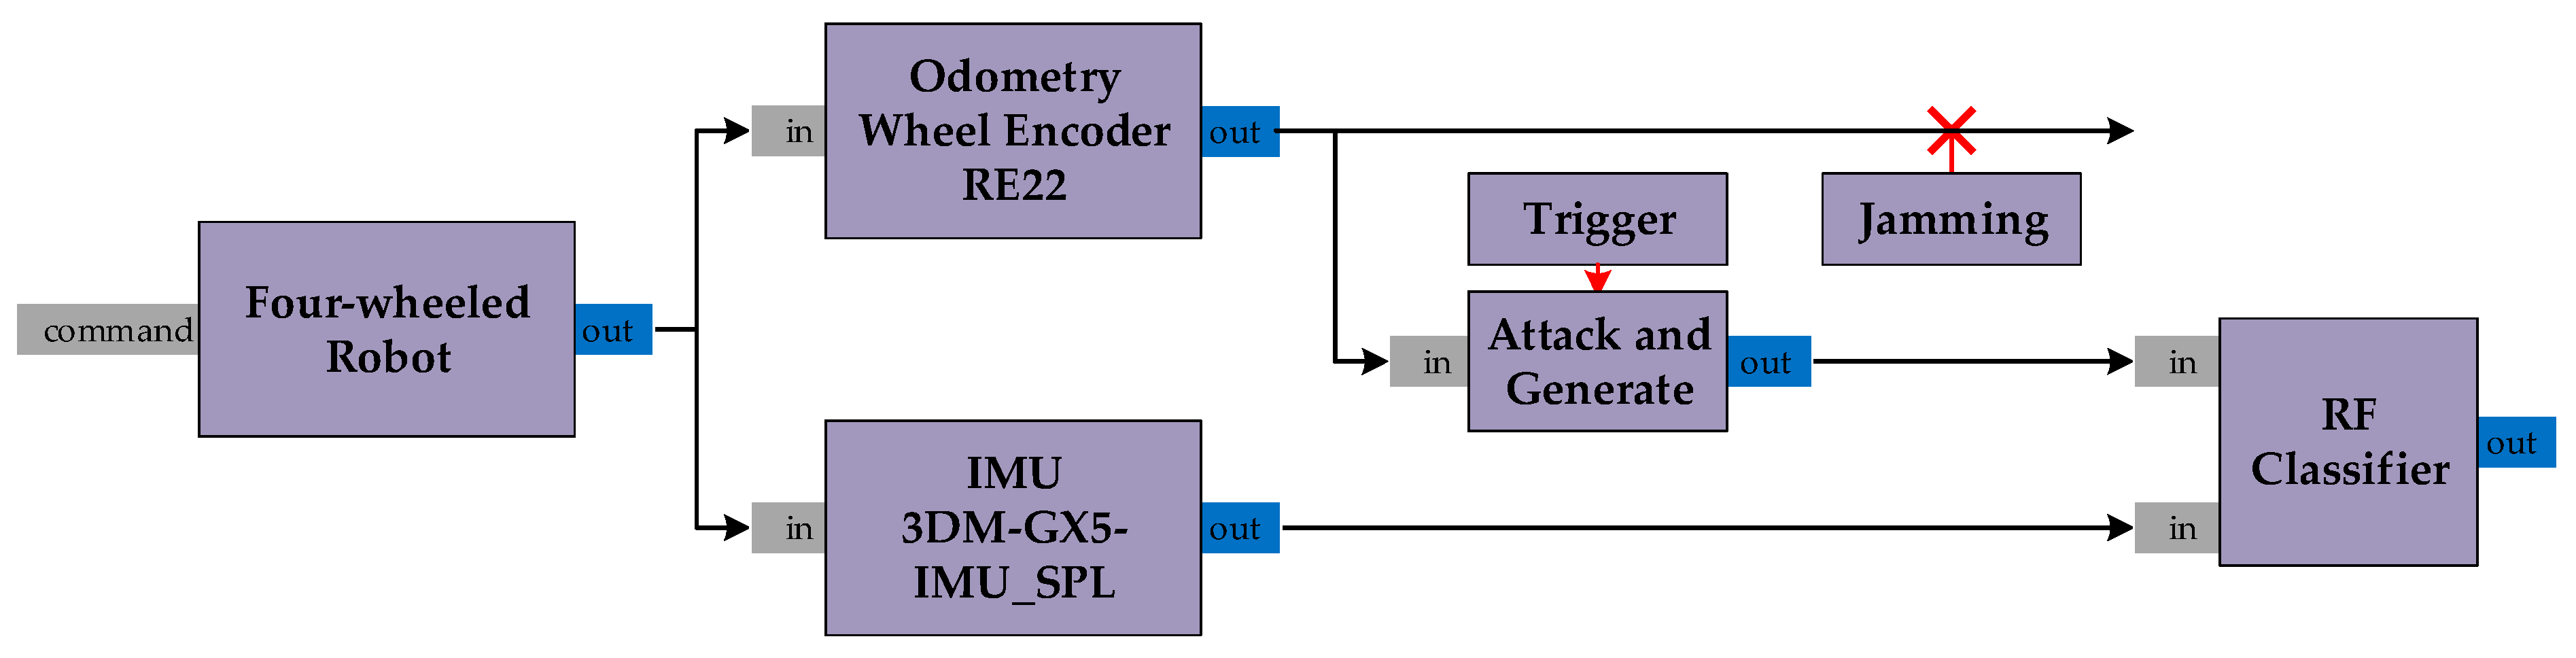
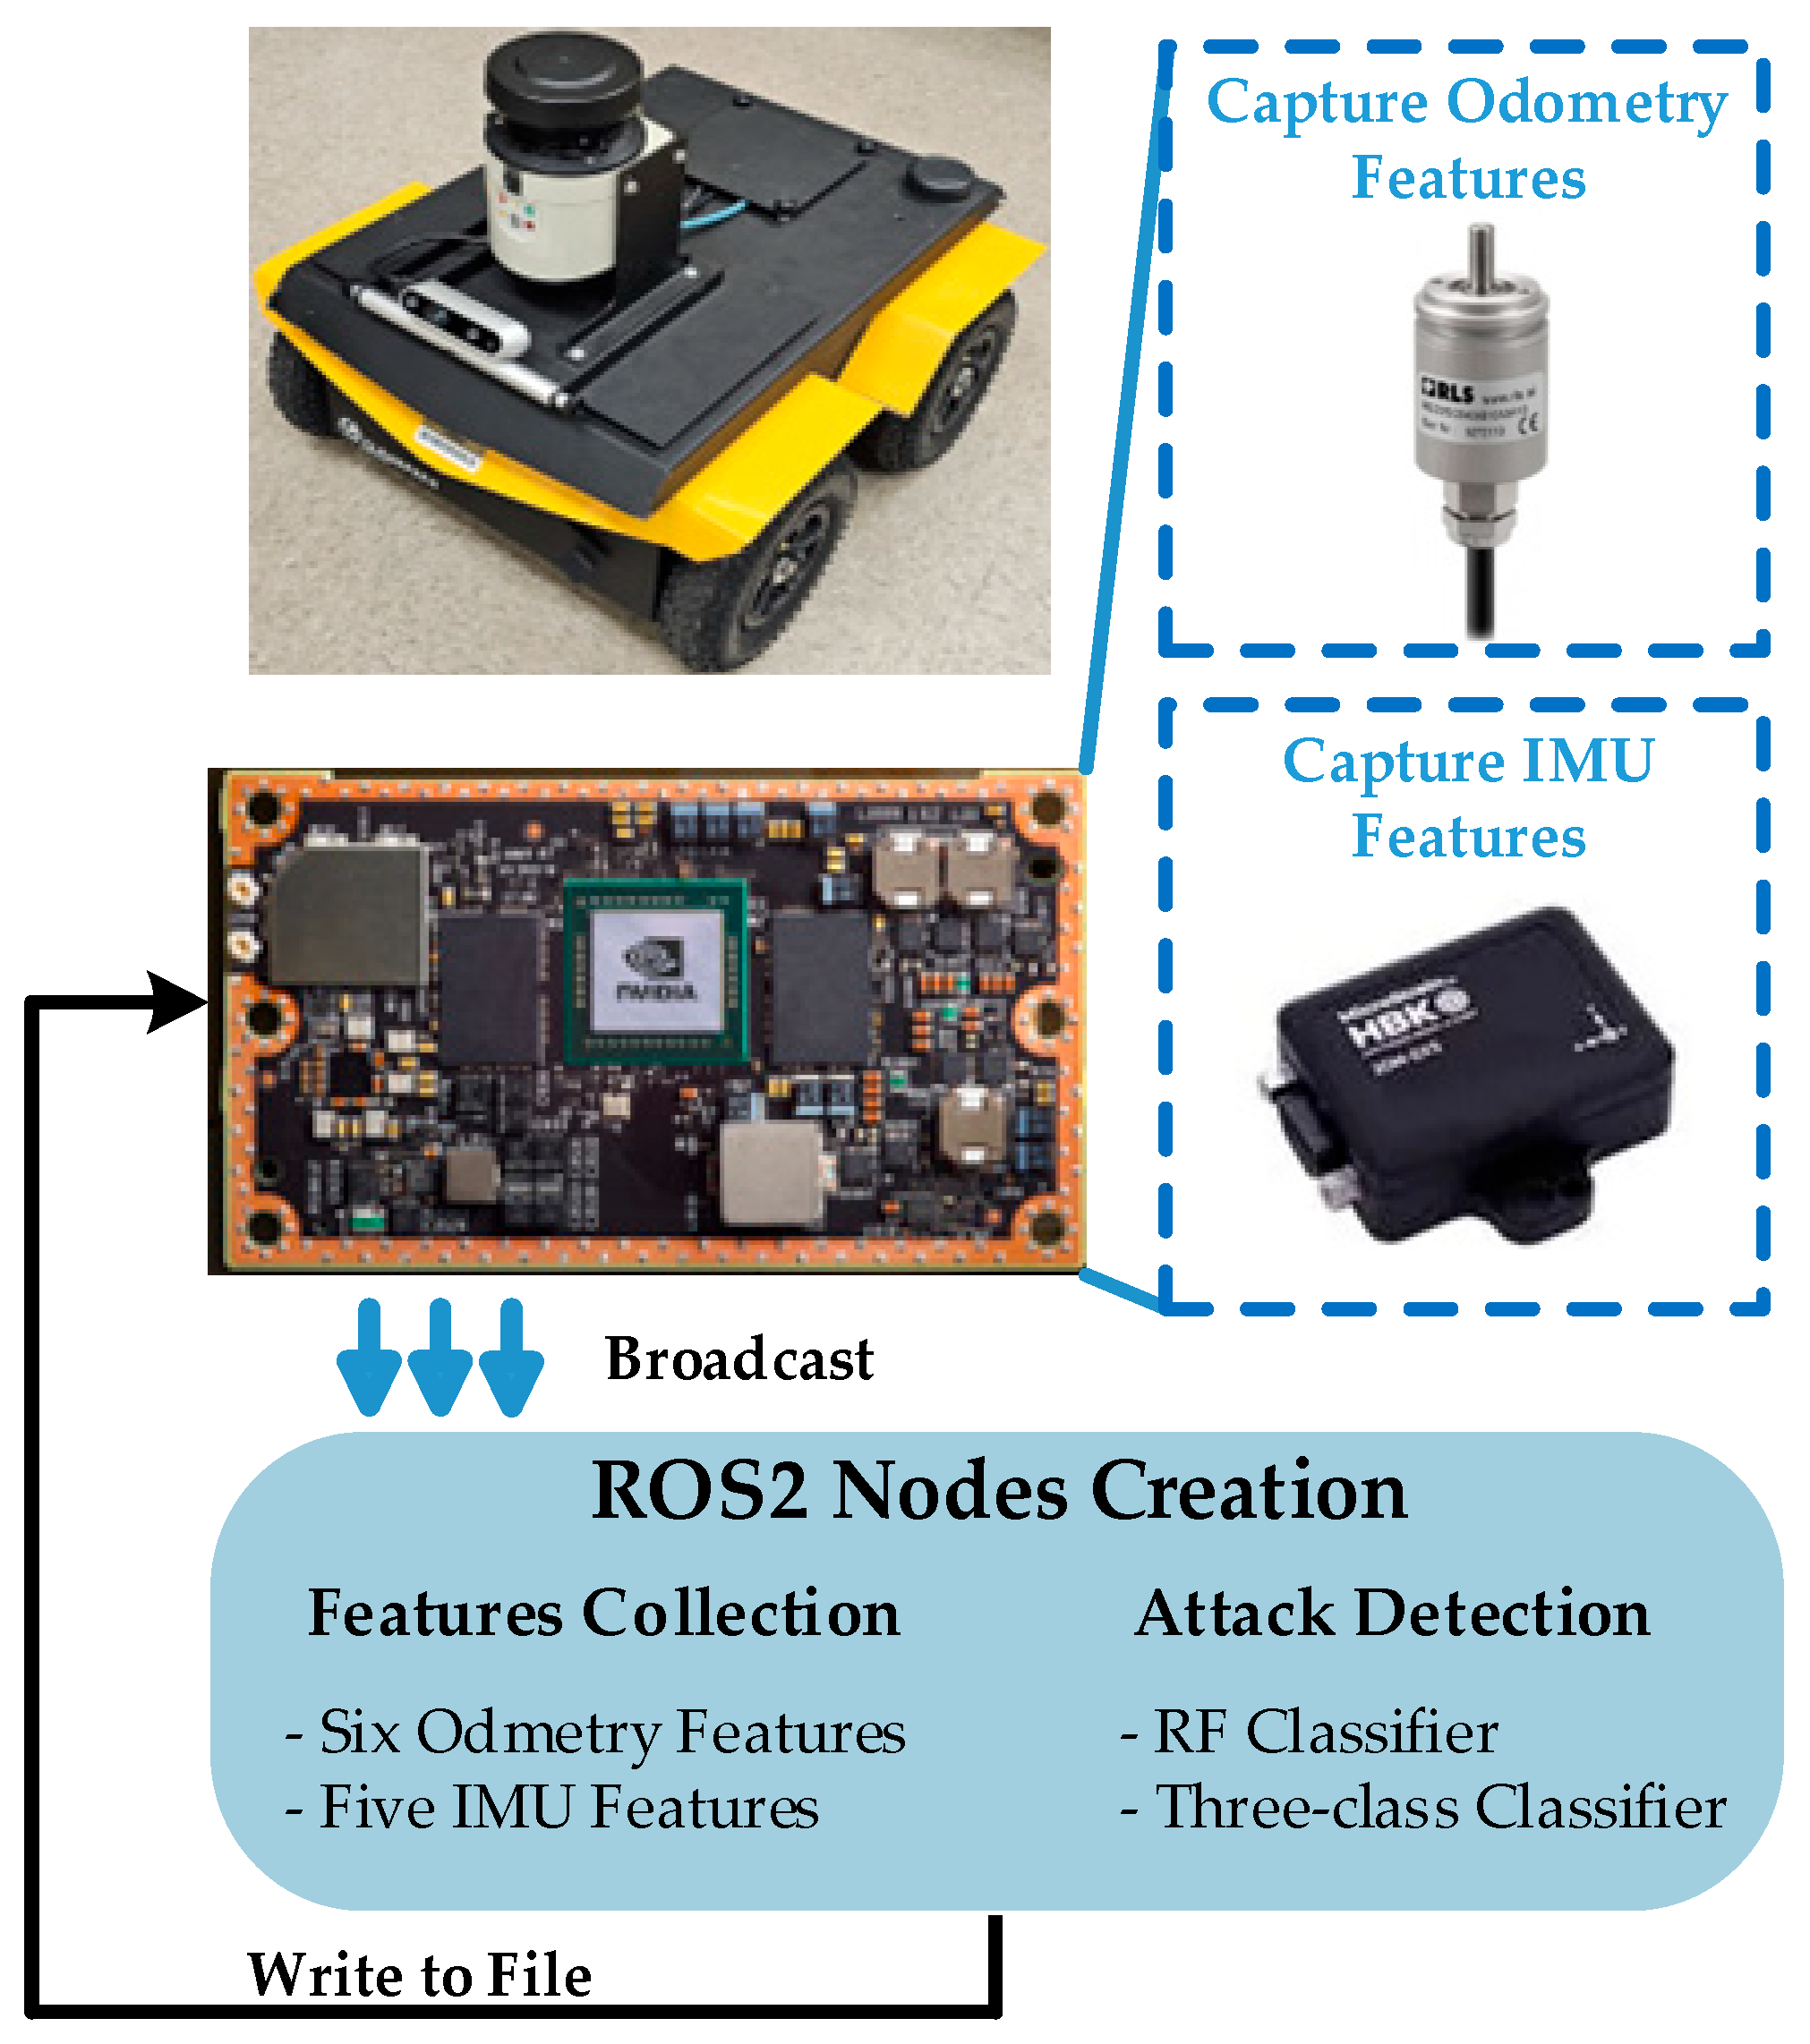
To validate operation in real-time, the trained RF classification model is integrated into an experimental setup featuring the four-wheeled platform from Clearpath Robotics (Kitchener, ON, Canada), i.e., Jackal. A simplified flowchart illustrating this setup is shown in Figure 8. The serialized model file occupies 40.6 MB on disk. When loaded into the active ROS2 Python node, the runtime RAM consumption—including Python version 3.12.7 interpreter dependencies and feature processing buffers—remains at 100 MB. The embedded platform computing unit consists of a microcontroller with 16 GB RAM. Therefore, the model requires less than 1% of the system’s memory, leaving ample resources for other navigation stacks. Also, it executes natively on CPU without requiring GPU acceleration frameworks, making it cost-effective and highly reliable for real-time autonomous ground navigation cybersecurity. A malicious odometry node, i.e., Attack and Generate, is created to mimic a man-in-the-middle attack. It uses the PM and VD cyberattack generator illustrated in Figure 4 with a switch, i.e., trigger, to control the launch of the attack and its type. In this setup, authentic samples are collected by the odometry and IMU sensors presented in Figure 9. The malicious node obtains odometry samples and tampers with the data stream to create either PM or VD attacks. Lastly, both IMU samples and tampered odometry samples are fed to the RF classifier for real-time classification. Experimentations are executed considering routes that differ from trajectories 1–4, i.e., turns and velocity variations, and incorporated diverse terrain vibrations as well as noise and attack magnitudes. Table 7 summarizes live classifications of incoming authentic, PM, and VD messages. Since each attack is triggered as standalone, experimental results are presented across three separate runs.
“Total Messages” are all incoming messages during testing, and “Accuracy” is computed using (1) to present the percent of samples decided upon in favor of Class 0, i.e., authentic, Class 1, i.e., PM, and Class 2, i.e., VD out of the total messages received. Authentic, PM, and VD messages are predicted with an accuracy of 98.47%, 97.12%, and 94.86%, respectively, averaging an accuracy of 96.82%. The if-else conditional branch evaluation logic of the RF classification model consists of lightweight, i.e., if-else logic, rather than complex matrix operations. This leads to a timely inference within the 50 Hz frame budget per sample and effortless execution with no control lag. Thus, the solution herein enables accurate and real-time classification, especially for edge computing platforms.

5. Conclusions

In this work, a ML solution was proposed for detecting and classifying injection cyberattacks with applications for UGVs. A mission-driven autonomous navigation algorithm was built to collect authentic odometry and IMU samples from four different simulated trajectories. A cyberattack generator was also built to obtain injected PM and VD samples to establish a dataset that contains authentic and malicious samples. The resulting dataset was used to train different ML classification models, and evaluations showed that RF exhibited optimum classification performance with VA and class-specific DR greater than 98% together with class-specific MDR and FAR less than 2%. The proposed solution was tested experimentally via a physical UGV platform and demonstrated high accuracy with a sub-millisecond PT, facilitating real-time classification. This solution allowed for the accurate detection of two types of injection attacks with no added hardware or physical infrastructure. It also offered a lightweight setup with no modifications to the existing experimental platform. Future work entails the exploration of this solution in detecting and classifying other types of injection cyberattacks, e.g., ghost injection. Future work also entails the investigation of the inclusion of sample features from other sensors, e.g., LiDAR and camera, to improve detection and classification accuracies. Moreover, future work entails stress-testing the proposed solution across diverse velocity bounds, elevated noise regimes, and multi-tier attack intensities. Lastly, future work entails studying countermeasure strategies, e.g., reinforcement learning, to sideline the impact of cyberattacks targeting UGVs by maintaining safe and trustworthy autonomous navigation in cyber-contested environments.

Author Contributions

Conceptualization, K.A.S.; Methodology, K.A.S.; Software, T.W. and M.A.; Validation, T.W. and M.A.; Formal analysis, T.W.; Investigation, T.W.; Data curation, T.W.; Writing—original draft, T.W.; Writing—review & editing, K.A.S. and M.A.; Visualization, T.W.; Supervision, K.A.S.; Project administration, K.A.S. All authors have read and agreed to the published version of the manuscript.

Funding

This research received no external funding.

Institutional Review Board Statement

Not applicable.

Informed Consent Statement

Not applicable.

Data Availability Statement

The data presented in this study are openly available in [GitHub] at reference number [54].

Conflicts of Interest

The authors declare no conflict of interest.

References

  1. Zhou, N.; Zhang, G.; Zhu, C.; Dong, X. An unstructured roadless environment navigation map construction method based on remote sensing. Geo-Spat. Inf. Sci. 2025, 1–22. [Google Scholar] [CrossRef] [Scilit]
  2. Liu, Q.; You, X.; Zhang, X.; Zuo, J.; Li, J. Dynamic path planning of autonomous mobile robot in off-road environments using experience replay enhanced distributed proximal policy optimization algorithm. Geo-Spat. Inf. Sci. 2023, 1–17. [Google Scholar] [CrossRef] [Scilit]
  3. Cristóvão, M.P.; Portugal, D.; Carvalho, A.E.; Ferreira, J.F. A LiDAR-Camera-Inertial-GNSS Apparatus for 3D Multimodal Dataset Collection in Woodland Scenarios. Sensors 2023, 23, 6676. [Google Scholar] [CrossRef] [Scilit] [PubMed]
  4. Zhang, S.; Zeng, Q. Online Unmanned Ground Vehicle Path Planning Based on Multi-Attribute Intelligent Reinforcement Learning for Mine Search and Rescue. Appl. Sci. 2024, 14, 9127. [Google Scholar] [CrossRef] [Scilit]
  5. Boyanov, Y.; Petrov, O.; Georgieva, T. A review of ground-based robotic systems for search and rescue. In Proceedings of the 2025 34th Annual Conference of the European Association for Education in Electrical and Information Engineering (EAEEIE), Cluj-Napoca, Romania, 18–20 June 2025; pp. 1–7. [Google Scholar]
  6. Ersü, C.; Petlenkov, E.; Janson, K. A Systematic Review of Cutting-Edge Radar Technologies: Applications for Unmanned Ground Vehicles (UGVs). Sensors 2024, 24, 7807. [Google Scholar] [CrossRef] [Scilit] [PubMed]
  7. Trybała, P.; Szrek, J.; Remondino, F.; Kujawa, P.; Wodecki, J.; Blachowski, J.; Zimroz, R. MIN3D Dataset: MultI-seNsor 3D Mapping with an Unmanned Ground Vehicle. PFG–J. Photogramm. Remote Sens. Geoinf. Sci. 2023, 91, 425–442. [Google Scholar] [CrossRef] [Scilit]
  8. El Bou, C.M.; Focchi, M.; Chang, M.R.; Camurri, M.; von Ellenrieder, K.D. Smooth Human–Robot Shared Control for Autonomous Orchard Monitoring With UGVs. IEEE Trans. Autom. Sci. Eng. 2025, 22, 13603–13620. [Google Scholar] [CrossRef] [Scilit]
  9. Autonomous Cars Market Size, Share and Industry Analysis, by Type, by Vehicle Type, and Regional Forecast, 2026–2034. Available online: https://www.fortunebusinessinsights.com/industry-reports/autonomous-cars-market-100141 (accessed on 1 June 2026).
  10. Kolar, P.; Benavidez, P.; Jamshidi, M. Survey of Datafusion Techniques for Laser and Vision Based Sensor Integration for Autonomous Navigation. Sensors 2020, 20, 2180. [Google Scholar] [CrossRef] [Scilit] [PubMed]
  11. Yeong, D.J.; Velasco-Hernandez, G.; Barry, J.; Walsh, J. Sensor and Sensor Fusion Technology in Autonomous Vehicles: A Review. Sensors 2021, 21, 2140. [Google Scholar] [CrossRef] [Scilit] [PubMed]
  12. Fayyad, J.; Jaradat, M.A.; Gruyer, D.; Najjaran, H. Deep Learning Sensor Fusion for Autonomous Vehicle Perception and Localization: A Review. Sensors 2020, 20, 4220. [Google Scholar] [CrossRef] [Scilit] [PubMed]
  13. Ilci, V.; Toth, C. High Definition 3D Map Creation Using GNSS/IMU/LiDAR Sensor Integration to Support Autonomous Vehicle Navigation. Sensors 2020, 20, 899. [Google Scholar] [CrossRef] [Scilit] [PubMed]
  14. Ngo, H.; Fang, H.; Wang, H. Cooperative Perception With V2V Communication for Autonomous Vehicles. IEEE Trans. Veh. Technol. 2023, 72, 11122–11131. [Google Scholar] [CrossRef] [Scilit]
  15. Yang, H.; Hong, J.; Wei, L.; Gong, X.; Xu, X. Collaborative Accurate Vehicle Positioning Based on Global Navigation Satellite System and Vehicle Network Communication. Electronics 2022, 11, 3247. [Google Scholar] [CrossRef] [Scilit]
  16. Wang, Z.; Spasojevic, P.; Schlake, B.W.; Mulay, N.; Zaman, A.F.; Liu, X. Development and Testing of a UWB-Based Vehicle-to-Vehicle (V2V) Ranging System for Self-Propelled Rail Vehicles. IEEE Trans. Veh. Technol. 2024, 73, 3247–3261. [Google Scholar] [CrossRef] [Scilit]
  17. Zhu, X.; Li, Z.; Jiang, Y.; Xu, J.; Wang, J.; Bai, X. Real-Time Vehicle-to-Vehicle Communication-Based Network Cooperative Control System Through Distributed Database and Multimodal Perception: Demonstrated in Crossroads. In Proceedings of Ninth International Congress on Information and Communication Technology (ICICT 2024); Lecture Notes in Networks and Systems; Yang, X.-S., Sherratt, R.S., Dey, N., Joshi, A., Eds.; Springer: Singapore, 2024; Volume 1055, pp. 143–154. [Google Scholar]
  18. Tamang, M.T.; Maheriya, D.; Sharif, M.S.; Sutharssan, T. Autonomous Navigation for TurtleBot3 Robots in Gazebo Simulation Environment. In Proceedings of the 2024 International Conference on Innovation and Intelligence for Informatics, Computing, and Technologies (3ICT), Sakhir, Bahrain, 20–21 November 2024; pp. 568–574. [Google Scholar]
  19. Katona, K.; Neamah, H.A.; Korondi, P. Obstacle Avoidance and Path Planning Methods for Autonomous Navigation of Mobile Robot. Sensors 2024, 24, 3573. [Google Scholar] [CrossRef] [Scilit] [PubMed]
  20. Singh, H. Artificial Intelligence and Robotics Transforming Industries with Intelligent Automation Solutions. SSRN Electron. J. 2020. [Google Scholar] [CrossRef] [Scilit]
  21. Ajeil, F.H.; Ibraheem, I.K.; Azar, A.T.; Humaidi, A.J. Autonomous navigation and obstacle avoidance of an omnidirectional mobile robot using swarm optimization and sensors deployment. Int. J. Adv. Robot. Syst. 2020, 17, 1729881420929498. [Google Scholar] [CrossRef] [Scilit]
  22. Taheri, H.; Hosseini, S.R.; Nekoui, M.A. Deep Reinforcement Learning with Enhanced PPO for Safe Mobile Robot Navigation. arXiv 2024, arXiv:2405.16266. [Google Scholar]
  23. Zhu, K.; Zhang, T. Deep reinforcement learning based mobile robot navigation: A review. Tsinghua Sci. Technol. 2021, 26, 674–691. [Google Scholar] [CrossRef] [Scilit]
  24. Tiwari, R.; Srinivaas, A.; Velamati, R.K. Adaptive Navigation in Collaborative Robots: A Reinforcement Learning and Sensor Fusion Approach. Appl. Syst. Innov. 2025, 8, 9. [Google Scholar] [CrossRef] [Scilit]
  25. Zhu, Y.; Wan Hasan, W.Z.; Harun Ramli, H.R.; Norsahperi, N.M.H.; Mohd Kassim, M.S.; Yao, Y. Deep Reinforcement Learning of Mobile Robot Navigation in Dynamic Environment: A Review. Sensors 2025, 25, 3394. [Google Scholar] [CrossRef] [Scilit] [PubMed]
  26. Winder, D. Tesla Hacked as Electric Cars Targeted in $1 Million Hacking Spree. Available online: https://www.forbes.com/sites/daveywinder/2024/01/27/tesla-hacked-as-electric-cars-targeted-in-1-million-hacking-spree/ (accessed on 5 May 2026).
  27. Researchers Warn AI ‘Blind Spot’ Could Allow Attackers to Hijack Self-Driving Vehicles. Available online: https://news.gatech.edu/news/2026/01/27/researchers-warn-ai-blind-spot-could-allow-attackers-hijack-self-driving-vehicles (accessed on 5 May 2026).
  28. Mohammadi, A.; Ahmari, R.; Hemmati, V.; Owusu-Ambrose, F.; Mahmoud, M.N.; Kebria, P.; Homaifar, A. Detection of Multiple Small Biased GPS Spoofing Attacks on Autonomous Vehicles Using Time Series Analysis. IEEE Open J. Veh. Technol. 2025, 6, 1152–1163. [Google Scholar] [CrossRef] [Scilit]
  29. Guizzaro, C.; Formaggio, F.; Tomasin, S. GNSS Spoofing Attack Detection By IMU Measurements Through A Neural Network. In Proceedings of the 2022 10th Workshop on Satellite Navigation Technology (NAVITEC), Noordwijk, The Netherlands, 5–7 April 2022; pp. 1–6. [Google Scholar]
  30. Ibrahum, A.D.M.; Hussain, M.; Hong, J.-E. Deep learning adversarial attacks and defenses in autonomous vehicles: A systematic literature review from a safety perspective. Artif. Intell. Rev. 2024, 58, 28. [Google Scholar] [CrossRef] [Scilit]
  31. Botta, A.; Rotbei, S.; Zinno, S.; Ventre, G. Cyber security of robots: A comprehensive survey. Intell. Syst. Appl. 2023, 18, 200237. [Google Scholar] [CrossRef] [Scilit]
  32. Prasad, A.; Chandra, S. Defending ARP Spoofing-based MitM Attack using Machine Learning and Device Profiling. In Proceedings of the 2022 International Conference on Computing, Communication, and Intelligent Systems (ICCCIS), Greater Noida, India, 4–5 November 2022; pp. 978–982. [Google Scholar]
  33. Avcı, İ.; Koca, M. Cybersecurity attack detection model, using machine learning techniques. Acta Polytech. Hung. 2023, 20, 29–44. [Google Scholar] [CrossRef] [Scilit]
  34. Pan, D.; Ge, X.; Ding, D.; Han, Q.-L. Simultaneous Cyber Attack Estimation and Radar Spoofing Attack Detection for Connected Automated Vehicles. In Proceedings of the IECON 2023—49th Annual Conference of the IEEE Industrial Electronics Society, Singapore, 16–19 October 2023; pp. 1–6. [Google Scholar]
  35. Zhang, K.; Keliris, C.; Parisini, T.; Jiang, B.; Polycarpou, M.M. Passive Attack Detection for a Class of Stealthy Intermittent Integrity Attacks. IEEE/CAA J. Autom. Sin. 2023, 10, 898–915. [Google Scholar] [CrossRef] [Scilit]
  36. Hu, M.; Bu, L.; Bian, Y.; Qin, H.; Sun, N.; Cao, D.; Zhong, Z. Hierarchical Cooperative Control of Connected Vehicles: From Heterogeneous Parameters to Heterogeneous Structures. IEEE/CAA J. Autom. Sin. 2022, 9, 1590–1602. [Google Scholar] [CrossRef] [Scilit]
  37. Xie, M.; Ding, D.; Ge, X.; Han, Q.-L.; Dong, H.; Song, Y. Distributed Platooning Control of Automated Vehicles Subject to Replay Attacks Based on Proportional Integral Observers. IEEE/CAA J. Autom. Sin. 2024, 11, 1954–1966. [Google Scholar] [CrossRef] [Scilit]
  38. Arafin, M.T.; Kornegay, K. Attack Detection and Countermeasures for Autonomous Navigation. In Proceedings of the 2021 55th Annual Conference on Information Sciences and Systems (CISS), Baltimore, MD, USA, 24–26 March 2021; pp. 1–6. [Google Scholar]
  39. Shen, J.; Won, J.Y.; Chen, Z.; Chen, Q.A. Drift with devil: Security of Multi-Sensor fusion based localization in High-Level autonomous driving under GPS spoofing. In Proceedings of the 29th USENIX Security Symposium (USENIX Security 20), Boston, MA, USA, 12–14 August 2020; pp. 931–948. [Google Scholar]
  40. Liu, S.; Cheng, X.; Yang, H.; Shu, Y.; Weng, X.; Guo, P.; Zeng, K.C.; Wang, G.; Yang, Y. Stars can tell: A robust method to defend against GPS spoofing attacks using off-the-shelf chipset. In Proceedings of the 30th USENIX Security Symposium (USENIX Security 21), Virtual, 11–13 August 2021; pp. 3935–3952. [Google Scholar]
  41. Zhou, Z.; Li, H.; Lu, M. Doppler-Based RAIM for GNSS Spoofing Detection in Vehicular Applications. IEEE Trans. Veh. Technol. 2025, 74, 10306–10320. [Google Scholar] [CrossRef] [Scilit]
  42. Chattopadhyay, A.; Lam, K.-Y.; Tavva, Y. Autonomous Vehicle: Security by Design. IEEE Trans. Intell. Transp. Syst. 2021, 22, 7015–7029. [Google Scholar] [CrossRef] [Scilit]
  43. Wang, C.; Tok, Y.C.; Poolat, R.; Chattopadhyay, S.; Elara, M.R. How to secure autonomous mobile robots? An approach with fuzzing, detection and mitigation. J. Syst. Archit. 2021, 112, 101838. [Google Scholar] [CrossRef] [Scilit]
  44. Cybersecurity and Infrastructure Security Agency (CISA). Autonomous Ground Vehicle Security Guide: Transportation Systems Sector; CISA: Washington, DC, USA, 2021. Available online: https://www.cisa.gov/resources-tools/resources/autonomous-ground-vehicle-security-guide (accessed on 6 June 2026).
  45. Deng, Y.; Zhang, T.; Lou, G.; Zheng, X.; Jin, J.; Han, Q.L. Deep learning-based autonomous driving systems: A survey of attacks and defenses. IEEE Trans. Ind. Inform. 2021, 17, 7897–7912. [Google Scholar] [CrossRef] [Scilit]
  46. Issa, A.S.A.; Albayrak, Z. DDoS attack intrusion detection system based on hybridization of CNN and LSTM. Acta Polytech. Hung. 2023, 20, 105–123. [Google Scholar] [CrossRef] [Scilit]
  47. Kandasamy, V.; Roseline, A.A. Harnessing advanced hybrid deep learning model for real-time detection and prevention of man-in-the-middle cyber attacks. Sci. Rep. 2025, 15, 1697. [Google Scholar] [CrossRef] [Scilit] [PubMed]
  48. Satpathy, S.; Swain, P.K.; Mohanty, S.N.; Basa, S.S. Enhancing Security: Federated Learning against Man-In-The-Middle Threats with Gradient Boosting Machines and LSTM. In Proceedings of the 2024 IEEE International Conference on Advanced Video and Signal Based Surveillance (AVSS), Niagara Falls, ON, Canada, 15–18 July 2024; pp. 1–8. [Google Scholar]
  49. Majumder, S.; Deb Barma, M.K.; Saha, A. ARP spoofing detection using machine learning classifiers: An experimental study. Knowl. Inf. Syst. 2025, 67, 727–766. [Google Scholar] [CrossRef] [Scilit]
  50. Bolboacă, R.; Haller, P.; Kontses, D.; Papageorgiou-Koutoulas, A.; Doulgeris, S.; Zingopis, N.; Samaras, Z. Tampering Detection for Automotive Exhaust Aftertreatment Systems using Long Short-Term Memory Predictive Networks. In Proceedings of the 2022 IEEE European Symposium on Security and Privacy Workshops (EuroS&PW), Genoa, Italy, 6–10 June 2022; pp. 358–367. [Google Scholar]
  51. Dasgupta, S.; Rahman, M.; Islam, M.; Chowdhury, M. A Sensor Fusion-Based GNSS Spoofing Attack Detection Framework for Autonomous Vehicles. IEEE Trans. Intell. Transp. Syst. 2022, 23, 23559–23572. [Google Scholar] [CrossRef] [Scilit]
  52. Dimos, A.; Skoutas, D.N.; Nomikos, N.; Skianis, C. A Survey on UxV Swarms and the Role of Artificial Intelligence as a Technological Enabler. Drones 2025, 9, 700. [Google Scholar] [CrossRef] [Scilit]
  53. Yan, X.; Sarkar, M.; Lartey, B.; Gebru, B.; Homaifar, A.; Karimoddini, A.; Tunstel, E. An Online Learning Framework for Sensor Fault Diagnosis Analysis in Autonomous Cars. IEEE Trans. Intell. Transp. Syst. 2023, 24, 14467–14479. [Google Scholar] [CrossRef] [Scilit]
  54. Wan, T.J.; AI Shamaileh, K. ML-Auto-UGV-Injection-Detection: A Machine Learning-Powered Solution for Safe Autonomous Robotic Ground Navigation in Cyber-Contested Environments. GitHub. 2026. Available online: https://github.com/W-w-star/ML-Auto-UGV-injection-detection (accessed on 21 June 2026).
  55. Clearpath Robotics. Jackal UGV—Small Weatherproof Robot. Available online: https://clearpathrobotics.com/jackal-small-unmanned-ground-vehicle/ (accessed on 15 March 2025).
  56. Clearpath Robotics. Inertial Measurement Units. Available online: https://docs.clearpathrobotics.com/docs/ros/config/yaml/sensors/imu/ (accessed on 15 March 2025).
  57. Clearpath Robotics. Manipulation in Gazebo Ignition. Available online: https://docs.clearpathrobotics.com/docs/ros2humble/ros/tutorials/manipulation/gazebo/ (accessed on 15 March 2025).
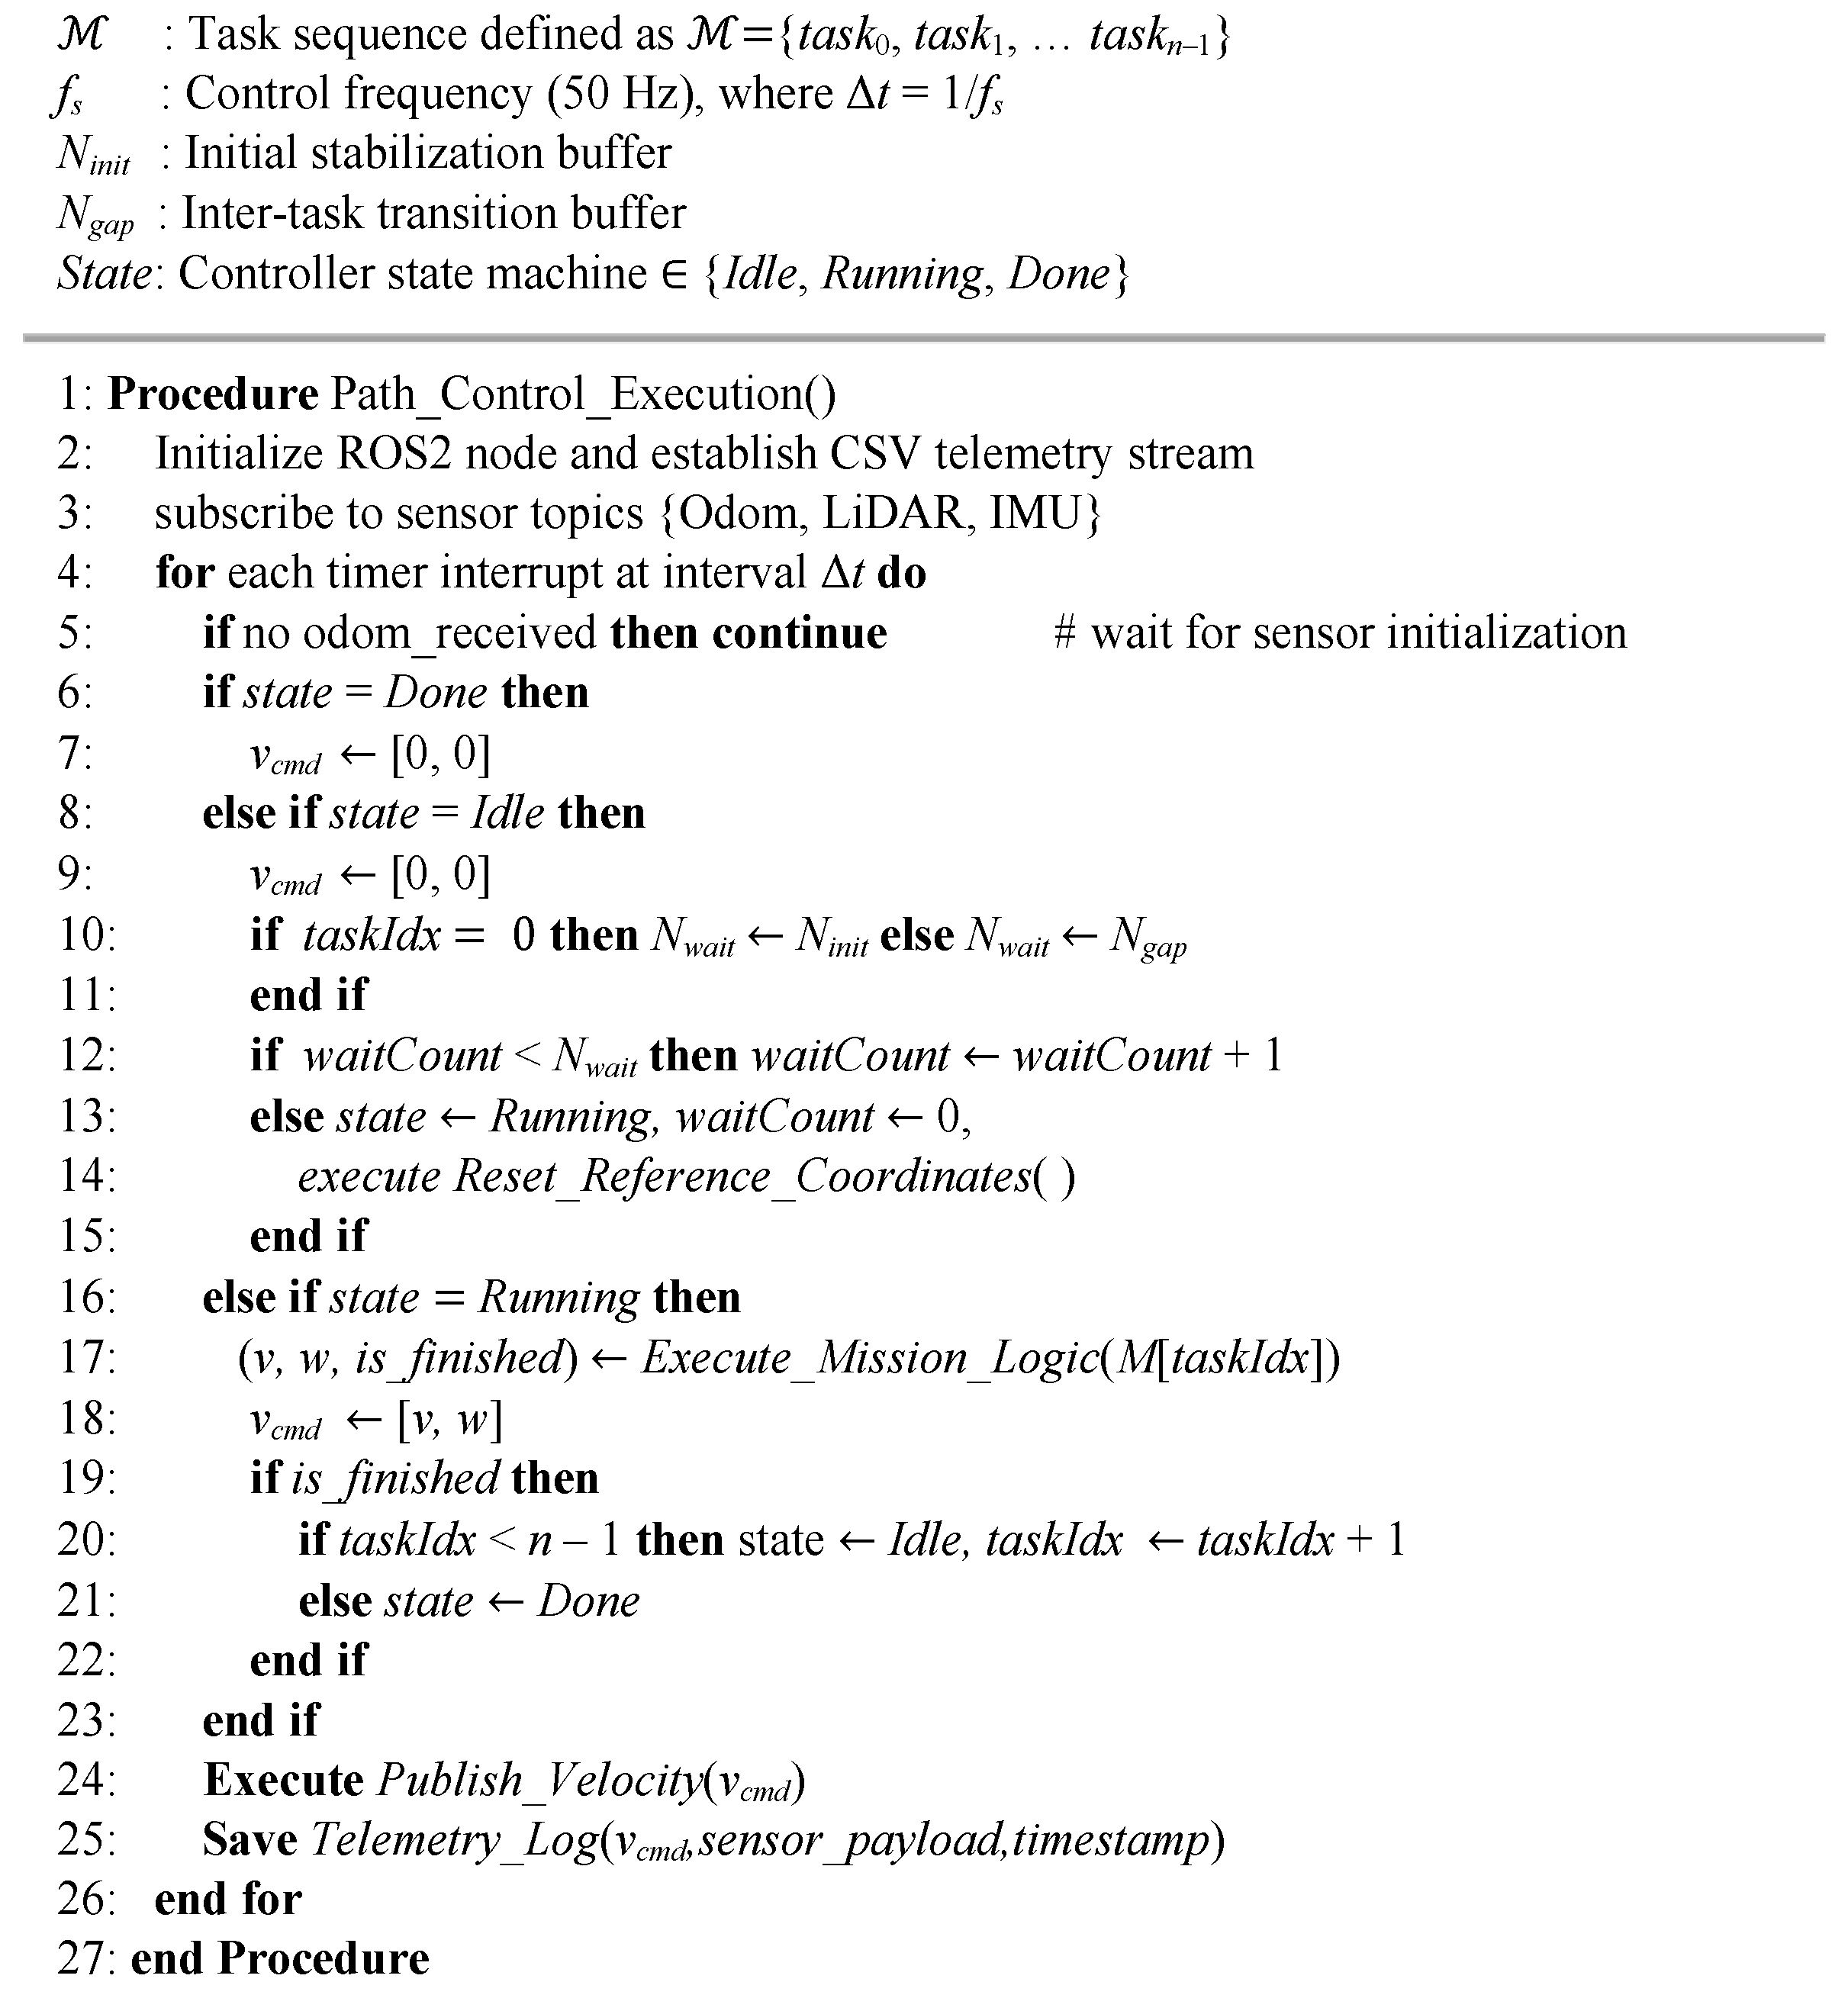
Figure 1. Pseudocode for the mission-driven controller algorithm.
Applsci 16 07666 g001
Figure 2. Pseudocode for the mission-driven autonomous navigation algorithm.
Applsci 16 07666 g002
Figure 3. Two-step scenario for launching malicious injection cyberattacks: (a) step 1 and (b) step 2.
Applsci 16 07666 g003
Figure 4. Pseudocode to generate attack samples for PM and VD.
Applsci 16 07666 g004
Figure 5. Designed trajectories with and without the presence of PM: (a) trajectory 1, (b) trajectory 2, (c) trajectory 3, and (d) trajectory 4. Solid traces (in blue) represent authentic trajectories, whereas dashed traces (in red) represent counterpart attacked trajectories.
Applsci 16 07666 g005
Figure 6. Feature analysis showcasing (a) correlation and (b) importance.
Applsci 16 07666 g006
Figure 7. Confusion matrices for the developed classifiers: (a) RF, (b) DT, (c) KNN, (d) MLP, (e) SVM.
Applsci 16 07666 g007
Figure 8. A simplified flowchart of this experimental setup.
Applsci 16 07666 g008
Figure 9. Hardware-software configuration for classifying odometry and IMU features.
Applsci 16 07666 g009
Table 1. Extracted features for developing the classifiers.
FeatureRepresentationUnitBrief Description
time stampTsnsTime elapsed since the start of the simulation
task typeTt-Indicates the designated driving sequence within the tasks
command linear velocity in x-axisClvxm/sLinear velocity operator sends to UGV in x-axis
command linear velocity in z-axisCavwrad/sAngular velocity operator sends to UGV in z-axis
odometry positionOpx, Opy, OpzmPosition estimated in the simulation world
heading angle (yaw)ΘradCalculated yaw angle from the odometry quaternion
odometry orientationOorx, Oory, Oorz, Oorw-Attitude represented as a normalized quaternion
odometry linear velocity in x-axisOlvxm/sEstimated linear velocity derived from wheel odometry
odometry angular velocity in z-axisOavwrad/sEstimated angular velocity derived from wheel odometry
IMU linear velocitiesIlvx, Ilvy, Ilvzm/s2Measured by the IMU three-axis accelerometer
IMU angular velocitiesIavx, Iavy, Iavzrad/sMeasured by the IMU three-axis gyroscope
IMU orientationsIorx, Iory, Iorz, Iorw-Attitude of the vehicle relative to the inertial reference frame
label--Represent the type of the data
trajectory label--Represent the number of the trajectory
Table 2. Distribution of authentic and attack samples.
Authentic SamplesPM Attack SamplesVD Attack SamplesTotal Samples/Trajectory
Trajectory 194004700470018,800
Trajectory 211,0005500550022,000
Trajectory 312,6006300630025,200
Trajectory 411,0005500550022,000
Total samples/type44,00022,00022,00088,000
Table 3. Executed tasks (all authentic) for trajectories 1–4.
Trajectory 1Trajectory 2Trajectory 3Trajectory 4
Task TypeDistance
(m)
Velocity
(m/s) *
Task TypeDistance
(m)
Velocity
(m/s) *
Task TypeDistance
(m)
Velocity
(m/s) *
Task TypeDistance
(m)
Velocity
(m/s) *
Obstacle1.080.6Turn-0.7Turn-0.7Turn-0.7
Turn-0.7Obstacle26.613.0Obstacle0.840.6Dist10.005.0
Dist3.500.7Turn-0.6Turn-0.7Turn-0.8
Turn-0.6Obstacle27.012.0Obstacle0.850.7Dist30.005.0
Obstacle25.314.0Turn-0.8Turn-0.7Turn-0.8
Turn-0.8Dist5.001.2Obstacle26.954.0Dist12.004.0
Dist3.000.8Turn-1.5Turn-1.5Turn-1.5
Turn-1.5Obstacle12.440.8Obstacle27.710.9Dist6.000.9
Dist3.000.9Turn-0.7Turn-0.7Turn-1.8
Turn-0.7Obstacle22.680.9Dist10.000.8Dist18.004.5
Obstacle7.631.5Turn-1.8Turn-1.8Turn-0.7
Turn-1.8Obstacle7.502.5Obstacle2.422.5Dist8.000.8
Obstacle17.462.5Turn-1.1Turn-1.1Turn-1.2
Turn-1.1Obstacle19.753.0Obstacle17.513.0Dist11.002.5
Obstacle19.603.0Turn-1.2Turn-1.2Turn-1.1
Turn-1.2Obstacle3.992.0Obstacle17.292.0Dist4.003.0
Obstacle3.782.0Turn-1.3Turn-1.3Turn-1.3
Turn-1.3Obstacle3.541.0Obstacle19.601.0Dist3.002.0
Obstacle3.581.0Turn-0.8Turn-0.8Turn-0.9
Turn-0.8Obstacle4.660.4Obstacle3.460.4Dist4.000.4
Obstacle4.710.4Turn-0.9Turn-0.9Turn-1.4
Turn-0.9Obstacle5.301.1Obstacle3.141.1Dist3.001.1
Obstacle5.231.1Turn-1.4Turn-0.8Turn-1.1
Turn-1.4Dist5.003.5Obstacle4.770.4Obstacle4.150.4
Dist5.003.5-- Turn-0.9Turn-1.3
-- -- Obstacle5.251.1Obstacle6.151.1
-- -- Turn-1.4Turn-1.4
Dist5.003.5Dist5.003.5
* Velocity for the Turn tasks is in (rad/s). Different colors are used to represent the tasks for each of Trajectories 1–4.
Table 4. Range of feature values for generating PM and VD attacks.
FeatureDescriptionValueUnit
Θ: Heading angle, i.e., yaw. Obtained by altering orientation & positionMaximum cumulative drift angle injected into Θ10 (min)
25 (max)
Degree
Olvx: Odometry linear velocity in x-axis. Obtained by altering velocity & positionScaling factor or applied to Olvx0.6 (min)
1.4 (max)
-
Table 5. Optimized hyperparameters for each model.
ClassifierHyperparametersOptimized Value
RFBootstrapFalse
CriterionGini
Max depth25
Min. samples leaf1
Min. samples split10
No. of estimators287
Max. featuresSqrt
KNNAlgorithmAuto
Leaf size30
MetricEuclidean
No. of neighbors3
Power2
WeightDistance
MLPActivationRelu
Alpha0.0002910635913
Hidden layers(128, 64)
Max. iter173
SolverAdam
Momentum0.953595
Initial learning rate0.0030049873592
Learning_rateConstant
Early stoppingTrue
DTCriterionGini
Max. depth88
Min. samples leaf2
Min. samples split2
Max. featuresNull
SplitterBest
SVMSvm_C82.78543388872
Kernelrbf
ShrinkingTrue
ProbabilityFalse
Tolerance1.00 × 10−3
Max. iterNull
Table 6. Evaluation metrics of the developed classifiers.
Avg. Performance MetricsClass-Specific DR (%)Class-Specific MDR (%)Class-Specific FAR (%)Time (ms)
VAPRDRFSAuthPMVDAuthPMVDAuthPMVDTTPT
RF99.2699.4299.199.2699.7599.4198.130.250.591.871.230.040.132618.32156.32
KNN96.1596.5895.6996.1397.5696.6392.892.443.377.115.081.030.7125.81414.56
MLP93.6494.3492.9193.6295.8996.3886.454.113.6213.558.540.132.64171,129.540.78
DT98.7698.9198.5998.7599.2899.297.290.720.82.711.70.10.42495.312.59
SVM94.6496.2393.2594.7198.9494.81861.065.19149.550.340.4187,217.932,593.01
Table 7. Live classification experiment.
Total MessagesMessages TypeAccuracy
2421Authentic98.48%
4202Authentic injected with PM97.12%
3466Authentic injected with VD94.86%
Disclaimer/Publisher’s Note: The statements, opinions and data contained in all publications are solely those of the individual author(s) and contributor(s) and not of MDPI and/or the editor(s). MDPI and/or the editor(s) disclaim responsibility for any injury to people or property resulting from any ideas, methods, instructions or products referred to in the content.