Article

Damage Evolution and Energy Dissipation Mechanism of Sandstone Subjected to Freeze–Thaw Action: Effects of Moisture Conditions

1
School of Resources and Safety Engineering, Central South University, Changsha 410083, China
2
Changsha Institute of Mining Research Co., Ltd., Changsha 410083, China
3
State Key Laboratory of Safety Technology of Metal Mines, Changsha Institute of Mining Research Co., Ltd., Changsha 410012, China
*
Author to whom correspondence should be addressed.
Appl. Sci. 2026, 16(15), 7593; https://doi.org/10.3390/app16157593
Submission received: 9 June 2026 / Revised: 2 July 2026 / Accepted: 9 July 2026 / Published: 30 July 2026
(This article belongs to the Special Issue Recent Advances in Rock Mass Engineering: 2nd Edition)

Abstract

To investigate the effects of different moisture conditions and numbers of freeze–thaw cycles on the damage deterioration behavior of red sandstone, three freeze–thaw conditions were used in this study: GA (sealed water-retaining state after saturation), GB (semi-immersed state after saturation), and GC (full immersion state after saturation). The samples were subjected to 20, 40, and 60 freeze–thaw cycles, followed by uniaxial compression tests and acoustic emission (AE) monitoring. By analysing the stress–strain curves, tangent modulus–strain curves, crack-closure parameters, brittleness indices, AE counts, and energy dissipation characteristics, the freeze–thaw damage mechanism of red sandstone samples under disparate moisture boundary conditions was revealed. The results show that as the number of freeze–thaw cycles increases, the uniaxial compressive strength and tangential deformation modulus of red sandstone samples gradually decrease, whereas the peak strain and full compaction strain increase. The crack-closure stage is prolonged, and the failure process changes from sudden brittle failure to progressive damage failure. The degree of damage differed among the samples under different moisture conditions; overall, the GB group (semi-immersed state) exhibited the most pronounced deterioration, followed by the GC group (fully immersed state), whereas the GA group (sealed water-retaining state) experienced relatively weak deterioration. Energy analysis indicates that freeze–thaw cycling decreases the elastic energy storage capacity and increases the proportion of dissipated energy. The freeze–thaw damage variable established on the basis of the peak dissipated energy ratio can be used to characterize the strength attenuation and deformation growth processes effectively.

1. Introduction

Freeze–thaw cycling is among the most common environmental actions in cold-region rock engineering and broadly occurs in engineering scenarios such as open-pit slopes, tunnel-surrounding rocks, mine slopes, subgrades in seasonally frozen soil regions, and reservoir bank slopes in cold areas. Under the long-term alternation of low-temperature freezing and warming-induced thawing, pore water inside rocks undergoes repeated phase transitions. This process subjects pore walls and crack tips to periodic frost-heaving pressure, thereby inducing the initiation, propagation, and coalescence of microcracks and ultimately causing the continuous deterioration of rock strength, stiffness, and durability [1,2,3,4,5,6,7,8]. Previous studies have shown that freeze–thaw cycles increase rock porosity, reduce the P-wave velocity, decrease the peak strength and elastic modulus, and increase the peak strain, residual deformation, and development degree of postfailure cracks [6,7,8,9,10,11,12,13]. Therefore, investigating rock damage evolution under freeze–thaw cycling is crucial for assessing the stability and long-term service security of rock engineering in cold regions.
Rocks contain pores and complex cementitious components, making them more susceptible to pore expansion, weakening of particle cementation, and connectivity of crack networks in freeze–thaw environments [1,3]. In addition, the cemented structure among mineral particles inside rocks tends to degrade under the combined action of water–ice phase transition, temperature cycling, and external loading. During freezing, the pore water volume increases by approximately 9%. As the resulting frost-heaving pressure exceeds the local tensile strength of rock or cementation strength between particles, existing pores and microcracks further open and may form new damage channels [4,13,14,15,16,17,18,19,20,21,22,23,24,25,26]. With increasing cycles, repeated frost heaving and thawing continuously weaken the structural integrity of the rock, gradually transforming it from a relatively intact brittle material into a damaged material containing multiscale defects.
In addition to the number of freeze–thaw cycles, the rock water content is also a critical influencing factor for the degree of freeze–thaw damage [4,5]. In practical engineering, rock masses are often not always completely dry or fully saturated but may be affected by various moisture boundary conditions, such as groundwater-level fluctuations, rainfall infiltration, capillary water absorption, evaporation-induced drying, and local ponding. Under different water content states, the pore water content, saturation, moisture migration path, and freezing-front position differ, resulting in different frost-heaving pressure distributions and crack propagation modes [4]. To study the effects of different moisture environments on freeze–thaw damage in granite, Weng et al. [4] placed saturated samples under three freeze–thaw conditions: sealed, semi-immersed, and fully immersed. They reported that compared with fully immersed samples, semi-immersed samples exhibited more evident moisture migration during freeze–thaw cycling, a faster increase in water content, and more significant increases in porosity and decreases in wave velocity after freeze–thaw treatment. That study further indicated that under semi-immersed conditions, samples are simultaneously affected by moisture evaporation, capillary replenishment, freezing suction, and thawing-induced replenishment. As a result, moisture migration and local saturation changes become more complex, making nonuniform frost-heaving damage and local crack propagation more likely [4]. Therefore, analysing only the freeze–thaw damage from the perspective of the number of cycles is insufficient to fully elucidate the deterioration mechanism of red sandstone samples under different moisture boundary conditions.
At present, research on freeze–thaw rock damage focuses mainly on macroscopic mechanical parameters, physical properties, pore structure, and damage constitutive models. Huang et al. [9] established a statistical damage constitutive model under coupled freeze–thaw and loading conditions and reported that freeze–thaw cycles markedly weaken rock strength and deformation modulus and alter the damage evolution process. Fang et al. [10], Li et al. [11], Lin et al. [12], and Jiang et al. [13] described the evolution of rock damage variables after freeze–thaw cycling from the perspectives of damage statistical models, constitutive relationships, and strength degradation, respectively. Ma et al. [14], Wang et al. [15], Jia et al. [16], Zhou et al. [17], and Huang et al. [18] further demonstrated, from pore structure, energy dissipation, and multiscale damage perspectives, that freeze–thaw cycling causes attenuation of mechanical parameters and deterioration of the internal structure of rocks. Moreover, nuclear magnetic resonance (NMR), computed tomography (CT), scanning electron microscopy (SEM), and acoustic emission (AE) have been gradually applied to reveal the evolution of pore structures and cracks inside rocks subjected to freeze–thaw action. Ke et al. [6,7] used nuclear magnetic resonance (NMR) to survey sandstone pore structure changes under freeze–thaw action and reported that freeze–thaw cycling significantly changed pore size and pore connectivity. Ullah et al. [27] and Xing et al. [28] analysed crack development in freeze–thaw–treated rocks using AE and energy evolution characteristics. Shi [29] and Lockner [30] also reported that AE signals can be used to identify crack types, crack activity intensity, and failure stages inside rocks or rock-like materials. Therefore, for freeze–thaw-damaged rocks, the AE count, cumulative energy, and energy-burst characteristics can reflect differences in crack propagation modes under different initial damage states.
From an energy perspective, the rock deformation and failure process is essentially a continuous transformation of externally input energy among storage, release, and dissipation [31,32,33,34,35]. On the basis of energy dissipation and energy release principles, Xie et al. [31] proposed that rock strength failure and structural instability are strongly related to energy dissipation and that an increase in dissipated energy reflects internal crack propagation and structural damage development. Subsequently, Xie et al. [32] further systematically analysed the energy mechanism during rock deformation and failure and reported that externally input energy during rock loading is primarily transformed into elastic strain energy and dissipated energy. Energy dissipated is primarily consumed by pore compaction, friction along crack surfaces, particle cementation failure, microcrack propagation, and plastic deformation. Gong et al. [33] surveyed the evolution features of energy storage and energy dissipation in rock through disparate tensile failure tests and reported that rock clearly accumulates elastic energy and dissipates energy before failure. Meng et al. [34] and Zhang et al. [35], on the basis of energy evolution under cyclic loading and unloading, reported that the energy distribution relationship can effectively reflect rock damage development and failure-stage transition. On the basis of uniaxial compression tests on frozen-thawed sandstone, Gao et al. [1] reported that freeze–thaw cycling significantly affects the evolution of total strain energy, elastic energy, and dissipated energy in freeze–damaged rocks. The more pronounced the degree of freeze–thaw damage is, the weaker the elastic energy storage capacity and the higher the proportion of dissipated energy. That study further defined a freeze–thaw damage variable using the peak dissipated energy ratio to characterize the relationship between peak strength attenuation and peak strain growth. Wang et al. [2] analysed energy dissipation and damage evolution during red sandstone specimen dynamic compression failure after freeze–thaw cycles and reported that freeze–thaw cycling changes the energy distribution mode during failure and that damage evolution corresponds well with increased dissipated energy. Thus, the energy dissipation method can explain the evolution of freeze–thaw-induced rock damage from the essence of deformation and failure, serving as an important analytical approach that links macroscopic mechanical deterioration with internal crack propagation.
Although extensive studies have explored the mechanical deterioration, moisture-state effects, and energy dissipation mechanisms of freeze–thaw–treated rocks [1,2,3,4,9,10,11,12,13,14,15,16,17,18,27], comprehensive investigations remain relatively limited for rocks subjected to sealed water-retaining, semi-immersed, and fully immersed freeze–thaw states after saturation, especially when strength and deformation, crack closure, brittleness variation, AE response, and energy-based damage variables are jointly considered under different numbers of cycles. In particular, the damage amplification effect induced by the coupling between moisture migration and frost heaving under semi-immersed conditions, as well as its difference from frost-heaving action under fully immersed conditions, still needs to be systematically analysed using complete stress–strain curves, tangent modulus–strain curves, AE responses, and energy distribution characteristics.
To clarify the research design, three moisture boundary conditions were selected to represent typical water participation modes in cold-region rock engineering. The sealed water-retaining condition represents a state with no continuous external water replenishment; the semi-immersed condition represents water-level fluctuation, capillary rise, and local ponding; and the fully immersed condition represents a continuously water-rich environment. Unlike previous studies that have considered mainly the number of freeze–thaw cycles or a single saturation state, the present work combines mechanical parameters, crack-closure behavior, brittleness indices, AE responses, and energy dissipation variables under three controlled moisture boundaries. This combined analysis is intended to clarify not only the degree of macroscopic deterioration but also the different damage paths induced by moisture migration and water–ice phase transition.

2. Experimental Methodology

Standard cylindrical red sandstone samples with dimensions of Φ50 mm × 100 mm were used in the tests. Before formal freeze–thaw treatment, the red sandstone samples were dried and saturated [4]. First, the samples were dried in an oven at 40 °C for 24 h until a constant mass was obtained. Subsequently, the internal pores of the samples were filled with water as completely as possible, ensuring that all the groups had similar initial saturation states before freeze–thaw cycling. A drying–saturation procedure was adopted to obtain comparable initial saturation states before freeze–thaw cycling. Although oven drying may slightly affect moisture-sensitive components, cementation, clay minerals, microcrack conditions, or possible salt crystallization in some rocks, a relatively low drying temperature of 40 °C was adopted in this study to reduce possible thermal disturbance. The possible effect of salt crystallization during drying was not specifically evaluated in the present work. However, all the samples underwent the same drying and saturation procedure before freeze–thaw treatment; therefore, the subsequent comparisons mainly reflect differences caused by the number of freeze–thaw cycles and moisture boundary conditions under the same initial preparation procedure.
In the present test program, the specimens included one unfrozen-thawed reference condition and nine freeze–thaw conditions, corresponding to three moisture states and three freeze–thaw cycle numbers. For each condition, two parallel samples were prepared and tested under the same procedure to check the repeatability and obtain mean values for summary analysis. Therefore, 20 cylindrical samples were used in total, including two unfrozen–thawed reference samples and 18 freeze–thawed samples. Because the number of parallel specimens was limited, formal hypothesis testing, such as ANOVA and confidence interval analysis, was not conducted. The comparisons among the GA, GB, and GC groups were therefore interpreted on the basis of the consistency of the repeated samples, the variation trends with the number of cycles, and the agreement among the mechanical, AE, and energy indicators.
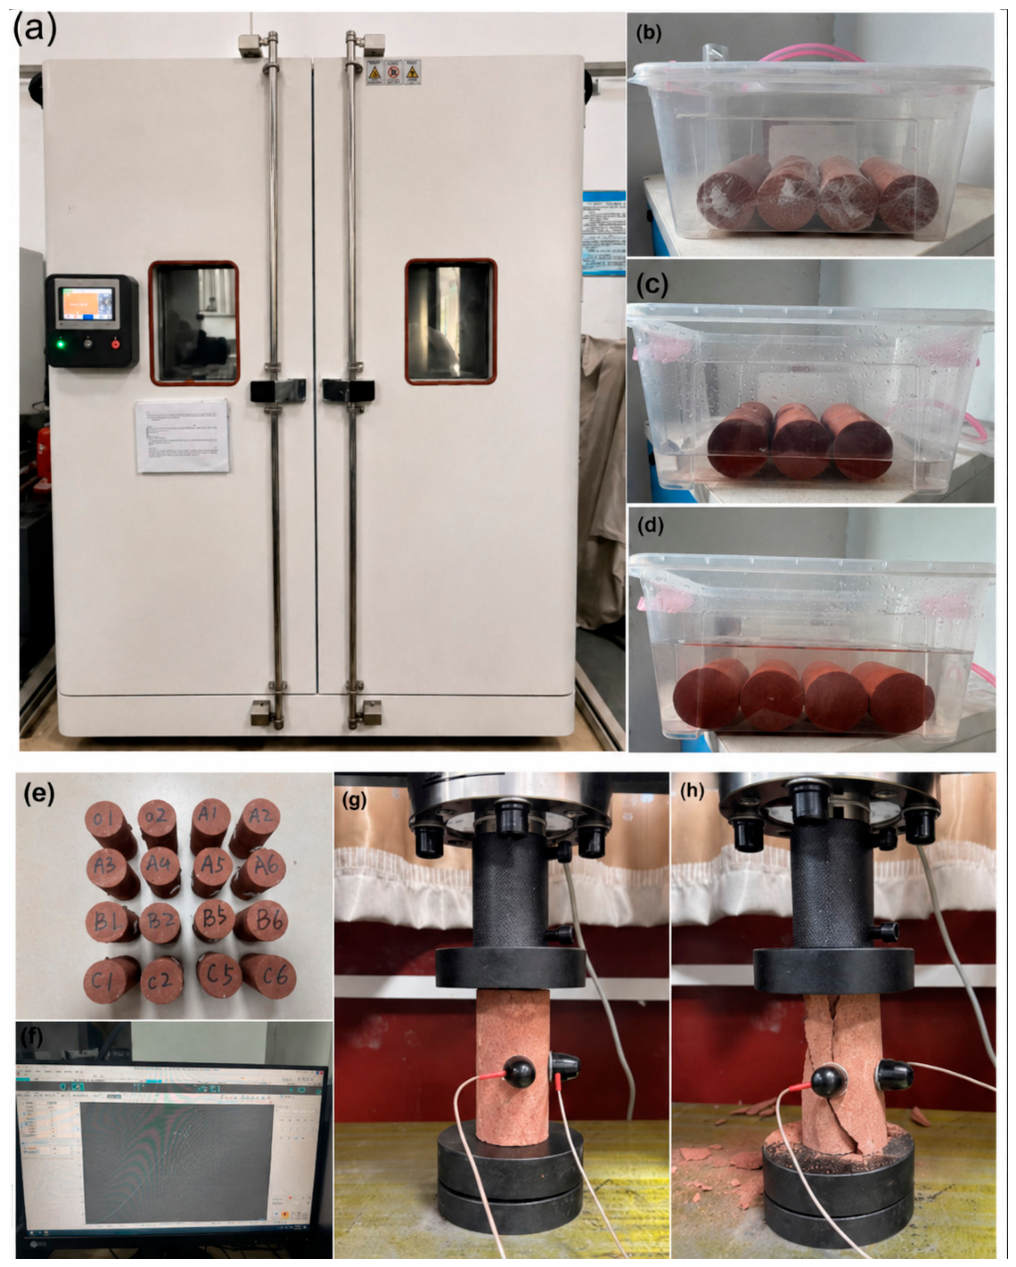
After saturation, the red sandstone samples were divided into three groups, namely, GA, GB, and GC, according to the different moisture environments during freeze–thaw cycling. After saturation, the GA samples were wrapped and sealed with plastic film, which represented a sealed water-retaining freeze–thaw state after saturation. This group reflects mainly the damage caused by the combined action of the original pore water inside the samples and temperature cycling without external water replenishment. The GB group represents the semi-immersed state, in which the lower part of the saturated sample is in contact with water while the upper part is exposed to air during freeze–thaw cycling. These conditions can simulate moisture migration, capillary replenishment, and freezing suction in water-level fluctuation zones or under local ponding conditions. The GC group represents the fully immersed state, in which the saturated sample is completely immersed in water during freeze–thaw cycling. This group reflects mainly the effects of pore-water phase transition and frost-heaving action on red sandstone sample damage under a sufficient water supply. The number of freeze–thaw cycles was set to 20, 40, and 60, and an unfrozen-thawed initial group was used as the control. Each group was denoted by the form “state-cycle number”, such as GA-20, GB-40, and GC-60. The detailed grouping scheme is shown in Table 1, which lists the specimen grouping and freeze–thaw states. For the semi-immersed group, the lower part of each saturated sample was kept in contact with water while the upper part was exposed to air so that water exchange, capillary replenishment, and evaporation could occur simultaneously during freeze–thaw cycling. For the fully immersed group, the specimens were completely submerged throughout the freeze–thaw process, whereas the sealed water-retaining specimens were isolated from the external water supply by plastic film wrapping.
Before the freeze–thaw treatment, the initial moisture-related physical state of the red sandstone samples was characterized. The initial mass moisture content ranged from 6.04–6.38%, with an average value of 6.21%, and the corresponding open porosity ranged from 12.66–13.32%, with an average value of 12.99%. These values were used to characterize the initial sample consistency before the freeze–thaw treatment. However, the moisture content, mass variation, degree of saturation, open porosity, and water absorption were not continuously measured during freeze–thaw cycling or after different numbers of cycles. This is mainly because the present study involved three different moisture boundary conditions. For the sealed water-retaining GA group, repeated weighing would require removing or disturbing the plastic wrapping; for the semi-immersed GB group, removing specimens during cycling would change the water-contact condition, capillary replenishment, and evaporation process; for the fully immersed GC group, repeated weighing would require taking specimens out of water and removing surface water, which could also disturb the imposed moisture boundary. In addition, porosity or water absorption measurements usually require additional drying–saturation procedures, which alter the freeze–thaw damage state of the samples. Therefore, the subsequent moisture migration mechanism discussed in this paper should be interpreted on the basis of the imposed boundary conditions and the coupled mechanical, AE, and energy dissipation responses rather than direct measurement of the internal moisture field.
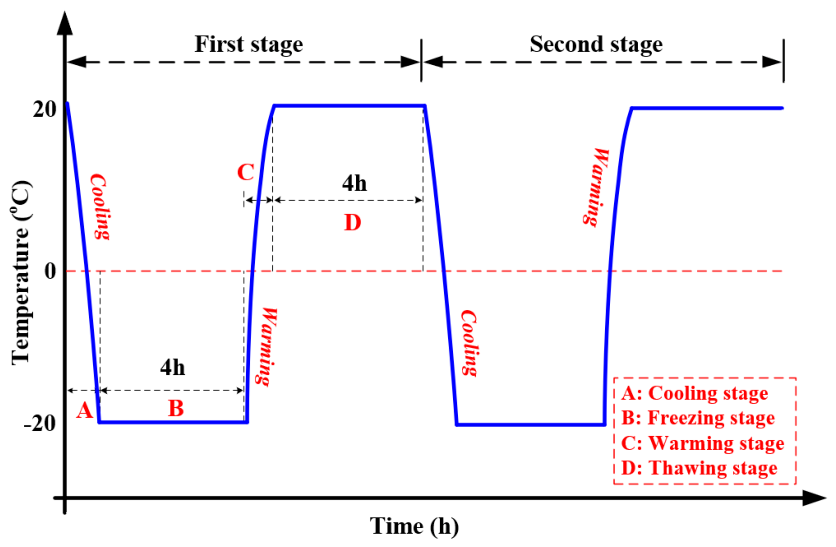
Every freeze–thaw cycle included a freezing stage and a thawing stage. During the freezing stage, the temperature in the test chamber was gradually decreased to approximately −20 °C and maintained for 4 h. During the thawing stage, the temperature was increased to approximately 20 °C and maintained for 4 h. One complete freezing–thawing process was defined as one freeze–thaw cycle. The temperature in the freeze–thaw chamber was monitored during cycling to ensure that the target freezing and thawing stages were reached. The freeze–thaw chamber was operated using its built-in temperature-control and monitoring system, and the same programmed temperature path was applied to all the samples. The exact cooling and heating rates were controlled by the built-in program of the freeze–thaw chamber and were not independently recorded. Although no independent external calibration records were available for the chamber in the original experimental records, the temperature program and monitoring procedure were kept identical for all the freeze–thaw groups to ensure the comparability of the test conditions. A typical temperature–time path of a freeze–thaw cycle is shown in Figure 1.
After the preset number of freeze–thaw cycles was reached, the samples were removed from the freeze–thaw chamber and subjected to uniaxial compression tests with simultaneous AE monitoring. Uniaxial compression tests were conducted under axial displacement control at a loading rate of 0.1 mm/min until the samples lost their bearing capacity. AE monitoring was started simultaneously with mechanical loading to ensure time consistency between the stress–strain data and the AE signals. The AE threshold and preamplifier gain were set to 40 dB to reduce environmental noise and ensure effective signal acquisition. The acquisition frequency was set to 1 MHz. AE sensors were attached to the sample surface using a coupling agent and fixed to maintain stable contact during loading. Before formal testing, the coupling quality and channel response were checked, and the same loading rate, sensor arrangement, coupling method, and acquisition parameters were used for all the samples. During loading, axial load, displacement, time, and AE signals were synchronously recorded, and axial strain was calculated from the measured axial displacement divided by the original specimen height. The experimental procedure is shown in Figure 2.

3. Strength, Deformation Characteristics and Cumulative Damage Variables

3.1. Strength and Deformation Characteristics

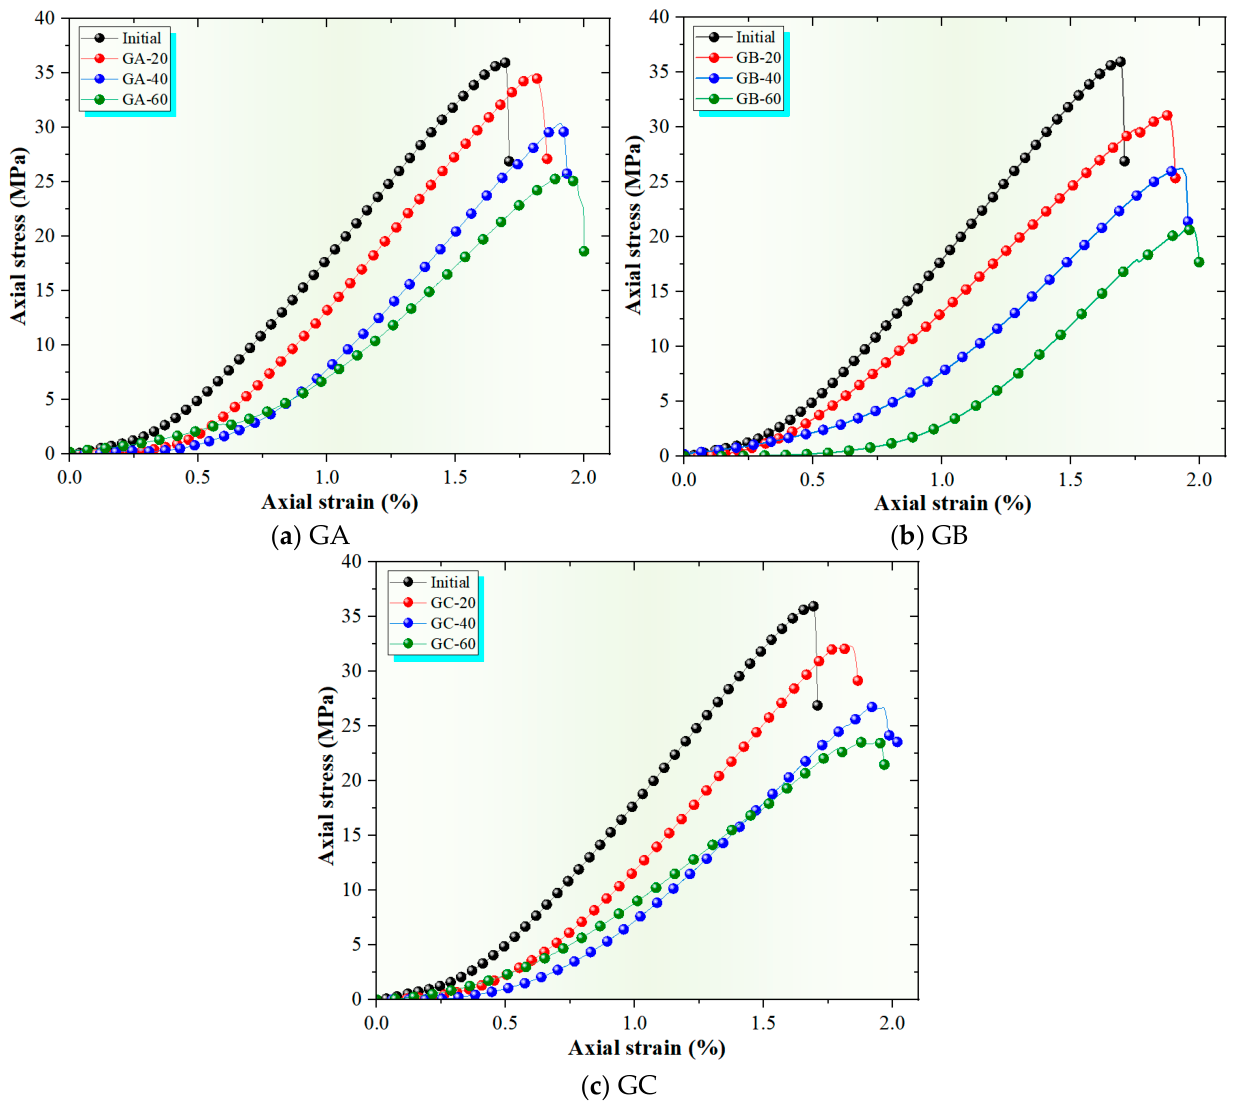
The stress–strain curves of the samples under different moisture conditions and numbers of freeze–thaw cycles are shown in Figure 3. All three groups of sandstone samples exhibit a typical complete process under uniaxial compression, such as compaction, crack propagation, elastic deformation, and postpeak failure. The unfrozen–thawed samples have the highest stress–strain peak, a larger curve slope, and an obvious postpeak stress decrease, indicating that the samples in the initial state have good integrity, strong energy storage capacity, and pronounced brittle failure characteristics. With increasing number of freeze–thaw cycles, the curve peak gradually decreases, the peak strain generally increases, and the curves shift toward a “low-stress and large-strain” response. These findings indicate that freeze–thaw action weakens particle cementation and skeleton-bearing capacity while enhancing pore compaction and frictional sliding deformation of cracks during loading.
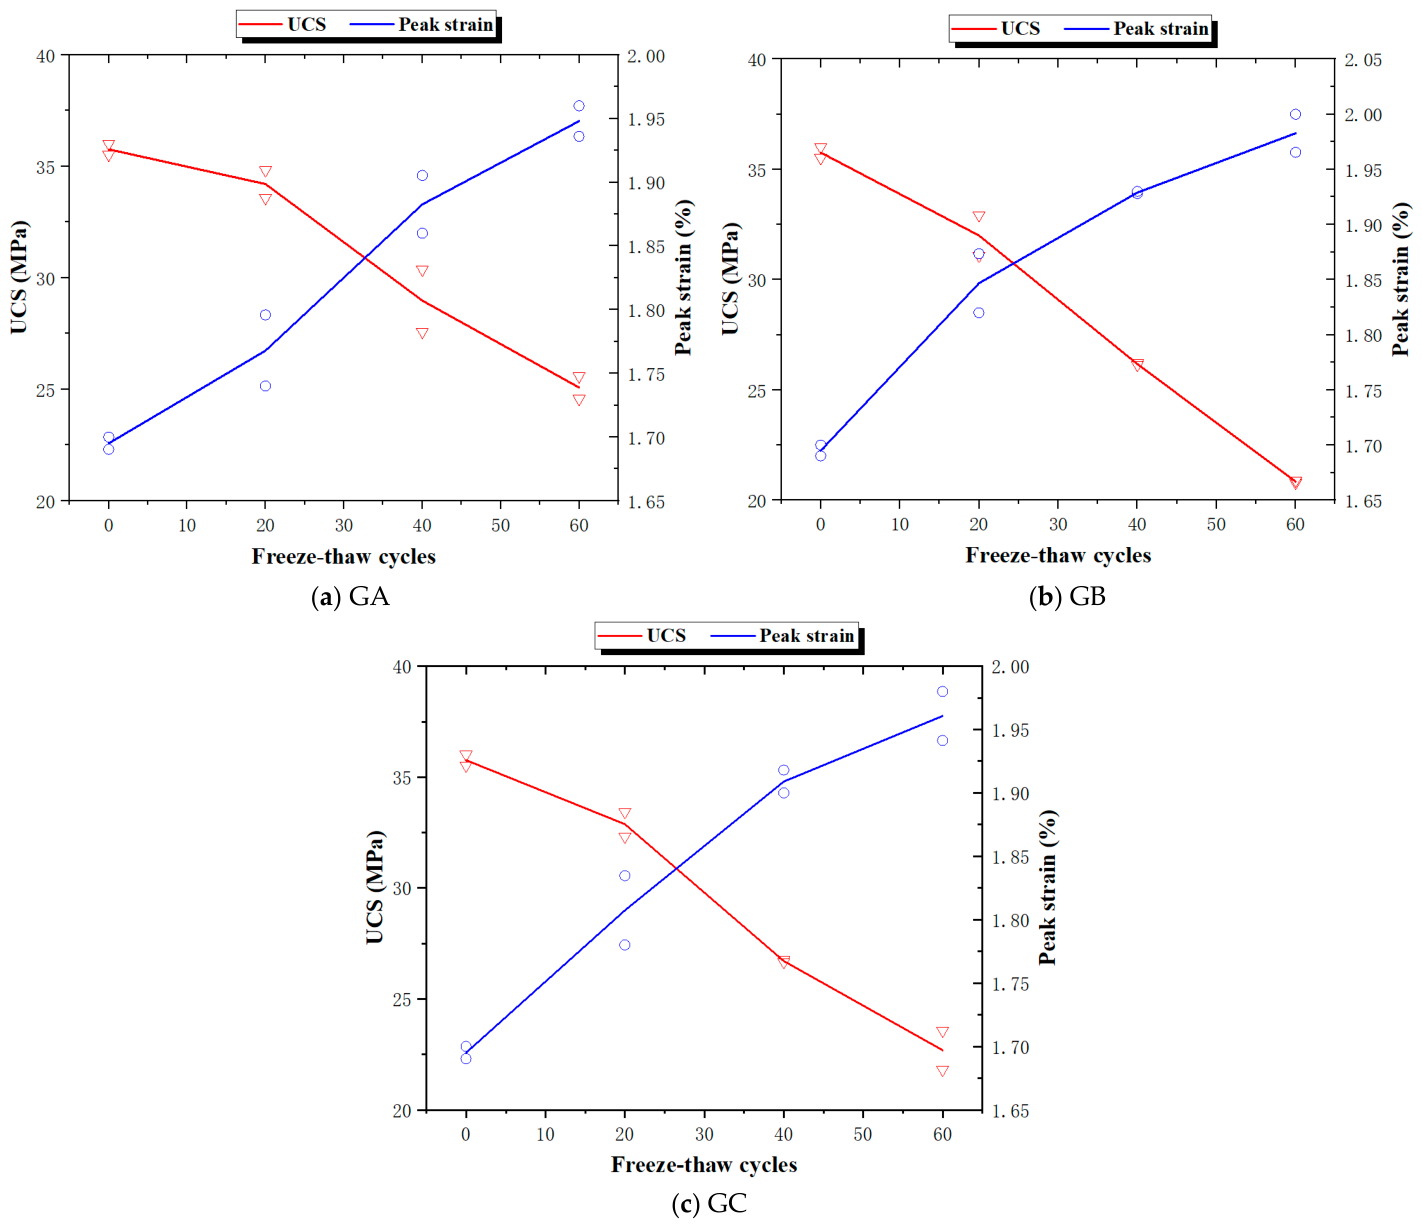
The variations in the uniaxial compressive strength (UCS) and peak strain of red sandstone samples under different moisture states and numbers of freeze–thaw cycles are further quantified, as shown in Figure 4. Overall, the UCS of the GA, GB, and GC samples decreases gradually as the number of freeze–thaw cycles increases, whereas the peak strain generally increases. These findings indicate that freeze–thaw cycling weakens the bearing capacity of red sandstone samples and allows for sufficient axial deformation before failure. Initial samples have a UCS of approximately 36 MPa and a peak strain of approximately 1.70%. After 60 freeze–thaw cycles, the UCS values of the GA, GB, and GC groups decrease to approximately 25, 20, and 22 MPa, corresponding to reductions of approximately 29.9%, 41.7%, and 36.5%, respectively, relative to the initial state. The corresponding peak strains increase to approximately 1.95%, 1.98%, and 1.96%, respectively. These results indicate that freeze–thaw cycling gradually transforms red sandstone samples from brittle failure characterized by high strength and low deformation to damage–softening failure characterized by low strength and large deformation.
The values shown in Figure 4 were obtained from repeated samples under the same conditions. Because the number of replicate specimens was limited, the differences among the GA, GB, and GC groups are discussed mainly from the perspective of consistent variation trends rather than strict statistical significance. Nevertheless, the UCS deterioration and peak strain increase are consistent with the stress–strain curves, tangent moduli, crack-closure parameters, AE responses, and energy dissipation results.
A further comparison of the UCS and peak strain of the samples under different moisture states at the same number of freeze–thaw cycles revealed clear differences among the three groups. After 20 freeze–thaw cycles, the UCS values of the GA, GC, and GB groups are approximately 34.2, 32.9, and 32.1 MPa, respectively. After 40 cycles, they decrease to approximately 28.9, 26.7, and 26.2 MPa, respectively. After 60 cycles, they further decrease to approximately 25.1, 22.7, and 20.8 MPa, respectively. Overall, at the same number of freeze–thaw cycles, the UCS follows the order of GA > GC > GB, whereas the peak strain is relatively higher in the GB group, indicating that strength deterioration and deformation growth are more pronounced in the semi-immersed state. This difference suggests that different moisture states change the mode of water participation and the crack propagation path during freeze–thaw cycling. Because the GA group has no continuous external water supply, its damage development is relatively limited. The GB group is simultaneously affected by moisture migration, capillary replenishment, evaporation, and local frost heave, increasing the likelihood of nonuniform damage. The water supply of the GC group is sufficient, but its moisture boundary is relatively uniform; therefore, its UCS attenuation is generally between those of the GA and GB groups. These findings indicate that the freeze–thaw damage to red sandstone samples is controlled not only by the number of cycles but also by the moisture boundary conditions.
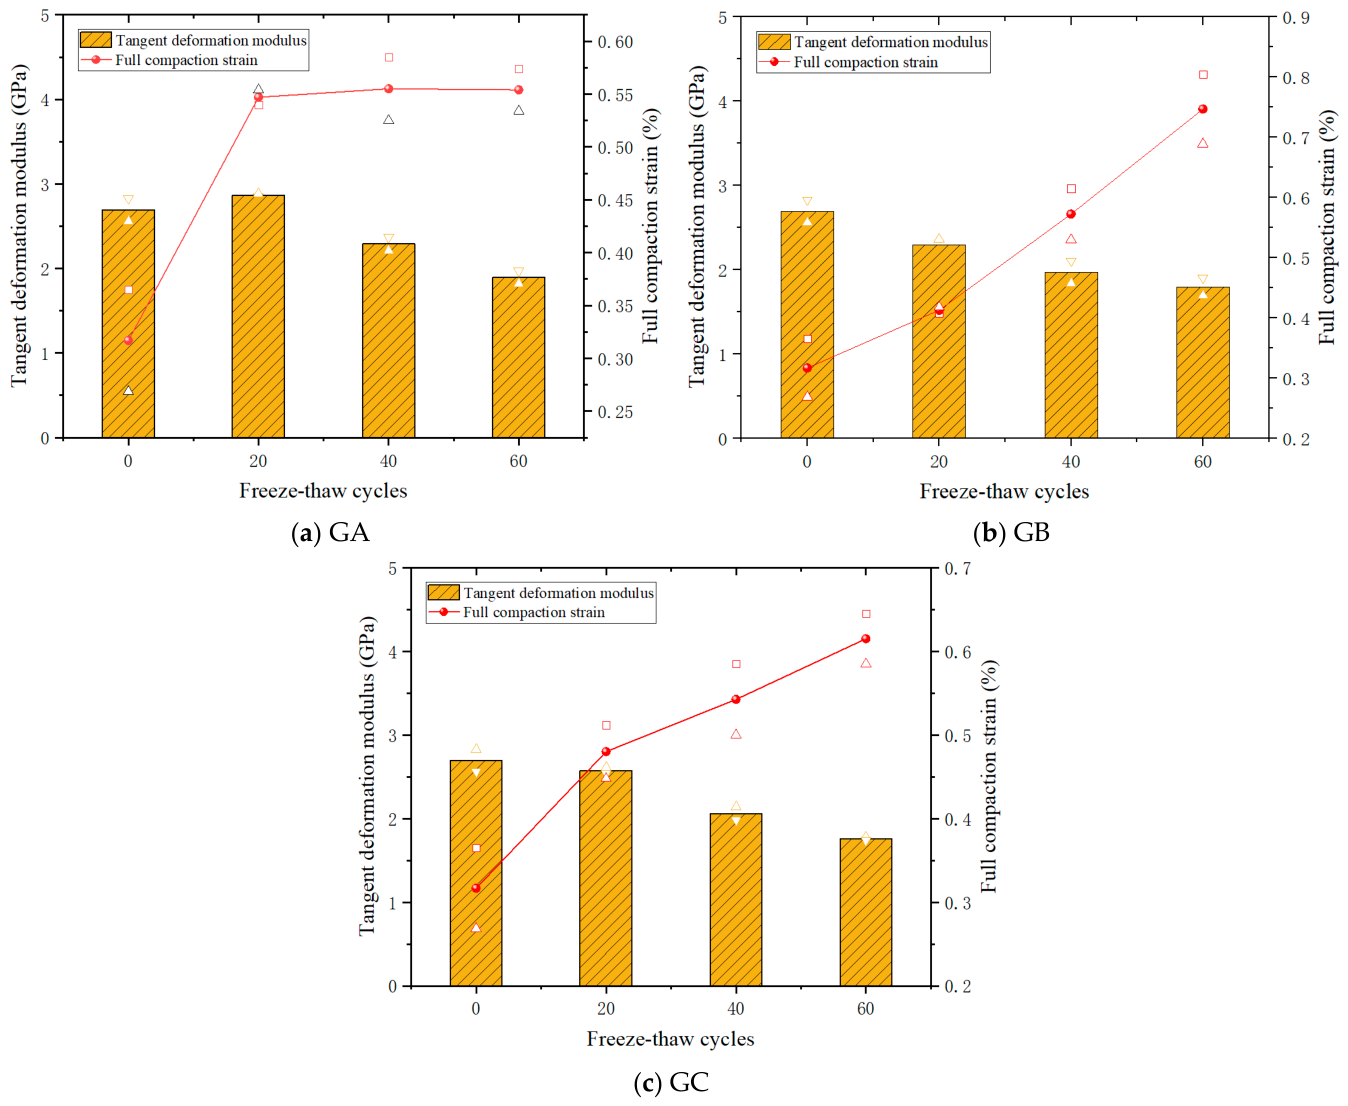
The variations in the tangent deformation modulus and full compaction strain of red sandstone samples under different moisture states and numbers of freeze–thaw cycles are shown in Figure 5. Overall, as the number of freeze–thaw cycles increases, the tangent deformation modulus of all three groups decreases, whereas the full compaction strain gradually increases. This means that freeze–thaw cycling weakens the initial stiffness of red sandstone samples and increases the number of compact pores and microcracks inside them. The initial samples have a tangent deformation modulus of approximately 2.69 GPa and a full compaction strain of approximately 0.32%. After 60 freeze–thaw cycles, the tangent deformation moduli of the GA, GB, and GC groups decrease to approximately 1.90, 1.80, and 1.76 GPa, respectively, whereas the full compaction strains increase to approximately 0.55%, 0.75%, and 0.62%, respectively. Among them, the GB group shows the greatest increase in full compaction strain, indicating that moisture migration and local frost-heaving action under the semi-immersed state more readily promote the development of pores and microcracks such that the specimens need to undergo a longer compaction process before entering the stable bearing stage. Therefore, freeze–thaw cycling reduces the deformation modulus of red sandstone samples and prolongs the initial compaction stage. The different modes of water participation under different moisture states are important reasons for the differences in the tangent deformation modulus and full compaction strain.
In summary, freeze–thaw cycling and moisture state jointly control the macroscopic mechanical deterioration of red sandstone samples. With increasing number of freeze–thaw cycles, all three groups exhibit decreasing UCS, increasing peak strain, decreasing tangent deformation modulus, and increasing full compaction strain. These findings indicate that the freeze–thaw action weakens the particle cementation and skeleton-bearing capacity of red sandstone samples while promoting the development of internal pores and microcracks and requiring a longer compaction process during the initial loading stage. At the same number of freeze–thaw cycles, the mechanical responses of samples under different moisture states differ markedly. In the GA group, because there is no continuous external water supply during freeze–thaw cycling, the attenuation of strength and stiffness is relatively weak. In the GB group, the combined effects of moisture migration, capillary replenishment, evaporation, and local frost heaving result in more pronounced UCS reduction and deformation growth. In the GC group, the water supply is sufficient, and the pore-water phase transition and frost-heaving action are strong; however, the moisture boundary is relatively uniform, and the overall degree of deterioration lies between those of the GA and GB groups. These results indicate that the freeze–thaw damage to red sandstone samples is not determined only by the number of cycles and is significantly influenced by the moisture boundary conditions and moisture migration modes during freeze–thaw cycling.

3.2. Tangent Modulus–Strain Curve and Microcrack Closure Behavior

To further identify the crack-closure and crack-propagation stages of red sandstone samples during uniaxial compression, this study adopted the tangent modulus–strain curve analysis method. The instantaneous tangent modulus during sample loading was computed from the stress–strain curve. The tangent modulus reflects the instantaneous stiffness variation in rocks at different loading stages. Its variation is closely related to the closure of primary cracks and the initiation, stable propagation, and unstable propagation of new cracks inside the sample during loading. Therefore, the tangent modulus–strain curve was used in this study as a local stiffness indicator to characterize crack evolution and identify crack closure and crack propagation stages. The calculation formula is as follows:
E i = σ i + 1 σ i 1 ε i + 1 ε i 1 , i = 2 , 3 , , n 1
where E i denotes the instantaneous tangent modulus corresponding to the ith data point; σ i + 1 and σ i 1 are the axial stresses at adjacent data points; and ε i + 1 and ε i 1 are the axial strains at adjacent data points. Notably, the central difference expression in Equation (1) is applicable to the internal data points, i.e., i = 2,3 , . . . , n 1 . For the first and last data points, the tangent modulus was not calculated directly using Equation (1); instead, only the valid internal tangent-modulus values were used for subsequent smoothing and stage identification. Notably, the tangent modulus was not used as a constant elastic modulus for the whole deformation process but as a local stiffness parameter for stage identification. Because the experimentally collected data exhibit certain discrete fluctuations, a moving-average method was further used to smooth the instantaneous tangent modulus and improve the tangent modulus–strain curve regularity. The related expression is [36]:
E ¯ i = 1 2 m + 1 i m i + m E i m , i = 1 , 2 , 3 , , n
where the barred tangent modulus denotes the smoothed tangent modulus and 2 m + 1 denotes the number of data points included in the moving-average calculation. A larger number of averaged data points produces a more obvious smoothing effect, but an excessively large smoothing window may weaken local crack-activity characteristics. Therefore, an appropriate smoothing window should be selected according to the degree of fluctuation of the original data in practical processing.
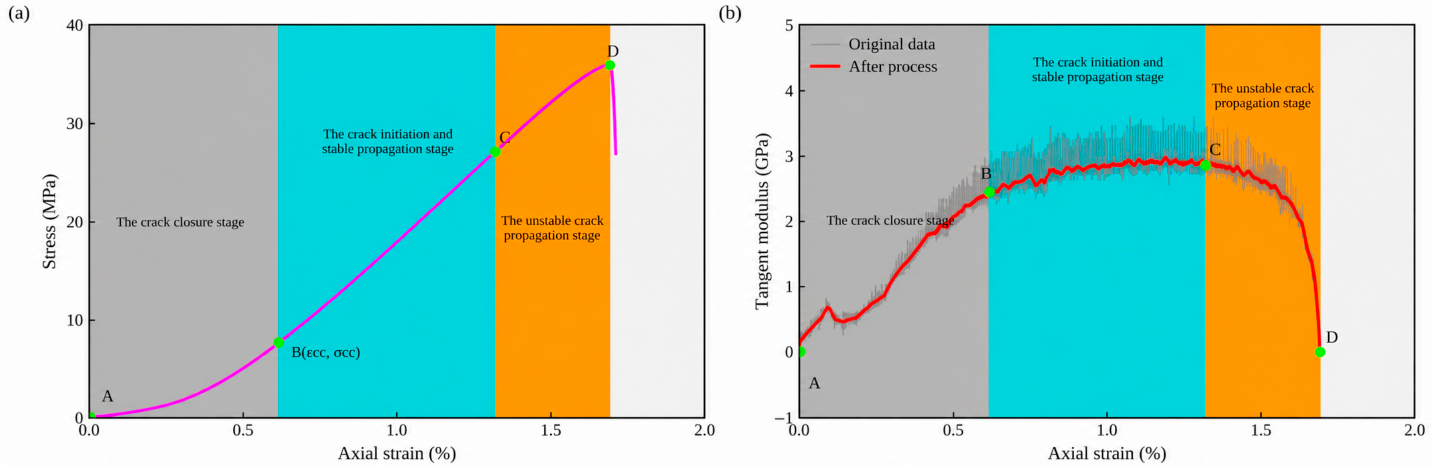
The typical stress–strain curves and corresponding tangent modulus–strain curves of the unfrozen-thawed red sandstone samples are shown in Figure 6. The loading process can be divided into a crack-closure stage, crack-initiation stage, stable propagation stage, and unstable crack-propagation stage. During the early loading stage, the primary pores and microcracks inside the sample gradually close, and the tangent modulus rapidly increases from a low value. When the tangent modulus changes from a rapid increase to a relatively stable fluctuation range, the main closable cracks inside the sample can be considered to have essentially completed closure. The stress and strain corresponding to this point are defined as the crack closure stress σcc and crack closure strain εcc, respectively. Subsequently, the crack initiation and stable propagation stage of the sample begins, during which the tangent modulus fluctuates within a certain range. Near the peak strength, the tangent modulus decreases significantly and fluctuates strongly, indicating that internal cracks enter the unstable propagation stage and that macroscopic failure gradually occurs. Ji et al. [36] reported that greater crack closure stress and closure strain generally indicate that internal cracks are more difficult to fully close and that the degree of initial defect development is greater.
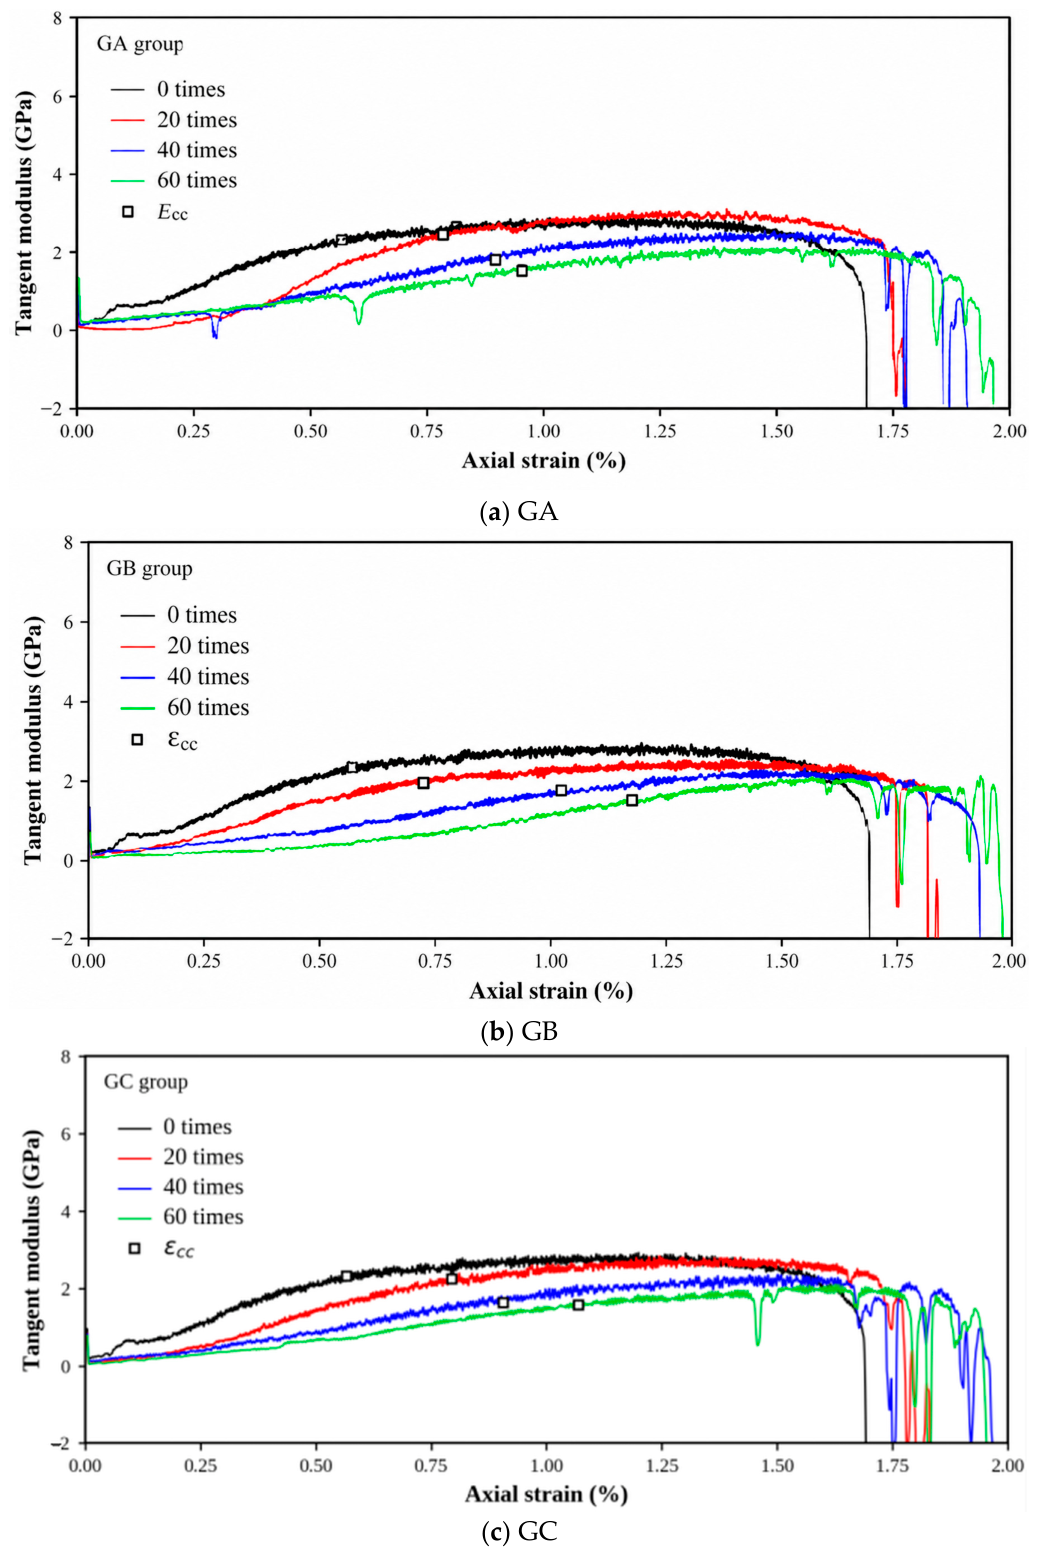
The tangent modulus–axial strain curves of the samples under different moisture states and numbers of freeze–thaw cycles are shown in Figure 7. Overall, the curve of the unfrozen–thawed sample is relatively smooth, and the tangent modulus increase and stable stages are clear, indicating fewer primary cracks and a relatively continuous crack-closure process. As the number of freeze–thaw cycles increases, the initial slope of the tangent modulus–strain curves decreases, the modulus plateau decreases, and the fluctuations intensify in all the groups. This finding indicates that freeze–thaw cycling increases the number of pores and microcracks inside the samples, making crack closure, frictional sliding, local initiation, and propagation activities more evident during loading. After 60 freeze–thaw cycles, the curves show more obvious decreases in modulus and multiple fluctuations both before and after the peak, indicating that the internal fracture network is more complex and that crack propagation is no longer concentrated near the peak but continues during the middle and late loading stages.
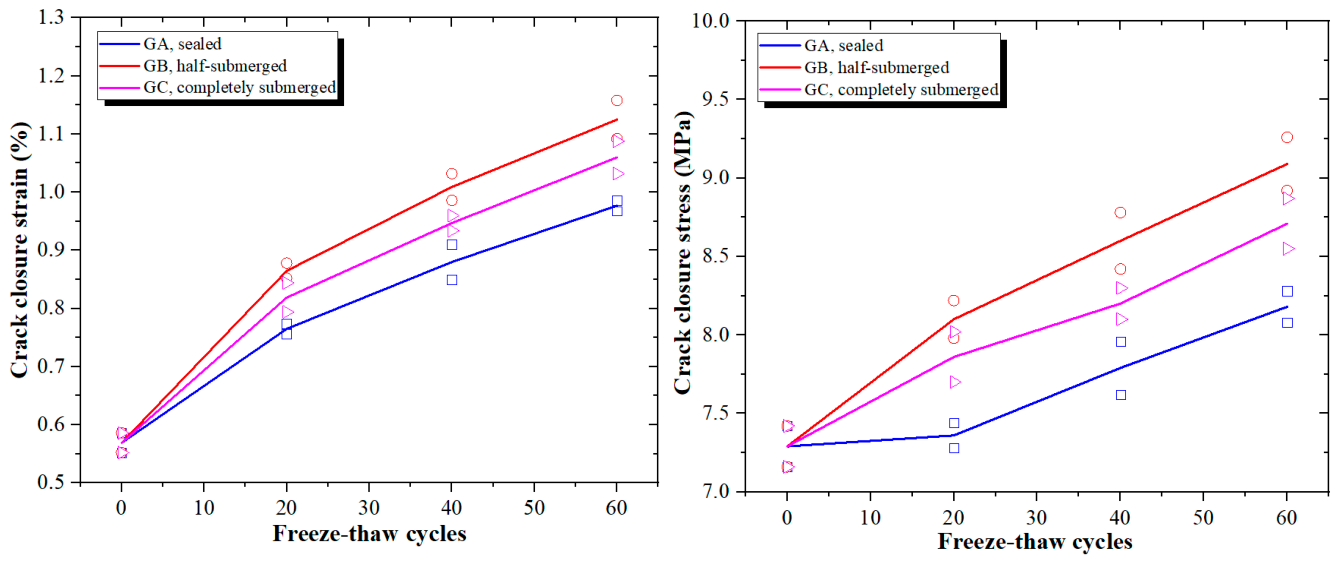
The variations in sample crack closure strain and crack closure stress under different moisture states and numbers of freeze–thaw cycles are shown in Figure 8. Overall, as the number of freeze–thaw cycles increases, the εcc and σcc of all three groups increase, implying that freeze–thaw action enhances the degree of initial crack opening and connectivity inside red sandstone samples and that greater axial deformation and stress levels are required during the early loading stage to complete crack closure. At the same number of cycles, the crack closure parameters differ among samples under different moisture states. The crack closure strain and crack closure stress of the GB group generally increase, indicating that moisture migration and local frost-heaving action under the semi-immersed state more readily promote crack development. The GC group ranks second, indicating that the pore-water phase transition and frost-heaving action under the fully immersed state also increase the difficulty of crack closure. The GA group has relatively lower values, indicating that the limitation of external water replenishment in the sealed water-retaining state leads to relatively weaker freeze–thaw-induced crack development. Therefore, the tangential modulus–strain curve can effectively reveal the microcrack-closure behavior of red sandstone samples during the early loading stage, and σcc and εcc can be used to quantify the differences in freeze–thaw damage under different moisture states.

3.3. Brittleness Evaluation Method

Rock brittleness reflects the combined characteristics of prepeak energy storage, rapid postpeak instability, and sudden crack propagation under external loading. For freeze–thaw-damaged rocks, freeze–thaw cycling not only changes the peak strength, peak strain, and deformation modulus but also affects the accumulation of prepeak damage and the postpeak crack propagation rate. Therefore, in reference to the freeze–thaw rock brittleness evaluation method proposed by Wang et al. [37], this study introduced the brittleness indices Bn1 and Bn2, which consider the correction of freeze–thaw damage, to evaluate the evolution of the brittleness of red sandstone samples under different moisture states and numbers of freeze–thaw cycles.
First, on the basis of the rock damage state at the macroscopic failure stage, the basic brittleness index B1 can be expressed as follows:
B 1 = ln D 1 ε p ( N ) ( ln ( 1 D 1 ) A ( N ) ) A ( N )
where
A ( N ) = ln σ P ( N ) E d N ε p ( N )
where D1 is the damage variable at the rock macroscopic failure stage. Following the method of Wang et al. [37],   D 1 = 0.9 is adopted, indicating that approximately 10% of the effective bearing area remains when macroscopic failure occurs. The value D 1 = 0.9 was selected following the cited brittleness-evaluation method and represents a highly damaged state at macroscopic failure rather than complete loss of bearing capacity. A separate sensitivity analysis for D1 was not performed in this work. Changing D1 affects the absolute magnitude of the brittleness index, but because the same value is used for all the samples, its influence on the comparative trend among different freeze–thaw states is limited. σp(N) and εp(N) are the peak strength and peak strain, respectively, after N freeze–thaw cycles; E d N is the tangent deformation modulus after N freeze–thaw cycles. Considering the weakening impact of freeze–thaw cycling on the rock deformation modulus, the freeze–thaw–corrected brittleness index Bn1 can be written as follows:
B n 1 = E d N E d ln D 1 ε p ( N ) ( ln ( 1 D 1 ) A ( N ) ) A ( N )
where Ed is the tangent deformation modulus of unfrozen-thawed samples. Equation (5) shows that Bn1 simultaneously considers the peak strain, peak strength, and modulus attenuation after freeze–thaw cycling and is mainly used to characterize the rock brittleness state at the macroscopic failure stage after freeze–thaw damage.
To further characterize the variation in brittleness during the whole failure process of the freeze–thaw samples, the prepeak brittleness index Bpre and postpeak brittleness index Bpost are defined as follows:
B p r e = 1 D p ( N ) ε p ( N ) ε c ( N )
B p o s t = D m ( N ) ε m ( N )
where Dp(N) is the damage variable at the peak point; εc(N) is the crack closure strain or full compaction strain; Dm(N) is the peak damage evolution rate; and εm(N) is the strain corresponding to Dm(N). Bpre mainly denotes the sample damage accumulation capacity during the prepeak stage from crack closure and crack initiation to prefailure, whereas Bpost reflects the intensity of rapid postpeak crack propagation and unstable failure.
By further introducing a freeze–thaw damage correction coefficient, the full-process brittleness index Bn2 can be obtained as follows:
B n 2 = B p r e + B p o s t 2 ( 1 D u ) = E d N 2 E d 1 D p ( N ) ε p ( N ) ε c ( N ) + D m ( N ) ε m ( N )
where the freeze–thaw damage variable Du can be denoted by the attenuation of the tangent deformation modulus as follows:
D u = 1 E d N E d
Wang et al. [37] reported that Bn1 focuses more on the final brittleness state of rocks at the macroscopic failure stage after freeze–thaw damage, whereas Bn2 considers prepeak damage and postpeak damage evolution and can characterize the variation in brittleness of freeze–thaw-treated rocks from an entire failure process perspective.
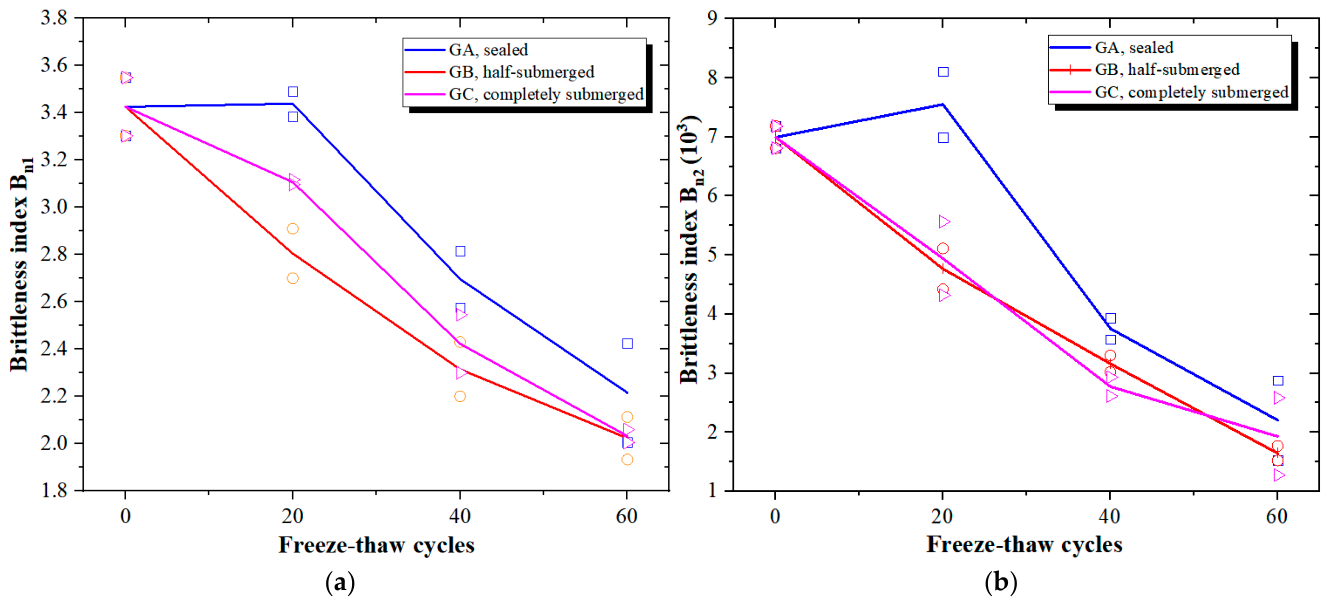
The variations in the brittleness indices Bn1 and Bn2 of red sandstone samples under different moisture states and numbers of freeze–thaw cycles are shown in Figure 9. Overall, as the number of freeze–thaw cycles increases, the Bn1 and Bn2 values of the GA, GB, and GC groups decrease. Specifically, Bn1 decreases from approximately 3.4 initially to approximately 2.0–2.2 after 60 freeze–thaw cycles, and Bn2 decreases from approximately 4.7–7.0 × 10³ initially to approximately 1.6–2.2 × 10³. These findings indicate that freeze–thaw cycling weakens the prepeak elastic energy storage capacity and rapid postpeak instability characteristics of red sandstone samples, resulting in the transformation of the failure process from highly sudden failure in the unfrozen–thawed state to failure dominated by multiple crack propagation, frictional sliding, and progressive damage.
Comparisons among different moisture states reveal that at the same number of freeze–thaw cycles, the GB group generally has lower brittleness indices. This finding indicates that moisture migration and local frost-heaving action under the semi-immersed state more readily promote crack propagation, enabling sufficient prepeak damage accumulation and weakening postpeak sudden instability. The GC group ranks second, suggesting that the pore-water phase transition and frost-heaving action under the fully immersed state also decrease the sample brittleness. In contrast, the GA group exhibited a relatively slower decline in the brittleness indices because of the limitation of external water replenishment. Therefore, the number of freeze–thaw cycles and moisture state jointly control the red sandstone sample brittleness degradation process. The greater the degree of water participation and the more complex the migration process, the more obvious the transformation trend from brittle failure to progressive damage failure.

3.4. Acoustic Emission Characteristics

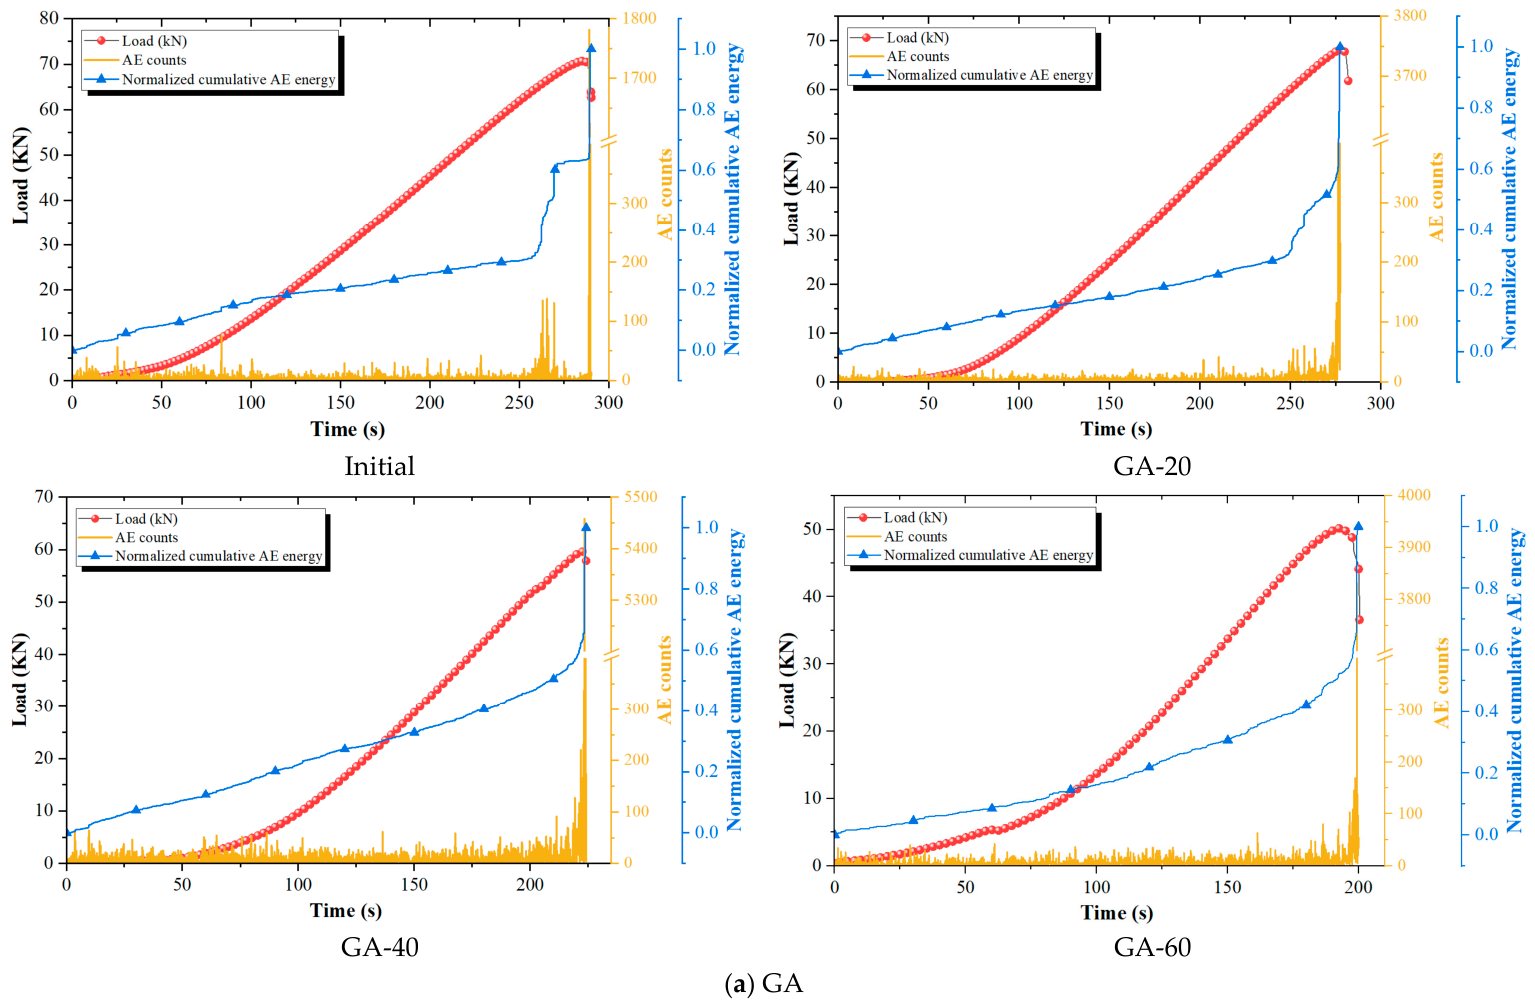
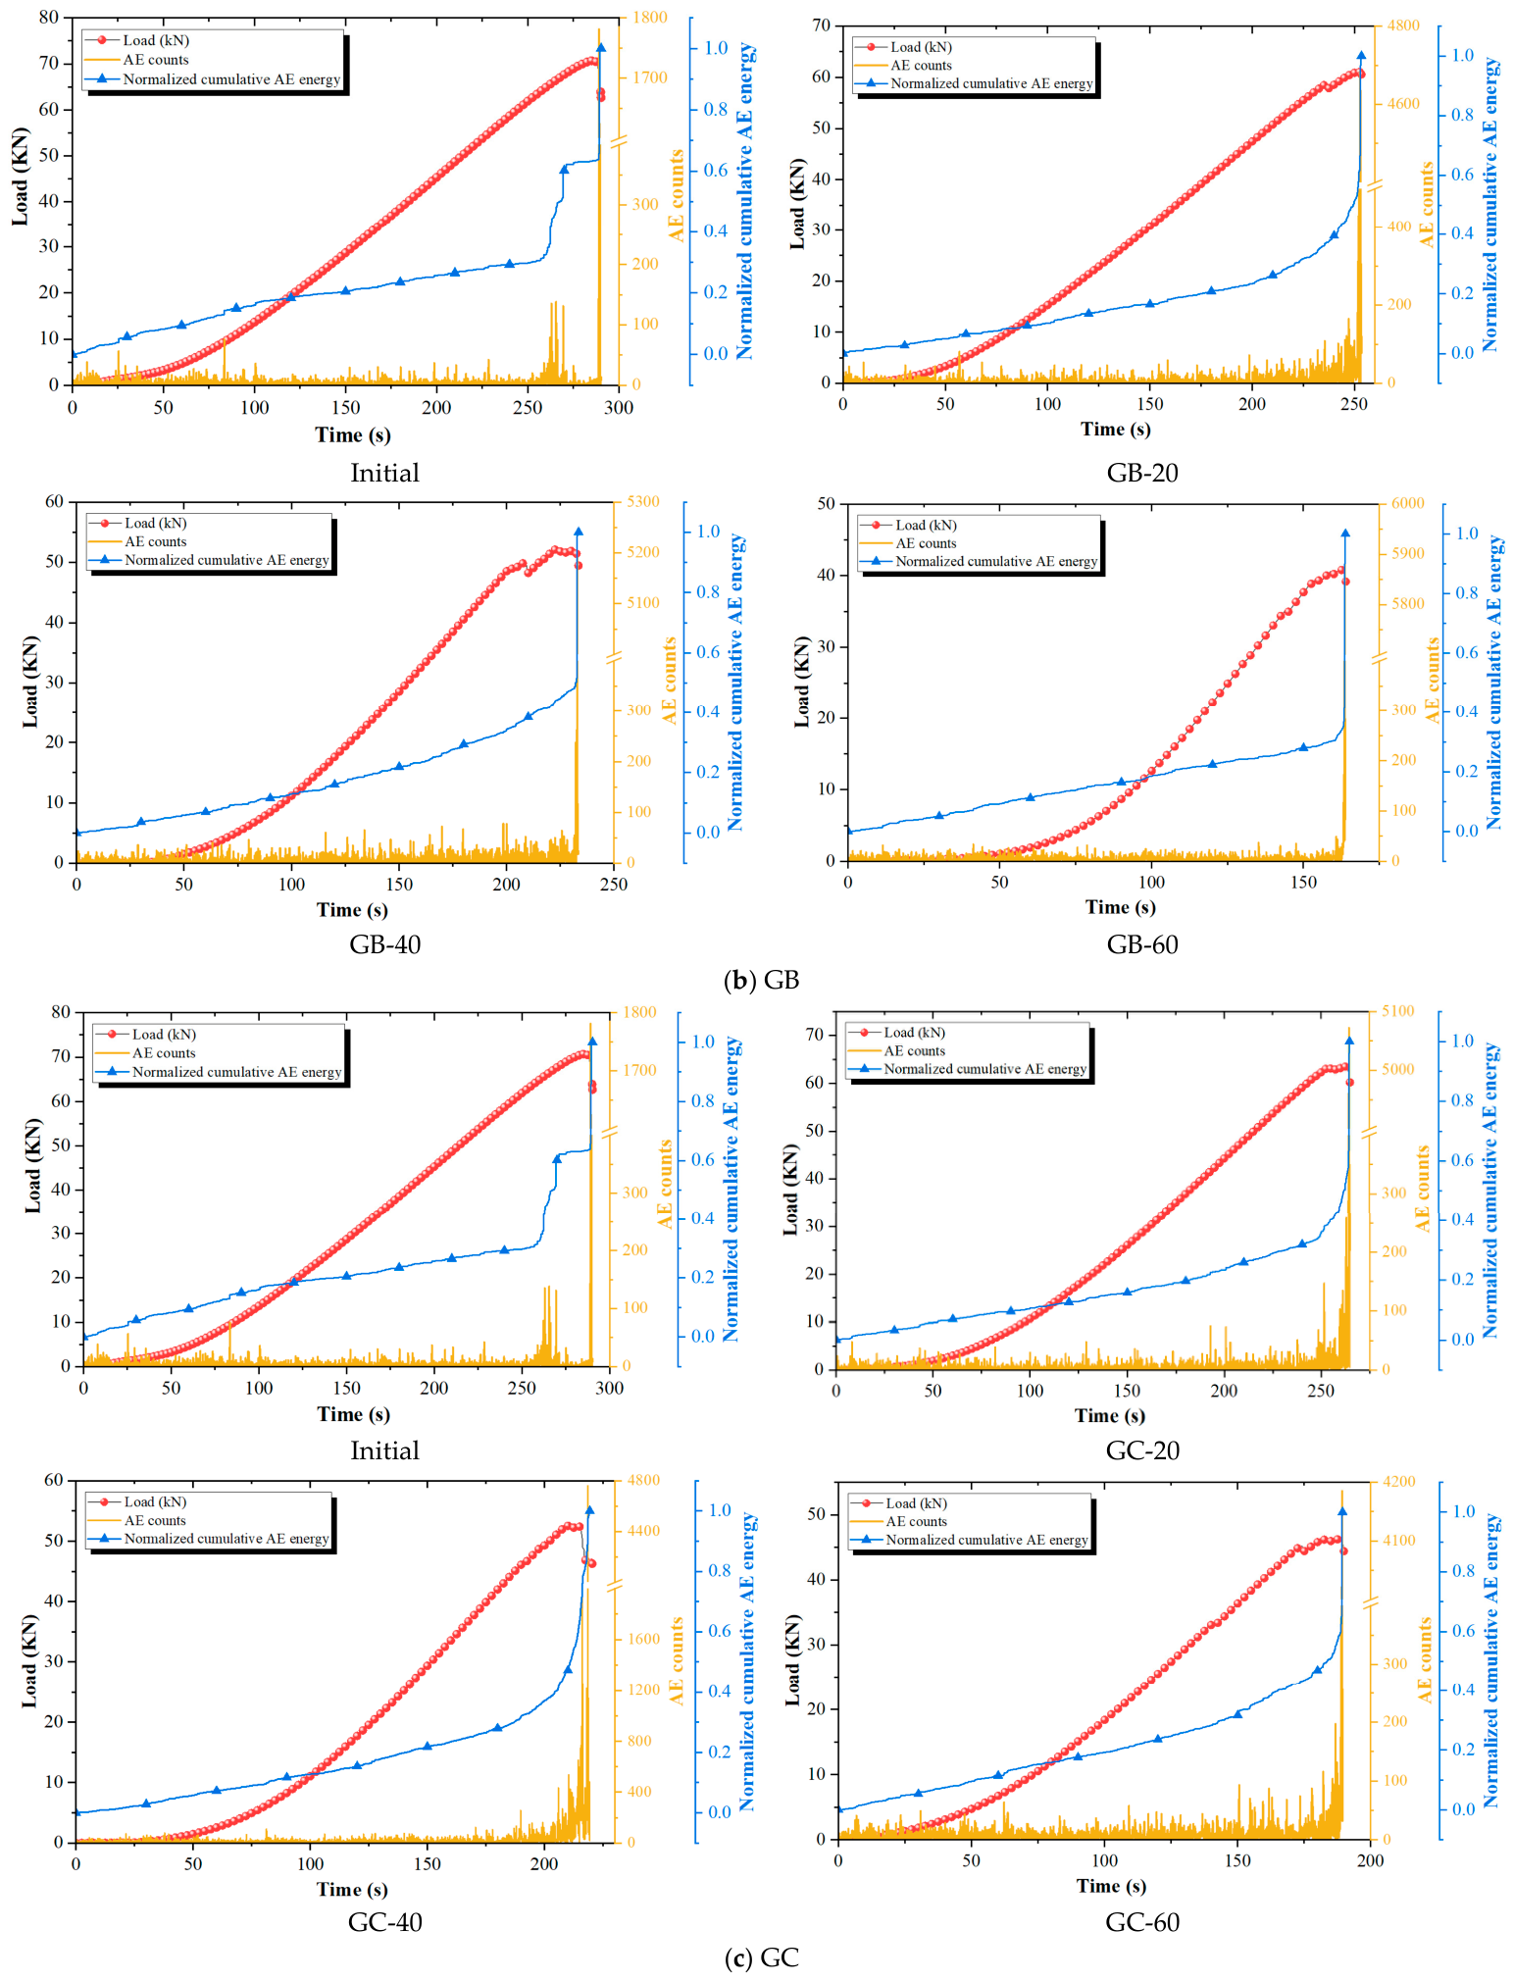
The variations in load and AE counts during uniaxial compression of red sandstone samples under different moisture states and numbers of freeze–thaw cycles are shown in Figure 10. Overall, the AE responses of all the samples corresponded well with the loading stages. At the early loading stage, the AE counts are low, indicating that pore closure and minor microcrack frictional sliding mainly occur. As the load increases, the number of AEs gradually increases, indicating that internal microcracks begin to initiate and propagate stably. Near peak failure, the AE counts show concentrated peaks, reflecting rapid propagation and coalescence of numerous cracks and macroscopic failure formation.
The AE activity in the unfrozen-thawed samples is concentrated mainly near the peak, whereas the AE counts are relatively low during the early and middle loading stages, indicating that their internal structures are relatively intact and that failure has a strong suddenness. After the freeze–thaw treatment, the AE activity occurred significantly earlier, and more continuous count responses appeared during the middle loading stage. With increasing numbers of freeze–thaw cycles, the prepeak AE activity becomes more obvious, indicating that freeze–thaw cycling increases the number of initial pores and microcracks, resulting in crack closure, frictional sliding, and local propagation. The failure mode gradually changes from concentrated instability near the peak to multistage progressive damage.
From the perspective of different moisture states, the AE activity in the GA group is relatively weak, and crack propagation is concentrated mainly during the late loading stage. The GB group exhibits a more continuous AE count distribution and more obvious prepeak activity, indicating that moisture migration and local frost heaving under the semi-immersed state more readily promote microcrack development. The AE response of the GC group also becomes more active with increasing freeze–thaw action, indicating that the pore–water phase transition and frost-heaving action in the fully immersed state also intensify crack activity. Therefore, the AE counts can effectively reflect crack closure, propagation, and coalescence during loading of the red sandstone samples under freeze–thaw cycles, and different moisture states and cycle numbers affect the damage evolution path of the samples.
The present AE analysis focuses mainly on count evolution and normalized cumulative energy because these two parameters directly reflect the timing and intensity of crack activity during loading. More detailed AE indicators, such as RA-AF classification, frequency analysis, b-value analysis, and source localization, were not included in this study and should be considered in future work to further identify tensile and shear cracking mechanisms.
It should also be emphasized that failure mechanisms cannot be completely identified by the evolution of the AE count alone. In this study, the AE counts were used together with the normalized cumulative AE energy, stress–strain behavior, tangent modulus variation, and energy dissipation characteristics to infer the damage evolution process. Thus, the AE results provide supporting evidence rather than an independent and complete fracture-mode classification.

4. Energy Principles and Damage Analysis

Under uniaxial compression, if heat exchange between the sample and the external environment is ignored, the work performed by the external force upon the rock sample may be considered to be completely transformed into internal stored energy and dissipated energy. In terms of the first law of thermodynamics, the total strain energy during rock loading can be expressed as the sum of the elastic strain energy and dissipated energy [1,31,32]:
U = U e + U d
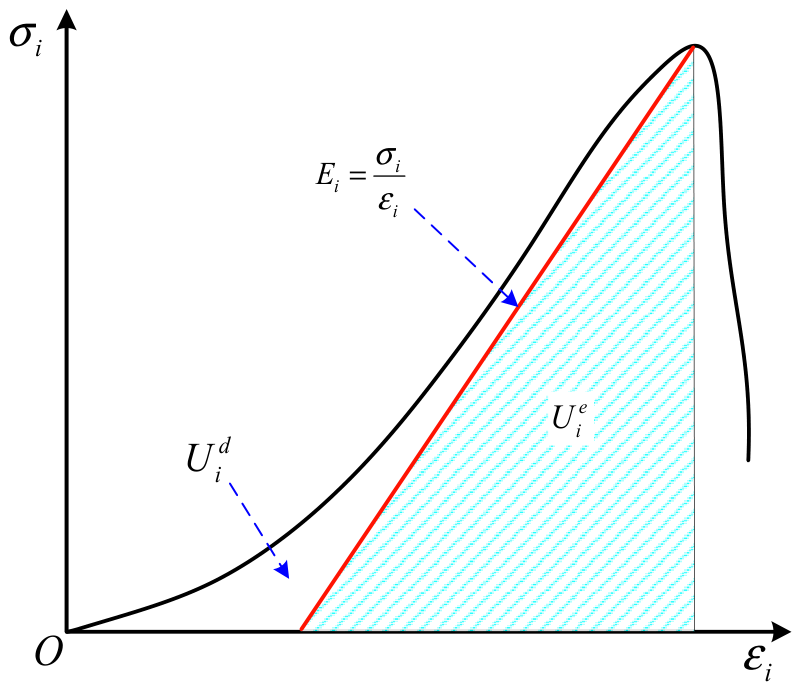
where total strain energy U denotes the energy input by the external force, elastic strain energy Ue represents the recoverable energy stored inside the rock, and dissipated energy Ud denotes the unrecoverable energy. Elastic strain energy mainly reflects rock energy storage capacity during loading, whereas dissipated energy is mostly consumed by irreversible damage processes such as pore compaction, friction along crack surfaces, particle cementation failure, microcrack propagation, and plastic deformation [1].
We can obtain the total strain energy by integrating the area under the stress–strain curve as follows:
U = 0 ε σ d ε
For discretely collected stress–strain data, the trapezoidal integration method can be used:
U = i = 1 n 1 1 2 ( σ i + σ i + 1 ) ( ε i + 1 ε i )
where σi and εi are the axial stress and axial strain, respectively, corresponding to the ith sampling point, and n is the total number of data points on the stress–strain curve.
Under uniaxial compression, the elastic strain energy corresponding to a certain loading state can be approximately expressed as follows:
U e = σ 2 2 E
where σ represents the current axial stress and E denotes the elastic modulus corresponding to the loading stage. In this study, the elastic modulus of each sample was determined from the experimental stress–strain curve and used to calculate the elastic strain energy at different loading stages.
Equation (13) provides an approximate estimate of the recoverable elastic strain energy on the basis of the stress–strain curve and the elastic modulus used in the calculation. Notably, unloading–reloading tests were not performed in this study; therefore, the recoverable elastic energy was not independently validated by unloading measurements. Accordingly, the calculated elastic strain energy should be regarded as an approximate value under the adopted calculation method.
The dissipated energy can be obtained as the difference between the total strain energy and elastic strain energy:
U d = U U e
To further analyse the energy distribution relationship during loading, the elastic energy ratio and dissipated energy ratio are introduced:
μ = U e U × 100 %
λ = U d U × 100 %
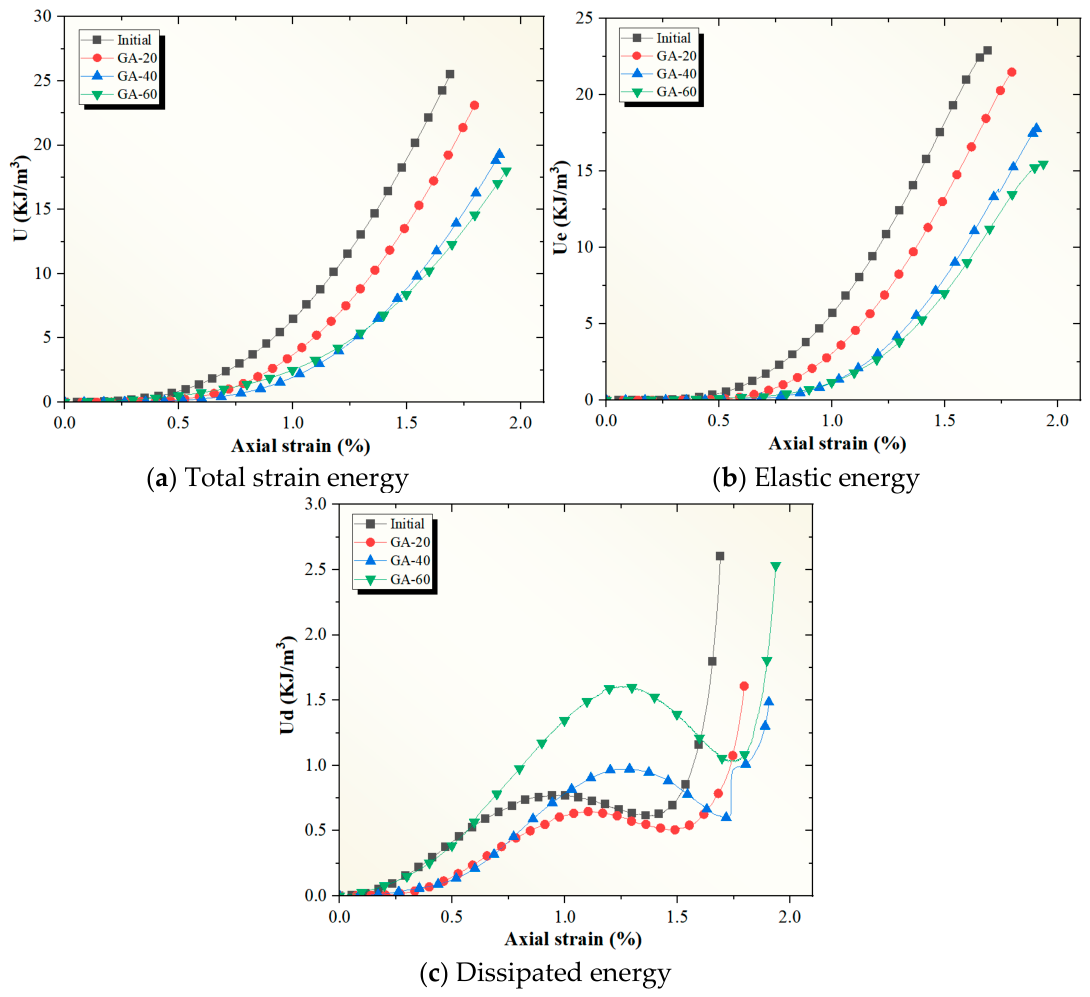
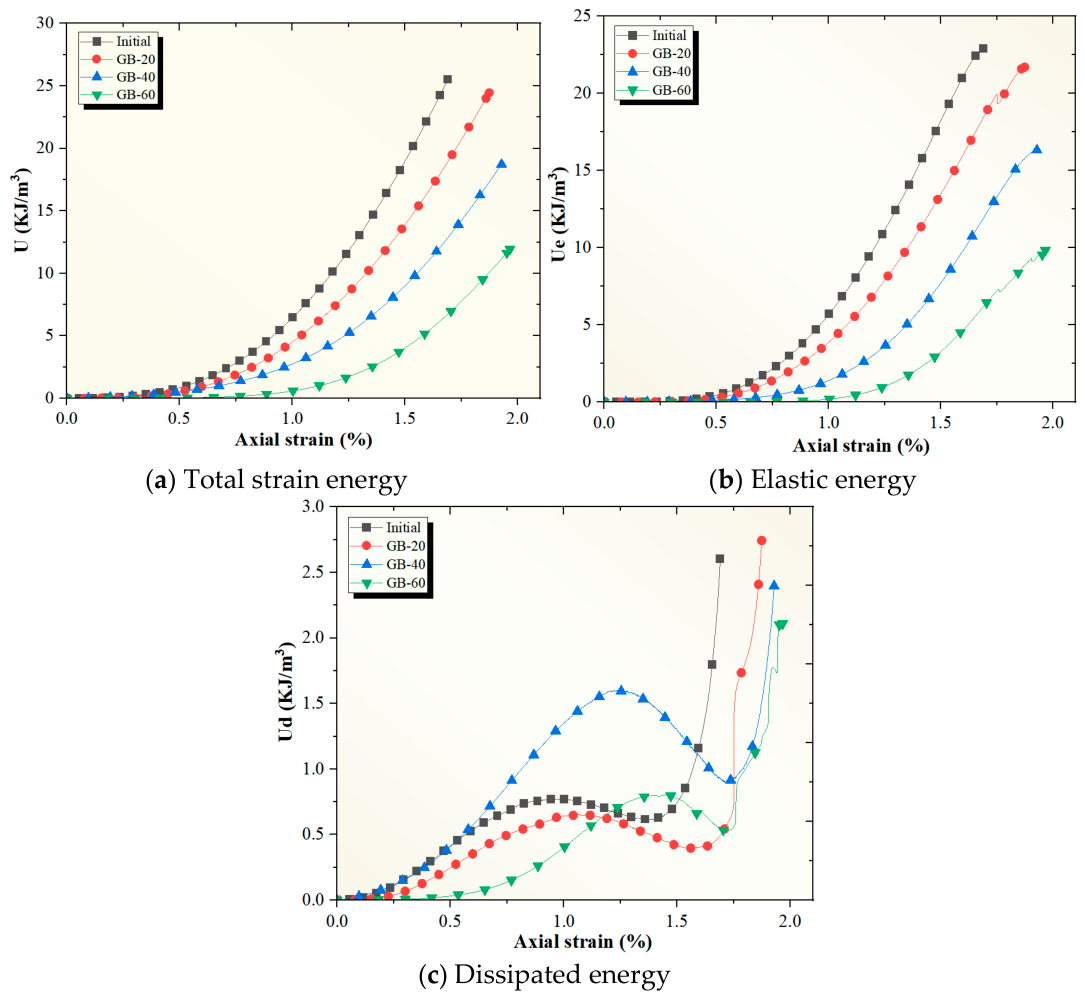
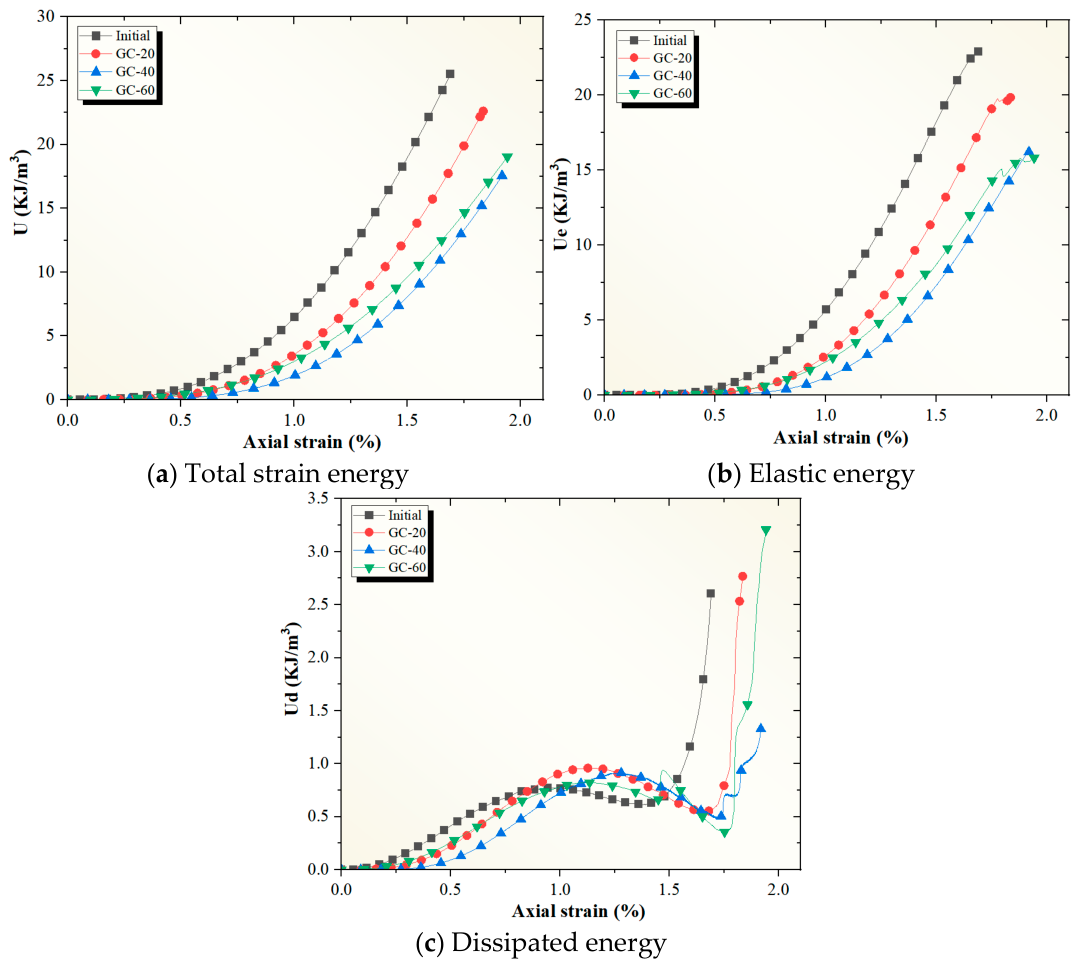
where μ represents the proportion of input energy stored in elastic energy form and λ represents the proportion of input energy consumed by irreversible damage and plastic deformation, as shown in Figure 11. Generally, a larger μ indicates a stronger energy storage capacity of the sample, whereas a larger λ suggests that more input energy is consumed by damage processes such as crack closure, frictional sliding, and crack propagation during loading. With respect to the freeze–thaw-damaged red sandstone samples, the number of freeze–thaw cycles altered the initial pore and fracture structure of the samples, thereby reducing their elastic energy storage capacity during loading and increasing the proportion of dissipated energy. Therefore, by analysing variations in U, Ue, Ud, μ, and λ, the damage evolution mechanism of red sandstone samples under disparate freeze–thaw states and cycle numbers can be revealed from an energy perspective.

4.1. Energy Distribution Characteristics of Sandstone Under Freeze–Thaw Cycles

The evolution of the total strain energy U, elastic energy Ue, and dissipated energy Ud with respect to axial strain for red sandstone samples under different moisture states and numbers of freeze–thaw cycles is shown in Figure 12, Figure 13 and Figure 14. From a peak energy perspective, the peak total strain energy and peak elastic energy of the samples after freeze–thaw cycling are generally lower than those of the initial samples, indicating that freeze–thaw damage weakens the energy storage capacity of red sandstone samples before failure. The peak total strain energy and peak elastic energy of the initial samples are approximately 25.52 kJ/m3 and 22.91 kJ/m3, respectively. After 60 freeze–thaw cycles, these values decrease to approximately 18.02 kJ/m3 and 15.49 kJ/m3 in the GA group, approximately 11.94 kJ/m3 and 9.83 kJ/m3 in the GB group, and approximately 19.03 kJ/m3 and 16.32 kJ/m3 in the GC group. Therefore, the peak total strain energy and elastic energy of the GB group are most strongly attenuated, indicating that the bearing skeleton of the samples in the semi-immersed state is more strongly affected by freeze–thaw damage and that their prepeak energy accumulation capacity is significantly reduced.
Dissipated energy curves reflect energy-consumption characteristics associated with crack compaction, frictional sliding, and crack propagation during sample loading. In the GA group, the energy dissipated after 20 and 40 freeze–thaw cycles is inferior to that of the initial samples, whereas it increases to approximately 2.53 kJ/m3 after 60 cycles, indicating that energy consumption is enhanced by crack propagation at high numbers of cycles. In the GB group, the dissipated energy changes only slightly overall; however, its total strain energy and elastic energy decrease most obviously, indicating that less energy can be stored after freeze–thaw treatment and that the input energy is more readily consumed by crack closure and damage propagation. In the GC group, the dissipated energy increases to approximately 3.21 kJ/m3 after 60 freeze–thaw cycles, indicating that crack propagation and coalescence consume more energy after high-cycle freeze–thaw treatment in the fully immersed state. Overall, freeze–thaw cycling decreases the elastic energy storage capacity of red sandstone samples and increases the degree of dissipative damage during loading. Under disparate moisture states, different water participation modes lead to differences in energy accumulation and dissipation among groups.
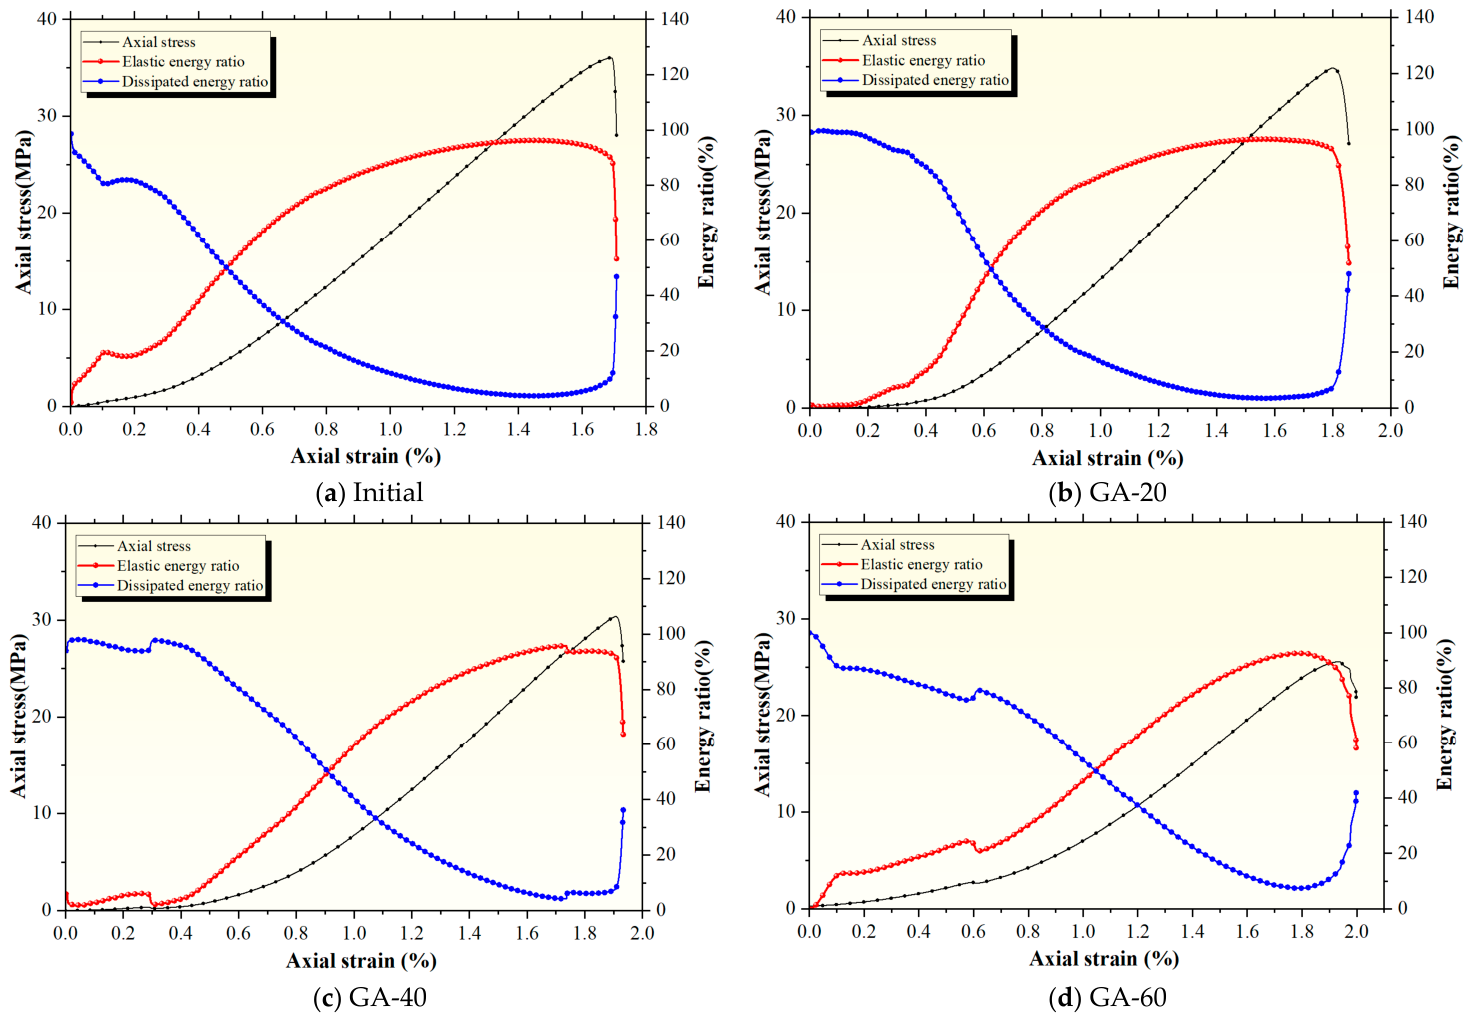
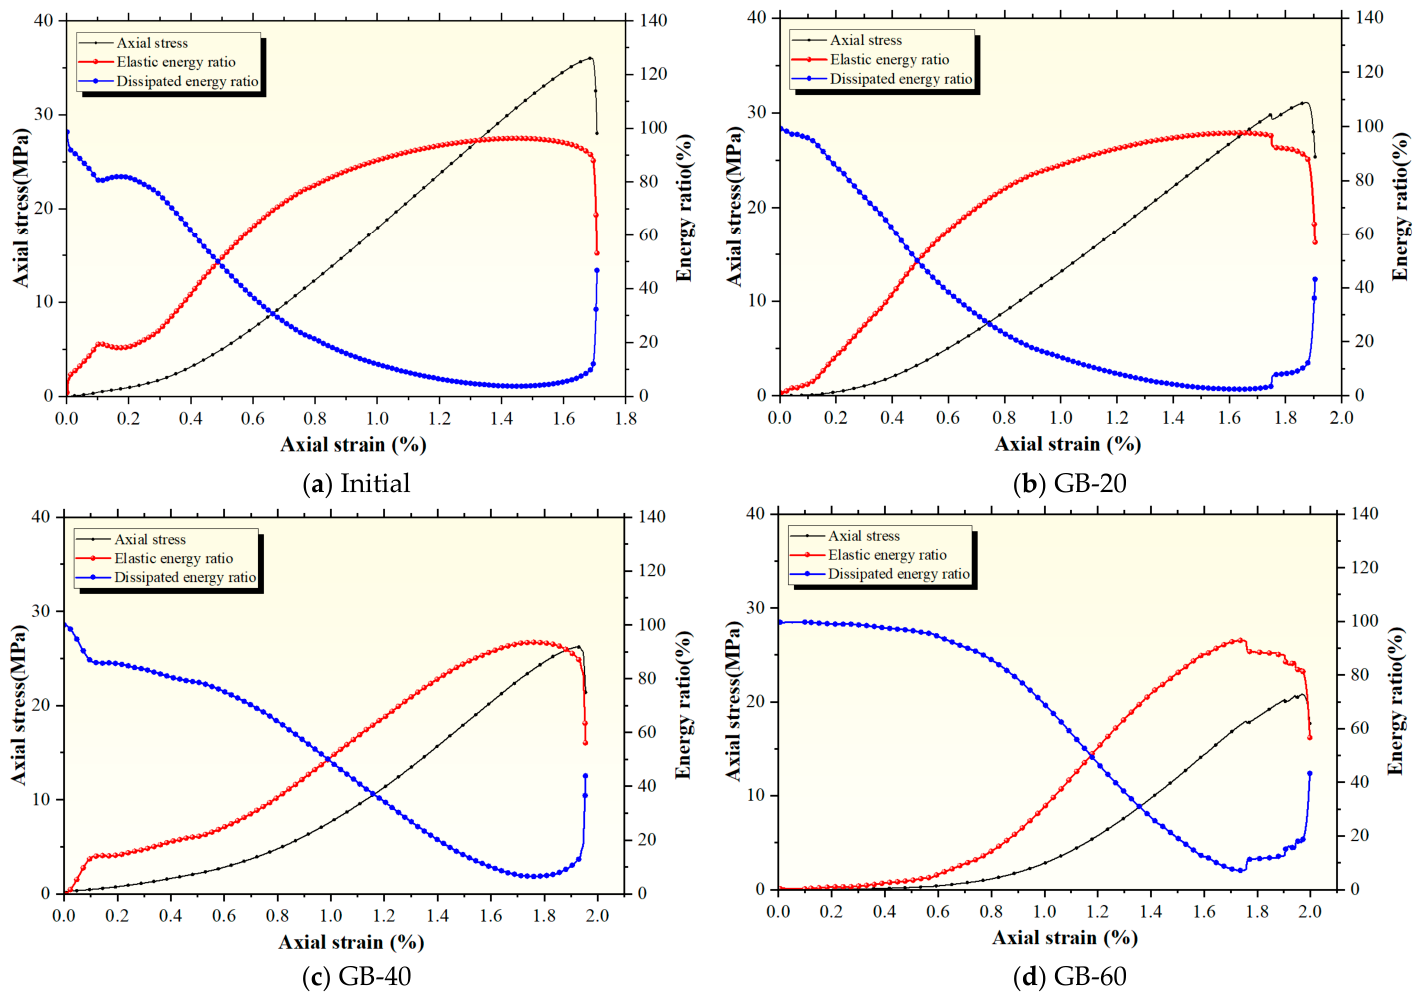
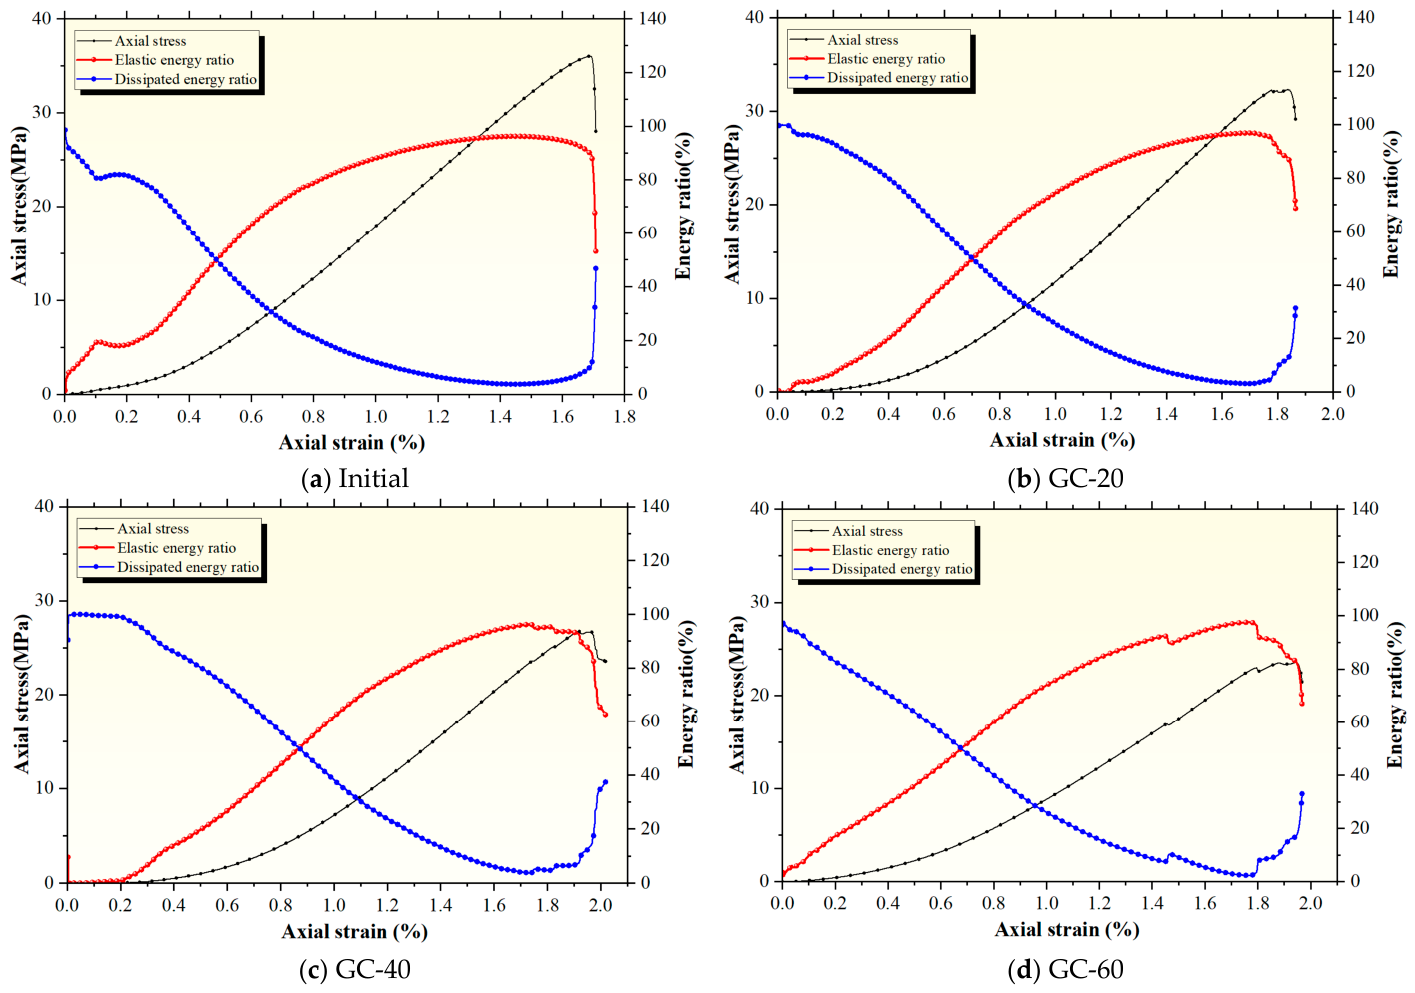
The variations in axial stress, elastic energy ratio, and dissipated energy ratio with axial strain during uniaxial compression for the GA, GB, and GC groups are shown in Figure 15, Figure 16 and Figure 17. Overall, the sample energy distribution curves under different moisture states and numbers of freeze–thaw cycles exhibit obvious stage characteristics and correspond well to rock compaction, elastic energy storage, crack propagation, and macroscopic failure processes. During the early loading stage, energy absorbed by rock is transformed primarily into dissipated energy. As deformation enters the elastic stage, the elastic energy ratio increases gradually, whereas the dissipated energy ratio decreases. When the failure stage is approached, the elastic energy ratio decreases rapidly, and the dissipated energy ratio increases rapidly, reflecting the energy transformation characteristics associated with crack propagation, coalescence, and macroscopic failure. Therefore, variations in the elastic energy ratio and dissipated energy ratio could effectively reveal the full process of freeze–thaw red sandstone samples, from compaction energy consumption to elastic energy storage and then to failure energy consumption.
At the early loading stage, the dissipated energy ratio of all three groups is high, whereas the elastic energy ratio is low. During such a stage, the primary pores, freeze–thaw–induced microcracks, and particle contact surfaces inside the samples have not yet been fully closed. Externally input energy is consumed mainly by pore compaction, crack-surface friction, particle rearrangement, and local structural adjustment, and only a small amount of energy can be retained in the rock skeleton as elastic energy. As the axial strain increases, the specimens gradually enter the stable loading stage. Most closable cracks are compacted, and the rock skeleton begins to bear the main load. The elastic energy ratio increases rapidly and gradually becomes dominant, whereas the dissipated energy ratio continuously decreases. During such a stage, the input energy is maintained mainly inside the sample in the form of recoverable elastic strain energy. When loading approaches the peak strength, the elastic energy ratio starts to decrease after reaching a high level, whereas the dissipated energy ratio rebounds rapidly from a low value. This finding indicates that internal cracks change from stable propagation to unstable propagation and that the elastic energy originally stored in the rock skeleton begins to be released and converted into the dissipated energy required for rapid crack propagation, frictional sliding along crack surfaces, and macroscopic fracture.

4.2. Energy Dissipation Ratio-Based Freeze–Thaw Damage Analysis

The variations in the peak elastic energy ratio and dissipated energy ratio under different moisture states and numbers of freeze–thaw cycles are shown in Figure 18. To characterize the energy distribution characteristics at the peak point, the peak elastic energy ratio μN and dissipated energy ratio λN of samples after N freeze–thaw cycles are defined as follows:
μ N = U e N U N × 100 %
λ N = U dN U N × 100 %
where UN, UeN, and UdN are the total strain energy, elastic energy, and dissipated energy, respectively, corresponding to the sample peak point after N freeze–thaw cycles. In terms of energy dissipation theory, dissipated energy is mostly consumed by irreversible damage processes such as crack closure, crack propagation, particle friction, cementation failure, and plastic deformation. Therefore, the peak dissipated energy ratio can be applied to reflect the degree of rock damage-related energy consumption before the peak strength is reached. Gao et al. [1] reported that the peak dissipated energy ratio can reflect the deformation process prior to rock failure and characterize the degree of initial damage caused by freeze–thaw cycles. A larger dissipated energy ratio indicates more severe internal freeze–thaw damage and lower energy accumulation efficiency. The peak dissipated energy ratio was selected because it directly reflects the proportion of input energy consumed by irreversible processes before peak failure, including crack closure, intergranular friction, cementation failure, and microcrack propagation. Compared with indicators based only on strength or elastic modulus degradation, this parameter can link energy conversion with macroscopic strength attenuation and deformation growth. The novelty of its use in this study lies not in redefining the basic energy theory but in applying it to compare different moisture boundary states and in combining it with crack closure, brittleness, and AE indicators. No independent sensitivity test of the energy dissipation-based damage variable was conducted; however, because all the samples were processed using the same calculation procedure, the index is still useful for comparing the relative influence of the number of freeze–thaw cycles and moisture boundary conditions.
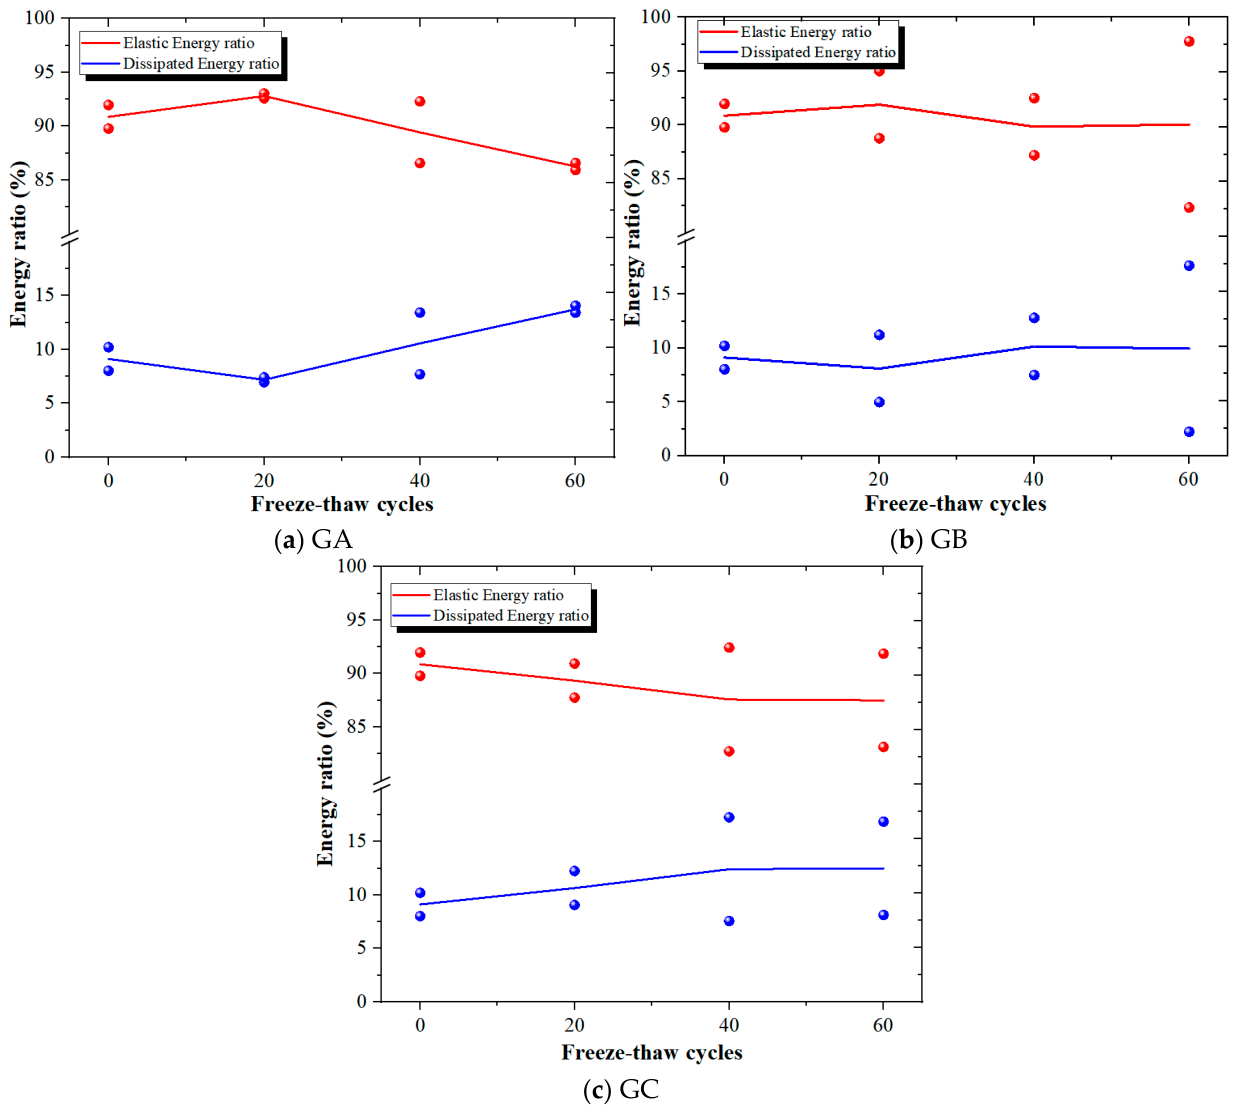
As shown in Figure 18, all the groups are still dominated by elastic energy storage at the peak point, with the elastic energy ratio remaining relatively high and the dissipated energy ratio remaining relatively low. With increasing number of freeze–thaw cycles, the elastic energy ratio generally decreases, whereas the dissipated energy ratio increases. This finding indicates that freeze–thaw cycling gradually weakens the prepeak elastic energy storage capacity of red sandstone samples and causes more input energy to be transformed into irreversible dissipated energy. The initial samples have a peak elastic energy ratio of approximately 90.88% and a dissipated energy ratio of approximately 9.12%. After 60 freeze–thaw cycles, the elastic energy ratio of the GA group decreases to approximately 86.27%, and the dissipated energy ratio increases to approximately 13.73%. The elastic energy ratio of the GB group fluctuates between approximately 89.85% and 91.90%, and its dissipated energy ratio after 60 cycles is approximately 9.94%. The elastic energy ratio of the GC group decreases from approximately 90.88% to approximately 87.50%, whereas the dissipated energy ratio increases from approximately 9.12% to approximately 12.50%.
From the perspective of different moisture states, the elastic energy ratio of the GA group increases slightly after 20 freeze–thaw cycles but then gradually decreases as the number of cycles increases. This finding indicates that early damage is relatively weak under the sealed water-retaining state, whereas internal cracks gradually develop after high-cycle freeze–thaw treatment, and the proportion of dissipative damage increases. The GB group peak energy ratio fluctuates more obviously, indicating that moisture migration and local frost-heaving action under the semi-immersed state are somewhat nonuniform, resulting in scattered energy distribution among different samples. In the GC group, the elastic energy ratio generally decreases, and the dissipated energy ratio gradually increases with increasing cycle number, indicating that the pore–water phase transition and frost-heaving action under the fully immersed state continuously promote crack propagation.
On the basis of the variation in the peak dissipated energy ratio shown in Figure 18, an energy-dissipation-based freeze–thaw damage variable can be constructed. In reference to the method of Gao et al. [1], who defined a freeze–thaw damage variable on the basis of the peak dissipated energy ratio, this study denoted the peak dissipated energy ratio of unfrozen–thawed samples as λ0 and that of samples after N freeze–thaw cycles as λN. The freeze–thaw damage variable can then be denoted as follows:
D N * = λ N - λ 0 λ 0
where D N * represents the energy dissipation-based freeze–thaw damage variable after N freeze–thaw cycles, λ0 represents the unfrozen–thaw sample peak dissipated energy ratio, and λN represents the sample peak dissipated energy ratio after N freeze–thaw cycles.
To further analyse the relationship between the energy damage variable and the macroscopic mechanical parameters, the peak strength relative variation rate ω σ and peak strain relative variation rate ω ε are defined as follows:
ω σ = σ N σ 0 σ 0 × 100 %
ω ε = ε N ε 0 ε 0 × 100 %
where σ0 and ε0 represent the peak strength and peak strain, respectively, of the unfrozen-thawed sample and σN and εN denote the sample peak strength and peak strain, respectively, after N freeze–thaw cycles.
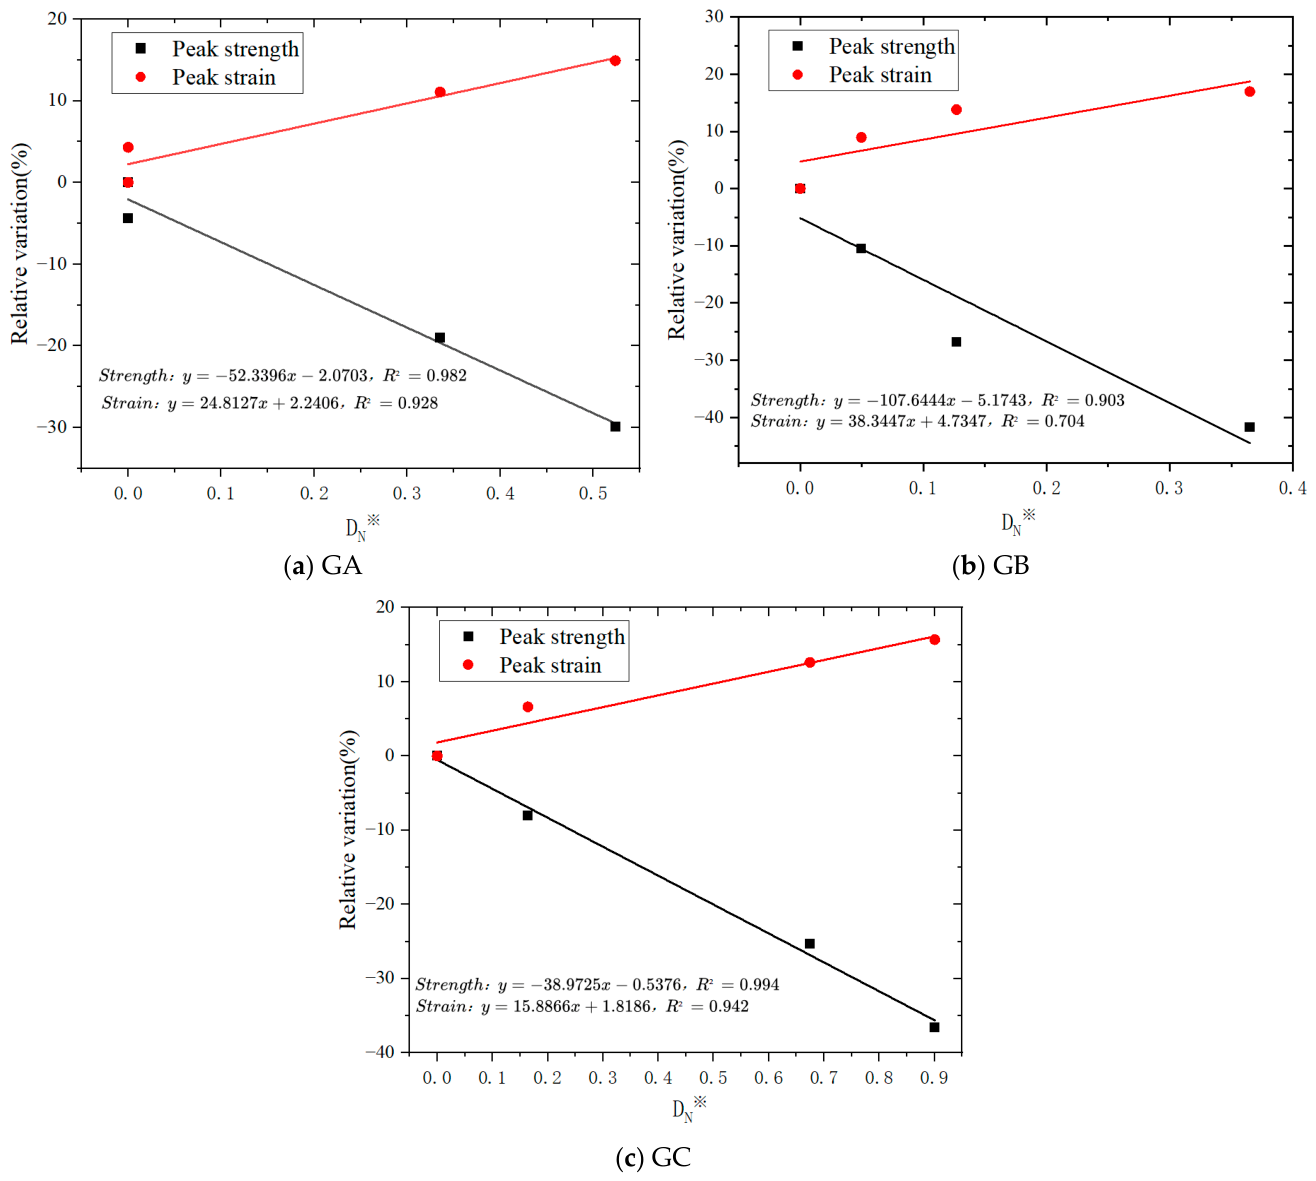
The relative change rate of the peak strength is negatively correlated with D N * , whereas the relative change rate of the peak strain is positively correlated with D N * (Figure 19). As D N * increases, the reduction in peak strength becomes more pronounced, whereas the increase in peak strain becomes more remarkable. This finding indicates that the energy dissipation-based freeze–thaw damage variable can simultaneously reflect strength degradation and deformation enhancement and can serve as an important indicator linking freeze–thaw cycles, moisture conditions, and changes in macroscopic mechanical properties.
The fitted equations and corresponding coefficients of determination (R2) are presented in Figure 19 to quantify the correlation between the energy-dissipation-based damage variable and the relative variations in peak strength and peak strain. The relatively high R2 values for most fitting relationships indicate that the proposed damage variable can effectively reflect the strength attenuation and deformation growth caused by freeze–thaw cycling under different moisture conditions. However, because only three freeze–thaw cycle levels were considered for each moisture condition, these fitting relationships are mainly used to describe the observed correlation trend rather than to establish a universal predictive model.
According to the fitting results, the relationship between the peak strength relative change rate and D N * is relatively high for the GA and GC groups, indicating that under sealed-water-retention and fully submerged conditions, the variation in the peak dissipated energy ratio can effectively characterize the strength degradation process. In contrast, the relationship between the peak strain relative change rate and D N * is relatively weak for the GB group, which may be related to moisture migration, local frost heave, and nonuniform crack propagation under half-submerged conditions. Under these conditions, the internal damage distribution of the sample is more heterogeneous, and the increase in peak strain is affected not only by overall energy dissipation but also by local crack development and differences in compaction deformation. Therefore, for engineering evaluation, using the strength loss rate alone may result in an underestimation of the change in rock deformation capacity after freeze–thaw treatment. It is therefore recommended that peak strength degradation, peak strain increase, and the energy dissipation ratio be jointly incorporated into the freeze–thaw damage evaluation system.
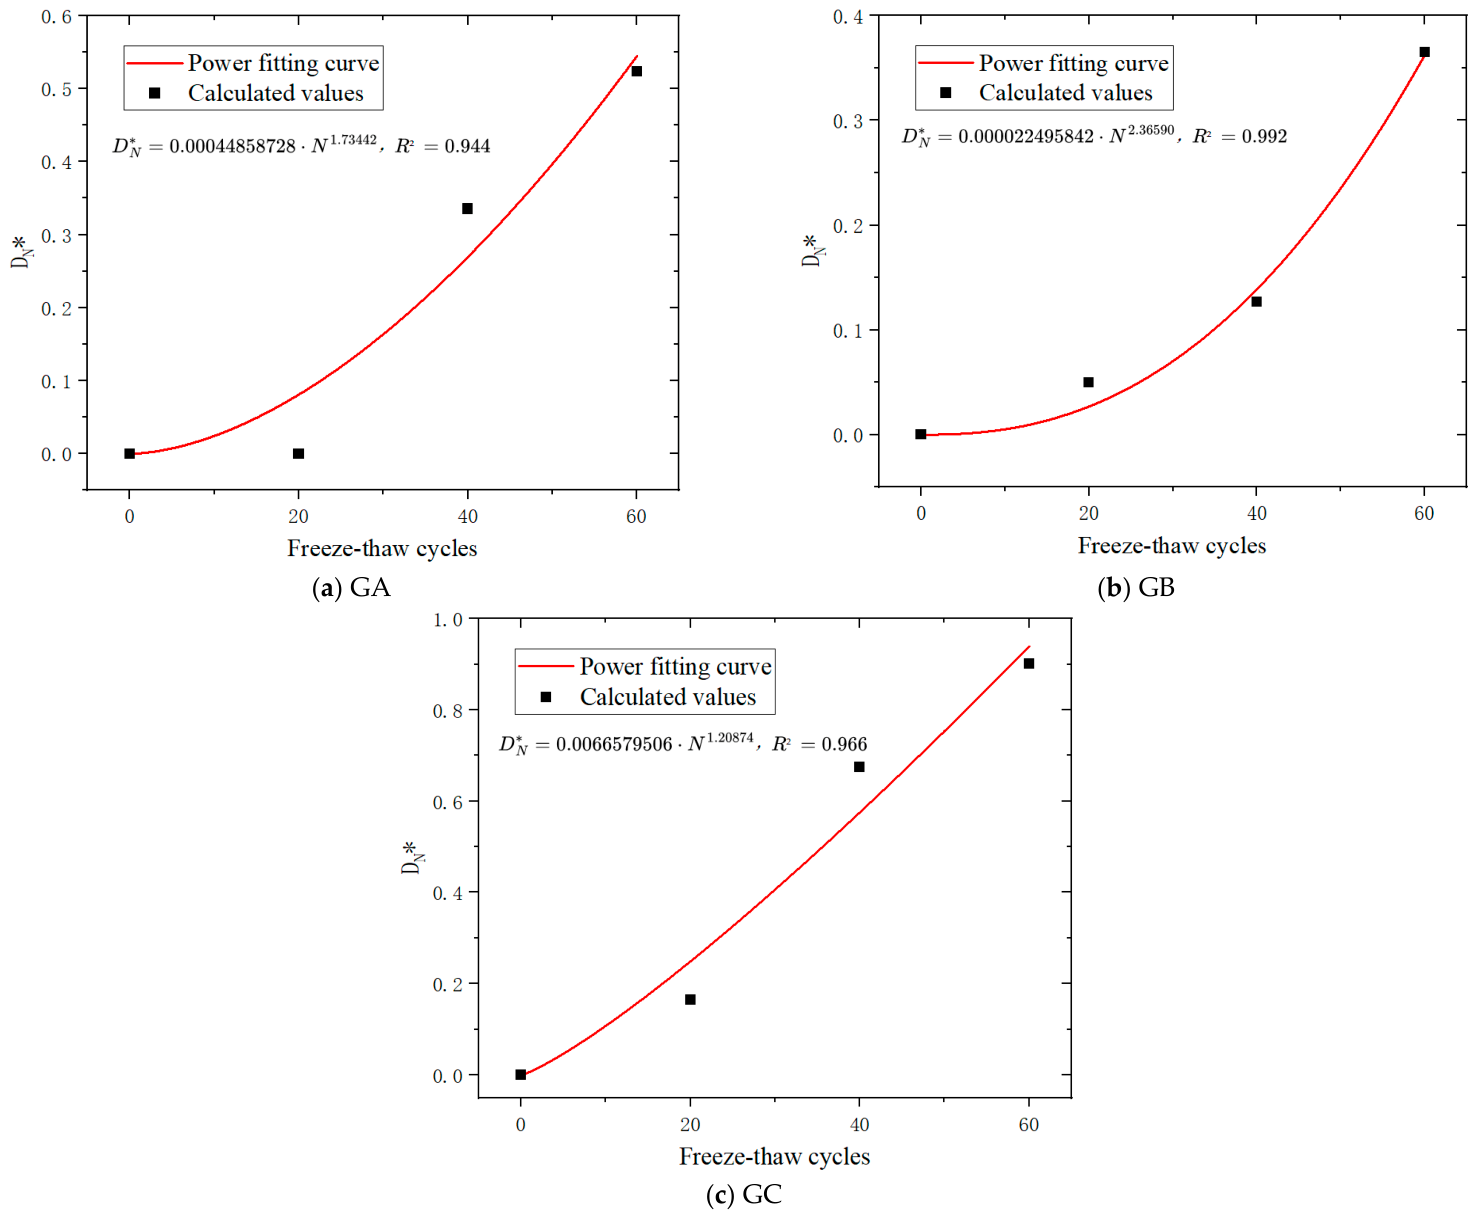
The energy dissipation-based freeze–thaw damage variable D N * of red sandstone samples under different moisture conditions increases with increasing number of freeze–thaw cycles and generally exhibits a nonlinear growth trend, as shown in Figure 20. This finding indicates that the impact of the number of freeze–thaw cycles on the red sandstone samples is cumulative. With increasing number of cycles, the pore water inside the sample repeatedly undergoes freezing expansion and thawing migration, causing the primary pores and microcracks to continuously expand and connect. As a result, the proportion of energy consumed by irreversible damage before peak failure gradually increases.
From the perspective of different moisture conditions, the GA group shows a relatively slow increase in D N * , indicating that under sealed-water-retention conditions, the external water supply is limited and that the freeze–thaw damage accumulation rate is relatively low. Although the overall D N * values of the GB group are relatively low, they show an evident nonlinear increasing trend with increasing cycle number, suggesting that the integrated impacts of moisture migration and local frost heave under half-submerged conditions make damage development more heterogeneous and sensitive. The greatest increase in D N * occurred in the GC group, which reached the highest level after 60 freeze–thaw cycles. This finding indicates that under fully submerged conditions, a sufficient water supply continuously promotes crack propagation through pore-water phase transition and frost heave, increasing the degree of energy dissipation-based damage to the sample.
Several limitations should be noted. First, quantitative measurements of internal moisture distribution, open porosity, water absorption, and saturation gradients were not conducted during freeze–thaw cycling. Second, complementary microscopic validation methods such as NMR, CT, SEM, and pore structure tests were not included. Third, the proposed brittleness and energy damage indices were evaluated only for red sandstone samples under the present testing conditions. Therefore, their transferability to other lithologies, stress paths, or moisture environments requires further validation. These limitations do not invalidate the observed deterioration trends, but they indicate that the proposed moisture-related damage mechanism should be further verified using direct moisture monitoring and pore structure characterization.

5. Conclusions

In this study, uniaxial compression tests, AE monitoring, and energy dissipation analysis were conducted to investigate the strength and deformation behavior, crack-closure features, brittleness degradation, and energy-damage characteristics of red sandstone samples under different numbers of freeze–thaw cycles and moisture states. The main conclusions are as follows:
(1)
Freeze–thaw cycling significantly weakens the bearing capacity of red sandstone samples. With increasing number of cycles, the UCS of the samples gradually decreases, and the peak strain increases, whereas the stress–strain curves shift toward a “low-stress and large-strain” response. After 60 freeze–thaw cycles, the UCS values of the GA, GB, and GC groups decrease by approximately 29.9%, 41.7%, and 36.5%, respectively, relative to the initial state. The degree of deterioration was most pronounced in the GB group, followed by the GC group, and was relatively weak in the GA group.
(2)
Freeze–thaw cycling promotes the development of pores and microcracks inside red sandstone samples. With increasing cycle number, the tangent deformation modulus decreases, the full compaction strain and crack-closure parameters increase, Bn1 and Bn2 generally decrease, and the AE response changes from concentrated release near peak to continuous prepeak activity. The GB group has more pronounced crack-closure parameters and AE activity, indicating more damage development in the semi-immersed state.
(3)
Freeze–thaw cycling affects the energy storage and dissipation relationships of red sandstone samples. With increasing cycle number, the peak total strain energy and elastic energy decrease, whereas the dissipated energy proportion increases. The freeze–thaw damage variable constructed on the basis of the peak dissipated energy ratio displays nonlinear growth and corresponds well to strength reduction and peak strain increase.
Notably, the conclusions of the present study are primarily based on macroscopic mechanical tests, AE count characteristics, and energy analysis under limited replicate conditions. Further work involving direct moisture monitoring, pore structure characterization, and more extensive statistical testing is needed to verify the proposed moisture-related damage mechanism.

Author Contributions

Data curation, Q.W., C.L., B.L. and Y.L.; formal analysis, C.L.; funding acquisition, R.C. and X.Q.; investigation, Q.W., R.C. and B.L.; methodology, R.C.; supervision, X.Q.; validation, Q.W. and Y.L.; writing—original draft preparation, Q.W. All authors have read and agreed to the published version of the manuscript.

Funding

This research was funded by the National Natural Science Foundation of China (Nos. 52474118 and 52374256); the Guizhou Provincial Science and Technology Support Plan (No. 202321440016522135); the National Key Research and Development Program of China (No. 2022YFC2904602); and the Guangxi Key Research and Development Program (No. 2022AB31023).

Data Availability Statement

The data presented in this study are available from the corresponding author upon reasonable request.

Acknowledgments

The authors would like to thank the editors and anonymous reviewers for their valuable comments and suggestions on the manuscript.

Conflicts of Interest

Authors Rihong Cao, Bo Liu, and Xianyang Qiu were employed by Changsha Institute of Mining Research Co Ltd. The remaining authors declare that the research was conducted in the absence of any commercial or financial relationships that could be construed as a potential conflict of interest.

References

  1. Gao, F.; Cao, S.; Zhou, K.; Lin, Y.; Zhu, L. Damage characteristics and energy-dissipation mechanism of frozen-thawed sandstone subjected to loading. Cold Reg. Sci. Technol. 2020, 169, 102920. [Google Scholar] [CrossRef] [Scilit]
  2. Wang, P.; Xu, J.Y.; Fang, X.Y.; Wang, P.X. Energy dissipation and damage evolution analyses for the dynamic compression failure process of red-sandstone after freeze-thaw cycles. Eng. Geol. 2017, 221, 104–113. [Google Scholar] [CrossRef] [Scilit]
  3. Gao, F.; Wang, Q.; Deng, H.; Zhang, J.; Tian, W.; Ke, B. Coupled effects of chemical environments and freeze-thaw cycles on damage characteristics of red sandstone. Bull. Eng. Geol. Environ. 2016, 76, 1481–1490. [Google Scholar] [CrossRef] [Scilit]
  4. Weng, L.; Wu, Z.; Taheri, A.; Liu, Q.; Lu, H. Deterioration of dynamic mechanical properties of granite due to freeze-thaw weathering: Considering the effects of moisture conditions. Cold Reg. Sci. Technol. 2020, 176, 103092. [Google Scholar] [CrossRef] [Scilit]
  5. Zhu, T.; Zhu, H.; Li, A.; Zong, X.; Zeng, B.; He, X. Physical properties and anisotropy of sandstone during freeze-thaw cycle under unidirectional constraint. Cold Reg. Sci. Technol. 2024, 228, 104324. [Google Scholar] [CrossRef] [Scilit]
  6. Ke, B.; Zhou, K.P.; Deng, H.W.; Bin, F. NMR pore structure and dynamic characteristics of sandstone caused by ambient freeze-thaw action. Shock Vib. 2017, 2017, 9728630. [Google Scholar] [CrossRef] [Scilit]
  7. Ke, B.; Zhou, K.P.; Xu, C.S.; Deng, H.W.; Li, J.L.; Bin, F. Dynamic mechanical property deterioration model of sandstone caused by freeze-thaw weathering. Rock Mech. Rock Eng. 2018, 51, 2791–2804. [Google Scholar] [CrossRef] [Scilit]
  8. Wang, P.; Xu, J.; Liu, S.; Wang, H.; Liu, S. Static and dynamic mechanical properties of sedimentary rock after freeze-thaw or thermal shock weathering. Eng. Geol. 2016, 210, 148–157. [Google Scholar] [CrossRef] [Scilit]
  9. Huang, S.B.; Liu, Q.S.; Cheng, A.P.; Liu, Y.Z. A statistical damage constitutive model under freeze-thaw and loading for rock and its engineering application. Cold Reg. Sci. Technol. 2018, 145, 142–150. [Google Scholar] [CrossRef] [Scilit]
  10. Fang, W.; Jiang, N.; Luo, X. Establishment of damage statistical constitutive model of loaded rock and method for determining its parameters under freeze-thaw condition. Cold Reg. Sci. Technol. 2019, 160, 31–38. [Google Scholar] [CrossRef] [Scilit]
  11. Li, Y.; Wang, Z.; Cao, H.; Wu, T. Constitutive characteristics of rock damage under freeze-thaw cycles. Appl. Sci. 2024, 14, 4627. [Google Scholar] [CrossRef] [Scilit]
  12. Lin, H.; Liang, L.; Chen, Y.; Cao, R. A damage constitutive model of rock subjected to freeze-thaw cycles based on lognormal distribution. Adv. Civ. Eng. 2021, 2021, 6658915. [Google Scholar] [CrossRef] [Scilit]
  13. Jiang, W.T.; Lai, Y.M.; Yu, F.; Ma, Q.G.; Jiang, H.Q. Mechanical properties investigation and damage constitutive models of red sandstone subjected to freeze-thaw cycles. Cold Reg. Sci. Technol. 2023, 207, 103776. [Google Scholar] [CrossRef] [Scilit]
  14. Ma, J.; Jin, J.X.; Wu, P.F.; Qin, Z.F.; Jia, B.X. Study on the pore structure characteristics and damage constitutive model of sandstone under freeze-thaw conditions. Front. Earth Sci. 2023, 11, 1095686. [Google Scholar] [CrossRef] [Scilit]
  15. Wang, Z.; Yu, M.; Wang, L.; Xie, H.; Xu, Y.; Wang, L. Strength degradation characteristics and damage constitutive model of sandstone under freeze-thaw cycles. Sci. Rep. 2024, 14, 22674. [Google Scholar] [CrossRef] [Scilit] [PubMed]
  16. Jia, P.; Mao, S.Z.; Qian, Y.J.; Wang, Q.W.; Lu, J.L. The dynamic compressive properties and energy dissipation law of sandstone subjected to freeze-thaw damage. Water 2022, 14, 3632. [Google Scholar] [CrossRef] [Scilit]
  17. Zhou, K.P.; Li, B.; Li, J.L.; Deng, H.W.; Bin, F. Microscopic damage and dynamic mechanical properties of rock under freeze-thaw environment. Trans. Nonferrous Met. Soc. China 2015, 25, 1254–1261. [Google Scholar] [CrossRef] [Scilit]
  18. Huang, S.B.; Yu, S.; Ye, Y.C.; Ye, Z.Y.; Cheng, A.P. Pore structure change and physico-mechanical properties deterioration of sandstone suffering freeze-thaw actions. Constr. Build. Mater. 2022, 330, 127200. [Google Scholar] [CrossRef] [Scilit]
  19. Lin, H.; Lei, D.; Zhang, C.; Wang, Y.; Zhao, Y. Deterioration of non-persistent rock joints: A focus on impact of freeze–thaw cycles. Int. J. Rock Mech. Min. Sci. 2020, 135, 104515. [Google Scholar] [CrossRef] [Scilit]
  20. Lei, D.; Lin, H.; Chen, Y.; Cao, R.; Wen, Z. Effect of Cyclic Freezing-Thawing on the Shear Mechanical Characteristics of Nonpersistent Joints. Adv. Mater. Sci. Eng. 2019, 2019, 9867681. [Google Scholar] [CrossRef] [Scilit]
  21. Yang, C.; Zhou, K.; Xiong, X.; Deng, H.; Pan, Z. Experimental investigation on rock mechanical properties and infrared radiation characteristics with freeze-thaw cycle treatment. Cold Reg. Sci. Technol. 2021, 183, 103232. [Google Scholar] [CrossRef] [Scilit]
  22. Zhang, C.; Tan, T.; Duan, W.; Li, W.; Hu, K.; Liao, J. Dynamic response and damage constitutive model of freeze-thawed sandstone with or without filling materials in prefabricated flaws. Constr. Build. Mater. 2025, 467, 140435. [Google Scholar] [CrossRef] [Scilit]
  23. Tan, T.; Zhang, C.; Li, W.; Zhao, E. Evolution of Freeze–Thaw Damage Characteristics and Corresponding Models of Intact and Fractured Rocks Under Uniaxial Compression. Rock Mech. Rock Eng. 2024, 57, 8013–8033. [Google Scholar] [CrossRef] [Scilit]
  24. Niu, C.; Zhu, Z.; Zhou, L.; Li, X.; Ying, P.; Dong, Y.; Deng, S. Study on the microscopic damage evolution and dynamic fracture properties of sandstone under freeze-thaw cycles. Cold Reg. Sci. Technol. 2021, 191, 103328. [Google Scholar] [CrossRef] [Scilit]
  25. Zhang, C.; Zou, P.; Wang, Y.; Jiang, T.; Lin, H.; Cao, P. An elasto-visco-plastic model based on stress functions for deformation and damage of water-saturated rocks during the freeze-thaw process. Constr. Build. Mater. 2020, 250, 118862. [Google Scholar] [CrossRef] [Scilit]
  26. Shi, Z.; Li, J.; Wang, M.; Chen, J.; Lin, H.; Cao, P. Fatigue fracture behaviour and constitutive model of freeze-thaw sandstone under multilevel fatigue loads. Bull. Eng. Geol. Environ. 2023, 82, 319. [Google Scholar] [CrossRef] [Scilit]
  27. Ullah, B.; Zhou, Z.L.; Cai, X.; Lu, J.Y.; Zhao, C.C. Failure prediction and microcracks development based on acoustic emission and energy evolution for different rocks treated with freeze-thaw weathering. Bull. Eng. Geol. Environ. 2023, 82, 471. [Google Scholar] [CrossRef] [Scilit]
  28. Xing, Y.; Zhang, G.; Wan, B.; Zhao, H. Subcritical fracturing of sandstone characterized by the acoustic emission energy. Rock Mech. Rock Eng. 2019, 52, 2459–2469. [Google Scholar] [CrossRef] [Scilit]
  29. Shi, Z.; Li, J.; Wang, J. Energy Evolution and Fracture Behavior of Sandstone Under the Coupling Action of Freeze–Thaw Cycles and Fatigue Load. Rock Mech. Rock Eng. 2023, 56, 1321–1341. [Google Scholar] [CrossRef] [Scilit]
  30. Lockner, D.A. The role of acoustic emission in the study of rock fracture. Int. J. Rock Mech. Min. Sci. Geomech. Abstr. 1993, 30, 883–899. [Google Scholar] [CrossRef] [Scilit]
  31. Xie, H.P.; Ju, Y.; Li, L.Y. Criteria for strength and structural failure of rocks based on energy dissipation and energy release principles. Chin. J. Rock Mech. Eng. 2005, 24, 3003–3010. [Google Scholar]
  32. Xie, H.P.; Ju, Y.; Li, L.Y.; Peng, R.D. Energy mechanism of deformation and failure of rock masses. Chin. J. Rock Mech. Eng. 2008, 27, 1729–1740. [Google Scholar]
  33. Gong, F.Q.; Luo, S.; Yan, J.Y. Energy storage and dissipation evolution process and characteristics of marble in three tension-type failure tests. Rock Mech. Rock Eng. 2018, 51, 3613–3624. [Google Scholar] [CrossRef] [Scilit]
  34. Meng, Q.; Zhang, M.; Han, L.; Pu, H.; Nie, T. Effects of acoustic emission and energy evolution of rock specimens under the uniaxial cyclic loading and unloading compression. Rock Mech. Rock Eng. 2016, 49, 3873–3886. [Google Scholar] [CrossRef] [Scilit]
  35. Zhang, M.; Meng, Q.; Liu, S. Energy evolution characteristics and distribution laws of rock materials under triaxial cyclic loading and unloading compression. Adv. Mater. Sci. Eng. 2017, 2017, 5471571. [Google Scholar] [CrossRef] [Scilit]
  36. Ji, P.Q.; Zhang, X.P.; Zhang, Q. A new method to model the non-linear crack closure behavior of rocks under uniaxial compression. Int. J. Rock Mech. Min. Sci. 2018, 112, 171–183. [Google Scholar] [CrossRef] [Scilit]
  37. Wang, C.; Gu, Z.; Xiong, X.; Gao, S. Uniaxial damage constitutive model of freeze-thaw rock based on improved Harris function distribution. Ain Shams Eng. J. 2026, 17, 104100. [Google Scholar] [CrossRef] [Scilit]
Figure 1. Variation in time–temperature during freeze–thaw (F–T) cycling.
Applsci 16 07593 g001
Figure 2. Freeze–thaw experiments and testing procedure: (a) Freeze–thaw chamber; (b) sealed water-retaining state; (c) semi-immersed state; (d) fully immersed state; (e) specimen grouping; (f) loading system; (g,h) uniaxial compression and AE monitoring.
Applsci 16 07593 g002
Figure 3. Stress–strain curves.
Applsci 16 07593 g003
Figure 4. Changes in the UCS and peak strain with respect to the number of freeze–thaw cycles. The scattered points represent repeated samples, and the solid lines represent the mean values.
Applsci 16 07593 g004
Figure 5. Variation in the tangent deformation modulus and full compaction strain with respect to the number of freeze–thaw cycles. The scattered points represent repeated samples, and the solid lines or bars represent the mean values.
Applsci 16 07593 g005
Figure 6. (a) Stress–strain and (b) tangent modulus–strain curves of red sandstone samples without freeze–thaw cycle treatment.
Applsci 16 07593 g006
Figure 7. Tangent modulus–strain curves of specimens under different freeze–thaw states and numbers of cycles.
Applsci 16 07593 g007
Figure 8. Variation in crack-closure stress and strain after freeze–thaw cycles.
Applsci 16 07593 g008
Figure 9. Rock brittleness indices under different freeze–thaw states and cycles: (a) Bn1; (b) Bn2.
Applsci 16 07593 g009
Figure 10. Load, AE counts, and normalized cumulative AE energy during loading.
Applsci 16 07593 g010aApplsci 16 07593 g010b
Figure 11. Relation of dissipated energy to elastic energy in rock elements.
Applsci 16 07593 g011
Figure 12. Energy evolution curves of the GA group.
Applsci 16 07593 g012
Figure 13. Energy evolution curves of the GB group.
Applsci 16 07593 g013
Figure 14. Energy evolution curves of the GC group.
Applsci 16 07593 g014
Figure 15. Energy distribution curves of the GA group.
Applsci 16 07593 g015
Figure 16. Energy distribution curves of the GB group.
Applsci 16 07593 g016
Figure 17. Energy distribution curves of the GC group.
Applsci 16 07593 g017
Figure 18. Relationships between the peak energy ratio and the number of freeze–thaw cycles under different freeze–thaw states.
Applsci 16 07593 g018
Figure 19. Relative variation in peak strength and peak strain with respect to the damage variable   D N .
Applsci 16 07593 g019
Figure 20. Relationship between the freeze–thaw damage variable D N and number of freeze–thaw cycles under different freeze–thaw states.
Applsci 16 07593 g020
Table 1. Specimen grouping and freeze–thaw state settings.
GroupFreeze–Thaw StateNumber of CyclesMain Physical Implication
InitialUnfrozen-thawed0Reference for mechanical and energy-damage evaluation
GASealed water-retaining state after saturation20, 40, 60Weak water participation; mainly reflects temperature cycling and primary defects
GBSemi-immersed state after saturation20, 40, 60Combined effects of moisture migration, capillary replenishment, and freeze–thaw alternation
GCFully immersed state after saturation20, 40, 60Sufficient water supply; obvious pore-water phase transition and frost-heaving action
Disclaimer/Publisher’s Note: The statements, opinions and data contained in all publications are solely those of the individual author(s) and contributor(s) and not of MDPI and/or the editor(s). MDPI and/or the editor(s) disclaim responsibility for any injury to people or property resulting from any ideas, methods, instructions or products referred to in the content.