Article

Damage-Aware Closed-Form Tuning of Rooftop Mass Dampers for Long-Period RC Towers Under Inelastic Period Drift

Department of Earthquake Engineering, Institute of Disaster Management, Istanbul Technical University, Maslak, Istanbul 34469, Türkiye
*
Author to whom correspondence should be addressed.
Appl. Sci. 2026, 16(15), 7424; https://doi.org/10.3390/app16157424
Submission received: 22 June 2026 / Revised: 13 July 2026 / Accepted: 21 July 2026 / Published: 24 July 2026

Featured Application

The framework gives structural engineers a transparent closed-form route to size and tune passive TMDs on long-period RC towers at the preliminary design stage. It replaces case-by-case numerical optimization while keeping the damper effective across the full-period range from the elastic state to the damaged state.

Abstract

Seismic design of long-period reinforced concrete tall buildings is drift-dominated, and yet closed-form tuned mass damper (TMD) calibration lacks a rank-oriented robustness framework and a deterministic treatment of inelastic period drift. First, a two-layer closed-form calibration procedure is verified on 30-, 48- and 60-storey RC towers with periods of 3.80 to 8.45 s on a rock-like Istanbul site under eleven spectrum-matched records. The first layer, a Robust Tuning Index built on four design requirements, weighs nominal suppression against detuning robustness through a closed-form dominance condition and a unique crossover at the ±13% band. The second layer, a period-elongation-aware anchor, sets the calibration period to the mean of the elastic and DD-2 secant first-mode periods, capping the worst-case offset at ±9.0% to ±12.1% against +19.7% to +27.6% under elastic anchoring. Response-history analyses give mean peak roof-drift reductions of 2.8% to 4.6% with statistically inseparable formulation means at exact tuning, while the Sadek calibration cuts dispersion by more than a third and stroke by roughly a third, carries 2.3 to 2.5 times less frequency-response loss at the anchor offsets, and ranks first in 122 of 144 envelope scenarios. The framework replaces numerical retuning with a transparent closed-form route within the linear verification tier.

1. Introduction

The seismic design of reinforced concrete (RC) tall buildings, whose first translational period exceeds five seconds, operates outside the regime in which classical structural control intuition applies. Spectral acceleration at the fundamental period falls to a small fraction of the short-period plateau, the inertial base shear ratio stays modest, and peak floor drift rather than base shear governs the demand, with spectral displacement reaching values that wall thickening and section growth cannot economically suppress. Passive tuned mass dampers (TMDs) have served as the operative supplemental damping pathway on this building class since the 1990s, with the closed-form trio of Den Hartog [1], Warburton [2] and Sadek [3] remaining the dominant calibration choices. Two analytical problems and one verification gap nevertheless persist. The trade-off between nominal peak suppression and detuning robustness lacks a rank-oriented scalarization that survives a wide-band parameter sweep. The deterministic period drift produced by inelastic action is not bound by closed-form anchors. Beyond these two analytical problems, joint validation across a parametric tower family with an explicit joint parameter sweep is absent. The present paper resolves the two analytical problems through a two-layer rank-oriented calibration procedure verified on a 30-to-60-storey RC core tower family on the Istanbul ZB reference site and establishes the parametric verification platform that closes the third gap.
Istanbul lies within tens of kilometers of the right lateral North Anatolian Fault. The Turkish Building Earthquake Code TBDY 2018 [4] hazard map identifies moment magnitudes of 7.0 to 7.4 along the Marmara segment as plausible within the service life horizon of the present high-rise inventory, of which more than two hundred RC towers exceeding 150 m have been built in the Marmara basin since 2010. Field surveys of pre-2007 RC frame stock on neighboring sites document detailing limitations that no economical stiffening can close [5,6], and shake table evaluations of tube-in-tube buckling-restrained brace retrofits on substandard frames [7,8] establish that brace family as the complementary device for the older non-ductile stock, leaving the TMD as the operative choice for the new long-period inventory.
The passive TMD holds the longest analytical record among supplemental damping devices. Frahm [9] patented the undamped absorber. Ormondroyd and Den Hartog [10] introduced viscous damping and the fixed-point solution, later consolidated by Den Hartog [1]. Warburton [2,11] adapted the criterion of white noise base acceleration through displacement-variance minimization. Sadek et al. [3] embedded the primary structure damping ratio in the optimization, obtaining a larger damper damping ratio that trades a modest loss in nominal peak suppression for a broader effective bandwidth. Asami et al. [12] derived closed-form  H  and  H 2  solutions for damped primary systems. The Den Hartog, Warburton and Sadek trio constitute the canonical baseline against which numerical and metaheuristic frameworks are benchmarked.
The seismic effectiveness of TMD has been questioned for more than four decades on the basis of early parametric evidence. Kaynia et al. [13] evaluated peak response ratios of damped systems under an ensemble of historical records and found reductions that were modest and widely scattered, with conventional stationary random vibration theory shown to overpredict the benefit. Sladek and Klingner [14] tuned a rooftop damper to a realistic high-rise prototype at a mass ratio of 0.026 and observed no reduction in peak seismic response. Three mechanisms explain these negative findings, and their separation defines the scope of the present study. Short-duration broadband input supplies too few response cycles for the absorber to develop the counterphase inertial force. A calibration anchored to the elastic period becomes detuned once cracking and plastic hinge rotation lengthen the effective period. A practical mass ratio of nearly 2% limits the attainable supplemental modal damping. The first mechanism loses relevance as the fundamental period lengthens, since the drift governing first-mode response of a tower beyond 5 s is narrow-band and long in duration regardless of the broadband character of the base input, which explains the renewed adoption of the device for this building class. The second and third mechanisms remain, and they correspond to the two layers of the present framework. The Robust Tuning Index quantifies the suppression loss under detuning at a given mass ratio, and the period-elongation-aware anchor converts the inelastic period drift into a bounded deterministic design input.
Supplemental damping systems for tall buildings fall into three groups: distributed velocity-dependent devices, damped outriggers, and tuned mass devices, and the selection among them depends on the structural configuration. Distributed viscous and viscoelastic dampers dissipate energy through inter-storey velocity and remain the standard supplemental system for mid-rise frames [15,16], yet at a fixed drift amplitude the inter-storey velocity decreases as the fundamental period lengthens, so the first-mode contribution of these devices diminishes on a core-governed tower. A specialized branch of the same passive family develops dry friction devices built on cut and slotted shells with deformable fillers, whose stiffness and damping follow from the configuration of the shell cut. A helical cut shell damper has been modeled numerically for energy sector and construction applications [17], and a slotted shell friction damper has been resolved analytically for the elastic suspension of sucker rod strings [18]. These devices and their hybrid combinations with elastic elements operate at the component and equipment scale rather than on the global first mode of a tower, and they share with the closed-form TMD route the principle of dissipation parameters set analytically rather than searched numerically. The damped outrigger converts the differential rotation between the core and the perimeter columns into damper stroke and restores concentrated energy dissipation in the super-tall range. Chen et al. [19] derived the modal damping of the damped outrigger in closed form together with its sensitivity to outrigger location, and Wang et al. [20] extended the configuration through stochastic optimization of combined negative stiffness and conventional damped outriggers under nonstationary seismic excitation. The outrigger solution requires dedicated stiffened storeys, transfers the damper forces into the perimeter columns, and depends on the architectural section. The rooftop TMD requires none of these provisions. It is installed at a single upper storey, does not alter the gravity or lateral load path below the installation level, and admits transparent closed-form calibration. For the core-governed 30-to-60-storey family studied here, which contains no outrigger storeys, the roof-mounted TMD is the applicable passive alternative.
Numerical optimization has since expanded the design search space. Genetic algorithm calibration of multiple TMDs [21], gradient-based numerical optimization [22], a transfer function formulation [23], and machine learning parameter regression [24] have all enlarged the search beyond the closed-form era, while Çoşut et al. [25] consolidated Jaya and hybrid Jaya-Teaching-Learning variants and reported tuning parameter recovery within 2% of the closed-form Den Hartog and Sadek targets, an independent numerical benchmark for the closed-form rankings examined.
Multi-mode and distributed configurations have been studied since the early 1990s. Distributed mass dampers under random loading [26], sequential placement with shake table verification [27,28], vertically distributed multiple TMDs for tall buildings [29], the generalization to irregular structures [30] and to the contemporary tall RC inventory [31], a 36 storey equivalent friction type verification [32], strategic floor-level placement [33], and the resolution of dry friction and cubic stiffness nonlinearities [34] have progressively widened the device space, with offshore multihazard configurations [35] and genetic algorithm tuning on a cross laminated timber tower [36], extending it further. Farsijani et al. [37] reported invariant optimum tuning envelopes spanning a frequency ratio between 0.75 and 1.10 and a damper damping ratio between 0.03 and 0.20 across 5-to-20-storey structures under 150 near-field pulse-like records, a direct precedent for the parametric multi-tower approach adopted in the present study.
Robustness-oriented work has addressed uncertainty in the device and in the host structure through robust min–max design for mass uncertain rolling-pendulum devices [38], analytical relations for the recorded motion response [39], a time-domain minimax formulation with event optimum parameters per record [40] and the subsequent balance of split modal mass criterion for a priori unknown input [41], frequency detuning studies on highspeed railway bridges [42], and the inerter-augmented configuration that lowers the required damper mass [43,44]. This sub-stream has not packaged the trade-off as a rank-oriented scalar reduction on the canonical closed-form trio, nor demonstrated invariance of the induced ordering under joint parametric perturbation of the host tower.
The soil–structure interaction- and performance-based backbones relevant to extending this framework rest on the rigid mat impedance theory of Veletsos and Meek [45], Kausel et al. [46], Gazetas [47] and Mylonakis et al. [48], with TMD-specific extensions that include foundation compliance [49,50], and on the performance-based framework of Cornell and Krawinkler [51] and FEMA P-58 [52], with record selection after Iervolino and Manfredi [53] and the appendage-damping theory of Villaverde and Koyama [54]. Field practice on the Taipei 101 [55] and Shanghai Tower [56] pendulum and eddy current dampers, recent active control algorithms [57], and consolidating reviews [15,16,58,59,60,61,62] identify semi-active and adaptive variants as the principal extension directions.
Two analytical issues remain open for the long-period RC tower application, alongside the verification gap that the parametric platform of this paper is designed to close. First, the Den Hartog formulation maximizes nominal peak suppression but degrades steeply when the structural frequency drifts, while the Sadek formulation surrenders a small nominal margin for a wide robustness zone. The robustness sub-stream [37,38,39,40] treats this trade-off through minimax and robust min–max design rather than as a rank-oriented scalar on the canonical trio, and the recent reviews [58,59,60,61] discuss it only qualitatively. Second, cracking of the concrete core, plastic hinge formation, and long-term creep all push the first-mode period upward, yet conventional design proceeds from the elastic value alone, and the available literature treats detuning as a stochastic perturbation rather than as a deterministic input derivable from the secant period evolution that a modal pushover [63] supplies directly. The inelastic response stream approaches the same phenomenon from the device side. Soto-Brito and Ruiz [64] showed on a nonlinear twenty-two-storey frame that the effectiveness of an elastically tuned device degrades as the intensity drives the structure into yielding. Lukkunaprasit and Wanitkorkul [65] proposed the hysteretic energy absorption ratio as the effectiveness measure for elastoplastic buildings under narrow-band distant motions, since the peak displacement ratio conceals the reduction in dissipated energy in the yielding storeys, and Pinkaew et al. [66] showed on the same building class that with past yields the device stops reducing the peak displacement and yet continues to reduce the hysteretic damage. Sgobba and Marano [67] optimized the linear device on a Bouc–Wen host and found the optimum displaced from its linear position, and a recent high-mass-ratio retrofit application sustained its reductions through incremental dynamic analyses on the nonlinear model [68]. This stream establishes that the device remains worth tuning past the elastic range and that its optimum moves with the softening host, yet it stops short of converting that movement into a calibration rule. The present framework supplies the rule in closed form. Field and numerical evidence on damaged RC systems supports the deterministic character of this drift. Damage accumulation models reproduce the progressive stiffness degradation and the associated period lengthening of the damaged RC stock as a traceable function of the demand history [69], and fragility analyses of degraded RC configurations confirm that the softened state governs the subsequent response [70]. A damper anchored to the intact elastic period therefore operates at a growing tuning offset as damage develops, and the present framework bounds this deterministic detuning in closed form.
This paper resolves both issues and establishes a parametric verification platform through three contributions. The first is the Robust Tuning Index (RTI), a multiplicative rank-oriented scalar formed from the mean roof drift reduction of an eleven-record spectrum-matched set, minus the average relative growth of the frequency response peak under a bounded ±10% mistuning band. A closed-form dominance condition identifies the detuning bandwidth beyond which the Sadek formulation overtakes Den Hartog, with a unique bandwidth crossover located at the ±13.2% band at the reference tower, and the Sadek formulation ranks first in 122 of the 144 scenarios of the joint parameter envelope and at every tower under the worst-case measure. The second is the period-elongation-aware (PEA) anchor, set at the arithmetic mean of the elastic and DD-2 secant first-mode periods, the DD-2 level denoting the 10% in 50 years design earthquake of TBDY 2018 [4], which bounds the worst-case damage state-of-tune offset to ±9.0%, ±11.0%, and ±12.1% at the three towers against +19.7% to +27.6% under elastic anchoring. The anchor is a proven minimax optimal across symmetric monotone off-tune cost functions, and the proof extends to the asymmetric case. The two layers interlock through the frequency response envelope. The frequency response point losses at the anchor offsets are 13.6% to 18.6% for the Sadek calibration against 33.5% to 42.3% for its elastic-anchored Den Hartog counterpart, so the PEA-anchored robust device sustains a bounded loss at the damage-state detuning extremes rather than the runaway off-tune of an elastic-anchored device. The third is the three-tower parametric platform of 30-, 48-, and 60-storey RC core towers with first periods of 3.80, 6.824, and 8.45 s, on which a Sherman–Morrison–Woodbury [71] rank-one update accelerates the 216,000-point grid search by a factor of 8.1 at a residual norm of order 10−12, and eleven-record Newmark-β response histories on openly redistributable inputs verify the band-conditional ordering, the Sadek formulation leading beyond the crossover and at the damage state offsets. This platform supplies a standalone modeling basis.
The remainder of the paper proceeds as follows. Section 2 describes the three-tower parametric family, the cracked-section assumptions, the TBDY 2018 [4] design spectrum at the Istanbul ZB reference site, and the eleven-record ground motion set scaled separately for each tower. Section 3 develops the design framework, including the per-tower calibration matrix, the SMW-accelerated grid search, the RTI with its rank-invariance verification, and the PEA procedure with the two lemmas and their corollary. Section 4 reports the frequency-domain and time-domain results, centered on the reference 48-storey Tower B with the parametric extension to Towers A and C summarized in cross-tower Tables. Section 5 discusses the analytical origin of the formulation ranking, the period elongation bound, and the computational acceleration, together with the scope limitations and the closed-form extension directions. Section 6 draws conclusions.

2. Reference Structures and Ground Motion Set

2.1. Three-Tower Parametric Family

The parametric family adopted for the verification analyses of Section 3 and Section 4 consists of three RC towers located in Istanbul and founded on the ZB reference site class. The towers share a common lateral resistance system and span a fundamental period range chosen to cross the velocity-to-displacement transition of the TBDY 2018 [4] design spectrum at  T L = 6   s .  Tower A is a 30-storey building with first translational period  T 1 = 3.8   s  and total height H = 87.0 m. Tower B is a 48-storey building with  T 1 = 6.824   s  and H = 139.7 m, retained as the reference for the detailed exposition of Section 3 and Section 4. Tower C is a 60-storey building with  T 1 = 8.45   s  and H = 174.6 m. The trio spans a fundamental period factor of 2.22 and a modal mass factor of 2.15. Tower A operates on the velocity-sensitive branch of the design spectrum at the fundamental period, while Towers B and C operate on the displacement-controlled plateau above TL. The structural parameters are listed in Table 1.
The three heights span the contemporary Istanbul high-rise inventory along the Levent–Maslak and Ataşehir corridors, where RC shear-wall-core construction has dominated the residential and mixed-use segments above thirty storeys since the early 2000s. Tower A represents the upper end of the residential typology, Tower B the median of the mixed-use office segment, and Tower C the upper envelope of contemporary practice below the 200 m super-tall threshold of the Council on Tall Buildings and Urban Habitat classification. The aspect ratio H/B sweeps from 3.75 through 4.46 to 5.14, covering the range over which the bending-cantilever response governs the seismic demand without entering the slender-tower regime H/B > 7. The core dimensions, slab system, structural steel grade, and concrete class are held constant so that the parametric study isolates the effect of global tower geometry on the calibration outcome.
The lateral resistance system shared by the three towers consists of a centrally located C45 concrete core with B420C reinforcement, combined with peripheral composite columns embedding S355 H-section steel profiles over the lower portion of the elevation. Above the transition storey, the columns become pure RC to reflect the reduced axial-load demand at the upper levels. For Tower B, the transition occurs at storey 28 of 48. The plan is symmetric about both principal axes, with a square footprint B × B, as listed in Table 1. The finite-element model of each tower is assembled in ETABS [72]. Shear walls are represented by four-node thin shell elements with combined membrane and bending action, beams and columns by frame elements with storey-dependent cross-section assignments, and the composite columns by a transformed-section equivalent elastic stiffness combining the concrete and the embedded steel section. Floor slabs are assigned as rigid in-plane diaphragms, and the foundation nodes are restrained in the six degrees of freedom for the fixed-base baseline analysis.
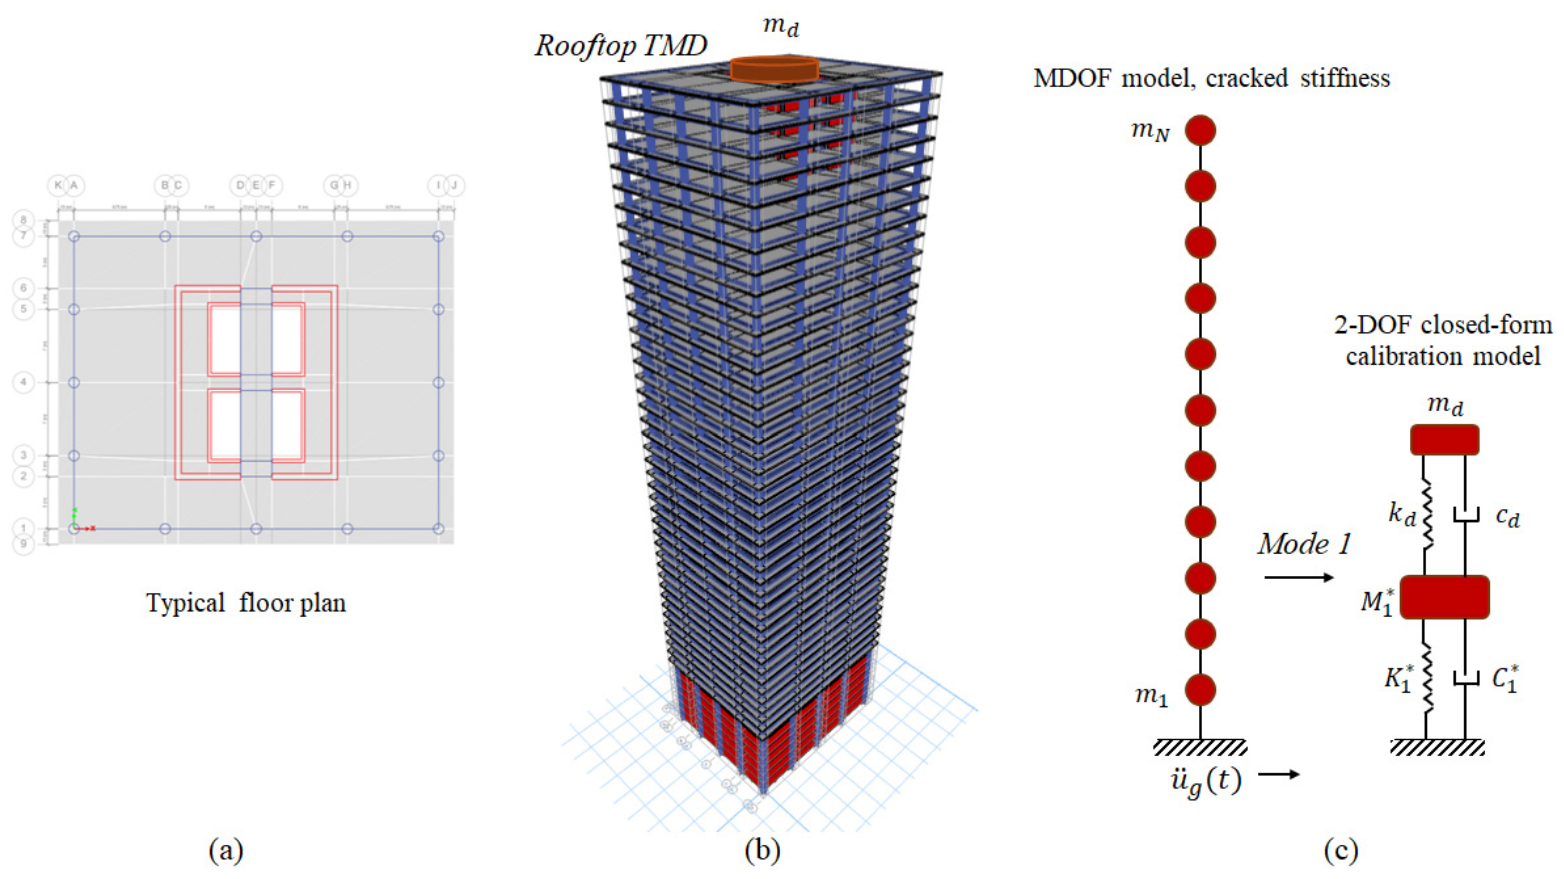
The symmetric plan is a working assumption rather than an incidental property. The single rooftop device controls one translational mode, so the procedure applies to plan-regular, torsionally stiff towers whose first translational modes carry the drift demand. A strong plan irregularity couples translation to torsion, breaks the single mode reduction of Figure 1, and calls for the multi-mode generalization. The cracked-section stiffness ratios  E I e f f / E I g  of Table 1 follow the ASCE 41-17 [73] defaults of 0.50 for shear walls under moderate axial load, 0.70 for columns, and 0.35 for beams, within the eccentricity-dependent ranges of TBDY 2018 [4] Madde 4.5.8 at the applicable axial-load level. Figure 1 shows the typical floor plan, the schematic elevation, and the calculation scheme of the reference tower.
A modal analysis retaining the first 30 vibration modes is performed for each tower with response combinations through the complete quadratic combination (CQC) rule. The first six modes of each tower are listed in Table 2. Across the trio, the fundamental mode is a translation in the global X direction with mass participation 0.583, 0.601, and 0.617 at Towers A, B, and C, while the fourth mode is the second X translational mode with participation 0.162, 0.157, and 0.149. The second X translational period lies on the velocity-sensitive branch of the design spectrum at every tower and contributes a substantial fraction of the roof absolute acceleration.
An independent check on the Tower B modal base shear under the TBDY 2018 [4] DD-2 spectrum is obtained from the standard modal product of effective mass, spectral ordinate, and gravitational acceleration. The effective modal masses and DD-2 ordinates give 4025 kN at Mode 1 on the long-period plateau and 5405 kN at Mode 4 on the velocity-sensitive branch at  T 4 = 1.516   s .
A two-anchor Rayleigh damping system balances the damping budget across the dominant translational modes. The X-direction Newmark-β integrations of Section 4.1, Section 4.2, Section 4.3, Section 4.4 and Section 4.5 use Mode 1 and Mode 4 as the anchor pair, jointly bracketing 75.8% of the X-direction effective modal mass at the 5% target damping ratio. The Y-direction integrations use Mode 1 and Mode 3 as the anchor pair so that the dominant Y translational mode is damped at the 5% target rather than at the 3.87% effective value that the Mode 1 plus Mode 4 anchor would impose at Mode 3.

2.2. Design Spectrum

TBDY 2018 [4] is the current national seismic code, aligned with the EN 1998 [74] hazard framework and the ASCE/SEI 7-16 [75] response spectrum methodology and mandatory for buildings in active fault zones in Türkiye. Its design spectrum at the Istanbul ZB reference site is parameterized by the short-period plateau ordinate  S D S , the one-second ordinate  S D 1  and the long-period transition period  T L . At the DD-2 hazard level (10% probability of exceedance in 50 years), the ordinates are  S D S = 0.95  g and  S D 1 = 0.204  g. At the DD-1 hazard level (2% in 50 years), the ordinates are  S D S = 1.40  g and  S D 1 = 0.306  g. The long-period transition is  T L = 6  s.
Two long-period branches govern design ordinates. For T below the corner period  T L , the spectrum follows the velocity-sensitive branch on which the elastic ordinate decays inversely with period. For T above  T L , the displacement-sensitive branch applies and the ordinate decays with the square of the period.
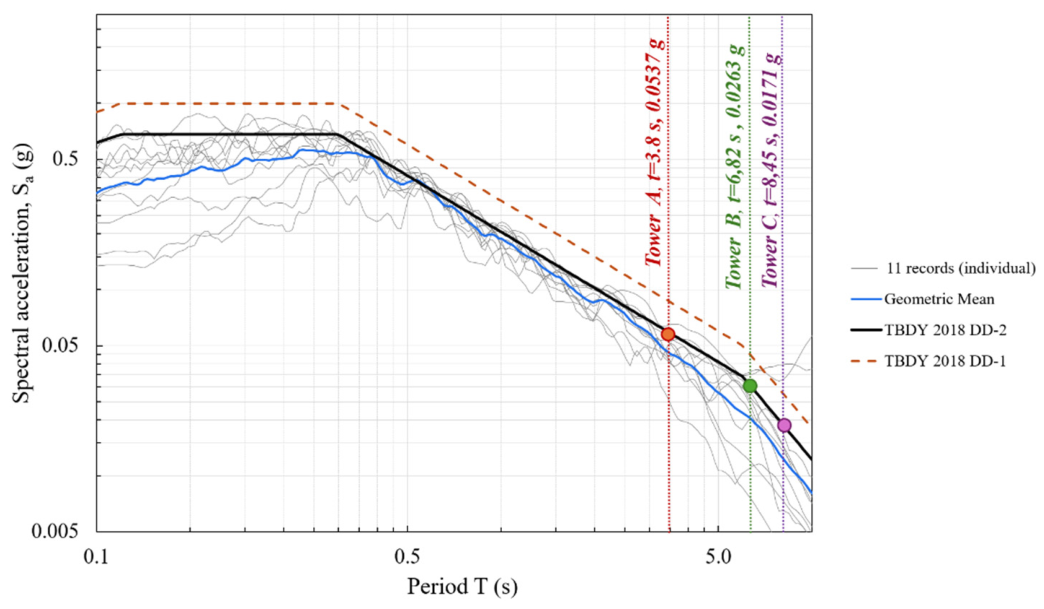
At the first-mode period of each tower, the DD-2 ordinates are  S a ( T 1 ) = 0.0537 g at Tower A on the velocity branch, 0.0263 g at Tower B and 0.0171 g at Tower C on the long-period plateau. The full parameter set and the per-tower ordinates at the first and fourth modes are listed in Table 3. Figure 2 shows the DD-2 and DD-1 spectra at the ZB site together with the scaled eleven-record set.

2.3. Ground Motion Selection and Scaling

Eleven ground motion records are assembled from the PEER NGA-West2 [76] archive, following the spectral-matching protocol of TBDY 2018 [4] and the selection strategy of Iervolino and Manfredi [53]. The selection criteria are moment magnitudes  M w  between 6.7 and 7.6, station conditions spanning shear wave velocities of 213 to 1000 m/s with each record spectrally matched to the ZB target so that the scaling normalizes the station signature, and source-to-site distances representative of the near-to-intermediate field of the right lateral NAF. The set is dominated by strike-slip events consistent with the fault kinematics, with the Kocaeli 1999 event contributing two stations, Yarımca in the near field, and Arçelik at intermediate distance. Two thrust records (Northridge 1994, Cape Mendocino 1992) and the Chi-Chi 1999 with its extremely long-period pulse, one oblique record (Loma Prieta 1989), and one normal faulting record (Irpinia 1980) broaden the mechanism and frequency content. Source-to-site distances span 0.6 to 17.2 km.
Records are scaled independently for each tower over the matching band 0.2 T 1  to 2 T 1  per TBDY 2018 [4] Madde 13.4.5.4, yielding three tower-specific sets of eleven records, with the horizontal component pairs retained for the bidirectional verification. Each record receives a record-specific factor that matches its logarithmic mean spectrum to the DD-2 target over the band, and set level factors of 1.38, 1.56, and 1.65 at Towers A, B, and C raise the eleven-record mean onto the target, so that the mean scaled spectrum equals or exceeds the target throughout the band, as required by TBDY 2018 [4].
The eleven-record per-tower scaled response histories supply the numerical anchors that propagate through the frequency- and time-domain assessments. Each record’s peak response is expressed through its standardized demand anomaly  k d , i , the centered and scaled per-record value with sample mean zero and unit sample standard deviation across the eleven records. The per-record uncontrolled peak roof displacement then decomposes as:
u u n c , X , i = u ¯ u n c , X + σ u n c , X · k d , i
with the tower-specific mean and standard deviation pairs (281, 116) mm at Tower A, (523, 146) mm at Tower B, and (601, 118) mm at Tower C, taken directly from the per-record values of Table 4. Equation (1) is the algebraic decomposition of the directly computed response into the eleven-record mean and the record-specific deviation, not a surrogate for the response-history analysis. The per-record factors are listed in Table 5.
The scaling factor  S f  in Table 5 is the multiplicative coefficient applied to each unscaled record so that its logarithmic mean spectrum matches the DD-2 target over 0.2 T 1 , X  to 2 T 1 , X . Since each tower is matched around its own first-mode period, the factor of a given record differs from tower to tower. The Manjil 1990 and Chi-Chi 1999 records strengthen the long-period content of the set, and the Cape Mendocino 1992 and Irpinia 1980 records supply the thrust and normal mechanism roles.
Newmark-β direct time integration is used with β = 0.25 and γ = 0.5, the unconditionally stable average-acceleration scheme, at the native sampling interval of each record, 0.0024 s to 0.02 s, so that the time step to period ratios remain below 0.013 at the Tower B first and fourth modes, within the accuracy limits of the scheme. The kinematic decomposition of Equation (1) projects onto three physically coupled anomaly vectors: the drift anomaly  k d , the acceleration anomaly  k a , and the TMD-energy-share anomaly  k e , each centred to zero mean and a near-unit sample standard deviation over the eleven records, with pairwise correlations ρ( k d k a ) ≈ 0.40 and ρ( k d k e ) ≈ 0.0, so the acceleration demand tracks the drift demand only in part and the energy share is governed by the duration of the record rather than by its amplitude. The three anomaly vectors propagate the eleven-record content consistently through the time-history reductions.
The record set enters the vibration control results through two channels: the eleven-record mean of each response quantity and the record-to-record dispersion about that mean. Spectral matching to the tower-specific DD-2 target constrains the first channel, since an alternative record set matched to the same target over the same period band reproduces the mean demand within the acceptance tolerances of TBDY 2018 [4]. The second channel is retained explicitly through the standardized demand anomaly of Equation (1), which reports the per-record deviation instead of averaging it away. The dependence of the formulation ranking depends on the input examined separately through the closed-form dominance condition and the joint parameter envelope.

3. TMD Design Framework

3.1. Analytical Hierarchy and Scope

The analyses of Section 3 and Section 4 rest on a single modeling approach stated up front so that each result is read against the kinematic regime in which it is valid. The modeling approach used throughout the present paper is a linear-elastic modal-condensed two-modal-coordinate host model, augmented by the TMD coordinate after device attachment, retaining Mode 1 and Mode 4 of each ETABS [72] model with the Rayleigh damping assignment of Section 2.1. It supplies the frequency response magnitudes, the eleven-record Newmark-β response histories, the RTI frontier and the per-tower calibration. The shared kinematic decomposition of Equation (1) underlies this model. The retained pair comprises the two X translational modes that govern the roof drift on which the calibration operates, and the remaining quarter of the X direction modal mass spreads over modes with periods below 0.8 s. Their omission biases the absolute floor accelerations low, which the acceleration assessment considers, while the drift quantities converge with the two retained modes, and a residual vector correction is required before the acceleration results are used for design.
The linear-elastic tier and the pushover-derived secant period serve two distinct roles within one equivalent linearization scheme, and the pairing is deliberate. The closed-form calibration theory of the Den Hartog, Warburton and Sadek trio is defined as a linear system, so the tier on which the devices are calibrated, ranked and verified must remain linear for the closed-form structure to hold. The inelastic behavior of the host enters the calibration through its leading order effect on the device, the elongation of the first-mode period, which the modal pushover [63] supplies as the secant period of the design damage state in the standard equivalent linearization sense. The damaged configuration is therefore represented as a linear system with the secant first-mode period, the PEA anchor is set between the elastic and secant configurations, and the frequency response function (FRF) envelope evaluates the device at the resulting off-tune offsets. The response history analyses run on the elastic configuration, where the closed-form reductions are defined, while the damage state is examined through the off-tune envelope rather than through inelastic response histories.
Two effects of hysteretic action remain outside the scheme: the added equivalent damping of the damaged host and the amplitude dependence of the secant elongation within a single record, and both act to reduce the actual resonant response and tuning error, so the reported off-tune losses sit on the conservative side. The nonlinear literature supports both sides of this scheme. On the response side, the device retains its effectiveness past yield when the effectiveness is measured on the hysteretic energy demand [65,66], which is the quantity that governs damage in the yielding storeys. On the calibration side, the optimum of a linear device attached to a hysteretic host displaces from its linear position toward the softened configuration [67], the direction the PEA anchor takes in closed form, and a recent retrofit application carried comparable reductions through incremental dynamic analyses on the full nonlinear model [68]. The fiber section inelastic verification that removes the equivalent linearization is identified as an extension direction.

3.2. Closed-Form Optimization Formulations

The closed-form framework rests on three formulations whose optima under harmonic and white noise base excitations are known analytically. The Den Hartog formulation [1] minimizes the peak amplification of an undamped primary system through the fixed-point theorem:
f o p t , D H = 1 1 + μ
ζ d , o p t , D H = 3 μ 8 ( 1 + μ ) 3
The Warburton formulation [2] minimizes the displacement variance under white noise base acceleration:
f o p t , W a r b = 1 0.5 μ 1 + μ
ζ d , o p t , W a r b = μ 4 μ 8 1 + μ 2 μ
The Sadek formulation [3] embeds the structural damping ratio  ζ s  in the optimization and minimizes the displacement variance of a damped primary system:
f o p t , S a d e k = 1 1 + μ 1 ζ s μ 1 + μ
ζ d , o p t , S a d e k = ζ s 1 + μ + μ 1 + μ
At the design mass ratio  μ = 0.02  with structural damping  ζ s = 0.05 , the three formulations produce optimum frequency ratios of 0.9804, 0.9755, and 0.9735. The Den Hartog formulation gives the smallest damper damping ratio at  ζ d = 0.0841 . The Warburton formulation reduces this further to  ζ d = 0.0702  with a marginally narrower bandwidth. The Sadek formulation gives  ζ d = 0.1890 , more than twice the Den Hartog value, trading a small loss in nominal peak suppression for a substantially wider effective bandwidth. The bandwidth-loss term  L ± 10  quantifies the trade-off. The Sadek loss is 4.3% against 11.3% for Den Hartog and 12.2% for Warburton at the design reference ±10% mistuning band.

3.3. Sherman–Morrison–Woodbury Accelerated Grid Validation

A parametric grid search over the ( μ , f d / f s , ζ d ) space identifies the numerical optimum per tower, spanning 60 × 60 × 60 = 216,000 logarithmically spaced points. The rooftop TMD is a rank-one perturbation of the dynamic stiffness matrix at every grid point and frequency, so the Sherman–Morrison–Woodbury (SMW) identity [71] updates the frequency response inverse without re-factorizing the bare-structure inverse:
Z + u v T 1 = Z 1 Z 1 u v T Z 1 1 + v T Z 1 u
where Z is the bare-structure dynamic stiffness,  u = e n  is the unit vector at the roof degree of freedom, and  v = α d ω e n  is the frequency-dependent equivalent impedance of the TMD. The TMD is attached to the roof through a spring  k d ,  a dashpot  c d  and a damper mass  m d , and static condensation of the damper coordinate yields the closed-form impedance:
α d ω = k d + i ω c d k d + i ω c d 2 k d + i ω c d m d ω 2
Equation (9) carries the full inertial, elastic and dissipative content of the device and approaches the locked mass spring dashpot form  k d + i ω c d  as the damper mass grows without bound, while it vanishes when the damper mass is removed, since a massless attachment transmits no steady force. The rank-one structure of Equation (8) is therefore preserved with the inertial term embedded in  α d ω . The cost drops from  O ( n 3 )  per grid point for direct lower–upper (LU) factorization to  O ( n ω ) ,  yielding an 8.10-fold speedup with the SMW reconstruction residual bounded by 2.1 × 10⁻¹² against the direct solution at three control points per tower. The grid search completes in 11.1 min against 90.0 min for the direct baseline. Table 6 summarizes the benchmark. The rank-one character is a structural property of any single-rooftop device, so the update transfers without modification to the soil–structure interaction and tuned mass damper inerter (TMDI) configurations.

3.4. Per-Tower TMD Calibration

The mass ratio  μ  is held at 0.02 across the three towers and enters the framework as a design constraint rather than an optimization variable. The closed-form trio treats μ as the independent parameter from which the frequency ratio and the damper damping ratio follow, and the response reduction grows monotonically with μ over the practical range, so a joint optimization over the three parameters would return the largest admissible mass rather than an interior optimum. The admissible value is set by the roof-level capacity of the tower. The damper masses that follow from μ = 0.02 are 184 t at Tower A, 312 t at Tower B, and 396 t at Tower C, which are of the same order as the 660 t pendulum of the Taipei 101 [55] and the 1000 t device of the Shanghai Tower [56], so the adopted ratio represents the practical roof-level capacity of this tower class rather than a universal engineering constant. The consequences of departing from this value are quantified through the perturbation envelope, which sweeps μ over {0.01, 0.02, 0.03, 0.05}, and the formulation ranking remains invariant over the whole axis, and through the stroke verification, which confirms that the resulting devices remain within commercially available pendulum and roller bearing supports.
The TMD parameters are scaled per tower from the modal properties of Table 1 and Table 2, with the frequency-ratio and damping-ratio Equations (2)–(7) evaluated for each tower–formulation pair. The damper mass  m d = μ M 1 * . The Den Hartog damper damping coefficient  c d  is comparable across the trio at 47.4 to 50.2 kN·s/m, since  f d  decreases in proportion to  T 1  while  m d  increases proportionally. The Sadek formulation requires about 2.23 times the Den Hartog coefficient at every tower, which was the direct consequence of the ratio  ζ d , S a d e k / ζ d , D H 2.25  imposed by Equations (3) and (7) at the design mass ratio. The complete calibration matrix is reported in Table 7.

3.5. Robust Tuning Index

The trade-off between nominal peak suppression and detuning robustness has been treated through the minimax and robust min–max frameworks [37,38,39,40] reviewed in Section 1. The RTI introduced here complements these frameworks with a scalar that orders the canonical trio directly, and the induced ordering is tested for invariance over the joint parameter envelope.
The remaining sources are the as-built modal period uncertainty, taken as 10% to 15% in assessment practice on the basis of the effective stiffness ranges of ASCE 41-17 [73] and reduced to about 8% once the calibration follows a system identification of the completed tower, and there was 3% to 5% manufacturing tolerance on the spring and dashpot. Treated as independent and combined in root-sum-square form at the upper tolerance, the two sources give about 9.4%, which the ±10% band covers with a margin.
The multiplicative form of Equation (10) follows from the four requirements that an engineering robustness index should satisfy on the plane of mean drift reduction and bandwidth loss. The first is strict monotonicity in each argument. The second is degenerate-extreme collapse, with the index vanishing when the mean reduction vanishes and when the bandwidth loss saturates at 100%. The third is dimensional consistency as a dimensionless percentage scalar. The fourth is consistency with product from multi-criteria aggregation [77]. The additive alternative that subtracts a weighted bandwidth loss from the drift reduction satisfies the first and third requirements but violates degenerate-extreme collapse, with its zero-crossing falling at a weight dependent point rather than at the degenerate extremes, so its sign carries no admissibility content. The Salvi–Rizzi minimax measure of Equation (11) belongs to the same multiplicative family, replacing the band mean loss with the worst-case loss. These requirements restrict the admissible family without singling out one member, since any monotone transform of the product satisfies them as well. Equation (10) is adopted as the simplest member of the family, and the ordering it induces is checked against the minimax member below, so the design conclusion rests on the family rather than on one scalarization. The index is positive whenever the band mean loss stays below 100%, the device reduces the mean response, and a non-positive value marks the calibration as inadmissible at that bandwidth rather than measuring a degree of performance.
The RTI combines the mean roof drift reduction  R ¯  from the eleven-record set with the mean relative growth  L ± 10  of the FRF peak over a ±10% mistuning band around the closed-form optimum:
RTI = R ¯ 1 L ± 10 100
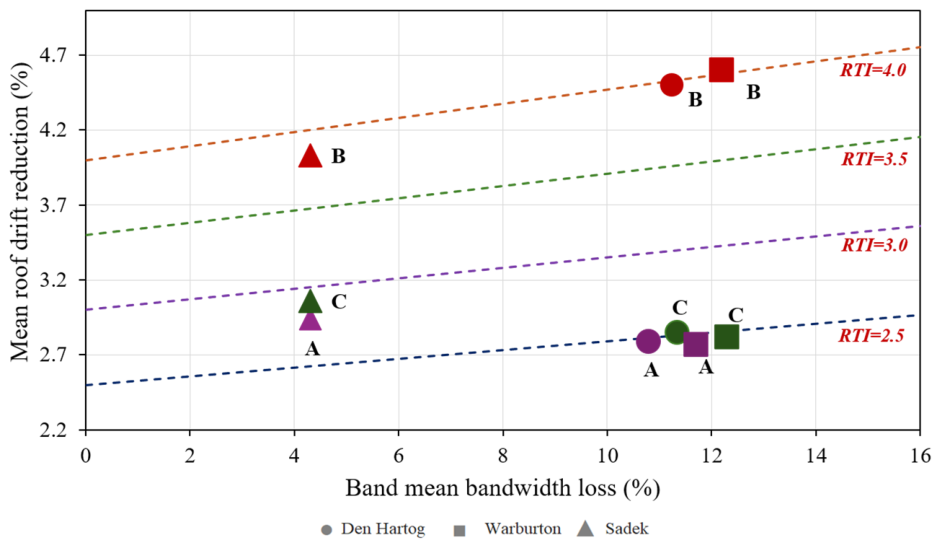
with a per-building scalar, since  R ¯  and  L ± 10  are evaluated against the host tower’s modal properties and its tower-specific record set. Any calibration rule that yields a mean reduction and a bandwidth loss on the same band, including multiple device layouts and inerter-augmented variants, enters the same ordering, so the index is not tied to the closed-form trio examined here. The values are RTI = 3.99 for Den Hartog, 4.04 for Warburton, and 3.86 for Sadek at the ±10% reference band, so the reference tower at its nominal parameters sits below the Sadek crossover, which Lemma 2 places at the ±13.2% band. The ranking is band conditional rather than universal. Figure 3 maps the three calibrations on this plane at the three towers, with the iso-RTI contours displaying the trade-off behind the ordering.
The physical content of the Sadek advantage and the contribution of the index structure deserve explicit separation. The criterion-independent fact is the calibration itself. The Sadek optimum embeds the structural damping ratio and returns a damper damping ratio more than twice the Den Hartog value, 0.189 against 0.084 at the reference tower, which flattens the FRF envelope across the band and lowers the nominal notch depth. At exact tuning, the Den Hartog and Warburton notches lie within 2% of each other and the eleven-record mean reductions are statistically inseparable across the trio. The criterion-dependent step is aggregation. A multiplicative index that retains a bandwidth factor rewards a wide effective tuning range by construction, so the Sadek lead at Towers A and C in Table 8 states that robustness carries measurable weight in the ranking, not that the Sadek notch is the deepest. Two features bound the influence of the adopted criterion. The ±10% band is fixed by the physical allowances of the preceding paragraph rather than adjusted to favor a formulation, and the minimax comparison below shows a worst-case criterion containing no band mean ranks for the robust calibration first at every tower.
To verify that the ordering is not an artifact of the band mean loss, the RTI is compared against the Salvi–Rizzi minimax robustness measure  M S R  [40], which replaces the band mean loss with the worst-case loss within the band. The worst-case losses at the ±10% band edges are 36% to 38% for the Den Hartog and Warburton calibrations against 15% for the Sadek calibration, whose flat FRF envelope holds the edge loss below one half of its competitors, so that:
M S R = R ¯ · 1 L m a x 100
Table 8 reports the side-by-side comparison. The minimax measure ranks the Sadek formulation first at all three towers, including the reference tower where the RTI at the ±10% band still leaves the Sadek index behind the Den Hartog and Warburton values, so the worst-case criterion strengthens the robustness content of the ranking rather than reversing it. The ratio RTI/ M S R  is 1.40 for the Den Hartog and Warburton calibrations against 1.13 for the Sadek calibration, with the smaller Sadek ratio showing that its index degrades least when the band mean loss is replaced by the worst-case loss. The cross-tower values are listed in Table 8.
The empirical RTI ordering admits the following analytical characterization.
Lemma 1 (Sadek-top condition).
Let  R ¯ DH  and   R ¯ S  denote the mean drift reductions and   L DH  and   L S  the bandwidth-loss factors of the Den Hartog and Sadek formulations at a common mass ratio and bandwidth. Define   Δ R = R ¯ DH R ¯ S  and  Δ L = L DH L S , with both positive on the canonical closed-form trio. The Sadek formulation dominates the Den Hartog formulation in the RTI ordering if and only if:
Δ L Δ R > 100 L DH R ¯ S
Proof. 
The dominance condition  RTI S > RTI DH  reads:
R ¯ S R ¯ S L S / 100 > R ¯ DH R ¯ DH L DH / 100
which is equivalent to:
R ¯ DH L DH R ¯ S L S > 100 Δ R
Substituting  R ¯ DH = R ¯ S + Δ R  and  L DH = L S + Δ L  gives:
R ¯ S Δ L + Δ R L DH > 100 Δ R
and hence  R ¯ S Δ L > Δ R 100 L DH . □
When  L DH < 100  the right-hand side is positive and division by  R ¯ S  yields the stated condition. When  L DH 100 , the Den Hartog index is non-positive, and the Sadek formulation dominates trivially.
Lemma 1 explains the bandwidth-sensitivity entries of Table 9 quantitatively. At Tower B, the ratio  Δ L / Δ R  rises from 3.0 at  ± 5 %  bandwidth to 14.9 at  ± 10 % , 24.0 at  ± 15 %  and 30.2 at  ± 20 %  The thresholds of Equation (12) at the same bands are 24.1, 22.0, 20.0, and 18.4. The rank crossover lies between  ± 10 %  and  ± 15 %  bands, at ±13.2%, and the  ± 10 %  design reference sits just below the crossover at the reference tower, while the PEA damage state offsets reach into the Sadek-led range. The boundary case where  Δ L / Δ R  equals the threshold marks the regime where the multiplicative scalarization of Equation (10) provides no resolution. The engineering decision should then fall back to the Salvi–Rizzi minimax measure of Equation (11) or to direct inspection of the FRF envelope.
Lemma 2.
Assume   R ¯ DH  >  R ¯ S ,  L DH ε band  >  L S ε band    for all  ε band  > 0, and that the weighted loss difference  R ¯ DH · L DH ε band    R ¯ S L S ε band  is strictly increasing in  ε band  over (0,  ε band ), as the computed losses of Table 9 satisfy over the ±5% to ±20% range. If  RTI DH ε max  <  RTI S ε max , then the difference  RTI DH ε band    RTI S ε band  is continuous and strictly decreasing on (0,  ε max ), with a unique crossover at  ε band *  where the two indices coincide, and the Sadek formulation leads for  ε band > ε band * .
Proof. 
The difference equals  Δ R  − [ R ¯ DH · L DH ε band  −  R ¯ S L S ε band ]/100, so it is continuous, and its strict decrease is equivalent to the assumed strict increase in the weighted loss difference. At zero bandwidth,  L DH 0  =  L S 0  = 0 gives a positive initial value  R ¯ DH R ¯ S , the assumed negativity at  ε max  provides the sign change, and the intermediate value theorem together with strict monotonicity yields exactly one crossover. This unique crossover property is the analytical reason why the bandwidth sensitivity sweep of Table 9 contains a single band interval in which the rank inverts. □
At a fixed formulation, the RTI is a smooth function of the mass ratio, the mistuning bandwidth, the structural damping, and the first-mode period. The mean drift reduction depends linearly on the kinematic decomposition of Equation (1) and, to first order about the optimum, quadratically on the tuning frequency ratio, while the bandwidth loss is a smooth function of the mass ratio, the mistuning bandwidth, and the damper damping. The partial derivatives of the index then follow in closed-form and support design-time interpolation across the parameter space without re-running the eleven-record analysis.

3.6. Robustness of the Formulation Ranking to Joint Parameter Perturbation

The relation between Lemma 1 and the parameter envelope is direct. The bandwidth loss factors are closed-form properties of the calibrations, with the Sadek value being roughly one-third of its competitor’s at every band, so the Sadek top condition of Lemma 1 is met once the band widens past the crossover of Lemma 2. The envelope below locates that crossover inside the ±10% to ±15% interval at the nominal cell of the reference tower and shows that most other cells of the parameter space satisfy the condition already at ±5%, which quantifies how far the ranking extends beyond the design point.
The rank invariance of the formulation ordering is tested over a 144-point joint-perturbation envelope built from four mass ratios, four mistuning bands, and three structural damping levels at the three towers:
μ { 0.01 , 0.02 , 0.03 , 0.05 } , ε { ± 5 % , ± 10 % , ± 15 % , ± 20 % } , ζ s { 0.03 , 0.05 , 0.07 }
The site class is not a separate axis of the envelope, since it enters the index only through an amplitude rescaling of the target spectrum, and a linear reduction ratio is invariant to a uniform scaling of the input, so the envelope spans the parameters on which the ratio depends. For each scenario, the RTI is computed independently for the three towers and the three formulations, yielding 432 RTI evaluations in total.
Of the 144 scenarios, the Sadek formulation ranks first in 122 (84.7%), the Warburton formulation in 20 (13.9%), and the Den Hartog formulation in two (1.4%). The exceptions concentrate at the tight bands: eight of 36 cells at ±5% and six of 36 at ±10%, thinning to five and three cells at ±15% and ±20%, and they lie in the cells where the mean reductions of the three calibrations are statistically inseparable. The worst-case measure of Equation (11) ranks the Sadek formulation first at all three towers at the design point.

3.7. Period-Elongation-Aware Calibration

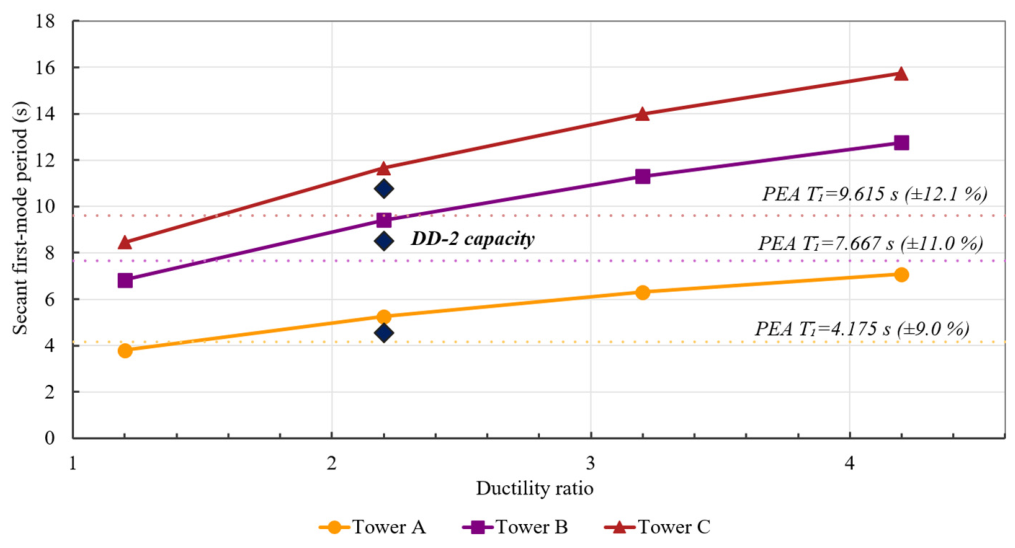
The closed-form formulations of Section 3.2 assume the calibration period coincides with the period during the event. Cracking of the C45 core during a moderate event, plastic hinge formation at the design-level event, and long-term creep all push  T 1  upward. A modal pushover with the first-mode load pattern scaled to the design-level roof drift gives secant first-mode periods of 4.55 s at Tower A, 8.51 s at Tower B, and 10.78 s at Tower C, elongations of +19.7%, +24.7%, and +27.6%. A device tuned at the elastic  T 1  alone would reach an off-tune approaching +27.6% at DD-2 for Tower C, far beyond the ±10% envelope of every closed-form solution.
The PEA calibration anchors the device at the arithmetic mean of the elastic and DD-2 first-mode periods:
T ¯ 1 = T 1 , elastic + T 1 , DD - 2 2
so that the worst-case off-tune at the extremes of the damage band is bounded to ±9.0%, ±11.0%, and ±12.1% at Towers A, B, and C, against the asymmetric +19.7% to +27.6% of elastic-only anchoring. The off-tune offset is measured as the frequency-ratio deviation of the device, tuned at the anchor period, from the structural period at each extreme of the damage band. With the device anchored at the arithmetic mean, the two extremes are equidistant in frequency-ratio terms, so the symmetric bound reduces to the closed-form expression:
Δ o f f = T 1 , D D 2 T 1 , e l a s t i c T 1 , D D 2 + T 1 , e l a s t i c
Equation (14) evaluates to these bounds per tower. The Tower A offset lies inside the ±10% reference band, while the Tower B and C offsets exceed it by 1.0 and 2.1 percentage points. The off-tune offset is a period quantity and the bandwidth loss is a response quantity, so the two are linked through the FRF envelope rather than compared directly. For the Sadek calibration, the point losses at the anchor offsets, evaluated directly on the frequency response, are 13.6% at Tower A, 16.8% at Tower B, and 18.6% at Tower C, against 33.5%, 39.4%, and 42.3% for the Den Hartog calibration, so the anchored robust device carries between 2.3 and 2.5 times less off-tune penalty at the damage band extremes.
The ±10% band remains the reference for the RTI ranking, while the offset-specific loss governs the PEA verification. Retuning the Sadek device to the anchor leaves the elastic state performance essentially unchanged, with the eleven-record mean reduction moving from 2.94%, 4.03%, and 3.06% at the elastic tuning to 2.96%, 3.91%, and 2.78% at Towers A, B and C, so the bounded damage state exposure costs at most 0.3 percentage points in the intact state. The minimax optimality of the arithmetic mean weight w = 0.5 is established next.
Lemma 3.
Let   T ¯ w = 1 w T el + w T DD - 2  denote the convex combination anchor with   w 0 , 1  and   δ = T DD - 2 T el > 0 . Let   f : [ 0 , ) [ 0 , )  be any cost function that is non-negative, continuous, strictly increasing away from zero and satisfies   f 0 = 0 . Then, the anchor that minimizes the worst-case off-tune cost
C w = m a x { f T ¯ T el , f T ¯ T DD - 2 }
is the arithmetic-mean choice  w * = 0.5 , independent of the specific form of  f .
Proof. 
The two off-tune distances are:
T ¯ T el = w δ
and
T ¯ T DD - 2 = 1 w δ
so that the worst-case cost may be written as:
C w = m a x { f w δ , f 1 w δ }
The worst-case cost is the maximum of two functions of  w . For  w 0,0.5 , the second term dominates, since  1 w w  and  f  are monotone and non-decreasing. For  w 0.5 , 1 , the first term dominates.
Hence,  C w  is strictly decreasing on  0,0.5  and strictly increasing on  0.5,1 , with the unique minimum at  w = 0.5 , where the two distances coincide and the common value  f 0.5 δ  is attained. □
Lemma 3 generalizes the absolute-time-shift minimax result to the broad class of cost functions defined by the four requirements. The class includes the linear absolute shift  f ( x ) = x ,  the quadratic shift  f ( x ) = x 2 , the percentage shift  f ( x ) = x / T ¯ , the exponential penalty  f ( x ) = e x p ( α · x ) 1  and any cost function obtained by composing these with a strictly increasing transform. The arithmetic mean anchor is therefore the minimax optimum across the entire engineering family of symmetric monotone off-tune cost functions, which renders the PEA anchor of Equation (13) robust to the specific scalarization adopted at the design stage.
Remark 1.
If the off-tune cost is defined in logarithmic or ratio-based period space, the corresponding minimax anchor becomes the log-space midpoint, that is, the geometric mean of the elastic and DD-2 secant periods. For the present towers, the arithmetic and geometric anchors differ only marginally, so the arithmetic form is retained for closed-form transparency.
Corollary 1.
Let   f +  and   f  be continuous, strictly increasing penalties with     f + x >   f x  for every   x > 0  (the elongation side toward the DD-2 boundary is more strongly penalized, with w measuring the anchor position toward the DD-2 period as in Lemma 3, the stronger penalty acting on the offset toward the DD-2 boundary, and the weaker on the offset toward the elastic boundary). The minimax anchor satisfies the equal-cost condition   f w * δ = f + 1 w * δ , and the optimum   w *  sits in the interval   0.5,1 , shifted toward the more strongly penalized elongation side, so that the offset on that side is the shorter one.
Proof. 
At the minimax optimum, the two off-tune costs are equal, which gives the following equal-cost condition:
f w * δ = f + 1 w * δ
Since  f +  exceeds  f  at every positive argument while both penalties are strictly increasing, equality of the two costs requires the argument of  f +  to be smaller than the argument of  f , that is, the offset on the strongly penalized side must be the shorter one. This yields  w *  in the interval  0.5 , 1 . □
The damage-state modal map of Table 10 records, at each ductility level, the secant first-mode period, the first-mode drift-amplification factor  φ m a x ( δ top )  of the secant configuration and the Mode 4 mass participation. The map is constructed from the first-mode bilinear capacity envelope of each tower with the secant stiffness  K s e c ( δ top )  evaluated at the current roof displacement:
T 1 δ top = 2 π M 1 * K sec δ top
Table 10 reports the secant period evolution and Mode 4 participation across ductility ratios  μ δ  =  δ top / δ y  from 1 to 4 for the three towers. Figure 4 plots the modal pushover secant first-mode period against roof displacement for the three towers, with the PEA anchor marked at each tower. The participation of Mode 4 grows from 0.157 at  μ δ = 1  to 0.257 at  μ δ = 4  at the reference Tower B, with similar trends at Towers A and C. The PEA anchor of Equation (13) is set over the elastic to DD-2 interval of this map, where the secant period reaches its design-event value, so that the bounded off-tune of ±9.0% to ±12.1% holds across that interval. Beyond DD-2, toward the higher ductility states of Table 10, the offset grows past the anchor bound and the loss climbs along the flat Sadek envelope of Table 9, so the device degrades gradually rather than abruptly. The variable mode analysis that reads the full map at every intensity step is identified among the extensions.
The equivalent linearization bounds the intra-event detuning as well as the end-state offsets. At the DD-2 intensity, the instantaneous secant period migrates monotonically from the elastic value toward the damage state value of Table 10, so the period trajectory remains inside the interval whose extremes define the anchor bound, and the instantaneous off-tune of the anchored device never exceeds the ±9.0% to ±12.1% envelope at any point of the response history. The linear tier does not resolve the transient side of this migration, the re-engagement of the absorber as the resonance moves through the tuning band, an effect that acts on the conservative side of the bound as noted in Section 3.1, and the inelastic verification that explicitly resolves the transient is identified as the leading extension direction.
The performance-axis numerical optimum  w perf *  reported in Table 11 sits in the range 0.68 to 0.72, since the underlying cost function in that case is asymmetric. The FRF amplification of the elastic-anchored TMD is steeper on the positive period-shift side, where the structural period has elongated toward  T DD - 2 , than on the negative side. The performance optimum trims the worst-case point loss from 16.8% to 9.6% at the reference tower, and the arithmetic mean anchor is retained at this bounded premium. The Corollary 1 condition predicts a shift above 0.5 toward the more strongly penalized elongation side, consistent with the numerical optimum.

4. Frequency and Time-Domain Performance

The per-tower calibrations of Section 3.4 are assessed through frequency response and Newmark-β response histories on the eleven-record set of Section 2.3. Tower B is reported in full, and the cross-tower Tables condense the corresponding results for Towers A and C. The Sadek-leading RTI conclusion of Section 3.5 is corroborated in the time domain of Section 4.2 and refined through the higher-mode acceleration response of Section 4.3.

4.1. Frequency Response Functions

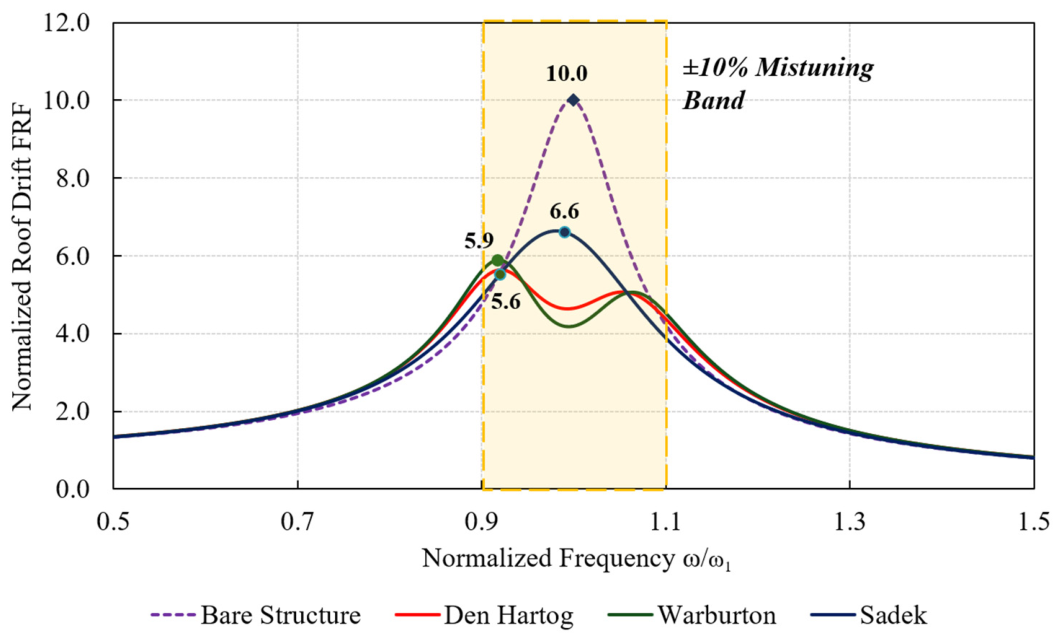
The roof drift transfer function  H u u ( ω )  is computed at each tower for the bare-structure baseline and for the three TMD formulations. The 60 × 60 × 60 grid output of Section 3.3 supplies the FRF amplitudes at the nominal closed-form optimum and at the ±5%, ±10%, and ±15% mistuning offsets. Figure 5 shows the Tower B amplification  H u u ( ω )  over the band  0.5 ω 1 ω 2 ω 1  for the bare structure and the three formulations at the nominal tuning. The bare-structure peak at  ω = ω 1  reaches a dimensionless amplification of 10.0 at the resonance, the 1/2ζ ordinate of the 5% damped host, drawn down to 6.15 by the Den Hartog calibration, to 6.25 by the Warburton calibration, and to 6.79 by the Sadek calibration. The Den Hartog and Warburton notches lie within 2% of each other. The Sadek tuning produces a shallower but markedly broader resonance valley, with the FRF envelope remaining below 7.82 across the entire ±10% bandwidth around ω1 against amplifications of 8.41 and 8.59 for the Den Hartog and Warburton tunings at the same bandwidth extremes. The bandwidth loss values  L ± 10 = 11.3 % , 12.2%, and 4.3% reported in Table 8 quantify the same property in scalar form. The peak-amplification reductions and the ±10% FRF envelope amplitudes are reported across the three towers in Table 12.

4.2. Time-History Drift Reductions

The eleven-record Newmark-β analyses give the peak roof drift reductions:
R d , i = u u n c , i u T M D , i u u n c , i
The values from Equation (16) are listed in Table 13 for Tower B. The mean reductions are 4.50%, 4.60%, and 4.03% for the Den Hartog, Warburton, and Sadek calibrations, with per-record sample standard deviations of 4.70, 5.05, and 2.98 percentage points. The reductions are modest and widely scattered, consistent with the early parametric evidence of Kaynia et al. [13], and the scatter is structured. The narrow-band, long-duration records engage the absorber most strongly, with the Imperial Valley 1940 record reaching 11% to 18% and the Yarımca pair 8% to 9%, while the short-duration Bolu and Erzincan records remain near or below 2%. Paired record-level comparisons show that no formulation separates from the others at the nominal tuning, the eleven-record mean differences of 0.1 to 0.6 percentage points carrying 95% confidence intervals that include zero. The Sadek calibration instead separates on dispersion, its standard deviation lying 37% below the Den Hartog value, so the formulation choice at nominal tuning is statistically neutral on the mean and favors Sadek on consistency. The cross-tower means are listed in Table 14.
The frequency domain and time-domain descriptions are consistent once the role of detuning is made explicit. At the exact tuning, the three calibrations are statistically inseparable on the peak metric, the paired eleven-record differences carrying confidence intervals that include zero. Separation appears away from the nominal point. The Sadek band mean loss of 4.3% at the ±10% band stands at roughly one-third of the 11.3% and 12.2% Den Hartog and Warburton values, the crossover of Lemma 2 falls at the ±13.2% and ±14.1% bands against the two competitors, and the point losses at the PEA damage state offsets of Section 3.7 are smaller for the Sadek calibration by a factor of 2.3 to 2.5. The formulation choice is therefore neutral where the structure stays on tune and shifts to the Sadek calibration over the detuning range that the damage state occupies, which is the trade-off that the RTI of Section 3.5 scalarizes.
A detuned response history sweep closes the loop between the two domains. Repeating the eleven-record analyses with the device frequency offset by ±5%, ±10% and ±15% gives band mean losses of the mean reduction of 3.4% and 6.5% for the Den Hartog calibration and 4.2% and 7.4% for the Warburton calibration at the ±10% and ±15% bands, against 1.8% and 3.4% for the Sadek calibration, with band edge losses at ±15% of 11% to 17% for the nominal pair against 6% to 9% for the robust one. The time-domain losses are smaller than their frequency-domain counterparts, since the broadband input averages the response over the moving notch, but they preserve the same ordering and the same roughly one-half Sadek advantage, so the robustness ranking of Section 3.5 is verified by direct detuned response histories rather than inferred from the frequency response alone.

4.3. Peak Floor Acceleration Reductions

The rooftop device leaves the peak floor acceleration essentially unchanged on these towers. The eleven-record mean reductions stay below 1.5% at Tower A, are statistically indistinguishable from zero at Tower B, and remain below 1% at Tower C, as Table 15 reports. The origin of this insensitivity is the modal composition of the acceleration response. The fourth mode, which the rooftop device does not control, lies on the velocity-sensitive branch of the design spectrum and carries a modal base shear of 5405 kN at the reference tower against 4025 kN in the first mode, so the acceleration demand resides in the uncontrolled mode while the drift demand remains with the controlled first mode. The damage state strengthens this composition effect. Mode 4 participation at the reference tower rises from 0.157 in the elastic state to 0.257 at ductility 4, so the uncontrolled share of the acceleration response grows as damage accumulates and the small elastic state benefit contracts further. Where floor acceleration governs the design, the vertically distributed multiple TMD configurations reviewed in Section 1 target the second translational mode directly and constitute the appropriate extension.

4.4. Inter-Storey Drift Profiles

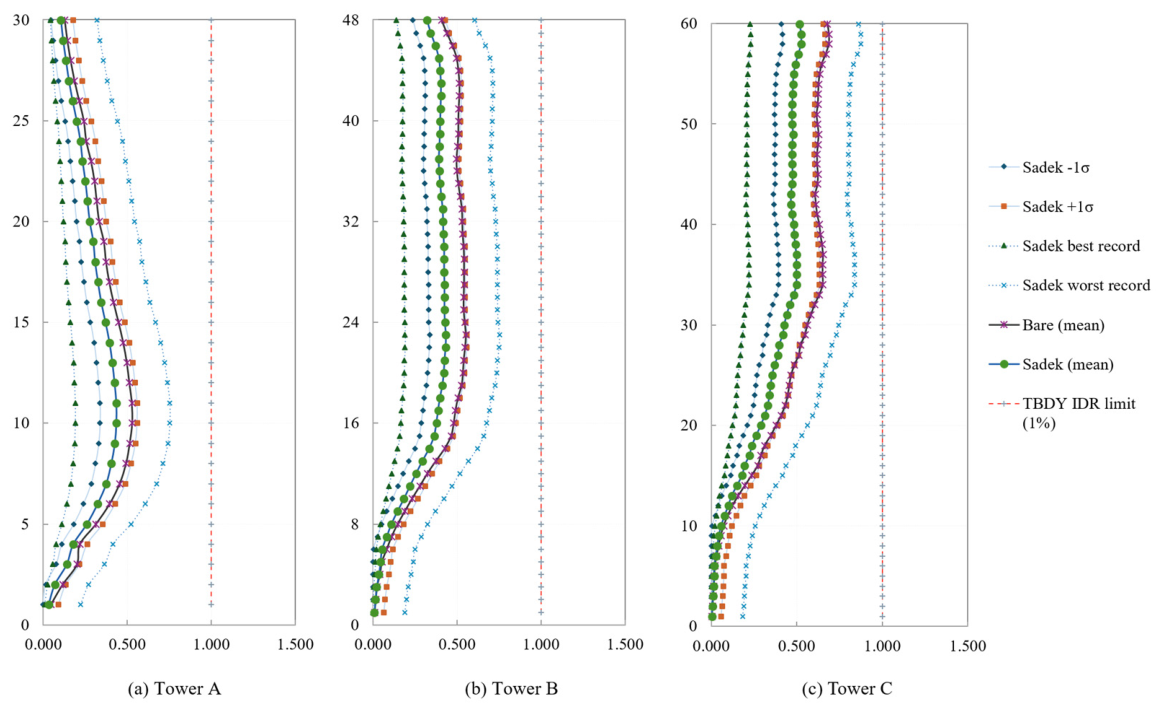
The inter-storey drift ratio is computed at every storey as the eleven-record mean, with the storey profile reconstructed from the fundamental mode coordinate through the first-mode shape of the flexure shear cantilever after Miranda [78], with the lateral stiffness ratio  α 0  identified per tower from the first-mode shapes of the ETABS models as 6, 1.5 and 2.5 at Towers A, B and C. The identified values reflect the configuration, the frame action of the peripheral composite columns governing the squat Tower A, and the flexural core governing the slender Towers B and C. Figure 6 shows the bare and Sadek-controlled profiles at DD-2 with the record-to-record spread of the controlled response. The Tower A profile peaks near storey 11 at 0.0055 in the eleven-record mean and decays toward the roof, the Tower B profile rises to a broad plateau of about 0.0055 above storey 16, and the Tower C profile reaches 0.0065 near storey 38. The mean maxima retain a clear margin below the 0.01 immediate occupancy limit of TBDY 2018 [4], while the worst records reach 0.0075, 0.0090, and about 0.0100, with Tower C approaching the extreme limit. The Sadek device trims the mean maxima by 3% to 5% without redistributing the demand vertically.

4.5. TMD Stroke Demand and Energy Dissipation

The TMD stroke demand is the peak relative displacement between the damper mass and the roof, and it governs the device design on this tower class. For the Tower B Sadek calibration, the eleven-record mean stroke is 768 mm with a sample standard deviation of 270 mm, with the Arçelik record giving the greatest demand at 1129 mm. The cross-tower Sadek values in Table 16 span 475 mm to 828 mm on the mean and reach 1588 mm at the Tower C extreme, while the Den Hartog and Warburton demands extend to 2411 mm. The Den Hartog calibration demands 40 to 50% more travel than the Sadek calibration across the trio, with a direct consequence of its damper damping ratio of 0.084 against the Sadek’s 0.189, so stroke control is a second practical argument for the robust formulation. The mean stroke lies between 1.4 and 1.7 times the uncontrolled peak roof displacement, which furnishes the screening estimate of about 1.5 times the uncontrolled peak for preliminary sizing. Demands of this magnitude sit at the upper end of long stroke pendulum practice and require dedicated travel clearance and hard stop provisions, which the feasibility discussion records among the design constraints.
The energy share dissipated by the TMD over the response history duration, defined as the ratio of the damper dissipation to the total dissipated energy, lies between 0.09 and 0.16 across the towers and differs little between the two calibrations, with 0.13 against 0.12 at the reference tower. The larger Sadek damping coefficient of 105.7 kN·s/m against 47.4 kN·s/m, a ratio of 2.23, is almost fully offset by the smaller relative velocity that the added damping imposes on the device, which is why the share moves by only one percentage point while the stroke drops by a third.

4.6. Bidirectional Response

The single rooftop X-direction device leaves the Y-component response unaffected, and the bidirectional resultant peak roof drift is obtained as the vector maximum of the two orthogonal components over the response history. At the Yarımca record pair, the resultant reductions are 4.1%, 6.9%, and 2.2% at Towers A, B, and C against uniaxial X reductions of 4.1%, 7.7%, and 3.1% for the same record, so the single-axis device retains most of its uniaxial effectiveness on the resultant whenever the X component governs the resultant peak. A twin device in the orthogonal direction remains the configuration for towers whose two translational periods attract comparable demand.

5. Discussion

The band-conditional ranking observed in the parametric study follows from the analytical structure of the Robust Tuning Index rather than from a numerical accident. The multiplicative form penalizes bandwidth loss in proportion to the underlying reduction, so the ordering at a given cell is fixed by the ratio of the loss difference to the reduction difference; Lemma 1 makes the threshold explicit, and Lemma 2 locates a single crossover beyond which the robust calibration leads. The 144 scenario envelope quantifies the reach of this mechanism, with the Sadek formulation ranking first in 122 cells, the worst-case measure ranking it first at every tower, and the exceptions confined to the tightest bands, so the design recommendation rests on the crossover geometry rather than on a universal dominance claim.
The period-elongation-aware anchor addresses a different category of detuning. Manufacturing tolerance, modelling uncertainty, and modest cracking move the calibration period within the canonical ±10% band; the secant period elongation between the elastic configuration and the DD-2 damage state shifts it by an order of magnitude more. Anchoring the device at the arithmetic mean of the two limit periods converts an asymmetric one-sided detuning into a symmetric bounded envelope. Lemma 3 shows that this symmetric choice is optimal under any monotone cost defined on absolute period distance, which means the PEA bound is robust to the analyst’s preference for the form of the off-tune penalty. The combination with the RTI ranking yields a design baseline that controls both the bandwidth and the period elongation contributions to the off-tune envelope through a single closed-form procedure.
Wind serviceability constitutes a separate design condition for the towers considered here, and its optimization objective differs from the seismic one. Crosswind response near the vortex-shedding frequency governs occupant comfort through peak floor acceleration at the service return period; the structure remains elastic at the associated amplitudes, and the corresponding TMD calibration minimizes the acceleration variance at the elastic first-mode period. Multihazard evaluations of damped systems outrigger hybrid systems under combined crosswind and seismic excitation and confirm that the two objectives select different device parameters [79]. Within the present framework, the divergence is bounded rather than resolved. The PEA anchor displaces the calibration period from the elastic value by one half of the DD-2 secant elongation, so a device anchored for the damage state operates off-tune under service wind by the same bounded offset that Section 3.7 establishes for the seismic side, and the loss at the wind-side offset is bounded through the same frequency response envelope argument. A joint wind–seismic calibration with an explicit comfort constraint requires an acceleration variance term in the index and is identified as an extension direction.
The Sherman–Morrison–Woodbury acceleration of the parametric grid search is methodological rather than analytical. It preserves the closed-form structure of the framework while removing the computational obstacle that otherwise restricts transparent calibrations to coarse grids or surrogate models. The downstream consequence is that the analytical claims of the RTI ordering and the PEA bound can be verified on a dense parametric envelope on a workstation rather than on cluster resources, which keeps the framework within reach of the design office. On the practical side, the governing constraint identified by the verification is the stroke, whose mean demands of 0.5 m to 0.8 m and record extremes beyond 1.5 m call for long-stroke pendulum hardware, dedicated travel clearance, and hard stop design, and the 40 to 50% stroke saving of the robust calibration is the decisive practical argument for it at this scale.
The experimental basis of the framework rests on its ingredients rather than on a dedicated test of the assembled procedure. The closed-form optima of the Den Hartog, Warburton and Sadek calibrations and the detuning behavior of the FRF envelope, which together generate the RTI ordering, are established device physics, verified on shake table structures with multiple tuned mass dampers [28] and on the experimental verification of a 36-storey equivalent high rise [32], while the full scale field performance of rooftop devices is documented on the Taipei 101 [55] and Shanghai Tower [56] installations. The period elongation input of the PEA layer descends from the modal pushover, whose secant period representation of the damage state is standard practice in performance-based assessment. What lacks a direct experimental counterpart is the assembled two-layer procedure itself, the RTI ranking under controlled detuning, and the PEA anchor at the damage state. The reduced-scale shaking table program identified among the extension directions is defined for this purpose: a long-period specimen with an adjustable rooftop device, tested at the elastic-tuned and secant-tuned configurations under the record set of Section 2.3.
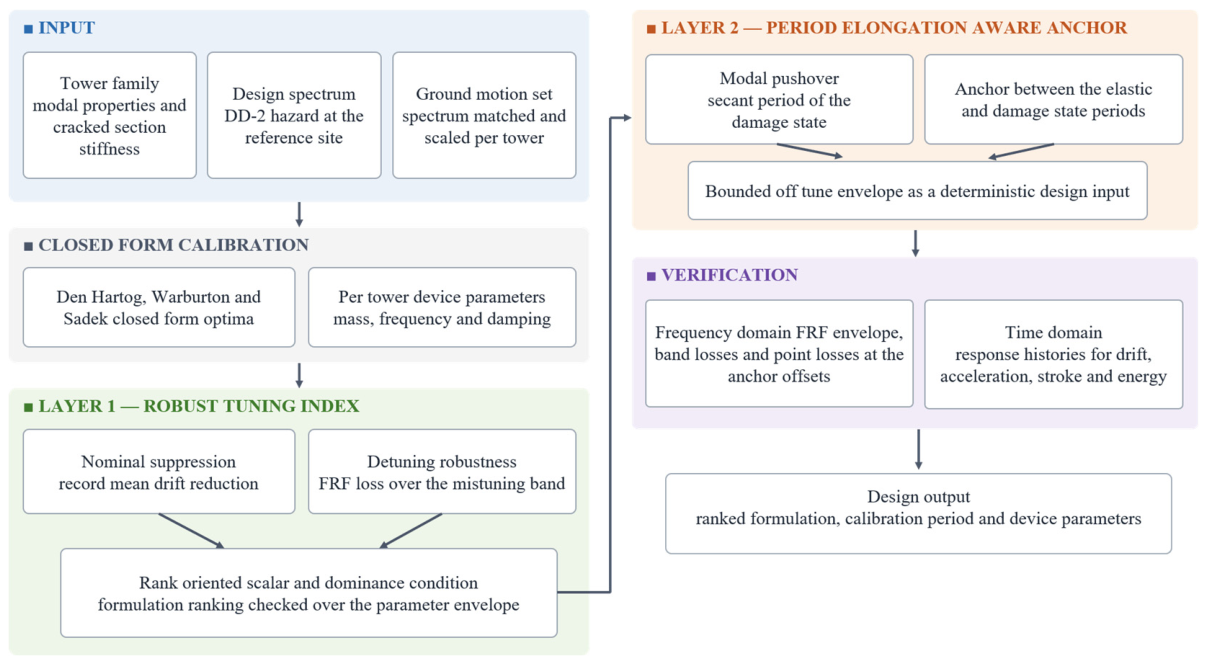
The framework operates within an explicit analytical envelope and lends itself to closed-form extensions that broaden its applicability while preserving its analytical core. A fiber-section formulation with cyclic hysteresis would extend the RTI–PEA structure into the inelastic regime while retaining the bandwidth-loss interpretation. A TMDI variant offers a closed-form generalization that lowers the absolute damper mass at the longest-period towers, and the bandwidth-loss formalism naturally accommodates a hybrid passive–semi-active complement at the upper ductility extreme. A shaking-table program on a reduced-scale long-period model would extend the analytical verification into the empirical domain. A damped outrigger benchmark on a companion tower family with dedicated stiffened storeys would quantify the comparison of Section 1. Figure 7 assembles the complete two-layer procedure, from the modal and spectral input through the RTI ranking layer and the PEA anchoring layer to the response history verification and the design output. The index itself is a deterministic comparison measure, and propagating the record-to-record and parameter uncertainties through it toward a reliability-based robustness statement is a further extension direction.

6. Conclusions

This paper has developed a closed-form, rank-oriented design framework for passive tuned mass dampers on long-period reinforced concrete high-rise structures and verified it on a three-tower parametric family of 30-, 48-, and 60-storey towers with first translational periods of 3.80, 6.824, and 8.45 s. Long-period towers expose the limits of elastic-anchored, single-point closed-form calibration, and the framework closes that gap with two analytical results and one verification platform that together turn the suppression against robustness trade-off and the inelastic period drift into transparent design quantities.
Three contributions advance the calibration of these devices beyond the current closed-form practice. The first recasts the suppression against robustness trade-off, hitherto resolved only through numerical minimax search or treated qualitatively in review, as a single multiplicative scalar built from four design requirements, which we call the Robust Tuning Index. Lemma 1 gives the necessary and sufficient condition under which the Sadek formulation dominates Den Hartog across any mistuning bandwidth, and Lemma 2 fixes the unique crossover, so the Sadek lead established at the design mass ratio is shown to be a structural property of the formulation rather than the outcome of a single calibration point, a ranking that leads in 122 of the 144 scenarios of the joint-perturbation envelope, at every tower under the worst case measure, and beyond the ±13.2% crossover at the reference tower, with the exceptions confined to tight band cells with statistically inseparable means.
The second converts the deterministic inelastic period drift, conventionally set aside in favor of the elastic period, into a closed-form tuning target. The period-elongation-aware anchor is placed at the arithmetic mean of the elastic and DD-2 secant periods, with which Lemma 3 proves minimax optimal across symmetric monotone off-tune costs and Corollary 1 extends to the asymmetric case. The anchor caps the worst-case damage state-of-tune offset at ±9.0%, ±11.0%, and ±12.1% at the three towers, against the asymmetric +19.7% to +27.6% of elastic-only anchoring. The frequency response envelope links the two layers, the Sadek point losses at the anchor offsets staying at 13.6% to 18.6% against 33.5% to 42.3% for the elastic-anchored Den Hartog device, and the anchor costs at most 0.3 percentage points of intact state performance.
The third supplies the parametric verification platform on which both analytical claims are tested. A Sherman–Morrison–Woodbury rank-one update accelerates the 216,000-point grid search 8.1-fold at a residual norm of order 10−12, which keeps the dense verification within reach of a workstation. The eleven-record Newmark-β histories on the 30-, 48-, and 60-storey towers, built on openly redistributable inputs, verify the band-conditional ordering of the index and its Sadek-led range beyond the crossover.
Numerically, the Sadek calibration produces mean roof drift reductions of 2.9%, 4.0% and 3.1% at the three towers, modest in the mean and widely scattered across records, with a per-record dispersion roughly one-third below its competitors. Peak floor acceleration reductions stay below 1.5%, with the higher modes carrying the acceleration demand that the rooftop device does not reach. The inter-storey drift maxima stay below the 0.01 immediate occupancy limit in the eleven-record mean, and the stroke demands of 475 mm to 828 mm on the mean, 40 to 50% below the Den Hartog values, govern the device design. Within the closed-form trio, the bandwidth loss factor of 4.3% against 11.3% and 12.2% accounts for the robust ranking.
The framework applies within a stated envelope, core-governed RC towers with first periods between 3.80 and 8.45 s, a rooftop device at a mass ratio of 0.02, rock-like site conditions, and a linear-elastic verification tier with the inelastic period drift represented through the pushover-derived secant period. Within this envelope, the designer obtains, in closed form and without iterative retuning, the ranked formulation, the calibration period, the frequency and damping parameters of the device, and the bounded off-tune envelope of the design. The verification of the inelastic tier by fiber section response histories, the TMDI generalization that lowers the damper mass at the longest periods, and the soil–structure interaction that sweep across the softer site classes remain the concrete extension directions.


Author Contributions

Conceptualization, R.O.; methodology, R.O.; software, E.O.; validation, R.O. and E.O.; formal analysis, E.O.; investigation, R.O.; resources, R.O.; data curation, E.O.; writing—original draft preparation, R.O.; writing—review and editing, R.O. and E.O.; visualization, E.O.; supervision, R.O.; project administration, R.O.; funding acquisition, R.O. All authors have read and agreed to the published version of the manuscript.

Funding

This research was funded by the Scientific Research Projects Coordination Unit (BAP) of Istanbul Technical University under grant number MGA-2022-43442.

Institutional Review Board Statement

Not applicable.

Informed Consent Statement

Not applicable.

Data Availability Statement

The data provided in this study could be released upon reasonable request.

Conflicts of Interest

The authors declare no conflicts of interest.

References

  1. Den Hartog, J.P. Mechanical Vibrations, 4th ed.; McGraw-Hill: New York, NY, USA, 1956. [Google Scholar]
  2. Warburton, G.B. Optimum absorber parameters for various combinations of response and excitation parameters. Earthq. Eng. Struct. Dyn. 1982, 10, 381–401. [Google Scholar] [CrossRef] [Scilit]
  3. Sadek, F.; Mohraz, B.; Taylor, A.W.; Chung, R.M. A method of estimating the parameters of tuned mass dampers for seismic applications. Earthq. Eng. Struct. Dyn. 1997, 26, 617–635. [Google Scholar] [CrossRef] [Scilit]
  4. AFAD. Türkiye Bina Deprem Yönetmeliği (TBDY 2018); T.C. İçişleri Bakanlığı Afet ve Acil Durum Yönetimi Başkanlığı: Ankara, Türkiye, 2018. Available online: https://tdth.afad.gov.tr (accessed on 12 July 2025).
  5. Oyguc, R.A. Seismic responses of buildings after the Mw 6.8 Sivrice earthquake in January 2020. J. Perform. Constr. Facil. 2022, 36, 04022002. [Google Scholar] [CrossRef] [Scilit]
  6. Oyguc, R.; Oyguc, E.; Tonuk, G. Case study on seismic behavior of aseismically designed reinforced concrete frame structures. Bull. Earthq. Eng. 2018, 16, 3057–3080. [Google Scholar] [CrossRef] [Scilit]
  7. Oyguc, E.; Oyguc, R.; Seker, O.; Hayır, A.; Shen, J.; Akbaş, B. Improving seismic performance of RC structures with innovative TnT BRBs: A shake table and finite element investigation. Appl. Sci. 2025, 15, 3844. [Google Scholar] [CrossRef] [Scilit]
  8. Oyguc, E.; Oyguc, R.; Hayır, A.; Seker, O.; Shen, J.; Akbaş, B. Seismic retrofitting of substandard RC frames using tube-in-tube buckling-restrained braces: Shake table evaluation and field insights. Bull. Earthq. Eng. 2025, 23, 4565–4608. [Google Scholar] [CrossRef] [Scilit]
  9. Frahm, H. Device for Damping Vibrations of Bodies. U.S. Patent 989,958, 30 October 1909. [Google Scholar]
  10. Ormondroyd, J.; Den Hartog, J.P. The theory of the dynamic vibration absorber. Trans. ASME J. Appl. Mech. 1928, 50, 9–22. [Google Scholar]
  11. Warburton, G.B.; Ayorinde, E.O. Optimum absorber parameters for simple systems. Earthq. Eng. Struct. Dyn. 1980, 8, 197–217. [Google Scholar] [CrossRef] [Scilit]
  12. Asami, T.; Nishihara, O.; Baz, A.M. Analytical solutions to H∞ and H2 optimization of dynamic vibration absorbers attached to damped linear systems. J. Vib. Acoust. 2002, 124, 284–295. [Google Scholar] [CrossRef] [Scilit]
  13. Kaynia, A.M.; Veneziano, D.; Biggs, J.M. Seismic effectiveness of tuned mass dampers. J. Struct. Div. 1981, 107, 1465–1484. [Google Scholar] [CrossRef] [Scilit]
  14. Sladek, J.R.; Klingner, R.E. Effect of tuned-mass dampers on seismic response. J. Struct. Eng. 1983, 109, 2004–2009. [Google Scholar] [CrossRef] [Scilit]
  15. Soong, T.T.; Dargush, G.F. Passive Energy Dissipation Systems in Structural Engineering; John Wiley & Sons: Chichester, UK, 1997. [Google Scholar]
  16. Soong, T.T.; Spencer, B.F. Supplemental energy dissipation: State-of-the-art and state-of-the-practice. Eng. Struct. 2002, 24, 243–259. [Google Scholar] [CrossRef] [Scilit]
  17. Velychkovych, A.; Mykhailiuk, V.; Andrusyak, A. Numerical model for studying the properties of a new friction damper developed based on the shell with a helical cut. Appl. Mech. 2025, 6, 1. [Google Scholar] [CrossRef] [Scilit]
  18. Velychkovych, A.S.; Shatskyi, I.P.; Shopa, V.M.; Bedzir, O.O. Slotted-shell friction damper for sucker-rod string suspension: Analytical model and parametric study. Arch. Mater. Sci. Eng. 2025, 134, 49–60. [Google Scholar] [CrossRef] [Scilit]
  19. Chen, Y.; McFarland, D.M.; Wang, Z.; Spencer, B.F., Jr.; Bergman, L.A. Analysis of tall buildings with damped outriggers. J. Struct. Eng. 2010, 136, 1435–1443. [Google Scholar] [CrossRef] [Scilit]
  20. Wang, Z.-H.; Zhou, Y.; Fang, C.; Zhang, J. Stochastic optimization and sensitivity analysis of the combined negative stiffness damped outrigger and conventional damped outrigger systems subjected to nonstationary seismic excitation. Struct. Control Health Monit. 2023, 2023, 4024741. [Google Scholar] [CrossRef] [Scilit]
  21. Mohebbi, M.; Shakeri, K.; Ghanbarpour, Y.; Majzoub, H. Designing optimal multiple tuned mass dampers using genetic algorithms (GAs) for mitigating the seismic response of structures. J. Vib. Control 2012, 19, 605–625. [Google Scholar] [CrossRef] [Scilit]
  22. Hoang, N.; Warnitchai, P. Design of multiple tuned mass dampers by using a numerical optimizer. Earthq. Eng. Struct. Dyn. 2005, 34, 125–144. [Google Scholar] [CrossRef] [Scilit]
  23. Cetin, H.; Aydin, E. A new tuned mass damper design method based on transfer functions. KSCE J. Civ. Eng. 2019, 23, 4463–4480. [Google Scholar] [CrossRef] [Scilit]
  24. Yucel, M.; Bekdaş, G.; Nigdeli, S.M.; Sevgen, S. Estimation of optimum tuned mass damper parameters via machine learning. J. Build. Eng. 2019, 26, 100847. [Google Scholar] [CrossRef] [Scilit]
  25. Çoşut, M.; Nigdeli, S.M.; Bekdaş, G. Structural control systems and tuned mass damper optimization by using Jaya and hybrid algorithms. In Hybrid Metaheuristics in Structural Engineering; Springer: Cham, Switzerland, 2023; pp. 87–110. [Google Scholar] [CrossRef] [Scilit]
  26. Kareem, A.; Kline, S. Performance of multiple mass dampers under random loading. J. Struct. Eng. 1995, 121, 348–361. [Google Scholar] [CrossRef] [Scilit]
  27. Chen, G.; Wu, J. Optimal placement of multiple tuned mass dampers for seismic structures. J. Struct. Eng. 2001, 127, 1054–1062. [Google Scholar] [CrossRef] [Scilit]
  28. Chen, G.; Wu, J. Experimental study on multiple tuned mass dampers to reduce seismic responses of a three-storey building structure. Earthq. Eng. Struct. Dyn. 2003, 32, 793–810. [Google Scholar] [CrossRef] [Scilit]
  29. Moon, K.S. Vertically distributed multiple tuned mass dampers in tall buildings: Performance analysis and preliminary design. Struct. Des. Tall Spec. Build. 2009, 19, 347–366. [Google Scholar] [CrossRef] [Scilit]
  30. Lavan, O.; Daniel, Y. Full resources utilization seismic design of irregular structures using multiple tuned mass dampers. Struct. Multidiscip. Optim. 2013, 48, 517–532. [Google Scholar] [CrossRef] [Scilit]
  31. Akhlagh Pasand, A.; Zahrai, S.M. Seismic control of tall buildings using vertically distributed multiple tuned mass dampers. Struct. Des. Tall Spec. Build. 2024, 33, e2123. [Google Scholar] [CrossRef] [Scilit]
  32. Lin, G.-L.; Lin, C.-C.; Yang, T.-H.; Lung, H.-Y. Experimental verification of seismic vibration control of high-rise buildings with friction-type multiple tuned mass dampers. Eng. Struct. 2024, 302, 117401. [Google Scholar] [CrossRef] [Scilit]
  33. Suresh, L.; Mini, K.M. Effect of multiple tuned mass dampers for vibration control in high-rise buildings. Pract. Period. Struct. Des. Constr. 2019, 24, 04019019. [Google Scholar] [CrossRef] [Scilit]
  34. Ekici, Y.; Cigeroglu, E. Effect of nonlinearities on the vibration reduction performance of a system with multiple nonlinear tuned mass dampers. In Proceedings of the ASME 2023 International Mechanical Engineering Congress and Exposition (IMECE), New Orleans, LA, USA, 29 October–2 November 2023; Volume 6, p. V006T07A026. [Google Scholar] [CrossRef] [Scilit]
  35. Zuo, H.; Bi, K.; Hao, H. Using multiple tuned mass dampers to control offshore wind turbine vibrations under multiple hazards. Eng. Struct. 2017, 141, 303–315. [Google Scholar] [CrossRef] [Scilit]
  36. Poh’sie, G.H.; Chisari, C.; Rinaldin, G.; Amadio, C.; Fragiacomo, M. Optimal design of tuned mass dampers for a multi-storey cross laminated timber building against seismic loads. Earthq. Eng. Struct. Dyn. 2016, 45, 1977–1995. [Google Scholar] [CrossRef] [Scilit]
  37. Farsijani, D.; Gholam, S.; Karampour, H.; Talebian, N. Machine-learning based performance assessment of TMD-equipped buildings subjected to near-field pulse-like ground motions. J. Build. Eng. 2025, 105, 112380. [Google Scholar] [CrossRef] [Scilit]
  38. Matta, E.; De Stefano, A. Robust design of mass-uncertain rolling-pendulum TMDs for the seismic protection of buildings. Mech. Syst. Signal Process. 2009, 23, 127–147. [Google Scholar] [CrossRef] [Scilit]
  39. Tributsch, A.; Adam, C. Evaluation and analytical approximation of tuned mass damper performance in an earthquake environment. Smart Struct. Syst. 2012, 10, 155–179. [Google Scholar] [CrossRef] [Scilit]
  40. Salvi, J.; Rizzi, E. Optimum tuning of tuned mass dampers for frame structures under earthquake excitation. Struct. Control Health Monit. 2014, 22, 707–725. [Google Scholar] [CrossRef] [Scilit]
  41. Salvi, J.; Rizzi, E. Optimum earthquake-tuned TMDs: Seismic performance and new design concept of balance of split effective modal masses. Soil Dyn. Earthq. Eng. 2017, 101, 67–80. [Google Scholar] [CrossRef] [Scilit]
  42. Kahya, V.; Araz, O. Series multiple tuned mass dampers for vibration control of high-speed railway bridges. In Insights and Innovations in Structural Engineering, Mechanics and Computation; CRC Press: Leiden, The Netherlands, 2016; pp. 143–146. [Google Scholar] [CrossRef] [Scilit]
  43. Marian, L.; Giaralis, A. Optimal design of a novel tuned mass-damper–inerter (TMDI) passive vibration control configuration for stochastically support-excited structural systems. Probab. Eng. Mech. 2014, 38, 156–164. [Google Scholar] [CrossRef] [Scilit]
  44. De Domenico, D.; Qiao, H.; Wang, Q.; Zhu, Z.; Marano, G. Optimal design and seismic performance of multi-tuned mass damper inerter (MTMDI) applied to adjacent high-rise buildings. Struct. Des. Tall Spec. Build. 2020, 29, e1781. [Google Scholar] [CrossRef] [Scilit]
  45. Veletsos, A.S.; Meek, J.W. Dynamic behavior of building-foundation systems. Earthq. Eng. Struct. Dyn. 1974, 3, 121–138. [Google Scholar] [CrossRef] [Scilit]
  46. Kausel, E.; Whitman, R.V.; Morray, J.P.; Elsabee, F. The spring method for embedded foundations. Nucl. Eng. Des. 1978, 48, 377–392. [Google Scholar] [CrossRef] [Scilit]
  47. Gazetas, G. Formulas and charts for impedances of surface and embedded foundations. J. Geotech. Eng. 1991, 117, 1363–1381. [Google Scholar] [CrossRef] [Scilit]
  48. Mylonakis, G.; Nikolaou, S.; Gazetas, G. Footings under seismic loading: Analysis and design issues with emphasis on bridge foundations. Soil Dyn. Earthq. Eng. 2006, 26, 824–853. [Google Scholar] [CrossRef] [Scilit]
  49. Farshidianfar, A.; Soheili, S. Ant colony optimization of tuned mass dampers for earthquake oscillations of high-rise structures including soil–structure interaction. Soil Dyn. Earthq. Eng. 2013, 51, 14–22. [Google Scholar] [CrossRef] [Scilit]
  50. Araz, O. Optimization of tuned mass damper inerter for a high-rise building considering soil-structure interaction. Arch. Appl. Mech. 2022, 92, 2951–2971. [Google Scholar] [CrossRef] [Scilit]
  51. Cornell, C.A.; Krawinkler, H. Progress and challenges in seismic performance assessment. PEER Cent. News 2000, 3, 1–3. [Google Scholar]
  52. Applied Technology Council. Seismic Performance Assessment of Buildings, Volume 1—Methodology, 2nd ed.; FEMA P-58-1; Federal Emergency Management Agency: Washington, DC, USA, 2018.
  53. Iervolino, I.; Manfredi, G. A review of ground motion record selection strategies for dynamic structural analysis. In Modern Testing Techniques for Structural Systems; Springer: Vienna, Austria, 2008; pp. 131–163. [Google Scholar] [CrossRef] [Scilit]
  54. Villaverde, R.; Koyama, L.A. Damped resonant appendages to increase inherent damping in buildings. Earthq. Eng. Struct. Dyn. 1993, 22, 491–507. [Google Scholar] [CrossRef] [Scilit]
  55. Shieh, S.S.; Chang, C.C.; Jong, J.H. Structural design of composite super-columns for the Taipei 101 Tower. In Proceedings of the International Workshop on Steel and Concrete Composite Construction (IWSCCC), Taipei, Taiwan, 8–9 October 2003; pp. 25–33. [Google Scholar]
  56. Lu, X.; Chen, J. Mitigation of wind-induced response of Shanghai Center Tower by tuned mass damper. Struct. Des. Tall Spec. Build. 2011, 20, 435–452. [Google Scholar] [CrossRef] [Scilit]
  57. Mousaviyan Safakhaneh, M.; Fahimi Farzam, M.; Ahmadi, H.; Farnam, A. Vibration control of structure using active tuned mass damper: A new control algorithm. J. Vib. Control 2025, 31, 2908–2919. [Google Scholar] [CrossRef] [Scilit]
  58. Spencer, B.F.; Nagarajaiah, S. State of the art of structural control. J. Struct. Eng. 2003, 129, 845–856. [Google Scholar] [CrossRef] [Scilit]
  59. Elias, S.; Matsagar, V. Research developments in vibration control of structures using passive tuned mass dampers. Annu. Rev. Control 2017, 44, 129–156. [Google Scholar] [CrossRef] [Scilit]
  60. Yang, F.; Sedaghati, R.; Esmailzadeh, E. Vibration suppression of structures using tuned mass damper technology: A state-of-the-art review. J. Vib. Control 2021, 28, 812–836. [Google Scholar] [CrossRef] [Scilit]
  61. Rahimi, F.; Aghayari, R.; Samali, B. Application of tuned mass dampers for structural vibration control: A state-of-the-art review. Civ. Eng. J. 2020, 6, 1622–1651. [Google Scholar] [CrossRef] [Scilit]
  62. Konar, T.; Ghosh, A. Tuned mass damper inerter for seismic control of multi-story buildings: Ten years since inception. Structures 2024, 63, 106459. [Google Scholar] [CrossRef] [Scilit]
  63. Chopra, A.K.; Goel, R.K. A modal pushover analysis procedure for estimating seismic demands for buildings. Earthq. Eng. Struct. Dyn. 2001, 31, 561–582. [Google Scholar] [CrossRef] [Scilit]
  64. Soto-Brito, R.; Ruiz, S.E. Influence of ground motion intensity on the effectiveness of tuned mass dampers. Earthq. Eng. Struct. Dyn. 1999, 28, 1255–1271. [Google Scholar] [CrossRef] [Scilit]
  65. Lukkunaprasit, P.; Wanitkorkul, A. Inelastic buildings with tuned mass dampers under moderate ground motions from distant earthquakes. Earthq. Eng. Struct. Dyn. 2001, 30, 537–551. [Google Scholar] [CrossRef] [Scilit]
  66. Pinkaew, T.; Lukkunaprasit, P.; Chatupote, P. Seismic effectiveness of tuned mass dampers for damage reduction of structures. Eng. Struct. 2003, 25, 39–46. [Google Scholar] [CrossRef] [Scilit]
  67. Sgobba, S.; Marano, G.C. Optimum design of linear tuned mass dampers for structures with nonlinear behaviour. Mech. Syst. Signal Process. 2010, 24, 1739–1755. [Google Scholar] [CrossRef] [Scilit]
  68. Marrazzo, P.R.; Montuori, R.; Nastri, E.; Benzoni, G. Advanced seismic retrofitting with high-mass-ratio Tuned Mass Dampers. Soil Dyn. Earthq. Eng. 2024, 179, 108544. [Google Scholar] [CrossRef] [Scilit]
  69. Oyguc, R.; Tonuk, G.; Oyguc, E. Damage accumulation modelling of two reinforced concrete buildings under seismic sequences. Bull. Earthq. Eng. 2023, 21, 4993–5015. [Google Scholar] [CrossRef] [Scilit]
  70. Oyguc, R.; Aygün, Z.S.; Oyguc, E. Fragility of irregular RC buildings under mainshock-aftershock sequences. Bull. Earthq. Eng. 2026. [Google Scholar] [CrossRef] [Scilit]
  71. Sherman, J.; Morrison, W.J. Adjustment of an inverse matrix corresponding to a change in one element of a given matrix. Ann. Math. Stat. 1950, 21, 124–127. [Google Scholar] [CrossRef] [Scilit]
  72. Computers and Structures, Inc. ETABS, Version 21: Extended Three Dimensional Analysis of Building Systems; CSI: Berkeley, CA, USA, 2023. [Google Scholar]
  73. ASCE/SEI 41-17; Seismic Evaluation and Retrofit of Existing Buildings. American Society of Civil Engineers, ASCE: Reston, VA, USA, 2017. [CrossRef] [Scilit]
  74. EN 1998-1; Eurocode 8: Design of Structures for Earthquake Resistance—Part 1: General Rules, Seismic Actions and Rules for Buildings. CEN: Brussels, Belgium, 2004.
  75. ASCE/SEI 7-16; Minimum Design Loads and Associated Criteria for Buildings and Other Structures. American Society of Civil Engineers, ASCE: Reston, VA, USA, 2017. [CrossRef] [Scilit]
  76. Ancheta, T.D.; Darragh, R.B.; Stewart, J.P.; Seyhan, E.; Silva, W.J.; Chiou, B.S.-J.; Wooddell, K.E.; Graves, R.W.; Kottke, A.R.; Boore, D.M.; et al. NGA-West2 database. Earthq. Spectra 2014, 30, 989–1005. [Google Scholar] [CrossRef] [Scilit]
  77. Saaty, T.L. The Analytic Hierarchy Process: Planning, Priority Setting, Resource Allocation; McGraw-Hill: New York, NY, USA, 1980. [Google Scholar]
  78. Miranda, E. Approximate seismic lateral deformation demands in multistory buildings. J. Struct. Eng. 1999, 125, 417–425. [Google Scholar] [CrossRef] [Scilit]
  79. Zhou, Y.; Wang, X.; Fan, B.; Wei, S.; Wang, Z. Multi-hazard performance evaluation of the negative stiffness damped outrigger hybrid system subjected to crosswind and seismic excitation. J. Vib. Control 2025. [Google Scholar] [CrossRef] [Scilit]
Figure 1. Reference tower family: (a) typical floor plan, (b) elevation of Tower B, and (c) MDOF to 2-DOF calibration model reduction.
Applsci 16 07424 g001
Figure 2. TBDY 2018 [4] design spectra at the ZB site with the eleven-record geometric mean and per-tower first-mode periods.
Applsci 16 07424 g002
Figure 3. RTI frontier on the ( R ¯ , L ± 10) plane for the three closed-form formulations at the three towers, with iso-RTI contours.
Applsci 16 07424 g003
Figure 4. Modal pushover secant first-mode period T1top) for the three towers.
Applsci 16 07424 g004
Figure 5. Normalized FRF magnitude at Tower B for the bare structure and the three formulations at nominal closed form.
Applsci 16 07424 g005
Figure 6. Mean inter-storey drift profiles at DD-2, bare versus Sadek controlled response, with the record-to-record spread of the controlled case.
Applsci 16 07424 g006
Figure 7. Two-layer closed-form design procedure and verification path.
Applsci 16 07424 g007
Table 1. Structural parameters of the three-tower parametric family.
ParameterSymbolTower ATower BTower CUnit
Number of storeysN304860
Total heightH87.0139.7174.6 m
Typical storey heighth2.902.912.91 m
Plan dimension (X = Y)B23.2031.3033.95 m
Aspect ratioH/B3.754.465.14
Total seismic mass m T 15,78025,95732,091 t
Storey mass density ρ s 0.9770.5520.464 t / m 2
Mode 1 effective mass M 1 * 920015,60019,800 t
Mode 1 mass participation U X 1 0.5830.6010.617
Mode 4 effective mass M 4 * 255640814783 t
Mode 4 mass participation U X 4 0.1620.1570.149
Cracked stiffness (walls) E I e f f / E I g 0.500.500.50
Cracked stiffness (columns) E I e f f / E I g 0.700.700.70
Cracked stiffness (beams) E I e f f / E I g 0.350.350.35
Structural damping ratio ζ s 0.050.050.05
Table 2. First six vibration modes for the three-tower parametric family.
TowerModeT (s)ω (rad/s)UXUYRZ
A13.8001.6530.5830.0040.007
21.9693.1910.0050.0080.562
31.6963.7040.0030.6050.006
40.8447.4410.1620.0020.004
50.44214.2200.0060.0090.139
60.34118.4360.0040.1240.005
B16.8240.9210.6010.0060.009
23.5361.7780.0070.0100.578
33.0462.0630.0040.6160.008
41.5164.1440.1570.0030.005
50.7947.9170.0080.0110.142
60.61210.2670.0050.1310.007
C18.4500.7440.6170.0080.012
24.3781.4350.0090.0130.591
33.7721.6660.0050.6240.010
41.8783.3460.1490.0040.007
50.9836.3910.0100.0140.145
60.7588.2880.0060.1350.008
Table 3. Design spectrum parameters at the ZB site and per-tower spectral accelerations at the first and fourth modes.
HazardParameterSymbolTower ATower BTower CUnit
DD-2Short-period plateau S D S 0.950.950.95g
One-second ordinate S D 1 0.2040.2040.204g
First-mode ordinate S a T 1 0.05370.02630.0171g
Fourth-mode ordinate S a T 4 0.2420.1350.109g
DD-1Short-period plateau S D S 1.401.401.40g
One-second ordinate S D 1 0.3060.3060.306g
First-mode ordinate S a T 1 0.08050.03940.0257g
CommonLong-period transition T L 666s
Table 4. Eleven-record ground motion set with source parameters and per-tower uncontrolled peak roof displacements after tower-specific spectral matching.
#Event   M w R (km)Mechanism u u n c , A (mm) u u n c , B (mm) u u n c , C (mm)
1Düzce 1999 (Bolu)7.1412.0Strike-slip194446676
2Kocaeli 1999 (Yarımca)7.514.8Strike-slip556553495
3Erzincan 1992 (Erzincan)6.694.4Strike-slip264302495
4Kocaeli 1999 (Arçelik)7.5113.5Strike-slip312595797
5Northridge 1994 (BH-Mulholland)6.6917.2Thrust211465634
6Loma Prieta 1989 (Capitola)6.9315.2Oblique160873737
7Cape Mendocino 1992 (Rio Dell Ovp)7.0114.3Thrust181631673
8Imperial Valley 1940 (El Centro)6.956.1Strike-slip322462649
9Manjil 1990 (Abbar)7.3712.6Strike-slip189457522
10Chi-Chi 1999 (TCU065)7.620.6Thrust357533495
11Irpinia 1980 (Sturno)6.9010.8Normal346438437
Mean11-record average281523601
Std σ11-record sample116146118
Table 5. Reproducibility metadata for the eleven-record set.
EventPGA (g)PGV (cm/s)Arias (m/s)   S f , A   S f , B   S f , C
Düzce 19990.82262.12.430.7301.3991.742
Kocaeli 1999 (Yarımca)0.31372.91.240.4030.4180.448
Erzincan 19920.48695.42.030.3930.6190.745
Kocaeli 1999 (Arçelik)0.21917.70.292.4172.3532.376
Northridge 19940.41658.93.070.7441.4971.918
Loma Prieta 19890.52935.04.371.1962.2222.944
Cape Mendocino 19920.38543.81.521.0971.5401.780
Imperial Valley 19400.31935.21.800.9351.2661.418
Manjil 19900.49750.57.510.5400.6860.793
Chi-Chi 19990.822127.77.730.2190.2470.263
Irpinia 19800.23241.51.000.7520.8740.980
Table 6. SMW computational benchmark for the parametric grid search over 216,000 ( μ , f d / f s , ζ d ) points per tower.
TowerGrid PointsDirect LU (s)SMW (s)SpeedupResidual Norm
A216,00017822208.101.9 × 10−12
B216,00018002228.112.0 × 10−12
C216,00018152248.102.1 × 10−12
Total648,00053976668.102.1 × 10−12
Table 7. Per-tower TMD calibration matrix at  μ = 0.02  and  ζ s = 0.05  for the three closed-form formulations.
TowerFormulation   m d   ( t )   T d   ( s )   f d   ( H z )   ζ d   k d   ( k N / m )   c d   ( k N · s / m )
ADen Hartog1843.8760.25800.0841484.450.2
Warburton3.8960.25670.0702479.741.6
Sadek3.9040.25620.1890477.5111.8
BDen Hartog3126.9600.14370.0841254.247.4
Warburton6.9960.14290.0702251.739.3
Sadek7.0100.14270.1890250.7105.7
CDen Hartog3968.6190.11600.0841210.448.6
Warburton8.6630.11540.0702208.340.3
Sadek8.6800.11520.1890207.5108.4
Table 8. RTI per tower per formulation at  μ = 0.02  and  ζ s = 0.05 .
TowerFormulation   R ¯   ( % )   L ± 10   ( % ) RTIRank   L m a x   ( % )   M S R RTI/ M S R  
ADen Hartog2.7910.82.49236.31.781.40
Warburton2.7711.72.45337.01.741.40
Sadek2.944.32.81115.32.491.13
BDen Hartog4.5011.33.99236.72.851.40
Warburton4.6012.24.04137.52.881.40
Sadek4.034.33.86315.23.421.13
CDen Hartog2.8511.32.53236.81.801.40
Warburton2.8212.32.47337.61.761.41
Sadek3.064.32.93115.12.601.13
Table 9. RTI bandwidth sensitivity at Tower B with the threshold ratio of Lemma 1.
Bandwidth   L D H   ( % )   L S   ( % )   R T I D H   R T I S   Δ L / Δ R ThresholdLeading Formulation
±5% 2.7 1.3 4.38 3.98 3.0 24.1 Den Hartog
±10% 11.3 4.3 3.99 3.86 14.9 22.0 Den Hartog
±15% 19.3 8.0 3.63 3.71 24.0 20.0 Sadek
±20% 25.8 11.6 3.34 3.56 30.2 18.4 Sadek
Table 10. Damage-state-dependent secant modal map per tower.
Tower   μ δ   T 1   ( s )   T 1 / T e l   φ m a x   U X 4
A13.8001.0001.5700.162
25.2441.3801.2850.231
36.2751.6511.1900.254
47.0871.8651.1430.265
B16.8241.0001.5700.157
29.4181.3801.2850.224
311.2691.6511.1900.246
412.7271.8651.1430.257
C18.4501.0001.5700.149
211.6621.3801.2850.212
313.9551.6511.1900.233
415.7591.8651.1430.244
Table 11. PEA TMD calibration per tower: periods, anchor, off-tune envelope, and performance optimum.
Tower   T e l (s) T D D 2  (s)Elongation (%)   T ¯ 1 (s) Bounded off Tune (%)   w p e r f *
A3.8004.550+19.74.175±9.0 0.72
B6.8248.510 +24.7 7.667±11.0 0.68
C8.45010.780+27.69.615±12.1 0.68
Table 12. Peak FRF amplification at the nominal tuning and at the ±10% band extreme.
TowerBareDen HartogWarburtonSadek
Nominal±10%Nominal±10%Nominal±10%
A10.06.198.446.298.626.797.83
B10.06.158.416.258.596.797.82
C10.06.158.416.248.596.797.82
Table 13. Peak roof drift reductions per record at Tower B for the three TMD formulations.
#Event   k d   R d , D H   ( % )   R d , W a r b   ( % )   R d , S a d e k   ( % )
1Düzce 1999−0.531.41.31.6
2Kocaeli 1999 (Yarımca)+0.209.19.27.7
3Erzincan 1992−1.511.31.12.3
4Kocaeli 1999 (Arçelik)+0.492.12.31.3
5Northridge 1994−0.401.61.52.7
6Loma Prieta 1989+2.391.51.32.9
7Cape Mendocino 1992+0.744.14.04.3
8Imperial Valley 1940−0.4216.818.011.3
9Manjil 1990−0.455.35.54.3
10Chi-Chi 1999+0.073.03.02.7
11Irpinia 1980−0.583.43.33.2
Mean11-record average0.004.504.604.03
Std σ11-record sample1.004.705.052.98
Table 14. Cross-tower mean roof drift reduction  R ¯ d  (%) at the nominal closed-form tuning.
TowerDen HartogWarburtonSadek
R ¯ d  (%)   σ R   L ± 10   ( % ) R ¯ d  (%)   σ R   L ± 10   ( % ) R ¯ d  (%)   σ R   L ± 10   ( % )
A 2.79 2.14 10.8 2.77 2.30 11.7 2.94 1.42 4.3
B 4.50 4.70 11.3 4.60 5.05 12.2 4.03 2.98 4.3
C 2.85 2.25 11.3 2.82 2.30 12.3 3.06 1.94 4.3
Table 15. Cross-tower mean peak floor acceleration reduction  R ¯ a  (%) at the nominal closed-form tuning and the Mode 4 mass participation  U X 4 .
TowerUX4Den Hartog  R ¯ a  (%)Warburton  R ¯ a  (%)Sadek  R ¯ a  (%)
A0.1620.90.91.4
B0.157−0.1−0.10.4
C0.1490.40.30.8
Table 16. Cross-tower TMD stroke demand at the DD-2 hazard level: eleven-record mean and sample standard deviation, and the peak record.
TowerFormulationMean Stroke (mm)Std σ (mm)Peak RecordPeak Value (mm)
ADen Hartog689443Kocaeli 1999 (Yarımca)1710
Warburton745489Kocaeli 1999 (Yarımca)1870
Sadek475275Kocaeli 1999 (Yarımca)1076
BDen Hartog1147465Kocaeli 1999 (Arçelik)1653
Warburton1241515Imperial Valley 19401792
Sadek768270Kocaeli 1999 (Arçelik)1129
CDen Hartog1171549Kocaeli 1999 (Arçelik)2263
Warburton1250600Kocaeli 1999 (Arçelik)2411
Sadek828339Kocaeli 1999 (Arçelik)1588
Disclaimer/Publisher’s Note: The statements, opinions and data contained in all publications are solely those of the individual author(s) and contributor(s) and not of MDPI and/or the editor(s). MDPI and/or the editor(s) disclaim responsibility for any injury to people or property resulting from any ideas, methods, instructions or products referred to in the content.