Article

Green-Synthesized Pd Nanoparticles Incorporated in Polymer Matrix Designed for Optical Applications


1
Institute of Optical Materials and Technologies “Acad. J. Malinowski”, Bulgarian Academy of Sciences, Akad. G. Bontchev Str., Block 109, 1113 Sofia, Bulgaria
2
Department of Organic Chemistry and Inorganic Chemistry, Technological Faculty, University of Food Technologies, 26 Maritza Blvd, 4002 Plovdiv, Bulgaria
3
National Centre of Excellence Mechatronics and Clean Technologies, 8 Kliment Ohridski Blvd, Sofia, Bulgaria
*
Author to whom correspondence should be addressed.
Appl. Sci. 2026, 16(11), 5558; https://doi.org/10.3390/app16115558
Submission received: 15 April 2026 / Revised: 26 May 2026 / Accepted: 28 May 2026 / Published: 2 June 2026
(This article belongs to the Section Green Sustainable Science and Technology)

Abstract

In this study, we employed one of the green synthesis methods utilizing water extracts prepared from solid industrial wastes of Rosa damascena Mill. (RD) and Oriental variety tobacco (Nicotiana tabacum)-mixed stems and leaves (O) as a natural reducing agent for PdCl2 to obtain environmentally friendly Pd nanoparticles (PdNPs). Transmission electron microscopy (TEM), selected area electron diffraction (SAED), and energy-dispersive X-ray spectroscopy (EDX) in TEM were applied to determine the morphology, microstructure, phase, and elemental composition of PdNPs synthesized. The concentration of PdNPs in the suspensions was quantified by inductively coupled plasma optical emission spectroscopy (ICP-OES), which is essential for their intended application. Furthermore, the synthesized PdNPs were incorporated as dopant into a polymer matrix (PAZO) developed for optical applications. As will be demonstrated, doping PAZO with specific concentrations (0.1, 0.2, 0.25, 0.3, 0.4, 0.5, and 1 wt. %) of green PdNPs enhances the maximal value of the photoinduced birefringence by more than 50%. This improvement enables more efficient inscription of polarization-selective holographic optical elements in the resulting photoanisotropic nanocomposite materials with nearly 25% higher diffraction efficiency. Using a digital polarization holographic setup, the spatial modulation of polarization was recorded on thin nanocomposite films of the azopolymer PAZO, doped with certain concentrations of the green PdNPs.

1. Introduction

The essential rose oil industry, characteristic for Bulgaria, Turkey, and France due to the lower amount of the target product (essential oil) in the plants, generates vast amounts of solid and liquid by-products [1]. Technologies and approaches for valorization of some of these residues have been successfully developed, but in general, most of the biomass is discarded. Attempts were extensively focused on searching for valorization of rose oil industry by-product approaches [1]. Due to technological and economic reasons, the processing of initial raw materials (fresh rose flowers) never leads to complete distillation of the essential oil and, subsequently, valuable substances such as aroma compounds, polyphenols, and polysaccharides can be found in the residues [2]. For this reason, rose by-products can be used as a source of valuable biologically active substances, and their extracts are rich in reducing substances [3].
At the same time, the tobacco world market is estimated at 8.8 million tons in 2024, with more than 100 countries (having diverse climatic conditions) actively producing tobacco and tobacco products. China, India, and Brazil are among the biggest worldwide tobacco producers (2.2, 0.8, and 0.7 million metric tons, respectively) from an overall 5.8 million metric tons produced in 2022 [4]. The tobacco and tobacco products industry has been highly developed and has worked well over the years, yet around 30% of the tobacco biomass (from field to factories) ends up as waste or by-products [4]. A great number of secondary metabolites have been isolated from tobacco plants, such as alkaloids, essential oils, polyphenols, triterpenes, aromatic substances, fatty alcohols, and phytosterols, which could find a variety of applications in agricultural, pharmaceutical, and medical fields [5,6]. Over 100 phenolic compounds such as benzofuran derivatives, coumarins, flavones, and others were isolated from Nicotiana tabacum—the most industrially cultivated tobacco species [7]. Chlorogenic acid, rutin, and scopoletin are the most abundant phenolic-type compounds, accounting for up to 80% of the total polyphenolics in tobacco biomass [8].
The use of biodegradable waste raw materials for the green synthesis of nanoparticles is one of the relatively new and up-to-date approaches in this direction and has two main advantages: it represents an environmentally friendly method for synthesis of nanoparticles, and also presents a method for valorization of the large amounts of waste plant materials. For example, Prasad et al. [9] successfully synthesized silver nanoparticles using tobacco leaf extracts and investigated their antibacterial properties. Suharto et al. [10] obtained and investigated copper nanoparticles using various tobacco leaf extracts, showing the advantage of using water–methanol systems. These biogenically synthesized nanoparticles have the potential to be used to combat diseases of the tobacco plant itself, such as tobacco mosaic virus. Interestingly, the tobacco mosaic virus (genetically engineered) was also used as a biological template for synthesis and deposition of PdNPs [11]. During the different stages of the synthesis, the authors were able to produce PdNPs with an average diameter of 4.5 nm and subsequently Pd nanorods. Parker et al. [12] also exploited the potential of the living organisms’ enzyme systems to accumulate and synthesize metal NPs (PdNPs) with potent catalytic activity and obtained PdNPs in the first 3 h with an average diameter of 3 nm. Sattar et al. [13] were able to successfully prepare PdNPs using water extract from Curcuma longa roots at 70 °C. The PdNPs had a spherical form with a size in the 50–150 nm range.
The demand for advanced materials for modern technological applications continues to increase. Nanocomposite materials, although studied and utilized for several decades, remain the subject of continuous development to achieve improved performance and enable more sophisticated applications [14,15]. Nanocomposites are typically formed by incorporating two or more constituents at the nanoscale—for example, an organic matrix and inorganic nanoparticles—resulting in materials with significantly modified and improved optical, mechanical, and electrical properties. The organic matrix often provides structural flexibility and a well-organized framework for the composite. For instance, polymers can be combined with nanoparticles to form hybrid materials in which key optical parameters, such as refractive index, birefringence, and other related properties, can be effectively modified and controlled. From the perspective of holographic applications, nanocomposite materials consisting of photopolymers and nanoparticles have attracted considerable research interest [16,17,18]. Among all of them, azopolymer-based nanocomposites are particularly important for our studies, as they are suitable for applications in polarization holography. Such materials typically consist of an azopolymer matrix doped with either metallic or non-metallic nanoparticles. Various nanoparticle compositions have been investigated so far [19,20], but to the best of our knowledge, PdNPs synthesized using the methods of green chemistry are employed for the first time. For a material to be applicable in polarization holographic recording, it must exhibit photoanisotropy, meaning that it should be capable of responding to and recording the polarization state of incident light. The magnitude of the photoinduced birefringence is a key parameter, as higher values lead to greater diffraction efficiency of the polarization diffraction gratings recorded in the material. Azobenzene-containing polymers are therefore widely used as recording media in polarization holography, since they can generate relatively large photoinduced birefringence, enabling the formation of highly efficient polarization-selective holographic gratings. Upon irradiation with polarized light within the absorption band of azobenzene, the azobenzene moieties undergo repeated trans–cis–trans photoisomerization cycles. As a result of these processes, the chromophores gradually reorient in a direction perpendicular to the polarization of the incident light [21,22,23]. This anisotropic alignment of azobenzene groups induces birefringence in the material, which can be spatially modulated with high resolution across the surface of the optical element. A widely used commercial azopolymer for polarization holography is PAZO (poly[1-4-(3-carboxy-4-hydroxyphenylazo)benzenesulfonamido]-1,2-ethanediyl, sodium salt). This material is frequently employed by numerous research groups due to its high photoinduced birefringence and the large amplitude of the surface relief gratings that can be recorded within it [21,23]. Furthermore, the solubility of PAZO in water and methanol facilitates the preparation of nanocomposite materials.
Digital holography can be extended to enable the recording and reconstruction of the complete optical wavefront, including amplitude, phase, and polarization [24]. This capability has led to the development of digital polarization holography (DPH), which allows both the recording and reconstruction of the polarization state of light [25]. In particular, digital polarization holographic recording using a spatial light modulator (SLM) enables precise spatial control over the phase distribution of the optical field.
Due to the growing interest in such optical elements in recent years, numerous research groups have proposed various schemes for the digital recording of polarization holograms, also referred to as polarization-selective diffractive optical elements (PS DOEs) [24,25,26,27,28]. The diffraction efficiency of the recorded PS DOE is commonly evaluated as a key performance parameter. A variety of potential applications have been demonstrated, including the fabrication of microstructures on the surfaces of optical elements [25]. However, detailed investigations of polarization diffraction gratings recorded on nanocomposite materials—and particularly on nanocomposites containing nanoparticles synthesized via green synthesis methods—using digital polarization holography have not yet been reported.
This study explores an approach for the valorization of waste materials derived from Rosa damascena and Oriental variety tobacco (Nicotiana tabacum) by synthesizing green palladium nanoparticles, which provides an ecological benefit. Investigating the application potential of these nanoparticles as a doping agent in a polymer matrix, we obtained for the first time a nanocomposite with tunable optical properties suitable for digital optical recording using green nanoparticles. As shown in a recently published comprehensive review on photoanisotropic nanocomposite materials [20], no literature data were found for PdNPs as a dopant, let alone those obtained by green synthesis. SLM-generated polarization gratings recorded on thin film samples of the azopolymer PAZO doped with PdNPs were also investigated. The objective is to improve the optical properties of a nanocomposite material containing nanoparticles produced via green synthesis, with particular emphasis on enhancing the material’s birefringence. Subsequently, the prepared nanocomposites are successfully employed for the digital recording of polarization diffraction gratings with improved optical performance.

2. Materials and Methods

Biomass harvesting and extract preparation: The hydrodistilled rose flowers (Rosa damascena Mill.) were obtained from EKOMAAT Ltd. (distillery in Mirkovo, Sofia, Bulgaria; 2024 harvest). The collection was performed after the end of the distillation. The solid material was separated from the liquid roughly in the distillery by a screw conveyor and further by filtration through a cloth (200 mesh size). The solids were dried in a laboratory oven at 60 °C (final aw 25 °C = 0.461 ± 0.017; the water activity was measured using Labmaster aw Neo, Novasina, Lachen, Switzerland). The tobacco (Nicotiana tabacum L.) waste—stems and remaining leaves—was obtained from the experimental fields of the Tobacco and Tobacco Products Institute (Markovo, Plovdiv, Bulgaria; 2025 harvest) after collection of the usable leaves. The material was cut into pieces of 25–30 cm, dried (final aw 25 °C = 0.411 ± 0.142), and shredded with a garden shredder. Both materials were further milled with a laboratory grain-milling machine and sieved. For extraction, the fraction with mesh size 350–450 μm was used.
The extraction of the raw materials (Rosa damascena Mill. or tobacco) was performed at a ratio of extractant to solid waste = 20:1. Then, 10 g of the residues was placed in a conical flask and 200 mL of deionized water was added. The mixture was heated for 1 h at 100 °C and filtered through a cloth (mesh size 100). The residue was extracted again at the same conditions with 50 mL of deionized water and filtered again. The combined filtrates were stored at −18 °C prior to analysis and nanoparticles synthesis.
Determination of monosaccharide composition and protein content: The quantities of galactose, rhamnose, glucose, arabinose, xylose, galacturonic acid, and glucuronic acid (Merck KGaA, Darmstadt, Germany) were determined on the chromatographic system ELITE LaChrome (Hitachi, Tokyo, Japan) high-performance liquid chromatography (HPLC) with a VWR Hitachi Chromaster 5450 refractive index detector using an Aminex HPX-85H (Bio-Rad Laboratories, Inc., Hercules, CA, USA) column. The samples and standards were eluted with 5 mM H2SO4 (Merck KGaA, Darmstadt, Germany) at an elution rate of 0.5 mL/min, column temperature of 50 °C, and detector temperature of 35 °C. The xylose was determined in a separate run with the same chromatographic system using the Sugar SP0810 (Shodex®, Showa Denko, Tokyo, Japan) column. The samples and standards were eluted with ultrapure water at an elution rate of 1.0 mL/min, column temperature of 85 °C, and detector temperature of 35 °C.
The protein content was determined by the Bradford method [29] using an AMRESCO E535-KIT (AMRESCO, Solon, OH, USA) and bovine gammaglobulin for preparation of the standard curve. One hundred μL of the extract was mixed with 1 mL of the Bradford reagent and vortexed; after waiting 2 min, the absorption at 595 nm with a 1 cm cuvette was read.
Individual phenolic acids and flavonoids: Analysis of individual phenolic acids and flavonoids in extract was performed by HPLC with a UV–VIS detector (Waters, Milford, MA, USA), as described [30]. A total of 20 µL of extract was injected into the C18 column (Supelco Discovery HS; 5 μm, 25 cm × 4.6 mm; Merck KGaA, Darmstadt, Germany) and eluted with 1% acetic acid (Phase A) and methanol (Phase B) in gradient conditions at a 1.0 mL/min flow rate [31]. The gallic, protocatechuic, vanillic, syringic, p-coumaric, and salicylic acids (+)-catechin and (+)-epicatechin (Merck KGaA, Darmstadt, Germany) were detected at λ = 280 nm, whereas the rosmarinic, chlorogenic, neochlorogenic, caffeic, 3,4-dihydroxy-benzoic, and ferulic acids rutin, quercetin, myricetin, and kaempferol (Merck KGaA, Darmstadt, Germany) were detected at λ = 360 nm. Quantification was completed using retention times and calibration curves of polyphenol standards.
Statistical analysis: The experimental data (three replications) are presented as mean value ± standard deviation. For analysis, Student’s t-test (p < 0.05) was used with Microsoft Excel 2013 (additional XL Toolbox NG module installed).
PdNP green synthesis: Palladium dichloride (anhydrous, 60% palladium basis; Merck KGaA, Darmstadt, Germany) was used for the preparation of a 0.1 M water solution. Prior to synthesis, 1 mL of concentrated hydrochloric acid (Merck KGaA, Darmstadt, Germany) was added to 30 mL of 0.1 M PdCl2, and the suspension was mixed until dissolution of the PdCl2 (around 40 min), with a final concentration of 0.097 M PdCl2.
The PdNPs were synthesized as follows: 3 mL of water extract of the solid residues was added to 6 mL of 0.097 M PdCl2 in a centrifuge tube. The tube was closed, and the mixture was heated in a laboratory oven for 2 h at 95 °C. Similarly (but for 24 h at 95 °C), the experiment for the synthesis of PdNPs was performed using bovine serum albumin (BSA, (AMRESCO, Solon, OH, USA)) at 300 μg/mL; a mixture of 14 mono- and disaccharides (lactose, cellobiose, maltose, D-glucose, D-fructose, L-rhamnose, D-mannose, D-xylose, D-galactose, L-fucose, D-ribose, D-arabinose, D-glucuronic acid, and D-galacturonic acid) at 300 μg/mL; D-galactose at 300 μg/mL; D-galacturonic acid at 300 μg/mL; rosmarinic acid at 300 μg/mL; and quercetin at 300 μg/mL (all compounds from Merck KGaA, Darmstadt, Germany).
Nanoparticle microstructure and phase composition characterization: The method of transmission electron microscopy (TEM, JEOL JEM 2100, 200 kV, JEOL Ltd., Tokyo, Japan) was used in order to obtain detailed information about the nanoparticles’ morphology, including their shape and size. The preparation technique comprises preliminary sonication of a suspension with green synthesized PdNPs, followed by deposition of a drop onto a copper grid covered with an amorphous thin carbon layer, and drying under ambient conditions. After this procedure, the sample was ready for direct observation under the microscope. For microstructure and phase composition analysis of NPs, the method of selected area electron diffraction (SAED) was applied. This method enables the determination of interplanar spacings, which were subsequently compared with reference data from the Match! software (version 4.1, Crystal Impact, Bonn, Germany). Additionally, energy-dispersive X-ray spectroscopy (EDX, X-ray energy dispersive spectrometer Oxford Instruments, X-MAX N 80T, High Wycombe, UK) analysis in scanning transmission electron microscopy (STEM, JEOL JEM 2100, 200 kV, JEOL Ltd., Tokyo, Japan) was utilized to verify the elemental composition of the nanoparticles. The elemental mapping was carried out to investigate the spatial distribution of elements in the NPs synthesized. Histograms of the nanoparticles distributed by their diameters were generated using the data acquired with the Image J computer program (v.1.53t) [32].
An inductively coupled plasma optical emission spectrometer (ICP-OES) (Prodigy 7, Teledyne Leeman Labs, Mason, OH, USA) equipped with a radio-frequency generator operating at 40 MHz, a high-resolution echelle optical system, and a solid-state complementary metal–oxide-semiconductor (CMOS) detector was used to determine the concentration of palladium in the suspensions. A volume of 0.1 mL from each sample was dissolved in 65% nitric acid and then diluted with distilled water to a final volume of 100 mL. The values of Pd concentration in the suspensions were as follows: 1.8497 g/L and 2.2948 g/L when RD and O extract were used as reduction agents, respectively. These values were subsequently used for the controlled doping of the polymer matrix. For example, in order to obtain the 0.1 wt. % sample of PAZO + Pd NPs_O, 32 μL of the NPs suspension was added to 568 μL of distilled water containing 60 mg of PAZO.
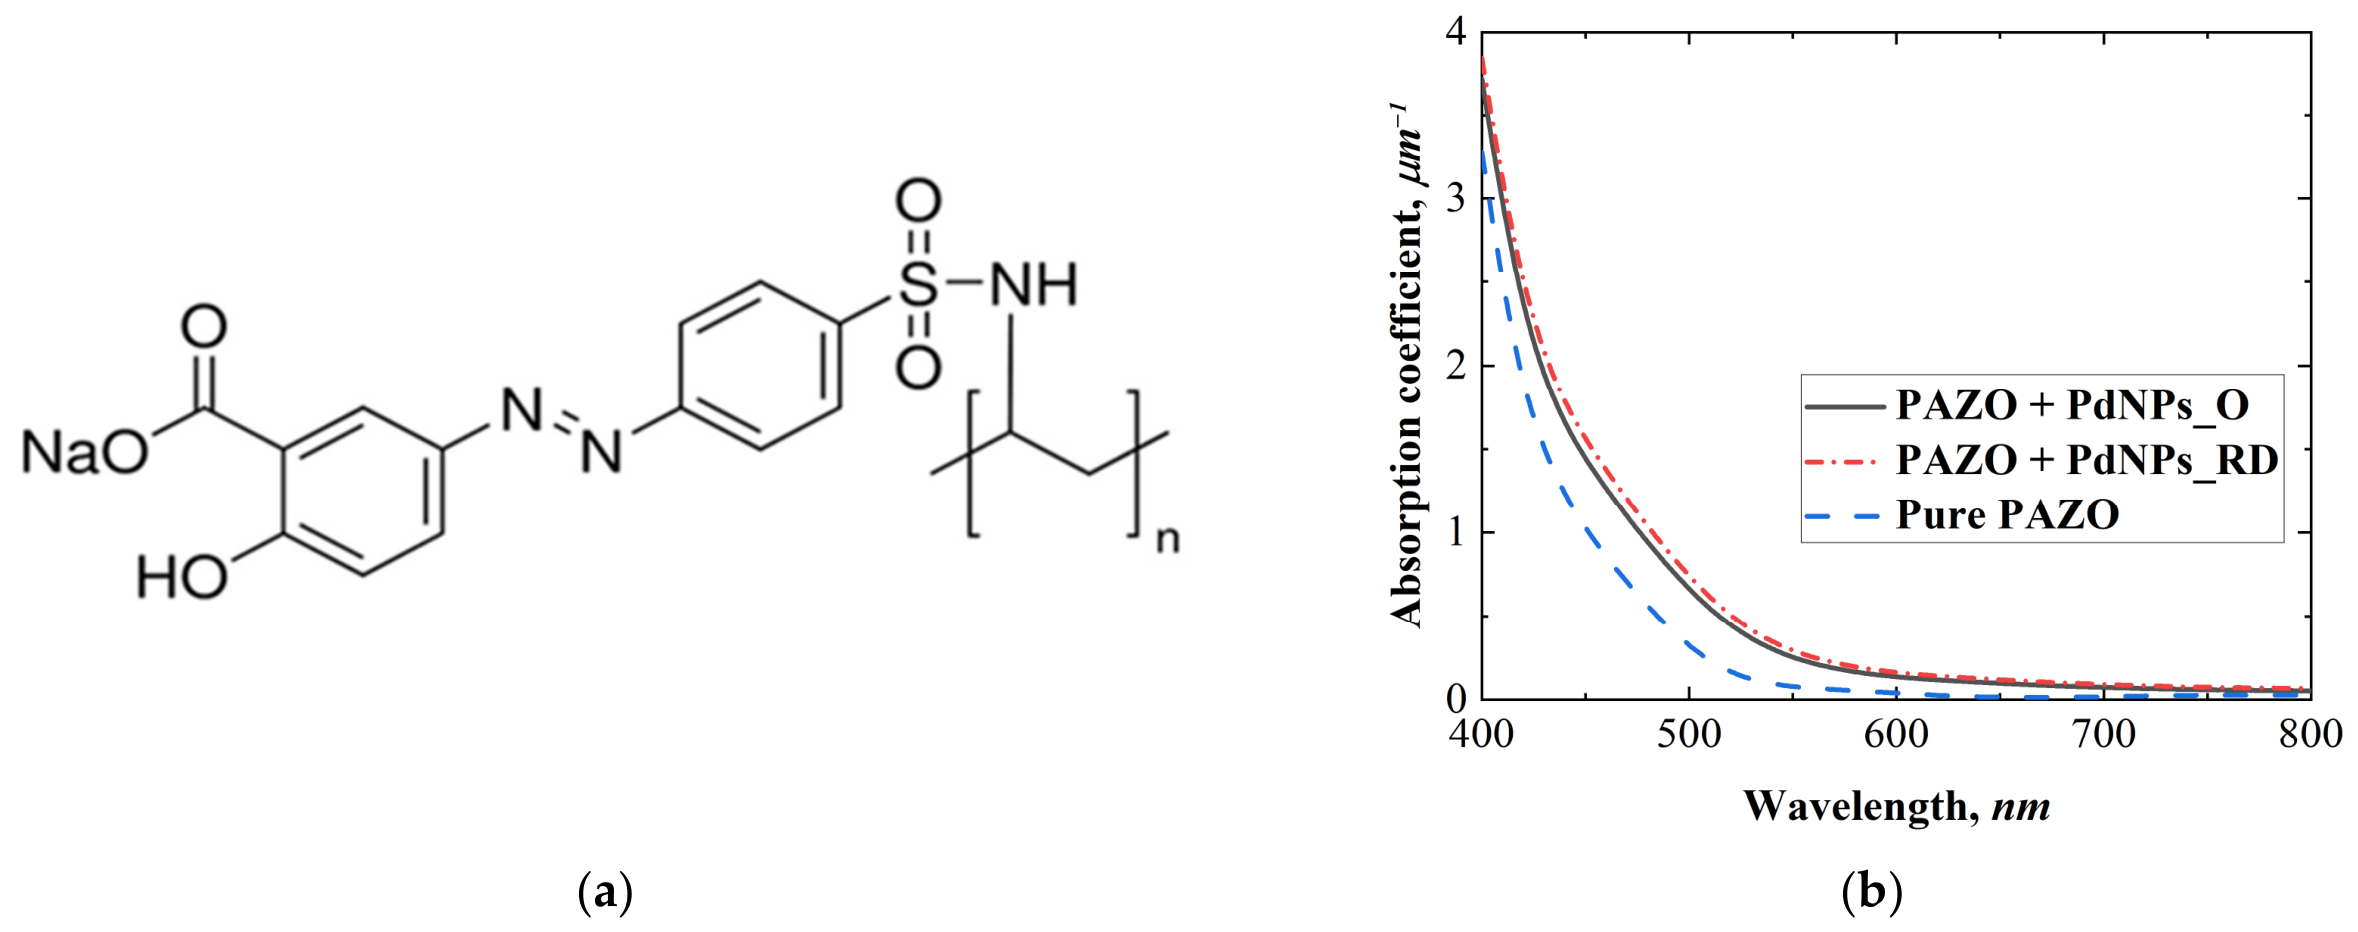
Preparation and characterization of the nanocomposite samples: For our optical applications, samples with either PdNPs_RD or PdNPs_O nanoparticles distributed in azopolymer PAZO (poly[1-4-(3-carboxy-4-hydroxyphenylazo)benzenesulfonamido]-1,2-ethanediyl, sodium salt) were prepared, the chemical structure of which is shown in Figure 1a. The polymer has been used extensively in recent decades for polarization [20,23,28] holography and is delivered by Merck KGaA, Darmstadt, Germany.
Figure 1b presents the spectra of the absorption coefficient for three thin film samples: pure PAZO and PAZO with 0.5% NPs of both PdNPs_O or PdNPs_RD. The spectral range is selected to cover the wavelengths of lasers used for recording and reading—442/444 nm and 635 nm, respectively. As seen on the graph, an increase in the absorption coefficient is observed for the films doped with NPs; this increase is more noticeable for the PdNPs_RD.
Spin-coating deposition was used as an easy and effective way of producing nanocomposite films with different NP concentrations and preselected uniform thickness. A solution of 60 mg of PAZO in 600 µL distilled water was prepared and subsequently mixed with the NP’s suspension. Enough volume of the NP’s suspension was added in order to achieve the desired NP concentration and the expected film thickness in the range of 600–1000 nm. Then, the azopolymer and NP suspensions were heated to 50 °C to ensure the complete dissolution of the azopolymer, and further homogenized using a magnetic stirrer (IKA-RET, IKA-Werke GmbH & Co. KG, Staufen, Germany). Finally, the thin films were deposited on glass slides via spin-coating at 1000 rpm (WS-650MZ-23NPPB, Laurell Technologies Corporation, Lansdale, PA, USA).
As a result, we obtained thin film samples with NP concentrations of 0.1, 0.2, 0.25, 0.3, 0.4, and 0.5 wt. % for both PdNPs_RD and PdNPs_O, in addition to 1 wt. % for PdNPs_RD. For comparison, we also prepared pure (or non-doped) PAZO films with the same thickness using distilled water as a solvent. We investigated selected concentrations of both types of nanoparticles, as well as the pure polymer. However, we should note one limitation associated with the absence of extract-containing control films.
The prepared samples were optically characterized by measuring their spectra of absorbance (with UV–VIS spectrophotometer Varian Cary 5E, Varian Inc., Palo Alto, CA, USA) and reflectance (F20 Optical Thin-Film Analyzer, Filmetrics, San Diego, CA, USA). Using the reflectance spectra, we determined the thicknesses of the samples, and they are all in the range of 600–1000 nm. For each thin film sample, the thickness is determined by averaging at least 3–5 measurements across the sample. As a result, the uncertainty is below 5% in all cases. These precise values are then used to calculate the birefringence.
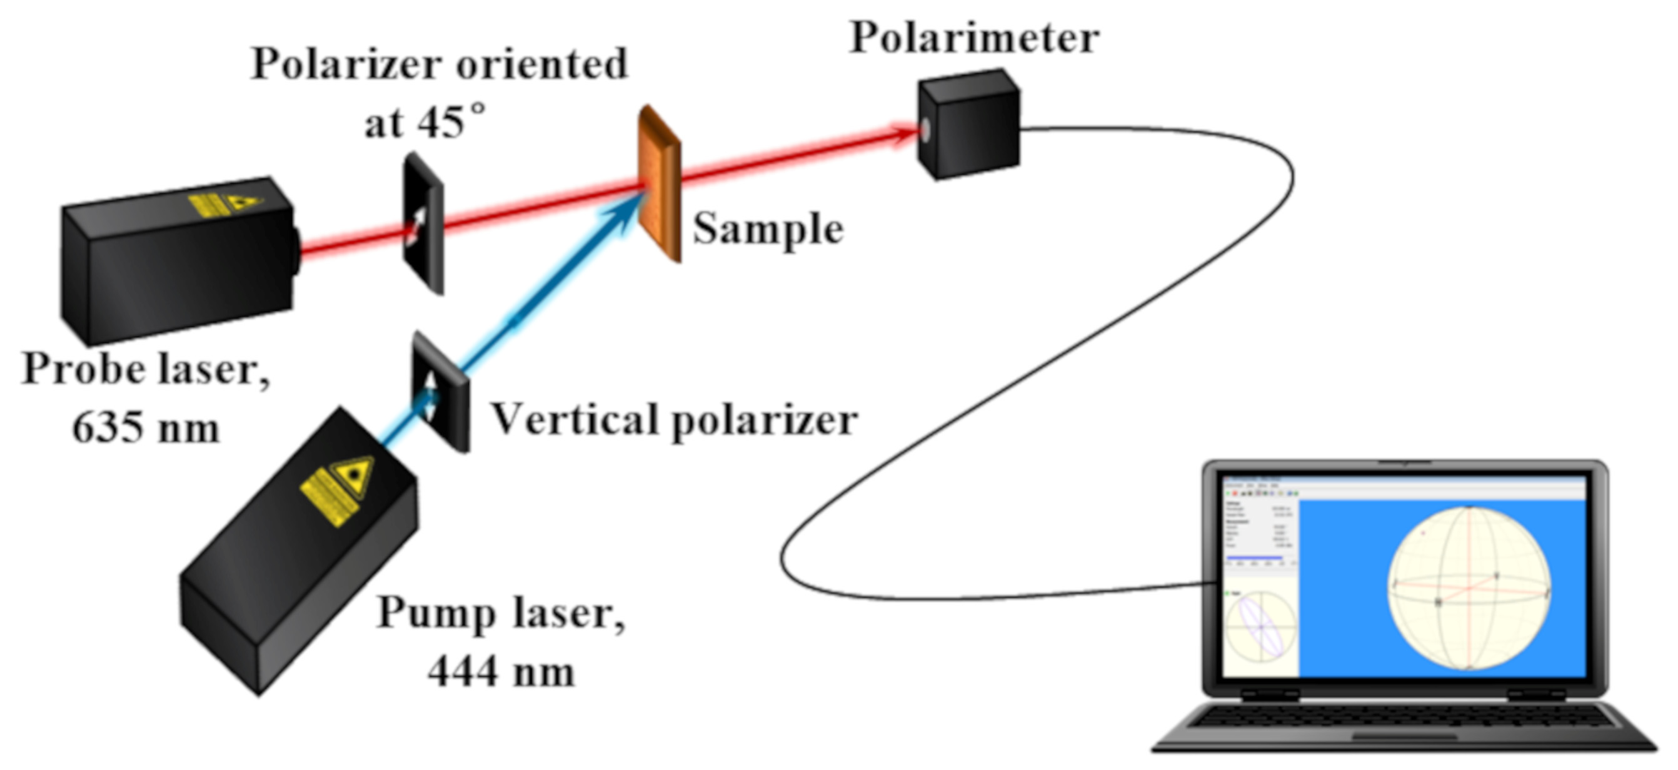
Photoinduced birefringence measurement: Following the precise measurement of the samples’ thicknesses, the photoinduced birefringence kinetics are determined for each sample using an experimental setup shown in Figure 2.
For the recording and measurement of the photoinduced birefringence, two lasers are employed, with a probe at 635 nm (B&W TEC Inc., Newark, NJ, USA) and a pump laser at 444 nm (Coherent Corp., Saxonburg, PA, USA). The pump laser provides vertically polarized light with an intensity of about 150 mW/cm2, which reorients the azo molecules in a direction perpendicular to the incident polarization. The probe laser beam incident on the sample is linearly polarized at 45°. Its polarization changes due to the anisotropy induced in the sample, and this change is monitored with a polarimeter (PAX 5710 Thorlabs Inc., Newton, MA, USA). Using the measured Stokes parameters S2 and S3 in time, we can calculate ∆n using the following formula:
n = λ 2 π d a r c t a n S 3 S 2 ,
where d is the measured thickness of the sample and λ is the probe laser wavelength. The following procedure is used for all samples: measurement of the background signal in the beginning to ensure that the samples are initially isotropic, then the pump laser is turned on, and recording continues until the process reaches saturation. At the last stage, the pump laser is turned off to measure the relaxation of the photoinduced birefringence.
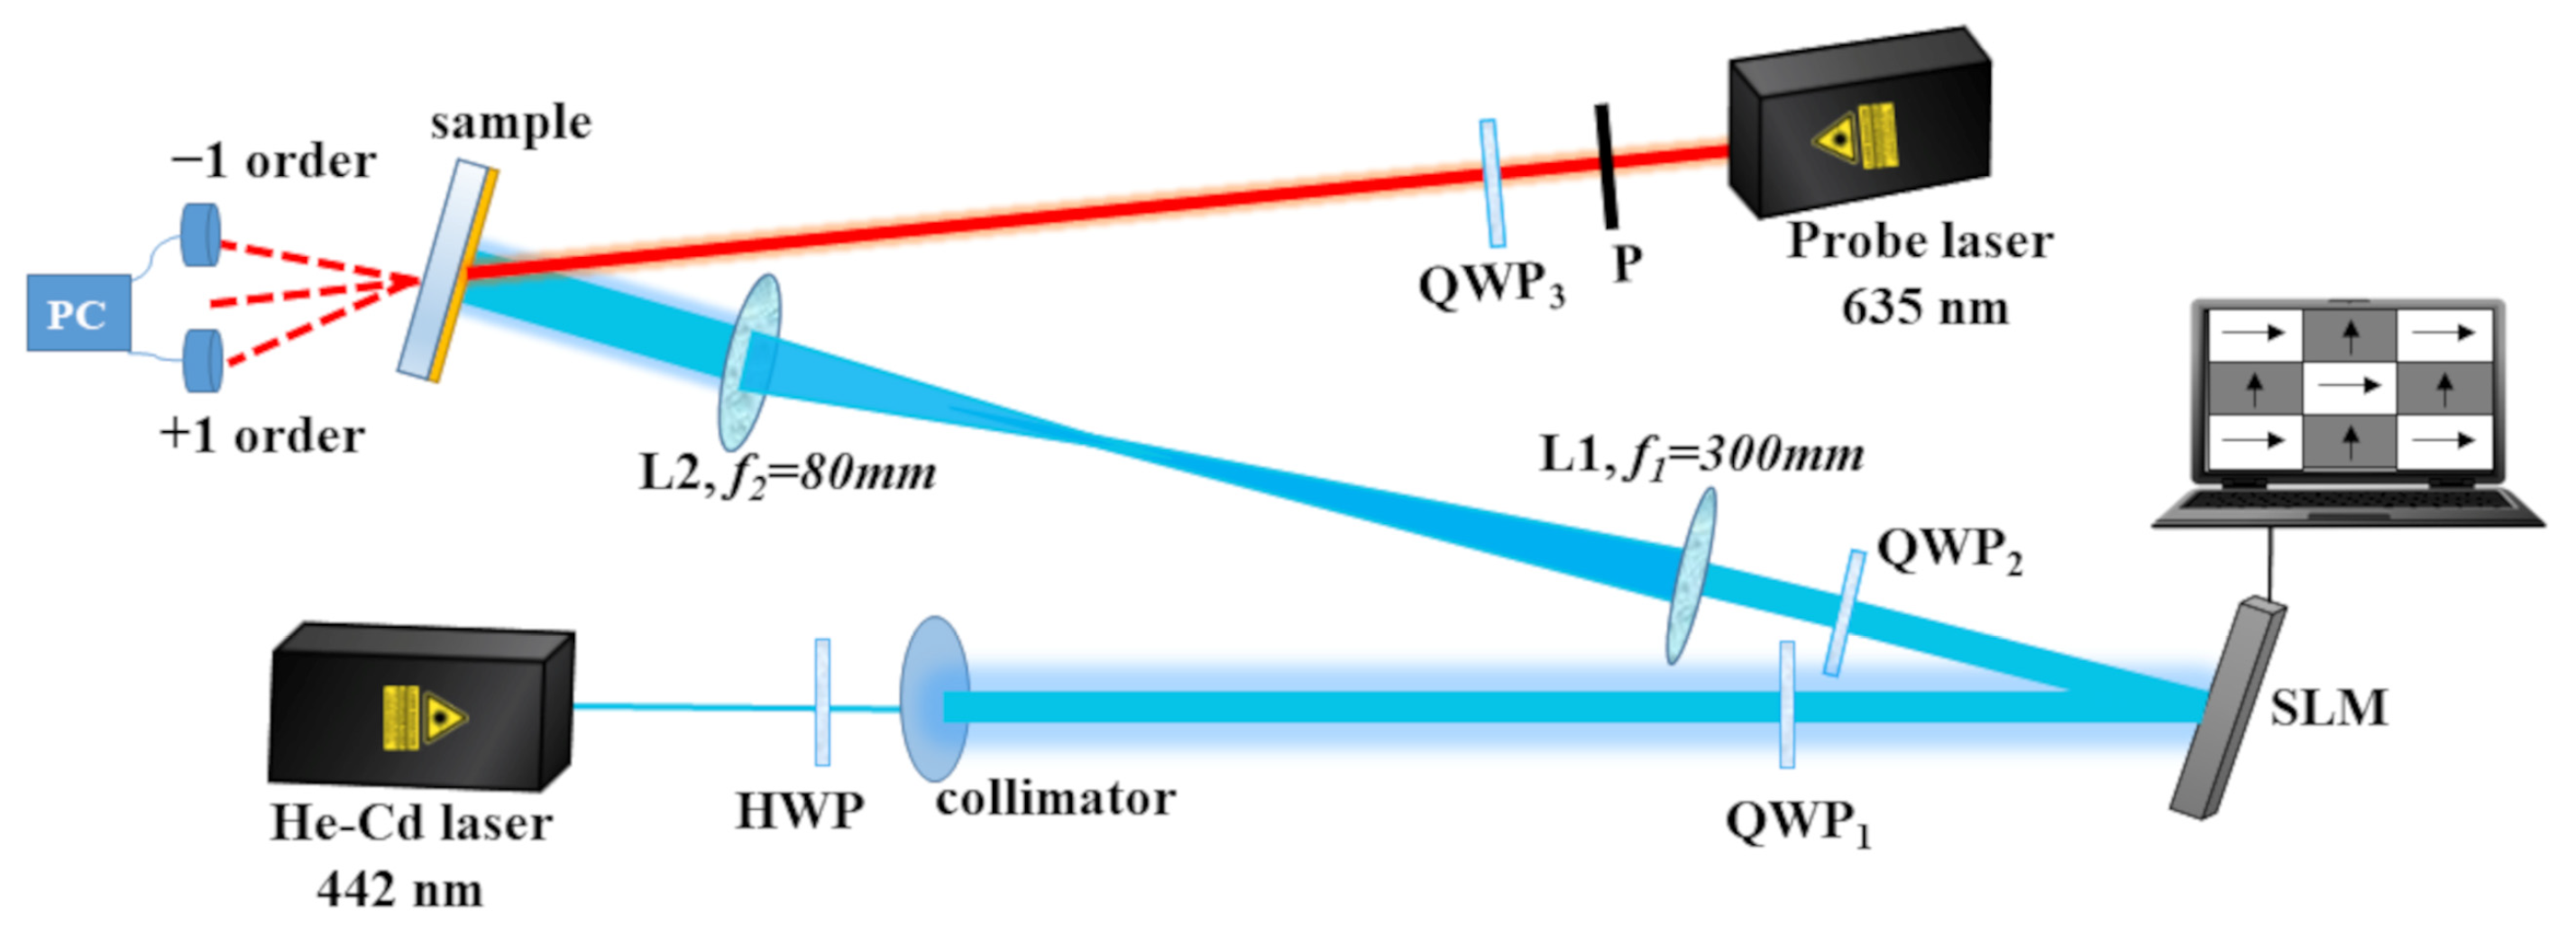
Digital Polarization Holographic Recording: The experimental optical setup is illustrated in Figure 3.
A He–Cd gas laser (IK4171I G, Kimmon Koha, Tokyo, Japan) operating at a wavelength of 442 nm is used as the light source. The beam is expanded and collimated by a collimator (C). A periodic phase pattern with a period of four pixels is encoded onto a spatial light modulator or SLM (LETO 3 SLM, Holoeye, Berlin, Germany) featuring a resolution of 1920 × 1080 pixels. Using two quarter-wave plates (QWP1 and QWP2) oriented at ±45° relative to the initial vertical linear polarization of the laser beam, the phase modulation of the SLM is converted to modulation of the polarization azimuth with a four-pixel period—more specifically with azimuth 0°, 45°, 90°, and 135°—across successive horizontal pixels. A two-lens system (L1 and L2) images the SLM onto the thin film sample with 3.75 linear reduction, i.e., to an image with ca. 6 mm2 area. The intensity of the recording beam on the sample surface is about 240 mW/cm2. A more detailed description of the optical scheme was previously described by us [28].
The recording process is carried out on thin layers of pure PAZO azopolymer samples, as well as on both types of nanocomposite samples, based on PdNPs_RD or PdNPs_O.
To quantify the optical response of the material during the recording of polarization holographic gratings (PHGs), the diffraction efficiency (DE), defined as the ratio between the intensities of the selected diffracted and the incident beam, is monitored in real time. A probe beam from a 635 nm diode-pumped solid-state laser (DPSS) is used, with circular polarization achieved by means of a polarizer and a quarter-wave plate. Measurements are performed simultaneously for both ±1 diffraction orders using two computer-controlled power meters (PM100D, Thorlabs Inc., Newton, MA, USA).

3. Results and Discussions

3.1. Chemical Composition of the Extracts and PdNP Synthesis

Previous studies for green synthesis of metal NPs [33] with plant extracts suggested that substances such as reducing sugars and polyphenols could be considered as the major reducing agents involved in the reaction of metal salt reduction. The role of the reducing agents is to donate electrons to the metal cations and convert them to NPs. The synthesized NPs have a high surface energy, and to lower it, they convert to their low-surface energy state by forming aggregates with other NPs [34,35,36]. Consequently, the presence of higher amounts of reducing and stabilizing agents could lower the formation of aggregates and direct the reaction towards NPs that are smaller in size. In addition, proteins can grip metal cations on their surfaces with functional groups such as thiol, carboxylic, etc., and contribute to the reduction process and formation of metal NPs [37].

3.1.1. Monosaccharide Composition and Protein Content of Extracts

The monosaccharide composition analyses of the aqueous extracts (Table 1) revealed the presence of seven monosaccharides: five neutral sugars (glucose, galactose, rhamnose, arabinose, and xylose) and two uronic acids (galacturonic and glucuronic acid). In the obtained extracts, the main monosaccharide is galactose with amounts ranging from 26.42 ± 0.75 to 34.56 ± 1.12 μg/mL extract. This observation, along with the amount of galacturonic acid determined, is tentatively related to the presence of pectic substances in the solid wastes. The higher amounts of neutral sugars and uronic acids in the RD extract might be due to the steam–water distillation of the rose flowers, which is industrially performed for around two hours. Galacturonic acid and rhamnose are the characteristic monosaccharides of the main chain of pectic polysaccharides. In general, it is clearly seen that the highest values for the amounts of monosaccharides were found for the RD extract. Galactose is found in higher amounts in both extracts. Xylose was present only in the RD extract. Galactose, arabinose, and xylose are characteristic monomers in the branched chains of pectin polysaccharides [37]. The amount of proteins determined in the extracts was 286.98 ± 1.97 μg/mL and 312 ± 2.12 μg/mL for RD and O extracts, respectively.

3.1.2. Polyphenolic Compounds in Extracts

In the aqueous extracts of the rose and tobacco solid residues, seven major phenolic acids were identified: rosmarinic, salycilic, gallic, ferulic, caffeic, p-coumaric, and chlorogenic acids (Table 2). Neochlorogenic acid and 3,4-dihydroxy-benzoic acid were detected only in the RD extract, while protocatechuic acid was found only in the tobacco extract. Neochlorogenic acid, rosmarinic, and 3,4-dihydroxy-benzoic acids (71.33 ± 1.14, 65.12 ± 1.74 and 41.81 ± 0.95 µg/mL, respectively) were the predominant phenolic acids in the RD extract. The tobacco extract was rich in rosmarinic, chlorogenic, and salicylic acids (315.98 ± 1.62, 74.85 ± 1.16 and 67.92 ± 1.41 µg/mL, respectively). The total amount of phenolic acids in the extracts was 239.52 µg/mL for RD and almost twice as high—511.72 µg/mL—for the O extract.
The RD extract was more than 50 times richer in flavonoids (total amount of 254.53 µg/mL) than the O extract (3.88 µg/mL), as shown in Table 2. One flavonoid glycoside (rutin) was identified in the RD extract, while in the O extract, it was present in minor (traces) amounts. Catechin and epicatechin were the predominating flavonoids (flavan-3-ols) in the RD extract. Bearing in mind that green synthesis of NPs is based on redox reactions in which the metal cations are reduced, the presence of major natural reducing agents, such as polyphenols, is important for the production of PdNPs [38]. It has been reported that when plants (Pteris vittata L.) were subjected to stress provoked by higher metal concentrations, a significant increase in chlorogenic acid derivatives and A-type procyanidin in plant roots at the contaminated site was observed [39]. Besides their pronounced antioxidant effect, the polyphenols exhibit metal chelating abilities and hence stabilize them. Such effects were observed for quercetin, a flavonoid that bears three potential bidentate binding sites (α-hydroxy-carbonyl, β-hydroxy-carbonyl, or catechol having two –OH groups in ortho positions) can form stable complexes with metals such as Mo(VI), Fe(II)/Fe(III), Cu(II), Zn(II), Al(III), Tb(III), Pb(II), and Co(II) [40]. When it comes to the in vitro synthesis of metal NPs by plant extracts, heat and pH play important roles in the production of NPs, which was observed in the current study for PdNP synthesis. Tentatively, amino groups of proteins, hydroxyl and carboxyl groups of polyphenols and amino acids, hydroxyl groups of polysaccharides, and carboxyl groups of organic acids chelate and stabilize metal ions and suppress the superoxide-driven Fenton reaction (the most important source of reactive oxygen species), leading to NP synthesis [38].

3.1.3. PdNP Synthesis

The initial experiments for PdNP synthesis were performed with 0.01 M PdCl2 at room temperature. The results revealed that no NPs were obtained (at any ratio between extracts and 0.01 M PdCl2), even after 48 h. Heating the mixture at 80 °C led to unsatisfactory results, since most of the substances observed by TEM turned out to be unreacted PdCl2. For this reason, 0.1 M PdCl2 was used after the addition of 1 mL concentrated hydrochloric acid (improving the solubility of the PdCl2), and the temperature was maintained at 95 °C. An additional experiment including both extracts, 0.01 and 0.1 M PdCl2, and mixtures of the extracts with 0.1 M PdCl2 (ratio 1:2) was performed. The pH of the O and RD extracts were 5.53 ± 0.05 and 4.62 ± 0.03, respectively, in the beginning, and after two hours of heating at 95 °C, the pH dropped insignificantly to 5.45 ± 0.04 (for O extract) and 4.55 ± 0.05 (for RD extract). For the mixtures, the initial pH values were 0.66 ± 0.04 (O extract + 0.1 M PdCl2 = 1:2) and 0.62 ± 0.05 (RD extract + 0.1 M PdCl2 = 1:2), and changed negligibly to 0.63 ± 0.03 (O extract + 0.1 M PdCl2 = 1:2) and 0.61 ± 0.02 (RD extract + 0.1 M PdCl2 = 1:2). After the end of the heating, clear formation of NPs was observed in both mixtures (extract + 0.1 M PdCl2 = 1:2), while no visual formation of NPs was observed for the 0.01 and 0.1 M PdCl2 solutions heated without the addition of reducing agents. The reproducibility of the synthesis remained sustainable between the different batches for PdNP preparation, which gave reproducible optical properties of the PAZO doped with PdNPs.
The total amount of polyphenolic compounds in both extracts is similar—515.60 µg/mL for the O extract and 494.05 µg/mL for the RD extract. Yet, the main compounds in the extracts differ, with the rosmarinic acid, (+)-catechin, and chlorogenic and neochlorogenic acids predominating, so we might tentatively “blame” these compounds as main contributors for the PdNP synthesis [41]. According to summarized results by [42] for PdNP green synthesis, the flavonoids and polyphenols are the main compounds responsible for reduction of Pd2+ to Pd0.
The amount of proteins determined in the extracts was 286.98 ± 1.97 μg/mL and 312 ± 2.12 μg/mL for the RD and O extracts—slightly higher (and significantly different) for the tobacco extract. The proteins could contribute to PdNP synthesis and further growth prevention [36,43].
The monosaccharides present in the extracts showed clear domination of the RD extract—331.76 μg/mL versus 221.91 μg/mL in the O extract. The monosaccharides determined are representative of the reducing sugars (having a free hemiacetalic carbonyl group) and could contribute to Pd2+ reduction and hence further aggregation of the PdNPs (which was observed by the TEM analysis predominantly using RD extract for PdNP synthesis) [44]. However, it seems that alkaline conditions favor the reduction abilities of sugars [45], while in our case, the mixture was strongly acidic.
In an additional experiment, bovine serum albumin (BSA), a mixture of 14 mono- and disaccharides (lactose, cellobiose, maltose, D-glucose, D-fructose, L-rhamnose, D-mannose, D-xylose, D-galactose, L-fucose, D-ribose, D-arabinose, D-glucuronic acid, and D-galacturonic acid), D-galactose, D-galacturonic acid, rosmarinic acid, and quercetin were incubated at 95 °C with 0.1 M PdCl2 (at a ratio of 1 part organic compounds:2 parts palladium chloride). The quercetin and rosmarinic acid gave visual formation of PdNPs after 40 and 60 min of heating, and BSA after 80 min. The mixture of 14 sugars gave negligible amounts of PdNPs after 24 h, while for galacturonic acid and galactose, visual observation did not support the formation of NPs. Thus, it could tentatively be considered that the polyphenolic compounds and proteins might be regarded as the primary reduction agents involved in the reduction of Pd2+. Similar conclusions were reported by Mikhailova [36].

3.2. Morphology, Microstructure, and Phase Composition of PdNPs

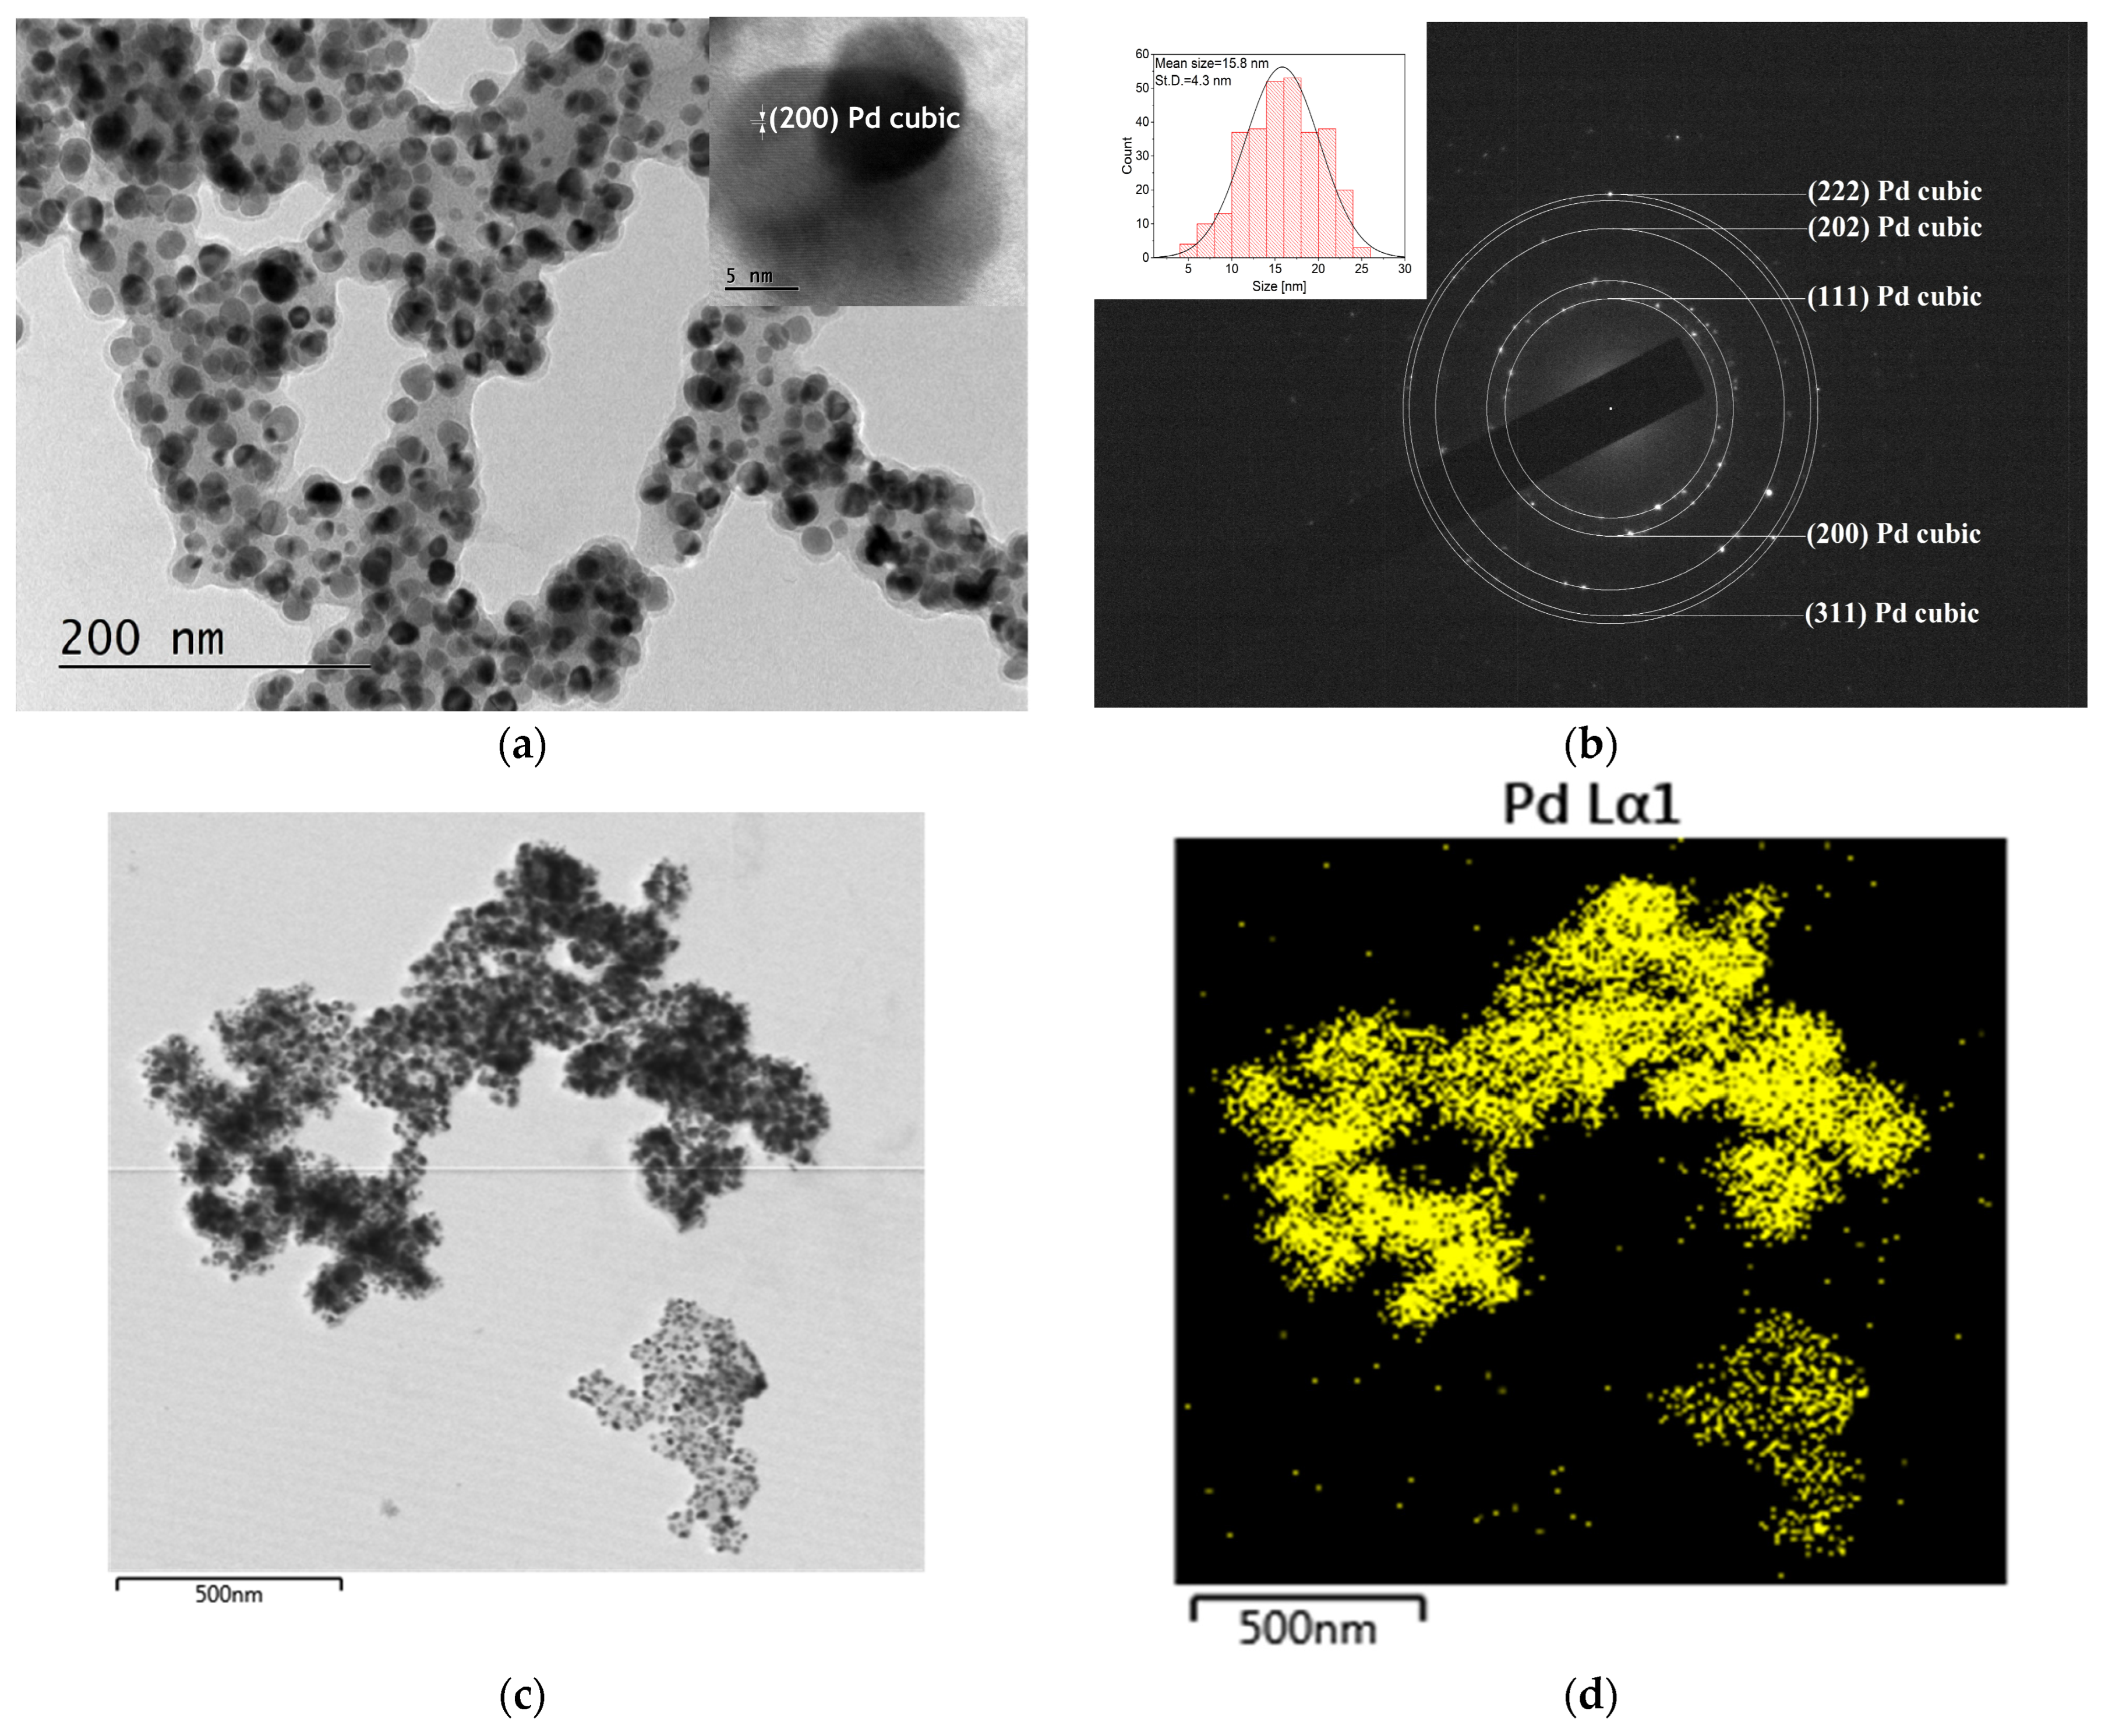
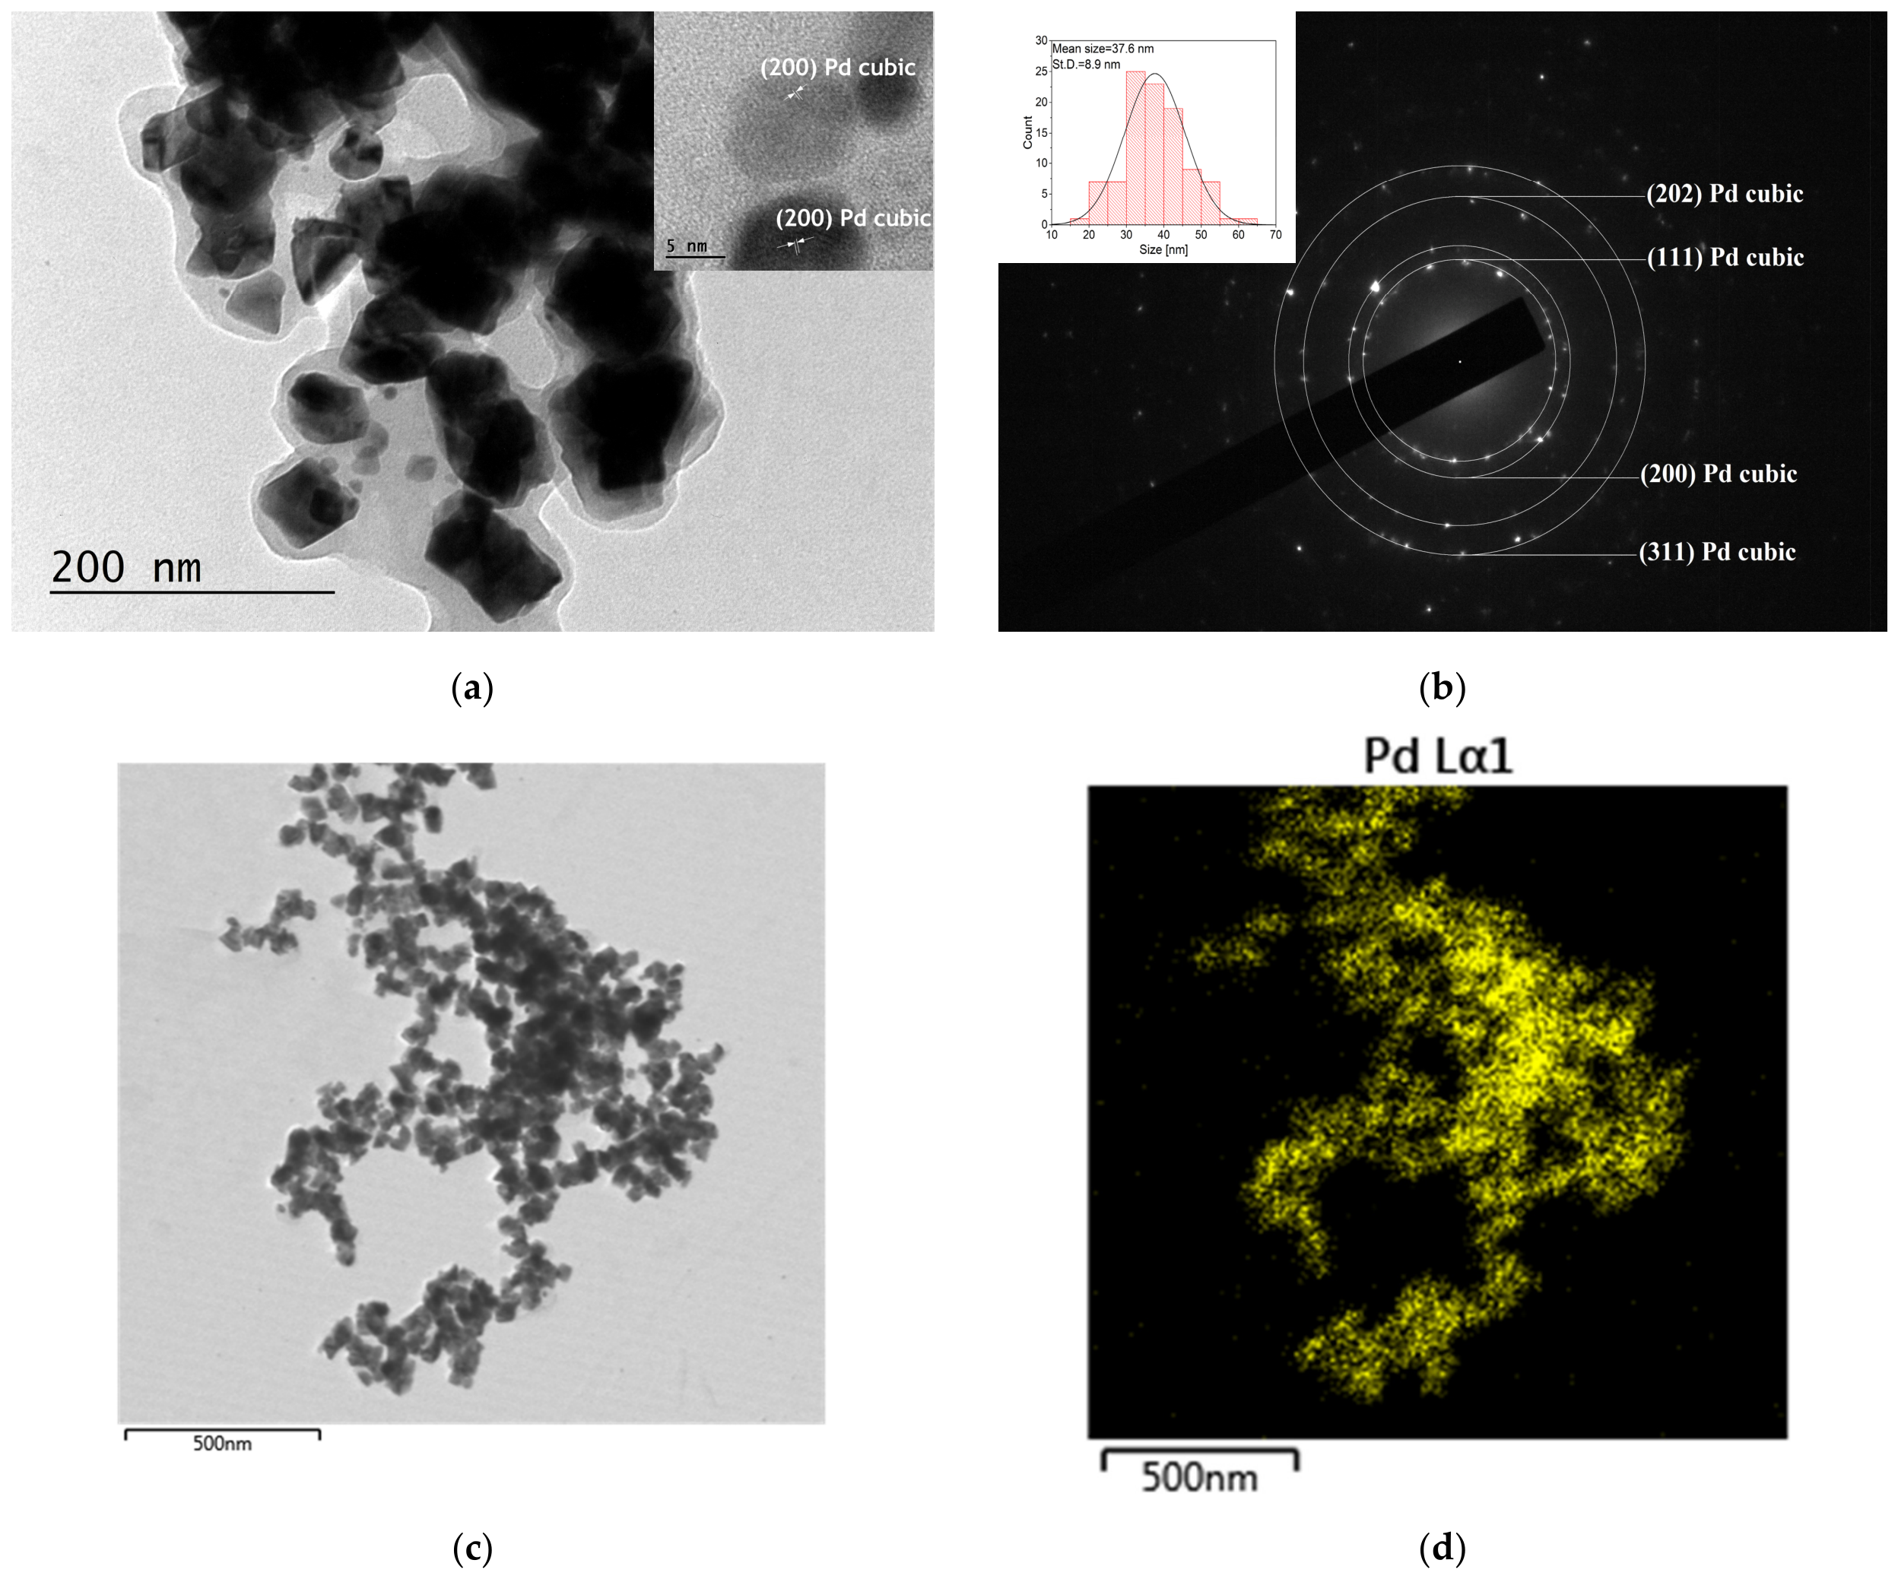
As can be seen from the BF TEM (Figure 4a), PdNPs synthesized with a reducing agent extract of RD grow with very different shapes—spherical, cube-like, and pyramidal. Although a strong tendency toward particle aggregation is observed, the TEM images still contain clusters whose approximated spherical diameters can be measured, and the histogram of their size distribution can be presented, as shown in the inset of Figure 4b. It was found that the particle size varies in the range from 15 nm to 65 nm and obeys a Gaussian distribution with a mean value of 37.6 nm. In contrast to PdNPs_RD, in the synthesis with the O extract, the population of PdNPs is quite similar by shape (Figure 5a). Spherical particles dominate, and they are relatively separated from each other in the clusters. The size distribution (inset in Figure 5b), ranging from 5 to 30 nm, follows a Gaussian law and shows that the particles are smaller compared with the ones synthesized by the RD extract, possessing an average diameter of 15.8 nm.
The NPs in both samples, PdNPs_RD and PdNPs_O, are enveloped by a low-contrast matrix, probably from the organic compounds identified in the extracts. The corresponding SAED patterns (Figure 4b and Figure 5b) of the two samples show the polycrystalline structure of the nanoparticles. The indexing of the electron diffraction patterns (Figure 4b and Figure 5b) showed several interplanar spacings—d(111) = 2.23 Å, d(200) = 1.93 Å, d(220) = 1.36 Å, d(311) = 1.16 Å, and d(222) = 1.11 Å, and together with the measured interplanar distance of d(200) = 1.93 Å in HRTEM images (Figure 4a and Figure 5a insets) reveal the presence of Pd face-centered cubic phase (COD Entry #96-901-3417, Pd cubic, cell parameters a = 3.85900 Å, S.G. Fm-3m). Additionally, the obtained EDX elemental mapping reveals a uniform distribution of Pd throughout the nanostructures, confirming the successful formation of Pd nanoparticles, as shown in Figure 4c,d and Figure 5c,d. The presence of Pd atoms only and the formation of a pure Pd cubic phase in the nanoparticles unequivocally demonstrates that the green synthesis was successfully carried out.

3.3. Optical Properties of PAZO Doped with PdNPs_RD and PdNPs_O

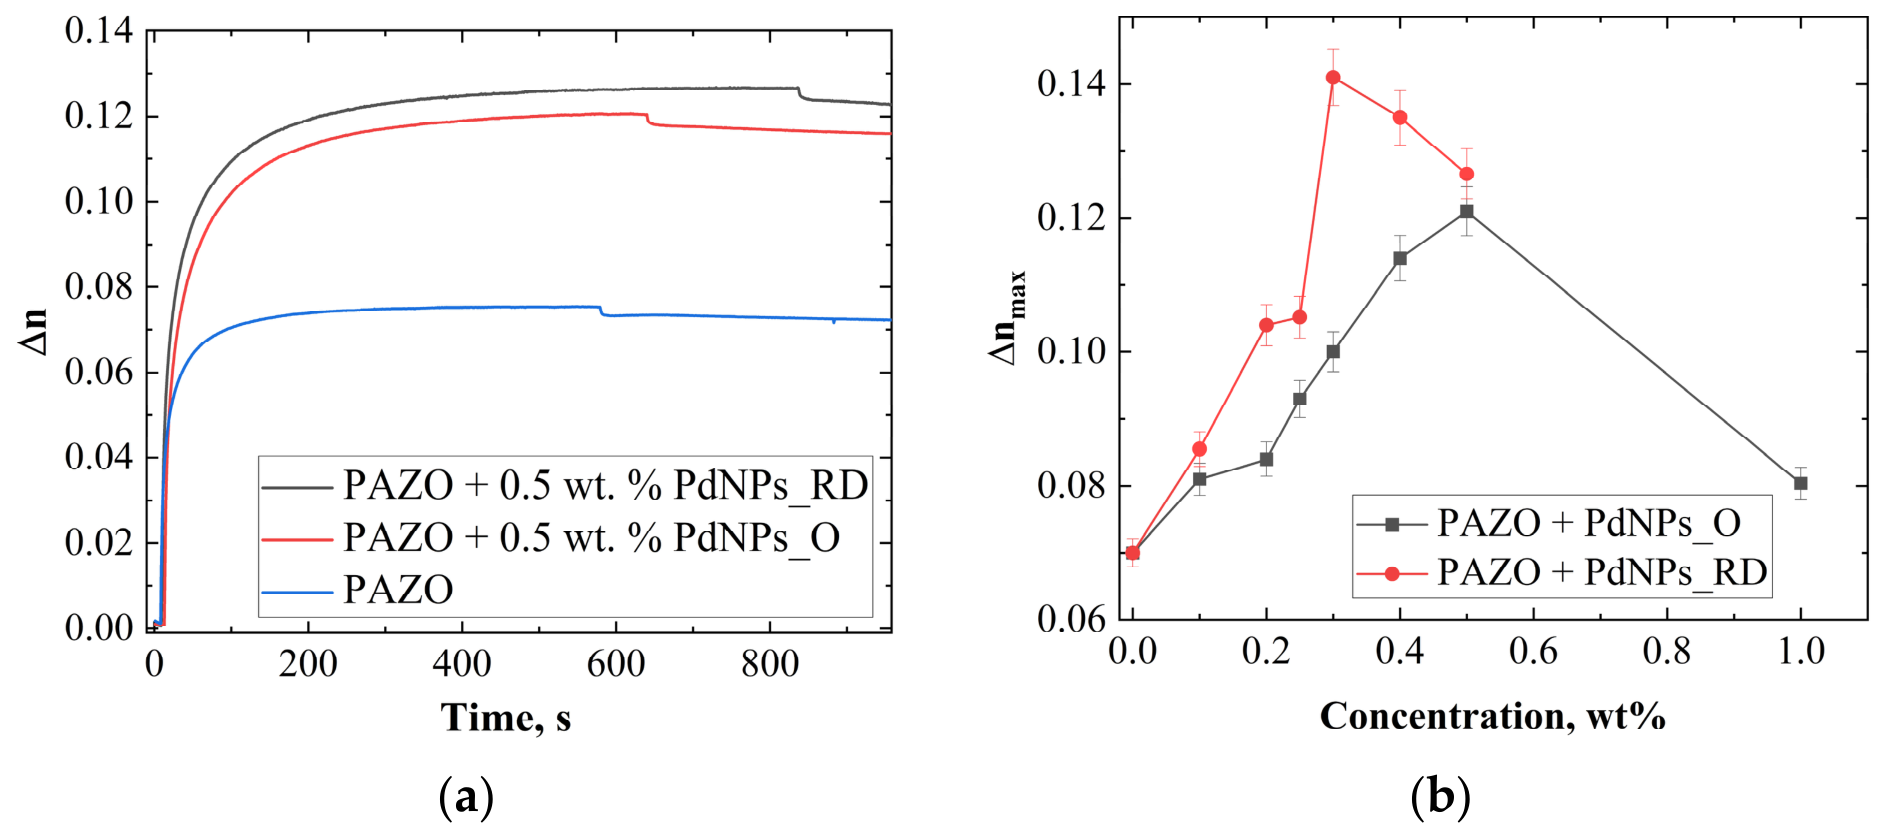
From the time-dependent curves (Figure 6a), we determine the maximal birefringence of ∆nmax for every sample, and thus, we build the dependence of the maximal birefringence on the concentration of the NP. These dependencies for both samples, PdNPs_O and PdNPs_RD, are shown in Figure 6b.
There are several hypotheses about how doping the azopolymer with NP could improve its response. One of them is based on the concept of the free volume formed in the vicinity of the NPs, which improves the mobility of the polymer chains. Based on earlier studies [20], there is an optimal concentration of the NP which leads to maximal photoinduced birefringence ∆n. As seen from the graphs, the nanocomposite samples show an enhancement of the ∆n in comparison to the non-doped films. For both types of NPs, we observe a single peak of enhancement, which is characteristic for nanoparticles with an approximately spherical shape, as previously reported [19,20]. For the PdNPs_O-based nanocomposites, the peak is at 0.5 wt. %, while the PdNPs_RD nanocomposites peak at 0.3 wt. %.
After investigating birefringence and observing the achieved enhancement upon the addition of both types of Pd nanoparticles, we were encouraged to continue our research in the field of digital polarization holography by recording a periodic polarization pattern and monitoring the diffraction efficiency in real time.
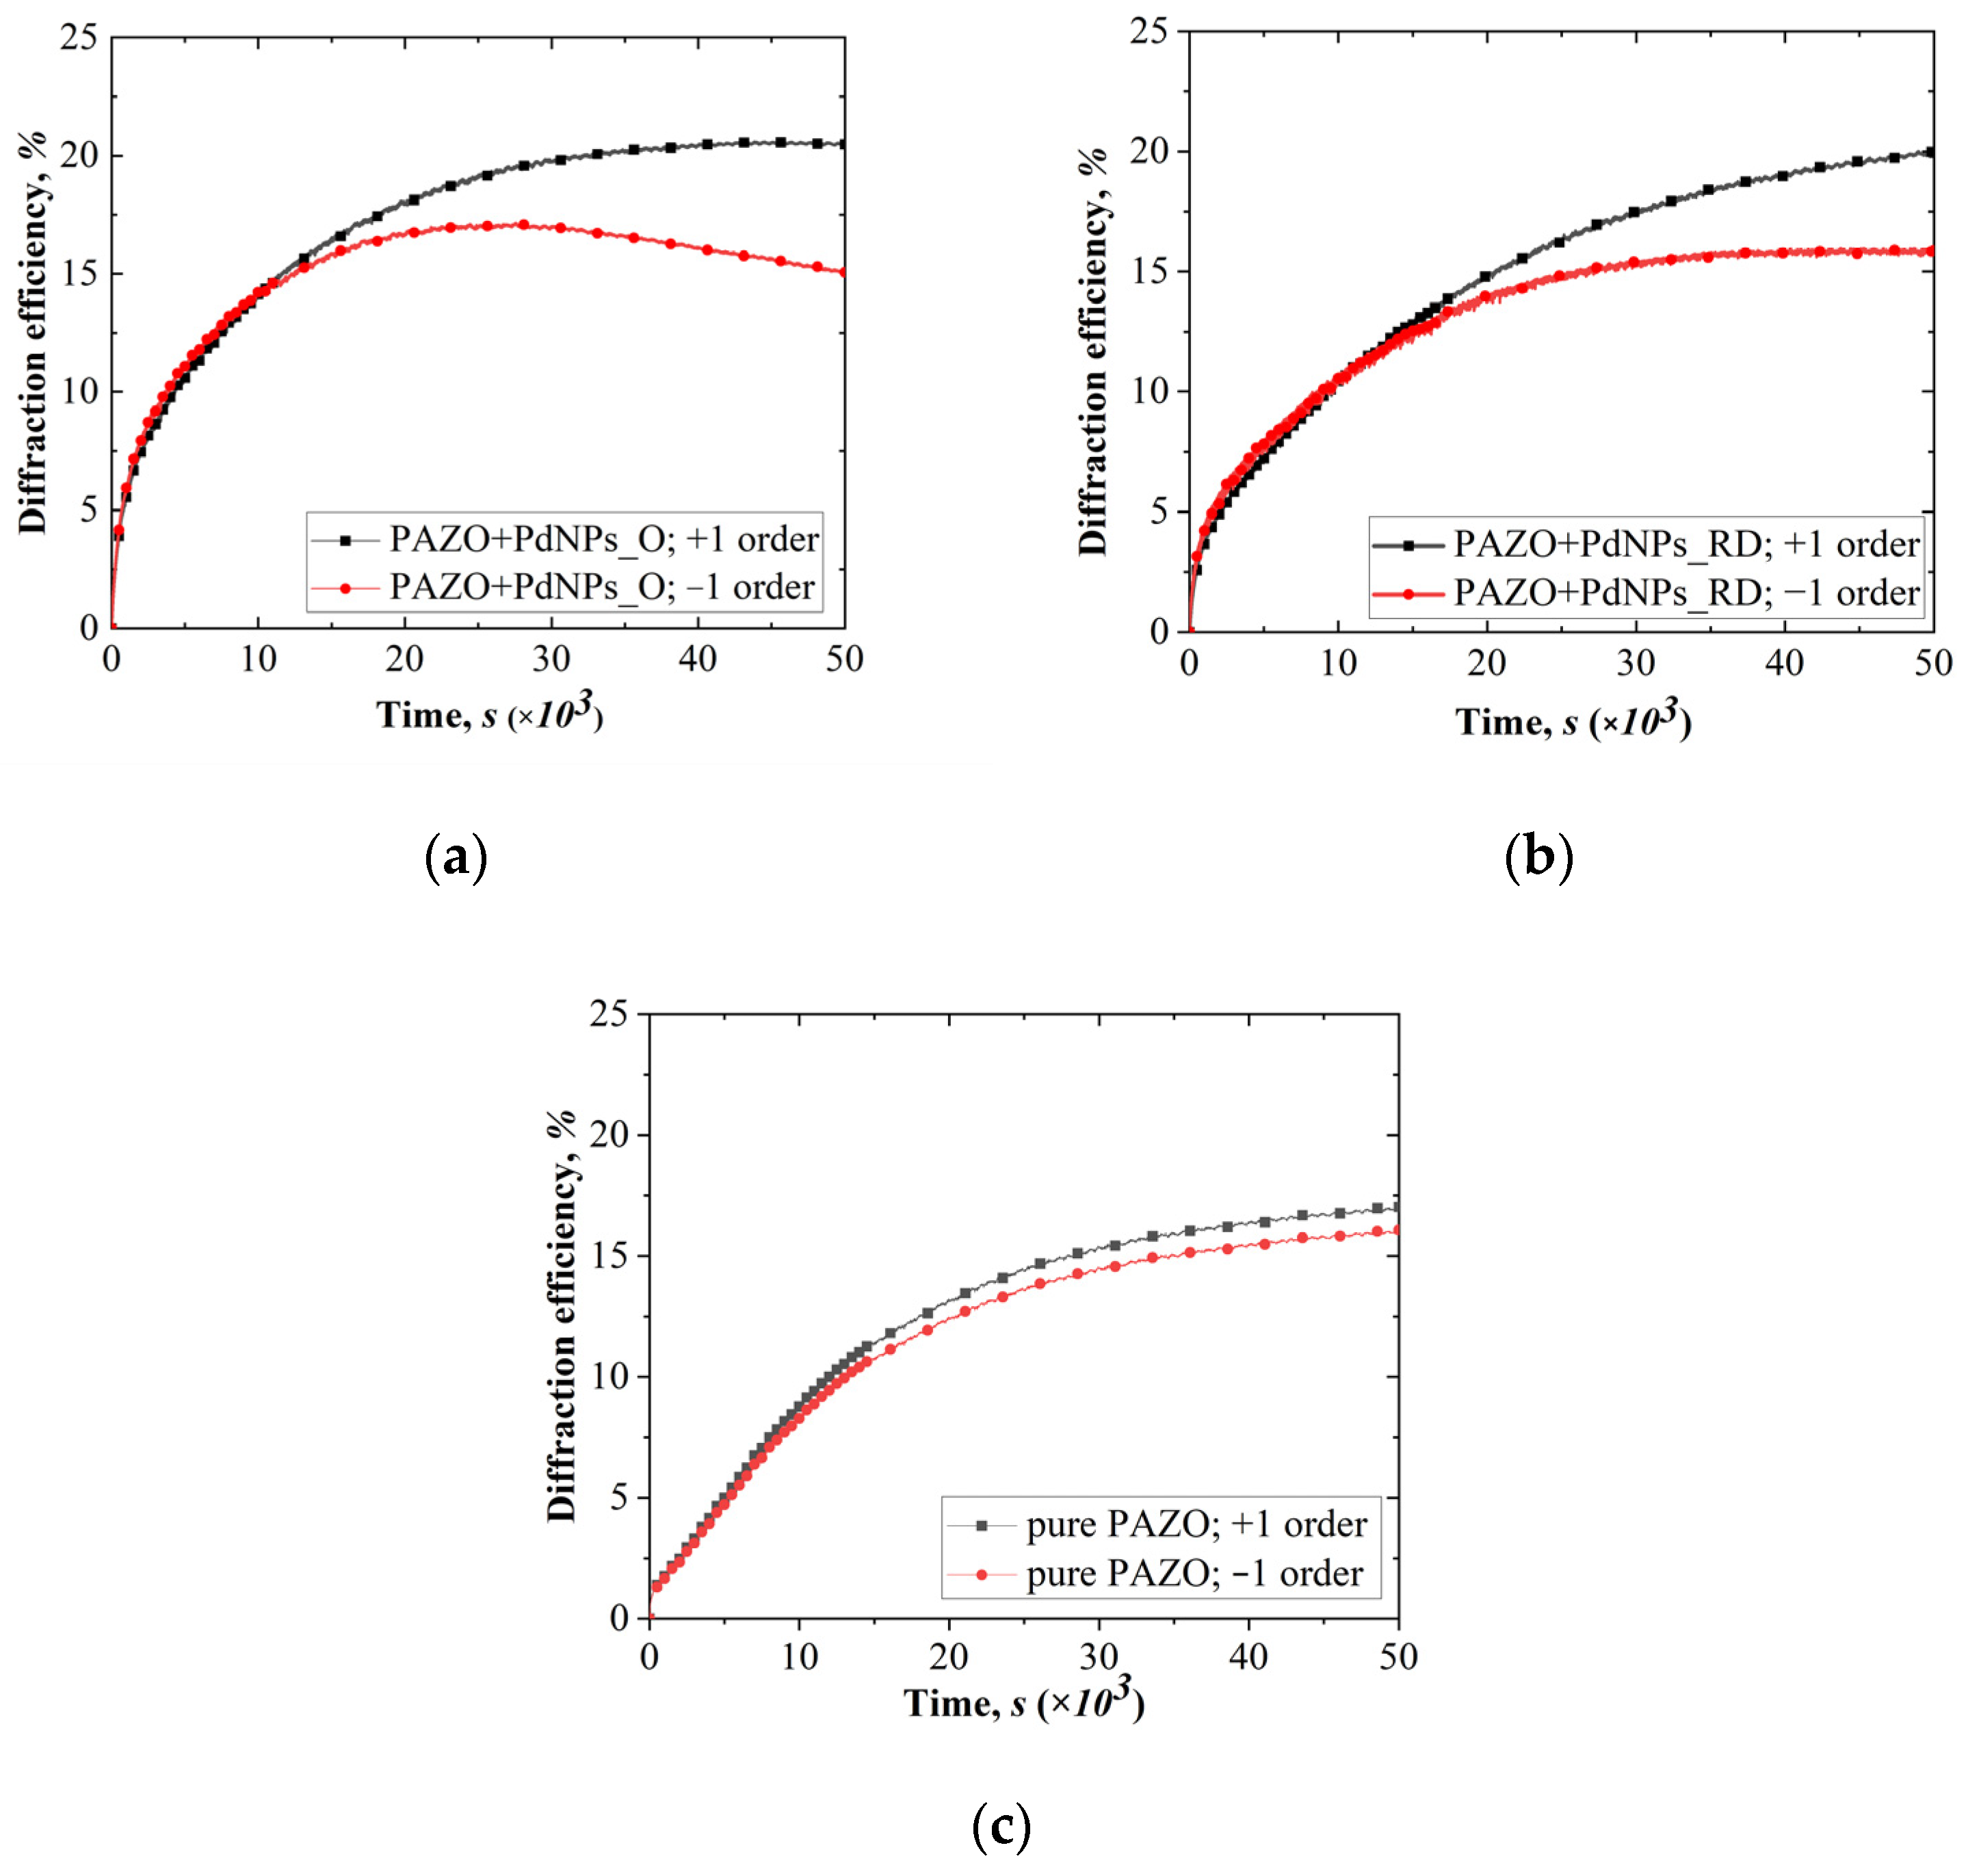
Employing the optical setup for digital polarization holography illustrated in Figure 3, we recorded polarization holographic grating from the azopolymer film side (pure PAZO and both nanocomposite samples—PdNPs_O and PdNPs_RD). Figure 7 shows the time evolution of the diffraction efficiency (DE) for the ±1 diffraction orders measured during the inscription of the PHG for all samples. As can be seen from the obtained DE kinetic curves in Figure 7a, for recording on the nanocomposite materials doped with PdNPs_O, the maximum diffraction efficiency in the +1 order is approximately 20.6%, and 17.1% for the −1 order. The DE kinetics for the PdNPs_RD-doped nanocomposite, shown in Figure 7b, indicate peak values of 21.2% (+1 order) and 15.9% (−1 order). For comparison, Figure 7c displays the DE behavior of the pure PAZO sample. Overall, both nanocomposite materials exhibit higher maximum diffraction efficiencies than the pure PAZO azopolymer, as summarized in Table 3.
The increase in the DE values obtained for the nanocomposite samples is in good agreement with the birefringence data shown in Figure 6. During the polarization recording, two types of diffraction gratings with the same period are formed in the azopolymer samples: a polarization-selective grating in the volume of the film and a surface relief grating with scalar properties. The differences in the values of diffraction efficiencies for the +1 and −1 orders in the photoanisotropic samples are due to the presence of the polarization-selective grating in the volume.

4. Conclusions

The potential for the valorization of waste materials derived from Rosa damascena and Oriental tobacco (Nicotiana tabacum) through the synthesis of green Pd nanoparticles has been demonstrated in this study. The contents of polyphenols, flavonoids, monosaccharides, and proteins in aqueous extracts from these plant wastes have been determined. The extracts were subsequently used as reducing agents for the synthesis of PdNPs from palladium salts. The results suggest that polyphenolic compounds might be regarded as the primary reducing agents involved in the synthesis of PdNPs.
In view of potential applications of the green-synthesized Pd nanoparticles, nanocomposite materials based on the azopolymer PAZO were developed, exhibiting increased photoinduced birefringence. A possible hypothesis for the improved optical response is the free volume formed in the vicinity of the NPs, which enhances the mobility of the polymer chains. As previously suggested by Nazarova et al. in [20], another proposed mechanism explaining the enhanced optical response of doped azopolymers is scattering. In our studies of the absorption spectra of both doped and undoped samples (Figure 1b), no significant changes outside the absorption band were observed as a result of nanoparticle doping, indicating that scattering from the nanoparticles is relatively low. Higher maximal values of the photoinduced birefringence were observed for nanocomposites based on the azopolymer PAZO and PdNPs_RD, and the optimal concentration of the NPs was determined. This enabled the digital recording of polarization diffraction gratings with enhanced optical performance. It has been established that the polarization gratings recorded in the nanocomposite layers have higher diffraction efficiency compared to the undoped PAZO films.

Author Contributions

Conceptualization, methodology, validation, formal analysis, investigation, B.G., A.S., M.K., I.H., D.K., D.N., L.N., N.B.-B., and G.M.; resources, A.S., B.G., D.K., and N.B.-B.; data curation, B.G., A.S., D.K., N.B.-B., D.N., and L.N.; writing—original draft preparation, B.G., A.S., D.N., L.N., and N.B.-B.; writing—review and editing, B.G., A.S., D.K., D.N., L.N., and N.B.-B.; supervision, B.G. and D.K.; project administration, A.S., N.B.-B., and G.M.; funding acquisition, A.S., N.B.-B., and G.M. All authors have read and agreed to the published version of the manuscript.

Funding

A.S., I.H., and M.K. acknowledge the financial support from the National Science Fund of Bulgaria; project KΠ-06-H87/13 from 6 December 2024 “Complex valorization of by-products and waste from the tobacco industry”. N.B.-B., D.N., and L.N. acknowledge the financial support by the Bulgarian National Science Fund (BNSF) under contract KΠ-06-H88/2. N.B.-B. acknowledges the support of the European Regional Development Fund under the “Research, Innovation and Digitization for Smart Transformation” Programme 2021–2027, through Project BG16RFPR002-1.014-0006 “National Centre of Excellence Mechatronics and Clean Technologies.” G.M. acknowledges the financial support from the Bulgarian Ministry of Education and Science under the National Research Programme “Young scientists and postdoctoral students-2”.

Institutional Review Board Statement

Not applicable.

Informed Consent Statement

Not applicable.

Data Availability Statement

Data is contained within the article.

Acknowledgments

Research equipment of Distributed Research Infrastructure INFRAMAT, part of the Bulgarian National Roadmap for Research Infrastructures, supported by the Bulgarian Ministry of Education and Science, was used in this investigation. We would like to thank Vasil Georgiev, (Laboratory of Cell Biosystems, Institute of Microbiology, Bulgarian Academy of Sciences, 139 Ruski Blvd., 4000 Plovdiv, Bulgaria) for determination of phenolic acids and flavonoids in extracts.

Conflicts of Interest

The authors declare no conflicts of interest.

Abbreviations

The following abbreviations are used in this manuscript:
RDRosa damascena Mill.
OTobacco Oriental variety, Oriental tobacco
PdNPsPalladium nanoparticles
PdNPs_RDPalladium nanoparticles synthesized by Rosa damascena Mill. extract
PdNPs_OPalladium nanoparticles synthesized by tobacco Oriental var. extract

References

  1. Liu, Z.; Wang, J.; Wang, C.; Wang, Q.; Li, J.; Han, C.; Lu, Z. Green hydrothermal valorization of Rosa damascena Mill. floral waste into functional carbon dots for anti-inflammatory nanomedicine. Ind. Crops Prod. 2025, 236, 122115. [Google Scholar] [CrossRef]
  2. Yeddes, W.; Reguez, S.; Rebey, I.B.; Wannes, W.A.; Majdi, H.; Dakhlaoui, S.; Sawsen, S.; Msaada, K.; Tounsi, M.S. Valorisation of hydrodistillation by-products from Damask Rose (Rosa damascena): Extraction, characterization, and bioactivity of phenolic compounds with biological properties. Int. J. Environ. Health Res. 2025, 35, 3546–3554. [Google Scholar] [CrossRef] [PubMed]
  3. Dinkova, R.; Vardakas, A.; Dimitrova, E.; Weber, F.; Passon, M.; Shikov, V.; Schieber, A.; Mihalev, K. Valorization of rose (Rosa damascena Mill.) by-product: Polyphenolic characterization and potential food application. Eur. Food Res. Technol. 2022, 248, 2351–2358. [Google Scholar] [CrossRef]
  4. Manthos, G.; Tsigkou, K. Upscaling of tobacco processing waste management: A review and a proposed valorization approach towards the biorefinery concept. J. Environ. Manag. 2025, 387, 125942. [Google Scholar] [CrossRef]
  5. Nagargade, M.; Singh, P.; Kumar, S. Commercial crops other than vegetables for a green economy of India. In A Critical Appraisal of India’s Self-Reliance in Agriculture, 1st ed.; Rai, P.K., Sharma, N.K., Singh, V.K., Rai, A.K., Eds.; Nova Science Publishers Inc.: Hauppauge, NY, USA, 2023; pp. 103–131. [Google Scholar] [CrossRef]
  6. Zhang, W.; Pan, X.; Fu, J.; Cheng, W.; Lin, H.; Zhang, W.; Huang, Z. Phytochemicals derived from Nicotiana tabacum L. plant contribute to pharmaceutical development. Front. Pharmacol. 2024, 15, 1372456. [Google Scholar] [CrossRef]
  7. Gui, Z.Q.; Yuan, X.L.; Yang, J.; Du, Y.M.; Zhang, P. An updated review on chemical constituents from Nicotiana tabacum L.: Chemical diversity and pharmacological properties. Ind. Crops Prod. 2024, 214, 118497. [Google Scholar] [CrossRef]
  8. Dewey, R.E.; Xie, J. Molecular genetics of alkaloid biosynthesis in Nicotiana tabacum. Phytochemistry 2013, 94, 10–27. [Google Scholar] [CrossRef]
  9. Prasad, K.; Pathak, D.; Patel, A.; Dalwadi, P.; Prasad, R.; Patel, P.; Selvaraj, K. Biogenic synthesis of silver nanoparticles using Nicotiana tobaccum leaf extract and study of their antibacterial effect. Afr. J. Biotechnol. 2011, 10, 8122–8130. [Google Scholar] [CrossRef]
  10. Suharto, T.; Sudirman; Ulfa, M.; Ningsih, B.; Putri, K.; Thamsiri, P. Effect of water-methanol binary solvent system in the green synthesis of copper nanoparticles with derived from tobacco leaf extract. Acta Chim. Asiana 2024, 7, 390–395. [Google Scholar] [CrossRef]
  11. Adigun, O.; Freer, A.; Miller, J.; Loesch-Fries, L.; Kim, B.S.; Harris, M. Mechanistic study of the hydrothermal reduction of palladium on the Tobacco mosaic virus. J. Colloid Interface Sci. 2015, 450, 1–6. [Google Scholar] [CrossRef] [PubMed]
  12. Parker, H.; Rylott, E.; Hunt, A.; Dodson, J.; Taylor, A.; Bruce, N.; Clark, J. Supported palladium nanoparticles synthesized by living plants as a catalyst for Suzuki-Miyaura reactions. PLoS ONE 2014, 9, e87192. [Google Scholar] [CrossRef]
  13. Sattar, Z.; Mohammed, A.; Khalaf, Y. Green synthesis of Curcuma longa-mediated Palladium nanoparticles as antioxidant, antimicrobial, and anticancer agents. Results Chem. 2024, 9, 101675. [Google Scholar] [CrossRef]
  14. Castagna, R.; Riminesi, C.; Di Donato, A.; Francescangeli, O.; Lucchetta, D. Top-performance transmission gratings with haloalkanes-based polymeric composite materials. Materials 2022, 15, 8638. [Google Scholar] [CrossRef]
  15. Monfared, V.; Bakhsheshi-Rad, H.R.; Razzaghi, M.; Toghraie, D.; Hekmatifar, M.; Berto, F. A review study for creep in different nanocomposites. Met. Mater. Int. 2023, 29, 2444–2457. [Google Scholar] [CrossRef]
  16. Leite, E.; Babeva, T.; Ng, E.-P.; Toal, V.; Mintova, S.; Naydenova, I. Optical properties of photopolymer layers doped with aluminophosphate nanocrystals. J. Phys. Chem. C 2010, 114, 16767–16775. [Google Scholar] [CrossRef]
  17. Naydenova, I.; Kotakonda, P.; Jallapuram, R.; Babeva, T.; Mintova, S.; Bade, D.; Martin, S.; Toal, V. Recent and emerging applications of holographic photopolymers and nanocomposites. In Proceedings of the AIP Conference Proceedings of the International Commission for Optics Topical Meeting on Emerging Trends and Novel Materials in Photonics; Technological University Dublin: Dublin, Ireland, 2010; Volume 1288, pp. 30–34. Available online: http://arrow.dit.ie/cieoart/27 (accessed on 10 April 2026).
  18. Burunkova, J.; Alkhalil, G.; Tcypkin, A.; Putilin, S.; Ismagilov, A.; Molnar, S.; Daroczi, L.; Kokenyesi, S. Laser light durability and nonlinear optical properties of acrylate polymer—Chalcogenide glass—Gold nanocomposites. Phys. Status Solidi A 2022, 219, 2100658. [Google Scholar] [CrossRef]
  19. Nedelchev, L.; Mateev, G.; Strijkova, V.; Salgueiriño, V.; Schmool, D.S.; Berberova-Buhova, N.; Stoykova, E.; Nazarova, D. Tunable polarization and surface relief holographic gratings in azopolymer nanocomposites with incorporated goethite (α-FeOOH) nanorods. Photonics 2021, 8, 306. [Google Scholar] [CrossRef]
  20. Nazarova, D.; Nedelchev, L.; Berberova-Buhova, N.; Mateev, G. Nanocomposite photoanisotropic materials for applications in polarization holography and photonics. Nanomaterials 2023, 13, 2946. [Google Scholar] [CrossRef] [PubMed]
  21. Nedelchev, L.; Ivanov, D.; Blagoeva, B.; Nazarova, D. Optical anisotropy induced at five different wavelengths in azopolymer thin films: Kinetics and spectral dependence. J. Photochem. Photobiol. A Chem. 2019, 376, 1–6. [Google Scholar] [CrossRef]
  22. Nazarova, D.; Nedelchev, L.; Ivanov, D.; Blagoeva, B.; Berberova, N.; Stoykova, E.; Mateev, G.; Kostadinova, D. Laser induced optically and thermally reversible birefringence in azopolymers. In Proceedings of the 19th International Conference and School on Quantum Electronics: Laser Physics and Applications; SPIE: Bellingham, WA USA, 2017; Volume 10226, p. 1022608. [Google Scholar] [CrossRef]
  23. Falcione, R.; Roldan, M.V.; Pellegri, N.; Goyanes, S.; Ledesma, S.A.; Capeluto, M.G. Increase of SRG modulation depth in azopolymers-nanoparticles hybrid materials. Opt. Mater. 2021, 115, 111015. [Google Scholar] [CrossRef]
  24. Singh, R.K. Digital polarization holography: Challenges and opportunities. Eng. Proc. 2023, 34, 10. [Google Scholar] [CrossRef]
  25. De Sio, L.; Roberts, D.E.; Liao, Z.; Nersisyan, S.R.; Uskova, O.; Wickboldt, L.; Tabiryan, N.V.; Steeves, D.M.; Kimball, B.R. Digital polarization holography advancing geometrical phase optics. Opt. Express 2016, 24, 18297–18306. [Google Scholar] [CrossRef] [PubMed]
  26. Strobelt, J.; Stolz, D.; Leven, M.; Soelen, M.V.; Kurlandski, L.; Abourahma, H.; McGee, D.J. Optical microstructure fabrication using structured polarized illumination. Opt. Express 2022, 30, 7308–7318. [Google Scholar] [CrossRef] [PubMed]
  27. Porfirev, A.; Khonina, S.; Ivliev, N.; Meshalkin, A.; Achimova, E.; Forbes, A. Writing and reading with the longitudinal component of light using carbazole-containing azopolymer thin films. Sci. Rep. 2022, 12, 3477. [Google Scholar] [CrossRef] [PubMed]
  28. Berberova-Buhova, N.; Nedelchev, L.; Mateev, G.; Nikolova, L.; Stoykova, E.; Ivanov, B.; Strijkova, V.; Hong, K.; Nazarova, D. Polarization diffraction gratings in PAZO polymer thin films recorded with digital polarization holography: Polarization properties and surface relief formation. Photonics 2024, 11, 425. [Google Scholar] [CrossRef]
  29. Bradford, M.M. A rapid and sensitive method for the quantitation of microgram quantities of protein using the principle of protein dye binding. Anal. Biochem. 1976, 72, 248–254. [Google Scholar] [CrossRef]
  30. Krasteva, G.; Berkov, S.; Pavlov, A.; Georgiev, V. Metabolite profiling of Gardenia Jasminoides Ellis in vitro cultures with different levels of differentiation. Molecules 2022, 27, 8906. [Google Scholar] [CrossRef]
  31. Dobreva, A.; Nenov, N.; Ivanov, I.; Georgiev, V.; Hambarliyska, I.; Slavov, A. Subcritical water extraction of Rosa alba L.—Technology and quality of the products. Appl. Sci. 2025, 15, 10007. [Google Scholar] [CrossRef]
  32. Rasband, W.S. U.S. ImageJ; National Institutes of Health: Bethesda, Maryland, USA, 2012. Available online: https://imagej.net/ij/ (accessed on 15 March 2026).
  33. Mikhailova, E.O. Green palladium nanoparticles: Mechanism of synthesis and biomedical application. J. Funct. Biomater. 2026, 17, 152. [Google Scholar] [CrossRef]
  34. Shrestha, S.; Wang, B.; Dutta, P. Nanoparticle processing: Understanding and controlling aggregation. Adv. Colloid Interface Sci. 2020, 279, 102162. [Google Scholar] [CrossRef]
  35. Rosická, D.; Šembera, J. Changes in the nanoparticle aggregation rate due to the additional effect of electrostatic and magnetic forces on mass transport coefficients. Nanoscale Res. Lett. 2013, 8, 20. [Google Scholar] [CrossRef] [PubMed]
  36. Kamiya, H.; Gotoh, K.; Shimada, M.; Uchikoshi, T.; Otani, Y.; Fuji, M.; Matsusaka, S.; Matsuyama, T.; Tatami, J.; Higashitani, K.; et al. Characteristics and behavior of nanoparticles and its dispersion systems. In Nanoparticle Technology Handbook, 1st ed.; Hosokawa, M., Nogi, K., Naito, M., Yokoyama, T., Eds.; Elsevier: Amsterdam, The Netherlands, 2008; pp. 113–176. [Google Scholar] [CrossRef]
  37. Lee, H.-B.; Kim, Y.-S.; Park, H.-Y. Pectic polysaccharides: Targeting gut microbiota in obesity and intestinal health. Carbohydr. Polym. 2022, 287, 119363. [Google Scholar] [CrossRef]
  38. Marslin, G.; Siram, K.; Maqbool, Q.; Selvakesavan, R.K.; Kruszka, D.; Kachlicki, P.; Franklin, G. Secondary metabolites in the green synthesis of metallic nanoparticles. Materials 2018, 11, 940. [Google Scholar] [CrossRef]
  39. Pham, H.N.; Michalet, S.; Bodillis, J.; Nguyen, T.D.; Nguyen, T.K.O.; Le, T.P.Q.; Haddad, M.; Nazaret, S.; Dijoux-Franca, M.-G. Impact of metal stress on the production of secondary metabolites in Pteris vittata L. and associated rhizosphere bacterial communities. Environ. Sci. Pollut. Res. 2017, 24, 16735–16750. [Google Scholar] [CrossRef]
  40. Cherrak, S.A.; Mokhtari-Soulimane, N.; Berroukeche, F.; Bensenane, B.; Cherbonnel, A.; Merzouk, H.; Elhabiri, M. In vitro antioxidant versus metal ion chelating properties of flavonoids: A structure-activity investigation. PLoS ONE 2016, 11, e0165575. [Google Scholar] [CrossRef]
  41. Rabiee, N.; Bagherzadeh, M.; Kiani, M.; Ghadiri, A.M. Rosmarinus officinalis directed palladium nanoparticle synthesis: Investigation of potential anti-bacterial, anti-fungal and Mizoroki-Heck catalytic activities. Adv. Powder Technol. 2020, 31, 1402–1411. [Google Scholar] [CrossRef]
  42. Siddiqi, K.S.; Husen, A. Green synthesis, characterization and uses of palladium/platinum nanoparticles. Nanoscale Res. Lett. 2016, 11, 482. [Google Scholar] [CrossRef]
  43. Bachar, O.; Meirovich, M.M.; Kurzion, R.; Yehezkeli, O. In vivo and in vitro protein mediated synthesis of palladium nanoparticles for hydrogenation reactions. Chem. Commun. 2020, 56, 11211–11214. [Google Scholar] [CrossRef]
  44. Camp, J.; Dunsford, J.; Dacosta, O.; Blundell, R.; Adams, J.; Britton, J.; Smith, R.; Bousfield, T.; Fay, M. Recyclable glucose-derived palladium(0) nanoparticles as in situ-formed catalysts for cross-coupling reactions in aqueous media. RSC Adv. 2016, 6, 16115–16121. [Google Scholar] [CrossRef]
  45. Kyne, S.; Camp, J. Use of monosaccharides in metal-catalyzed coupling reactions. ACS Sustain. Chem. Eng. 2017, 5, 41–48. [Google Scholar] [CrossRef]
Figure 1. Chemical structure of PAZO (a); Absorption coefficient for three thin film samples—pure PAZO and PAZO with 0.5% NPs of both PdNPs_O or PdNPs_RD (b).
Applsci 16 05558 g001
Figure 2. Experimental setup for real-time measurement of the photoinduced birefringence.
Applsci 16 05558 g002
Figure 3. Optical setup for digital polarization holography. HWP—half-wave plate, C—collimator, QWP1 and QWP2—achromatic quarter-wave plates, QWP3—quarter-wave plate for 635 nm, SLM—spatial light modulator, L1 and L2—lenses, P—polarizer.
Applsci 16 05558 g003
Figure 4. BFTEM micrograph at magnification of 40,000× (a) and corresponding SAED pattern (b) of PdNPs_RD. Insets: HRTEM at magnification 600,000× (a) and size distribution of PdNPs_RD (b). STEM micrograph at magnification 15,000× (c) and corresponding mapping of Pd distribution by EDX analysis (d).
Applsci 16 05558 g004
Figure 5. BFTEM micrograph at magnification of 40,000× (a) and corresponding SAED pattern (b) of PdNPs_O. Insets: HRTEM at magnification 600,000× (a) and size distribution of PdNPs_O (b). STEM micrograph at magnification 15,000× (c) and corresponding mapping of Pd distribution (d) by EDX analysis.
Applsci 16 05558 g005
Figure 6. (a) Kinetics of ∆n for pure PAZO and for nanocomposite films with 0.5 wt. % NP of both types; (b) dependence of the maximal birefringence on the NP concentration for both types of NPs.
Applsci 16 05558 g006
Figure 7. Kinetics of the DE in ±1 diffracted orders in the case of recording PHGs on the nanocomposite materials doped with PdNPs_O (a), PdNPs_RD (b), and pure PAZO (c) samples.
Applsci 16 05558 g007
Table 1. Monosaccharide composition (μg/mL) of extracts.
SampleGalAGlcAGlcRhaGalAraXyl
RD254.61 ± 1.32 a3.09 ± 0.23 a14.98 ± 0.95 a13.48 ± 0.39 a34.56 ± 1.12 a9.72 ± 0.52 a1.32 ± 0.11
O167.05 ± 2.16 b1.57 ± 0.11 b11.72 ± 0.77 b8.34 ± 0.24 b26.42 ± 0.75 b7.81 ± 0.37 b-
GalA—galacturonic acid; GlcA—glucuronic acid; Glc—glucose; Rha—rhamnose; Gal—galactose; Ara—arabinose; Xyl—xylose; Results are presented as the mean of three measurements; a,b Different letters in columns indicate statistically different values (Student’s t-test, p < 0.05).
Table 2. Individual phenolic acids and flavonoids in extracts.
CompoundConcentration, µg/mL
RDO
Gallic acid10.34 ± 0.35 a10.44 ± 0.85 a
Protocatechuic acid-21.08 ± 0.84
Chlorogenic acid9.85 ± 0.86 b74.85 ± 1.16 a
Neochlorogenic acid71.33 ± 1.14-
Caffeic acid9.45 ± 0.41 b10.90 ± 0.48 a
3,4-dihydroxy-benzoic acid41.81 ± 0.95-
p-Coumaric acid5.32 ± 0.24 b7.37 ± 0.99 a
Ferulic acid4.96 ± 0.64 a3.18 ± 0.86 b
Salicylic acid21.34 ± 0.35 b67.92 ± 1.41 a
Rosmarinic acid65.12 ± 1.74 b315.98 ± 1.62 a
Rutin47.13 ± 1.21 atraces
(+)-Catechin134.34 ± 1.67-
(−)-Epicatechin44.36 ± 1.02-
Quercetin17.26 ± 0.81 a3.40 ± 0.57 b
Myricetin9.75 ± 0.85-
Kaempferol1.69 ± 0.12 a0.48 ± 0.11 b
- Not determined. Results are presented as the mean of three measurements; a,b Different letters in columns indicate statistically different values (Student’s t-test, p < 0.05).
Table 3. Maximum DE values for all samples.
DEmax +1 Order [%]DEmax −1 Order [%]
Pure PAZO1715.8
PdNPs_O20.617.1
PdNPs_RD21.215.9
Disclaimer/Publisher’s Note: The statements, opinions and data contained in all publications are solely those of the individual author(s) and contributor(s) and not of MDPI and/or the editor(s). MDPI and/or the editor(s) disclaim responsibility for any injury to people or property resulting from any ideas, methods, instructions or products referred to in the content.