Article

Improvements in Surface Integrity and Rotating Bending Fatigue Strength of CuZn39Pb3 Brass via a Conventional Diamond-Burnishing Process


1
Department of Material Science and Mechanics of Materials, Technical University of Gabrovo, 5300 Gabrovo, Bulgaria
2
Center of Competence “Smart Mechatronic, Eco-and Energy-Saving Systems and Technologies”, Technical University of Gabrovo, 5300 Gabrovo, Bulgaria
3
Department of Mechanical Engineering Equipment and Technologies, Technical University of Gabrovo, 5300 Gabrovo, Bulgaria
4
Department of Industrial Design and Textile Engineering, Technical University of Gabrovo, 5300 Gabrovo, Bulgaria
*
Author to whom correspondence should be addressed.
Appl. Sci. 2026, 16(11), 5557; https://doi.org/10.3390/app16115557
Submission received: 28 April 2026 / Revised: 28 May 2026 / Accepted: 30 May 2026 / Published: 2 June 2026

Abstract

CuZn39Pb3 leaded brass is one of the most widely used alloys in machining. Despite its good machinability, there is a lack of information in the literature on the effects of surface cold working on the surface microhardness, microhardness profile, introduced residual stresses, microstructure, and the operating behaviour of machined components. This article reveals the capabilities of conventional diamond burnishing (DB) (implemented under flood-lubrication conditions) to improve the surface integrity and high- and mega-cycle fatigue strength of CuZn39Pb3 cylindrical components such as axles and shafts. The results show that both the smoothing and hardening DB processes achieve mirror-like surfaces, introduce significant residual compressive stresses at depths greater than 0.5 mm, and significantly increase the fatigue strength in the high- and mega-cycle regions compared to the reference condition (turned and polished specimens). However, the surface microhardness is weakly affected by the degree of surface cold working. Given the almost identical microhardness profiles and the equivalent distribution in depth of the introduced residual stresses by the two DB processes, the possible reason for the more pronounced effect of the hardening process on the fatigue strength lies in the thicker affected layer and the reduced negative skewness introduced by this process.

1. Introduction

Copper–zinc alloys with a zinc content of up to 45% are called brasses and are of considerable importance in industry [1]. The brasses used in practice are alloyed, as they also contain other chemical elements (Al, Ti, Ni, Fe, Mn, Pb, Sn). These alloys are used for a wide range of products such as radiators, heat exchangers, hydraulic and pneumatic components, automotive parts, electrical cables and components, installation technology in the sanitary sector, door hardware and handles, and others [1,2]. For example, in Germany and Northern Italy, the amount of brass processing is estimated at approximately 500,000–600,000 tons per year [3]. The disadvantages of brasses include reduced stress corrosion cracking resistance in ammonia environments, dezincification in warm acidic waters, and a tendency to corrosion destruction in humid atmospheres [1,4].
Lead-free brasses (such as CuZn21Si3P alloy, for example) are environmentally friendly because lead is a toxic metal, but they have very poor machinability (long curling chips, intense wear of the cutting tool, etc.), especially at high cutting speeds [1,5,6]. The addition of lead to brass (up to 3%) results in excellent chip breaking, low tool wear, and high cutting speeds [7,8,9,10].
Lead-containing CuZn39Pb3 α-brass is one of the most widely used alloys in many industrial sectors because of its combination of properties: excellent machinability, ductility (the α-phase is ductile), resistance to organic substances and alkaline compounds, sliding-wear resistance [11], and good mechanical properties due to the presence of aluminium, which refines the structure [1,4].
CuZn39Pb3 leaded brass alloy is characterised by a 100% machinability index by cutting, and these cutting processes have been widely studied. Using an L18 orthogonal experimental design, Vaxevanidis et al. [7] investigated the influence of the cutting speed, feed rate and cutting depth in turning of Cu39Zn3Pb on the surface roughness parameters Ra and Rt, as well as on the principal component of the cutting force. These authors found that cutting conditions, as well as their interactions, affect objective functions differently. In a subsequent work [8], the same authors conducted multi-objective optimisation implementing the Grey Wolf algorithm. Schultheiss et al. [9] found that cutting tool wear in longitudinal turning was significantly higher when machining lead-free CuZn21Si3P alloy compared to CuZn39Pb3 under similar operating conditions. In addition, Brinksmeier et al. [10] established the excellent machinability of high-speed cutting of CuZn39Pb3 alloy using diamond turning and milling. Comparing the cutting machinability of two types of brass (CuZn38Pb3 and CuZn42), Johansson et al. [12] found that the lead, deforming into flaky shapes that initiate cracks, promotes discontinuous chip formation. This reduces cutting forces, friction and temperature in the cutting area.
Although manufacturers of semi-finished products report poor cold formability of CuZn39Pb3 brass, our previous study [13] showed that a promising direction for improving the surface integrity (SI) of this alloy is static surface cold working, and in particular diamond burnishing (DB), as a cost-effective approach [14,15]. DB is a type of slide burnishing [16,17], in which the tangential contact between the deforming spherical- or cylindrical-ended diamond insert and the surface being treated is sliding friction. This feature of DB allows it to be implemented with simpler devices than burnishing methods in which the deforming elements (balls or rollers) roll on the treated surface [14,18].
From its introduction by General Electric in 1962 to the present day, DB has been used for cheap and effective finishing of metals and alloys: carbon [19,20], constructional [21,22], tool [23,24] and stainless [25,26] steels, titanium [27,28], aluminium [29,30], and bronze alloys [31,32]. The only study on the DB of brass H62 was conducted by Luo et al. [33]. These authors investigated the effect of DB implemented via a cylindrical-ended diamond insert on the Ra roughness parameter and found a drastic reduction—the initial average roughness of 0.6 μm was reduced to 0.08 μm.
Over the past three decades, various burnishing techniques have been used to improve the SI of brass alloys. Hassan [34] and Hassan et al. [35] investigated the effects of burnishing force and number of passes of roller and ball burnishing on the Ra roughness parameter and surface microhardness of commercial brass. It was found that with increasing burnishing force and number of passes, the microhardness increases linearly, while the Ra roughness parameter decreases to a minimum value, after which it begins to increase. Hassan et al. [36] applied the ball burnishing technique to improve surface roughness and microhardness of brass components and thus improved the wear resistance of these components. Rao et al. [37] investigated the effect of the number of passes in roller burnishing on the Ra roughness parameter and surface microhardness of commercial brass and confirmed the results obtained in [34]. Frihat et al. [38] investigated the influence of feed rate and burnishing force of roller burnishing on the average roughness and surface microhardness of lead-free brass specimens. The authors reported that the maximum improvement percentages of the roughness and microhardness were 48.9% and 63.1%, respectively. Using the response surface methodology, Kumara et al. [39] compared the effects of two ball burnishing processes (conventional and abrasive-assisted) on the Ra roughness parameter and surface microhardness of free machining brass specimens and demonstrated the advantages of the second process. Al-mahasne [40] improved the mechanical properties of samples of 1% lead brass by roller burnishing. Ichkova et al. [41] investigated the effect of slide burnishing using a Ferro-Tic Grade C cylindrical-ended deforming element on nine roughness parameters through one-factor-at-a-time and planned experiments. The optimised slide burnishing process achieved an average roughness of 0.141 μm.
However, there is a lack of research on the effects of DB on the SI performance of CuZn39Pb3 alloy components.
Our previous study [13] examined the influence of DB governing factors, implemented under different burnishing conditions, on the height and shape 2D roughness parameters of CuZn39Pb3 cylindrical specimens. It was found that the optimised conventional DB (i.e., implemented under flood-lubrication conditions) can achieve a mirror-like surface. However, many issues remained unanswered concerning the effects of DB on the mechanical and physical characteristics of SI, as well as on the operational behaviour (wear, fatigue) of machined components, given the known correlation between finishing, SI, and operating behaviour [42]. For rotating machine elements such as axles and shafts, the requirements for improved fatigue strength are of paramount importance. The present study fills part of this gap.
The main objective of this study is to evaluate the effectiveness of the conventional DB process for improving the mechanical characteristics of SI (microhardness and residual stresses) as well as the high- and mega-cycle rotating bending fatigue behaviour of CuZn39Pb3 brass.

2. Materials and Methods

2.1. Material

CuZn39Pb3 hot-rolled cylindrical bars with a diameter of 26 mm were used without additional heat treatment. The chemical composition in wt % and the main mechanical properties were established in our previous study [13] as follows: Cu: 57.8, Zn: 38.08, Pb: 3.58 (Sn, P, Mn, Fe, NI, Si, Cr, Al, Ag, Sb, Cd: balance); we measured a yield limit of 298 MPa, a tensile strength of 408 MPa, elongation of 6.75%, an impact toughness of 14 J / c m 2 , and a Brinell hardness of 136 HB.

2.2. Process Implementation

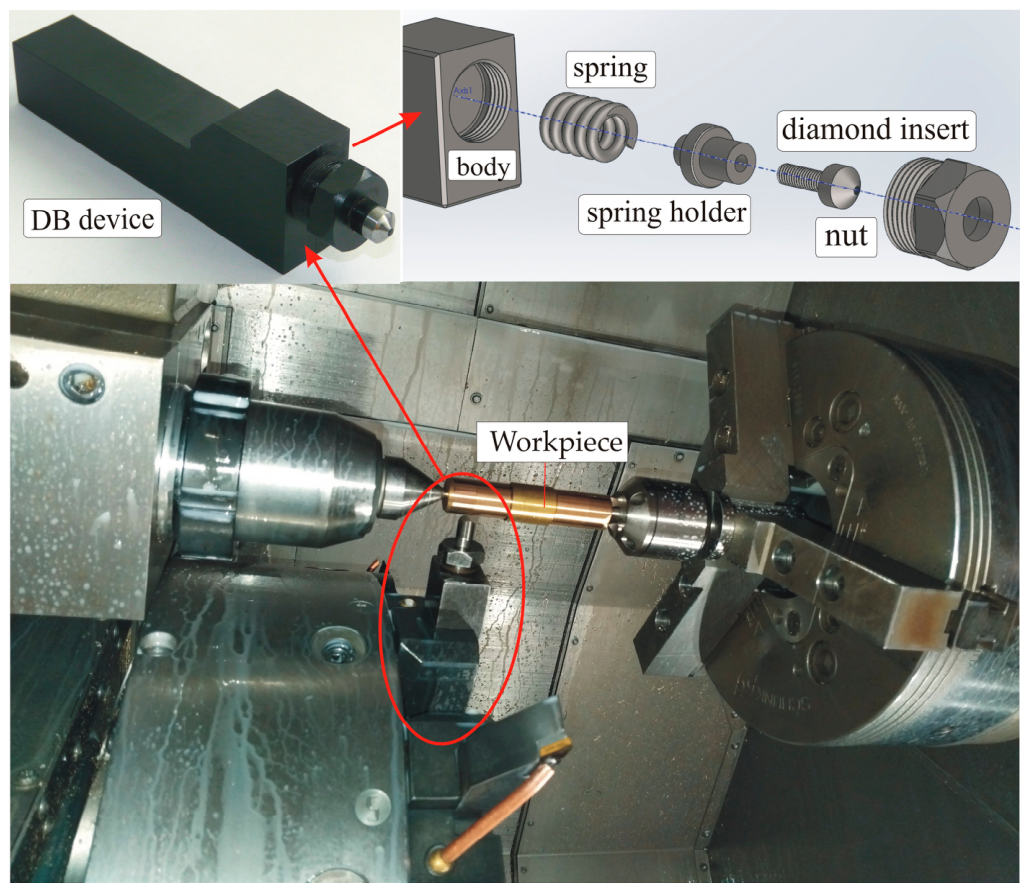
Turning and DB were implemented in one clamping process on an Index Traub CNC lathe (Esslingen am Neckar, Germany) under flood lubrication conditions using Vasco 6000 lubricant. A VCMT 160404—F3P cutting insert and SVVCN 2525M-16 holder supplied by ISCAR Bulgaria (Sofia, Bulgaria) were used in the turning process, which was implemented via the optimal values of the governing factors found in [13] using analysis of variance (ANOVA) as follows: a cutting velocity of 180 m/min and a feed rate of 0.05 mm/rev. The cutting insert was used before the advent of flank wear to ensure a relatively constant geometry of the cutting wedge. Spherical-ended polycrystalline diamond inserts fixed in the DB device, providing elastic normal contact between the diamond and the surface being treated, were employed (Figure 1).
The governing factors and their level of DB process are shown in Table 1. The levels of the governing factors were selected in [13] based on one-factor-at-a-time experiments. In all the studies, DB was implemented as a one-pass process under flood lubrication conditions.

2.3. Measurement of SI Characteristics

A ZHVμ Zwick/Roell microhardness tester (Ulm, Germany) was used to establish the surface microhardness as a median of the clustering of ten measurements using 0.05 kgf loading and a holding time of 10 s. The residual stresses were measured by X-ray diffraction [43]. A Bruker D8 Advance X-ray diffractometer (Billerica, MA, USA) with a pinhole collimator and a primary beam measuring 1 × 1 m m was used. Table 2 shows the characteristics of the X-ray measurement.

2.4. Rotating Bending Fatigue Tests

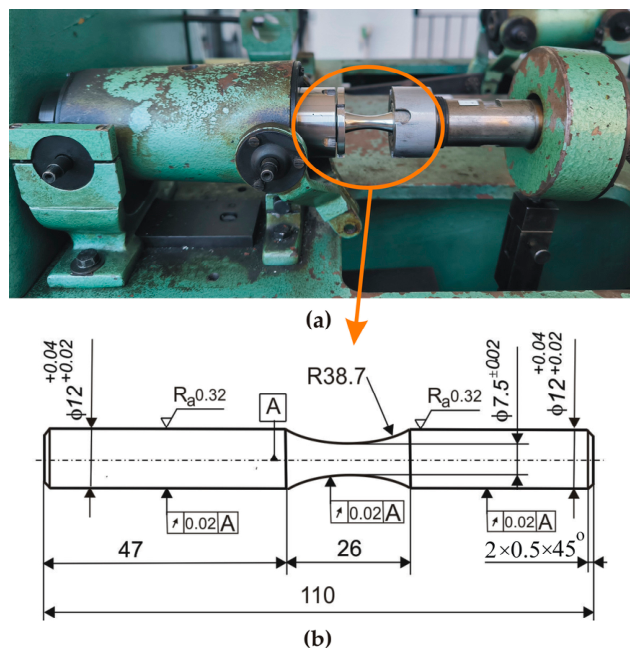
Rotating bending fatigue tests were performed in high- and mega-cycle fatigue field (from 10 3 to 10 8 cycles) at room temperature using a UBM testing machine, cantilever load on the specimen, and 50 Hz loading frequency (Figure 2a).
A strategy with one specimen for each experimental point (i.e., stress amplitude) and a small stress amplitude increment step of 5 MPa was used. The specimen geometry (Figure 2b) is in accordance with [44]. Three groups of specimens were manufactured: (1) turned and polished; (2) turned and diamond burnished using an optimised smoothing process; and (3) turned and diamond burnished using an optimised mixed process. The first group of samples was fabricated using the optimised turning, after which the samples were polished by means of an abrasive diamond paste with a particle size of approximately 3 μm, using technical wool felt to meet the standard requirement for average roughness Ra. This group served as a reference condition, on the basis of which the effects of the two DB processes on the fatigue behaviour of Cu39Zn3Pb alloy were quantitatively evaluated.

2.5. Flowchart of the Study

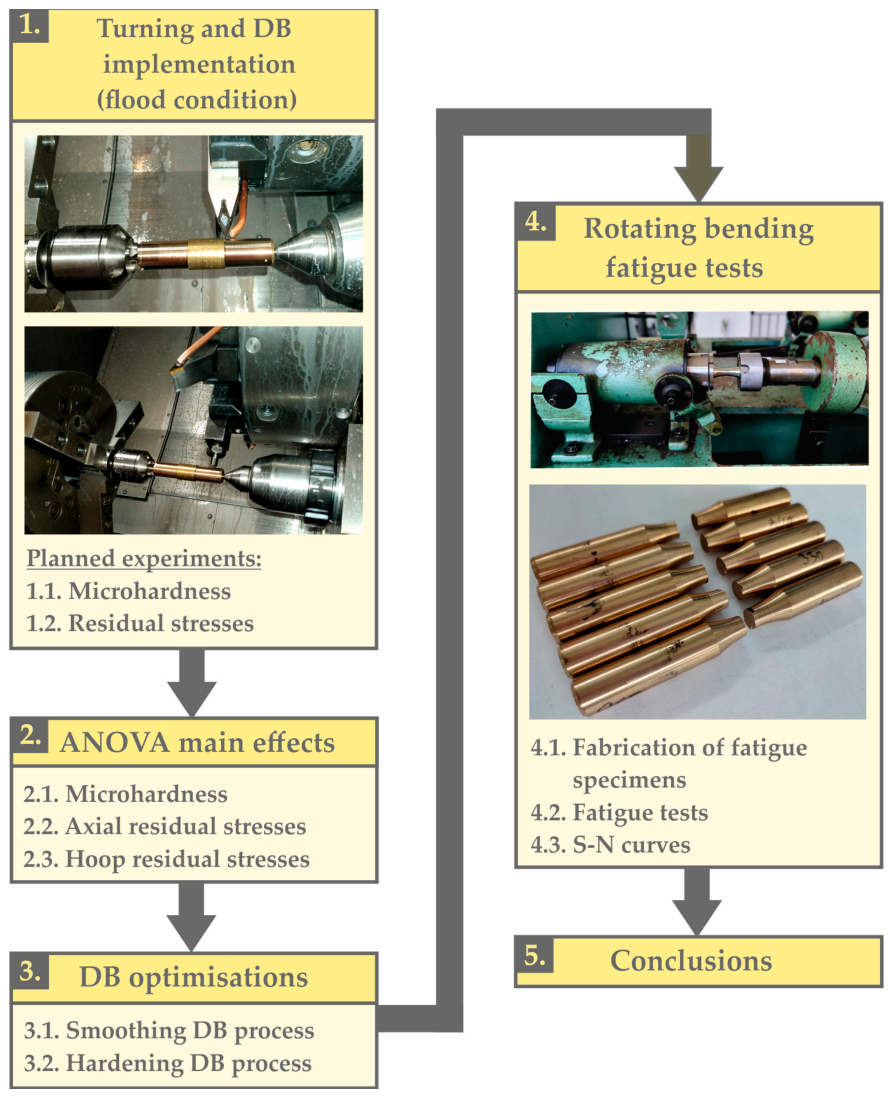
The flowchart of the study is shown in Figure 3. The research was conducted in the following main stages:
  • Planned experiments regarding surface microhardness and surface residual stresses (axial and hoop) obtained via DB;
  • ANOVA to determine the significance of the governing factors of DB with respect to the three objective functions;
  • Justification of the optimisation approach and DB optimisations aimed at obtaining the optimal values of the governing factors of smoothing and hardening DB processes;
  • Rotating bending fatigue tests to establish the effectiveness of the smoothing and hardening DB processes in increasing fatigue limit compared to the optimised turning process.

3. Experimental Results and Discussion

3.1. Effects of Conventional DB on SI Characteristics

3.1.1. Roughness

In our previous study [13], a regression model of the Ra roughness parameter was obtained depending on the governing factors (see Table 1) for the conventional (flood-lubrication condition) DB process as follows:
Y R a = 0.052166 0.00405 x 1 + 0.006166 x 2 + 0.005166 x 3 +     0.0065 x 2 2 + 0.011 x 3 2 0.00383 x 1 x 2 0.00225 x 2 x 3 ,
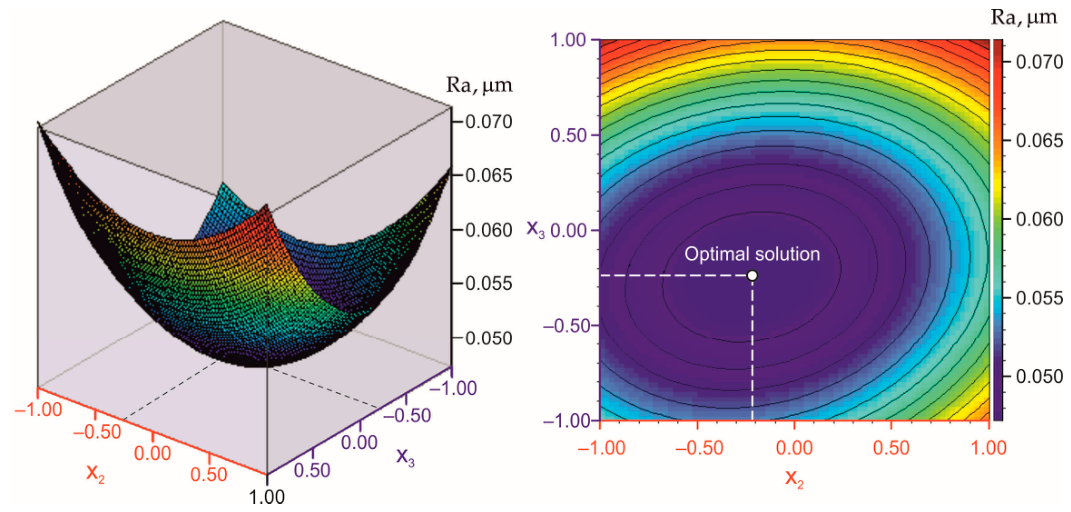
According to [15,22], DB is implemented as a smoothing or hardening process, depending on the functional purpose of the treated surface. The goal of the first process is to achieve mirror-like surfaces, while strain hardening is an accompanying effect. The second process places the emphasis primarily on strain hardening, in which the smoothing effect also manifests itself. It is also possible to implement a mixed DB process [22], in which a compromise between the two effects is achieved. The optimal values of the governing factors and the minimum value of the objective function Y R a obtained for smoothing DB were found in [13] by minimising (1) using a non-dominated sorting genetic algorithm (NSGA II) [45] and QStatLab software, v.6.1.1.3 [46] (Table 3). Figure 4 illustrates the optimal solution for the magnitudes of the governing factors of the optimised smoothing DB process. The radius of the deforming diamond is 4 mm, and the burnishing velocity is 80 m/min. The experimental verification (20 samples processed by the optimised smoothing DB) showed that the average value obtained for the Ra roughness parameter was 0.054 μm, which corresponds to a mirror-like surface.
Table 4 shows some of the more important height parameters, as well as the roughness shape parameters (skewness and kurtosis) obtained with the smoothing DB process. Given the known correlation between the roughness shape parameters and sliding wear behaviour of the respective component in boundary-lubrication-friction-regime conditions [47,48], it can be predicted that the optimised smoothing DB will increase the sliding wear resistance, as it introduces negative skewness and kurtosis greater than three, in combination with a low value of the Ra roughness parameter.

3.1.2. Microhardness and Residual Stresses

The experimental design from our previous study [13] was used, synthesised as a superposition of two second-order optimal compositional designs (with respect to burnishing force and feed rate) with included centre points. The plan was expanded to include the radius of the diamond insert, which changes in two levels and can only accept integer values (Table 5). Table 1 shows the governing factors and their levels. The objective functions are the surface microhardness Y H V and the surface residual stresses: axial Y σ a r e s and hoop Y σ t r e s , respectively.
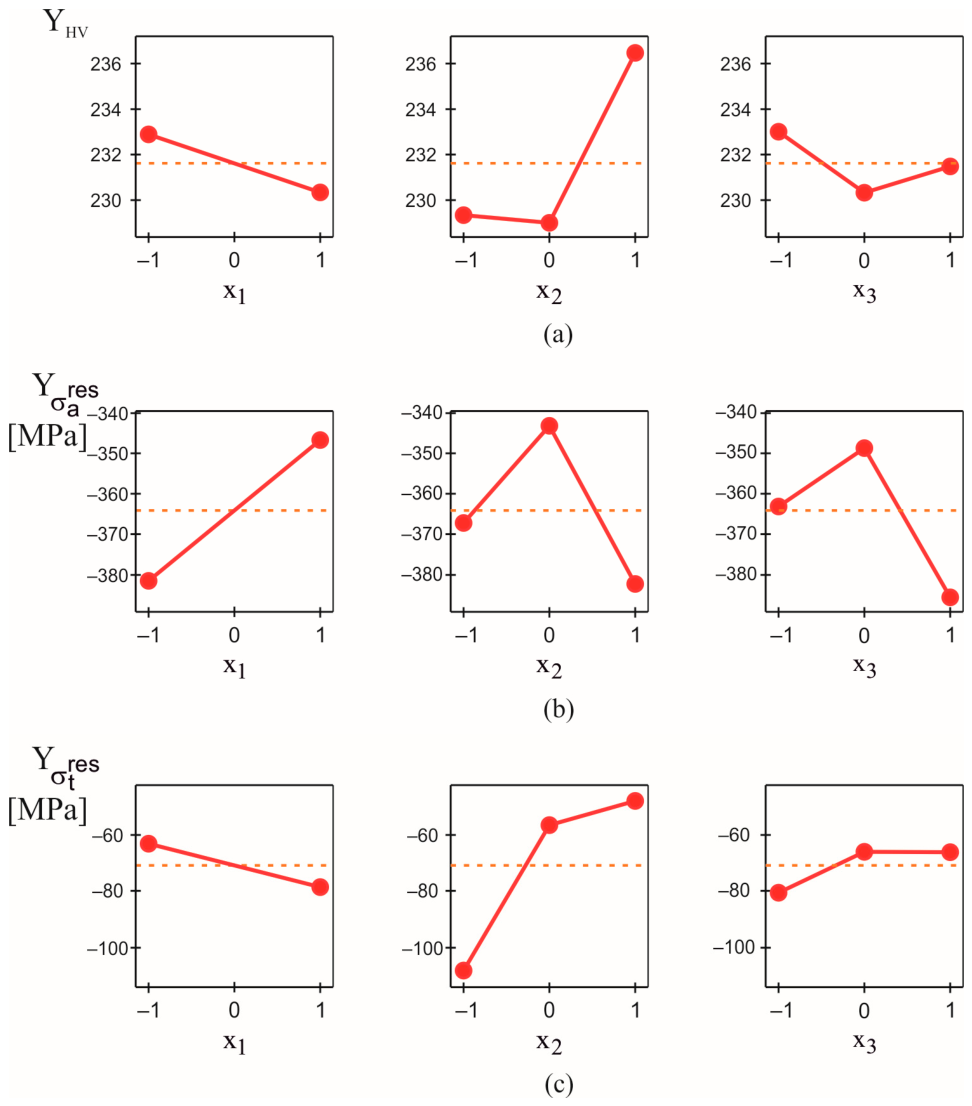
The experimental results are shown in Table 5. ANOVA was conducted for each objective function by means of QStatLab. The computed ANOVA results are shown in Table 6. The probability of a governing factor being significant is p = 0.05, which is a confidence level of 95%. The only significant factor regarding the surface microhardness Y H V is the burnishing force. All three governing factors are not significant for the other two objective functions ( Y σ a r e s and Y σ t r e s ).
Figure 5 illustrates the influence of the governing factors on the three objective functions.
Visual inspection of the experimental results in Table 5 and Figure 5a shows that the surface microhardness varies within a narrow range (from 220 to 240 HV), i.e., it is weakly affected by the equivalent plastic deformation of the surface layer, which is caused by each of the 18 combinations of values of the governing factors. However, the maximum surface microhardness is achieved with a maximum value of burnishing force. The distribution of residual stresses as a function of depth determines the fatigue behaviour of diamond-burnished specimens.
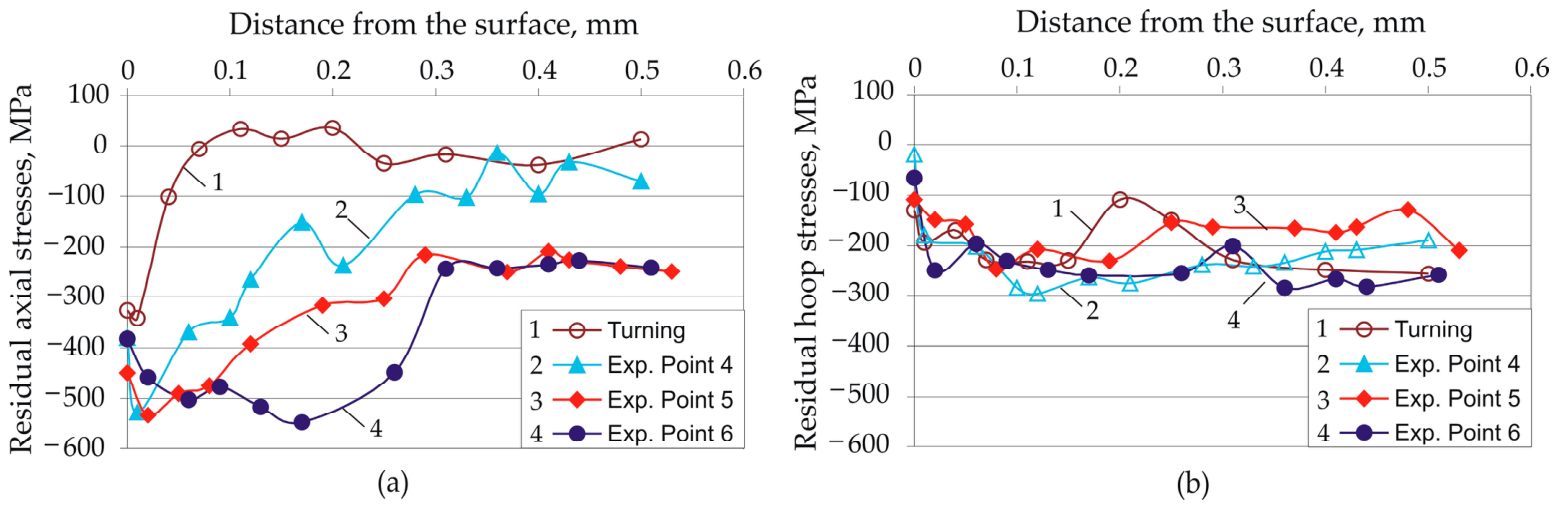
Figure 6 shows the residual stress distribution for experimental points 4, 5, and 6 of Table 5 to establish the influence of burnishing force on this distribution. These points were chosen for two reasons: (1) the smaller value (3 mm) of the radius leads to the maximum surface residual axial stress (see Figure 5); (2) the feed rate has the least effect on the surface residual stresses, and the average level of this factor was chosen. The measurement errors are tabulated in Table 7.
The mechanism of inducing residual stresses by both turning and DB is strain hardening, which is why the axial stresses are significantly larger in absolute value than the circumferential stresses (Figure 6). (This is unlike the transformation hardening mechanism, where the opposite is true [49].) Turning introduces residual axial compressive stresses in the surface and nearby subsurface layers (Figure 6a). Taking measurement errors into account (see Table 7), the depth of the compressive zone after turning is approximately 0.07 mm. DB, implemented with any of the three burnishing force values, significantly increases the absolute values of axial residual stresses and the depth of the compression zone. In addition, the absolute values of axial stresses and the depth of the compressive zone both increase with increasing burnishing force. Given the correlation between SI and fatigue behaviour [14], it is expected that increasing burnishing force will increase fatigue strength. Although DB introduces significant residual axial stresses in CuZn39Pb4 specimens, the surface microhardness is only slightly affected by DB intervention. Similar behaviour was noted by Gharbi et al. [50], who employed slide burnishing using a special burnishing tool to improve the SI of 1050A aluminium alloy. Those authors found that slide burnishing moderately reduced the Ra roughness parameter and improved ductility, but the surface microhardness did not change significantly. The explanation for the discrepancy lies in the specific structure of the processed material.
Although less pronounced, DB introduces larger compressive residual hoop stresses compared to turning (Figure 6b). In addition, these stresses increase with increasing burnishing force.

3.1.3. Hardening DB

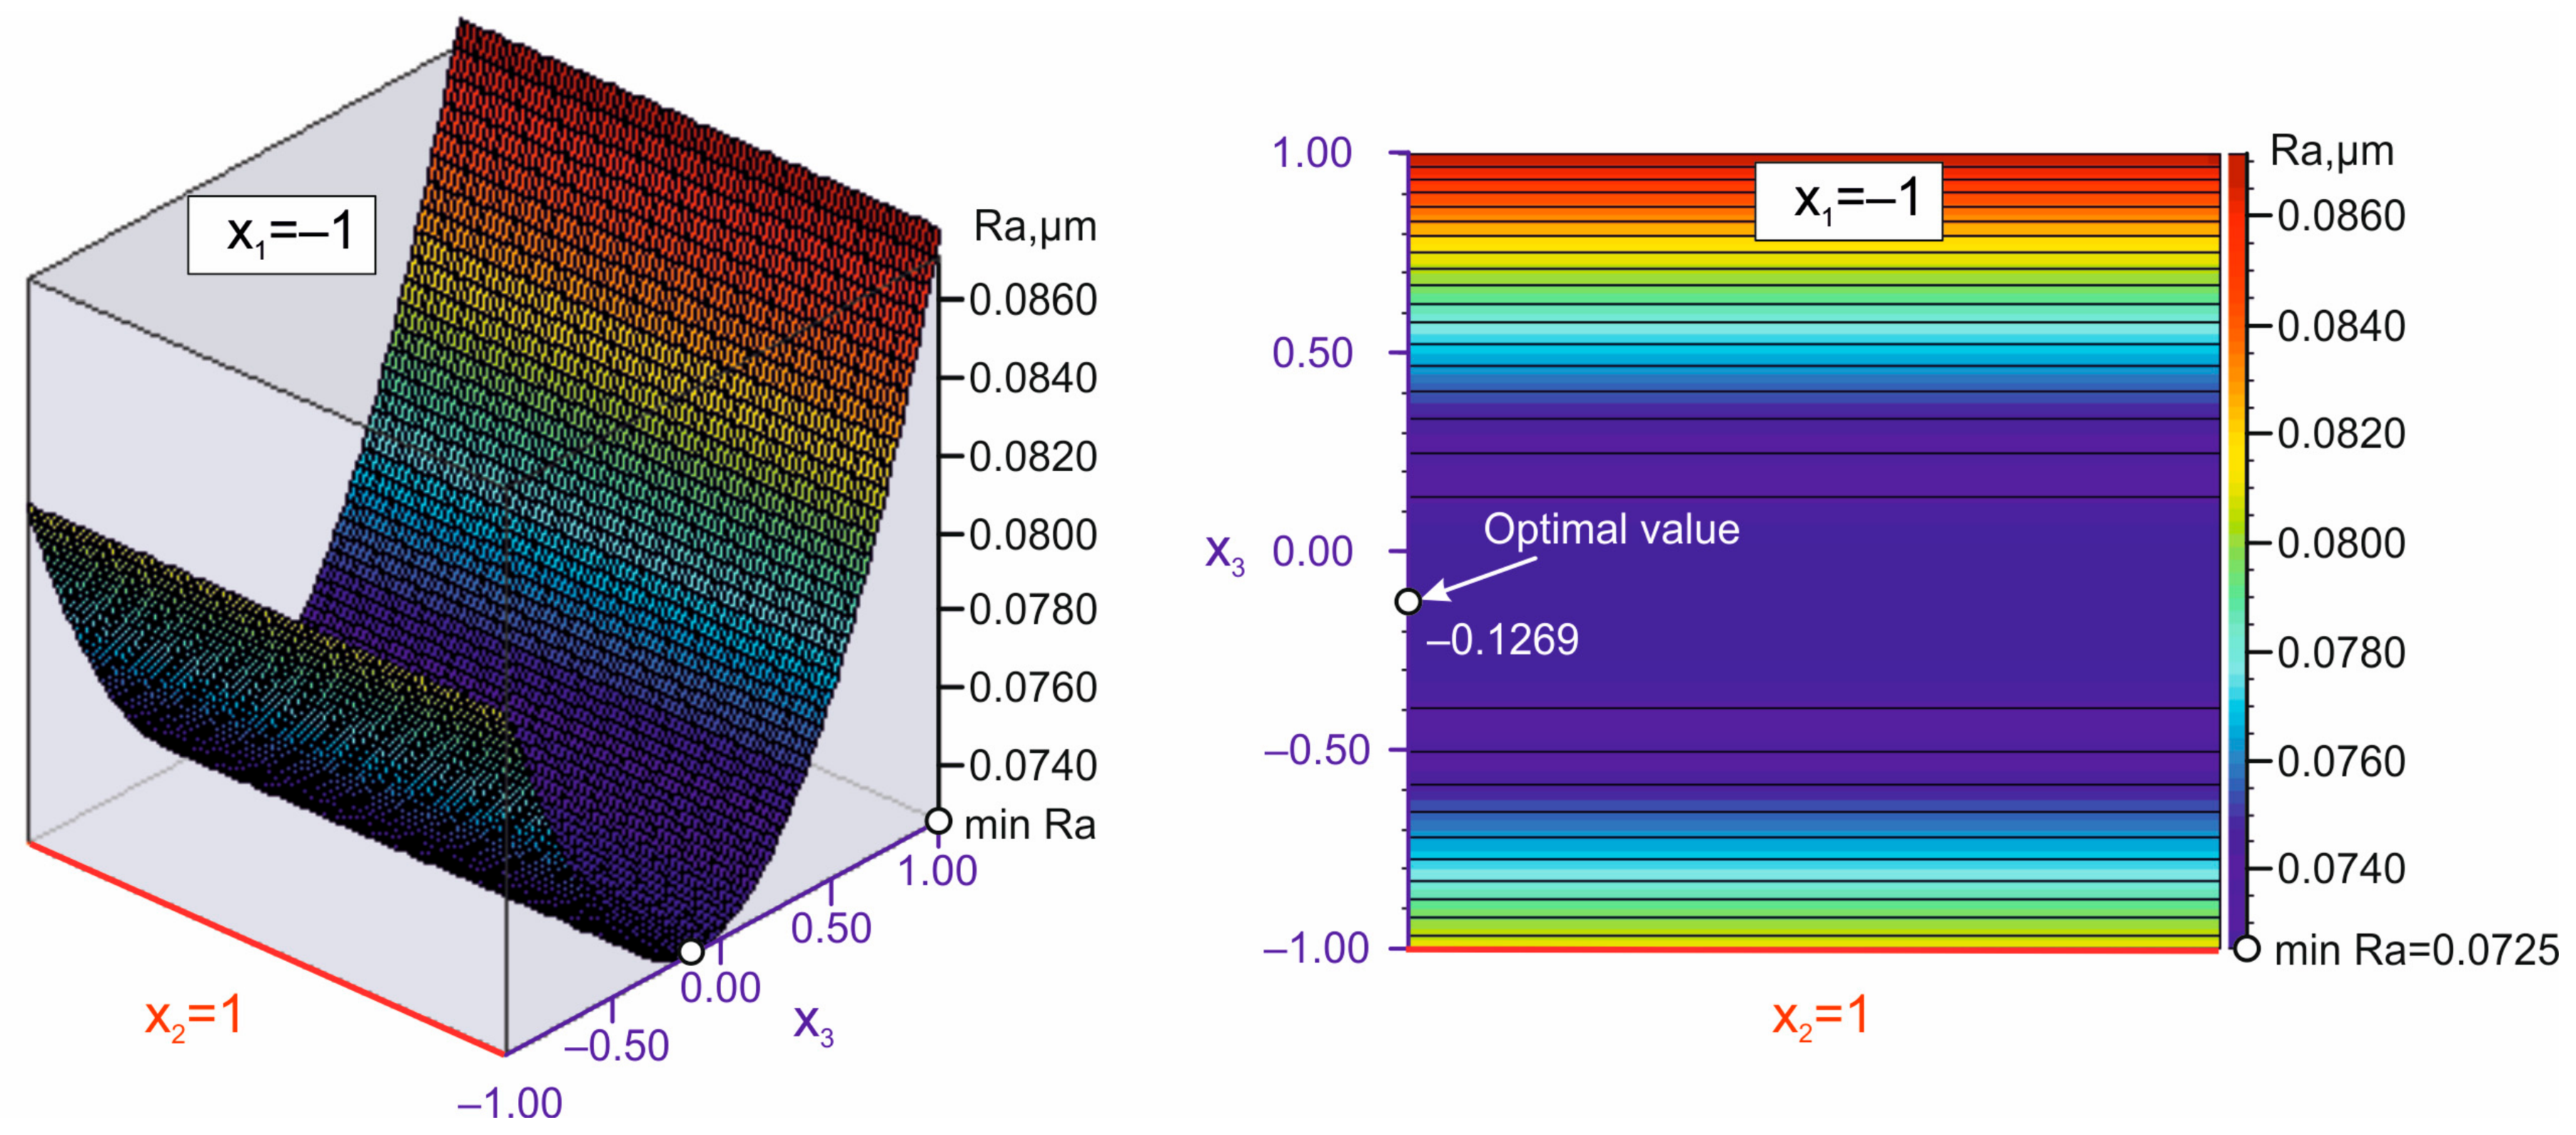
The hardening DB process aims primarily at increasing microhardness and fatigue strength; i.e., the strain-hardening effect dominates over the smoothing effect [22]. Since the depth of the compression zone and the maximum compressive stress increase with increasing burnishing force, the surface microhardness is maximised when the diamond insert takes the smaller value (r = 3 mm). The optimisation was performed using the minimum value criterion for Ra, the roughness parameter, as in the roughness model (1). The radius and burnishing force are assumed to have their minimum and maximum values, respectively; i.e., x 1 = 1 and x 2 = 1 . NSGA II and QStatLab were used. Table 8 shows the optimal values of the governing factors implementing the DB hardening process.
Figure 7 visually illustrates the optimal solution for the magnitudes of the governing factors of the optimised DB-hardening process. The radius of the deforming diamond is 3 mm, and the burnishing velocity is 80 m/min. The experimental verification showed that the average value of the obtained Ra roughness parameter was 0.0685 μm, and the nominal value and deviations of the measured surface microhardness were 235 (+10, −9) HV. For comparison, the experimental verification results for the smoothing DB process were Ra = 0.0540 μm and 235 (+7, −12) HV, respectively. Obviously, the two DB processes achieve very similar results for Ra and for surface microhardness.
Table 9 shows some of the more important height parameters, as well as the roughness shape parameters obtained by the hardening DB process. The height parameters have larger values, and the absolute values of skewness and kurtosis are smaller than those obtained by the smoothing DB process (see Table 4). According to [47,48], it can be expected that the effectiveness of the smoothing DB process in increasing wear resistance under boundary-lubrication-friction-regime conditions will be greater than that of the hardening DB process.
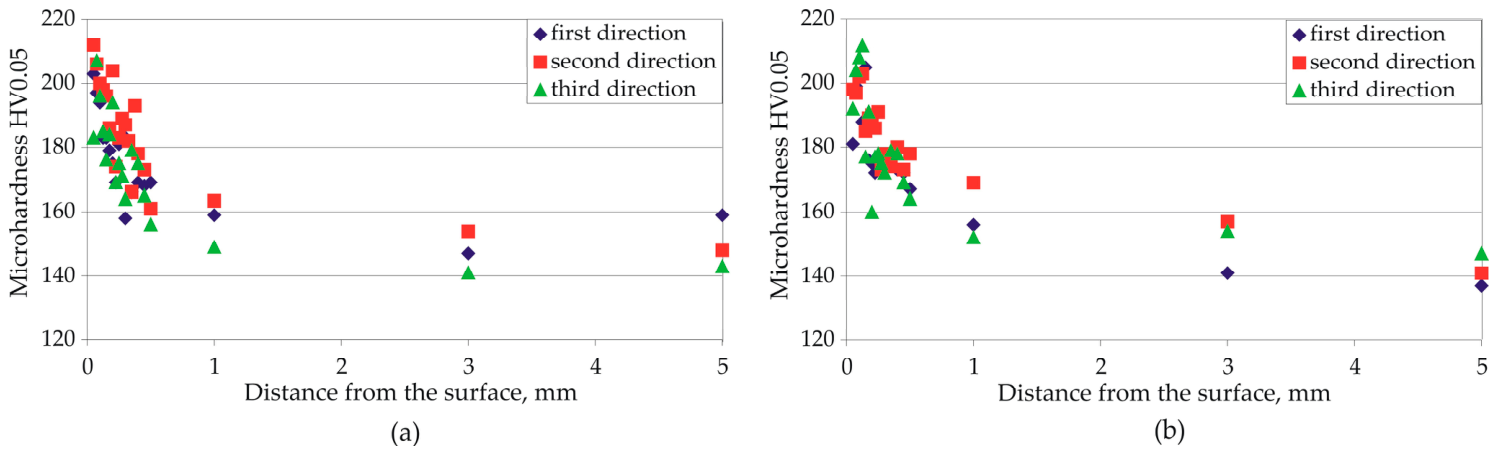
Figure 8 shows the microhardness profiles obtained via the two optimised DB processes (smoothing and hardening). The measurements were made in three equidistant directions. The two DB processes introduce practically equivalent hardened zones to a depth of approximately 0.5 mm, despite the higher burnishing force in DB hardening. A possible reason for this phenomenon is the limited surface-strain-hardening ability of this material.
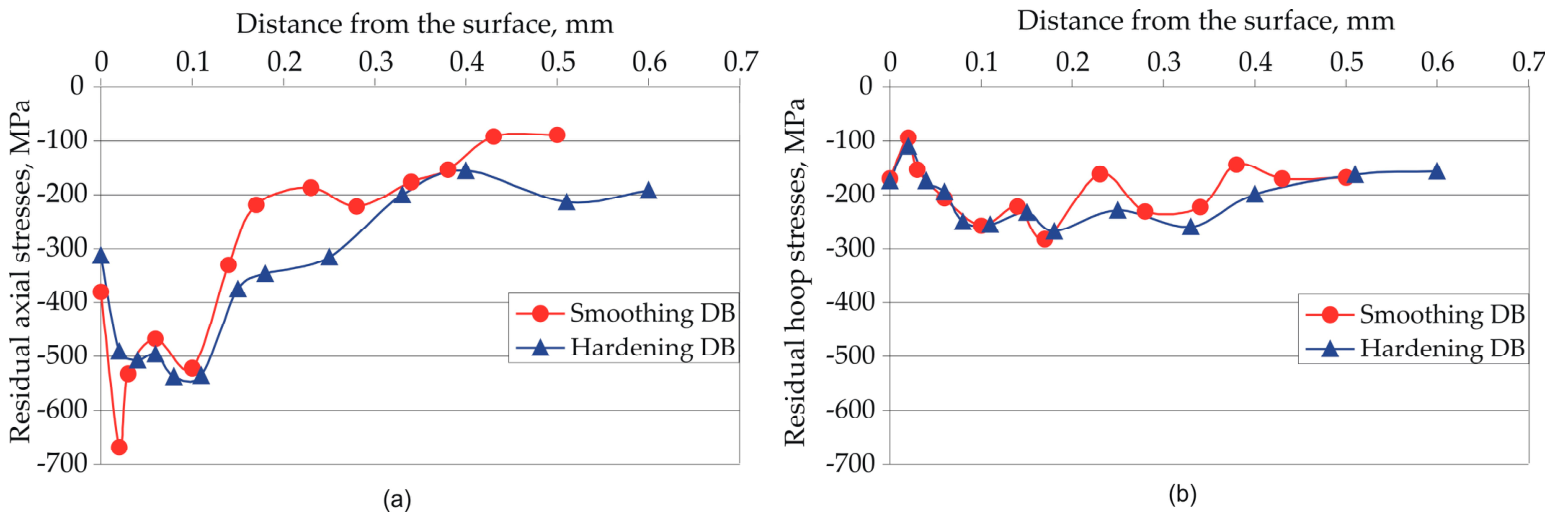
Figure 9 shows the residual stress distributions introduced by the optimised smoothing and hardening DB processes. The errors from the X-ray measurement are shown in Table 10. Although slightly pronounced, hardening DB creates a deeper compression zone and larger absolute residual stresses.
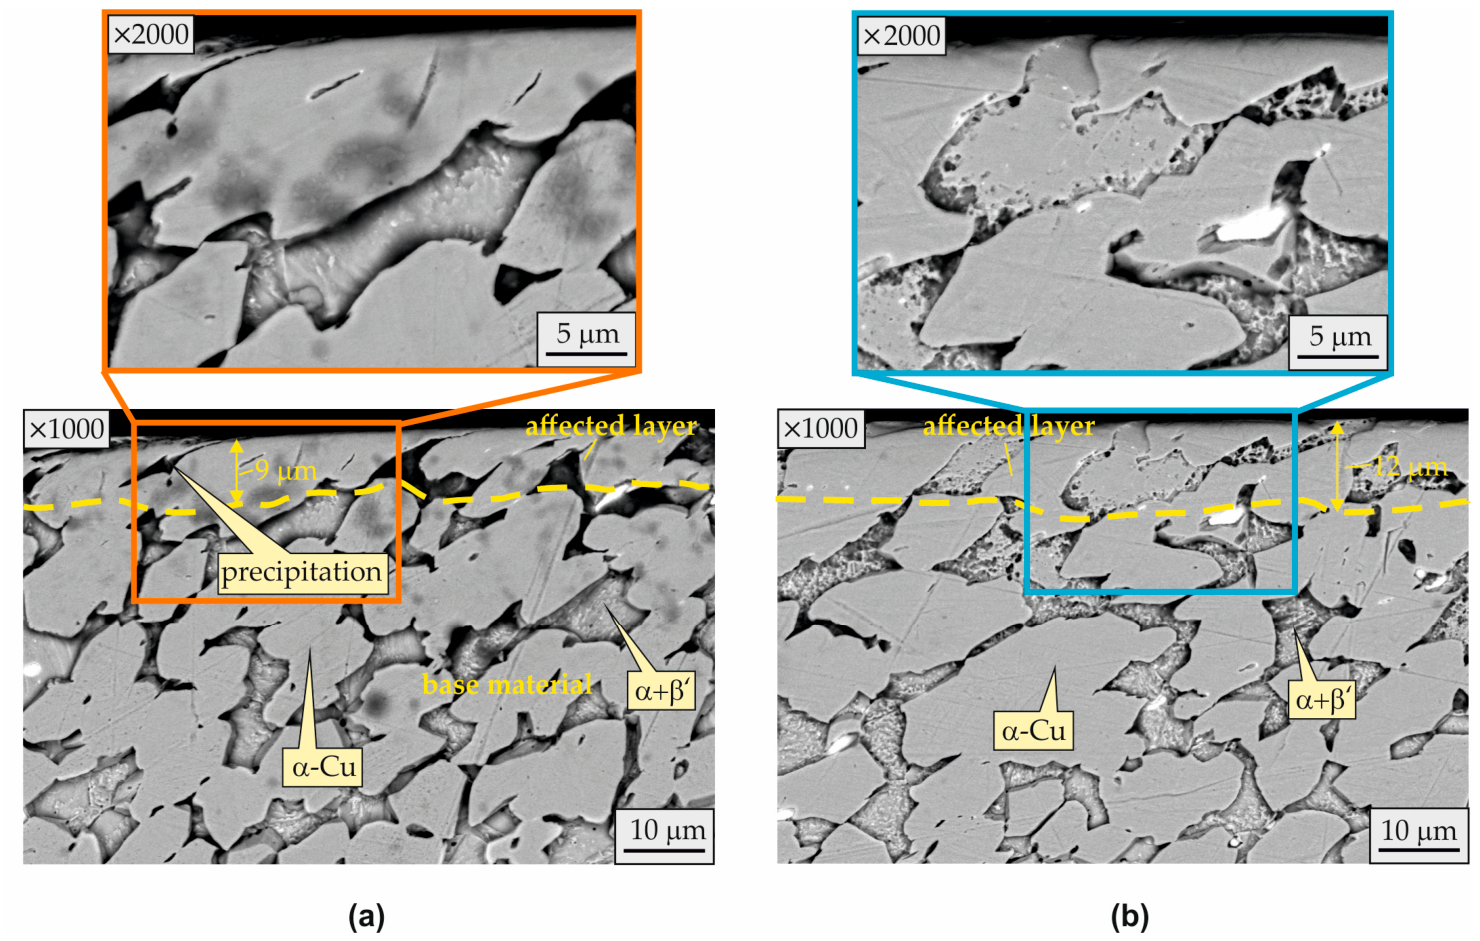
The physical locus of the measured characteristics (microhardness and residual stresses) is the microstructure. Figure 10 shows the effects of the two DB processes (smoothing and hardening) on the microstructure near the surface layer at different magnifications. The resulting structures are two-phase, formed by large grains of α-Cu (about 15–20 μm) and a mechanical mixture of α and β’ (the electronic compound CuZn) phases at the boundaries of the solid solution. The smoothing DB process creates a deformed layer with a thickness of about 9 μm, characterised by tangentially deformed (in the direction of the DB velocity) β-grains and fragmentation of the brittle mechanical mixture α + β’ (Figure 10a). The moderate strengthening effect is due to the deformation of the α-solid solution. The observed dispersion separations are due to the deformation of the more brittle mechanical mixture. The hardening DB process produces analogous effects (Figure 10b), but the thickness of the affected layer is larger: about 12 μm. Judging by the microstructures, it can be assumed that the effects of the two DB processes on the fatigue strength will be similar to each other.

3.2. Effects of Conventional DB on Fatigue Behaviour

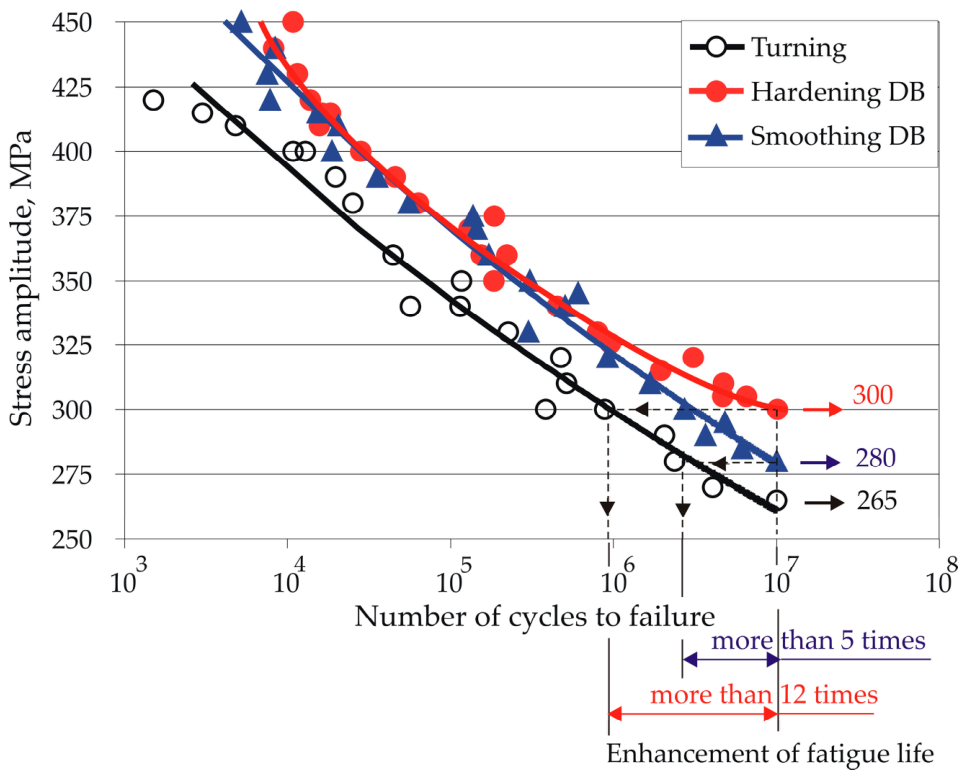
It is well known [29] that non-ferrous alloys—unlike steels—do not show a physical fatigue limit. The conditional fatigue limit is taken to be the stress amplitude at which the test specimen withstands 2 × 10 8 cycles without failure or unacceptable deformation. In the present study, to reduce the duration of the fatigue tests, the fatigue behaviour was investigated in the interval from 10 3 to 10 7 cycles. Figure 11 shows the resulting S-N curves. The turned and polished specimen group shows a 10 7 cycle fatigue strength (or so-called limited fatigue strength of non-ferrous materials [29]) of 265 MPa. Both DB processes (smoothing and hardening) increase the fatigue strength of CuZn39Pb3 alloy in both the high-cycle and the mega-cycle fatigue fields compared to the turned and polished specimen group. The increases in 10 7 cycle fatigue strength are 5.7% (from 265 to 280 MPa) and 13.2% (from 265 to 300 MPa), respectively, while the fatigue life (based on 10 7 cycles) increases by more than a factor of 5 for smoothing DB and more than 12 for hardening DB. The negative skewness adversely affects the fatigue behaviour since the deep valleys of the roughness profile are natural stress concentrators; as a result, a reduction in the fatigue strength is observed [51]. Given the almost identical microhardness profiles (Figure 8) and the equivalent distribution in depth of the residual stresses induced by the two DB processes (Figure 9), the explanation for the more pronounced effect of the hardening process on the fatigue strength lies in the thicker affected layer and the reduced negative skewness introduced by this process.

4. Conclusions

This study reveals the capabilities of conventional DB (implemented under flood-lubrication conditions) to improve the mechanical characteristics of SI (microhardness and residual stresses) and the high- and mega-cycle fatigue strength of CuZn39Pb3 brass cylindrical components. The most important new findings are as follows:
  • Both DB processes (smoothing and hardening) achieve mirror-like surfaces: Ra = 0.0540 μm and Ra = 0.0685 μm, respectively, and introduce significant residual compressive stresses at depths greater than 0.5 mm. However, the surface microhardness is weakly affected by the degree of surface cold working.
  • Both DB processes (smoothing and hardening) significantly increase the fatigue strength in the high- and mega-cycle regions compared to the reference condition (turned and polished specimens). The increase in 10 7 cycle fatigue strength is 5.7% (from 265 to 280 MPa) and 13.2% (from 265 to 300 MPa), respectively, while the increase in the fatigue life (based on 10 7 cycles) is more than five times for smoothing DB and more than 12 times for hardening DB.
  • Given the almost identical microhardness profiles (Figure 8) and the equivalent depth distribution of the residual compressive stresses induced by the two DB processes (Figure 9), the possible reason for the more pronounced effect of the hardening process on the fatigue strength lies in the thicker affected layer and the lower negative skewness introduced by this process. A detailed study to clarify the fatigue failure mechanism, as well as the effects of DB, implemented under dry and cool-assisted conditions on the fatigue behaviour of this alloy, will be the subject of our next work.

Author Contributions

Conceptualisation, M.I. (Mariana Ichkova), P.P. and K.A.; methodology, M.I. (Mariana Ichkova), P.P. and K.A.; software, M.I. (Mariana Ichkova), P.P. and M.I. (Marieta Ivanova); validation, M.I. (Mariana Ichkova), P.P. and K.A.; formal analysis, M.I. (Mariana Ichkova), P.P., M.I. (Marieta Ivanova), P.D. and T.A.; investigation, K.A., P.D., M.I. (Mariana Ichkova), M.I. (Marieta Ivanova), and T.A.; resources, K.A. and M.I. (Mariana Ichkova); data curation, M.I. (Mariana Ichkova), P.D., M.I. (Marieta Ivanova) and T.A.; writing—original draft preparation, M.I. (Mariana Ichkova), P.P. and K.A.; writing—review and editing, M.I. (Mariana Ichkova), P.P. and K.A.; visualisation, M.I. (Mariana Ichkova) and P.D.; supervision, M.I. (Mariana Ichkova); project administration, M.I. (Mariana Ichkova); funding acquisition, K.A. and M.I. (Mariana Ichkova). All authors have read and agreed to the published version of the manuscript.

Funding

This research was funded by the European Regional Development Fund under the Operational Program “Scientific Research, Innovation and Digitization for Smart Transformation 2021–2027”, Project CoC “Smart Mechatronics, Eco- and Energy Saving Systems and Technologies”, BG16RFPR002-1.014-0005.

Institutional Review Board Statement

Not applicable.

Informed Consent Statement

Not applicable.

Data Availability Statement

The original contributions presented in the study are included in the article; further inquiries can be directed to the corresponding author.

Conflicts of Interest

The authors declare no conflicts of interest.

Abbreviations

The following abbreviations are used in this manuscript:
ANOVAAnalysis of variance
DBDiamond burnishing
NSGANon-dominated sorting genetic algorithm
SISurface integrity

References

  1. Balevski, A. Metal Science; Technika: Sofia, Bulgaria, 1988. [Google Scholar]
  2. Jasper, S.; Subash, R.; Muthuneelakandan, K.; Vijayakumar, D.; Jhansi Ida, S. The Mechanical Properties of Brass Alloys: A Review. Eng. Proc. 2025, 93, 11. [Google Scholar]
  3. Karaman, A.; Marre, M. Forging of Zinc Alloys—A Feasibility Study. Eng. Proc. 2022, 26, 2. [Google Scholar]
  4. Kaleycheva, J. Metal Science; Scientific and Technical Union of Mechanical Engineering “Industria 4.0”: Sofia, Bulgaria, 2018. [Google Scholar]
  5. Klocke, F.; Nobel, C.; Veselovac, D. Influence of tool coating, tool material, and cutting speed on the machinability of low-leaded brass alloys in turning. Mater. Manuf. Process. 2016, 31, 1895–1903. [Google Scholar] [CrossRef]
  6. Nobel, C.; Klocke, F.; Lung, D.; Wolf, S. Machinability enhancement of lead-free brass alloys. Procedia CIRP 2014, 14, 95–100. [Google Scholar] [CrossRef]
  7. Vaxevanidis, N.M.; Fountas, N.A.; Koutsomichalis, A.; Kechagias, J.D. Experimental investigation of machinability parameters in turning of CuZn39Pb3 brass alloy. Procedia Struct. Integr. 2018, 10, 333–341. [Google Scholar] [CrossRef]
  8. Fountas, N.A.; Koutsomichalis, A.; Kechagias, J.D.; Vaxevanidis, N.M. Multi-response optimization of CuZn39Pb3 brass alloy turning by implementing Grey Wolf algorithm. Frat. Integrita Strutt. 2019, 50, 584–594. [Google Scholar] [CrossRef]
  9. Schultheiss, F.; Johansson, D.; Bushlya, V.; Zhou, J.; Nilsson, K.; Ståhl, J.-E. Comparative study on the machinability of lead-free brass. J. Clean. Prod. 2017, 149, 366–377. [Google Scholar] [CrossRef]
  10. Brinksmeier, E.; Preuss, W.; Riemer, O.; Rentsch, R. Cutting forces, tool wear and surface finish in high speed diamond machining. Precis. Eng. 2017, 49, 293–304. [Google Scholar] [CrossRef]
  11. Küçükömeroğlu, T.; Kara, L. The friction and wear properties of CuZn39PB3 alloys under atmospheric and vacuum conditions. Wear 2014, 309, 21–28. [Google Scholar] [CrossRef]
  12. Johansson, J.; Alm, P.; M’Saoubi, R.; Malmberg, P.; Stahl, J.-E.; Bushlya, V. On the function of lead (Pb) in machining brass alloys. Int. J. Adv. Manuf. Technol. 2022, 120, 7263–7275. [Google Scholar] [CrossRef]
  13. Anastasov, K.; Ichkova, M.; Todorov, V.; Daskalova, P. The Effect of Optimised Combined Turning and Diamond Burnishing Processes on the Roughness Parameters of CuZn39Pb3 Alloys. Appl. Sci. 2025, 15, 13075. [Google Scholar] [CrossRef]
  14. Maximov, J.T.; Duncheva, G.V. Effects of diamond burnishing on surface integrity, fatigue, wear, and corrosion of metal components—Review and perspectives. Int. J. Adv. Manuf. Technol. 2025, 139, 4233–4267. [Google Scholar] [CrossRef]
  15. Korzynski, M. Modeling and experimental validation of force—Surface roughness relation for smoothing burnishing with a spherical tool. Int. J. Mach. Tools Manuf. 2007, 47, 1956–1964. [Google Scholar] [CrossRef]
  16. Maximov, J.; Duncheva, G. Improvements in the Surface Integrity and Operating Behaviour of Metal Components Through Slide Burnishing with Non-Diamond-Based Deforming Elements: Review and Perspectives. Appl. Sci. 2025, 15, 12182. [Google Scholar] [CrossRef]
  17. Maximov, J.T.; Duncheva, G.V. Finite Element Analysis and optimization of spherical motion burnishing of low-alloy steel. Proc. Inst. Mech. Eng. Part C J. Mech. Eng. Sci. 2012, 226, 161–176. [Google Scholar] [CrossRef]
  18. Korzynski, M. (Ed.) Slide diamond burnishing. In Nonconventional Finishing Technologies; Polish Scientific Publisher: Warsaw, Poland, 2013; pp. 9–34. [Google Scholar]
  19. Skoczylas, A.; Zaleski, K.; Matuszak, J. Evaluation of the Effectiveness of Surface Defect Removal by Slide Burnishing. Appl. Sci. 2025, 15, 7398. [Google Scholar] [CrossRef]
  20. Skoczylas, A.; Klonica, M. Selected properties of the surface layer of C45 steel samples after slide burnishing. Materials 2023, 16, 6513. [Google Scholar] [CrossRef]
  21. Kebede, F.T.; Felho, C.; Sztankovics, I. Improving Surface Roughness of 42CrMo4 Low Alloy Steel Shafts by Applying Varying Feed in the Multi-Pass Slide Burnishing Process. Appl. Sci. 2025, 15, 9063. [Google Scholar] [CrossRef]
  22. Maximov, J.T.; Duncheva, G.V.; Anchev, A.P.; Dunchev, V.P. Smoothing, deep or mixed diamond burnishing of low-alloy steel components—Optimization procedures. Int. J. Adv. Manuf. Technol. 2020, 106, 1917–1929. [Google Scholar] [CrossRef]
  23. Brostow, W.; Czechowski, K.; Polowski, W.; Rusek, P.; Tobola, D.; Wronska, I. Slide diamond burnishing of tool steels with adhesive coatings and diffusion layers. Mater. Res. Innov. 2013, 17, 269–277. [Google Scholar] [CrossRef]
  24. Tobola, D.; Brostow, W.; Czechowski, K.; Rusek, P.; Wronska, I. Structure and properties of burnished and nitrided AISI D2 tool steel. Mater. Sci. 2015, 21, 511–516. [Google Scholar] [CrossRef]
  25. Maximov, J.T.; Duncheva, G.V.; Anchev, A.P.; Dunchev, V.P.; Argirov, Y.B.; Nikolova, M.P. Effects of heat treatment and diamond burnishing on fatigue behaviour and corrosion resistance of AISI 304 austenitic stainless steel. Appl. Sci. 2023, 13, 2570. [Google Scholar] [CrossRef]
  26. Maximov, J.T.; Duncheva, G.V.; Anchev, A.P.; Dunchev, V.P.; Argirov, Y.B. Effect of Diamond Burnishing on Fatigue Behaviour of AISI 304 Chromium-Nickel Austenitic Stainless Steel. Materials 2022, 15, 4768. [Google Scholar] [CrossRef] [PubMed]
  27. Varga, G.; Dezso, G.; Szigeti, F. Surface roughness improvement by sliding friction burnishing of parts produced by selective laser melting of Ti6Al4V titanium alloy. Machines 2022, 10, 400. [Google Scholar] [CrossRef]
  28. Dezső, G.; Szigeti, F.; Varga, G. Surface Hardness Modification of Selective Laser Melted Ti6Al4V Parts by Sliding Friction Diamond Burnishing. Period. Polytech. Mech. Eng. 2023, 67, 59–69. [Google Scholar] [CrossRef]
  29. Maximov, J.T.; Anchev, A.P.; Duncheva, G.V.; Ganev, N.; Selimov, K.F.; Dunchev, V.P. Impact of slide diamond burnishing additional parameters on fatigue behaviour of 2024-T3 Al alloy. Fatigue Fract. Eng. Mater. Struct. 2019, 42, 363–373. [Google Scholar] [CrossRef]
  30. Nestler, A.; Schubert, A. Effect of machining parameters on surface properties in slide diamond burnishing of aluminium matrix composites. Mater. Today Proc. 2015, 2, S156–S161. [Google Scholar] [CrossRef]
  31. Duncheva, G.V.; Maximov, J.T.; Anchev, A.P.; Dunchev, V.P.; Argirov, Y.B. Multi-objective optimization of internal diamond burnishing process. Mater. Manuf. Process. 2022, 37, 428–436. [Google Scholar] [CrossRef]
  32. Duncheva, G.V.; Maximov, J.T.; Anchev, A.P.; Dunchev, V.P.; Argirov, Y.B.; Kandeva-Ivanova, M. Enhancement of the wear resistance of CuAl9Fe4 sliding bearing bushings via diamond burnishing. Wear 2022, 510–511, 204491. [Google Scholar] [CrossRef]
  33. Luo, H.; Liu, J.; Wang, L.; Zhoung, Q. Investigation of the burnishing process with PCD tool on non-ferrous metals. Int. J. Adv. Manuf. Technol. 2005, 25, 454–459. [Google Scholar] [CrossRef]
  34. Hassan, A.M. The effect of ball- and roller-burnishing on the surface roughness and hardness of some non-ferous metals. J. Mater. Process. Technol. 1997, 72, 385–391. [Google Scholar] [CrossRef]
  35. Hassan, A.M.; Al-Jalil, H.F.; Ebied, A.A. Burnishing force and number of passes for the optimum surface finish of brass components. J. Mater. Process. Technol. 1998, 83, 176–179. [Google Scholar] [CrossRef]
  36. Hassan, A.M.; Al-Dhifi, S.Z.S. Improvement in the wear resistance of brass components by the ball burnishing process. J. Mater. Process. Technol. 1999, 96, 73–80. [Google Scholar] [CrossRef]
  37. Rao, J.N.M.; Reddy, A.C.K.; Rao, P.V.R. Experimental investigation of the influence of burnishing tool passes on surface roughness and hardness of brass specimens. Indian J. Sci. Technol. 2011, 4, 1113–1118. [Google Scholar] [CrossRef]
  38. Frihat, M.N.; Al Quran, F.M.F.; Al-Odat, M.Q. Experimental investigation of the influence of burnishing parameters on surface roughness and hardness of brass alloy. J. Mater. Sci. Eng. 2015, 5, 1000216. [Google Scholar]
  39. Kumara, P.; Bhat, V.V.; Purohit, G.K. Effect of ball burnishing medium on the surface characteristics of free machining brass. J. Mod. Manuf. Syst. Technol. 2020, 4, 110–116. [Google Scholar] [CrossRef]
  40. Al-mahasne, M.M. Mechanical properties analysis of burnished brass. Adv. Sci. Technol. Res. J. 2025, 19, 423–433. [Google Scholar] [CrossRef]
  41. Ichkova, M.; Anastasov, K.; Dikova, T. Surface plastic deformation of leaded brass components using a Ferro-Tic Grade C cylindrical-ended deforming element. Arch. Mater. Sci. Eng. 2025, 136, 30–41. [Google Scholar] [CrossRef]
  42. Maximov, J.T.; Duncheva, G.V. The correlation between surface integrity and operating behaviour of slide burnished components—A review and prospects. Appl. Sci. 2023, 13, 3313. [Google Scholar] [CrossRef]
  43. Maximov, J.T.; Duncheva, G.V.; Ganev, N.; Amudjev, I.M. Modeling of Residual Stress Distribution around Fastener Holes in Thin Plates after Symmetric Cold Expansion. J. Braz. Soc. Mech. Sci. Eng. 2014, 36, 355–369. [Google Scholar] [CrossRef]
  44. Bulgarian National Standard 5297:1983; Metals—Fatigue Test Methods. BDS: Sofia, Bulgaria, 1983. (In Bulgarian)
  45. Deb, K.; Pratap, A.; Agarwal, S.; Meyarivan, T. A fast and elitist multiobjective genetic algorithm: NSGA-II. IEEE Trans. Evol. Comput. 2002, 6, 182–197. [Google Scholar] [CrossRef]
  46. Vuchkov, I.N.; Vuchkov, I.I. QStatLab Professional, version 6.1.1.3; Statistical Quality Control Software, User’s Manual; QStatLab: Sofia, Bulgaria, 2009.
  47. Sedlacek, M.; Podgornik, B.; Vizintin, J. Correlation between standard roughness parameters skewness and kurtosis and tribological behaviour of contact surface. Tribol. Int. 2012, 48, 102–112. [Google Scholar] [CrossRef]
  48. Duncheva, G.V.; Maximov, J.T.; Anchev, A.P.; Dunchev, V.P.; Argirov, Y.B. Improvement in Wear Resistance Performance of CuAl8Fe3 Single-Phase Aluminum Bronze via Slide Diamond Burnishing. J. Mater. Eng. Perform. 2022, 31, 2466–2478. [Google Scholar] [CrossRef]
  49. Maximov, J.; Duncheva, G.; Anchev, A.; Dunchev, V.; Argirov, Y. Improvement in Fatigue Strength of Chromium–Nickel Austenitic Stainless Steels via Diamond Burnishing and Subsequent Low-Temperature Gas Nitriding. Appl. Sci. 2024, 14, 1020. [Google Scholar] [CrossRef]
  50. Gharbi, F.; Sghaier, S.; Hamdi, H.; Benameur, T. Ductility improvement of aluminum 1050A rolled sheet by a newly designed ball burnishing tool device. Int. J. Adv. Manuf. Technol. 2012, 60, 87–99. [Google Scholar] [CrossRef]
  51. Zabala, A.; Blunt, L.; Tato, W.; Aginagalde, A.; Gomez, X.; Llavori, I. The use of areal surface topography characterisation in relation to fatigue performance. MATEC Web Conf. 2018, 165, 14013. [Google Scholar] [CrossRef]
Figure 1. DB implementation.
Applsci 16 05557 g001
Figure 2. Rotating bending fatigue test: (a) testing machine (photo); (b) fatigue specimen geometry.
Applsci 16 05557 g002
Figure 3. Flowchart of the study.
Applsci 16 05557 g003
Figure 4. Graphical visualisation of the optimal values of the governing factors of the smoothing DB process.
Applsci 16 05557 g004
Figure 5. ANOVA main effects: (a) surface microhardness; (b) surface residual axial stress; (c) surface residual hoop stress.
Applsci 16 05557 g005
Figure 6. Residual stress distribution: (a) axial; (b) hoop.
Applsci 16 05557 g006
Figure 7. Graphical visualisation of the optimal values of the governing factors of the hardening DB process.
Applsci 16 05557 g007
Figure 8. Microhardness profiles: (a) smoothing DB; (b) hardening DB.
Applsci 16 05557 g008
Figure 9. Residual stress distributions introduced via smoothing and hardening DB processes: (a) axial stresses; (b) hoop stresses.
Applsci 16 05557 g009
Figure 10. Microstructures: (a) smoothing DB; (b) hardening DB.
Applsci 16 05557 g010
Figure 11. S-N curves.
Applsci 16 05557 g011
Table 1. Governing factors and levels.
Governing FactorsLevels
Natural, x ˜ i Dimensionless, x i
Diamond radius r [mm] x ˜ 1 3NA4 x 1 −1NA1
Burnishing force F b [ N ] x ˜ 2 100250400 x 2 −101
Feed rate f [ m m / r e v ] x ˜ 3 0.030.070.11 x 3 −101
Table 2. Characteristics of the X-ray measurement.
Measuring deviceBruker D8 Advance diffractometer
X-ray tubeLong focus Cr—Kα
Crystallographic planeCu(α)—(220)
Diffraction angle (2θ)122.52° (117–127°)
Measuring methodOffset coupled TwoTheta/Theta (sin2ψ method)
Scan modeContinuous PSD fast
X-ray detectorSSD160-2 (1D scanning)
Collimator spot sizeStandard Φ1.0 mm
Measurement time for single scanApprox. 30 s
Elastic constant s1 2.747 × 10 6
Elastic constant 1/2s2 1.083 × 10 5
Voltage30 kV
Current40 mA
Step size0.5°
Time for step1 s
Table 3. Optimal values of the governing factors of smoothing DB.
Governing Factor Optimal Values min Y R a , μm
DimensionlessNatural
x 1 * x 2 * x 3 * r, mm F b * , N f*, mm/rev
1−0.2218−0.246242170.06020.0472
Table 4. Roughness parameters obtained through optimised smoothing DB process.
2D Roughness Parameters
R a , μ m R q , μ m R p , μ m R v , μ m R s k R k u R k , μ m R p k , μ m R v k , μ m
0.0540.0680.1910.234−0.2144.1900.1840.0670.082
Table 5. Experimental design and results.
No.Governing FactorsObjective Functions
Y H V , H V Y σ a r e s , M P a Y σ t r e s , M P a
x 1 x 2 x 3 NominalDeviationNominalErrorNominalError
1−1−1−1232 + 9 9 −448.160.9−7826.4
2−10−1227 + 11 6 −362.650.9−3052.8
3−11−1240 + 5 9 −359.445.4−7832.6
4−1−10227 + 9 11 −326.141.2−13024.1
5−100231 + 14 9 −379.948.4−2043.6
6−110237 + 8 11 −382.822.5−6628.7
7−1−11232 + 16 9 −383.844.6−15526.4
8−101231 + 10 10 −374.976.513.539.5
9−111239 + 7 9 −416.648.4−2744
101−1−1235 + 10 9 −275.162.4−9929.7
1110−1230 + 9 9 −314.549.1−10859
1211−1234 + 8 15 −390.856.3−9228.4
131−10230 + 8 8 −386.548−7935
14100224 + 14 8 −287.629.7−13462.1
15110233 + 8 5 −328.6683323.3
161−11220 + 10 11 −383.147.9−10940.9
17101231 + 8 8 −339.239.4−6048
18111236 + 13 6 −415.557.8−6046.1
Turning232 + 12 10 −351.342.1−10938
Table 6. Computed ANOVA results.
Objective FunctionSourceSum of SquaresDispersionF Valuep Value
Microhardness
Y H V
Radius x 1 29.3888929.388892.099210.17300
Force x 2 215.44444107.722227.694440.00707
Feed rate x 3 21.4444410.722220.765870.48637
Residual168.0000014.00000
Total434.27778
Residual standard deviation = 3.74166; R-sq = 0.61315; R-sq (adj) = 0.45196
Surface residual axial stress
Y σ a r e s
Radius x 1 5453.160565453.160563.240750.09700
Force x 2 4680.111112340.055561.390670.28629
Feed rate x 3 4390.351112195.175561.304570.30714
Residual20,192.213331682.68444
Total34,715.21333
Residual standard deviation = 41.02054; R-sq = 0.41836; R-sq (adj) = 0.17601
Surface residual hoop stress
Y σ t r e s
Radius x 1 1056.467221056.467220.443490.51804
Force x 2 12,670.801116335.400562.659490.11065
Feed rate x 3 853.65444426.827220.179170.83816
Residual28,586.193332382.18278
Total43,167.11611
Residual standard deviation = 48.80761; R-sq = 0.33778; R-sq (adj) = 0.06185
Table 7. Residual stress X-ray measurement errors.
TurningDiamond Burnishing
Experimental Point 4Experimental Point 5Experimental Point 6
Depth
[mm]
Axial
[MPa]
Hoop
[MPa]
Depth
[mm]
Axial
[MPa]
Hoop
[MPa]
Depth
[mm]
Axial
[MPa]
Hoop
[MPa]
Depth
[mm]
Axial
[MPa]
Hoop
[MPa]
041.224.1048.443.6042.138022.528.7
0.0130.517.70.0143.727.90.0267.839.90.0234.845.6
0.0420.410.70.0635.814.20.0536.321.10.0645.857
0.0741.320.10.134.121.20.0846.816.50.0922.543.3
0.1127.527.30.1230.110.70.1249.227.40.132736.3
0.1537.620.50.1730.419.60.1951.724.70.174236.3
0.221.8120.2125.416.70.2540.618.80.2632.523.1
0.2537.217.80.282215.90.2931.19.30.3130.733.1
0.3133.6230.3318.213.40.3741.123.90.3619.918.8
0.440.419.90.3619.200.4134.518.50.4124.16.5
0.540.416.60.423.9290.4321.5140.4448.818.5
---0.4327.1320.4850.211.80.5127.613.4
---0.541.416.80.5329.929.9---
Table 8. Optimal values of the governing factors of hardening DB.
Governing Factor Optimal Values min Y R a , μm
DimensionlessNatural
x 1 * x 2 * x 3 * r*, mm F b * , N f*, mm/rev
−11−0.126934000.06490.0725
Table 9. Roughness parameters obtained through the optimised hardening DB process.
2D Roughness Parameters
R a , μ m R q , μ m R p , μ m R v , μ m R s k R k u R k , μ m R p k , μ m R v k , μ m
0.06850.0890.2570.315−0.1893.7120.2260.0920.106
Table 10. X-ray measurement errors.
Diamond Burnishing
Smoothing ProcessHardening Process
Depth
[mm]
Axial
[MPa]
Hoop
[MPa]
Depth
[mm]
Axial
[MPa]
Hoop
[MPa]
051.238.6051.763.8
0.0264.630.00.0227.381.0
0.0337.932.30.0435.955.0
0.0646.544.70.0646.849.1
0.1050.426.80.0838.136.7
0.1435.212.70.1189.055.5
0.1726.318.50.1536.027.6
0.2319.69.40.1835.146.6
0.2834.531.00.2534.318.1
0.3416.312.60.3333.130.8
0.383514.20.4040.042.0
0.4319.520.20.5119.147.7
0.5012.313.60.6027.016.6
Disclaimer/Publisher’s Note: The statements, opinions and data contained in all publications are solely those of the individual author(s) and contributor(s) and not of MDPI and/or the editor(s). MDPI and/or the editor(s) disclaim responsibility for any injury to people or property resulting from any ideas, methods, instructions or products referred to in the content.