1. Introduction
Urban air mobility (UAM) is moving from conceptual vision to commercial reality. Industry forecasts place the global UAM market at roughly USD 30 billion by 2030, and electric vertical take-off and landing (eVTOL) aircraft—the central platform for this market—have already entered intensive flight-testing and airworthiness certification [
1,
2]. Yet, the rapid technical maturation of the platform has not been matched by progress in public psychological acceptance. Existing studies focus largely on platform-level engineering challenges such as propulsion integration, certification, and airspace management [
2], with a smaller body of work addressing operator cognitive load; the psychological experience of the passenger has received comparatively little attention. Using structural equation modelling, Al Haddad et al. [
3] identified perceived risk and distrust of autonomous systems as the dominant determinants of public willingness to fly in eVTOL aircraft. A recent large-scale virtual-reality study covering 2430 test scenarios and three urban environments confirms that even under highly immersive conditions, passenger anxiety remains the principal bottleneck for acceptance [
4]. Technical maturity alone, in other words, will not dissolve passenger apprehension.
The immersive study cited above evaluated acceptance-related responses from passenger-perspective scenarios rather than from a conventional survey-only setting; this distinction is important because anxiety remained salient even when the flight experience was embedded in a visually and contextually rich simulation. The finding therefore supports the present focus on real-time state monitoring during the passenger experience itself, rather than on post hoc acceptance measurement alone.
The eVTOL flight environment presents psychological and physiological stressors that differ markedly from those of conventional commercial aviation. During flight, passengers experience rapid vertical accelerations (±0.2–0.4 g), abrupt attitude changes induced by low-altitude turbulence, and broadband mechanical vibration in the 20–80 Hz range generated by distributed electric propulsion. Bhalla et al. [
5] showed that these vibration characteristics significantly affect ride comfort and that active vibration suppression can reduce perceived vibration by approximately 40%. Critically, the 20–80 Hz band overlaps with the natural resonance frequencies of several anatomical structures—including the eyeball (about 20–90 Hz) and the cranial vault—and can produce blurred vision and somatic discomfort, creating a positive feedback loop between physical discomfort and psychological anxiety. NASA’s dedicated passenger ride-quality simulator study has documented elevated heart rates and increased subjective discomfort during take-off, landing, and turbulence [
6]. Equally important, the short flight duration of an eVTOL trip (15–30 min) leaves no time for pre-flight cognitive–behavioural preparation, mismatches the pharmacokinetic window of anxiolytic medication, and outpaces the response of static cabin amenities that cannot react to a passenger’s real-time physiological state. eVTOL passenger anxiety therefore demands a closed-loop solution capable of sensing individual state in real time and adjusting the intervention on the fly.
Wearable physiological sensing offers a foundation for such closed-loop management, but the choice of sensor form factor must be tailored to the eVTOL setting. Wrist-worn devices face a fundamental signal-quality problem under acute anxiety: sympathetic activation produces peripheral vasoconstriction, which markedly degrades the SNR of wrist-site PPG [
7,
8]. Chest-strap electrocardiography offers higher accuracy but is physically intrusive and incompatible with the seamless boarding experience that UAM operations require. In-ear sensors—so-called
hearables—offer several context-specific advantages. The external auditory canal is perfused by branches of the external carotid artery, which belongs to the central rather than the peripheral circulation, so the in-canal PPG signal is preserved even when distal vessels constrict [
9]. Earphone form factors are largely free of social signalling effects in public-transport settings. Most importantly, the cymba conchae is the only superficial cutaneous region containing the auricular branch of the vagus nerve (ABVN), which provides an anatomical basis for integrating sensing and neuromodulation within a single device [
10].
Building on this rationale, we propose a human-centred, closed-loop system for the real-time monitoring and mitigation of anxiety in eVTOL passengers. The system couples an in-ear multimodal sensing module with adaptive regulation of the cabin environment, achieving individualised mitigation through a continuous sense–analyse–intervene–feedback loop. The contributions of this work are as follows.
Design framework. We present, to the best of our knowledge, the first closed-loop affective-regulation framework specifically targeted at the eVTOL passenger. In-ear multimodal sensing and cabin-environment control are unified within a single adaptive system, addressing a research gap in real-time passenger anxiety management for UAM.
Hardware parameters. We design an in-ear sensing module that targets the 20–80 Hz vibration spectrum of distributed electric propulsion. A silicone damping layer integrated into the earpiece delivers more than 12 dB of hardware-level attenuation above 25 Hz, raising the HRV monitoring SNR of in-canal PPG to 24.1 dB under vibration.
Intervention mechanism. We construct a three-channel adaptive intervention scheme that combines transcutaneous auricular vagus nerve stimulation (tVNS), binaural beats, and cabin colour-temperature modulation. A fuzzy controller paired with online gradient optimisation tailors the intervention parameters to each individual.
Empirical validation. A randomised controlled trial with 50 participants in a simulated eVTOL cruise-vibration environment demonstrates the closed-loop efficacy and user acceptance of the system.
2. Related Work
2.1. Passenger Anxiety in Urban Air Mobility
The commercial viability of UAM depends heavily on public psychological acceptance. In a comprehensive review of UAM research, Straubinger et al. [
1] identified passenger acceptance as the foremost obstacle to market roll-out, noting that public concern over safety consistently outweighs interest in the time-saving benefits. Subsequent tracking work by the DLR team has confirmed that this conclusion still holds as eVTOL commercialisation advances [
11].
Al Haddad et al. [
3] used a structural equation model to quantify these psychological mechanisms and isolated perceived risk and distrust of autonomous systems as the principal factors shaping willingness to use eVTOL services. Unlike ground autonomous vehicles, the airborne setting leaves passengers virtually no scope for manual intervention in an emergency, producing a profound loss of control that is a well-recognised trigger for acute anxiety. A recent large-scale, multi-perspective virtual-reality study (2430 scenarios; three stakeholder roles) has shown that the passenger perspective generates the most prominent anxiety response of any role examined [
4]. The European Union Aviation Safety Agency (EASA) has likewise documented that public concern over safety, noise, and privacy constitutes a major barrier to UAM acceptance [
12].
Beyond these cognitive factors, the physical environment of eVTOL flight introduces distinctive physiological stressors. In simulated-flight experiments, Bhalla et al. [
5] demonstrated that the 20–80 Hz vibration generated by distributed electric propulsion exerts a significant effect on ride comfort. This frequency band overlaps with the resonance frequencies of several anatomical structures (eyeball ≈ 20–90 Hz; cranial structures ≈ 30–50 Hz) and can produce blurred vision and head discomfort, generating a positive feedback loop between physical discomfort and psychological anxiety. NASA’s ride-quality simulator study has explicitly verified the negative physiological responses elicited under large-scale motion conditions [
6]. Schachner et al. [
13] reported at the 2025 Aviation Psychology Symposium that anxiety scores during the boarding phase can in fact exceed those during cruise, suggesting that pre-flight expectation management also warrants attention.
Existing aviation anxiety-mitigation strategies operate predominantly in an open-loop fashion and adapt poorly to eVTOL operations. Pre-flight cognitive-behavioural therapy requires scheduled sessions and is incompatible with on-demand boarding. Pharmacological approaches suffer from a mismatch between the onset time of the drug and the 15–30 min trip duration. Static cabin amenities cannot accommodate individual physiological variation. To the best of our knowledge, no published work has yet developed a real-time closed-loop solution for anxiety monitoring and mitigation that is specifically designed for the eVTOL passenger and the high-frequency vibration environment unique to this platform. Filling this gap is the motivation for the present study.
The target of the present system is not the clinical treatment of anxiety disorders, but the short-term mitigation of acute state anxiety in a transport cabin. This distinction is important for the intervention logic. Cognitive–behavioural approaches are effective when passengers can complete structured preparation before travel, but they do not match the on-demand and short-duration nature of eVTOL trips. Pharmacological approaches raise additional problems of onset latency, individual variability, and possible sedation. Static cabin interventions such as lighting, music, or interior design may improve the general ambience, but they remain open-loop and cannot adapt to a passenger whose autonomic state is changing over seconds. A closed-loop system is therefore required not because existing anxiety treatments are ineffective in general, but because the eVTOL cabin imposes a specific combination of short exposure time, high sensory load, and large inter-individual physiological variation.
2.2. Ear-Based Physiological Sensing
Although wrist-worn devices are convenient, they suffer a fundamental signal-quality bottleneck under acute anxiety: sympathetically driven peripheral vasoconstriction sharply reduces the SNR of wrist-site PPG [
7,
8]. Chest-strap monitors offer higher fidelity but conflict with the requirement for unobtrusive boarding. The in-ear approach uses the external auditory canal as an alternative measurement site, where multiple physiological signals can be acquired in parallel, and has therefore attracted growing interest. Ferlini et al. [
9] demonstrated that in-ear PPG can capture not only heart rate but also respiratory rate and blood-pressure-related parameters, illustrating the multimodal potential of the platform. Mandic et al. [
14] published the most comprehensive review of multimodal hearables to date, reporting the first prototype to integrate EEG, ECG, and PPG within a single in-ear device. The systematic reviews by Azudin et al. [
15] and Masè et al. [
16] both confirm the reliability and accuracy with which in-canal PPG can extract cardiovascular parameters.
The advantage of the in-ear site over the wrist site is therefore functional rather than merely ergonomic. For the present use case, the in-ear position offers four specific advantages: a more centrally perfused PPG measurement site that is less vulnerable to anxiety-induced peripheral vasoconstriction; a mechanically stable relation to the head during seated vibration; the possibility of co-locating sensing with cymba-concha tVNS electrodes; and an earphone-like form factor that is compatible with public-transport boarding. These advantages do not imply that in-ear sensing is universally superior to wrist sensing, but they make it more appropriate for closed-loop passenger-state regulation in a compact eVTOL cabin.
In the area of human-factors design for in-ear wearables, Fan et al. [
17] measured 23 anthropometric parameters of 1400 ears (700 Chinese participants) and identified the tragus-expansion angle (TEA, 28–42°) as the key predictor of fit stability and sensor contact quality. The same group [
18] subsequently classified the auricular morphology of 1400 participants into five types and showed a strong association between ear type and age, providing fine-grained guidance for earpiece fitting across populations. These anthropometric findings directly informed the earpiece geometry of our in-ear sensing module. A recent evaluation by Parikh et al. [
19] further demonstrated that in-ear PPG sensors can reliably measure vagal-tone-related HRV parameters (RMSSD and HF power).
The cited in-ear PPG studies support this rationale through different forms of evidence. Ferlini et al. validated in-ear PPG by comparing ear-derived vital-sign estimates with reference physiological measurements during controlled daily-activity conditions. The reviews by Alafeef and Fraiwan and by Masè et al. synthesised evidence across hearable PPG studies and concluded that in-canal signals can support cardiovascular-parameter extraction when sensor contact is stable. Fan et al. derived the anthropometric constraints from direct measurement of 1400 ears, linking tragus-expansion angle to fit stability and contact quality. O’Sullivan et al. evaluated ear-derived HRV parameters relevant to vagal tone by comparison with reference measurements. Collectively, these studies justify the in-ear form factor, while also showing that validation under sustained propulsion-like vibration remained unresolved before the present work.
All of the above evidence, however, was obtained under static or mild-motion conditions. Whether in-ear sensors can preserve sufficient signal quality under the sustained 20–80 Hz mechanical vibration generated by an eVTOL propulsion system to support reliable HRV feature extraction—and how the corresponding signal-processing pipeline should be designed—are the open questions that the present study seeks to answer.
2.3. Signal Processing Under Vibration
The signal-processing pipeline is the technical layer that links in-ear sensing hardware to intelligent intervention. Seok et al. [
20] surveyed motion-artefact removal techniques for wearable PPG and noted that adaptive filtering, independent component analysis, and deep learning each have appropriate use cases. Recursive least-squares (RLS) adaptive filters can improve PPG SNR by more than 10 dB during active motion [
21]. Kalman-filter frameworks have proved more robust under variable-speed motion. A recent compressed-sensing PPG implementation has achieved reliable heart-rate extraction at only 172 µW [
22], opening a route to ultra-low-power edge processing. Adaptive notch filters can track drifting rotor harmonics. None of these methods, however, has been validated against the relevant scenario for the present work: continuous broadband (20–80 Hz) mechanical excitation transmitted from an external airframe rather than from the wearer’s own limbs. Their effectiveness, and their ability to separate such excitation from physiological signals in the 0.5–4 Hz band, has yet to be tested experimentally.
For HRV feature extraction and classification, the Lomb–Scargle periodogram solves spectral estimation directly on non-uniformly sampled time points and so avoids the spectral distortion that interpolation of the inter-beat-interval (IBI) series introduces [
23]. A recent CNN-BiLSTM hybrid architecture has raised stress-detection accuracy to 94.1% using PPG alone [
24], substantially outperforming earlier LSTM and random-forest approaches. The WESAD multimodal dataset [
25] remains the standard benchmark in this area. Yet, existing classifiers have almost without exception been developed under low-vibration or static conditions. Whether classification performance can be sustained on in-ear PPG signals that have passed through a vibration-suppression pipeline, and whether prediction lead time is sufficient for real-time intervention, are not currently answered by the literature. The present study addresses both questions through dedicated signal-processing and classification experiments.
Several model families could be used for anxiety-state recognition from wearable physiological signals. Traditional classifiers such as support-vector machines, random forests, and gradient-boosted trees are robust for small samples, but they depend heavily on manually engineered features and do not model temporal evolution explicitly. Stand-alone 1-D CNNs capture local waveform or feature-window patterns but are less suitable for gradual state transitions. LSTM and GRU networks model sequential dependence but are less efficient at extracting local short-window patterns from noisy physiological streams. Transformer-based models provide strong sequence-modelling capacity, but their data and computational requirements are difficult to justify for a small, edge-computing implementation. The CNN-LSTM architecture was therefore selected as a pragmatic compromise: the CNN layers extract local HRV-pattern changes, whereas the LSTM layers model the progressive development of anxiety across overlapping windows.
2.4. Closed-Loop Biofeedback Systems
Closed-loop biofeedback systems that continuously monitor physiological state and adjust intervention parameters in real time have proved superior to open-loop alternatives in stress and anxiety management, achieving levels of personalisation and temporal precision that fixed-protocol approaches cannot match. Using functional MRI, Yakunina et al. [
10] determined optimal stimulation parameters for tVNS and showed that currents in the 0.5–5 mA range can effectively activate the nucleus tractus solitarius in the brainstem while suppressing limbic hyperactivity. Clancy et al. [
26] confirmed that tVNS produces a rapid reduction in sympathetic nerve activity. Clinical evidence has accumulated quickly in recent years: Austelle et al. [
27] reported that tVNS attenuates the early heart-rate acceleration evoked by the cold-pressor test; Ferreira et al. [
28] used a double-blind RCT to show that tVNS reduces masseter tension, pain, and anxiety in university students; and Jackowska et al. [
29] found in a recent RCT that a two-week daily tVNS protocol significantly relieves subthreshold anxiety symptoms in a community sample. A combined tVNS-and-neuro feedback intervention study [
30] reported complementary effects mediated through distinct neural pathways, indicating that multimodal integration can enhance overall efficacy.
Theta-band binaural beats (4–8 Hz) entrain cortical oscillations associated with relaxed attention. The meta-analysis by Garcia-Argibay et al. [
31] confirmed their anxiolytic and mood-improving effects under laboratory conditions. Warm lighting at 2700–3000 K reduces short-wavelength stimulation of the intrinsically photosensitive retinal ganglion cells (ipRGCs), thereby lowering the secretion of arousal-related hormones. Jiang et al. [
32] showed that colour-temperature changes have a significant effect on heart rate and electrodermal activity in confined environments.
Despite these advances, two critical limitations remain. First, existing closed-loop systems have been developed for static clinical or laboratory environments and do not address the constraints imposed by a high-vibration mobile setting. Second, integration of neural, auditory, and environmental modalities within a single adaptive framework remains rare. The present study aims to fill this dual gap.
Table 1 summarises the comparison between existing approaches and the present work.
3. Materials and Methods
3.1. System Architecture
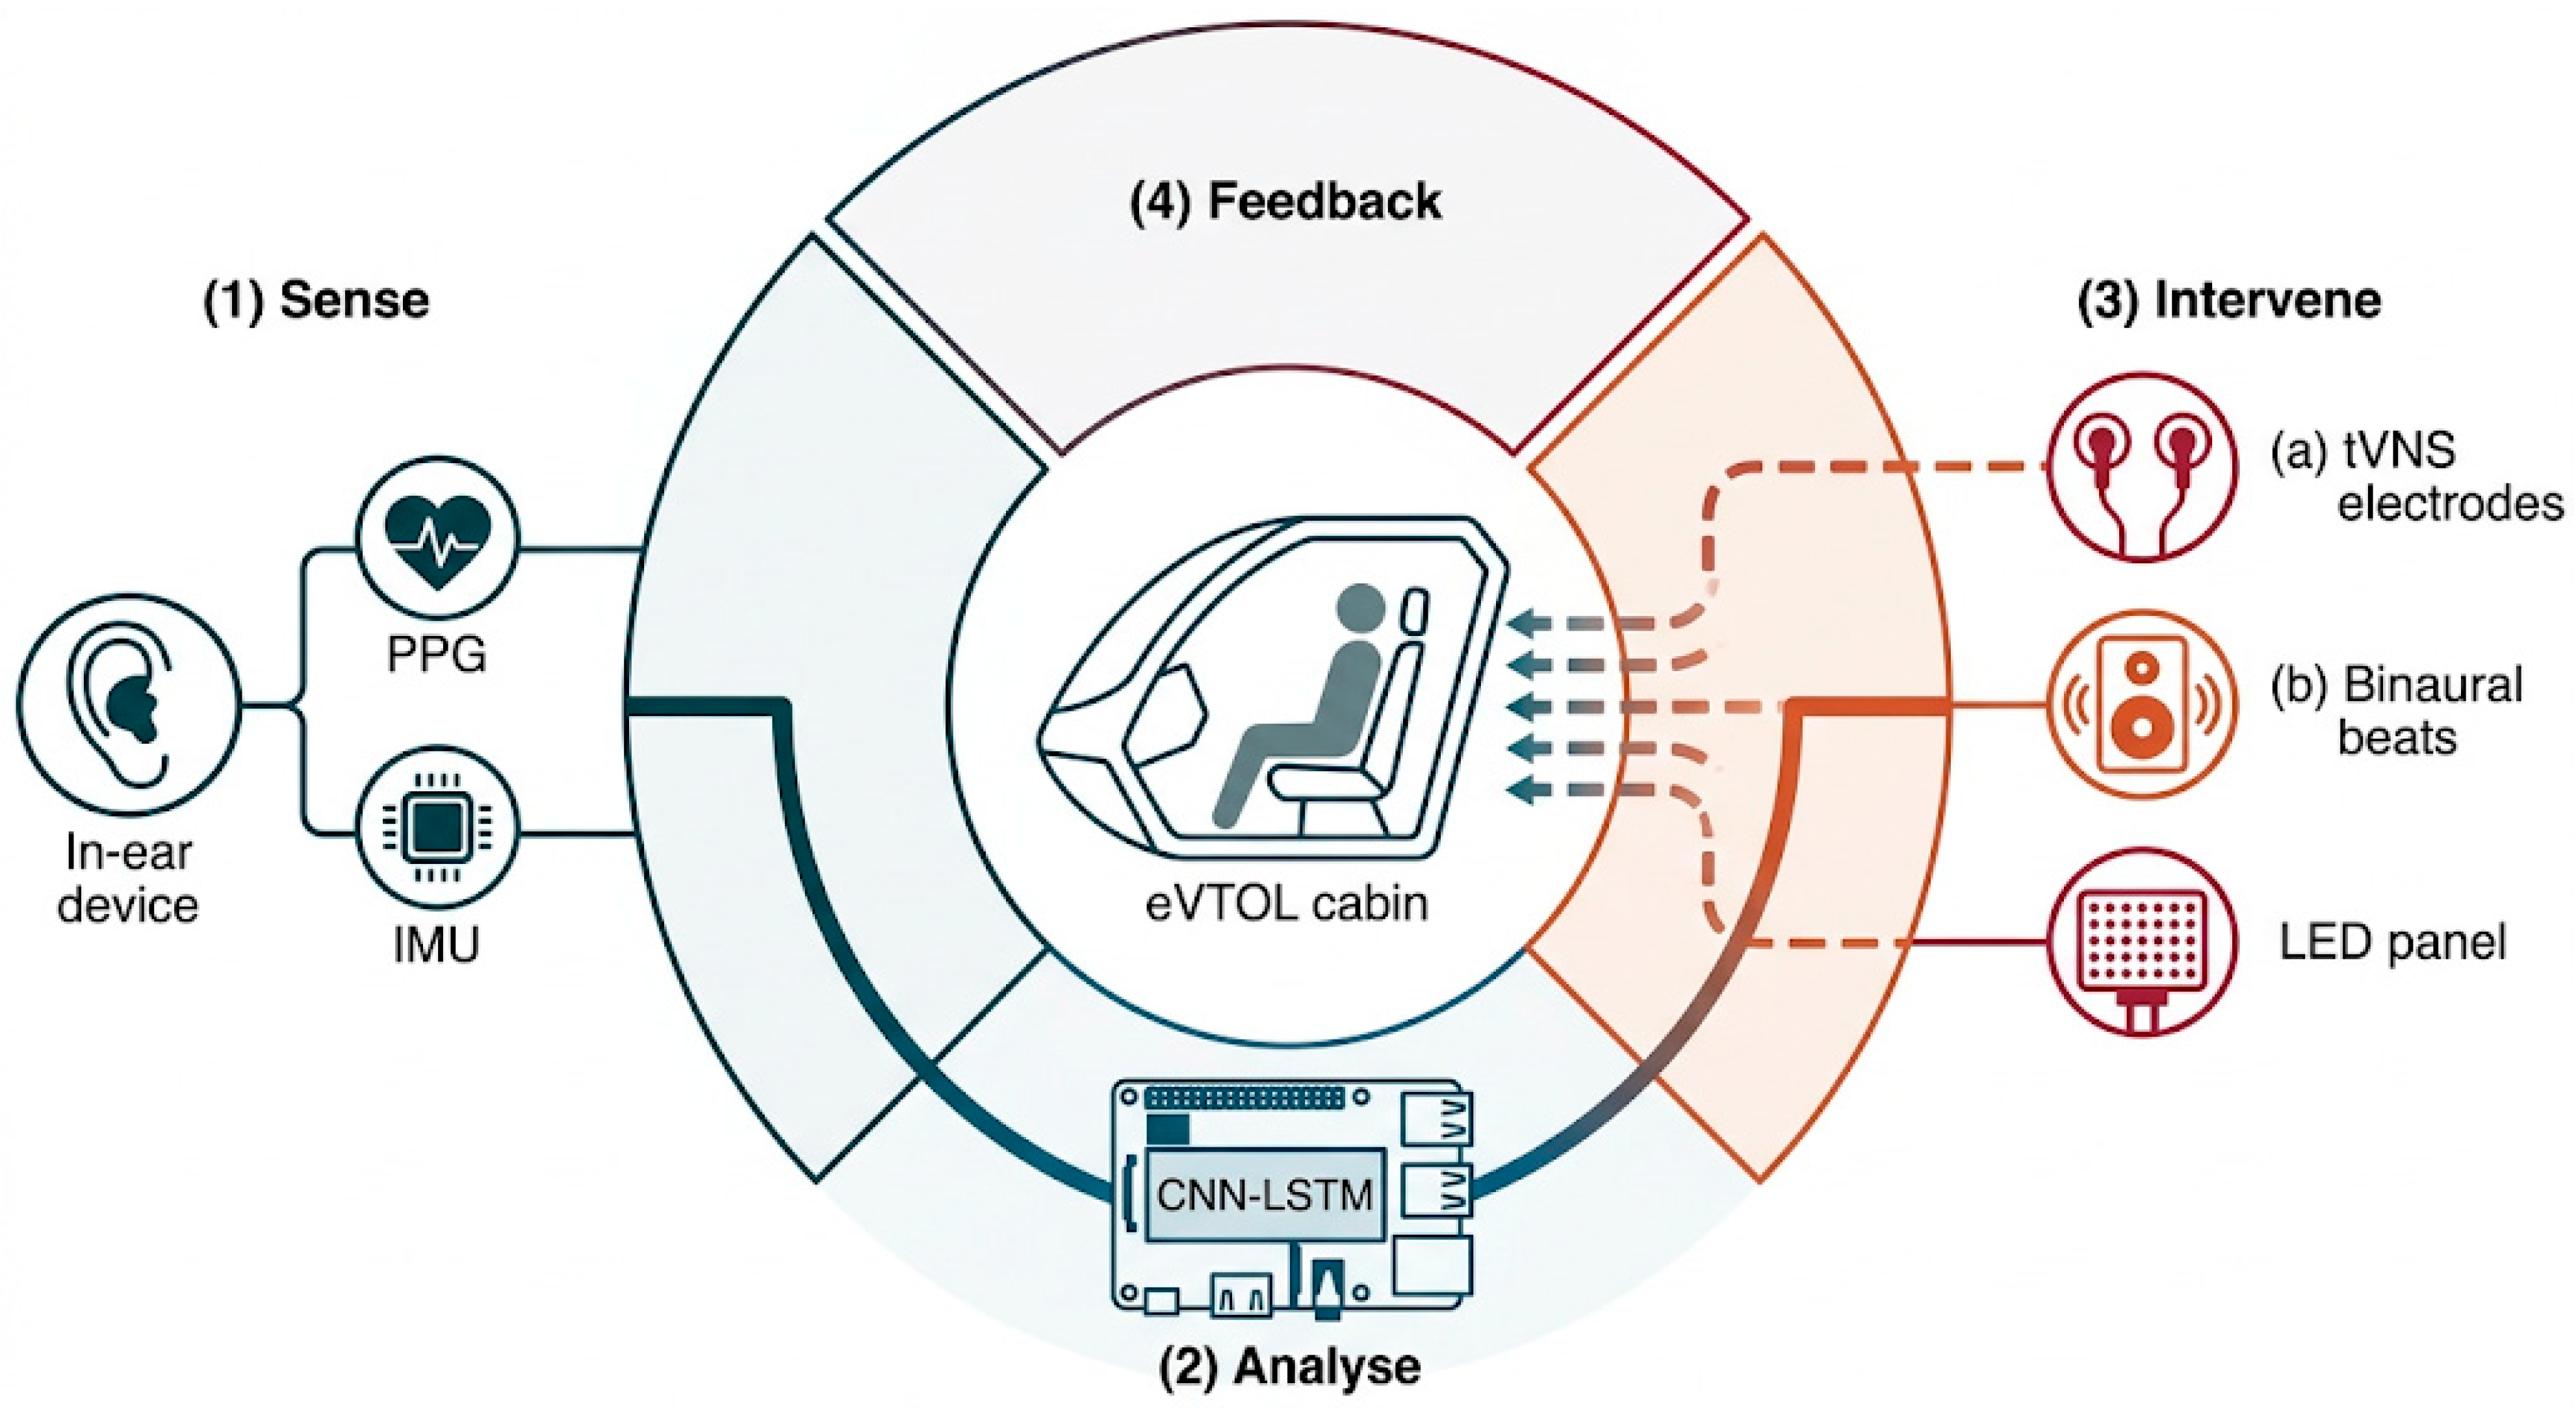
The architecture of the closed-loop anxiety-mitigation system follows a
human-in-the-loop control philosophy: the system is designed not to replace the passenger’s own emotional regulation, but to function as an external auxiliary loop that continuously senses the autonomic state, intervenes early when anxiety signals appear, and at the same time preserves the priority of natural recovery. This philosophy is realised in a four-stage cyclic structure—
Sense, Analyse, Intervene, and Feedback—in which every stage is shaped by the human-factors constraints of the eVTOL cabin (
Figure 1).
The loop is realised by three interconnected subsystems. The sensing subsystem consists of a pair of custom in-ear devices that acquire PPG and IMU data. The processing subsystem runs on a portable edge-computing platform (Raspberry Pi 4 Model B; Broadcom BCM2711; 4 GB RAM) and performs signal conditioning, feature extraction, anxiety classification, and intervention-strategy computation. Edge computing is preferred over cloud processing because wireless connectivity in low-altitude urban airspace is intermittent; local processing eliminates latency and keeps the system operational during communication dropouts. The intervention subsystem delivers tVNS and binaural beats through the in-ear devices, while the cabin LED panel modulates colour temperature.
The system uses a dual-rate architecture. Physiological sampling at 200 Hz preserves the morphological detail of the PPG waveform, supporting accurate peak detection and IBI extraction; closed-loop decisions are issued at 1 Hz so that intervention parameters change gradually across multiple cardiac cycles. In an anxiety-mitigation context this gradualism is essential—any abrupt change in the environment can itself become a stressor.
3.2. Hardware Design
3.2.1. Anthropometric Basis
The choice of the in-ear form factor rests on three considerations: the external auditory canal belongs to the central circulation and preserves PPG signal quality during peripheral vasoconstriction; an earphone form factor carries no social stigma in public transport; and the cymba conchae distribution of the ABVN allows sensing and neuromodulation to be co-located.
Earpiece geometry is based on the Chinese-adult auditory-canal anthropometric data published by Fan et al. [
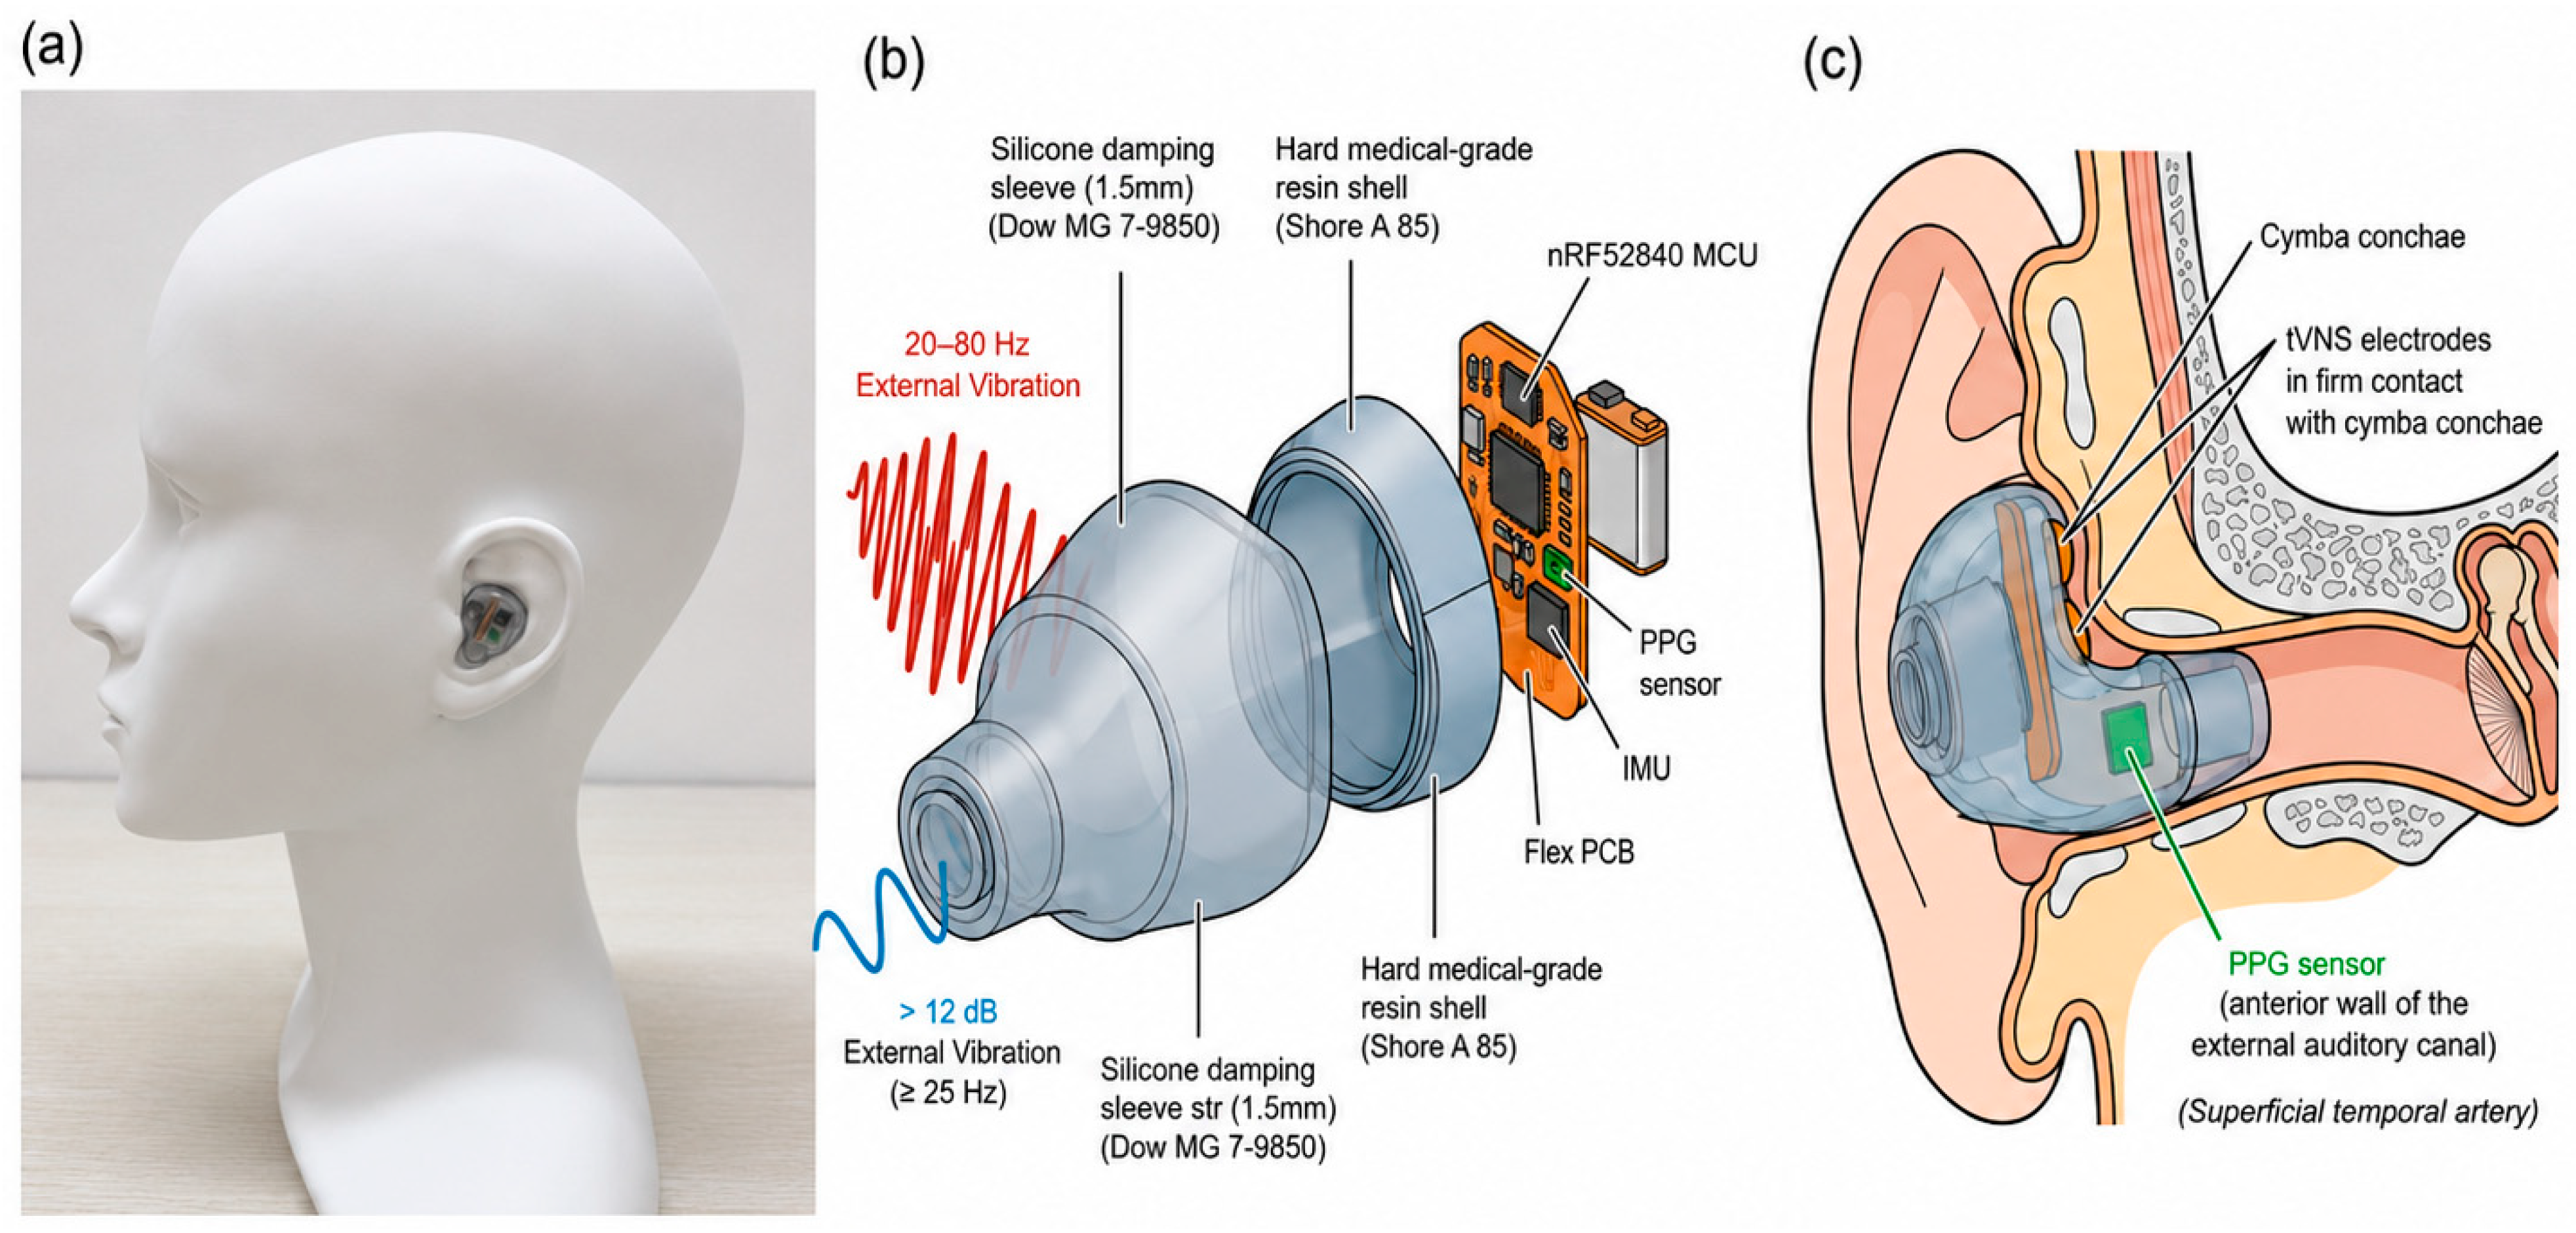
17]—23 dimensional parameters from 1400 ears—where TEA (28–42°) is identified as the key predictor of fit stability. Our earpiece covers the 30–40° TEA range, balancing population fit against sensor contact quality. The shell is fabricated by stereolithography (Form 3B, Formlabs) from a medical-grade resin (Shore A 85). An outer silicone sleeve (Dow MG 7-9850; Shore A 30; 1.5 mm) provides both comfortable contact and a mechanical low-pass filter. Bench testing confirmed more than 12 dB of attenuation above 25 Hz, providing a hardware-level countermeasure to the 20–80 Hz vibration of distributed electric propulsion [
5].
3.2.2. Sensor and Electrode Integration
Sensing and intervention elements are arranged around the anatomy of the auditory canal (
Figure 2). The dual-wavelength PPG sensor (MAX30102) is positioned on the anterior wall of the canal—the area perfused by the superficial temporal artery—with the 525 nm green channel as the primary heart-rate channel and the 940 nm infrared channel as an auxiliary reference. A six-axis IMU (ICM-42688-P; 200 Hz) is rigidly mounted on the PCB to capture head motion and micro-vibration as a reference signal for adaptive noise cancellation. Two tVNS electrodes (carbon–silicone composite; 28 mm
2; 8 mm spacing) make contact with the cymba conchae [
10]. Two GSR electrodes (Ag/AgCl dry contacts) sample skin-conductance level at 64 Hz as an auxiliary verification channel. Hardware specifications are listed in
Table 2.
3.3. Signal-Processing Pipeline
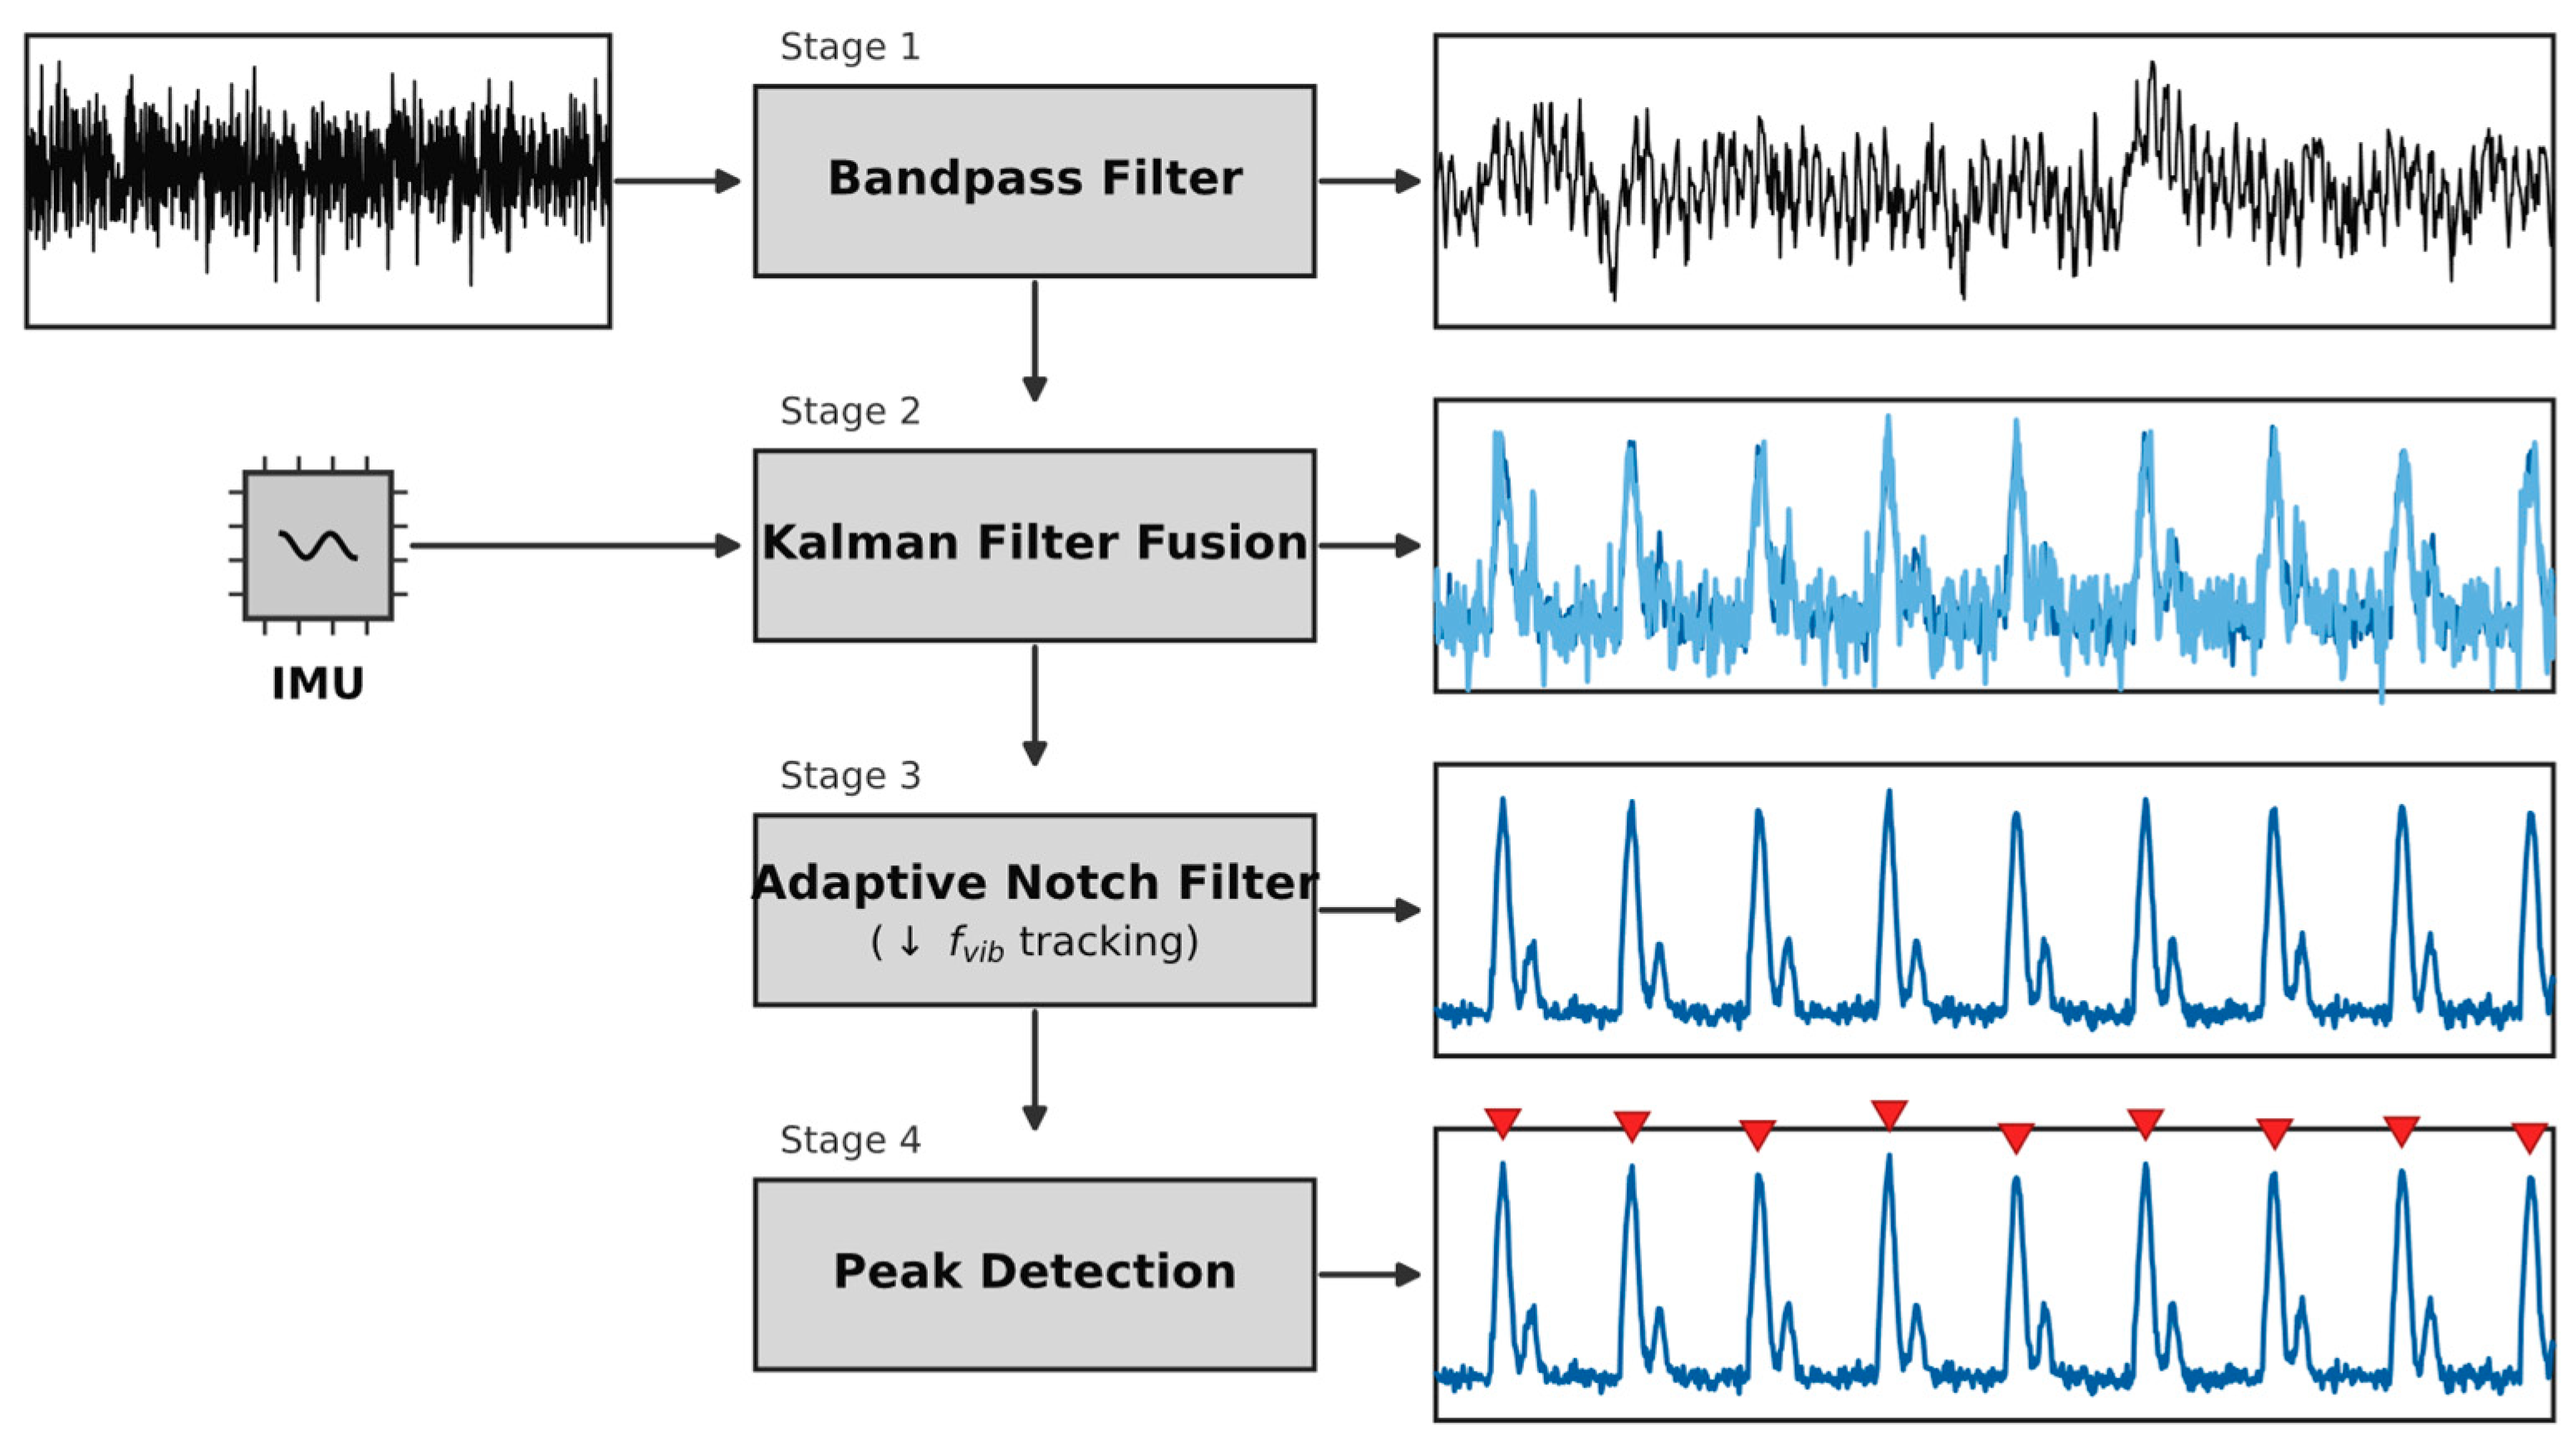
Extracting reliable HRV features from in-canal PPG under vibration is the central technical challenge. We therefore designed a four-stage cascaded pipeline (
Figure 3). The architecture proceeds from broad to narrow: a wideband filter removes out-of-band components (Stage 1); IMU-referenced state-space fusion removes broadband motion artefacts (Stage 2); a frequency-tracking notch filter suppresses residual rotor harmonics (Stage 3); and peak detection together with artefact rejection produces a clean IBI series (Stage 4). A staged scheme was chosen over end-to-end deep learning denoising because the physical transmission mechanism of eVTOL vibration is well understood; staged processing exploits this prior knowledge fully and allows each stage to be validated and tuned independently.
Stage 1 (band-pass pre-filtering). A fourth-order Butterworth band-pass filter (0.5–8 Hz) removes the DC offset and high-frequency noise. The 0.5 Hz lower cut-off accommodates sinus bradycardia (≈30 bpm), and the 8 Hz upper cut-off retains morphological features such as the dicrotic notch.
Stage 2 (Kalman sensor fusion). The band-pass-filtered PPG is modelled as y(k) = x(k) + H·a(k) + v(k), where x is the physiological signal, a is the three-axis acceleration, H is the motion-artefact transfer matrix estimated online by recursive least squares, and v is Gaussian noise. A linear Kalman filter (state dimension 4; Q = diag(0.01, 0.1, 0.1, 0.1); R = 0.5) dynamically subtracts the motion-related interference. A Kalman framework is preferred because vibration intensity in eVTOL flight changes with flight phase—strong on take-off, weak in cruise, with sudden bursts in turbulence—and the predict-correct mechanism of a state-space model accommodates this time-varying behaviour better than a static adaptive filter.
Stage 3 (adaptive notch filtering). A 256-point FFT is applied to the IMU acceleration magnitude every second to identify the dominant vibration frequency f_vib. An adaptive IIR notch filter (2 Hz bandwidth, centre frequency tracking f_vib) removes the narrow-band rotor harmonics. This stage is what distinguishes our pipeline from conventional approaches: it is targeted at the quasi-periodic vibration transmitted from the airframe rather than at limb motion of the wearer.
Stage 4 (peak detection and IBI extraction). A derivative-threshold algorithm identifies systolic peaks; the adaptive threshold is set at 0.6 times the sliding median amplitude of the most recent ten beats. IBIs that fall outside the physiological range of 300–1500 ms or that deviate from the local median by more than 20% are replaced by cubic-spline interpolation.
Validation. The vibration–validation protocol was separated from the full stress-induction experiment to avoid conflating signal quality with intervention efficacy. The signal-quality validation used a controlled 40 Hz excitation at 0.3 m/s
2 RMS, whereas the experimental cruise condition in
Section 3.6.2 used 40 Hz vibration at 0.2 m/s
2 RMS with transient perturbations of 0.5 m/s
2 RMS for 8 s. The in-ear PPG and Polar H10 reference ECG were synchronised at recording onset; IBIs derived from the processed PPG waveform were temporally aligned with ECG R-R intervals. SNR was calculated as 10log10(P_signal/P_noise) before and after each processing stage, and windows with more than 10% invalid peaks were excluded from the per-protocol signal-quality analysis. Under the 40 Hz, 0.3 m/s
2 RMS validation condition, the processed signal reached an SNR of 24.1 dB and a Pearson correlation of r = 0.96 ± 0.02 with R-R intervals derived from the Polar H10 chest-strap ECG.
3.4. Anxiety-State Recognition
3.4.1. Feature Extraction
Acute anxiety manifests in the autonomic nervous system as sympathetic dominance: heart rate increases, beat-to-beat variability decreases, and spectral power shifts towards the low-frequency band [
36]. From the artefact-corrected IBI series, the system extracts five features within a 30 s sliding window (5 s step): RMSSD and pNN50 in the time domain; LF power (0.04–0.15 Hz), HF power (0.15–0.4 Hz), and the LF/HF ratio in the frequency domain (computed via the Lomb–Scargle periodogram [
23]).
3.4.2. Classification Model
Before selecting the final classifier, the application constraints were considered at the architecture level. A purely feature-based classifier would have simplified training but would not capture the temporal persistence of anxiety. A stand-alone recurrent model would capture temporal dependence but would be more sensitive to local artefacts in short HRV windows. A bidirectional model was not selected because the deployed system must operate causally and cannot use future windows when issuing real-time intervention commands. The CNN-LSTM design was therefore chosen because it preserves causal deployment while combining local pattern extraction with sequential prediction.
The system employs a hybrid CNN–LSTM architecture. The one-dimensional convolutional layers extract local time–frequency patterns from the HRV feature series and are translation-invariant to residual vibration artefacts; the LSTM layers capture the gradual evolution of the anxiety state across time windows, supporting predictive rather than reactive intervention. The network consists of two 1-D convolutional layers (32 filters, kernel size 3, ReLU) → max-pooling → two LSTM layers (128 hidden units, inter-layer dropout 0.3) → a fully connected softmax output. Four anxiety levels are defined:
Level 0 (baseline): RMSSD > 40 ms, LF/HF < 2.0;
Level 1 (mild activation): RMSSD 30–40 ms, LF/HF 2.0–3.0;
Level 2 (moderate anxiety): RMSSD 20–30 ms, LF/HF 3.0–5.0;
Level 3 (severe anxiety): RMSSD < 20 ms, LF/HF > 5.0.
Thresholds are set with reference to established HRV measurement standards [
36] and the stress-induction literature, and are then adapted experimentally through individual baseline calibration.
3.4.3. Training and Transfer Strategy
The network was pre-trained on 120 recordings from 40 TSST participants (Adam optimiser; learning rate 0.001; batch size 32; 20% validation set; early-stopping patience of 10 epochs). Five-fold cross-validation on the pre-training set was used for model selection and to stabilise the initial feature representation; the final four-class accuracy and prediction lead time reported in
Section 4.3 were calculated only after transfer to the eVTOL simulation recordings. To bridge the domain gap between TSST recordings and eVTOL deployment, we used a two-stage transfer strategy: (i) the CNN feature-extraction layers were frozen and only the LSTM recurrent layers were fine-tuned on recordings from 10 pilot participants under simulated vibration; and (ii) anxiety-level boundary thresholds were re-calibrated for each participant from their three-minute Stage 1 baseline data, allowing a ±2 ms offset relative to the resting RMSSD baseline.
3.5. Adaptive Intervention Mechanism
3.5.1. Design Rationale
An effective intervention must resolve a central tension: anxiety relief requires sufficient stimulation intensity, yet an overly aggressive intervention can itself become a stressor. We chose Takagi–Sugeno fuzzy logic control for three reasons. The fuzzy output is intrinsically gradual and aligns with the human-factors principle of “implicit intervention”; the rule base is interpretable, and the controller is naturally robust to input noise and inter-individual variation.
3.5.2. Fuzzy Controller
The predicted anxiety level A ∈ {Low, Medium, High} (trapezoidal membership functions) and the HRV trend ΔR ∈ {Decreasing, Stable, Increasing} (triangular membership functions) are mapped to three outputs: tVNS intensity (0–5 mA), binaural-beat amplitude (0–1), and lighting colour temperature (2700–6500 K). The complete rule base is shown in
Table 3. When a passenger shows a spontaneous recovery trend (HRV Increasing), the system actively reduces the intervention intensity (R3, R6, R9) to avoid disrupting the intrinsic homeostatic mechanism.
3.5.3. Intervention Parameters
tVNS. Biphasic charge-balanced pulses; pulse width 200 µs; frequency 25 Hz; current 1–5 mA; duty cycle 75% (30 s on/10 s off). Parameters were chosen on the basis of neuroimaging evidence [
10,
27].
Binaural beats. A 200 Hz carrier in the left ear and a 200 + Δf Hz carrier in the right ear, with Δf ∈ [
4,
8] Hz (theta band). The anxiolytic effect of theta-band frequency differences is supported by meta-analytic evidence [
31].
Lighting colour temperature. The cabin LED panel (Philips Hue; 2700–6500 K; 806 lm) transitions at 100 K/s. Warm light reduces ipRGC short-wavelength stimulation and the secretion of arousal-related hormones [
32].
3.5.4. Online Adaptive Optimisation
Every 30 s the system evaluates the HRV recovery rate (the linear slope of RMSSD over the past 60 s) and uses simultaneous perturbation stochastic approximation (SPSA) to refine the three modality scaling factors w = [w_tVNS, w_beat, w_light] ∈ [0.5, 2.0]3. SPSA is a stochastic approximation method that estimates the gradient of a multi-dimensional objective with only two perturbed evaluations per update, regardless of the number of parameters. This property is important in the present system because the controller must adjust three intervention channels online while physiological recovery remains noisy and time-limited. In intuitive terms, the controller applies a small random perturbation to the channel weights, observes whether the perturbed setting accelerates RMSSD recovery, and then updates the weights in the favourable direction. The gradient is approximated as Δw_i ≈ (L(w + δΔ) − L(w − δΔ))/(2δΔ_i), with L = −ΔR−, Bernoulli perturbation Δ, perturbation magnitude δ = 0.05, and step size α = 0.01.
3.6. Experimental Design
To evaluate the closed-loop system in a simulated eVTOL cruise-vibration environment, we conducted a randomised controlled experiment with two parallel groups: an active group that received closed-loop intervention and a control group that received sham intervention. All data were collected during a single laboratory session of approximately 30 min per participant. The protocol was approved by the Ethics Review Committee of Xi’an University of Technology and was conducted in accordance with the Declaration of Helsinki.
3.6.1. Participants and Sample Size
Healthy volunteers aged 22–45 years were recruited between January and March 2026. Exclusion criteria were implanted cardiac devices, diagnosed anxiety disorder, psychotropic medication, cardiovascular disease, vestibular disorder, pregnancy, ear infection, and colour blindness (which would interfere with the Stroop task). All participants provided written informed consent and received CNY 80 for participation.
The exclusion criteria were set to reduce confounding and safety risk in this first proof-of-concept validation. Elderly participants were not included because age-related differences in HRV baseline, vascular compliance, skin impedance, vestibular sensitivity, and ear-canal morphology could alter both the sensing signal and the intervention response. Participants with diagnosed anxiety disorders were excluded because clinical symptoms, medication status, and risk of symptom exacerbation would require a separate clinical protocol and ethics review. The present sample was therefore restricted to healthy adults in order to validate the sensing-classification-intervention loop before extending the study to higher-risk passenger groups.
Sample size was estimated a priori with G*Power 3.1. Drawing on reported tVNS effect sizes of
d = 0.8–1.2 [
26,
27], we adopted a conservative
d = 0.8. A two-sided
t-test (α = 0.05; power 0.80) requires a minimum of
n = 21 per group (
N = 42). Allowing for 15% signal loss, we set the target at 25 per group (
N = 50; power > 0.90).
3.6.2. Experimental Environment
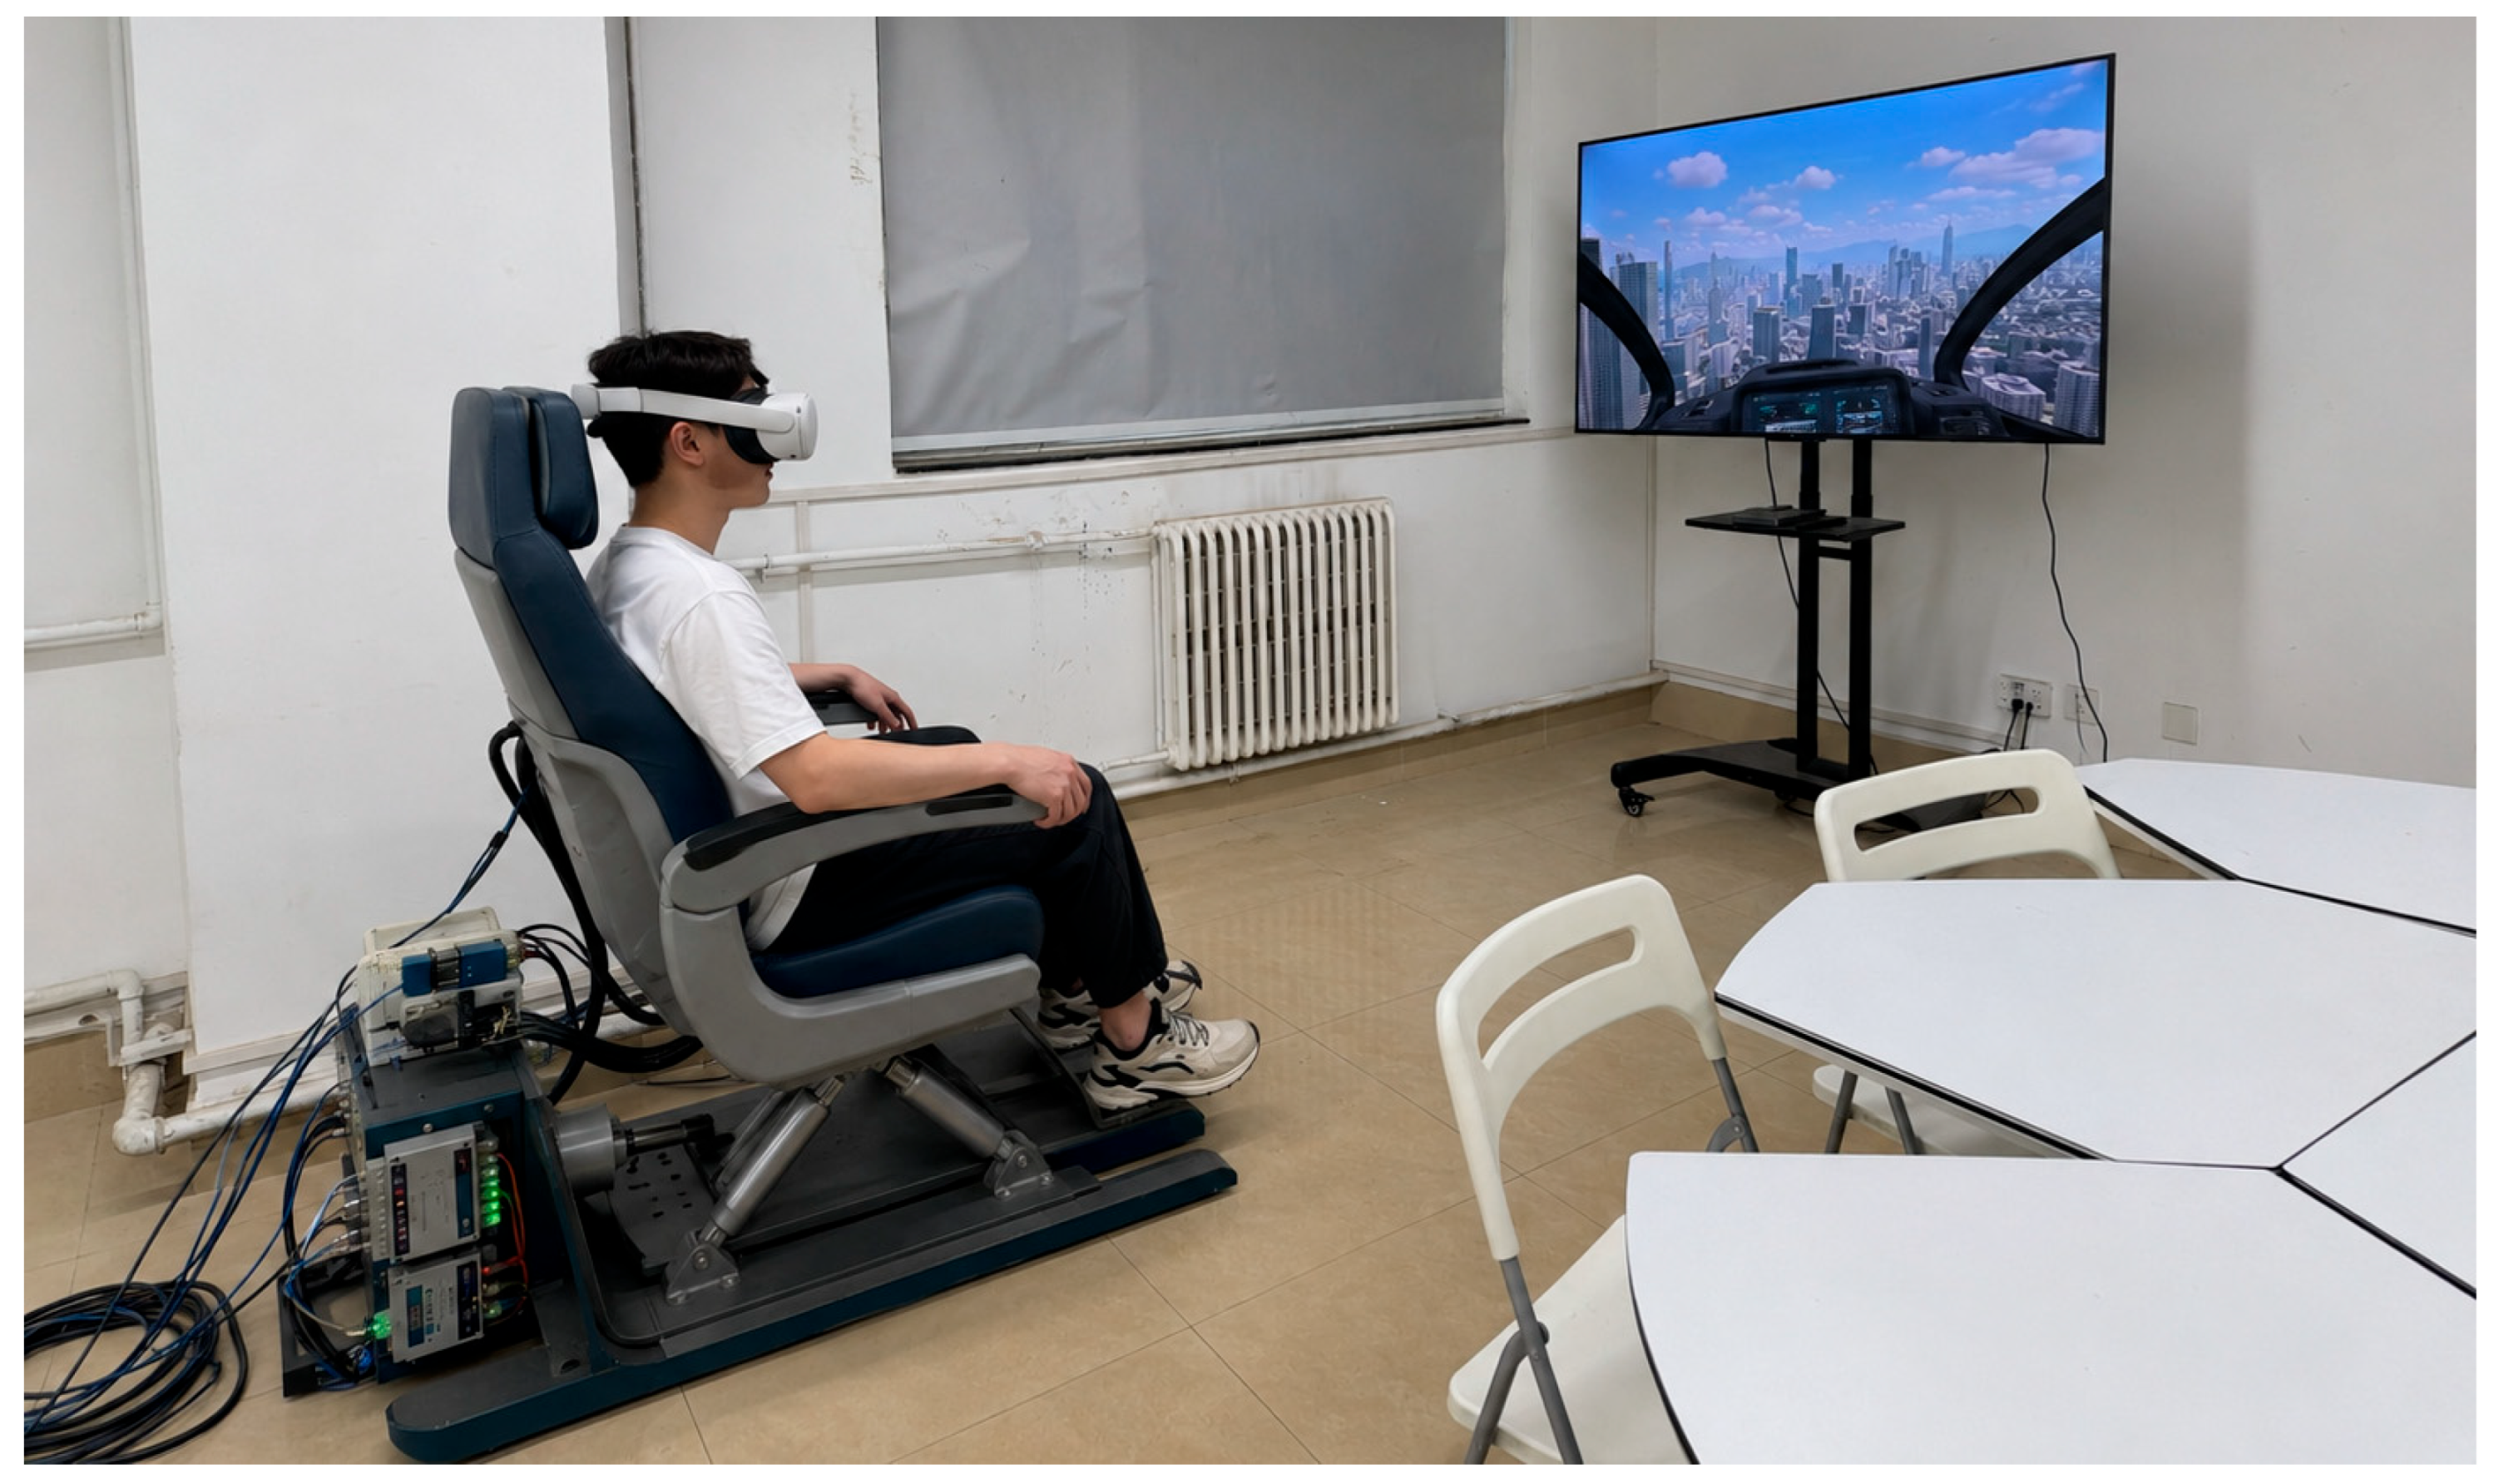
A multi-sensory simulation of the eVTOL cruise phase was constructed in the Human-Factors Engineering Laboratory of the School of Art and Design, Xi’an University of Technology (
Figure 4). The setup focused on reproducing the three-channel sensory experience—vibration, vision, and hearing—encountered during cruise.
Vibration simulation. A low-frequency vibration exciter was fixed to the base frame of a standard laboratory chair to generate continuous vibration centred at 40 Hz with an RMS amplitude of 0.2–0.3 m/s2, reproducing the dominant vibration of distributed electric propulsion under cruise conditions. The exciter was driven by a power amplifier with a pre-programmed waveform file that allowed the vibration amplitude to be raised briefly at scheduled times (to 0.5 m/s2 RMS for 8 s) to simulate sudden turbulence events.
Visual immersion. Participants wore a VR head-mounted display (HTC Vive Pro) and viewed a pre-recorded first-person video of an urban eVTOL cruise (per-eye resolution 2064 × 2208; refresh rate 90 Hz). The footage depicted an urban skyline at a stable cruise altitude of approximately 300 m; during turbulence events, slight visual sway was added to maintain multi-sensory consistency.
Auditory environment. Pre-recorded eVTOL cabin noise (70 dB SPL) was played continuously through laboratory loudspeakers to provide a background ambience. The binaural beats and intervention audio were delivered independently through the in-ear devices.
Lighting environment. A tunable colour-temperature LED panel (Philips Hue; 2700–6500 K) was mounted above the participant to simulate cabin overhead lighting. For the active group the colour temperature was modulated in real time by the closed-loop system; for the control group it was held at a neutral 5000 K.
3.6.3. Experimental Procedure
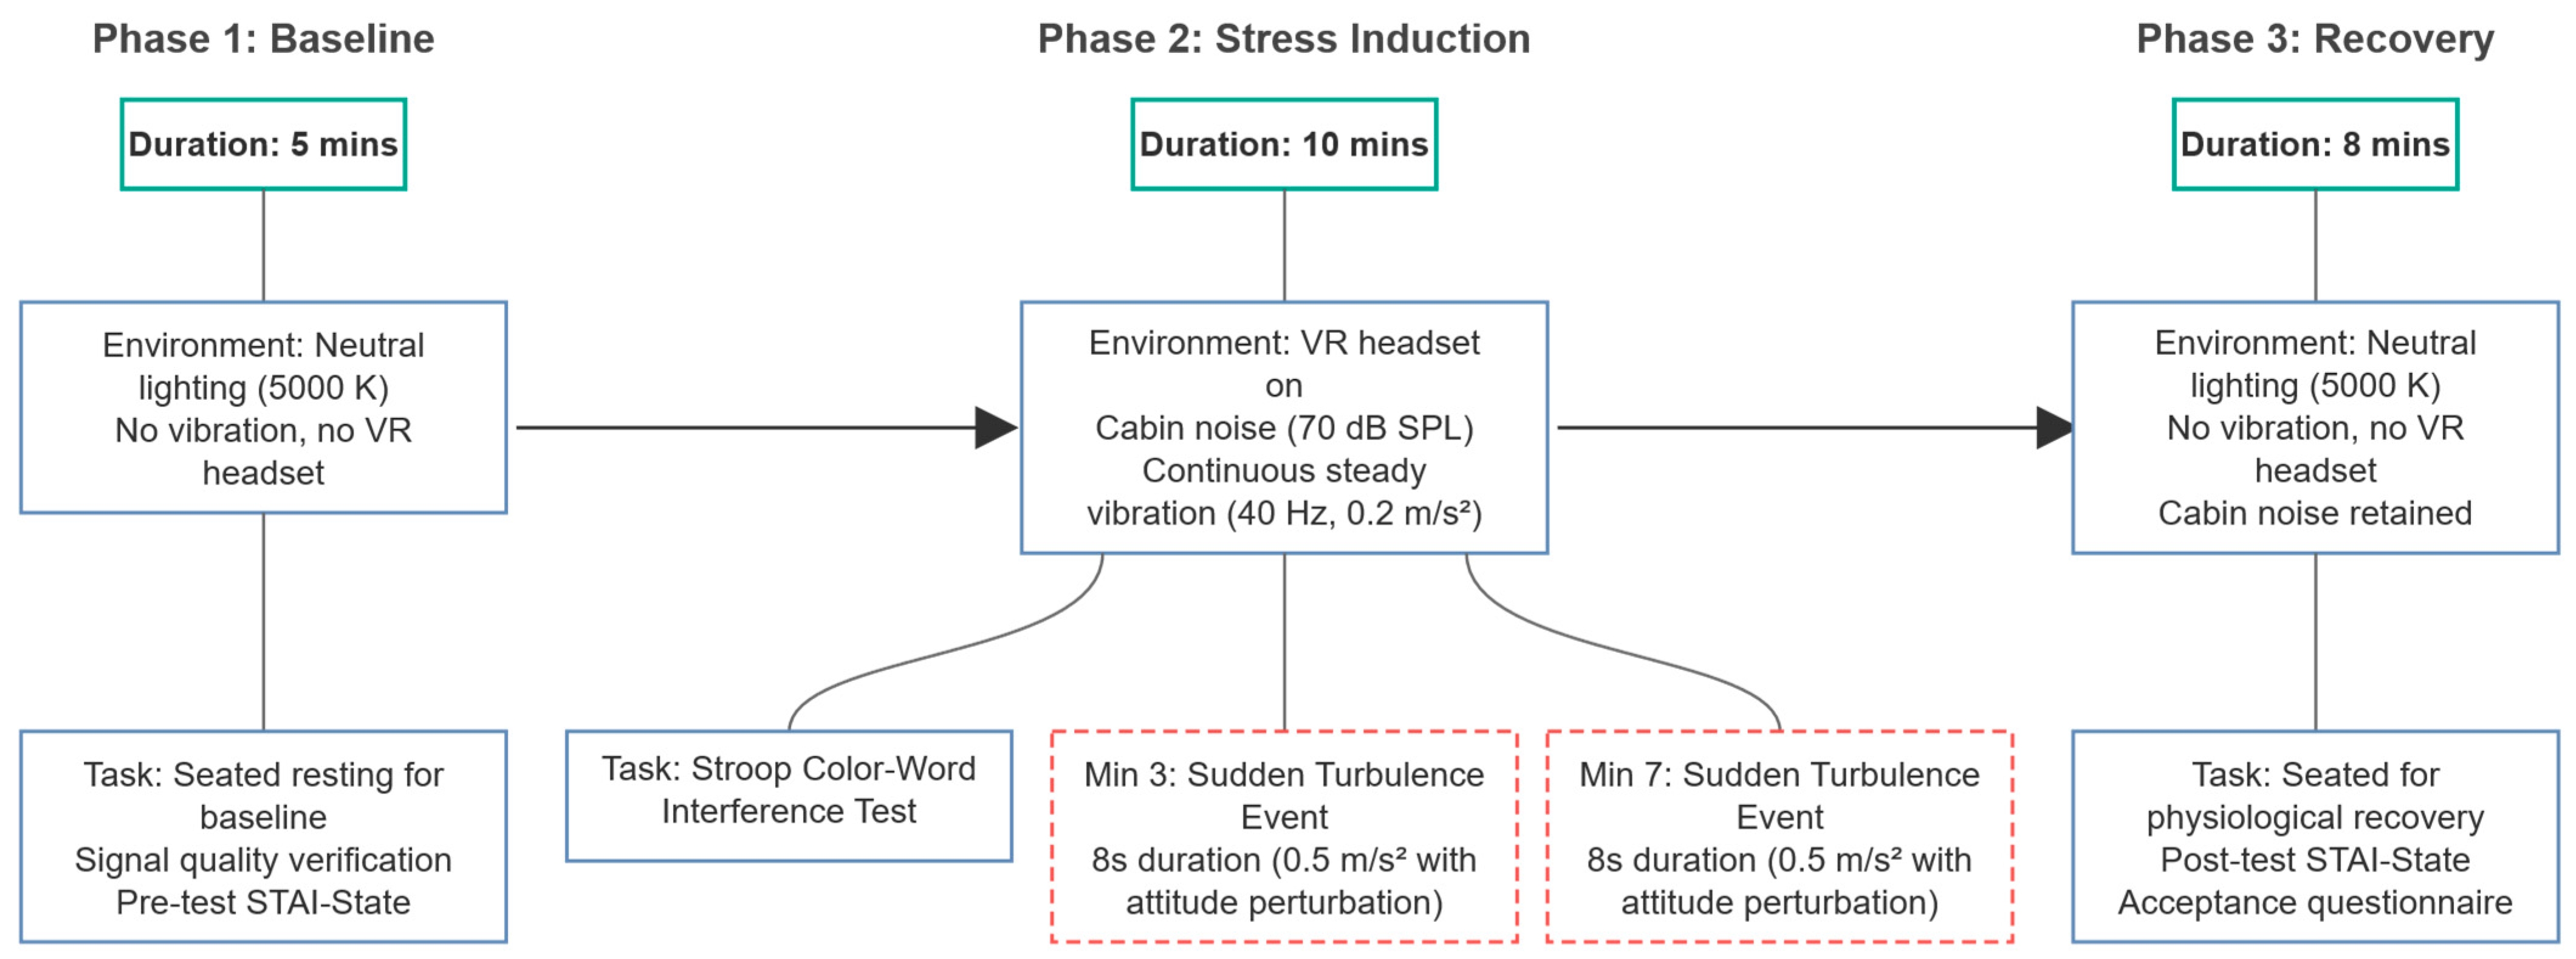
Each test followed a three-phase protocol (
Figure 5).
Phase 1 (baseline, 5 min). The participant sat quietly in the laboratory chair under neutral lighting (5000 K) without vibration and without the VR headset. The experimenter fitted the in-ear devices and verified signal quality (PPG amplitude > 0.1 V; motion artefact < 10% of total variance). Baseline physiological data were recorded and the STAI-State [
37] was completed as a pre-test.
Phase 2 (stress induction, 10 min). The participant put on the VR headset, the vibrating chair and cabin noise were activated, and the simulated urban eVTOL cruise was presented. Vibration was held at a constant 40 Hz, 0.2 m/s2 RMS to reproduce the steady propulsion vibration of cruise. Two “sudden turbulence” events were scheduled at the third and seventh minutes: vibration was briefly raised to 0.5 m/s2 RMS for 8 s while the VR view simultaneously presented an attitude perturbation, reproducing the multi-sensory experience of low-altitude turbulence. On a virtual tablet within the VR scene, participants concurrently performed a Stroop colour–word task (80 trials, 7.5 s each). A combined physical-and-cognitive stressor paradigm was chosen because real eVTOL passengers face simultaneous somatic discomfort and cognitive vigilance towards an unfamiliar mode of transport.
The turbulence parameters were selected as a conservative laboratory surrogate rather than as a full reproduction of real low-altitude turbulence. The 0.5 m/s2 RMS amplitude and 8 s duration were chosen to create a detectable transient perturbation in the physiological signal while avoiding excessive vestibular discomfort or premature task termination in healthy volunteers. Two events were placed at the third and seventh minutes to provide early- and late-phase perturbations within the same stress-induction period while leaving sufficient time between events for partial autonomic stabilisation. Thus, the events were intended to standardise perturbation timing and intensity for comparison between groups, not to exhaustively simulate the complete turbulence envelope of an eVTOL flight.
Phase 3 (recovery, 8 min). Vibration and VR were switched off, the participant removed the headset, and they continued to sit quietly under neutral conditions (5000 K lighting, no vibration, cabin noise only) while physiological recovery was monitored. At the end of the phase, the STAI-State post-test and a user-acceptance questionnaire (10 items, 7-point Likert scale, covering wearing comfort, perception of the intervention, and intention to use) were administered.
3.6.4. Randomisation, Outcomes, and Statistical Analysis
A computer-generated permuted-block sequence (block size 4; R 4.2) assigned participants to the control group (n = 25) or the active group (n = 25). The physical environment (VR and vibration) and the external appearance of the equipment were identical for the two groups. The control group received recording only, with a subthreshold sham stimulus of 0.1 mA and a fixed 5000 K lighting; the active group received the closed-loop intervention (tVNS, binaural beats, and adaptive lighting) during Phases 2 and 3. Blinding integrity was assessed after the test.
The primary outcome was physiological recovery time (PRT), defined as the time required after the end of Phase 2 for RMSSD to return to within ±5% of the Phase 1 baseline mean and to remain stable for at least 60 s. For reproducibility, the Phase 1 baseline was calculated from the last three minutes of the 5 min resting baseline, after signal-quality verification. RMSSD was computed with the same 30 s sliding window and 5 s step used for feature extraction. The recovery clock started at t = 0 when the VR scene and vibration were switched off at the end of Phase 2. PRT was assigned to the first window onset after which all subsequent RMSSD windows within the next 60 s remained within the individual baseline mean ±5% range. If a participant did not satisfy this criterion during the 8 min recovery period, the recovery time was treated as right-censored at 480 s for sensitivity checking and handled in the ITT analysis according to the prespecified LOCF rule.
Statistical analysis was conducted in Python 3.10 (SciPy 1.11; Pingouin 0.5.3) at α = 0.05. After Shapiro–Wilk and Levene tests for normality and homogeneity of variance, the primary outcome PRT was compared using an independent-samples t-test (or Mann–Whitney U test where appropriate); Cohen’s d or r_rb is reported as the effect size. STAI change scores were analysed by analysis of covariance (ANCOVA) with the pre-test as a covariate; the ordinal outcome (peak anxiety) was analysed by Mann–Whitney U; and adverse events were analysed by Fisher’s exact test. Participants with more than 10% physiological signal loss were excluded from the per-protocol (PP) analysis, and an intention-to-treat (ITT) sensitivity analysis was performed using last-observation-carried-forward (LOCF) imputation.
4. Results
4.1. Participant Flow and Baseline Characteristics
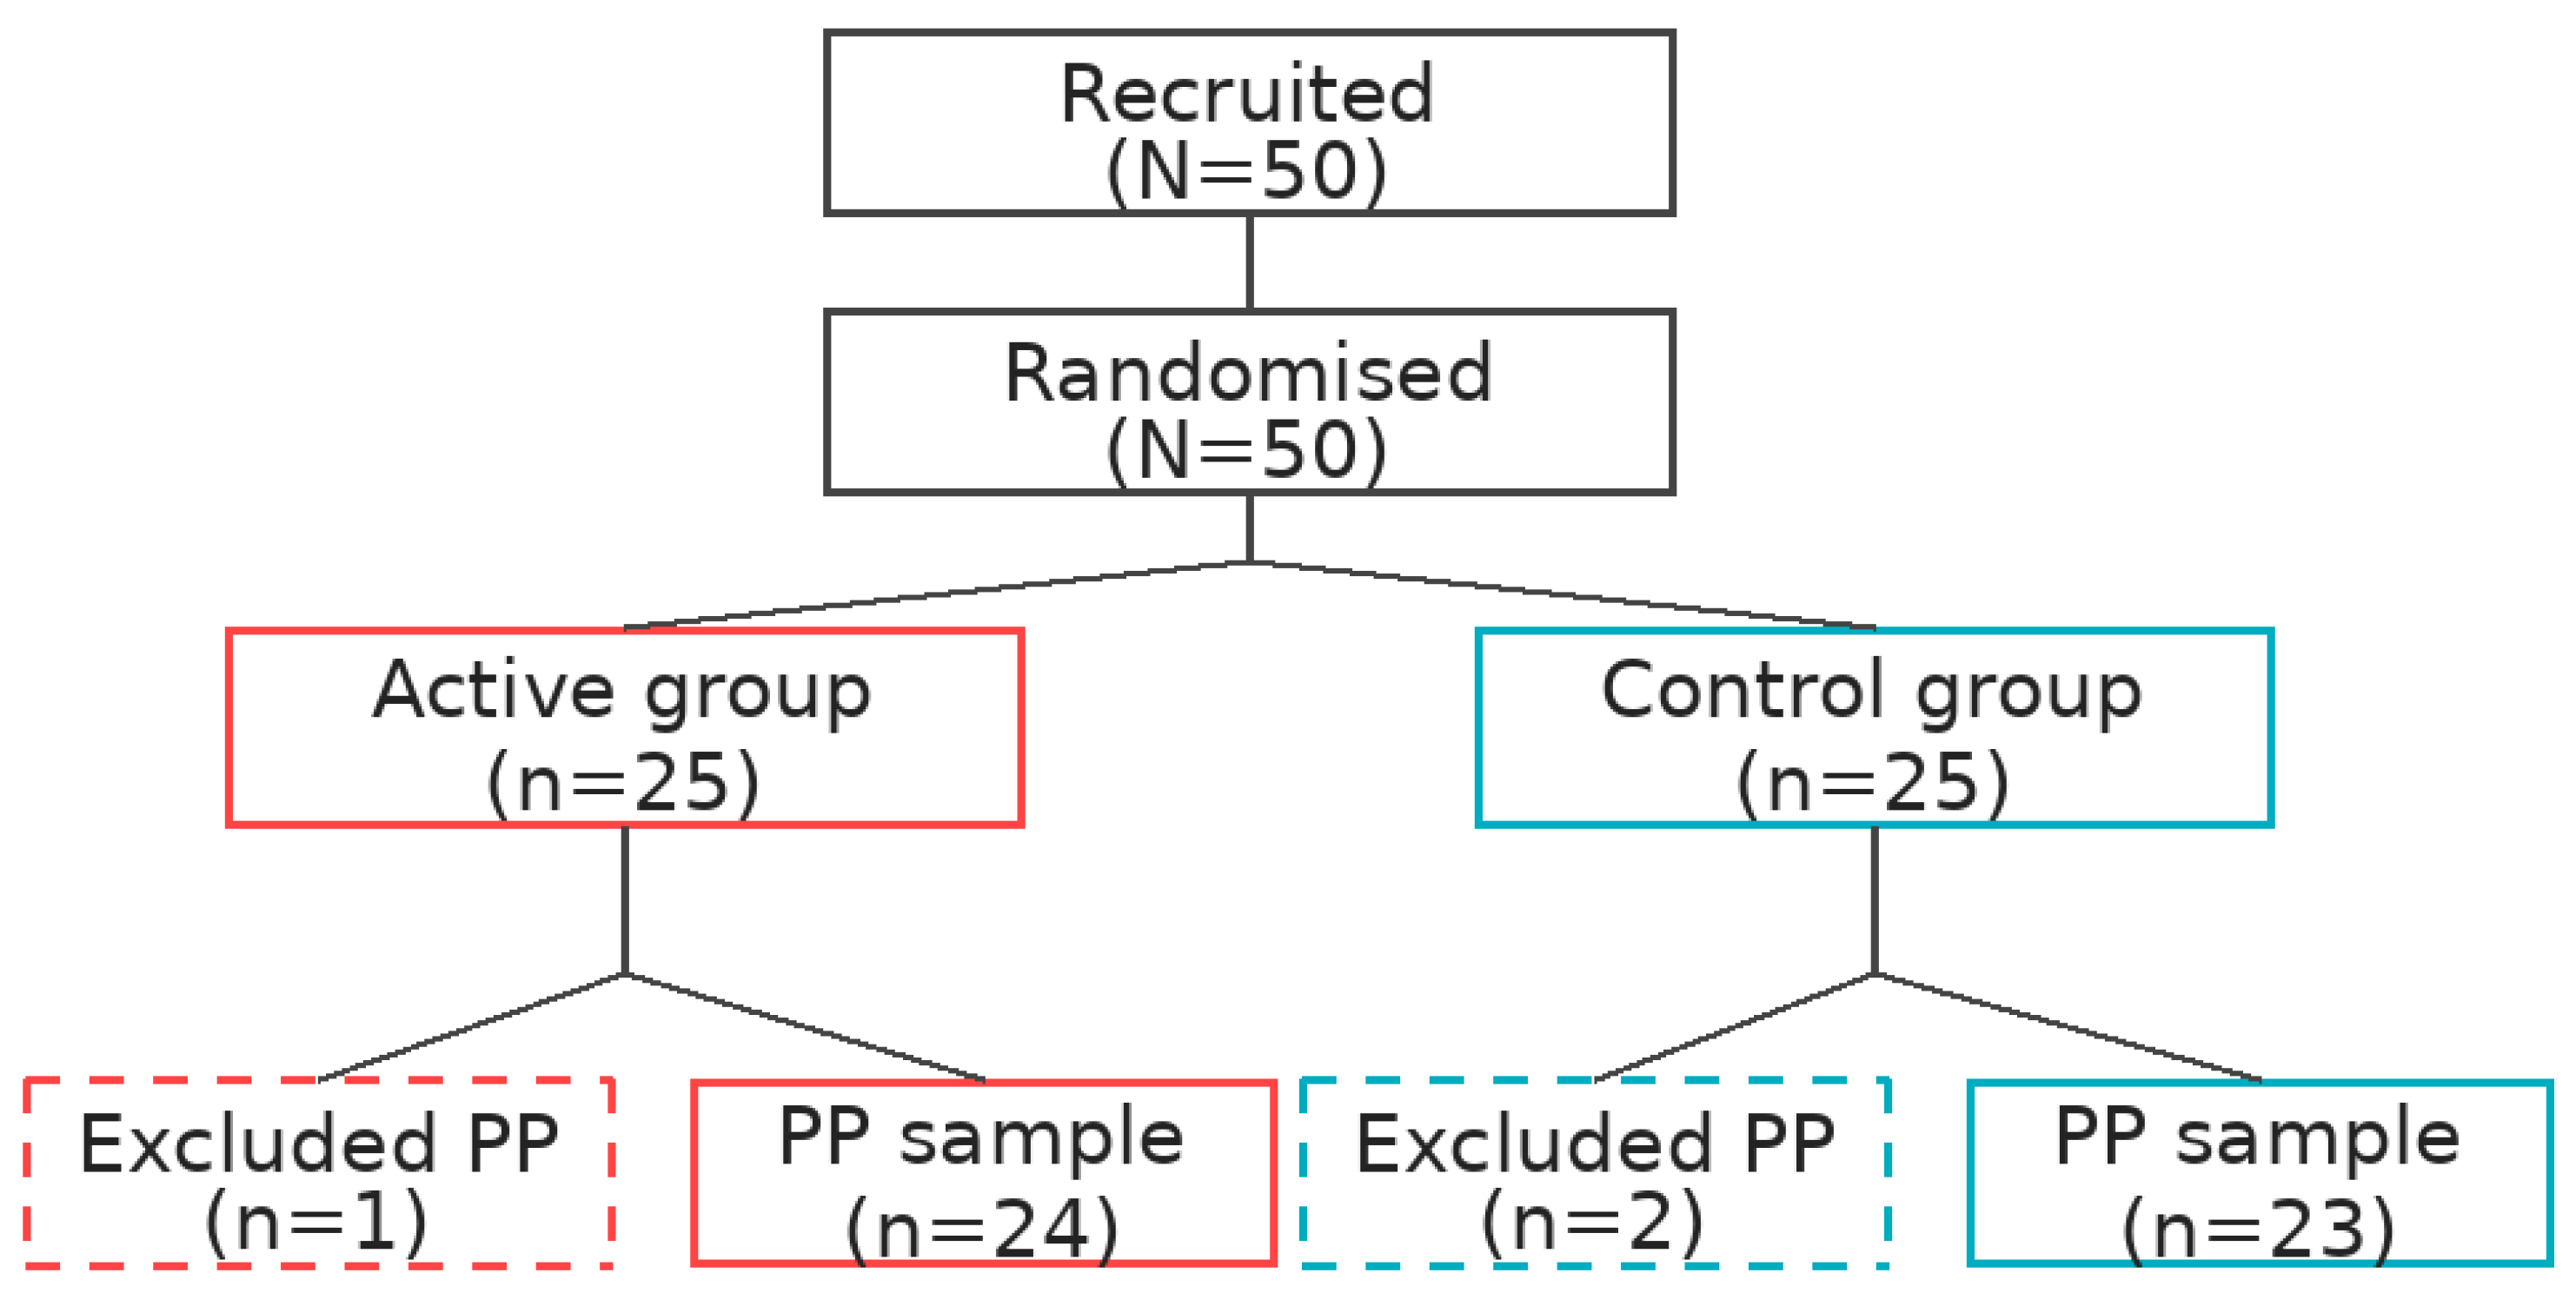
A total of 50 healthy volunteers were recruited and randomised, with 25 per group. Three participants were excluded from the per-protocol analysis: one because of equipment failure (control group) and two because of signal loss exceeding 10% of the total recording time (one per group). The final per-protocol sample comprised 24 active-group and 23 control-group participants (
Figure 6). All 50 participants were retained in the ITT analysis.
Baseline characteristics are summarised in
Table 4. The two groups did not differ significantly in age, sex ratio, pre-test STAI-State score [
37], or resting RMSSD (all
p > 0.05), confirming that randomisation was successful.
Blinding integrity was assessed by asking participants after testing to guess their group assignment. In the active group, 13 of 24 (54.2%) guessed correctly; in the control group, 12 of 23 (52.2%) guessed correctly. The difference was not significant (χ2(1) = 0.02, p = 0.89), indicating that blinding had been preserved.
4.2. Signal-Processing Performance
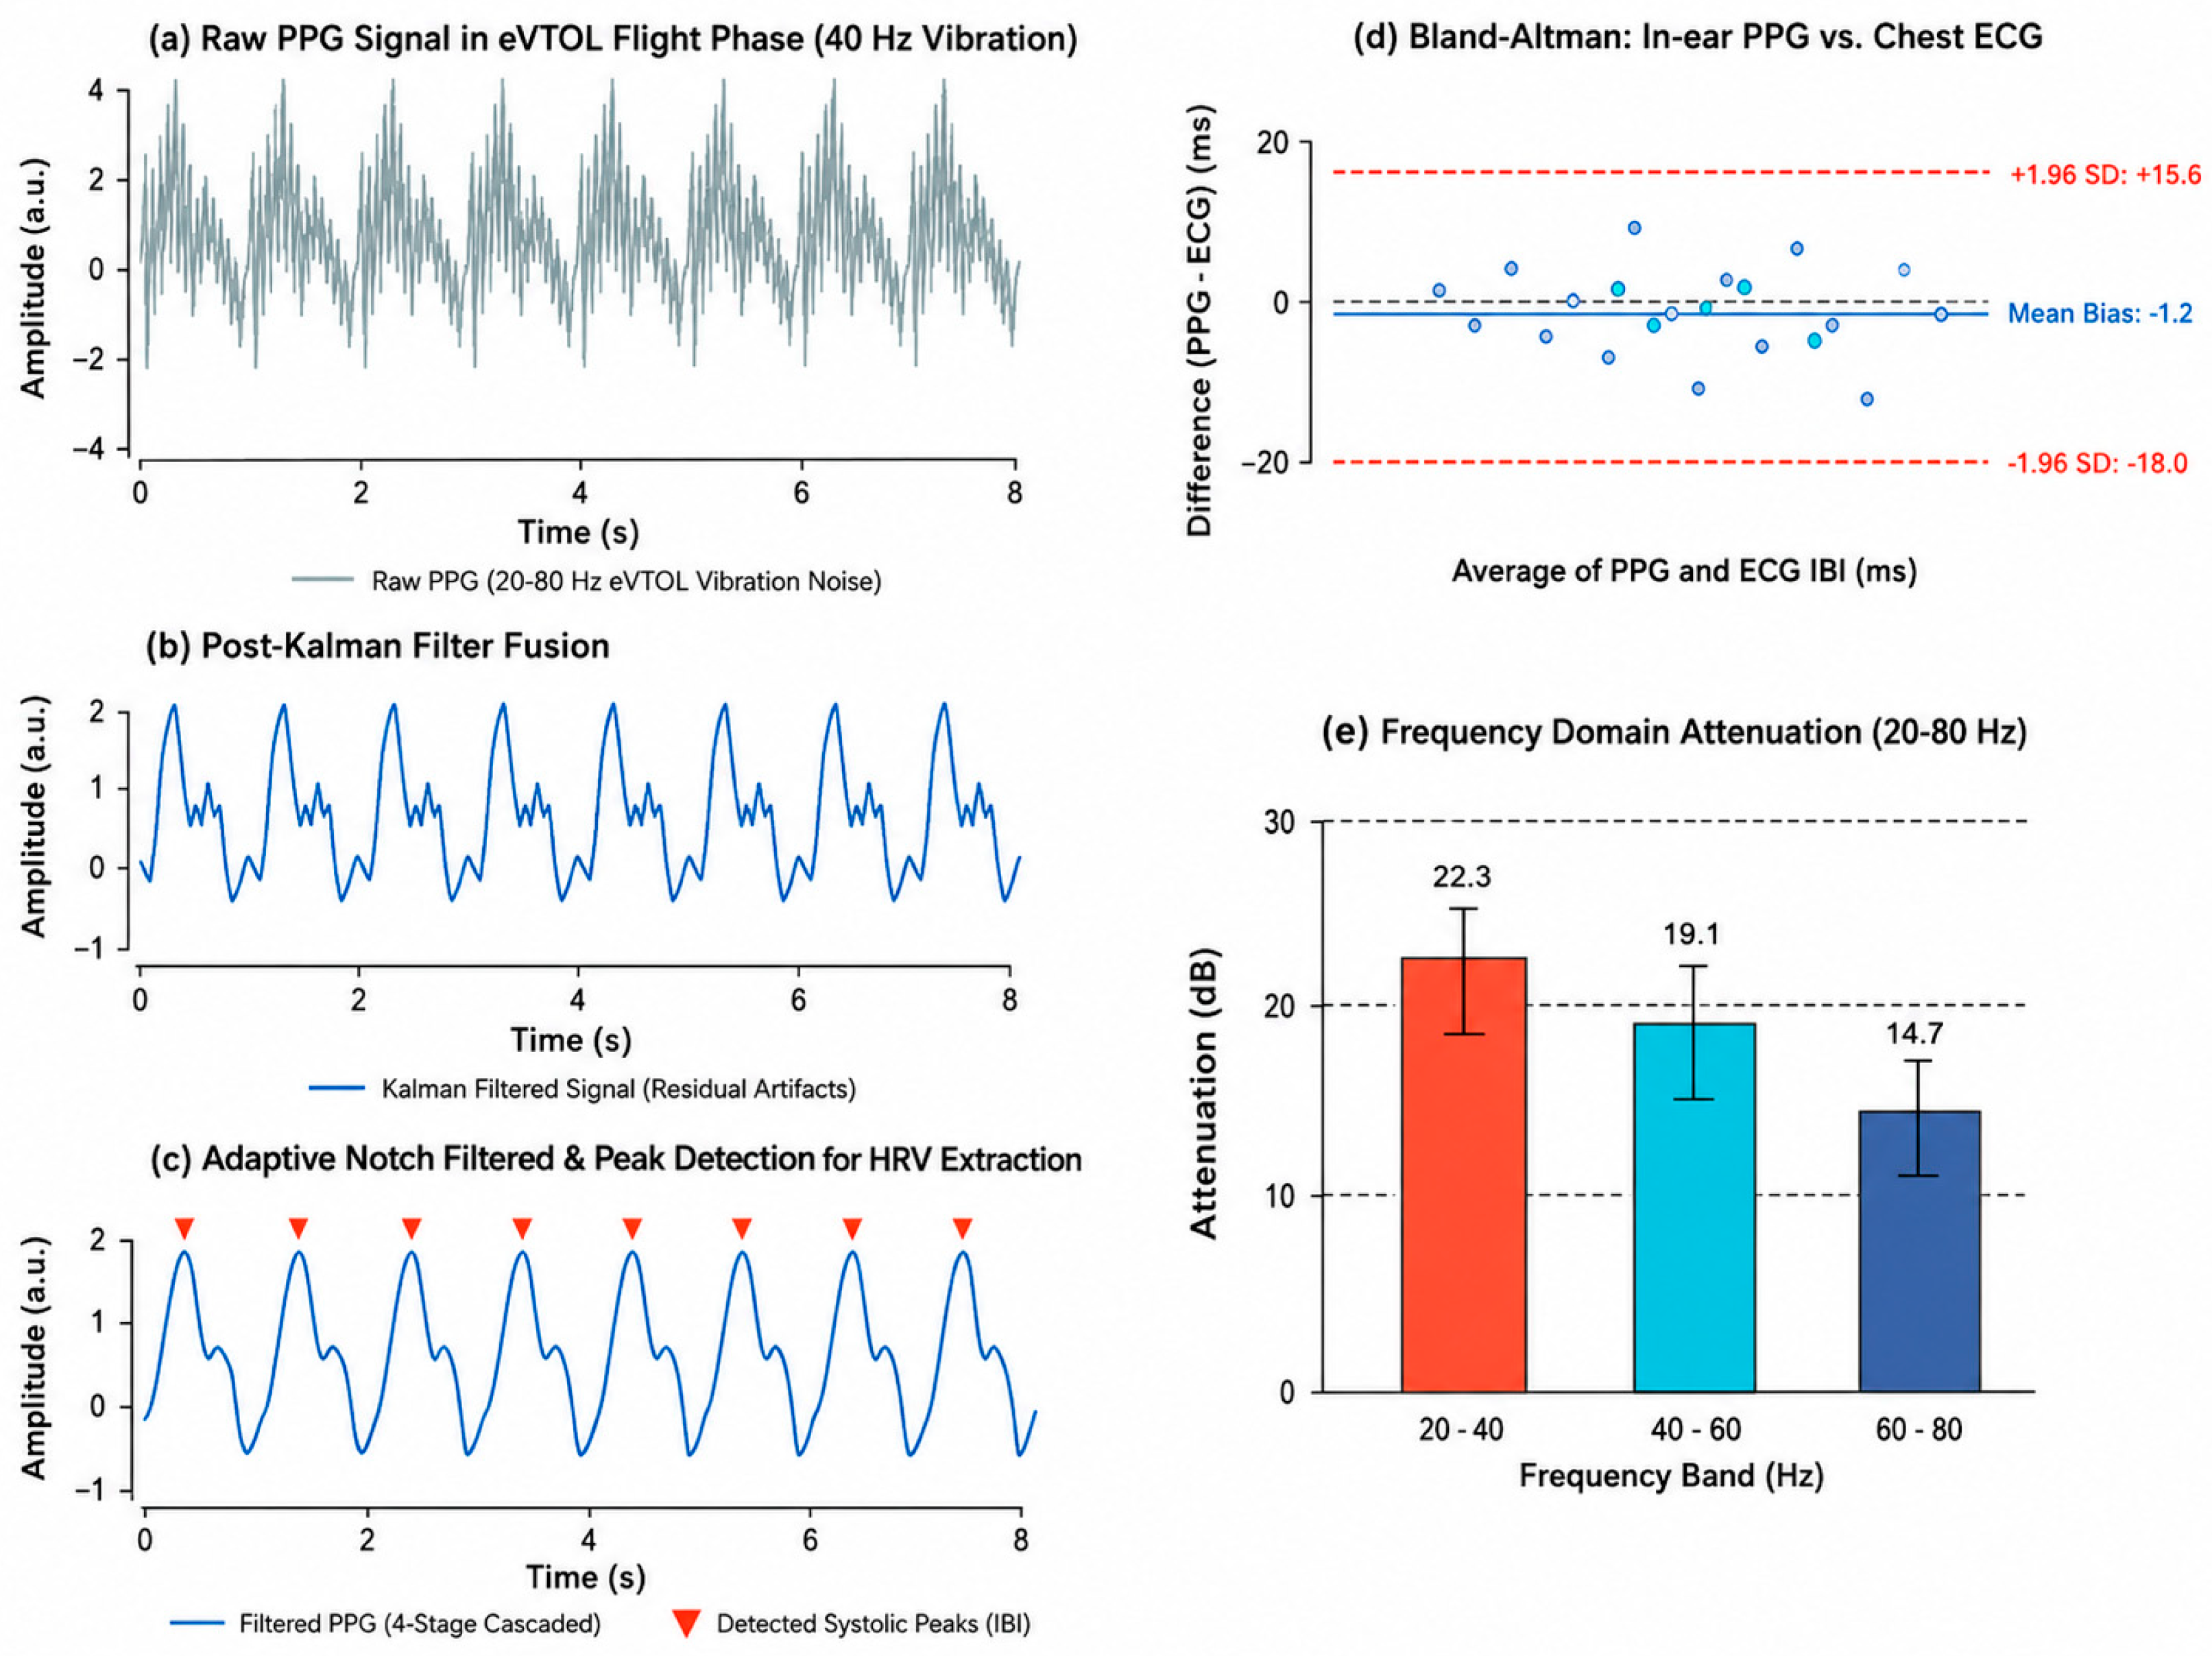
The cascaded signal-processing pipeline was evaluated against a chest-strap reference (Polar H10) under the 40 Hz continuous vibration of Phase 2. With constant vibration (40 Hz; 0.2 m/s2 RMS), the raw in-canal PPG signal had a mean SNR of 8.2 ± 3.1 dB. After Kalman sensor fusion, the SNR increased to 18.7 ± 2.4 dB; subsequent adaptive notch filtering brought the final SNR to 24.1 ± 1.8 dB—a net gain of approximately 16 dB over the raw signal. During the turbulence events (0.5 m/s2 RMS; 8 s) the SNR dropped briefly to 20.3 ± 2.8 dB but returned to its steady-state level within 1.5 s of the event, demonstrating that the pipeline adapts rapidly to transient increases in vibration.
A frequency-band analysis showed that attenuation varied across the vibration spectrum: suppression was strongest in the 20–40 Hz sub-band (22.3 ± 3.8 dB), followed by 40–60 Hz (19.1 ± 4.2 dB) and 60–80 Hz (14.7 ± 5.1 dB). The processed in-ear PPG inter-beat intervals (IBIs) were strongly correlated with the ECG-derived R–R intervals (Pearson r = 0.96 ± 0.02). A Bland–Altman analysis returned a mean bias of −1.2 ms and 95% limits of agreement of ±16.8 ms (
Figure 7), confirming that the pipeline achieves a level of measurement agreement sufficient to support HRV-based anxiety classification.
4.3. Anxiety Classification Performance
The CNN-LSTM classifier was evaluated on the Phase 2 recordings of the per-protocol dataset. Overall four-class accuracy was 82.4 ± 4.1%. The confusion matrix is shown in
Table 5.
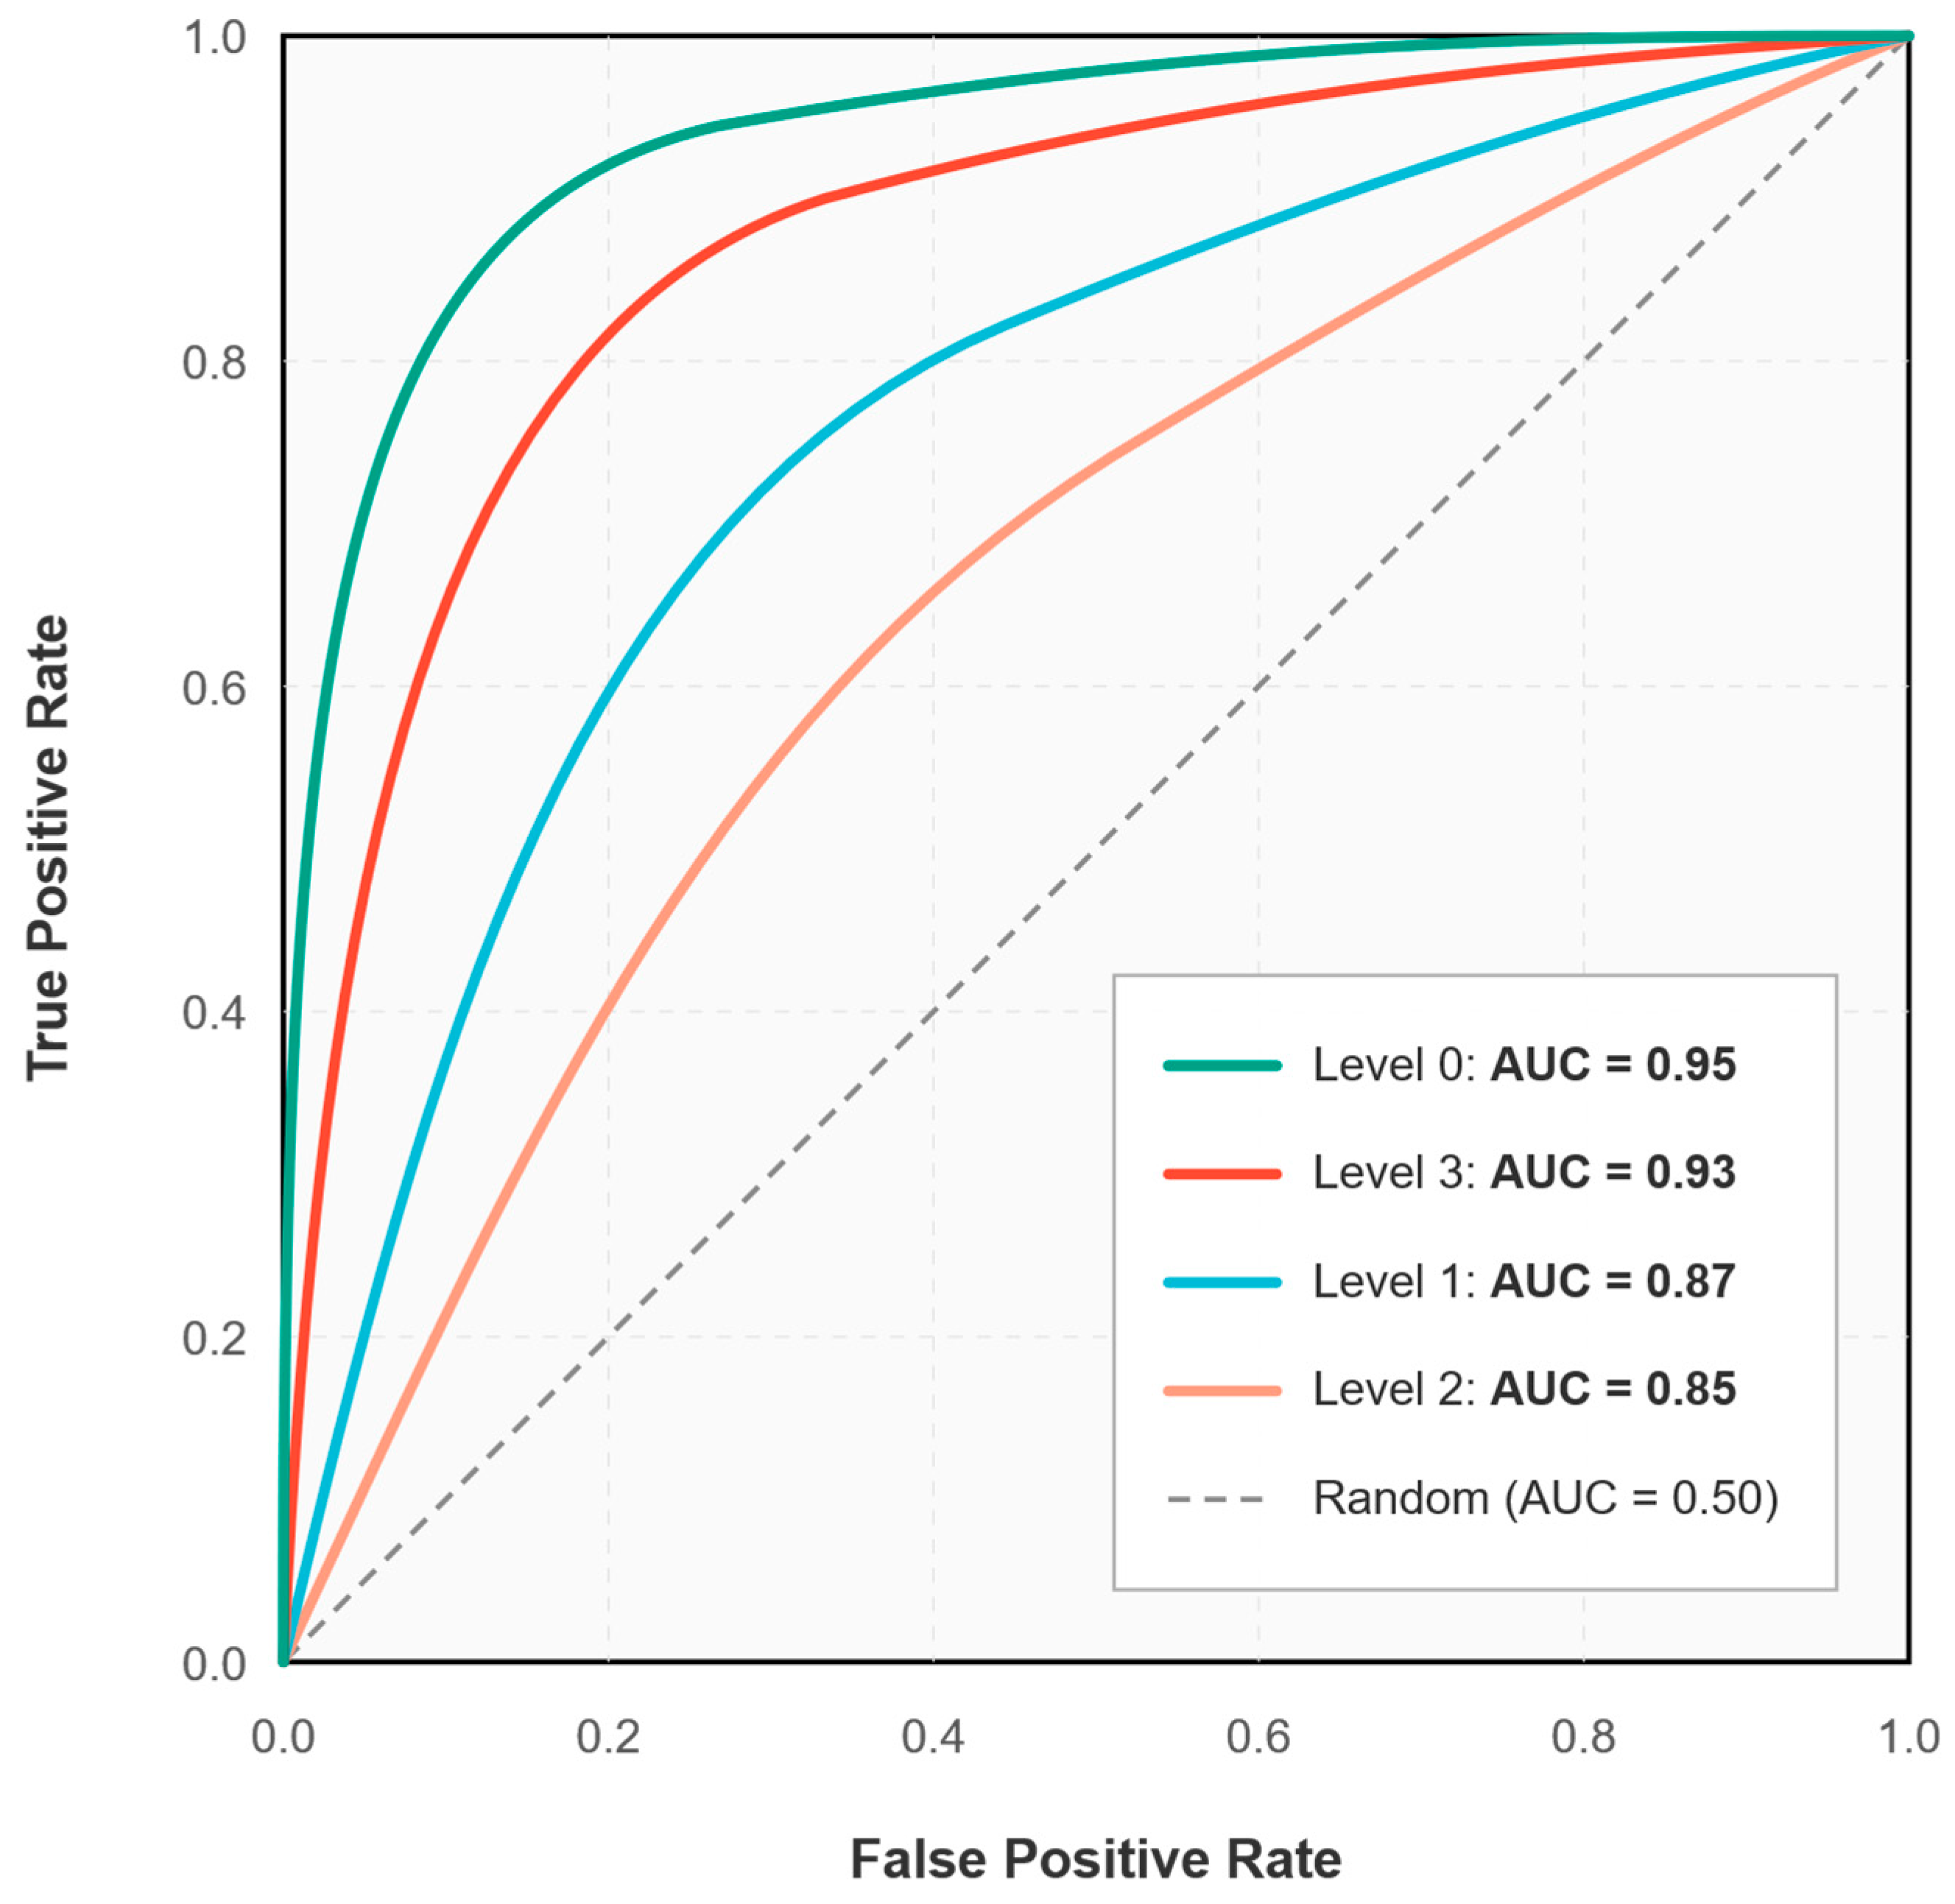
Per-class F1 scores were 0.89 (Level 0, baseline), 0.78 (Level 1, mild), 0.76 (Level 2, moderate), and 0.84 (Level 3, severe). The mean prediction lead time was 8.2 ± 2.1 s. One-vs-rest ROC analysis yielded AUC values of 0.95 (Level 0), 0.87 (Level 1), 0.85 (Level 2), and 0.93 (Level 3) (
Figure 8).
4.4. Primary Outcome: Physiological Recovery Time
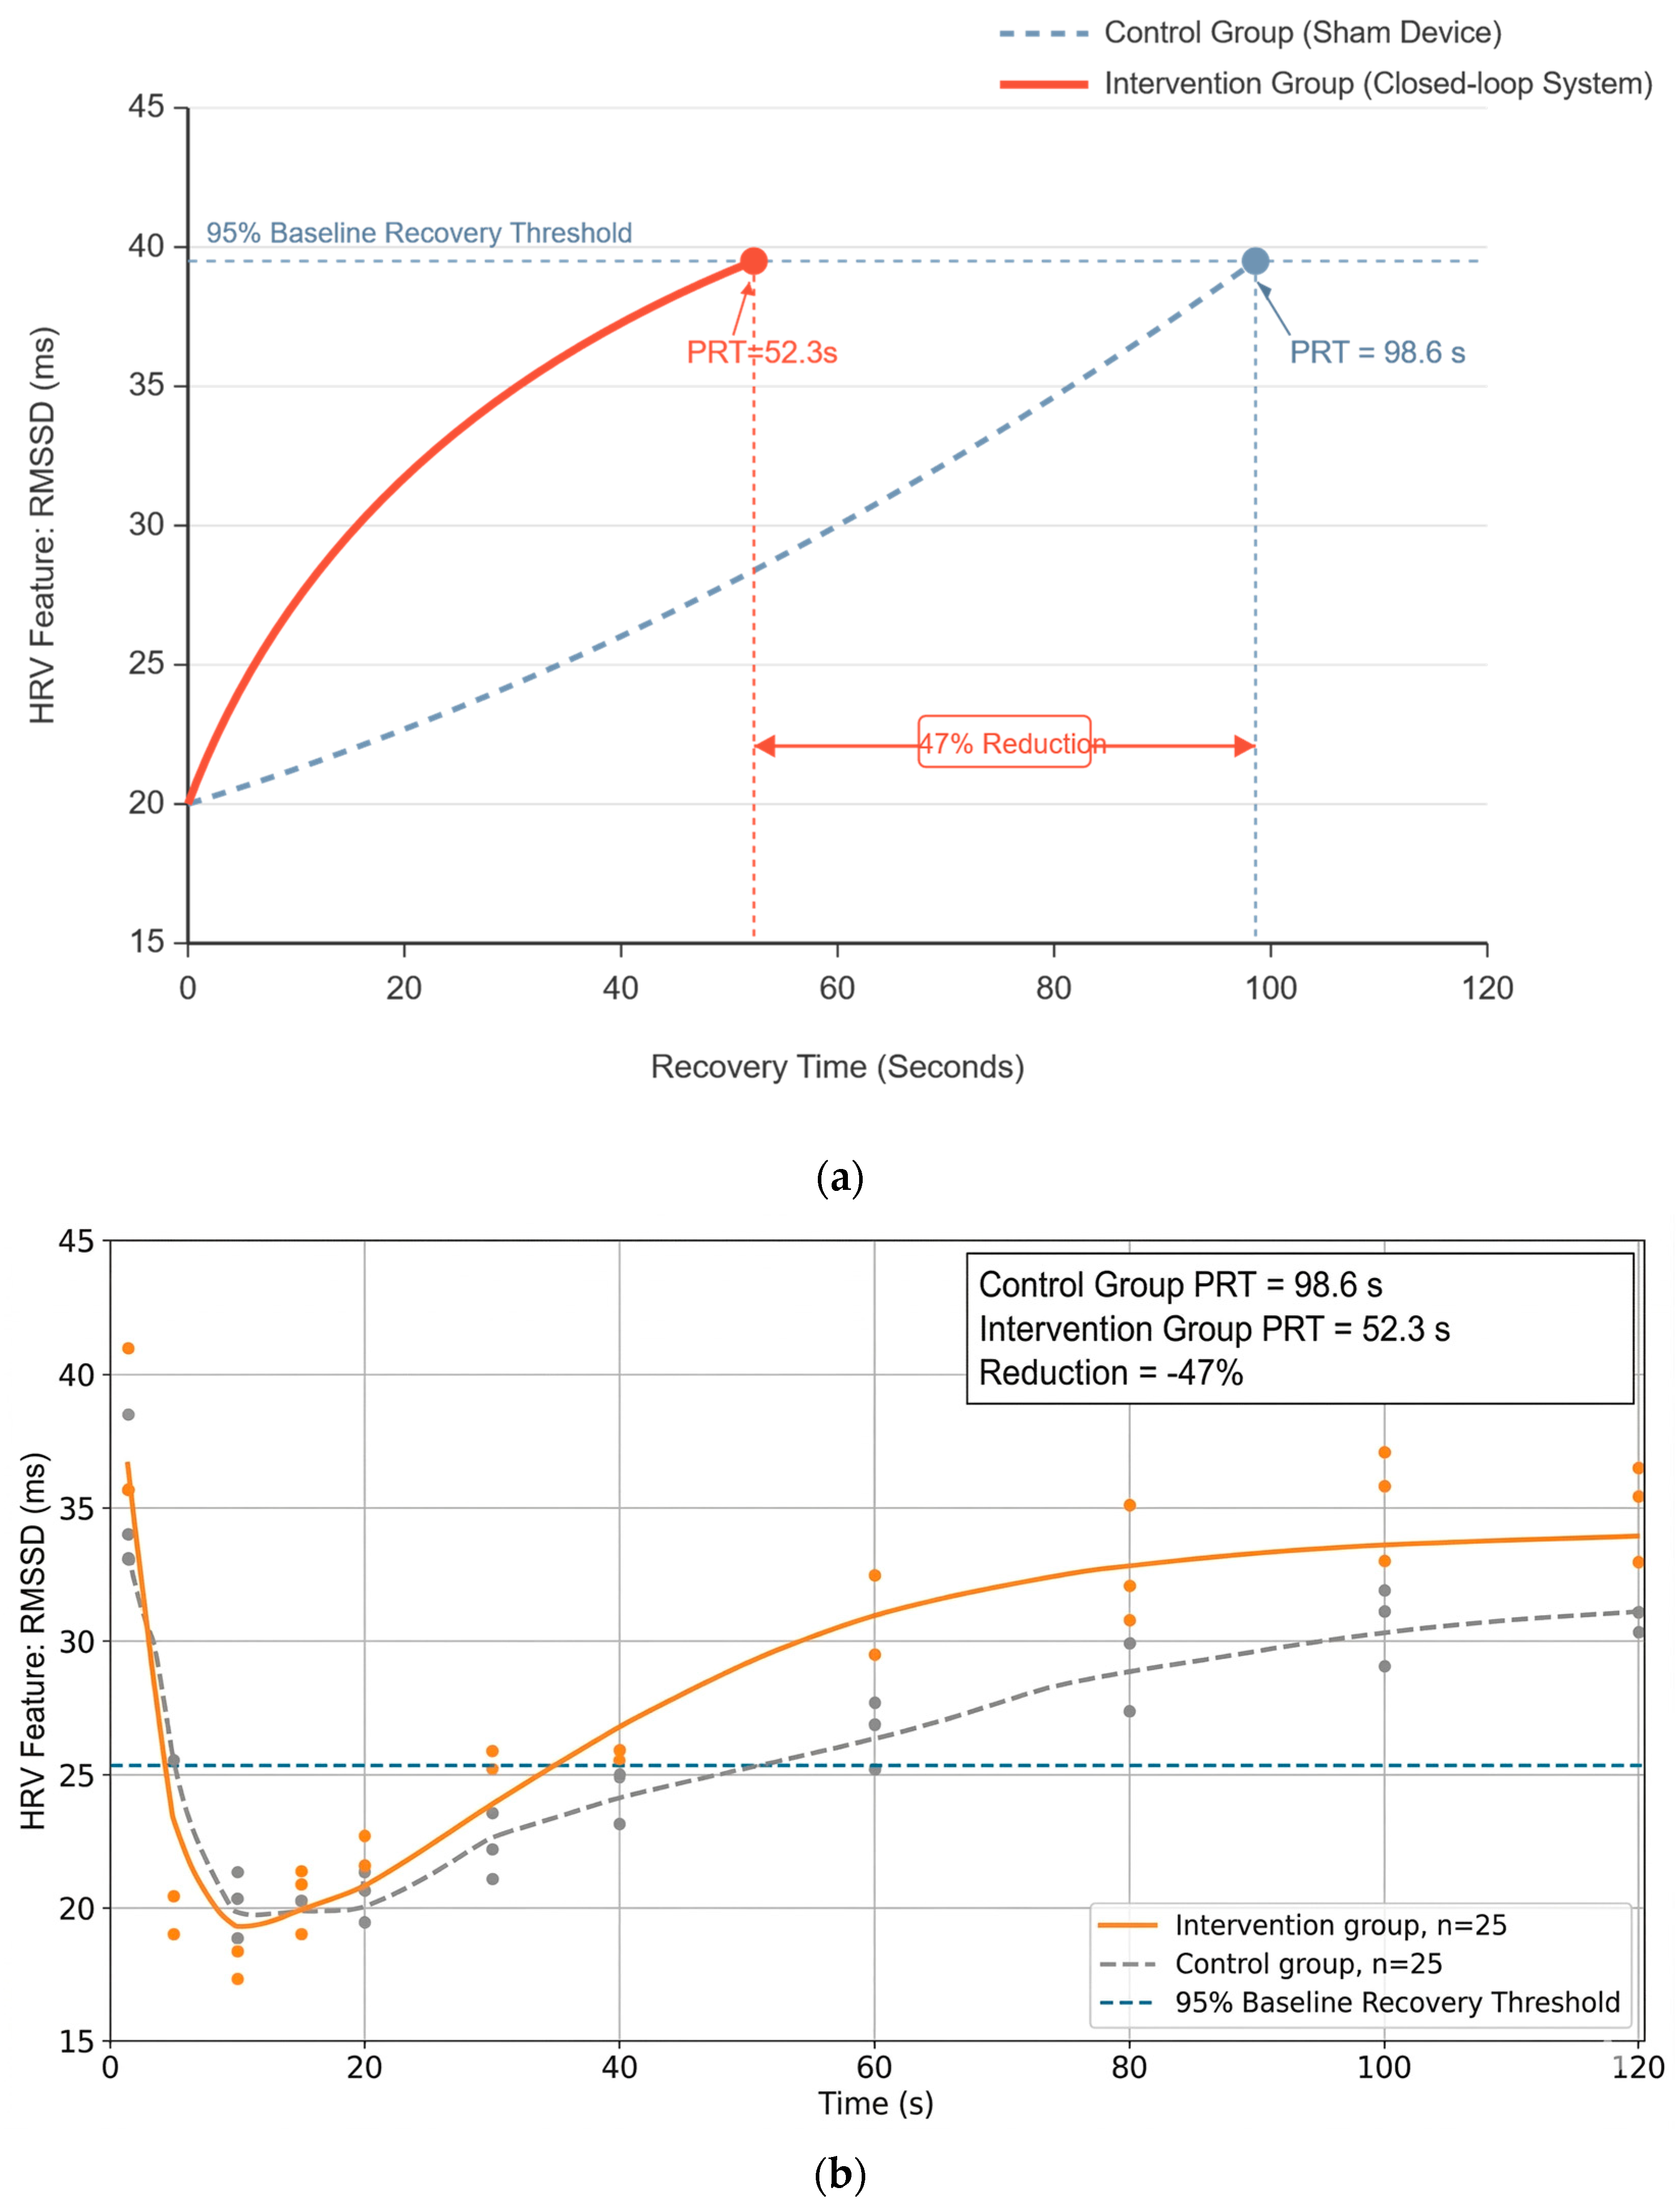
The active group reached the individual baseline RMSSD ±5% range in an average of 52.3 ± 31.5 s, compared with 98.6 ± 42.6 s in the control group. The 46.3 s difference (a 47% reduction) was statistically significant (
t(45) = 4.22,
p < 0.001) with a large effect size (Cohen’s
d = 1.24, 95% CI [0.62, 1.86]) (
Figure 9a). The individual recovery trajectories (
Figure 9b) show that the treatment effect was consistent across participants.
The ITT analysis (N = 50) is consistent: 53.1 ± 33.1 s in the active group versus 99.4 ± 44.7 s in the control group (Cohen’s d = 1.18, p < 0.001).
4.5. Secondary Outcomes
The secondary outcomes provide further support for the overall efficacy and usability of the closed-loop system. During the stress-induction phase (Phase 2), the median peak anxiety level was significantly lower in the active group than in the control group (Level 2 [IQR 1–2] vs. Level 3 [IQR 2–3]; Mann–Whitney U = 245.5, p = 0.003, r_rb = 0.38). This objective physiological pattern aligned closely with the subjective psychological assessment: the increase in state-anxiety score was significantly smaller in the active group (ΔSTAI = +4.2 ± 6.8) than in the control group (+12.7 ± 9.3), and ANCOVA confirmed a significant between-group effect (F(1, 44) = 14.32, p < 0.001, η2 = 0.21). The convergence between the objective physiological indicator (PRT) and the subjective questionnaire indicator (STAI) supports a short-term state-anxiety-mitigating effect of the system under the simulated eVTOL stress paradigm.
In terms of feasibility and safety in deployment, the in-ear form factor was widely accepted. The composite acceptance score did not differ significantly between the two groups (active 5.4 ± 0.9 vs. control 5.1 ± 1.1;
p = 0.24), and 94% of participants (44/47) rated the device at or above the scale midpoint (≥4/7). The intervention was safe in practice: adverse events were mild and rare. In the active group, two participants reported transient ear discomfort and one reported mild tingling at the electrode site; in the control group, one participant reported mild ear discomfort (Fisher’s exact test
p = 0.61). All mild adverse reactions resolved spontaneously within 24 h, and no serious adverse events occurred. Detailed statistics for all primary and secondary outcomes are summarised in
Table 6.
4.6. Exploratory Analyses
4.6.1. HRV Time-Series Trajectories
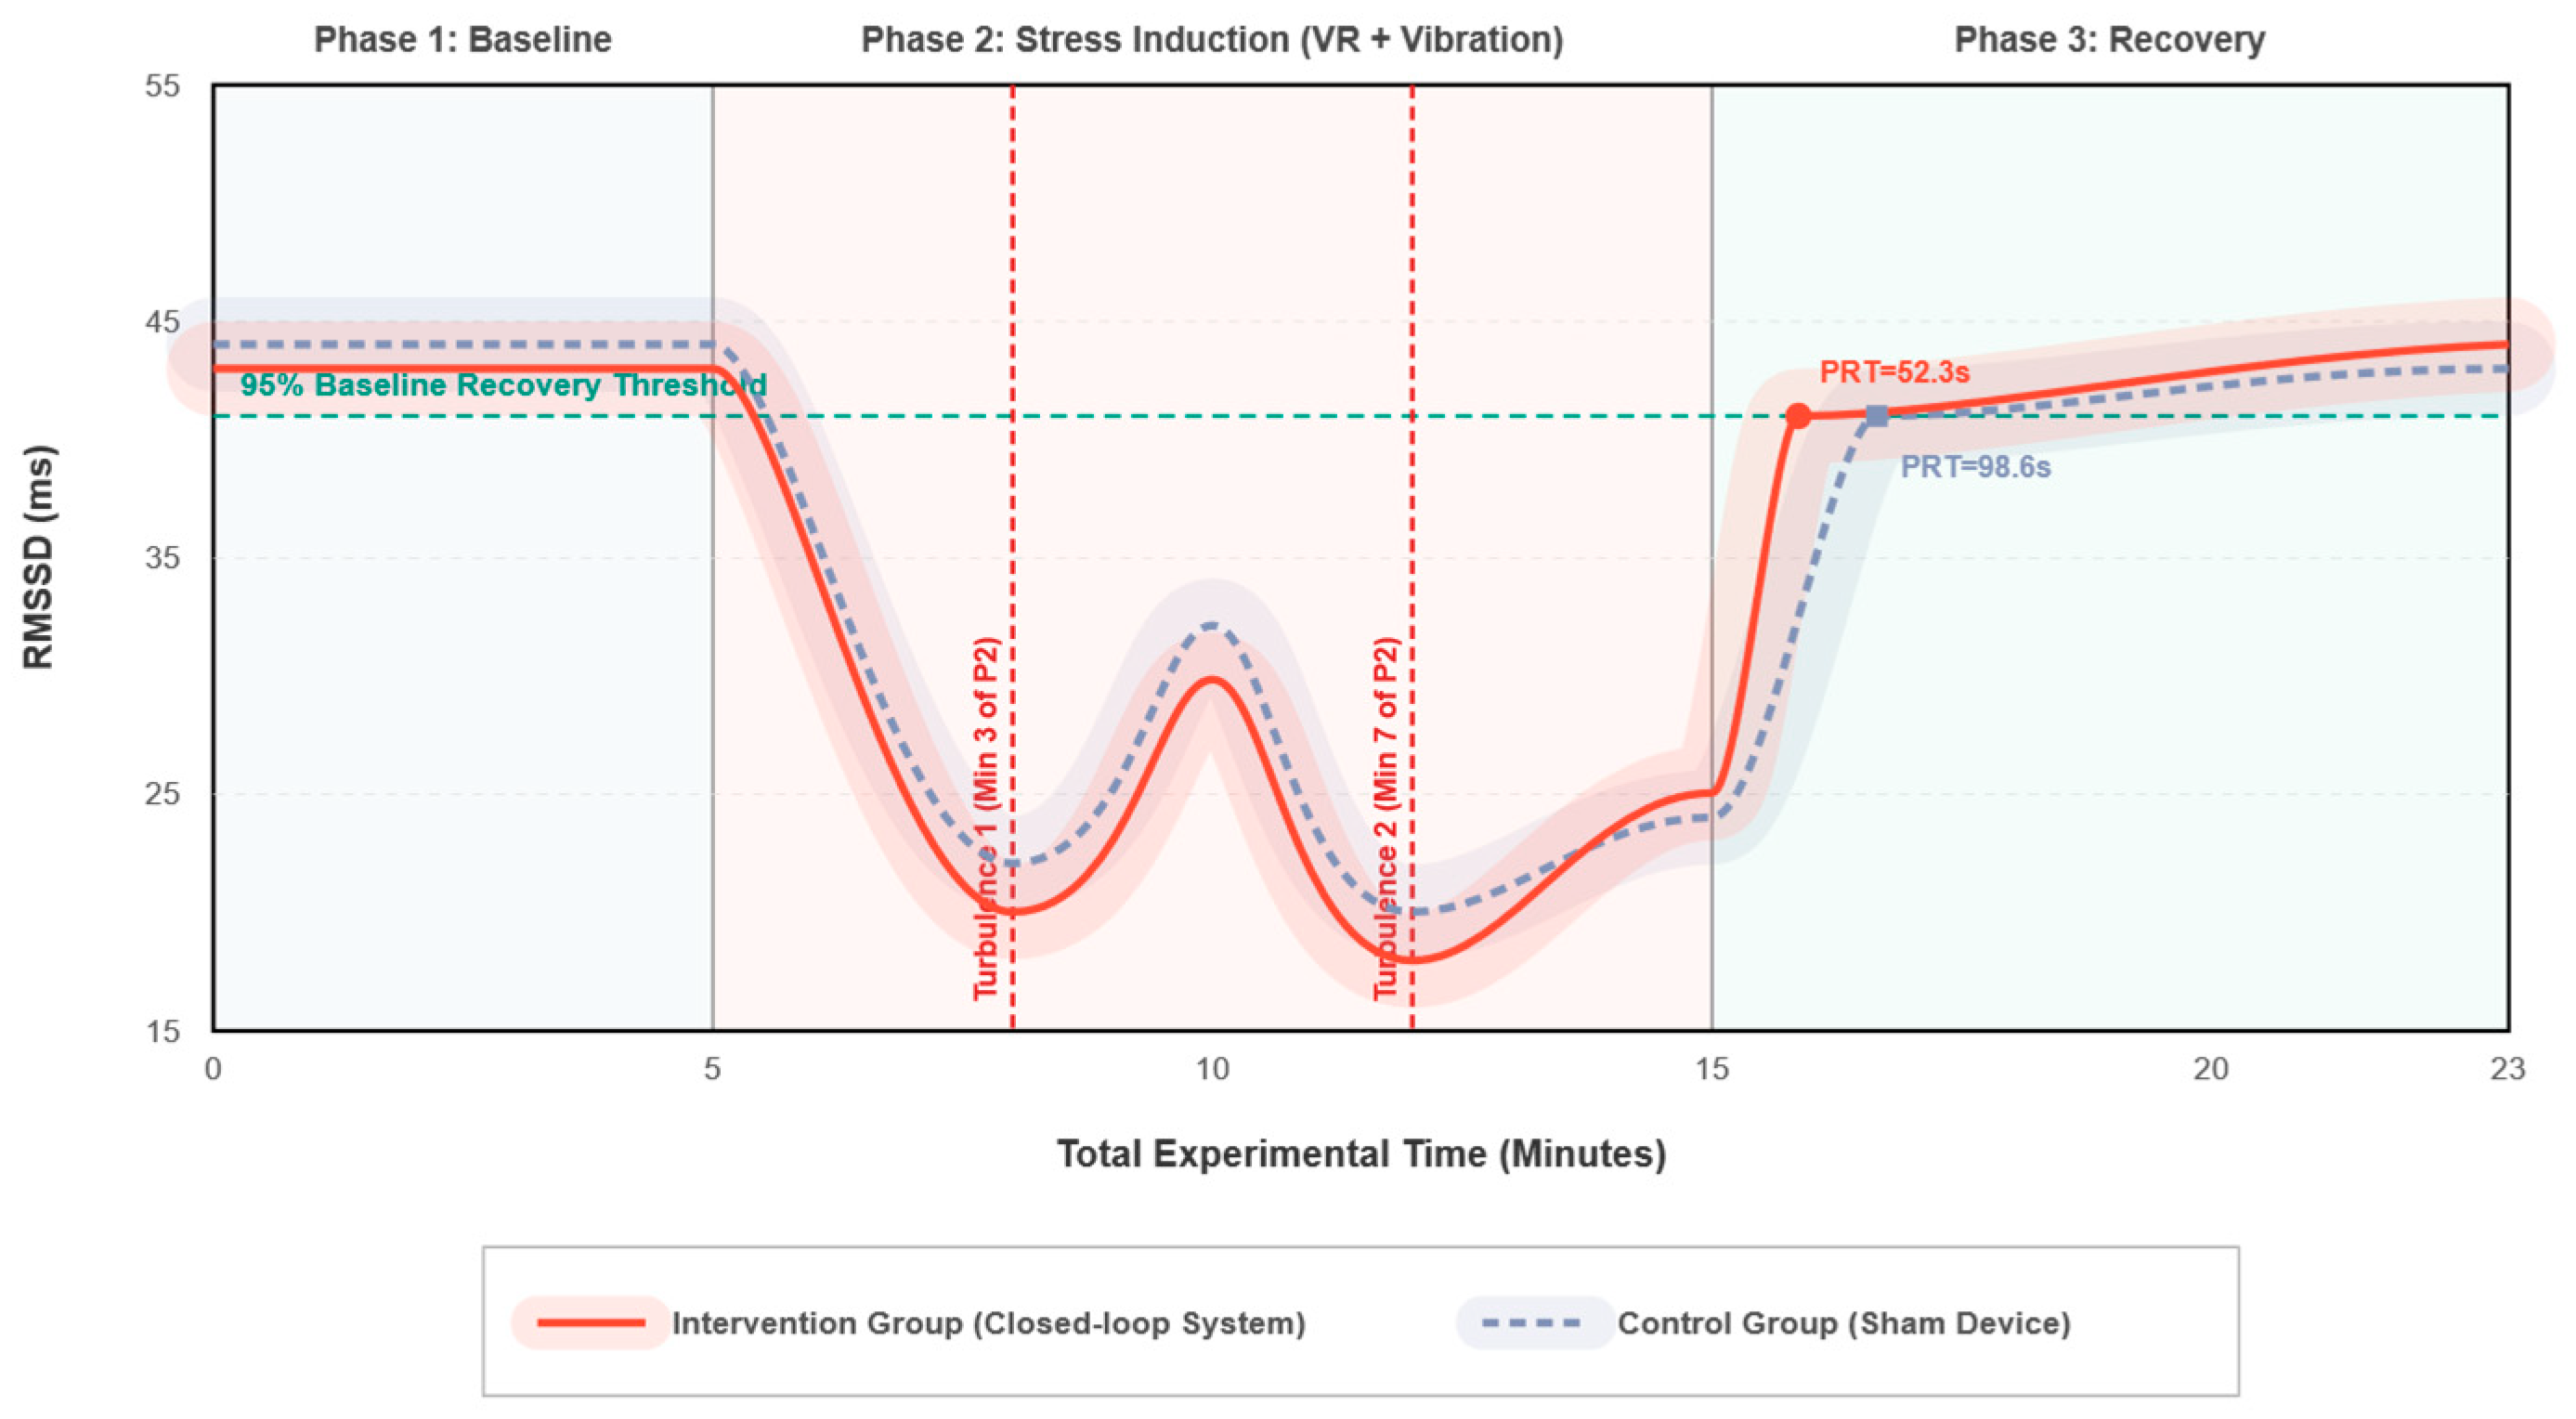
The group-mean RMSSD trajectories are shown in
Figure 10. The two groups showed a comparable drop in RMSSD during Phase 2, with clear troughs at the two turbulence events at the third and seventh minutes. The two groups diverged rapidly during the Phase 3 recovery period: RMSSD in the active group returned to the ±5% baseline range in approximately 50 s, whereas the control group required nearly 100 s.
4.6.2. Modality Contribution Analysis
A hierarchical regression with PRT as the dependent variable was performed: Step 1 (w_tVNS only), ΔR2 = 0.18, p < 0.01; Step 2 (+w_beat), ΔR2 = 0.09, p = 0.03; Step 3 (+w_light), ΔR2 = 0.04, p = 0.12; Step 4 (interaction terms), ΔR2 = 0.11, p = 0.008. The full-model R2 of 0.42 outperforms any single-modality model, supporting the value of the multi-channel intervention design.
4.6.3. Subgroup Analysis
Participants were stratified by baseline anxiety level (STAI-State ≤ 30 vs. > 30). The high-baseline-anxiety subgroup (n = 22) showed a larger effect (d = 2.01) than the low-baseline-anxiety subgroup (n = 25; d = 1.34). The interaction was significant (F(1, 43) = 4.38, p = 0.04), indicating that passengers with higher baseline anxiety derive greater benefit.
5. Discussion
5.1. Summary of Main Findings
This study set out to determine whether a closed-loop system that integrates in-ear physiological sensing with multimodal cabin intervention can reduce anxiety under simulated eVTOL cruise vibration. The three principal findings are as follows.
At the sensing level, the cascaded signal-processing pipeline achieved an SNR of 24.1 dB and an IBI correlation of r = 0.96 under continuous 40 Hz vibration—the first demonstration that in-canal PPG can support reliable HRV extraction in a propulsion-vibration environment.
At the classification level, the CNN-LSTM model achieved 82.4% four-class accuracy with an 8.2 s prediction lead time.
At the intervention level, the closed-loop system shortened physiological recovery time by 47% (Cohen’s d = 1.24), substantially exceeding the prespecified threshold of d = 0.8. Self-reported anxiety (STAI-State) followed the same pattern as the physiological indicator (η2 = 0.21), and user acceptance reached 5.4/7.
5.2. Comparison with Existing Work
5.2.1. In-Ear Signal Quality and Vibration Robustness
Earlier validation work on in-ear PPG has been confined almost exclusively to static or mild-motion conditions such as walking. Ferlini et al. [
9], for example, demonstrated the potential of in-canal PPG for multi-parameter vital-sign extraction, and Parikh et al. [
19] confirmed that in-ear PPG can effectively measure HRV parameters related to vagal tone—but neither study addressed sustained external mechanical vibration. The eVTOL cabin environment presents a distinct form of continuous high-frequency mechanical coupling (e.g., 40 Hz rotor vibration) that differs fundamentally from the low-frequency motion artefacts conventionally encountered. The present work extends in-ear vital-sign monitoring into a sustained 40 Hz vibration environment, achieving an IBI correlation of
r = 0.96 that markedly exceeds the precision reported in earlier work under treadmill-walking artefact conditions (
r ≈ 0.89 [
38]). This step-change cannot be attributed to algorithmic filtering alone; rather, it derives from the three “hardware–software co-design” innovations introduced here: a compliant silicone damping sleeve first dampens resonance peaks at the physical layer to prevent sensor clipping; Kalman fusion of the IMU reference signal then removes broadband motion artefacts at the software layer; and an adaptive notch filter targeted at rotor harmonics removes the residual narrow-band components.
5.2.2. Anxiety Classification from Single-Channel In-Ear PPG
In the area of physiological affective computing in dynamic environments, existing studies generally rely on multimodal sensor arrays. Schmidt et al. [
24], for instance, reported a three-class accuracy of 75.2% on the WESAD dataset using a multi-channel device. By comparison, the present study used a more demanding four-class scheme and reached a higher accuracy of 82.4% with a single-channel in-ear PPG signal alone. This advantage stems primarily from the feature-extraction capability of the CNN-LSTM hybrid architecture, which captures both local time–frequency morphological distortions of the PPG waveform and the long-range temporal dependencies in HRV indicators. The auditory canal, as a relatively enclosed and richly perfused sensing site, also intrinsically shields the signal from a portion of ambient optical interference and so provides higher-fidelity raw data. Although a recent CNN-BiLSTM model [
25] reported 94.1% accuracy under highly controlled static conditions—indicating that there is still room for deep learning models to grow—our model achieves the best balance currently available between computational efficiency and dynamic in-cabin robustness. We note explicitly that the four-class labels in the present work are an ecological–momentary assessment derived from HRV statistical thresholds rather than a strict clinical diagnosis; a precise mapping between these anxiety levels and the lived subjective experience of passengers remains to be calibrated in future large-cohort studies.
5.2.3. Synergistic Efficacy of the Closed-Loop Multimodal Intervention
The large effect size observed for physiological recovery time (Cohen’s d = 1.24) is consistent with, but should not be interpreted as directly interchangeable with, effects reported in single-modality tVNS studies because the present outcome, stressor, and population differ from those clinical or laboratory protocols. Clancy et al. [
26] showed that tVNS can reduce sympathetic nerve activity, and Austelle et al. [
27] reported attenuation of early heart rate increases during a cold-pressor challenge; these findings provide physiological support for including tVNS as one component of the intervention. In the present experiment, the significant interaction term in the hierarchical regression (ΔR
2 = 0.11,
p = 0.008) suggests that the combined intervention may provide benefits beyond a simple single-channel explanation, although this interpretation should be confirmed by future ablation studies. The most defensible interpretation is therefore that closed-loop adaptation allowed the system to scale tVNS, auditory stimulation, and lighting in response to each participant’s HRV trajectory, thereby facilitating faster physiological recovery without imposing a fixed high-intensity protocol on all passengers.
5.2.4. User Acceptance and Wearability in the Cabin Microenvironment
Beyond technical performance, whether the technology can transition into a commercial eVTOL cabin ultimately depends on the wearing experience. In the present trial, the active and control groups did not differ significantly in acceptance scores (
p = 0.24), and both groups scored well above the scale midpoint. This indicates that integrating a tVNS electrode array into the earpiece and delivering closed-loop neuromodulation through it neither imposes a noticeable physical burden nor degrades the overall user experience. The finding aligns with recent work on user adherence to “smart hearables” [
14,
15] and reinforces the view that the cymba conchae is not only an ideal physiological window for high-quality vital-sign acquisition but also the best site for unobtrusive, non-invasive neuromodulation in public-transport contexts.
5.3. Practical Implications
Implications for eVTOL cabin design. A docking and charging interface for the in-ear devices could be integrated into the seat headrest; tunable colour-temperature LED panels (2700–6500 K) could become a standard part of the overhead module; cabin noise should be controlled below 70 dB SPL; and a data interface should be established between the physiological-monitoring subsystem and the flight management system.
Implications for operations. The anxiety-monitoring earpiece should be offered as an optional amenity, respecting passenger autonomy. Cabin crew should be trained to recognise anxiety signals, and a sustained Level 3 anxiety state in the absence of intervention efficacy should trigger a crew alert.
Regulatory considerations. The system sits at the intersection of medical-device regulation (tVNS) and avionics certification (electromagnetic compatibility). Commercialisation will require airworthiness certification, medical-device registration, and compliance with data-privacy regulations.
Relationship to engineering-level vibration mitigation. The proposed in-ear closed-loop system should be interpreted as a passenger-state regulation layer, not as a substitute for airframe-level engineering improvements. Flight-control optimisation, structural damping, seat isolation, and propulsion balancing remain the primary means of reducing the external physical stimulus. The present system addresses a different residual problem: even when vibration and attitude disturbances are reduced to acceptable engineering levels, passengers may still differ substantially in perceived control, autonomic reactivity, and recovery speed. Under the fixed vibration conditions of the present experiment, the system shortened physiological recovery time by 47%, indicating that it can add value as a second-layer adaptive comfort intervention. A direct comparison with engineering modifications was not performed and should therefore not be inferred from the present data.
5.4. Limitations
The study has several limitations that need to be borne in mind when interpreting the results. The most fundamental concerns the range of flight phases simulated. Only the cruise-phase vibration profile of an eVTOL was reproduced—a constant 40 Hz, 0.2–0.5 m/s2 RMS seat vibration that captures the steady propulsion vibration with two short turbulence-augmentation events. The large vertical-take-off-and-landing accelerations (±0.2–0.4 g) and the complex multi-axis attitude changes that occur in those phases were not included, because reproducing them requires a six-degree-of-freedom motion platform or comparable dedicated equipment that exceeds the hardware available in the design-school laboratory in which the study was conducted. In a full-flight-envelope simulation, the vibration spectrum would probably be broader, the relative motion between the head and the earpiece would be stronger, and passenger anxiety during take-off, transition, and landing might be higher than in the cruise-focused protocol. The 47% reduction in recovery time should therefore be interpreted as evidence of efficacy under controlled cruise-vibration conditions, not as a direct estimate of performance in all phases of commercial eVTOL flight.
Second, the experimental environment was a simplified multi-sensory simulation rather than a full-scale cabin reconstruction. The visual immersion provided by the VR headset differs from the visual experience of a real cabin window in field of view, depth perception, and vestibular–visual conflict, and the vibration transmission path generated by a chair exciter does not exactly match the structural vibration of a real airframe. If the experiment were repeated in a full cabin mock-up or in a motion-base simulator, the absolute recovery times might change because noise, cabin enclosure, social density, perceived risk, and vestibular cues would be more realistic. Nevertheless, the simplified environment gave the experiment good reproducibility, allowing other research groups to replicate the study with general-purpose laboratory equipment, and it kept the focus on validating the core sense → classify → intervene → feedback loop of the closed-loop system rather than on maximising ecological validity.
Third, the sample was confined to healthy adults aged 22–45 years from a single Chinese city (Xi’an). Patients with clinical anxiety disorders, elderly passengers, and children—groups at high risk of eVTOL-related anxiety—were excluded for methodological and ethical reasons. Including those groups in the first validation would have introduced substantial heterogeneity in HRV baseline, medication status, vestibular sensitivity, cognitive appraisal of risk, and tVNS tolerability. Their exclusion therefore improved internal validity and safety in the initial experiment, but it also limits generalisability. Cultural differences in the expression of anxiety and in technology acceptance may further limit the external validity of the findings. At the measurement level, although in-ear PPG correlated highly with ECG (r = 0.96), measurement error under extreme motion-artefact conditions cannot be ruled out, and STAI-State scores are subject to social-desirability bias.
Finally, in the experimental design, the control group received sham stimulation through the same device, but no device-free control was included; the observed effect therefore reflects a mixture of active intervention and a device-related placebo component. In addition, only the immediate single-session effect was evaluated; habituation, sensitisation, and the long-term efficacy of repeated use remain to be determined.
5.5. Future Work
First, full-flight-envelope validation. The complete eVTOL flight profile (including vertical take-off and landing and the transition phase) should be reproduced in an aviation human-factors laboratory equipped with a six-degree-of-freedom motion platform, in order to evaluate the signal quality and intervention efficacy of the closed-loop system under large-acceleration conditions. Once commercial eVTOL operations begin, final validation should be conducted in real flight.
Second, broader populations. Priority should be given to participants with subthreshold anxiety (STAI-Trait > 45), older adults (≥65 years), passengers with flight phobia, and child passengers.
Third, longitudinal evaluation. Repeated-exposure studies should assess habituation and sensitisation of the intervention effect and map individual learning curves.
Fourth, enhanced sensing. Galvanic skin response (already recorded but not yet used for classification), PPG-derived respiratory rate, and eye-tracking data could be integrated into the classification pipeline.
Fifth, advanced personalisation. Reinforcement-learning policy optimisation could replace the current SPSA online adaptation, accelerating convergence to the individually optimal intervention configuration.
6. Conclusions
This study addressed eVTOL passenger anxiety—a key obstacle to public acceptance of urban air mobility—by developing and validating a human-centred closed-loop system for the real-time monitoring and mitigation of anxiety.
At the technical level, three innovations were verified. The silicone damping sleeve integrated into the in-ear module provided more than 12 dB of hardware-level attenuation against 20–80 Hz propulsion vibration. The cascaded signal-processing pipeline achieved a 24.1 dB SNR and an IBI correlation of r = 0.96 against a chest-strap ECG reference, providing the first demonstration that in-canal PPG can support reliable HRV-based anxiety classification in a propulsion-vibration environment. The CNN-LSTM classifier reached 82.4% four-class accuracy with an 8.2 s prediction lead time, and a Takagi–Sugeno fuzzy controller paired with online SPSA adaptation modulated tVNS, binaural beats, and cabin colour temperature in real time.
At the validation level, the randomised controlled trial conducted with 50 participants in a simulated eVTOL cruise-vibration environment produced converging evidence from physiological and subjective indicators: a 47% reduction in physiological recovery time (Cohen’s d = 1.24, p < 0.001), a 67% smaller increase in self-reported state anxiety (η2 = 0.21), a user-acceptance score of 5.4/7 (with 94% of participants scoring at or above the scale midpoint), and no serious adverse events. Passengers with higher baseline anxiety derived the greatest benefit (d = 2.01); the multimodal intervention was associated with a better explanatory model than any single-channel weight alone, and the significant interaction effect supports the value of the three-channel design while still requiring future ablation validation.
The experiment focused on the vibration profile of the cruise phase and did not yet cover the large-acceleration conditions of take-off and landing. This limitation provides a clear direction for full-envelope validation in aviation human-factors laboratories and, ultimately, in real eVTOL flight. Even so, the in-ear form factor presented here embodies a “transparent technology” principle—a device that is indistinguishable from a consumer earphone and that simultaneously provides physiological monitoring, neuromodulation, and auditory intervention—and the system’s respect for natural recovery embodies a human-in-the-loop design philosophy. In summary, this work offers an evidence-based, human-factors-driven technical solution for managing eVTOL passenger anxiety that should help to support public acceptance and the commercial advancement of urban air mobility.