Article

Biomechanical Determinants of Racket Velocity: The Role of Plantar Pressure During the Table Tennis Topspin Forehand

1
Department of Sports Didactics, Faculty of Physical Education and Sport, Wrocław University of Health and Sports Sciences, 51-612 Wrocław, Poland
2
China Table Tennis College, Shanghai University of Sport, Shanghai 200348, China
3
Department of Physiology and Biomechanics, Faculty of Physical Education and Sport, Wrocław University of Health and Sports Sciences, 51-612 Wrocław, Poland
*
Author to whom correspondence should be addressed.
Appl. Sci. 2026, 16(11), 5345; https://doi.org/10.3390/app16115345
Submission received: 22 April 2026 / Revised: 19 May 2026 / Accepted: 22 May 2026 / Published: 26 May 2026
(This article belongs to the Special Issue Applied Biomechanics for Sport Performance and Injury Rehabilitation)

Abstract

(1) Background: The aim of this study was to determine the biomechanical role of plantar pressure distribution in generating racket velocity during the topspin forehand in table tennis players, with particular emphasis on its relationship with stroke kinematics and performance level. (2) Methods: The study involved 14 male table tennis players divided into Elite and Sub-Elite athletes. Each participant performed a topspin forehand stroke. The study employed a biomechanical analysis combining inertial motion capture and plantar pressure measurement to assess the relationship between lower limb loading and racket velocity during the topspin forehand. (3) Results: The statistical evidence supports the subsequent phase-by-phase comparisons, indicating that the Elite (EL) and Sub-Elite players (SE) differ in execution of the topspin forehand, and the Elite group achieved significantly higher racket speed values in all phases (e.g., in hitting phase: SE-13.8 m/s, EL-15.6 m/s, p ≤ 0.001, d = 1.0; in post-impact follow-through phase: SE-13.8 m/s, El-16.1 m/s, ≤0.001, d = 1.3) and exhibited also a different pattern of foot loading. An analysis of the correlation between the plantar pressure and velocity of the racket in individual events revealed numerous significant correlations. (4) Conclusions: The study identified numerous correlations between the maximum plantar pressure and the maximum racket speed in the individual phases of the stroke. This demonstrates the active involvement of the feet throughout the entire kinematic chain of the topspin forehand stroke and highlights the importance of foot coordination for the outcome of this stroke, namely the speed of the racket-wielding arm.

1. Introduction

Table tennis is a sport that is widely played, both for recreational and health purposes as well as at the competitive level. When played competitively at a high level, it is a very demanding sport, the nature of which has changed over the years due to advancements in equipment, training conditions, and the physical development of players, among other factors [1,2]. Current reports indicate that the average duration of a play is short, at about 3.5 s, the rest period between plays is longer, lasting about 8–20 s, and energy expenditure during a game is relatively low [3]. Non-lactic anaerobic metabolism is the primary source of energy during periods of exertion in table tennis, but aerobic metabolism helps players recover more quickly before the next match and the next day of competition [4,5]. As reported in the literature [6], the high level of athletic performance (including in table tennis) is determined by five factors: technique, tactics, physical fitness, mental toughness, and intelligence. It is also sometimes stated that indicators of success in sports can be divided into technical, tactical, and biomechanical factors [7]. Table tennis is a highly diverse sport in which the outcome is determined by a wide range of factors: technical, tactical, and psychological preparation, motor skills, and others [8]. Among the factors mentioned, the importance of technique for the performance of table tennis players cannot be overstated. This technique, understood as the way a movement is executed—tailored to the demands of the sport and the player’s abilities—is based on several biomechanical principles, of which the principle of the kinematic chain appears to be the most important [9,10]. During play, players must position themselves optimally relative to the ball using footwork and then strike the ball in a coordinated manner with the appropriate force (both magnitude and direction) and at the correct racket angle. This coordination, known also as the kinematic chain, involves executing the movement in accordance with principles such as the proximal-to-distal sequence (where movement begins in the lower limbs and trunk before being transferred to the racket-wielding hand) and the stretch-shortening cycle (where muscles are rapidly stretched during the backswing to enhance the power of the subsequent contraction during the forward swing), which allows for the concentration of energy at the point of contact with the ball [11]. Coordination based on the kinetic chain enables the generation of energy from the whole body (lower limbs and trunk) and the transfer of this energy to the point of contact, where the racket meets the ball, thereby optimizing the force of the stroke. On the other hand, any error in the kinetic chain can lead to compensatory patterns, high demands on distal parts, and overuse and overload injuries [12]. Understood in this way, the sequence of movements suggests that footwork, in addition to its fundamental role in achieving optimal positioning relative to the ball, can be of immense importance in terms of coordinating the stroke itself. The colloquial term “power from the ground”, used by table tennis coaches to emphasize the importance of the lower limbs in generating stroke power, has not yet been fully substantiated scientifically. The topics addressed by authors dealing with table tennis and the importance of footwork touch upon several issues. The biomechanics of footwork are described, most often in the context of comparing specific steps among players of different levels [13,14]. Attention is drawn to the similarities in the characteristics of the individual steps, highlighting the occurrence of the highest loads and reaction forces during the cross-step. The differences in leg biomechanics between athletes of different levels are emphasized, noting that professional athletes have a better ability to utilize foot drive and body balance in footwork movement techniques [13]. Some authors point to different uses for specific footwork maneuvers. The “one step” (a quick, single-segment movement used for immediate reach) is associated with faster performance for a direct point, whilst the chasse step (or sidestep) involves a sliding motion used for broader positioning and more efficient preparation for high-quality strokes in the next phase [15]. Most studies on footwork focus on its biomechanical analysis during the execution of the topspin forehand stroke [16]. It is emphasized that lower limb muscle development plays an important role in movement control and stability as well as sports injury prevention in table tennis footwork during the performance of the topspin forehand. The authors point out that there are differences in the forces exerted by the foot on the ground between the cross step and the sidestep (“chase”) when executing a topspin forehand at specific points on the forefoot [17]. Fu et al. [18] assessed the trajectory of the center of pressure during a topspin forehand stroke, comparing professional and less advanced players. They found differences in the movement of the COP in the lateral–medial direction and, at the same time, a smaller movement in the anterior–posterior direction, interpreting this as an indicator of better footwork technique in advanced players during this stroke.
While the topspin forehand is widely described as a proximal-to-distal movement, the interaction between the foot and the ground remains insufficiently explored. A recent systematic review by Ferrandez et al. [19] explicitly noted a lack of research investigating the energy flow between the lower and upper body and how footwork-generated energy contributes to racket velocity. To the best of our knowledge, there is a lack of studies and research findings in the literature that would describe the characteristics of the forces exerted by the feet on the ground (and the ground reaction forces or plantar pressure) during the execution of individual forehand topspin strokes, correlated with the effect of the kinematic chain, i.e., the resulting racket speed. Previous studies have predominantly focused on kinematic and kinetic parameters of the upper body or selected joint actions, with limited attention given to how forces are generated and transferred at the level of foot–ground contact. While lower limb involvement has been acknowledged, it has typically been analyzed through joint kinematics rather than direct measures of loading distribution. Plantar pressure analysis provides a unique opportunity to quantify how athletes generate and transfer forces through the feet, reflecting both the magnitude and timing of loading as well as weight transfer strategies. Despite its relevance, the relationship between plantar pressure distribution and key performance outcomes, such as racket velocity, has not been clearly established. Understanding this relationship may offer important insights into the mechanical origins of stroke effectiveness and the role of lower limb coordination within the kinematic chain. Investigating the relationship between the distribution of foot pressure on the ground and racket speed may provide important insights into the technique of executing a forehand topspin among players of varying skill levels. It may demonstrate the importance of technical elements such as the distribution of pressure forces during different phases of the stroke, the shift of the center of gravity for racket speed, and the action of individual parts of the feet during a forehand topspin stroke. Consequently, demonstrating such correlations may have cognitive value, as well as practical and applied value. Therefore, the aim of this study was to determine the biomechanical role of plantar pressure distribution in generating racket velocity during the topspin forehand in table tennis players, with particular emphasis on its relationship with stroke kinematics and performance level. We hypothesized the following:
  • Elite players will demonstrate significantly higher maximum racket velocities across all stroke phases compared to Sub-Elite players, and this superiority will be associated with a distinct foot-loading profile characterized by higher peak pressures in the forefoot and hallux (big toe) during the preparation and impact phases.
  • There will be a significant positive correlation between specific plantar pressure parameters and maximum racket velocity, where increased total pressure and localized loading in the hallux and metatarsal zones will serve as key predictors of racket velocity within the kinematic chain.

2. Materials and Methods

This study employed a cross-sectional observational design to examine the relationship between plantar pressure distribution and racket velocity during the topspin forehand in table tennis players.

2.1. Participants

The study involved 14 male table tennis players from leading training centers in Poland. All participants represented a high competitive level and were actively competing in national leagues. They were recruited from among players training in the central PZTS (Polish Table Tennis Association) centers. Players were classified according to their competitive level based on participation in the Polish Superliga (highest national division) or the First Division, as well as their official national ranking. All participants had a minimum of 8 years of training experience and trained regularly (10 sessions per week).
Participants were divided into two groups based on performance level: ELITE (EL; n = 6, 25.0 ± 4.0 y., 175.0 ± 3.1 cm, 70.0 ± 3.9 kg), comprising players competing in the Polish Superliga and were placed in 1–10 in the national ranking (more than 400 ranking points), and SUB-ELITE (SE; n = 8, 22.0 ± 5.0 y., 177.0 ± 5.5 cm, 72.0 ± 5.0 kg), comprising players competing in the First Division and placed 11–64 in the national ranking, which was equivalent to having more than 190 ranking points.
Inclusion criteria were active participation in national-level competitions (Superliga or First Division, more than 190 points in national ranking), a minimum of 8 years of systematic training, and regular training frequency (at least 10 sessions per week). Exclusion criteria included any musculoskeletal injury affecting performance within the last 6 months.
All participants were right-handed. All participants were informed of the aims and procedures of the study and provided written informed consent prior to participation. The study protocol was approved by the Senate Bioethics Commission of the Wroclaw University of Health and Sport Sciences (approval no. 34/2019) and conducted in accordance with the Declaration of Helsinki. Informed consent was obtained from all athletes involved in the study.

2.2. Procedures

The tests were conducted at three table tennis training centers in Poland (Drzonków, Grodzisk Mazowiecki, and Gdańsk). To minimize inter-site variability, identical equipment and measurement protocols were used at all locations.
Prior to testing, all participants completed a standardized warm-up consisting of 15 min of general exercises followed by 20 min of table tennis-specific drills, including forehand and backhand topspin strokes, played according to individual requirements.
Each participant performed a topspin forehand stroke directed cross-court from the forehand side of the table. The task required players to hit a predefined target area (30 × 30 cm) located diagonally on the opponent’s side of the table. Participants were instructed to perform the stroke with maximal effort while maintaining accuracy (“Play diagonally, accurately, and as hard as possible”).
Every successful shot considered “on the table” and played diagonally was recorded for further analysis (missed balls, balls hit out of bounds, balls hit into the net, etc.) were excluded. Balls were delivered using a table tennis robot Newgy Robo-Pong 2055 (Newgy Industries, Gallatin, TN, USA) with constant parameters of rotation, speed, direction, and frequency. The robot settings were as follows: topspin, speed level 15, placement oscillation left/right level 15, head angle 8, and ball interval 1.30 s. These parameters ensured consistent ball trajectory and timing across trials.
Each participant performed 20–25 trials, of which 15 valid strokes (i.e., balls landing within the target area) were included in the analysis. Unsuccessful attempts (e.g., balls hit into the net or outside the table) were excluded from further analysis. To standardize equipment, all participants used the same racket blade, Jonyer-H-AN (Butterfly, Tamasu Co., Ltd., Tokyo, Japan), and the rubbers Tenergy 05, 2.1 mm on both sides. Plastic balls (Andro Speedball 3S 40+) and the Stiga Premium Compact (Stiga Sports AB, Eskilstuna, Sweden) table were used in all trials. Participants were familiarized with the equipment prior to testing.

2.3. Study Design

The study employed a biomechanical analysis combining inertial motion capture and plantar pressure measurement to assess the relationship between lower limb loading and racket velocity during the topspin forehand.
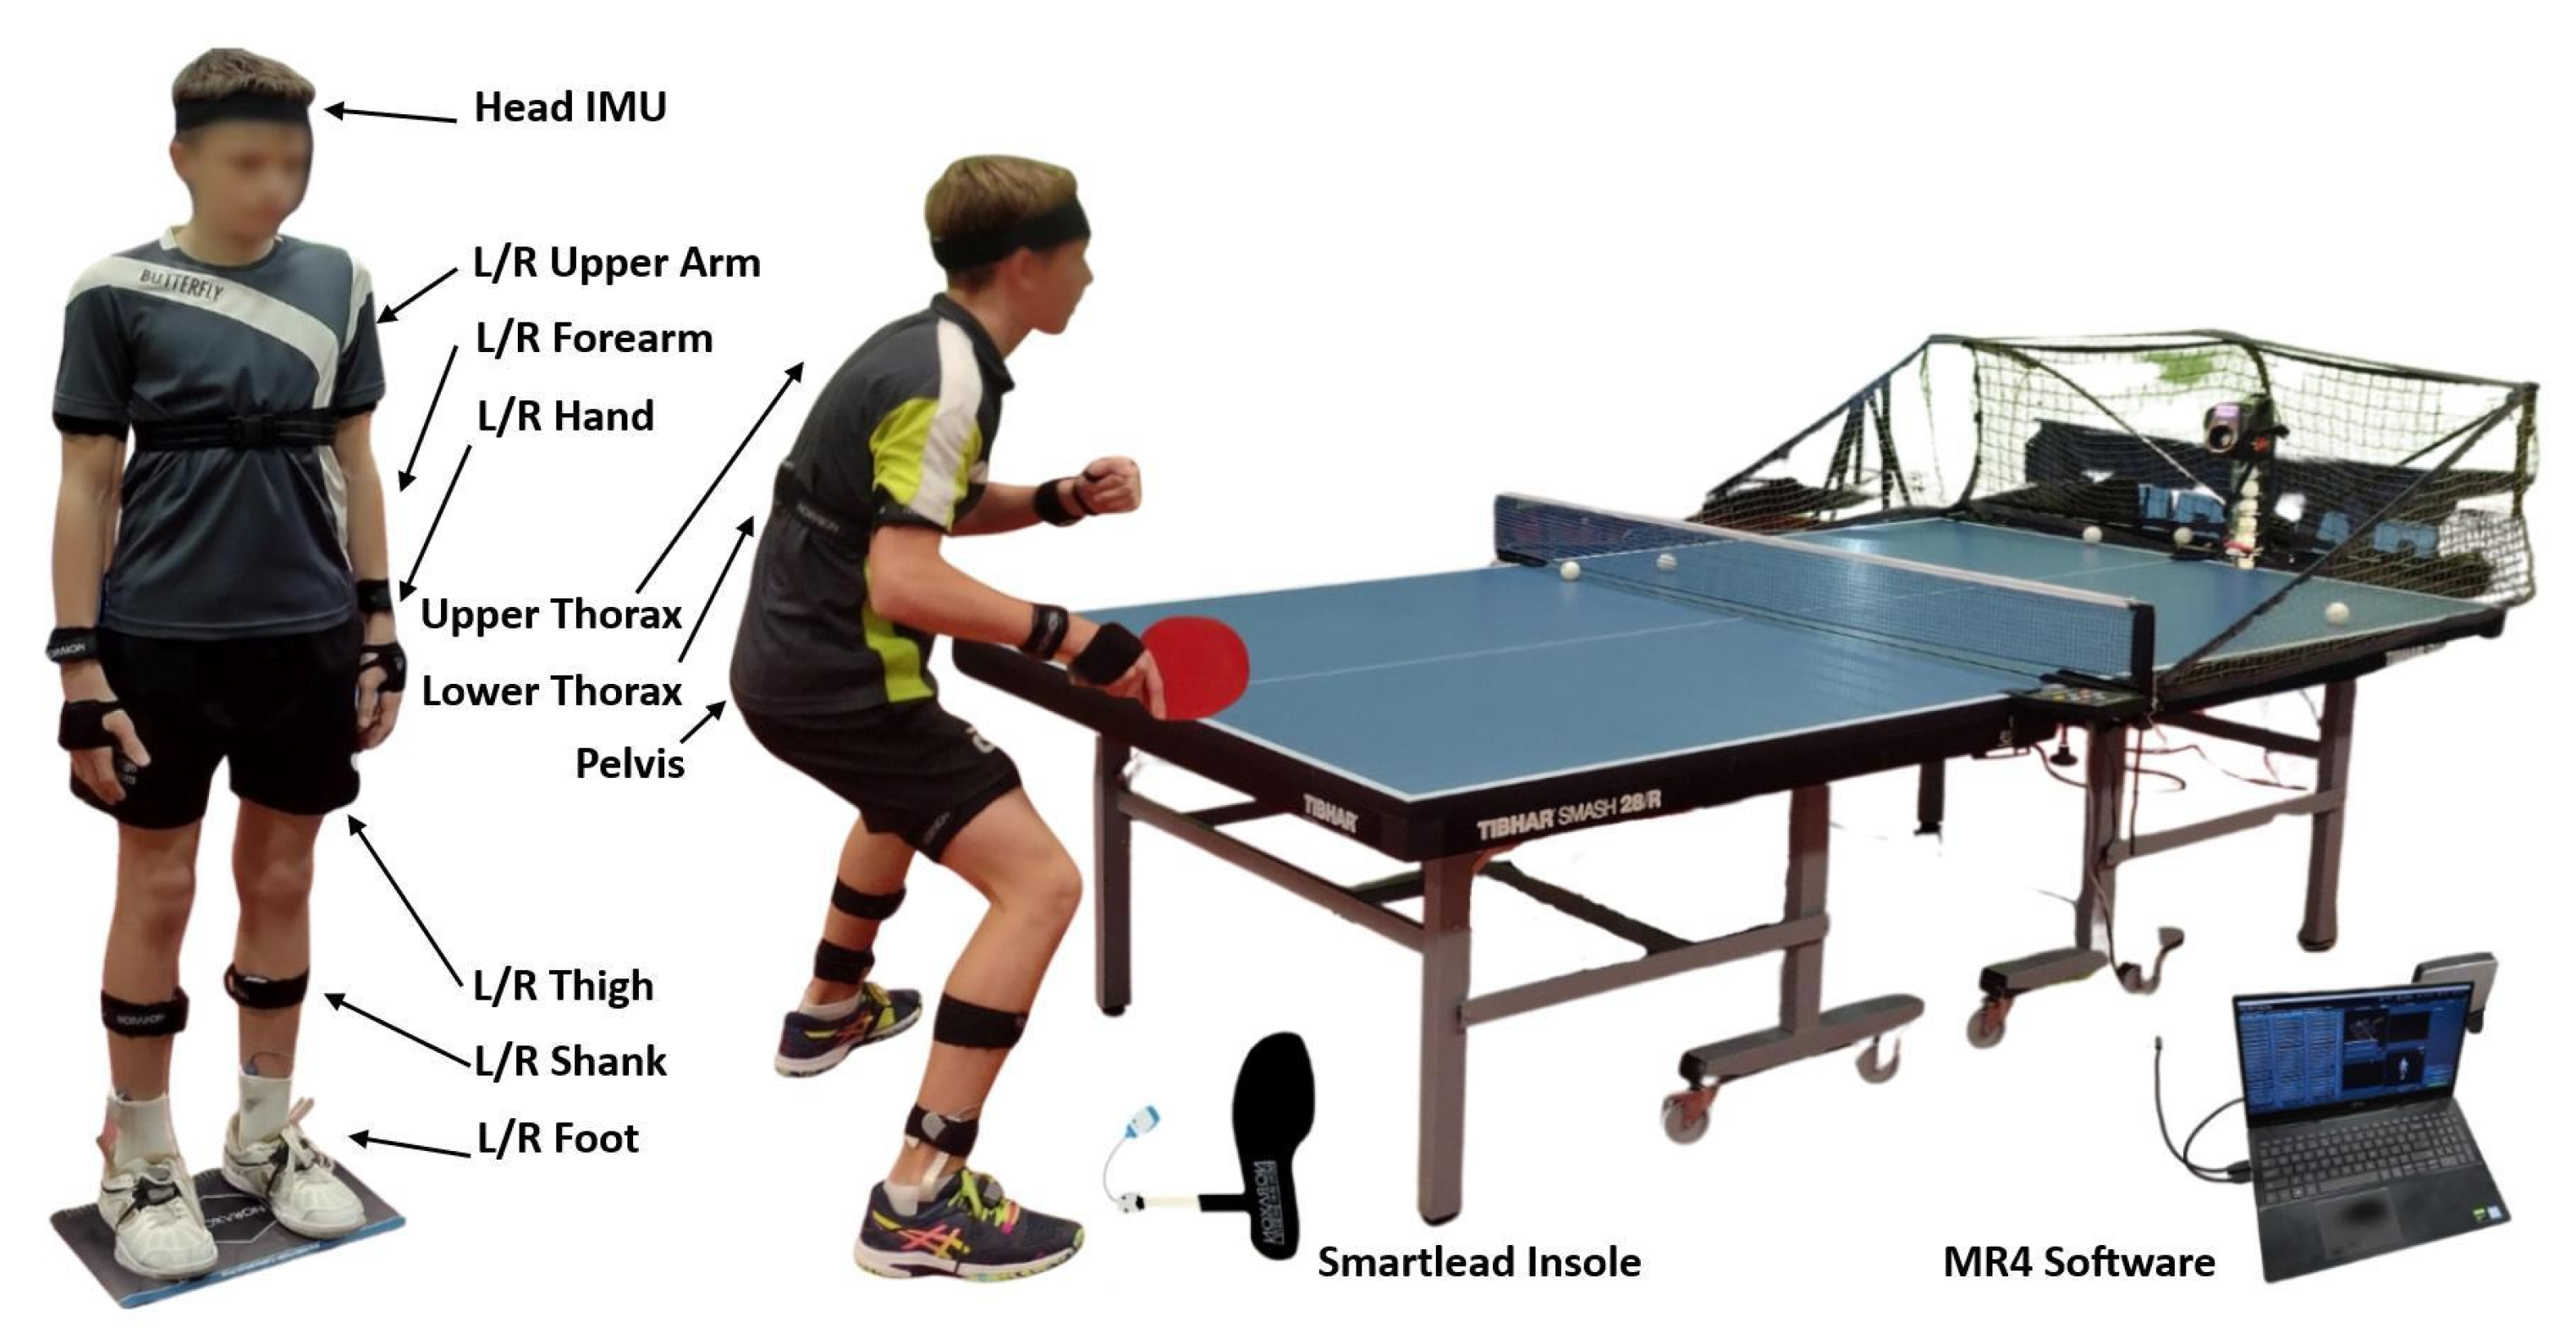
Upper limb and whole-body kinematics were recorded using the wearable inertial measurement system myoMOTION™ (Noraxon USA Inc., Scottsdale, AZ, USA), consisting of 16 sensors placed on body segments according to the manufacturer’s protocol (Figure 1). Sensor placement and calibration were performed by the same experienced technician prior to data collection. The system recorded 3D segment orientations at a sampling rate of 100 Hz. The validity and reliability of IMU-based motion capture systems for dynamic movement analysis have been demonstrated in previous studies [20].
The setup included a table tennis robot delivering balls under controlled conditions (on the right). Kinematics were recorded using a 16-sensor IMU system (myoMOTION™, Noraxon, USA Inc., Scottsdale, AZ, USA) placed on the head, trunk, pelvis, and bilaterally on the upper and lower limbs (Figure 1). Plantar pressure was measured using instrumented insoles (Ultium SmartLead, Noraxon, USA Inc., Scottsdale, AZ, USA). All subsystems were synchronized and calibrated prior to testing (Figure 1, on the left).
The sensors were placed symmetrically so that the positive x-coordinate on the sensor label corresponded to a superior orientation for the trunk, head, and pelvis (Figure 1). Every participant, at the beginning of the measurement, was checked, and the system was calibrated. For the limb segment sensors, the positive x-coordinate corresponded to a proximal orientation. For the foot sensor, the x-coordinate was directed distally (to the toes). The sensors were placed according to the myoMotion manual protocol. The max sampling rate for a given sensor/receiver was 100 Hz per sensor for the whole 16-sensor set.
The force exerted by the foot on the ground was assessed using Ultium SmartLead Insoles, a component of the Motion Ultium system. SmartLead insoles provide information on foot–ground contact detection and quantitative impact characteristics during walking, running, and other dynamic activities, as well as the relative load distribution during balance exercises and bilateral or unilateral exercises.
Plantar pressure data were collected using wireless instrumented insoles which are thin, flexible pressure-measuring devices designed to fit comfortably within standard footwear. These insoles incorporate an array of resistive pressure sensors that capture force distribution across eight discrete plantar zones, including the heel, midfoot (arch), forefoot (metatarsal heads 1, 3, and 5), and toes (hallux and lesser toes). The system recorded data at a sampling rate of 500 Hz, with a measurement range of 0 to 52 N/cm2 and a maximum tolerable pressure of 69 N/cm2. All data were synchronized and processed within the Noraxon myoRESEARCH version 4.0 (MR4) software environment. The following maximum pressure-related parameters were extracted separately for the left (LT) and right foot (RT): total maximum pressure (Total_Max), maximum pressure in the heel zone (Heel_Max), arch zone (Arch_Max), hallux zone (Hallux_Max) and toes zone (Toes_Max), and individual metatarsal regions (Met 1/3/5_Max). Plantar-loading variables were expressed as pressure values in N/cm2, as provided by the measurement software. For SI unit reference, 1 N/cm2 corresponds to 10,000 N/m2. Additionally, percentage contributions of each metatarsal region to total pressure (Met 1/3/5 (%)_Max) were calculated and expressed as percentages. This procedure allows for an assessment of relative loading distribution and weight transfer strategies that is independent of the absolute body weight of the participants, thereby facilitating a more accurate comparison of technical footwork patterns across different performance levels.
Before each measurement session, the IMU and plantar pressure systems were calibrated according to the manufacturer’s protocol.
Where available, inertial data from the integrated motion sensors were used to derive maximum velocity values. Racket velocity was estimated from the IMU sensor attached to the playing hand/racket-side segment. Linear velocity was calculated from the three orthogonal velocity components recorded in the global coordinate system. These included the peak resultant velocity (V_Max) and the maximum velocities along the mediolateral (X), anteroposterior (Y), and vertical (Z) axes—denoted as VX_Max, VY_Max, and VZ_Max, respectively. All velocity parameters were expressed in meters per second (m/s).
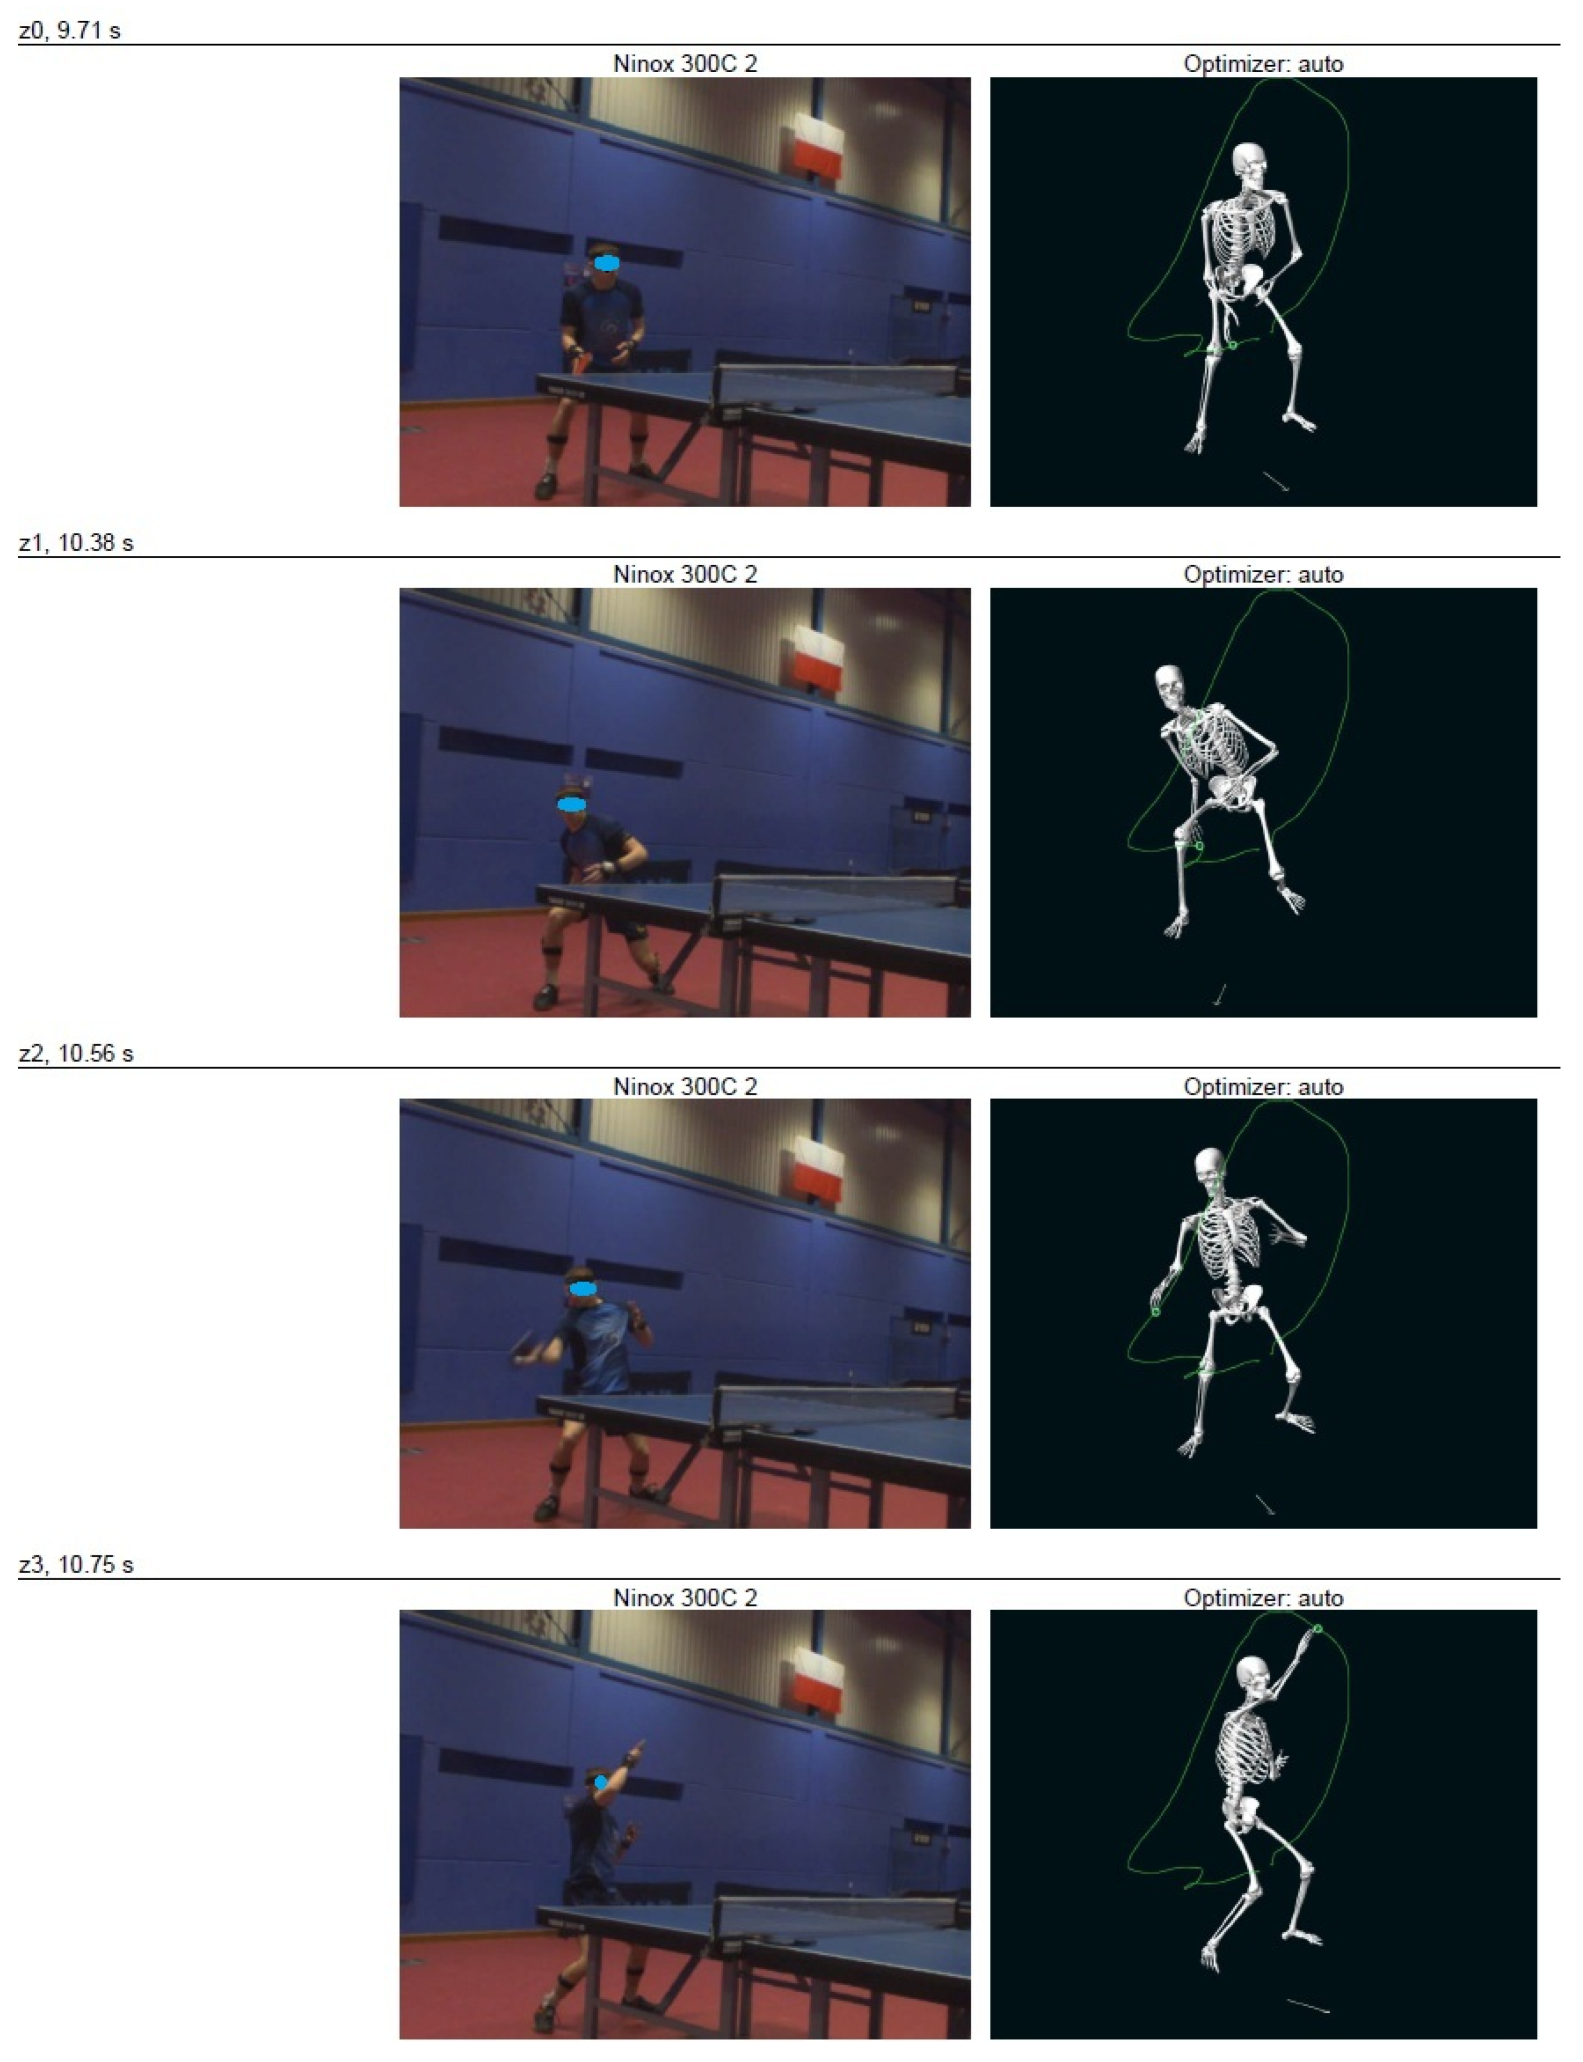
The movement of the playing hand was used to assess specific events of the cycle. The events were identified by the person analyzing the video material by a min/max algorithm applied to the components of hand position or velocity (Figure 2). The specific events were: ready position (event z0—hand not moving after the previous stroke, before the swing), backswing (event z1—the moment when the hand changes direction from backward to forward in the sagittal plane after the swing), contact (event z2—the moment of contact of the racket with the ball determined based on the camera recording), and forward swing end (event z3—the moment when the hand changes direction from forward to backward in the sagittal plane after the stroke).
The identification of specific events made it possible to define the individual phases of the movement being assessed:
  • Backswing (Bcksw): This preparatory phase begins at the ready position (z0), where the hand is stationary after a previous stroke, and ends at the moment the hand changes direction from backward to forward in the sagittal plane (z1). During this phase, there is typically a shift of the center of gravity toward the right leg and slightly backward.
  • Forward Swing Phase 1 (Frw1): This is the initial stroke phase that covers the forward motion up to the exact moment of racket–ball contact (z2). It is considered a critical phase for impact, characterized by an active shift of the center of gravity toward the forefoot and hallux (big toe) of the left foot while reducing the load on the left heel.
  • Forward Swing Phase 2 (Frw2): This phase represents the end of the stroke, covering the forward motion after contact until the hand decelerates and changes direction from forward to backward (z3). Although the racket is still moving forward and often reaches its maximum resultant velocity during this time, the footwork starts to anticipate the deceleration and return to a neutral stance.
  • Return to Ready Position Phase (Ret): This is the return phase, where the player moves from the end of the stroke back to the initial ready position to prepare for the next shot. Plantar pressure increases again during this phase as the player stabilizes their body, with the left foot playing a more significant role in the return to the ready position.

2.4. Statistical Calculations

The dataset was organized in a long format, where each row represented a single observation defined by participant (ID), trial (cycle), biomechanical variable, and movement phase. Descriptive statistics (mean, standard deviation, minimum, and maximum) were calculated for all dependent variables across groups (EL vs. SE) and phases. Normality of distributions was assessed using the Shapiro–Wilk test; however, due to their sensitivity to sample size, results were interpreted in conjunction with graphical methods (histograms and boxplots). To examine differences between the Elite and Sub-Elite groups, each biomechanical variable was compared separately within each stroke phase. Data distribution was assessed using the Shapiro–Wilk test. When the assumptions of normality and homogeneity of variance were met, independent-samples t-tests were used; when these assumptions were violated, the Mann–Whitney U test was used. The significance level was set at α = 0.05.
To investigate relationships between lower limb loading and racket velocity, correlation analyses were conducted. Maximum plantar pressure variables (e.g., total pressure for the left and right foot) were correlated with kinematic variables representing racket velocity (resultant and directional components) within corresponding movement phases (z1–z2 and z2–z3). Pearson’s correlation coefficient was used for normally distributed data, while Spearman’s rank correlation was applied otherwise.
To support the interpretation of between-group differences, effect sizes were calculated and reported alongside p-values where appropriate. For comparisons performed using independent samples t-tests, Cohen’s d was calculated. As an alternative, for non-parametric comparisons performed using the Mann–Whitney U test, the rank-biserial correlation was used as the effect-size measure. Effect sizes were interpreted as small, moderate, and large using conventional thresholds of 0.20, 0.50, and 0.80 for Cohen’s d and 0.10, 0.30, and 0.50 for rank-biserial correlation, respectively.
All statistical analyses were performed using Statistica 14.1 software (TIBCO Software Inc., Palo Alto, CA, USA). Results are presented as the mean ± SD, with corresponding p-values for group comparisons and correlation coefficients (r) indicating the strength and direction of associations.

3. Results

Between-group comparisons were conducted separately for each biomechanical variable within each stroke phase. Depending on the data distribution, either independent-samples t-tests or Mann–Whitney U tests were used. The results showed several significant differences between Elite (EL) and Sub-Elite (SE) players in racket velocity and plantar pressure variables. These findings indicate that the two groups differed in selected biomechanical aspects of topspin forehand execution, particularly in racket speed and foot-loading patterns.

Analysis of the Maximum Plantar Pressure and Maximum Speed of a Racket in Both Groups

An analysis of the maximum pressure values (Table 1) shows that these values generally increase during the two specific phases Bcksw and Frw 1, decrease during the Frw 2 phase, and increase again during the Ret phase. An additional observation is that in the first three phases, the maximum pressure force (its average values across the group in all repetitions) is greater in the right foot than in the left. The highest values of pressure force, considering the location of this force, were found (apart from the Total_Max) for Met 1/3/5_Max. Particularly high pressure values are observed in the right foot during the Bcksw and Frw 1 phases and in the left foot during the Ret.
An analysis of the differences between the EL and SE groups (Table 1) showed that the EL group achieved significantly higher racket speed values in all phases (p ≤ 0.05 and high effect size) and exhibited a different pattern of foot loading, particularly in the left leg and during the preparation (Bcksw) and impact (Frw1 and Frw2) phases.
The highest racket velocity values were observed in both groups during the Frw2 phase; the maximum values of the racket’s resultant velocity were only slightly lower in Frw1. In most phases, the maximum velocities were significantly higher in the EL group than in the SE group (e.g., in hitting phase: SE-13.8 m/s, EL-15.6 m/s, p ≤ 0.001, d = 1.0; in post-impact follow-through phase: SE-13.8 m/s, El-16.1 m/s, ≤0.001, d = 1.3, Table 2). This applies to both the Cartesian components and the resultant velocity.
In many phases, the maximum values in the Total, Arch, Hallux/Toes, Heel, and Met zones for the left foot (LT) differed significantly between EL and SE. Generally, EL showed higher peak values in forefoot and big toe loading, particularly in Bcksw, Frw1, and Frw2 (Table 1).
Differences in the variables for the right foot (RT) were less clear-cut: in some phases there were no effects, whilst in others (e.g., Heel and Metatarsal), higher parameter values were observed in EL. It is noteworthy that in the Bcksw phase, EL exhibited higher-pressure forces (except in Arch) in the right foot than SE.
The most pronounced differences between EL and SE were observed in the phases critical to impact: Frw1 (the start of forward motion, up to contact) and Frw2 (forward motion after contact, up to deceleration).
An analysis of the correlation between the force and velocity of the racket in individual events revealed numerous significant correlations. During the FRW 1 phase, the pressure forces in the left foot (LT), particularly in the Hallux/Toes and Total zones, showed significant positive correlations with racket speed (VX_Max and V_Max; r ≈ 0.51–0.53, p ≤ 0.001) and negative correlations in the Heel and Arch regions (Table 2). For the right foot (RT), positive correlations were found, particularly for Heel and Total with V_Max and VX_Max (r ≈ 0.40–0.49, p ≤ 0.001), with negative correlations for Hallux/Toes with V_Max (r ≈ 0.28, p ≤ 0.001). The highest number of significant correlations was found in this phase.
In the Frw2 phase in the right foot (RT), Heel and Total were significantly positively correlated with total velocity and VZ (r ≈ 0.38–0.44, p < ≤0.0011), whereas in the left limb, the correlations concerned the heel, the arch of the foot, and the midfoot region. Weaker and less stable relationships were observed in the left foot; some correlations were negative (e.g., LT Arch with VY, p < 0.05).
Other significant correlations included, in several phases (particularly Frw1 and Frw2), those between Arch and velocity (often negative with VY). Pressure values in Met 1/3/5 showed positive correlations with velocities, though generally weaker than those for Hallux/Toes and Heel. In the Bcsw phase, isolated significant correlations appeared, particularly around the Heel, but these were not as consistent. Significantly fewer correlations were found in the Ret.

4. Discussion

The aim of the study was to assess and compare the maximum plantar pressures in different regions of the foot and the maximum racket speed among players of varying skill levels during a topspin forehand stroke, as well as to evaluate the correlation between the measured force values and the maximum racket speed. Analysis of the differences showed that the EL group achieved significantly higher racket speed values in all phases. This confirms our first hypothesis. This observation is also consistent with literature reports that suggest more advanced players have better so-called stroke effects (e.g., ball speed or spin, also placement) [11,21]. EL exhibited a different pattern of foot loading, particularly in the left leg and during the preparation (Bcksw) and impact (Frw1 and Frw2). This may indicate better coordination of force transfer and more efficient (bio)mechanics of movement in professional players (EL) compared to less advanced players (SE). Of course, from the perspective of the quality of the stroke, the maximum values achieved in the Frw1 and Frw2 phases appear to be the most important, as they are related to the velocity at which the racket strikes the ball. In these phases, the EL players achieved a statistically significantly higher maximum racket speed. Furthermore, the X-mediolateral component in Frw1 and all components in Frw2 were higher in the EL group than in the SE group. The ability to achieve maximum racket speed may therefore serve as a training control parameter, indicating the level of coordination in the stroke movement.
When analyzing the distribution of foot loads across the individual phases, it was observed that in many phases the maximum values in the Total, Arch, Hallux/Toes, Heel, and Met zones differed significantly between the EL and SE groups: the EL group exhibited higher peak values in forefoot and left big toe load, particularly in Bcksw, Frw1, and Frw2 (Table 1), which may suggest a more dynamic weight transfer forwards and to the left in this group. Regarding the parameters of the right foot, the differences were less clear-cut: in some phases, there were no effects, whilst in others (e.g., Heel and Metatarsal), higher parameter values were observed in the EL group. It is noteworthy that in the Bcksw phase, ELs exhibited higher pressure forces in the right foot (except for Arch), which may reflect a stronger push-off from the right leg towards the left.
The most significant differences between the EL and SE groups were observed in the phases critical to the strike: Frw1 (the start of the forward movement, up to contact) and Frw2 (forward movement after contact). This confirms that experienced players make better use of the preparation and strike phases to generate speed and transfer force from the lower limbs; more precisely, they utilize ground reaction forces. This therefore provides confirmation, specifically regarding the feet, of the observations made by other authors. Qian et al. [14] found that high-level athletes utilize their lower limbs, including their feet, more effectively and efficiently to execute a topspin forehand stroke in table tennis. This highlights how important it is, in the overall coordination of the stroke movement, to use the correct sequence of leg coordination, particularly in generating force by pushing off the ground with the appropriate part of the foot. The importance of using specific parts of the foot was also identified for the complex technique employed, in stroke combinations. Jin et al. [22] investigated which part of the foot players use to contact the ground when performing a sidestep, concluding that an alternate method is far more advantageous than full-foot contact. Consequently, as the studies indicate, the point of take-off from the ground, the distribution of the foot’s pressure on the ground and their coordination are related to the coordination of the hitting movement and are important when working on the topspin forehand technique. The above-presented results and analysis confirm a further part of the first hypothesis concerning the different characteristics of plantar pressure in athletes with different levels of advancement.
The novelty of our research in relation to the literature was the assessment of the correlation between the values of the pressure force on the ground of different areas of the foot and the velocity of the racket during topspin stroke. The results obtained confirm our second hypothesis. Correlation analysis showed that leg coordination plays an important role in generating racket speed, although its nature varies depending on the phase. In the Bcsw phase, there were isolated significant correlations, particularly around the Heel in the RT and LT with V_max, but these were not as consistent, suggesting a rather preparatory and individually variable nature of this phase. The correlations indicated suggest a shift of the center of gravity to the right leg, slightly backwards.
During the Frw1 phase, the pressure forces in the left foot, particularly in the Hallux/Toes and Total zones, showed significant positive correlations with racket speed and negative correlations in the Heel and Arch regions. This suggests an active shift of the center of gravity towards the toes and forefoot of the left foot, as well as a reduction in load on its heel. This can be considered as a demonstration of the principle of the kinematic chain, i.e., the inclusion of individual body parts in the overall movement, resulting in the transfer of the center of gravity to the left foot (its front parts). The principle of the kinematic chain during topspin strokes in table tennis has already been confirmed in the literature [8,20]. It is explained in the literature that this principle enables the generation of energy, starting from the lower limbs, through the trunk and the upper-playing limb, to the accumulation of this energy in the hand–racket–ball area.
At the same time (Frw1), positive correlations were observed in the right foot (RT)—particularly in the Heel and Total zones with V_Max and VZ_Max—with negative correlations in the Hallux/Toes zone with V_Max, indicating pressure on the heel and a reduction in load on the toes and forefoot. In contrast, during the Frw2 phase, positive correlations were again observed in the right foot, and many negative ones in the left. This distribution of pressure forces thus corresponds to the end of the stroke and, consequently, to the deceleration of the racket’s movement and the return to the next shot, i.e., the next topspin, even though the racket is still moving forwards. This may be interpreted like the beginning of the Ret phase (return to the position, for the next stroke) in the feet area and then in the lower limbs. It therefore appears, when analyzing the distribution of forces, the directions of correlations, and their sequences, that the work of the feet seems to anticipate events related to the racket itself. This is likely a manifestation of the proximal-to-distal sequence principle, in which the proximal segments (here: the feet, but presumably also the legs and torso) precede the distal element (the hand holding the racket [11]. The results highlight an asymmetrical, dynamically changing pattern of leg coordination, which forms the (bio)mechanical basis for an effective stroke and use of kinematic chain principle. Li et al. [23] drew attention to the role of the non-dominant leg in the overall improvement of sports performance of table tennis players.
Previous studies have also highlighted a correlation between angular velocities in certain joints and racket speed in table tennis during topspin forehand and backhand strokes [24]. Similar correlations have been demonstrated in tennis [25]. In tennis, too, a possible correlation has been suggested between racket speed and the force of foot pressure directed vertically during the serve [26]. The research conducted in this study indicates that the magnitude of foot pressure, its distribution, and coordination are significant for racket speed in almost all phases of the movement. The pressure exerted by the right foot is greater and more significant for racket speed during the backswing and the initiation of the forward movement, whereas that of the left foot is more significant during the final phase of the stroke and the return to the ready position. This is a visible manifestation of the transfer of the center of gravity and the good organization of the stroke, utilizing the coordination of the whole body.

4.1. Practical Applications

The practical implications of our research revolve around applying the acquired knowledge primarily to the kinematic chain principle. Adding individual body segments to this chain, expressed by greater foot pressure on the ground, is the key to executing an effective topspin forehand stroke. Coordinating the movement on a proximal-to-distal basis, active shift of the center of gravity towards the toes and forefoot of the left foot, as well as a reduction in load on its heel during impact: these seem to be important elements of performing topspin forehand. Another important element of coordinated movement is the unloading of the left foot in preparation for the next stroke. The above observations can be immediately implemented by players and coaches into the training process to improve the forehand topspin of a given player.

4.2. Limitations and Future Research

This study has several methodological limitations that should be acknowledged. First, only male players were included; therefore, the findings should be interpreted as applicable only to male table tennis players. Second, although the participants represented a highly competitive level in Polish table tennis, they were not world-class players, and studies involving international elite athletes may produce different results. Therefore, future research should also include female athletes, as well as table tennis champions.
The relatively small sample size, particularly after division into Elite and Sub-Elite groups, limits the statistical power and generalizability of the findings. However, recruitment of homogeneous high-level table tennis players is difficult, and stroke technique in table tennis is characterized by considerable inter-individual variability. Therefore, the present results should be treated as exploratory and should be verified in future studies involving larger and more diverse samples.
Another limitation is the lack of force-plate validation of the plantar pressure measurements. The system was calibrated statically by recording signals during quiet standing, but no dynamic validation against force-plate data was performed. Therefore, although the insole system allowed assessment of plantar pressure distribution during a sport-specific task, the results should not be interpreted as direct ground reaction force measurements.
Because multiple between-group and correlation analyses were performed, the possibility of Type I error cannot be excluded. Accordingly, the reported relationships should be interpreted with caution and considered hypothesis generating rather than confirmatory.
Given the exploratory character of the study and the large number of inter-related biomechanical variables analyzed, no formal correction for multiple comparisons was applied. Therefore, the reported p-values should be interpreted cautiously, with greater emphasis placed on effect sizes and consistency of biomechanical patterns.
Although event detection was supported by a min/max algorithm applied to hand-position components, the final identification of z0–z3 events still involved manual frame-by-frame inspection of the video recordings. Because formal inter-rater and intra-rater reliability analyses were not performed, some observer-dependent variability cannot be excluded [27].
Finally, although the IMU system enabled sport-specific data collection under practical testing conditions, its limitations should be acknowledged. These include possible sensor drift, sensitivity to sensor placement, soft-tissue artefacts, and lower spatial accuracy compared with optical motion capture systems.

5. Conclusions

The study found that the EL group achieved significantly higher racket speed values than the SE group in all phases, particularly the maximum value overall. The group with higher sporting proficiency (EL) also exhibited generally higher plantar pressure values, as well as a different pattern of foot loading compared to the SE group, particularly in the left leg and during the preparation (Bcksw) and impact phases (Frw1 and Frw2). The study also identified numerous correlations between the maximum plantar pressure and the maximum racket speed in the individual phases of the stroke. This demonstrates the active involvement of the feet throughout the entire kinematic chain of the topspin forehand stroke. This concerns the transfer of the center of gravity during the impact phase to the forefoot of the left foot. The results highlight the importance of foot coordination for the outcome of this stroke, namely the speed of the racket-wielding arm. The practical implications of our research revolve around applying the acquired knowledge primarily to the kinematic chain principle. Adding individual body segments to this chain, expressed by greater foot pressure on the ground, is the key to executing an effective topspin forehand stroke. Coordinating the movement on a proximal-to-distal basis, active shift of the center of gravity towards the toes and forefoot of the left foot, as well as a reduction in load on its heel during impact: these seem to be important elements of performing topspin forehand, which can be directly implemented to table tennis training process.

Author Contributions

Conceptualization: Z.B., A.W., K.W. and S.W.; methodology: Z.B., P.J. and S.W.; software: Z.B. and S.W.; validation: Z.B., P.J., A.W., K.W. and S.W.; formal analysis: Z.B., S.W. and P.J.; investigation: Z.B., S.W., K.W. and A.W.; resources: Z.B., A.W. and K.W.; data curation: Z.B. and S.W.; writing—original draft preparation: Z.B., S.W., A.W. and K.W.; writing—review and editing: Z.B., S.W., P.J., A.W. and K.W.; visualization: Z.B. and S.W.; supervision: Z.B., S.W. and P.J.; project administration: Z.B.; funding acquisition: S.W. All authors have read and agreed to the published version of the manuscript.

Funding

This research received no external funding.

Institutional Review Board Statement

The study was conducted in accordance with the Declaration of Helsinki and approved by the Institutional Review Board (the Senate Bioethics Commission of the Wroclaw University of Health and Sport Sciences, approval no. 34/2019, 23 September 2019).

Informed Consent Statement

Informed consent was obtained from all subjects involved in the study.

Data Availability Statement

The raw data supporting the conclusions of this article will be made available by the authors on request.

Acknowledgments

We acknowledge the authority of the Wrocław University of Health and Sport Sciences for their financial support.

Conflicts of Interest

The authors declare no conflicts of interest.

Abbreviations

The following abbreviations are used in this manuscript:
LT and RT—left and right foot; Total_Max—total maximum pressure; Heel_Max—maximum pressure in the heel; Arch_Max—maximum pressure in the arch; Hallux/Toes_Max—maximum pressure in the hallux and toes; Met 1/3/5_Max—maximum pressure in the metatarsal regions; Met 1/3/5 (%)_Max—percentage contributions of each metatarsal region to total pressure; V—velocity; X, Y, Z—mediolateral, anteroposterior, and vertical; Bcksw—backswing phase; Frw1—stroke phase; Frw2 stroke end phase; Ret—return to ready position phase; EL—elite players; SE—sub-elite players.

References

  1. Grycan, J.; Kołodziej, M.; Bańkosz, Z. Technical and tactical actions of the world’s leading men players in table tennis in the years 1970–2021. J. Sports Sci. Med. 2023, 122, 667–680. [Google Scholar] [CrossRef]
  2. Yo-Aj, O.; Bumrungpanictarworn, A.; Liauw, F. Comparing competitive and recreational table tennis training: Impacts on quality of life in older adults—A randomized controlled trial. F1000Research 2025, 14, 89. [Google Scholar] [CrossRef]
  3. Milioni, F.; Leite, J.V.M.; Beneke, R.; de Poli, R.A.B.; Papoti, M.; Zagatto, A.M. Table tennis playing styles require specific energy systems demands. PLoS ONE 2018, 13, e0199985. [Google Scholar] [CrossRef]
  4. Zagatto, A.M.; Kondric, M.; Knechtle, B.; Nikolaidis, P.T.; Sperlich, B. Energetic demand and physical conditioning of table tennis players. A study review. J. Sports Sci. 2018, 36, 724–731. [Google Scholar] [CrossRef]
  5. Kondrič, M.; Zagatto, A.M.; Sekulić, D. The physiological demands of table tennis: A review. J. Sports Sci. Med. 2013, 12, 362–370. [Google Scholar]
  6. Yang, Q.; Li, M.; Zhou, Z.; Zhang, H. Exploring the structure of the shot effectiveness model for elite table tennis players. BMC Sports Sci. Med. Rehabil. 2023, 15, 127. [Google Scholar] [CrossRef] [PubMed]
  7. Hughes, M.D.; Bartlett, R.M. The use of performance indicators in performance analysis. J. Sports Sci. 2002, 20, 739–754. [Google Scholar] [CrossRef] [PubMed]
  8. Wong, D.W.-C.; Lee, W.C.-C.; Lam, W.-K. Biomechanics of Table Tennis: A Systematic Scoping Review of Playing Levels and Maneuvers. Appl. Sci. 2020, 10, 5203. [Google Scholar] [CrossRef]
  9. Chow, T.-H.; Lee, Y.-L. Plantar load distribution with centres of gravity balance and rearfoot posture in daily lives of Taiwanese college elite table tennis players: A cross-sectional study. PeerJ 2024, 12, e17173. [Google Scholar] [CrossRef]
  10. He, Y.; Sun, D.; Yang, X.; Fekete, G.; Baker, J.S.; Gu, Y. Lower limb kinetic comparisons between the chasse step and one step footwork during stroke play in table tennis. PeerJ 2021, 9, e12481. [Google Scholar] [CrossRef]
  11. Tian, J.; Xiao, Y. Research on the difference of stroke characteristics and stroke effect between different stroke duration of table tennis players. Sci. Rep. 2024, 14, 25405. [Google Scholar] [CrossRef]
  12. Almansoof, H.S.; Nuhmani, S.; Muaidi, Q. Role of kinetic chain in sports performance and injury risk: A narrative review. J. Med. Life 2023, 16, 1591–1596. [Google Scholar] [CrossRef] [PubMed]
  13. Li, X. Biomechanical analysis of different footwork foot movements in table tennis. Comput. Intell. Neurosci. 2022, 10, 9684535. [Google Scholar] [CrossRef]
  14. Qian, J.; Zhang, Y.; Baker, J.S.; Gu, Y. Effects of performance level on lower limb kinematics during table tennis forehand loop. Acta Bioeng. Biomech. 2016, 18, 149–155. [Google Scholar]
  15. Yang, X.; Wang, Y.; Mei, Q.; Shao, S.; Gu, Y.; Fernandez, J. Chasse-step and one-step footwork reported different biomechanical profiles in elite table tennis athletes. J. Sports Sci. Med. 2025, 24, 453–462. [Google Scholar] [CrossRef]
  16. He, Y.; Fekete, G.; Sun, D.; Baker, J.S.; Shao, S.; Gu, Y. Lower limb biomechanics during the topspin forehand in table tennis: A systemic review. Bioengineering 2022, 9, 336. [Google Scholar] [CrossRef] [PubMed]
  17. Lam, W.K.; Fan, J.X.; Zheng, Y.; Lee, W.C. Joint and plantar loading in table tennis topspin forehand with different footwork. Eur. J. Sport Sci. 2019, 19, 471–479. [Google Scholar] [CrossRef]
  18. Fu, F.; Zhang, Y.; Shao, S.; Ren, J.; Lake, M.; Gu, Y. Comparison of centre of pressure trajectory characteristics in table tennis during topspin forehand loop between superior and intermediate players. Int. J. Sports Sci. Coach. 2016, 11, 559–565. [Google Scholar] [CrossRef]
  19. Ferrandez, C.; Marsan, T.; Poulet, Y.; Rouch, P.; Thoreux, P.; Sauret, C. Physiology, biomechanics and injuries in table tennis: A systematic review. Sci. Sports 2021, 36, 95–104. [Google Scholar] [CrossRef]
  20. Bańkosz, Z.; Winiarski, S.; Malagoli Lanzoni, I. Kinematic Analysis of Short and Long Services in Table Tennis. Appl. Sci. 2025, 15, 470. [Google Scholar] [CrossRef]
  21. He, Y.; Lyu, X.; Sun, D.; Baker, J.S.; Gu, Y. The kinematic analysis of the lower limb during topspin forehand loop between different level table tennis athletes. PeerJ 2021, 9, e10841. [Google Scholar] [CrossRef]
  22. Jin, P.; Yang, C.; Ren, J. The kinetic differences in knee joint loading under different foot support patterns in table tennis players. Int. J. Sports Sci. Coach. 2025, 20, 2561–2570. [Google Scholar] [CrossRef]
  23. Li, H.; Liu, Y.; Zhou, X.; Yang, Z.; Xiao, Y. Study on the effect of unstable surface balance training on lower limb dynamic balance ability and stroke effect of table tennis players. Sci. Rep. 2025, 15, 38637. [Google Scholar] [CrossRef]
  24. Bańkosz, Z.; Winiarski, S. Correlations between angular velocities in selected joints and velocity of table tennis racket during topspin forehand and backhand. J. Sports Sci. Med. 2018, 17, 330–338. [Google Scholar]
  25. Pedro, B.; João, F.; Lara, J.P.R.; Cabral, S.; Carvalho, J.; Veloso, A.P. Evaluation of upper limb joint contribution to racket head speed in elite tennis players using imu sensors: Comparison between the cross-court and inside-out attacking forehand drive. Sensors 2022, 22, 1283. [Google Scholar] [CrossRef]
  26. Gorce, P.; Jacquier-Bret, J. Are there kinematic and kinetic parameters correlated with racket velocity during the tennis serve? A preliminary comparison between a slow and a fast serve for performance improvement. Front. Sports Act. Living 2024, 6, 1451174. [Google Scholar] [CrossRef] [PubMed]
  27. Mănescu, A.M.; Mănescu, D.C. Self-supervised gait event detection from smartphone imus for human performance and sports medicine. App. Sci. 2025, 15, 11974. [Google Scholar] [CrossRef]
Figure 1. Experimental setup and sensor configuration.
Applsci 16 05345 g001
Figure 2. The scheme of the cycle with identified events (z0–z3).
Applsci 16 05345 g002
Table 1. Mean values and t-test results: comparison of the two groups (EL vs. SE) across all measured parameters.
ParametersPhaseMean ± SD
SE
Mean ± SD
EL
Test Value (t/U)p-ValueEffect Size
(d/rrb)
LT Insole.Total_MaxBcksw79.28 ± 24.85101.89 ± 30.23−6.3≤0.0010.831
LT Insole.Arch_MaxBcksw4.66 ± 4.488.41 ± 4.08−6.4 U≤0.000.461
LT Insole.Heel_MaxBcksw17.57 ± 12.3724.90 ± 21.64−3.3 U≤0.0010.241
LT Insole.Hallux/Toes_MaxBcksw30.42 ± 14.6338.46 ± 17.28−3.8≤0.0010.509
LT Insole.Met 1/3/5 (%)_MaxBcksw41.06 ± 18.1448.82 ± 24.01−2.80.010.373
RT Insole.Total_MaxBcksw101.85 ± 28.10114.86 ± 32.69−3.3≤0.0010.432
RT Insole.Arch_MaxBcksw11.34 ± 4.629.69 ± 4.302.70.01−0.368
RT Insole.Heel_MaxBcksw50.11 ± 28.3061.35 ± 25.60−3.1≤0.0010.413
RT Insole.Hallux/Toes_MaxBcksw22.04 ± 12.1226.67 ± 13.41−2.70.010.365
RT Insole.Met 1/3/5_MaxBcksw40.41 ± 16.4740.59 ± 10.47−0.10.930.013
VX_MaxBcksw1.863 ± 1.5461.139 ± 1.1993.8 U≤0.001−0.283
VY_MaxBcksw1.083 ± 1.3012.035 ± 1.753−4.8 U≤0.0010.345
VZ_MaxBcksw0.917 ± 0.6771.518 ± 0.854−6.0≤0.0010.796
V_MaxBcksw3.933 ± 1.2024.365 ± 1.066−2.80.010.376
LT Insole.Total_MaxFrw171.47 ± 30.9592.82 ± 48.10−4.2≤0.0010.547
LT Insole.Arch_MaxFrw12.29 ± 3.544.27 ± 5.89−3.3 U≤0.0010.236
LT Insole.Heel_MaxFrw18.92 ± 10.1816.45 ± 26.38−3.2 U≤0.0010.224
LT Insole.Hallux/Toes_MaxFrw127.56 ± 15.8344.45 ± 26.85−6.1≤0.0010.799
LT Insole.Met 1/3/5 (%)_MaxFrw136.25 ± 20.8737.36 ± 23.79−0.40.710.050
RT Insole.Total_MaxFrw1114.24 ± 24.22115.64 ± 41.32−0.30.740.043
RT Insole.Arch_MaxFrw111.73 ± 7.0310.72 ± 6.081.10.27−0.152
RT Insole.Heel_MaxFrw149.42 ± 28.7658.85 ± 33.26−2.30.020.307
RT Insole.Hallux/Toes_MaxFrw131.49 ± 15.6228.98 ± 16.051.20.24−0.159
RT Insole.Met 1/3/5_MaxFrw148.81 ± 16.9643.82 ± 13.622.40.02−0.319
VX_MaxFrw14.396 ± 3.9719.108 ± 3.905−8.9 U≤0.0010.602
VY_MaxFrw16.405 ± 4.5876.116 ± 6.5660.4 U0.69−0.030
VZ_MaxFrw17.243 ± 2.0626.837 ± 2.3061.40.16−0.187
V_MaxFrw113.678 ± 2.49415.833 ± 1.490−7.3≤0.0011.010
LT Insole.Total_MaxFrw241.80 ± 20.5853.15 ± 46.43−2.6 U0.010.187
LT Insole.Arch_MaxFrw23.31 ± 3.852.37 ± 3.281.9 U0.06−0.146
LT Insole.Heel_MaxFrw28.29 ± 13.628.32 ± 9.660.0 U0.980.001
LT Insole.Hallux/Toes_MaxFrw216.97 ± 8.3325.11 ± 28.69−3.3 U≤0.0010.231
LT Insole.Met 1/3/5 (%)_MaxFrw220.40 ± 12.5319.23 ± 11.330.70.47−0.097
RT Insole.Total_MaxFrw281.20 ± 36.2065.06 ± 29.003.6≤0.001−0.483
RT Insole.Arch_MaxFrw24.64 ± 4.974.45 ± 4.130.3 U0.76−0.023
RT Insole.Heel_MaxFrw215.62 ± 15.2515.02 ± 9.740.3 U0.74−0.026
RT Insole.Hallux/Toes_MaxFrw223.78 ± 12.4223.56 ± 18.000.1 U0.91−0.008
RT Insole.Met 1/3/5_MaxFrw240.58 ± 23.1826.22 ± 13.755.3≤0.001−0.725
VX_MaxFrw23.329 ± 4.3446.251 ± 7.011−4.0 U≤0.0010.287
VY_MaxFrw23.529 ± 5.4878.054 ± 5.950−6.0 U≤0.0010.426
VZ_MaxFrw210.030 ± 1.61012.288 ± 0.956−11.9≤0.0011.641
V_MaxFrw213.818 ± 2.16816.113 ± 0.795−9.5≤0.0011.323
LT Insole.Total_MaxRet93.57 ± 23.91100.39 ± 18.42−2.30.020.313
LT Insole.Arch_MaxRet9.84 ± 4.0710.69 ± 2.18−1.80.070.249
LT Insole.Heel_MaxRet44.78 ± 29.6339.94 ± 22.141.30.19−0.181
LT Insole.Hallux/Toes_MaxRet24.41 ± 12.9832.44 ± 12.30−4.7≤0.0010.632
LT Insole.Met 1/3/5 (%)_MaxRet36.25 ± 12.4846.95 ± 20.15−5.1≤0.0010.664
RT Insole.Total_MaxRet91.40 ± 31.2893.884 ± 13.92−0.70.480.097
RT Insole.Arch_MaxRet7.70 ± 5.078.727 ± 4.41−1.60.120.214
RT Insole.Heel_MaxRet25.30 ± 15.2329.404 ± 14.15−2.10.040.277
RT Insole.Hallux/Toes_MaxRet27.81 ± 16.3133.360 ± 12.17−2.80.010.377
RT Insole.Met 1/3/5_MaxRet44.00 ± 22.8341.248 ± 11.601.10.29−0.145
VX_MaxRet2.073 ± 0.9102.314 ± 0.830−2.00.040.274
VY_MaxRet1.476 ± 1.1871.717 ± 1.049−1.6 U0.120.120
VZ_MaxRet0.254 ± 1.0330.221 ± 0.4080.3 U0.78−0.022
V_MaxRet3.756 ± 1.2494.623 ± 0.979−5.6≤0.0010.757
Legend: LT and RT—left and right foot; Total_Max—total maximum pressure; Heel_Max—maximum pressure in the heel; Arch_Max—maximum pressure in the arch; Hallux/Toes_Max—maximum pressure in the hallux and toes; Met 1/3/5_Max—maximum pressure in the metatarsal regions; Met 1/3/5 (%)_Max—percentage contribution of the metatarsal regions to total pressure; V—velocity; X, Y, Z—mediolateral, anteroposterior, and vertical directions, respectively; Bcksw—backswing phase; Frw1—stroke phase; Frw2—stroke end phase; Ret—return to ready position phase; t—independent samples t-test; U—Mann–Whitney U test; d—Cohen’s d; rrb—rank-biserial correlation.
Table 2. Matrix of Pearson’s r values and p-values for individual parameters in the events (EL + SE, n = 14). Only significant values are presented.
ParametersPhaseV_MaxVX_MaxVY_MaxVZ_Max
LT Insole.Total_MaxBcksw −0.3530.428
Bcksw p ≤ 0.001p ≤ 0.001
LT Insole.Arch_MaxBcksw0.262−0.5020.3910.412
Bckswp ≤ 0.001p ≤ 0.001p ≤ 0.001p ≤ 0.001
LT Insole.Hallux/Toes_MaxBcksw−0.128−0.2750.490
Bckswp = 0.048p ≤ 0.001p ≤ 0.001
LT Insole.Heel_MaxBcksw0.147−0.269 0.353
Bckswp = 0.023p ≤ 0.001 p ≤ 0.001
LT Insole.Met 1/3/5 (%)_MaxBcksw −0.1810.391−0.177
Bcksw p = 0.005p ≤ 0.001p = 0.006
RT Insole.Total_MaxBcksw0.2420.365−0.177
Bckswp ≤ 0.001p ≤ 0.001p = 0.006
RT Insole.Arch_MaxBcksw−0.562−0.256 −0.468
Bckswp = 0.00p ≤ 0.001 p ≤ 0.001
RT Insole.Hallux/Toes_MaxBcksw −0.1340.225−0.165
Bcksw p = 0.039p ≤ 0.001p = 0.010
RT Insole.Heel_MaxBcksw0.4470.346−0.1300.410
Bckswp ≤ 0.001p ≤ 0.001p = 0.045p ≤ 0.001
RT Insole.Met 1/3/5_MaxBcksw0.1480.411−0.1760.150
Bckswp = 0.022p ≤ 0.001p = 0.006p = 0.020
LT Insole.Total_MaxFrw1 0.511−0.280−0.162
Frw1 p ≤ 0.001p ≤ 0.001p = 0.012
LT Insole.Arch_MaxFrw1−0.3250.472 −0.395
Frw1p ≤ 0.001p ≤ 0.001 p ≤ 0.001
LT Insole.Hallux/Toes_MaxFrw10.1920.530−0.219−0.150
Frw1p = 0.003p ≤ 0.001p = 0.001p = 0.020
LT Insole.Heel_MaxFrw1−0.1810.423 −0.231
Frw1p = 0.005p ≤ 0.001 p ≤ 0.001
LT Insole.Met 1/3/5 (%)_MaxFrw1 0.230−0.209
Frw1 p ≤ 0.001p = 0.001
RT Insole.Total_MaxFrw10.367−0.2510.3290.289
Frw1p ≤ 0.001p ≤ 0.001p ≤ 0.001p ≤ 0.001
RT Insole.Arch_MaxFrw10.309−0.163 0.392
Frw1p ≤ 0.001p = 0.012 p ≤ 0.001
RT Insole.Hallux/Toes_MaxFrw1−0.280
Frw1p ≤ 0.001
RT Insole.Heel_MaxFrw10.486 0.3980.436
Frw1p ≤ 0.001 p ≤ 0.001p ≤ 0.001
RT Insole.Met 1/3/5_MaxFrw10.255−0.2800.2520.316
Frw1p ≤ 0.001p ≤ 0.001p ≤ 0.001p ≤ 0.001
LT Insole.Total_MaxFrw2 −0.323
Frw2 p ≤ 0.001
LT Insole.Arch_MaxFrw2−0.2570.194−0.154−0.244
Frw2p ≤ 0.001p = 0.003p = 0.017p ≤ 0.001
LT Insole.Hallux/Toes_MaxFrw2 0.165−0.404
Frw2 p = 0.010p ≤ 0.001
LT Insole.Heel_MaxFrw20.132 −0.208
Frw2p = 0.040 p = 0.001
LT Insole.Met 1/3/5 (%)_MaxFrw2−0.144 −0.230
Frw2p = 0.026 p ≤ 0.001
RT Insole.Total_MaxFrw20.153−0.3450.4360.136
Frw2p = 0.018p ≤ 0.001p ≤ 0.001p = 0.036
RT Insole.Arch_MaxFrw2 0.1840.219
Frw2 p = 0.004p = 0.001
RT Insole.Hallux/Toes_MaxFrw2 −0.4030.301
Frw2 p ≤ 0.001p ≤ 0.001
RT Insole.Heel_MaxFrw20.238 0.2050.205
Frw2p ≤ 0.001 p = 0.001p = 0.001
RT Insole.Met 1/3/5_MaxFrw2 −0.1980.384
Frw2 p = 0.002p ≤ 0.001
LT Insole.Total_MaxRet−0.207−0.200−0.261−0.133
Retp = 0.001p = 0.002p ≤ 0.001p = 0.040
LT Insole.Arch_MaxRet
Ret
LT Insole.Hallux/Toes_MaxRet 0.129
Ret p = 0.046
LT Insole.Heel_MaxRet−0.155−0.152
Retp = 0.017p = 0.018
LT Insole.Met 1/3/5 (%)_MaxRet
Ret
RT Insole.Total_MaxRet 0.127
Ret p = 0.049
RT Insole.Arch_MaxRet0.1280.2330.162
Retp = 0.048p ≤ 0.001p = 0.012
RT Insole.Hallux/Toes_MaxRet −0.142
Ret p = 0.027
RT Insole.Heel_MaxRet0.2760.3160.4280.196
Retp ≤ 0.001p ≤ 0.001p ≤ 0.001p = 0.002
RT Insole.Met 1/3/5_MaxRet 0.160
Ret p = 0.013
Legend: LT and RT—left and right foot; Total_Max—total maximum pressure; Heel_Max—maximum pressure in the heel; Arch_Max—maximum pressure in the arch; Hallux/Toes_Max—maximum pressure in the hallux and toes; Met 1/3/5_Max—maximum pressure in the metatarsal regions; Met 1/3/5 (%)_Max—percentage contributions of each metatarsal region to total pressure; V—velocity; X, Y, Z—mediolateral, anteroposterior, and vertical; Bcksw—backswing phase; Frw1—stroke phase; Frw2 stroke end phase; Ret—return to ready position phase.
Disclaimer/Publisher’s Note: The statements, opinions and data contained in all publications are solely those of the individual author(s) and contributor(s) and not of MDPI and/or the editor(s). MDPI and/or the editor(s) disclaim responsibility for any injury to people or property resulting from any ideas, methods, instructions or products referred to in the content.