Article

How Teams Score May Matter More than How Often: Play-Type Efficiency, Usage, and Success in the NBA


by
Alberto Borrega-Solano
1,
Pablo Lopez-Sierra
1,2,
Amalia Campos-Redondo
1,2 and
Javier Garcia-Rubio
1,2,*
1
Grupo de Optimización del Entrenamiento y Rendimiento Deportivo (GOERD), Facultad de Ciencias del Deporte, Universidad de Extremadura, 10003 Caceres, Spain
2
Instituto de Investigación e Innovación del Deporte (INIDE), Universidad de Extremadura, 10003 Caceres, Spain
*
Author to whom correspondence should be addressed.
Appl. Sci. 2026, 16(11), 5342; https://doi.org/10.3390/app16115342
Submission received: 28 April 2026 / Revised: 18 May 2026 / Accepted: 21 May 2026 / Published: 26 May 2026

Abstract

The present study examined whether offensive play-type indicators in professional basketball reflect broader latent playing-style dimensions and whether play-type usage or efficiency is more strongly associated with competitive success. Data were obtained from the official NBA statistics website and included 6400 games across five seasons (2019–2020 to 2023–2024), comprising 5979 regular-season games and 421 playoff games. For each offensive play type, two indicators were analysed separately: usage percentage and efficiency, operationalised as points per possession (PPP). Principal component analyses were conducted independently for regular-season and playoff data, and for usage and efficiency variables. In addition, linear mixed-effects models were used to examine the relationship between play-type indicators and competitive success while accounting for games nested within teams. Only regular-season efficiency variables showed adequate sampling adequacy for factorial analysis (KMO = 0.774), yielding a four-component solution that explained 58.85% of the total variance. In the mixed-effects models, usage variables were not significantly associated with success, whereas efficiency indicators showed greater explanatory value. Specifically, pick-and-roll ball handler PPP and spot-up PPP emerged as the strongest positive predictors of success, with smaller effects observed for roll-man PPP and cut PPP. The efficiency-only model improved model fit relative to the frequency-only model (marginal R2 = 0.799 vs. 0.755), whereas adding usage variables to efficiency provided only a negligible additional contribution (marginal R2 = 0.803). These findings suggest that, in the NBA, competitive success is more closely related to the effectiveness with which offensive actions are executed than to the relative frequency with which they are used. From an applied perspective, play-type efficiency appears to provide more actionable information than usage-based summaries for performance analysis and tactical decision-making.

1. Introduction

Performance analysis in basketball has progressively evolved from a predominantly physical and technical perspective toward a broader, more integrative framework incorporating tactical, psychological, and analytical dimensions [1]. In professional settings, this evolution has consolidated performance analysis as a core tool for coaches and technical staff, as it enables the systematic collection of reliable information on games, competitions, teams, and players [2]. Beyond final outcomes, contemporary performance analysis increasingly seeks to characterise the processes through which competitive success is achieved, with the ultimate aim of supporting decision-making under the constraints of limited preparation time, variable opposition, and changing competitive demands [3,4].
Traditionally, basketball research and applied practice have relied heavily on game-related box-score statistics to describe performance and to identify factors associated with winning across competitive contexts [5]. Although these indicators remain valuable for summarising outcomes, they provide a largely static representation of performance and offer limited insight into the tactical structure of offensive possessions and the dynamic interactions that shape decision-making and execution [5,6]. Importantly, basketball performance emerges from continuous interactions between teammates and opponents, where the value of an action depends on the defensive response, spatial occupation, timing, and subsequent decisions [7]. Consequently, box-score metrics are often insufficient for describing how teams generate advantages, how those advantages are sustained or transformed across a possession, and how actions are executed under the constraints of live play.
In response, recent research has emphasised the value of contextual, possession-based approaches that capture the structure of play rather than solely its final products [8,9]. This shift is consistent with contemporary perspectives in performance analysis and ecological approaches to sport behaviour, which conceptualise game performance as an adaptive process shaped by task constraints, opponent behaviour, and the coordination of players within a shared tactical environment [10]. Accordingly, the analytical focus has increasingly moved from isolated event counts to indicators that represent decision-making contexts, action sequences, and the conditions under which scoring opportunities are created and converted [8,11].
Within this line of work, play-type statistics have emerged as a practical method for describing how possessions unfold through individual, dyadic, or collective interactions, and for quantifying both the frequency of use and the efficiency of specific offensive actions (points per possession; PPP) [12]. In contrast to conventional summaries, play-type indicators provide information about how an offence attempts to create scoring opportunities (e.g., via ball screens, isolations, off-ball actions, or transition), allowing tactical tendencies to be described at a level closer to coaching language and game-planning. At the same time, play-type metrics can be interpreted through two complementary lenses: (i) usage, reflecting the distribution of offensive actions and the tactical options prioritised within a team’s repertoire; and (ii) efficiency, reflecting the extent to which those options produce points once selected. Distinguishing between these lenses is critical, as high usage does not necessarily imply effectiveness, and high efficiency may reflect either superior execution or the selective deployment of actions under favourable conditions [13].
The broader importance of tactical information for characterising team dynamics and styles of play has also been demonstrated in other invasion sports such as football [14,15], supporting the premise that tactical profiling can provide information not captured by conventional summary statistics. Translating this rationale to basketball implies that offensive styles may be reflected in coherent patterns across multiple play types rather than in any single action. From an applied perspective, this raises a key methodological question: whether play-type indicators can be reduced to latent dimensions that represent broader playing-style constructs, and whether these constructs differ according to competition phase or contextual constraints [16,17].
Despite the growing use of play-type data, most studies have remained largely descriptive, reporting which actions were most frequent or most effective among successful teams in previous seasons [18]. Moreover, evidence is often based on single-season samples and on specific competitive environments, particularly European leagues, which constrains generalisability across contexts and competitive levels [19]. For example, during the 2018–2019 NBA playoffs, successful teams were characterised by high effectiveness in catch-and-shoot actions, pick-and-roll ball handler plays, transition, and isolation [20]. Nonetheless, the dominant analytical approach has typically focused on retrospective comparisons between winning and losing teams [12,13,19], which is informative for description but provides limited empirical support for prediction-oriented questions that are central to applied decision-making.
In particular, two related issues remain insufficiently addressed. First, relatively few studies have examined, within a predictive framework, whether play-type usage and/or play-type efficiency is more strongly associated with competitive success. This distinction is practically meaningful because usage reflects selection and tactical preference, whereas efficiency reflects execution and outcome quality, and these may not contribute to success in the same manner [21]. Second, it is not yet well established whether these relationships differ between the regular season (RS) and playoffs (PO). The RS and PO differ in contextual characteristics that may alter tactical behaviour and the determinants of success, such as opponent familiarity, the intensity and specificity of scouting, the extent of matchup-driven adjustments, and the reduced tolerance for inefficiency in higher-stakes contexts [13]. Consequently, models that do not distinguish between phases may obscure meaningful differences in how play-type indicators relate to success.
Addressing these questions also requires modelling strategies capable of separating two complementary objectives: (i) identifying underlying performance dimensions, namely whether play-type indicators reflect broader latent constructs consistent with playing styles; and (ii) testing the association of usage and efficiency indicators with competitive success in each context. This dual approach is important because tactical profiling and outcome prediction answer different applied questions: the former describes how teams tend to play, whereas the latter evaluates which indicators are most strongly associated with success under competitive constraints [13].
Therefore, the aim of the present study is twofold: (i) to explore whether offensive play-type indicators can be reduced to broader latent playing-style dimensions from offensive play-type indicators, considering regular-season and playoff contexts separately; and (ii) to examine the extent to which play-type usage and efficiency are associated with competitive success in each context. It will be hypothesised that (a) efficiency indicators will exhibit a more coherent latent structure than usage indicators, and (b) efficiency will show stronger associations with success than usage, with the magnitude and pattern of these associations potentially differing between RS and PO contexts.

2. Materials and Methods

2.1. Sample

Data were collected from the official NBA website (2019–2020 to 2023–2024). Regular season and playoff data were included (Regular Season (RS): 5979 games; playoff (PO) games = 421). The total number of games in the study is 6400 basketball games. As the study used all available NBA observations within the predefined period rather than a prospectively recruited sample, no a priori power analysis was conducted to determine sample size. Instead, statistical precision was evaluated through confidence intervals around fixed-effect estimates and model-level explanatory indices.

2.2. Procedures and Variables

Data were extracted from the official NBA statistics website https://www.nba.com/stats (accessed on 4 June 2025). The data are publicly available and may be used for research and educational purposes. The validity and reliability of these data have been previously established in independent investigations [22,23]. The dataset included the following situational variables: competition phase (Regular Season [RS] or Playoffs [PO]), season (2019–2020 to 2023–2024), number of wins (RS), and final standing (PO).
The primary performance variables analysed were play types, defined as the tactical classification of offensive possessions according to how the possession is executed. For each play type, two indicators were considered: (i) usage percentage (% of total possessions) and (ii) efficiency, operationalized as points per possession (PPP). Operational definitions of all play types are presented in Table 1.

2.3. Statistical Analysis

A principal component analysis (PCA) was conducted to examine the underlying structure of offensive play types. Regular Season (RS) and Playoff (PO) data were analysed separately. In addition, usage (% of total possessions) and efficiency (points per possession; PPP) variables were examined independently. Sampling adequacy was assessed using the Kaiser–Meyer–Olkin (KMO) measure; values ≥ |0.60| considered acceptable. Components were extracted using the Kaiser criterion (eigenvalues > 1), and a Varimax orthogonal rotation was applied to enhance interpretability. Values ≥ |0.60| were considered acceptable.
To investigate the predictive relationship between play-type indicators and competitive success, linear mixed-effects models (LMM) were employed. Given the hierarchical structure of the data (games nested within teams), a random intercept for team was included to account for between-team variability. The competition phase (RS vs. PO) was included as a fixed effect in all models. All continuous predictors were mean-centred within the team prior to analysis.
Three models were estimated: (i) a frequency-only model including play-type usage variables; (ii) an efficiency-only model including PPP variables; and (iii) a combined model incorporating both usage and efficiency indicators. Model fit was evaluated using marginal and conditional R2, likelihood ratio tests (LRT), and intraclass correlation coefficients (ICC). Fixed effects were estimated using restricted maximum likelihood (REML), and statistical significance was determined using Satterthwaite’s approximation for degrees of freedom. The significance level was set at p < 0.05. The assumption of normality of residuals was also assessed as part of the model diagnostics. The analysis indicated a Gaussian (normal) distribution of residuals, supporting the adequacy of the model and suggesting that the normality assumption was satisfactorily met. Therefore, no substantial deviations from residual normality were observed.
Finally, team-level random intercept estimates (empirical Bayes estimates) were extracted and graphically represented with 95% confidence intervals to illustrate franchise-level deviations from the overall fixed-effects prediction.
All analyses were performed using jamovi (Version 2.6) with the GAMLj module, which interfaces with the lme4 package in R (v2.0-1).

3. Results

The Kaiser–Meyer–Olkin (KMO) measure indicated acceptable sampling adequacy only for the Regular Season efficiency variables (KMO = 0.774). In contrast, usage variables in the Regular Season (KMO = 0.221) and both usage (KMO = 0.054) and efficiency (KMO = 0.407) variables in the Playoffs demonstrated inadequate adequacy (KMO < 0.50), precluding reliable factorial interpretation. Therefore, only the Regular Season efficiency model was retained for component extraction. Four components with eigenvalues greater than 1 were identified, explaining 58.85% of the total variance. The first component accounted for 28.02% of the variance, followed by the second (11.67%), third (10.54%), and fourth (8.63%) components (Table 2).
The rotated component matrix is presented in Table 3. Four components with eigenvalues greater than 1 were retained, and factor loadings ≥ |0.60| were considered meaningful for interpretation. The extracted components revealed the following performance profiles:
Based on the rotated component matrix, four performance profiles were identified.
Component 1 grouped high loadings for pick-and-roll ball handler efficiency, spot-up efficiency, and isolation efficiency. This component reflects a perimeter-oriented offensive efficiency dimension characterised by ball-dominant creation and individual scoring actions. These actions share a common reliance on the ability to generate advantages through on-ball decision-making and shot execution.
Component 2 was primarily defined by off-screen efficiency, representing off-ball offensive actions that require coordinated movement and spacing to generate scoring opportunities.
Component 3 was characterised by roll-man efficiency in pick-and-roll situations and miscellaneous plays, suggesting a dimension associated with interior finishing actions and less structured offensive scenarios.
Component 4 was exclusively defined by put-back efficiency, indicating the specific contribution of offensive rebounding and second-chance opportunities as an independent performance dimension.
Overall, these findings indicate that offensive performance in the NBA Regular Season is structured into four distinct dimensions: (i) global offensive efficiency linked to competitive success, (ii) off-ball execution, (iii) interior pick-and-roll and unstructured scoring actions, and (iv) offensive rebounding. This factorial structure provides a multidimensional perspective of technical performance.
To examine the predictive contribution of offensive play-type indicators to competitive success, linear mixed-effects models were estimated. Given the hierarchical structure of the dataset (games nested within teams), a random intercept for team was included to account for between-team variability. Three models were compared: (i) a frequency-only model including usage variables, (ii) an efficiency-only model including points per possession (PPP) variables, and (iii) a combined model incorporating both usage and efficiency indicators. The competition phase (Regular Season vs. Playoffs) was included as a fixed effect in all models. The fixed-effect estimates and model fit indices are presented in Table 4.
In the frequency-only model (Model 1), none of the play-type usage variables significantly predicted wins, although the competition phase showed a strong negative effect (β ≈ −36 to −37, p < 0.001), reflecting structural differences between Regular Season and Playoffs.
In contrast, the efficiency-only model (Model 2) identified significant positive effects for pick-and-roll ball handler efficiency (PRBH PPP; β = 26.73, p < 0.001) and spot-up efficiency (β = 30.34, p < 0.001). Marginal effects were observed for roll-man efficiency (PRRM PPP; p = 0.079) and cut efficiency (p = 0.093).
The combined model (Model 3) showed a similar pattern, with PRBH PPP (β = 30.92, p < 0.001) and spot-up PPP (β = 31.36, p < 0.001) remaining significant predictors. Frequency variables did not reach statistical significance in the combined model. Model fit indices indicated that the efficiency-only and combined models explained more variance than the frequency-only model.
To formally compare the explanatory performance of the three models, model fit indices and likelihood ratio tests were examined. Multicollinearity diagnostics indicated no relevant collinearity issues among the predictor variables. All Variance Inflation Factor (VIF) values were low, ranging from 1.08 to 1.30, well below the commonly accepted threshold of 5, while tolerance values remained high (0.767–0.928). These results suggest a low level of multicollinearity and support the independence of the predictors included in the model. Marginal and conditional R2 values, intraclass correlation coefficients (ICC), and likelihood ratio statistics for nested model comparisons are presented in Table 5.
Model fit indices for the three linear mixed-effects models are presented in Table 4. The frequency-only model explained 75.5% of the variance at the fixed-effects level (marginal R2 = 0.755) and 82.3% when including random effects (conditional R2 = 0.823). Residual diagnostics indicated no substantial departures from normality, with Shapiro–Wilk tests yielding p-values of 0.104, 0.465, and 0.715 for the frequency, efficiency, and combined models, respectively. Residual-versus-fitted diagnostics suggested that the combined model did not show strong evidence of heteroscedasticity, although some heteroscedasticity was observed in the frequency-only and efficiency-only models. Multicollinearity diagnostics showed low VIF values for the efficiency model, whereas frequency-based models showed higher VIFs, consistent with the compositional nature of usage variables. The efficiency-only model improved explanatory capacity (marginal R2 = 0.799; conditional R2 = 0.834), representing an increase of 0.044 in marginal R2 relative to the frequency model.
The combined model yielded a marginal R2 of 0.803 and a conditional R2 of 0.839, reflecting only a modest increase in explanatory power (+0.004) compared to the efficiency-only model. Likelihood ratio tests indicated that all full models significantly improved over their respective nested models (p < 0.001). The efficiency-only model explained 4.4 percentage points more fixed-effect variance than the frequency-only model, whereas adding usage indicators to efficiency increased marginal R2 by only 0.4 percentage points. This indicates that most of the explanatory gain was attributable to efficiency indicators rather than usage indicators.
The intraclass correlation coefficient (ICC) decreased from 0.276 in the frequency model to 0.175 in the efficiency model and 0.183 in the combined model, indicating a reduction in between-team variance when efficiency variables were included.
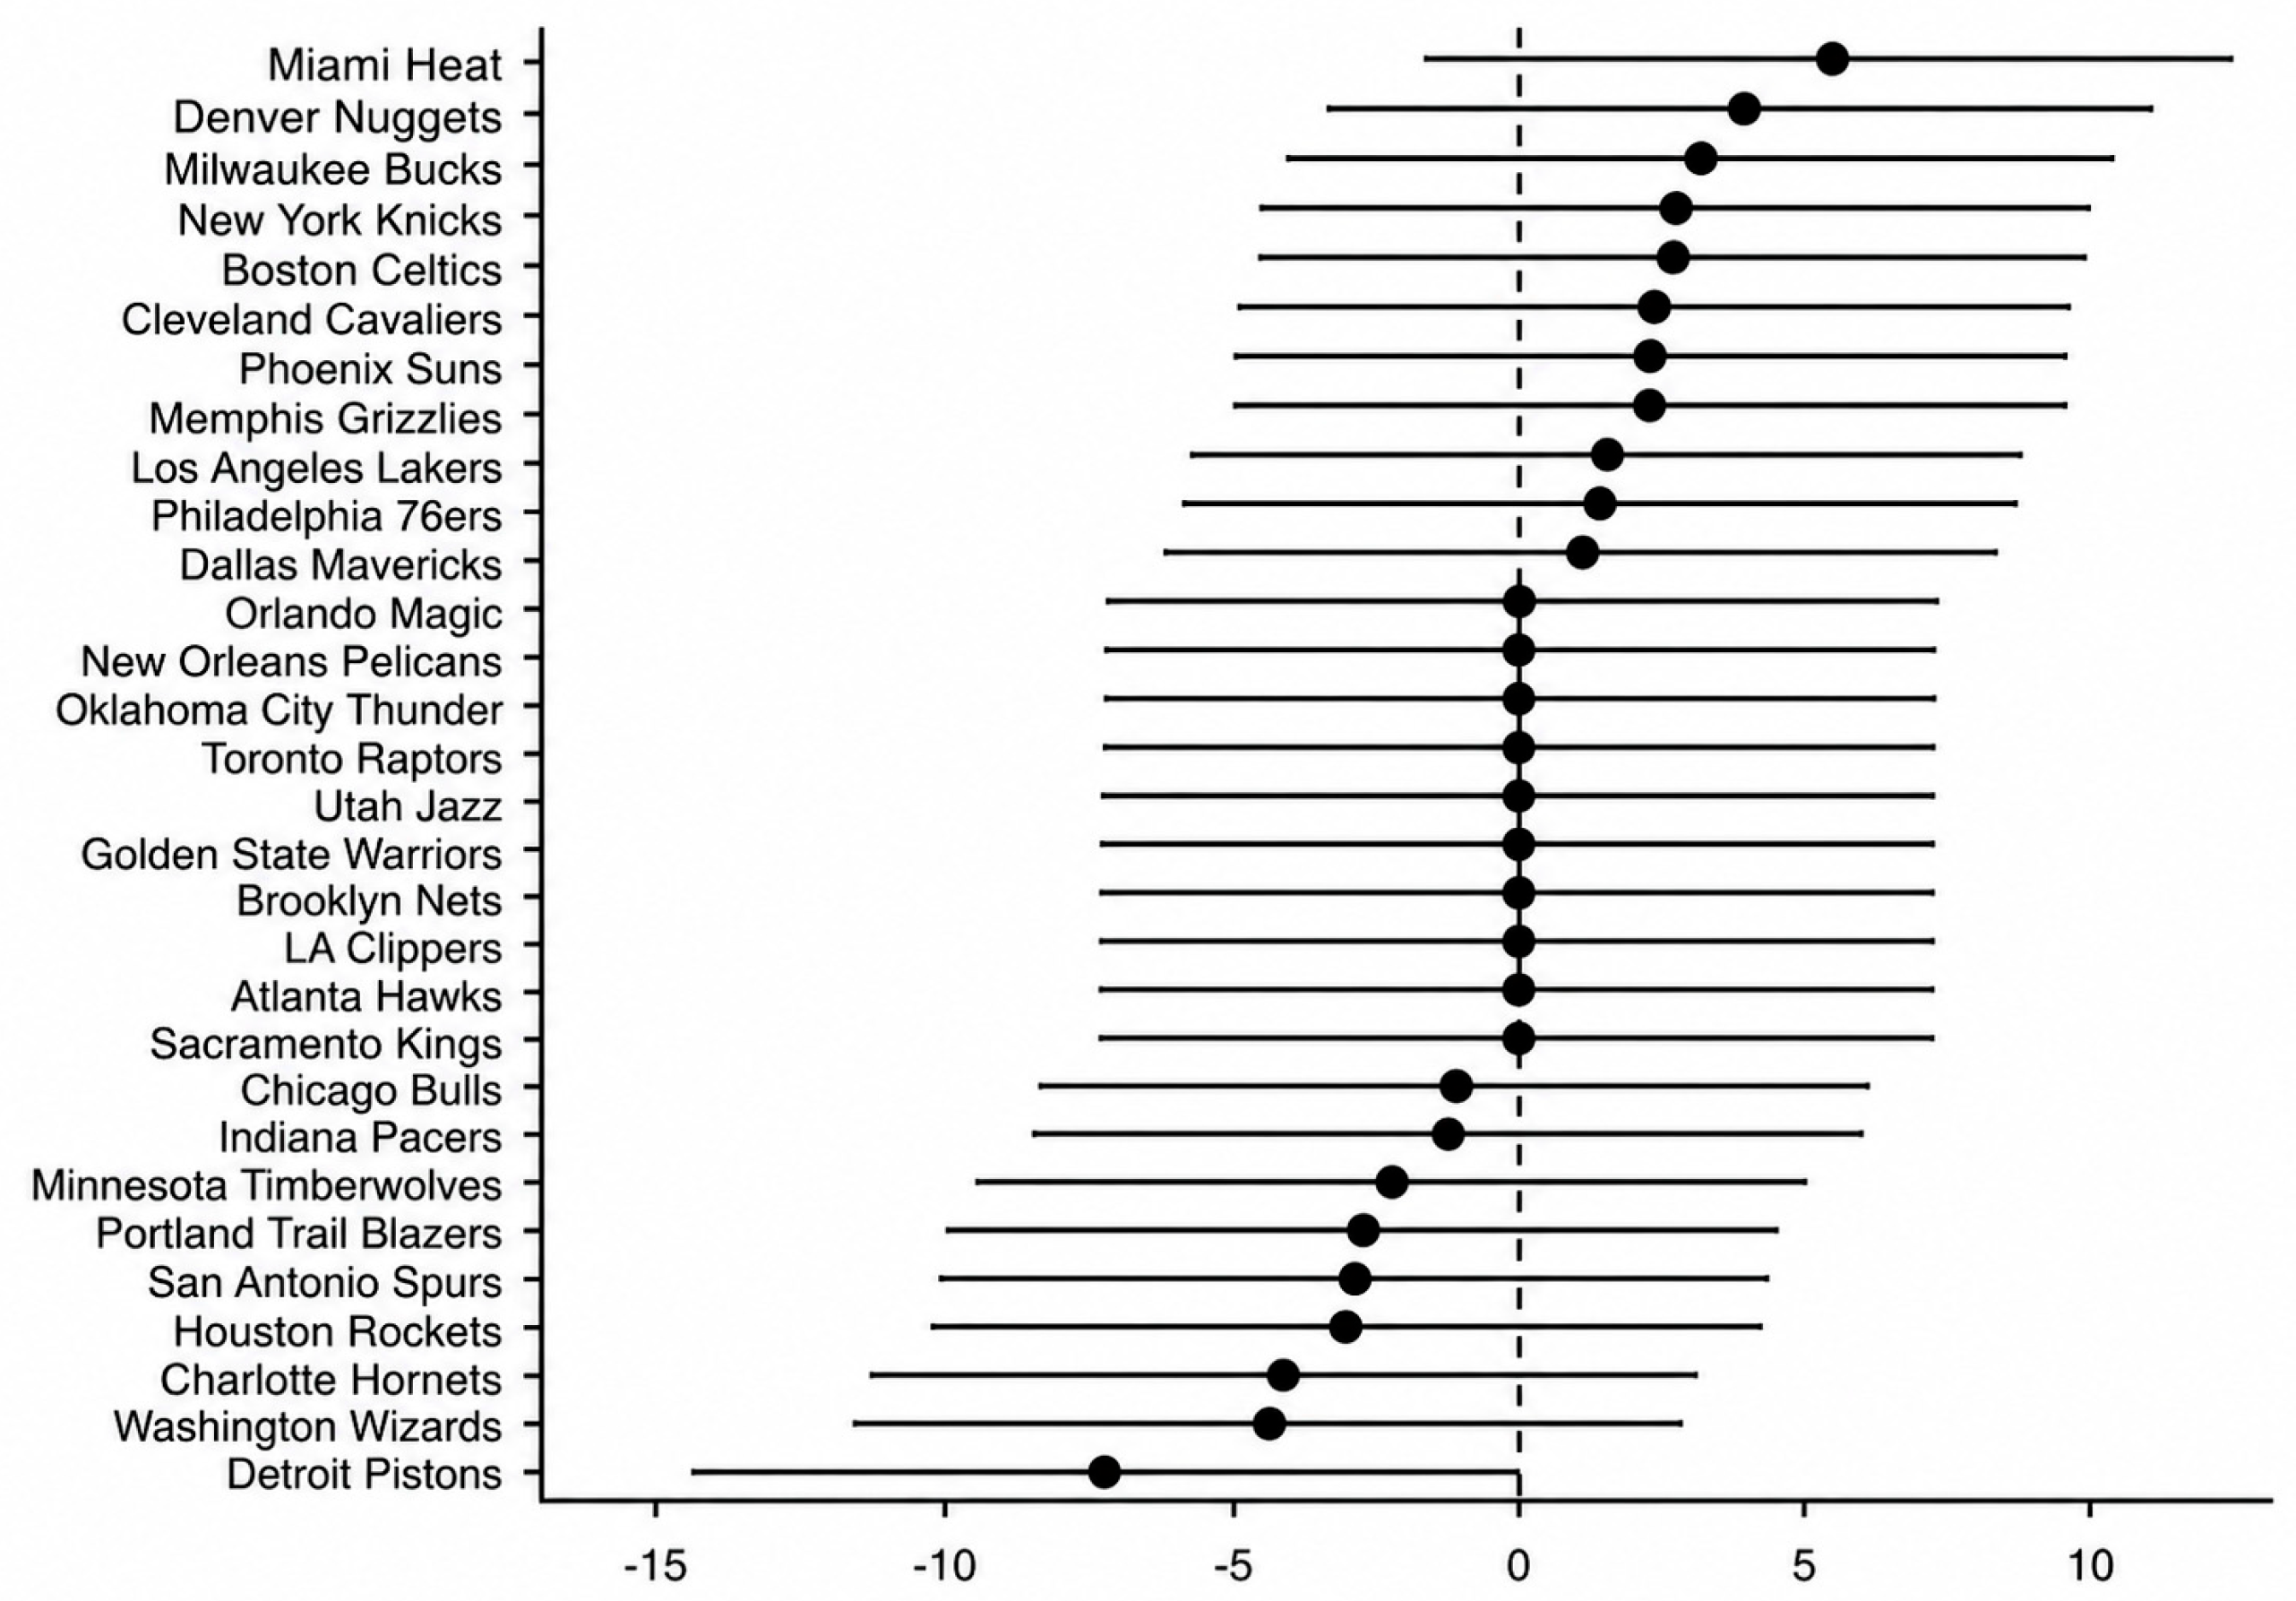
Figure 1 presents the team-specific random intercept estimates derived from the combined linear mixed-effects model. The plot illustrates the deviation of each team from the overall fixed-effects prediction, with 95% confidence intervals. Positive values indicate teams performing above the model-estimated average, whereas negative values reflect below-average deviations.
Each point represents the empirical Bayes estimate for a given team, while horizontal bars indicate 95% confidence intervals. The dashed vertical line at zero corresponds to the overall fixed-effects prediction, such that positive values reflect above-average deviations and negative values reflect below-average deviations relative to the model. Most team-specific confidence intervals overlapped with zero, indicating that, after accounting for the fixed effects included in the model, franchise-level deviations were generally moderate. However, variability across teams remained observable, as reflected in the dispersion of the random intercept estimates.

4. Discussion

The aim of this study was to move beyond descriptive comparisons of play-type profiles by examining (i) whether offensive play-type indicators exhibit an underlying factorial structure and (ii) whether play-type usage or efficiency is associated with competitive success across the regular season (RS) and playoffs (PO). In the dimensionality-reduction stage, an interpretable solution was supported only for RS efficiency, yielding four components that explained 58.85% of the total variance; by contrast, RS usage and both PO matrices showed insufficient sampling adequacy to justify factorial interpretation. In the inferential stage, the mixed-effects models indicated a consistent pattern: usage variables were not associated with success, whereas efficiency metrics were. Specifically, PRBH PPP and spot-up PPP showed robust positive associations, with smaller effects observed for roll-man PPP and cut PPP. Finally, including usage alongside efficiency explained only a negligible amount of additional variance, reinforcing the notion that, within this indicator set and modelling framework, competitive success is more closely related to execution quality than to the relative frequency with which specific play types are employed.
From a modelling perspective, the mixed-effects framework is relevant because it distinguishes between (i) average associations of play-type indicators with success (fixed effects) and (ii) residual between-team heterogeneity not captured by the observed predictors (random effects). The minimal improvement observed when adding usage indicators to efficiency indicators is consistent with the interpretation that, at the team-season level, a substantial proportion of the signal contained in play-type distributions is either redundant with, or mediated through, efficiency outcomes. This pattern is coherent with the premise that efficiency metrics integrate multiple underlying mechanisms (shot quality, shot-making, decision-making, and opponent response), whereas frequency metrics are more directly constrained by opportunity structure and contextual factors [25,26]. Importantly, the conditional nature of the combined model implies that coefficients for frequency should be interpreted as relative reallocations within a compositional system, rather than as isolated “effects” of increasing a single play type in absolute terms [27,28]. Consequently, the inferential value of the combined specification lies less in prescriptive statements about increasing or decreasing particular frequencies, and more in identifying which efficiency domains retain robust associations with success after accounting for concurrent tactical tendencies.
A key implication of these findings is that efficiency-based indicators (PPP) provide greater explanatory value than distribution-based indicators (play-type frequency) when modelling competitive outcomes. This interpretation is consistent with prior work in basketball analytics showing that possession-level scoring efficiency and shooting-related efficiency metrics explain a substantial proportion of between-team variance in success, and that tactical summaries often require contextualisation by possessions and efficiency constraints to support meaningful inference [29,30]. By contrast, play-type frequency primarily reflects tactical preference and opportunity structure, and is simultaneously shaped by roster composition, opponent-specific strategies, score effects, and situational constraints [8]. Under these conditions, frequency metrics may exhibit weaker and less stable associations with season outcomes than efficiency metrics, particularly in professional leagues where teams share a broadly similar repertoire of offensive actions [21].
Within the efficiency domain, pick-and-roll ball handler (PRBH) PPP and spot-up PPP showed the most robust positive associations with success, supporting the importance of on-ball advantage creation and subsequent shot conversion in contemporary NBA offence [13]. The combined model revealed a relevant nuance; PRBH PPP was positively associated with success, whereas PRBH frequency was negatively associated when PRBH PPP and other covariates were held constant. This coefficient pattern should not be presented as a causal recommendation against higher PRBH usage. Rather, because play-type frequencies are compositional, increases in the relative share of one play type necessarily imply reductions in others. Accordingly, the negative coefficient for PRBH frequency is best interpreted as a conditional association indicating that, for a given level of PRBH efficiency, a greater relative dependence on PRBH possessions is associated with lower success. This association may reflect strategic trade-offs, reduced tactical diversity, opponent predictability effects, or contextual confounding related to roster constraints and game state [31,32]. In contrast, Spot-up efficiency was positively associated with success, suggesting that successful teams not only convert spot-up opportunities at higher rates but also generate them more frequently, which is compatible with evidence linking spacing-oriented environments and high-quality catch-and-shoot opportunities to offensive effectiveness [13,33].
The PCA conducted on RS efficiency further indicates that offensive PPP may be represented by partially separable efficiency dimensions during the regular season. The first component, characterised by loadings on PRBH, spot-up, and isolation PPP, is consistent with a perimeter-oriented creation and conversion construct, integrating self-created scoring (isolation), ball-screen-based advantage creation (PRBH), and conversion of created opportunities (spot-up). This structure is compatible with theoretical accounts that emphasise the influence of high-level creation capacity and the surrounding spacing and decision-making environment on team efficiency [34,35]. In the mixed-model analysis, isolation PPP did not retain an independent association with success once other efficiency indicators were included. This may indicate substantial shared variance between isolation efficiency and the broader perimeter creation and spacing processes captured by PRBH and spot-up efficiency. This interpretation should be presented cautiously because multivariable coefficient patterns may also be affected by collinearity and suppression.
The remaining PCA components (off-screen PPP; roll-man and miscellaneous PPP; put-back PPP) are informative in contextualising the indicators that did not emerge as independent predictors in the mixed models. Off-screen efficiency formed a distinct dimension, consistent with coordinated off-ball screening and timing as a separable performance domain, yet it was not associated with success in the present specification. This finding should not be interpreted as evidence that off-ball actions are unimportant. Alternative explanations include higher matchup dependence, lower volume, and greater measurement variability within publicly classified play-type labels, as well as potential mediation through downstream shot outcomes already captured by spot-up efficiency [36,37]. Put-back efficiency also emerged as a standalone dimension, consistent with second-chance scoring, reflecting distinct processes related to rebounding position, timing, and conversion. Its lack of association with success at the team-season level is consistent with frameworks in which primary scoring efficiency is the dominant differentiator of outcomes, whereas rebounding-related contributions may be more context-dependent and pronounced in closely matched settings [38]. Finally, the lack of adequate sampling adequacy for PCA in PO matrices indicates that factorial interpretations should be restricted to RS efficiency. This likely reflects both methodological constraints (reduced sample size and restricted variability in playoffs) and substantive context effects related to greater opponent-specific adaptation and strategic heterogeneity during PO competition [39,40].
The PCA diagnostics also carry substantive implications. Insufficient sampling adequacy for RS usage and for both PO matrices should not be interpreted as evidence that no tactical structure exists; rather, it indicates that the set of observed variables did not exhibit sufficiently strong and consistent shared variance to support stable latent-factor extraction under these conditions. Several non-exclusive explanations may account for this pattern. First, play-type usage may be driven by context-specific constraints (lineup composition, opponent schemes, score effects), resulting in covariance structures that vary across teams and seasons and therefore do not aggregate into a coherent factor solution [8,41]. Second, playoff competition may amplify opponent-specific adaptation and matchup-driven tactical divergence, which can reduce the stability of inter-variable relationships and limit factorial recoverability even when meaningful tactical patterns exist at a finer scale [12,29]. Third, reduced variability and smaller effective samples in PO contexts can degrade factor extraction and contribute to low adequacy indices [5]. Taken together, these results suggest that latent style constructs may be more readily detectable in efficiency indicators during the RS, whereas usage-based styles and PO structures may require alternative operationalisations to be identified with adequate psychometric support.
This study has several strengths, including the use of multiple NBA seasons and play-type indicators obtained from an official league source, and the integration of dimensionality reduction with mixed-effects modelling to evaluate the relative contribution of usage and efficiency within a unified framework. Nevertheless, limitations should be acknowledged. The observational design is susceptible to confounding, as play-type PPP is likely influenced by roster quality, opponent strength, injuries, coaching strategies, and defensive context, none of which were explicitly modelled. Future research should extend the present approach by incorporating defensive mechanisms and interaction effects, particularly in playoff contexts, using opponent-adjusted indicators, lineup-level information, and defensive constraints to enhance explanatory and applied relevance.

5. Conclusions

This study showed that offensive play-type efficiency is more informative than play-type frequency when examining its association with competitive success in the NBA. Evidence for latent play-type structures was limited to regular-season efficiency indicators. The usage matrices and playoff matrices did not show sufficient sampling adequacy and should not be interpreted as reflecting stable latent playing-style dimensions. Across regular-season and playoff contexts, teams were not more successful simply because they used particular offensive actions more often; rather, success was more strongly associated with how efficiently those actions were executed. In particular, pick-and-roll ball handler efficiency and spot-up efficiency emerged as the most robust positive indicators of success, while adding usage information to efficiency provided only minimal additional explanatory value. Moreover, only regular-season efficiency variables showed a sufficiently stable latent structure, suggesting that broad tactical profiles are more detectable in execution quality than in action distribution, especially outside the more variable playoff context.
From a practical standpoint, these findings suggest that coaches and performance staff should prioritise the monitoring and training of play-type efficiency over simple play-type frequency counts. For applied decision-making, it may be more useful to ask how well a team executes pick-and-roll ball handler and spot-up situations than how often those actions appear. This means that scouting and internal performance reviews should focus less on reproducing the play-type distribution of successful teams and more on identifying the technical, tactical, and contextual factors that improve efficiency within each offensive action. In this sense, performance analysis can better support coaching practice when play-type data are used not merely to describe offensive preferences, but to guide training design, player-role optimisation, and game planning around the actions that generate points most effectively.

Author Contributions

Conceptualization, P.L.-S. and J.G.-R.; methodology, P.L.-S. and J.G.-R.; software, P.L.-S., A.C.-R. and J.G.-R.; validation, A.B.-S.; formal analysis, P.L.-S. and J.G.-R.; investigation, A.B.-S. and J.G.-R.; resources, P.L.-S., A.C.-R. and J.G.-R.; data curation, J.G.-R.; writing—original draft preparation, A.B.-S., P.L.-S. and J.G.-R.; writing—review and editing, P.L.-S. and A.C.-R.; visualization, A.C.-R.; supervision, J.G.-R.; funding acquisition, P.L.-S., A.C.-R. and J.G.-R. All authors have read and agreed to the published version of the manuscript.

Funding

This research was partially funded by the Research Group Support Grant (GR24133). It was co-funded at 85% by the European Union through the European Regional Development Funds (ERDF), and by the Regional Government of Extremadura (Department of Education, Science, and Vocational Training). The Managing Authority is the Ministry of Finance of Spain. The author Amalia Campos-Redondo was supported with a grant by the Valhondo Calaff Foundation (Caceres, Spain). The author Pablo López-Sierra is a grantee of the “Formación de Profesorado Universitario 2023” of the Ministry of Sci-ence, Innovation and Universities, code FPU23/02997.

Institutional Review Board Statement

Not applicable.

Informed Consent Statement

Not applicable.

Data Availability Statement

The data used in this study are publicly available from the official NBA statistics website https://www.nba.com/stats (accessed on 31 March 2025). Processed datasets and analysis scripts can be obtained from the corresponding author upon reasonable request.

Conflicts of Interest

The authors declare no conflicts of interest.

References

  1. Sarlis, V.; Tjortjis, C. Sports analytics—Evaluation of basketball players and team performance. Inf. Syst. 2020, 93, 101562. [Google Scholar] [CrossRef] [Scilit]
  2. Lorenzo, J.; Lorenzo, A.; Conte, D.; Giménez, M. Long-Term Analysis of Elite Basketball Players’ Game-Related Statistics Throughout Their Careers. Front. Psychol. 2019, 10, 421. [Google Scholar] [CrossRef] [Scilit]
  3. Vilar, L.; Araújo, D.; Davids, K.; Button, C. The Role of Ecological Dynamics in Analysing Performance in Team Sports. Sports Med. 2012, 42, 1–10. [Google Scholar] [CrossRef] [Scilit]
  4. Lorains, M.; Ball, K.; MacMahon, C. Performance analysis for decision making in team sports. Int. J. Perform. Anal. Sport 2013, 13, 110–119. [Google Scholar] [CrossRef] [Scilit]
  5. García-Rubio, J.; Ibáñez, S.J.; De Santos, R.M.; Leite, N.; Sampaio, J. Identifying Basketball Performance Indicators in Regular Season and Playoff Games. J. Hum. Kinet. 2013, 36, 161–168. [Google Scholar] [CrossRef] [Scilit]
  6. Christmann, J.; Akamphuber, M.; Müllenbach, A.L.; Güllich, A. Crunch time in the NBA—The effectiveness of different play types in the endgame of close matches in professional basketball. Int. J. Sports Sci. Coach. 2018, 13, 1090–1099. [Google Scholar] [CrossRef] [Scilit]
  7. Lamas, L.; Santana, F.; Heiner, M.; Ugrinowitsch, C.; Fellingham, G. Modeling the Offensive-Defensive Interaction and Resulting Outcomes in Basketball. PLoS ONE 2015, 10, e0144435. [Google Scholar] [CrossRef] [Scilit]
  8. Dong, R.; Chen, R.B.; Zhang, S.L.; Sansone, P.; Mateus, N.; Liu, H.Y. Beyond the box score: Clustering offensive play types to reveal game styles in professional basketball. J. Sports Sci. 2026, 44, 357–371. [Google Scholar] [CrossRef] [Scilit] [PubMed]
  9. Vázquez-Estévez, C.; Prieto-Lage, I.; Reguera-López-de-la-Osa, X.; Gutiérrez-Santiago, J.A.; Toledo-González, M.; Gutiérrez-Santiago, A. Offensive Patterns and Performance Analysis in One-Possession Scenarios During the Last Minute and Overtime in the EuroLeague. Appl. Sci. 2025, 15, 1928. [Google Scholar] [CrossRef] [Scilit]
  10. de Souza, W.J.F.; Clemente, F.M.; Goulart, K.N.D.; Costa, G.D.T.; Cunha, P.E.S.; Figueiredo, L.S.; Laporta, L.I.; Reverdito, R.S.; Leonardi, T.J.; Castro, H.D. Tactical and Technical Performance in Basketball Small-Sided Games: A Systematic Review. Retos-Nuevas Tend. Educ. Fis. Deporte Recreacion 2024, 56, 554–566. [Google Scholar]
  11. Jutamulia, I.; Hosoi, A.E. Leveraging expected action value to measure on-court decision-making skills in basketball. J. Sports Anal. 2025, 11, 22150218251325018. [Google Scholar] [CrossRef] [Scilit]
  12. Akinci, Y. Examining the Differences Between Playoff Teams and Non-Playoff Teams in Men’s Euroleague; Play-Type Statistics Perspective. Sage Open 2023, 13, 21582440231220155. [Google Scholar] [CrossRef] [Scilit]
  13. García-Rubio, J.; Martínez-Sánchez, A.; Lopez-Sierra, P.; Campos-Redondo, A. Inside the Playbook: Tactical Signatures of Winning Teams in the NBA. Appl. Sci. 2025, 15, 13121. [Google Scholar] [CrossRef] [Scilit]
  14. Rein, R.; Memmert, D. Big data and tactical analysis in elite soccer: Future challenges and opportunities for sports science. SpringerPlus 2016, 5, 1410. [Google Scholar] [CrossRef] [Scilit]
  15. Peng, W.K.; Ribeiro, J.; Wang, M.J.; Gómez-Ruano, M.A. Evolution of playing styles in UEFA European championships: Trends from 2012 to 2024. Int. J. Perform. Anal. Sport 2025, 1–16. [Google Scholar] [CrossRef] [Scilit]
  16. Plakias, S.; Moustakidis, S.; Kokkotis, C.; Papalexi, M.; Tsatalas, T.; Giakas, G.; Tsaopoulos, D. Identifying Soccer Players’ Playing Styles: A Systematic Review. J. Funct. Morphol. Kinesiol. 2023, 8, 104. [Google Scholar] [CrossRef] [Scilit]
  17. Fernandez-Navarro, J.; Fradua, L.; Zubillaga, A.; McRobert, A.P. Influence of contextual variables on styles of play in soccer. Int. J. Perform. Anal. Sport 2018, 18, 423–436. [Google Scholar] [CrossRef] [Scilit]
  18. Selmanovic, A.; Skegro, D.; Milanovic, D. Basic characteristics of offensive modalities in the Euroleague and the NBA. Acta Kinesiol. 2015, 9, 83–87. [Google Scholar]
  19. Pérez-Chao, E.A.; Portes, R.; Ribas, C.; Lorenzo, A.; Leicht, A.S.; Gómez, M.A. Impact of Spectators, League and Team Ability on Home Advantage in Professional European Basketball. Percept. Mot. Ski. 2024, 131, 177–191. [Google Scholar] [CrossRef] [Scilit]
  20. Demenius, J. Offensive Modalities and Their Influence on Basketball Efficiency Between Winning and Losing Teams. Master’s Thesis, Lithuanian Sports University, Kaunas, Lithuania, 2020. [Google Scholar]
  21. Pérez-Chao, E.A.; Salazar, H.; Bustamante, A.; Sansone, P.; Lorenzo, A. Identifying winning strategies: Analysis of play-types in professional European basketball leagues. Int. J. Perform. Anal. Sport 2025, 25, 1047–1058. [Google Scholar] [CrossRef] [Scilit]
  22. Zhang, S.L.; Lorenzo, A.; Gómez, M.A.; Liu, H.Y.; Gonçalves, B.; Sampaio, J. Players’ technical and physical performance profiles and game-to-game variation in NBA. Int. J. Perform. Anal. Sport 2017, 17, 466–483. [Google Scholar] [CrossRef] [Scilit]
  23. Zhang, S.L.; Lorenzo, A.; Gómez, M.A.; Mateus, N.; Gonçalves, B.; Sampaio, J. Clustering performances in the NBA according to players’ anthropometric attributes and playing experience. J. Sports Sci. 2018, 36, 2511–2520. [Google Scholar] [CrossRef] [Scilit]
  24. Matulaitis, K.; Bietkis, T. Prediction of Offensive Possession Ends in Elite Basketball Teams. Int. J. Environ. Res. Public Health 2021, 18, 1083. [Google Scholar] [CrossRef] [Scilit]
  25. Casals, M.; Martinez, J.A. Modelling player performance in basketball through mixed models. Int. J. Perform. Anal. Sport 2013, 13, 64–82. [Google Scholar] [CrossRef] [Scilit]
  26. Ulas, E. Examination of National Basketball Association (NBA) team values based on dynamic linear mixed models. PLoS ONE 2021, 16, e0253179. [Google Scholar] [CrossRef] [Scilit] [PubMed]
  27. Aitchison, J. The Statistical-Analysis of Compositional Data. J. R. Stat. Soc. Ser. B-Stat. Methodol. 1982, 44, 139–177. [Google Scholar] [CrossRef] [Scilit]
  28. PawlowskyGlahn, V.; Egozcue, J.J.; TolosanaDelgado, R. Modeling and Analysis of Compositional Data. In Modeling and Analysis of Compositional Data; Statistics in Practice; John Wiley & Sons, Ltd.: Hoboken, NJ, USA, 2015; pp. 1–247. [Google Scholar]
  29. Cabarkapa, D.; Deane, M.A.; Fry, A.C.; Jones, G.T.; Cabarkapa, D.V.; Philipp, N.M.; Yu, D. Game statistics that discriminate winning and losing at the NBA level of basketball competition. PLoS ONE 2022, 17, e0273427. [Google Scholar] [CrossRef] [Scilit] [PubMed]
  30. Mandic, R.; Jakovljevic, S.; Erculj, F.; Strumbelj, E. Trends in NBA and Euroleague basketball: Analysis and comparison of statistical data from 2000 to 2017. PLoS ONE 2019, 14, e0223524. [Google Scholar] [CrossRef] [Scilit]
  31. Dimitris-Angelou, S.; Stavropoulos, N.; Christos-Galazoulas, V.M. Effectiveness of the Pick and Roll Offense at the 2017 European U’20 Championship. Eur. J. Phys. Educ. Sport Sci. 2022, 8, 131–142. [Google Scholar] [CrossRef] [Scilit]
  32. Angelou, S.D.; Stavropoulos, N.; Manou, V.; Galazoulas, C. Factors affecting the effectiveness of the pick and roll offense at the 2017 European Men’s Championship. Exerc. Qual. Life 2021, 13, 23–30. [Google Scholar] [CrossRef] [Scilit]
  33. Zukolo, Z.; Dizdar, D.; Selmanović, A.; Vidranski, T. The role of Finishing Actions in the Final Result of the Basketball Match. Sport Sci. 2019, 12, 90–95. [Google Scholar]
  34. Foteinakis, P.F.; Pavlidou, S.P. A Decade of Evolution: Comparative Analysis of Shooting Trends and Offensive Efficiency in the NBA and EuroLeague. Montenegrin J. Sports Sci. Med. 2025, 14, 13–19. [Google Scholar] [CrossRef] [Scilit]
  35. Bazanov, B.; Võhandu, P.; Haljand, R. Trends in Offensive Team Activity in Basketball. Balt. J. Sport Health Sci. 2006, 2, 5–11. [Google Scholar] [CrossRef] [Scilit]
  36. Stavropoulos, N.; Papadopoulou, A.; Kolias, P. Evaluating the Efficiency of Off-Ball Screens in Elite Basketball Teams via Second-Order Markov Modelling. Mathematics 2021, 9, 1991. [Google Scholar] [CrossRef] [Scilit]
  37. Foteinakis, P.; Pavlidou, S.; Stavropoulos, N. Analysis of the effectiveness of different play types in the end of game possessions of close EuroLeague matches. J. Hum. Sport Exerc. 2024, 19, 617–630. [Google Scholar] [CrossRef] [Scilit]
  38. Leicht, A.S.; Gomez, M.A.; Woods, C.T. Team Performance Indicators Explain Outcome during Women’s Basketball Matches at the Olympic Games. Sports 2017, 5, 96. [Google Scholar] [CrossRef] [Scilit]
  39. Rojas-Valverde, D.; Pino-Ortega, J.; Gómez-Carmona, C.D.; Rico-González, M. A Systematic Review of Methods and Criteria Standard Proposal for the Use of Principal Component Analysis in Team’s Sports Science. Int. J. Environ. Res. Public Health 2020, 17, 8712. [Google Scholar] [CrossRef] [Scilit] [PubMed]
  40. Weaving, D.; Beggs, C.; Dalton-Barron, N.; Jones, B.; Abt, G. Visualizing the Complexity of the Athlete-Monitoring Cycle Through Principal-Component Analysis. Int. J. Sports Physiol. Perform. 2019, 14, 1304–1310. [Google Scholar] [CrossRef] [Scilit] [PubMed]
  41. Huyghe, T.; Alcaraz, P.E.; Calleja-González, J.; Bird, S.P. The underpinning factors of NBA game-play performance: A systematic review (2001–2020). Physician Sportsmed. 2022, 50, 94–122. [Google Scholar] [CrossRef] [Scilit]
Figure 1. Team-specific random intercept estimates (wins).
Applsci 16 05342 g001
Table 1. Description of play types.
Play TypeOperational Definition (Scientific Writing Style)
IsolationOffensive possession characterised by an intentional one-on-one situation in which the ball handler attempts to generate a scoring opportunity without the immediate use of collaborative tactical actions to create an advantage.
TransitionOffensive phase initiated immediately after a change in possession, with the objective of completing a scoring attempt before the opposing defence achieves full spatial and tactical organisation. Typically associated with increased tempo, direct progression toward the basket, and reduced structured play.
Pick and Roll—Ball HandlerOn-ball screening action in which the ball handler uses a screen to create separation from the primary defender. The subsequent decision (drive, pass, or shot) is considered part of the same tactical action.
Pick and Roll—Roll ManOffensive role assumed by the screener in pick-and-roll situations, involving movement toward the basket (roll) or away from the basket (pop) after screen contact to exploit defensive rotations, mismatches, or spatial advantages.
Post-UpOffensive action in which a player establishes position near the basket, typically receiving the ball with their back to the rim, aiming to generate a scoring opportunity through positional advantage or defensive collapse.
Spot-UpCatch-and-shoot action executed immediately after pass reception while positioned in a stationary or minimally mobile state, typically in spatially optimised areas created by offensive spacing.
Hand-OffDynamic offensive interaction involving the direct transfer of ball possession to a teammate in motion, often functioning as a moving screen and potentially generating defensive misalignment or switching situations.
CutPurposeful off-ball movement toward the basket or open space to receive a pass under advantageous scoring conditions, including linear, backdoor, and screen-assisted cuts.
Off-ScreenOffensive action in which a player uses one or multiple off-ball screens to create separation from defenders and receive the ball in a tactically advantageous position.
Put-backImmediate shot attempt following an offensive rebound, typically occurring during transient defensive disorganisation.
MiscellaneousResidual category including offensive possessions that cannot be reliably classified within predefined play types, such as disorganised possessions or forced attempts under defensive pressure.
Adapted from Matulaitis and Bietkis [24] and García-Rubio et al. [13].
Table 2. Eigenvalues and Total Variance Explained for Regular Season Efficiency Variables.
ComponentInitial EigenvaluesExtraction Sums of SquaredRotation Sums of Squared Loadings
TotalPercentage of
Variance (%)
Cumulative
(%)
TotalPercentage of
Variance (%)
Cumulative
(%)
TotalPercentage of
Variance (%)
Cumulative
(%)
13.3628.0228.023.3628.0228.022.9424.5224.52
21.4011.6739.691.4011.6739.691.4712.2536.77
31.2610.5450.231.2610.5450.231.4411.9848.75
41.048.6358.851.048.6358.851.2110.1158.85
50.887.3066.16
60.847.0173.17
70.736.0879.25
80.615.0684.31
90.584.8489.15
100.514.2893.43
110.433.5596.98
120.363.02100.00
Bartlett’s test of sphericity was statistically significant (χ2 = 342.877, df = 66, p < 0.001), indicating that the correlation matrix was not an identity matrix and was therefore suitable for factor analysis. Together with the acceptable KMO value (KMO = 0.774), these results supported the extraction of components for the Regular Season efficiency variables.
Table 3. Rotated component matrix for the technical performance indicators.
VariableComponent 1Component 2Component 3Component 4
PRBH ppp0.789
SPOTUP ppp0.724
ISO ppp0.659
TRAN ppp
OFFSCREEN ppp 0.637
CUT ppp
HANDOFF ppp
POSTUP ppp
PRRM ppp 0.733
MISC ppp 0.726
PUTBACK ppp 0.901
Table 4. Linear Mixed Models results.
PredictorModel 1 (Freq)
Estimate (SE)
Model 2 (PPP)
Estimate (SE)
Model 3 (Freq—PPP)
Freq Estimate (SE)/PPP Estimate (SE)
Intercept20.714 (1.116) ***21.361 (0.872) ***21.468 (0.887) ***
Phase (PO vs. RS)−36.957 (1.428) ***−34.175 (1.291) ***−33.521 (1.524) ***
Isolation0.382 (0.572)8.014 (5.508)0.157 (0.540)/5.887 (5.635)
Transition0.394 (0.638)7.376 (7.015)0.687 (0.596)/6.946 (7.309)
PRBH−0.266 (0.577)26.732 (7.538) ***−0.279 (0.533)/30.922 (8.020) ***
PRRM0.126 (0.843)8.216 (4.654) †0.226 (0.791)/8.285 (4.699) †
Post-up0.121 (0.568)7.168 (4.437)0.271 (0.540)/5.091 (4.706)
Spot-up−0.419 (0.587)30.336 (7.488) ***0.140 (0.555)/31.363 (7.805) ***
Hand-off−0.476 (0.684)−2.316 (4.361)−0.185 (0.635)/−1.316 (4.538)
Cut−0.147 (0.812)10.049 (5.955) †−0.155 (0.767)/10.929 (6.018) †
Off-screen0.134 (0.763)−0.917 (4.025)0.923 (0.709)/−0.511 (4.451)
Put-back−1.137 (0.885)−0.889 (5.314)0.352 (0.872)/−0.649 (5.417)
Misc−1.160 (1.107)5.949 (5.515)−1.008 (1.058)/6.537 (5.642)
Note:p < 0.10, * p < 0.05, ** p < 0.01, *** p < 0.001.
Table 5. Model Fit Indices and Comparison of Linear Mixed-Effects Models.
MetricModel 1 (Frequency)Model 2 (PPP)Model 3 (Combined)
Marginal R20.7550.7990.803
Conditional R20.8230.8340.839
Δ Marginal R2+0.044+0.004
Model LRT (χ2)344.239 ***384.711 ***398.654 ***
ΔR2 Comparison χ2349.466 ***442.365 ***459.935 ***
ICC0.2760.1750.183
Random intercept variance26.40013.00013.500
Note:p < 0.10, * p < 0.05, ** p < 0.01, *** p < 0.001.
Disclaimer/Publisher’s Note: The statements, opinions and data contained in all publications are solely those of the individual author(s) and contributor(s) and not of MDPI and/or the editor(s). MDPI and/or the editor(s) disclaim responsibility for any injury to people or property resulting from any ideas, methods, instructions or products referred to in the content.