Article

Early-Stage Prediction of DC2 Tower Dynamic Behaviour Using Real-Time 3D Monitoring Coupled with OMA-Based Digital Twin

by
Luz Elizabeth Vasquez Munoz
1,
Herbert Wolfgang Müllner
2 and
Michael Reiterer
3,*
1
REVOTEC zt gmbh, 1030 Vienna, Austria
2
Technology Management & Innovation, PORR Bau GmbH, 1100 Vienna, Austria
3
Research Unit of Mechanics and Structural Dynamics, Institute of Structural Engineering, Faculty of Civil and Environmental Engineering, Technology University of Vienna, 1040 Vienna, Austria
*
Author to whom correspondence should be addressed.
Appl. Sci. 2026, 16(10), 5139; https://doi.org/10.3390/app16105139
Submission received: 4 May 2026 / Revised: 19 May 2026 / Accepted: 20 May 2026 / Published: 21 May 2026

Abstract

Structural vibrations caused by dynamic wind action are critical for high-rise buildings such as the DC2 Tower due to the potential for occupant discomfort. To ensure that the top acceleration remained below the required 1.5% g comfort limit, the tower’s stiffness was assessed through actual modal parameters—natural frequencies, mode shapes, and damping ratios—obtained through an innovative framework combining real-time 3D monitoring with a real-time digital twin model during construction. The digital twin was based on operational modal analysis (OMA) and continuously updated, allowing comparisons between measured parameters and static design-based values at different construction stages. When the first quarter of the tower was completed, it was already possible to observe that the vibration modes corresponded in shape to those estimated in the static design. However, the natural frequencies and damping ratios were higher than initially estimated, confirming greater stiffness. Consequently, the static design model was tuned early to match the measured frequencies obtained from the digital twin model, enabling accurate prediction of the final-state response. This prediction confirmed compliance with comfort criteria, eliminating the need for a tuned mass damper for vibration control. The prognosis was verified by the natural frequencies measured in the final state of the DC2 Tower.

1. Introduction

Recently, digital twin technology has proved to be a powerful tool for structural analysis, accurately representing real entities by linking their physical form with a digital model [1]. Although its development history in the construction industry is relatively short, its application has already shown promise, particularly in the field of structural health monitoring [2,3,4,5,6,7,8,9,10,11,12,13]. Real-time monitoring of structural performance provides decision-makers and building owners with a comprehensive overview to assess structural reliability [2,3,4]. Real-time monitoring allows us to know the actual condition of the structure, by building its digital twin model (e.g., FEM model updating [5,6,7,14] and AI-Driven Structural Health Monitoring [15]). Structural health monitoring has also been shown to play an important role during the construction phase of structures, allowing the identification of the dynamic modal parameters throughout the construction process [16].
In the field of structural dynamics, the actual modal parameters of a structure (i.e., mode shapes, natural frequencies and damping ratios) can be directly obtained from the real-time monitoring via OMA [17,18,19,20,21]. Artemis (v. 8.0.2.2) [20] is a software able to perform OMA, based on the monitoring data and by using a 3D digital twin model, which is not a FEM model.
However, when safe and economical decisions must be made at early stages of a project (e.g., during construction), it is necessary to accurately predict the actual performance of the structure in its final state to face the challenge of capturing structural performance before its construction ends. This was the case for the DC2 Tower in Vienna, the second-highest skyscraper in Austria, whose construction was commissioned to PORR Bau GmbH. To mitigate the tower’s forced vibrations induced by wind action, the installation of a passive tuned mass damper (TMD) in the DC2 Tower was an open discussion at the design stage, and the final decision had to be made as early as possible to provide the necessary space on the top floor. To address this, PORR Bau GmbH designed a research project aimed at predicting the tower’s dynamic performance early in the construction stage and bridging the gap between the design estimates and the actual modal parameters of the tower [22,23].
In collaboration with REVOTEC zt gmbh, a framework was developed for the prediction of the actual natural frequencies of the DC2 Tower in its final state (i.e., at full height), based on the monitoring data recorded when the tower was only at one-quarter of its construction height. The results obtained from the digital twin model in Artemis [20] allowed the design and wind engineers to calibrate the FEM model at quarter height [5,6,7] and to extend it to predict the tower’s vibration frequencies in its final state, as well as the top horizontal accelerations used as a demand parameter for comfort criteria. This facilitated timely decision-making regarding the installation of a passive TMD.
Given that this was the first application of the developed framework, the prognosis made at an early stage of construction (i.e., at quarter height) was checked via OMA throughout the construction process solely for safety purposes but was never updated. The prediction made at an early stage of construction aligned very well with the data recorded upon completion of the tower.
This paper presents the framework developed within the research project. Section 2 provides an overview of the DC2 Tower and describes the design stage issue that prompted the study. Section 3 introduces the framework developed for an early prognosis of the tower’s actual natural frequencies. Section 3.1 details the real-time monitoring of the DC2 Tower, Section 3.2 describes the digital twin model used for OMA, and Section 3.3 outlines the prognosis methodology. The results are presented in Section 4 and discussed in Section 5, while the findings and conclusions are summarized in Section 6.

2. DC2 Tower: Design Results and Problem Description

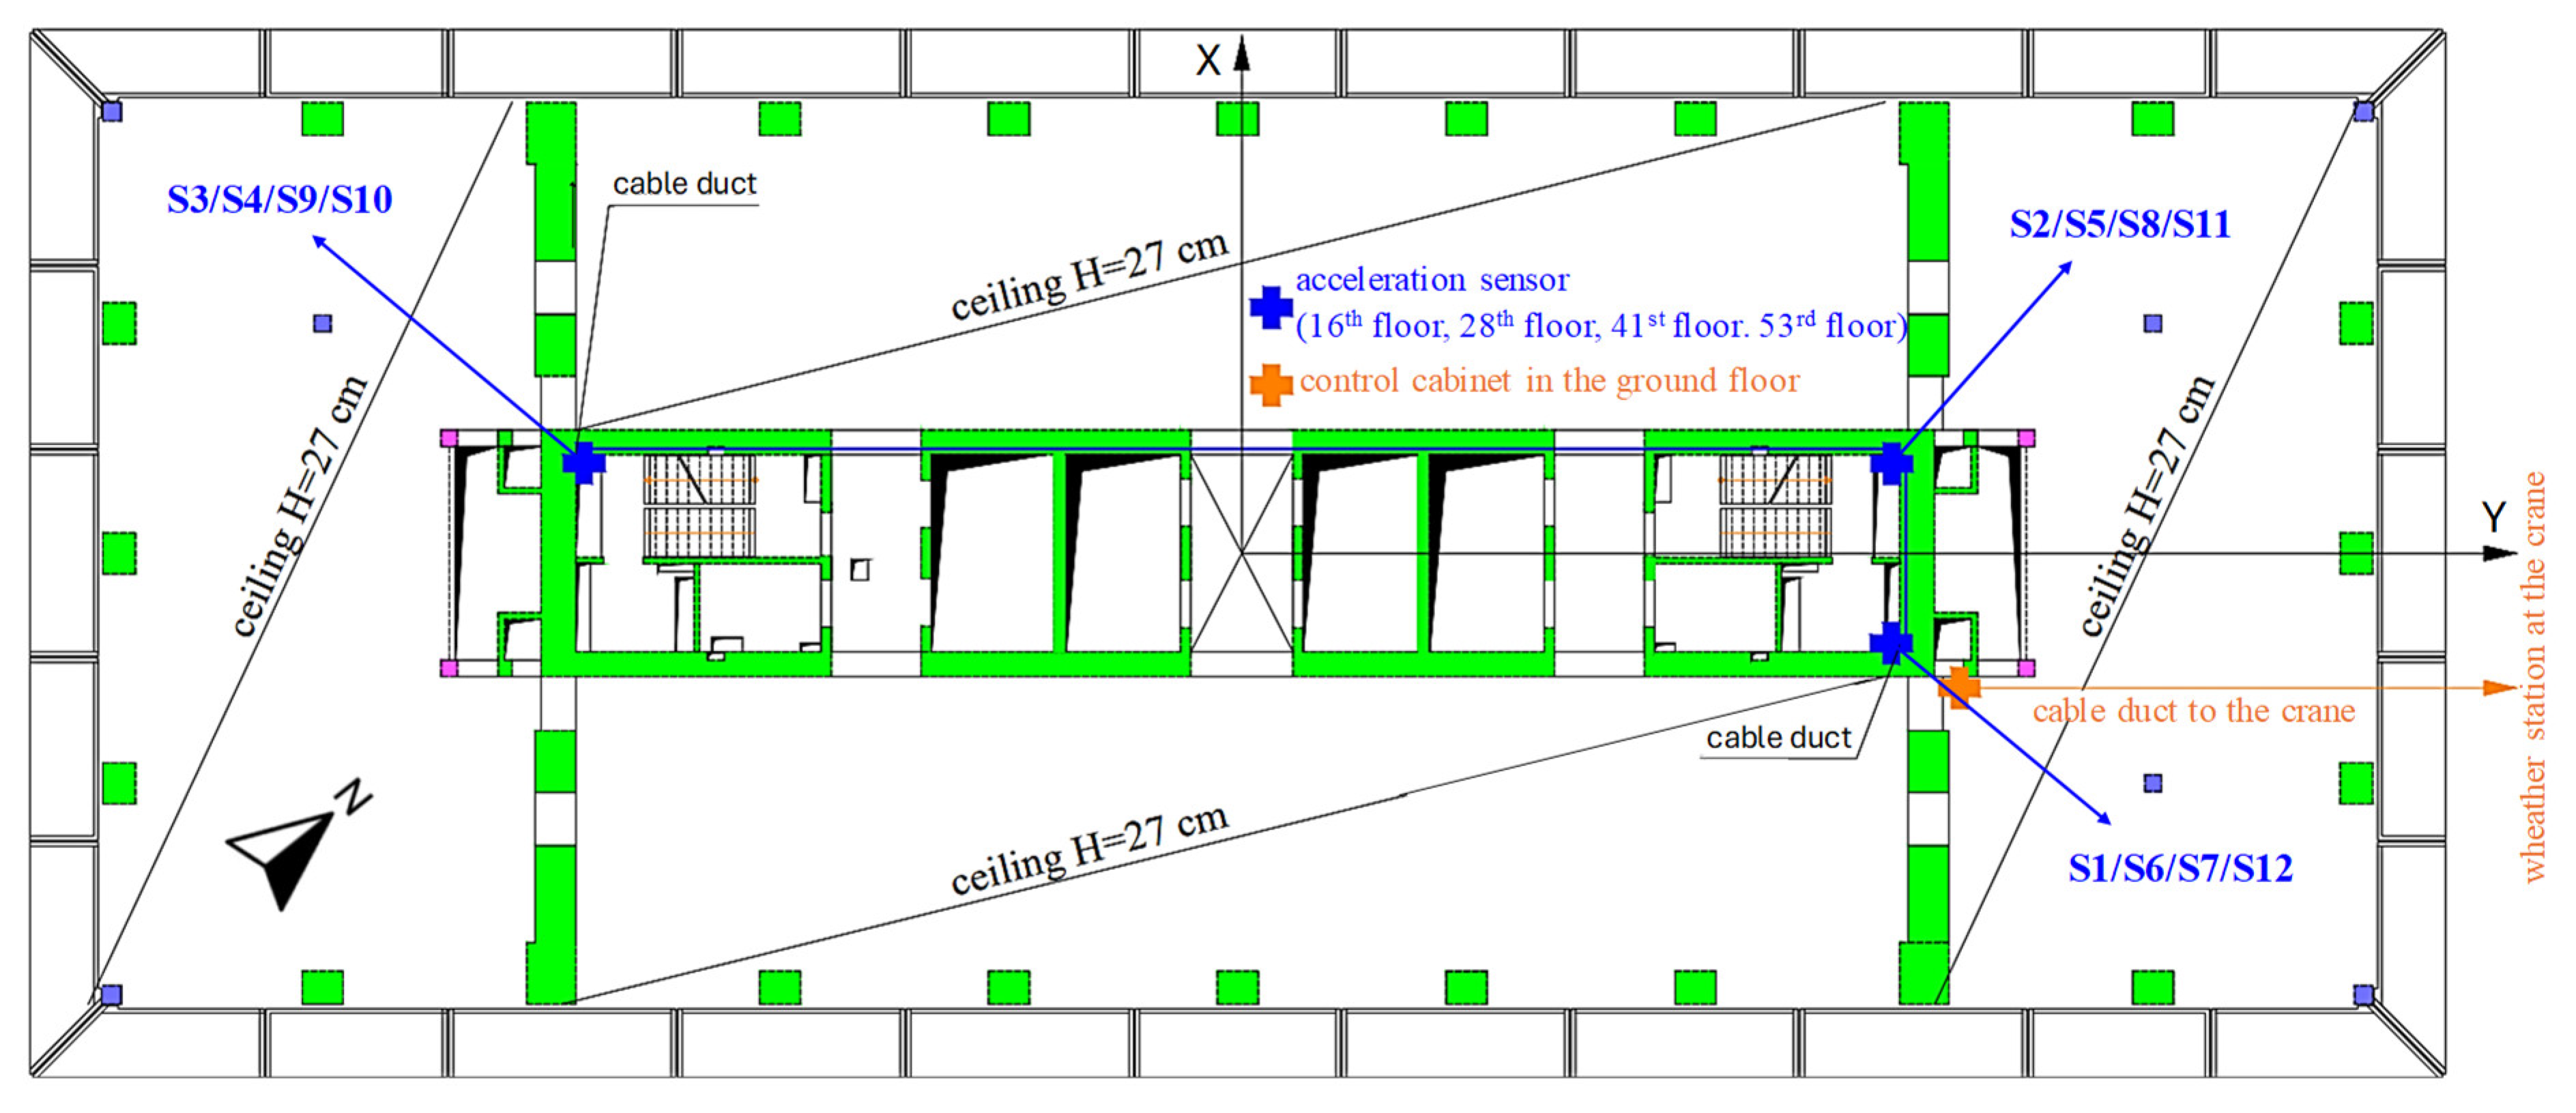
DC2 Tower (i.e., Danube City Tower 2) is a high-rise building in Vienna’s 22nd district, offering space for flats, offices, restaurants and shops. It is the second-highest skyscraper in Austria. The rough construction was completed in June 2025, with façade and interior works in progress as of September 2025. The tower is approximately 175 m high, with 53 upper floors and 6 basement floors. It measures about 59 m in length and 26 m in width. Its construction is characterized by reinforced concrete without joints. A stiffening core and two transverse shear walls provide horizontal load transfer (Figure 1). The vertical load is transferred by the floor slabs, columns, stiffening core and the all-around 80 cm thick diaphragm wall in the subsoil, which acts as a foundation enclosure. The foundation system beneath the 3.80 m thick base plate consists of deep diaphragm walls constructed with thicknesses of 40 cm and 60 cm, respectively. Stabilization of the eastern diaphragm wall was achieved using strand anchors. On the west side, this was not possible due to the underground parking garage of the neighbouring DC1 Tower. Therefore, a basement floor was constructed as a bracing cover.
The FEM model of the DC2 Tower was built by the static design engineers [26]. It consisted of beam and shell elements [26]. Columns were modelled using beam elements, while the stiffening core was modelled using shell elements, as these can capture the actual stress distribution in reinforced concrete walls. All floors were modelled as flexible slabs. At the design stage, the basement levels were assumed to be horizontally free, and the soil–structure interaction between the base plate and the soil was simulated using springs.
At the design stage of the DC2 Tower, the dynamic wind action was investigated by Wacker Ingenieure [27], as the comfort criteria could have required the installation of a passive TMD to mitigate wind-induced vibrations. Since the top floors of the DC2 Tower were intended for residential use, the comfort limit (i.e., maximum top horizontal acceleration) was 1.5% g for a wind with a 10-year return period and 1.0% g for a wind with a 1-year return period. The wind engineers carried out wind tunnel tests to evaluate the wind pressure time series and tower’s top horizontal accelerations, both in isolation and within the surrounding environment [27]. The initial estimates of the natural frequencies provided by the design engineers [26] were considered: f1,d = 0.15 Hz (bending in the X-direction, see Figure 1), f2,d = 0.26 Hz (torsion) and f3,d = 0.27 Hz (bending in the Y-direction, see Figure 1), accounting for dead load and 30% of live load. Here, the subscript d indicates the design value of the corresponding variable. The assumed logarithmic damping decrement δd depended on the wind return period (0.09 for a 10-year wind and 0.06 for a 1-year wind). The damping ratio ζd (1.4% for a 10-year wind and 1.0% for a 1-year wind), derived from δd, was assigned to all vibration modes considered.
The determination of wind pressure time series and tower’s top horizontal accelerations on scaled tower models in the wind tunnel was carried out in accordance with the standards and guidelines for wind tunnel testing [27]. For structural aerodynamic investigations (i.e., determination of wind pressure), a rigid model of the structure was created. For the dynamic behaviour (i.e., determination of tower’s top horizontal accelerations), the investigation was carried out on an aeroelastic model that reproduced the stiffness and vibration modes of the real structure. By rotating the model, installed on the rotatable wind tunnel floor, different incoming flow or wind directions were simulated.
The results of the wind simulations satisfied the comfort limit for a 1-year return period (0.85% g < 1.0% g [27]). However, the comfort limit was exceeded for a 10-year return period (1.59% g > 1.5% g [27]), requiring the installation of a passive TMD at the design stage.
Because previous studies showed a gap between the design estimates and the actual modal parameters of the real tower [22,23], the urgent need to decide on the installation of a passive TMD prompted PORR Bau GmbH and REVOTEC zt gmbh to develop a framework to evaluate the actual natural frequencies of the DC2 Tower early in the construction stage (Section 3). This was achieved by coupling real-time 3D monitoring (Section 3.1) with the tower’s digital twin model, updated throughout the construction process (Section 3.2). The results obtained from the digital twin model allowed the design and wind engineers to calibrate the static FEM model during construction and to predict the tower’s actual vibration frequencies in its final state (Section 3.3), as well as the updated top accelerations. This facilitated timely decision-making and avoided the installation of a TMD. The prognosis was also verified at the end of construction (Section 4).

3. Framework Coupling Real-Time 3D Monitoring with a Digital Twin Model for an Early Prognosis of the Actual Natural Frequencies of the DC2 Tower

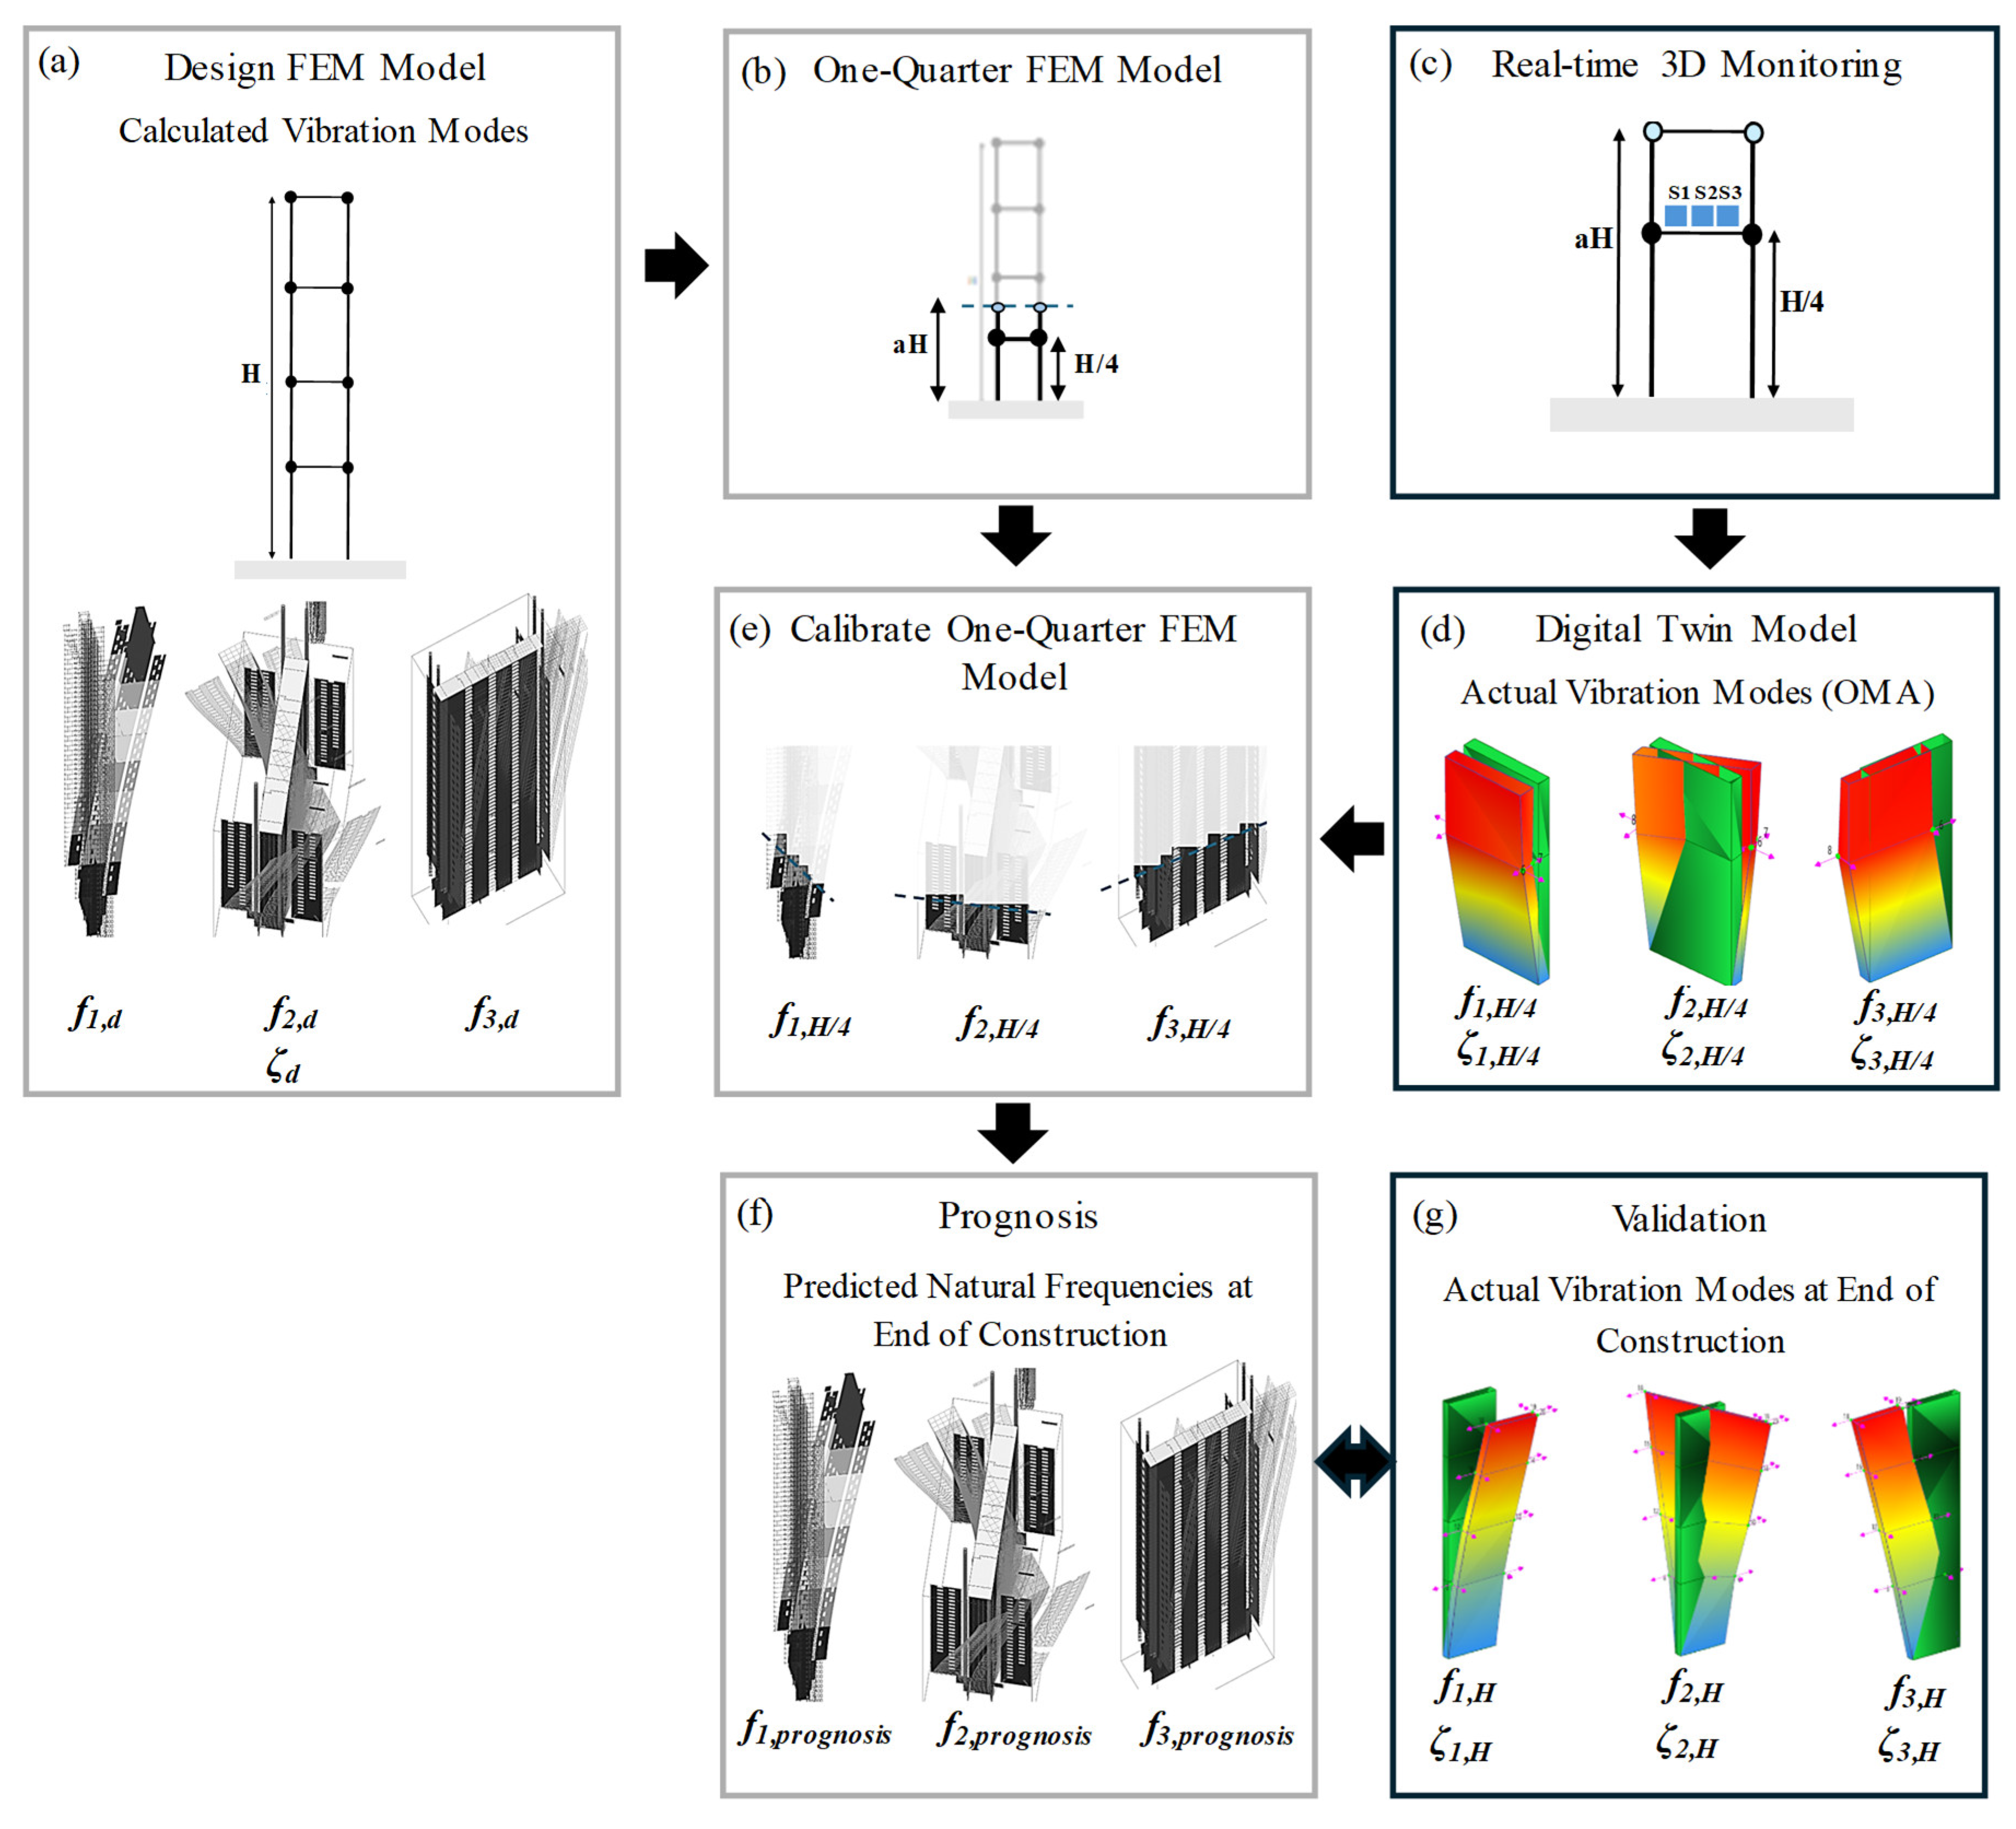
Figure 2 shows the flowchart of the developed framework to predict the actual natural frequencies of the DC2 Tower in its final state. The static FEM model of the DC2 Tower, available since the design stage (Figure 2a), was used to perform modal analysis and evaluate the vibration modes (i.e., mode shapes and natural frequencies) of the tower in its final stage (f1,d, f2,d and f3,d in Figure 2a). At the design stage, a damping ratio (ζd in Figure 2a) was assumed according to the relevant normative and applied equally to all vibration modes. The design estimates are presented in Section 2.
Once construction of the DC2 Tower began, the FEM model was trimmed (Figure 2b) to reflect the current state of construction (Figure 2c), when only three sensors had been installed at the first quarter of the tower height on the 16th floor (Figure 2c). The three sensors (S1, S2 and S3 in Figure 2c), installed on the real structure, recorded the ambient and forced vibrations of the DC2 Tower in real time in X, Y and Z directions (Section 3.1). These recordings were imported and applied to the corresponding sensor locations in the digital twin model, developed in parallel in Artemis (Figure 2d). Using OMA described in Section 3.2, it was possible to obtain the actual modal parameters of the tower at its current state (f1,H/4, f2,H/4 and f3,H/4; and ζ1,H/4, ζ2,H/4 and ζ3,H/4 in Figure 2d) from the digital twin. The trimmed FEM model was then calibrated to match these actual natural frequencies (f1,H/4, f2,H/4 and f3,H/4 in Figure 2e). The calibrated FEM model (Figure 2e) was then extended and used for an early prognosis of the actual natural frequencies of the DC2 Tower at the end of construction (f1,prognosis, f2,prognosis and f3,prognosis in Figure 2f). The prognosis methodology is described in Section 3.3.
Solely for safety purposes, thanks to the framework coupling real-time 3D monitoring (Figure 2c) with the digital twin model (Figure 2d), it was possible to check the prognosis throughout construction, but it was never updated (Figure 2f). The actual modal parameters of the in-construction tower, obtained from the digital twin model and updated as construction progressed, were checked every two weeks until the end of construction (Figure 2g), when all sensors were installed (S1–S12 in Figure 1). The prognosis (Figure 2f) was verified by the natural frequencies measured at the end of construction (f1,prognosisf1,H, f2,prognosisf2,H and f3,prognosisf3,H in Figure 2g).
It is noted that the static FEM model is a digital twin model, used to perform modal analysis at the design stage [26]. However, the calculated natural frequencies (Figure 2a) are often lower than the ones characterizing the real structure, as shown at the end of the DC2 Tower construction (Figure 2g). It is due to the design assumptions made for the material properties, soil properties and boundary conditions. Therefore, within the proposed framework, the one-quarter FEM model is calibrated (Figure 2e) to match the real natural frequencies obtained from the digital twin model built in Artemis (Figure 2d). The 3D digital twin model built in Artemis is not a FEM model and represents a powerful tool to accurately evaluate the actual modal parameters of the structure in real time.
As the digital twin model built in Artemis [20] is based on real-time monitoring data, it was updated as additional sensors were installed with the construction progress. The prognosis made early at one-quarter height (Figure 2f) aligned very well with the actual natural frequencies obtained from the digital twin model at the end of the construction (Figure 2g).

3.1. Real-Time 3D Monitoring

The permanent vibration monitoring system was installed during the construction stage of the DC2 Tower, which began in July 2023. It comprised a control cabinet (REVOTEC: Vienna, Austria), a weather station (Lufft: Fellbach, Germany) and acceleration sensors (so-called accelerometers; DEWESOFT: Vienna, Austria). It is well known that shear walls, and in particular core walls of high-rise buildings, transfer more horizontal load than columns. Therefore, the measurement layout to evaluate the modal parameters and wind-induced vibrations of the DC2 Tower accounted only for the perimeter of the stiffening core (Figure 1). Based on the mode shapes estimated at the design stage [26], three sensors were installed per floor (blue crosses in Figure 1) at every quarter height of the tower (i.e., 16th floor—49.6 m on 3 September 2024, 28th floor—88.0 m on 3 December 2024, 41st floor—129.6 m on 3 April 2025, and 53rd floor—166.3 m on 23 June 2025) as construction progressed. In total, 3 × 4 = 12 accelerometers (S1–S12, see Figure 1) were present in the final state. Section 3.1.1 describes the properties of the accelerometers in detail.
The tower’s vibration shapes estimated at the design stage [26] were considered to define the sensor configuration, which captured not only the translational vibration modes (i.e., bending modes) in the weak X- and strong Y-directions of the tower, but also its torsional mode and coupled translational–torsional modes (i.e., higher vibration modes). Note that different mode shapes would have led to a different measurement layout.
Although the natural frequencies of the tower could be measured by a single accelerometer, it was only possible to link these frequencies to the tower’s natural vibration shapes (i.e., vibration modes) by installing three accelerometers per floor at every quarter height and using the real-time monitoring data to build the digital twin model and display the mode shapes in 3D (Section 3.2).
A weather station was also installed at the top of the construction site K2 crane (Liebherr: Bischofshofen, Austria) to monitor environmental effects on the DC2 Tower’s modal parameters and forced vibrations in real time, such as the dynamic wind impact. The K2 crane was selected due to its location close to the Danube River. The weather station recorded wind speed and direction in real time. Section 3.1.1 describes the weather station’s properties in detail. The combined measurement of wind effects, recorded by the weather station, and wind-induced vibrations of the DC2 Tower, recorded by the accelerometers, enabled an accurate evaluation of the forced vibrations, with their amplitudes assigned to specific wind forces. Ambient vibrations of the DC2 Tower at low wind speeds, induced by external excitations such as traffic and micro-seismic events, were also continuously recorded.
The recorded data were accurately collected, processed and transmitted thanks to the control cabinet (orange cross in Figure 1), which managed the entire measurement system.

3.1.1. Sensors and Sampling Rates

The tower’s vibration accelerations were recorded by triaxial MEMS accelerometers, which were firmly attached to a mechanical chassis to prevent damage. In these MEMS accelerometers, the analogue-to-digital conversion (ADC) is performed inside the sensor, eliminating noise pick-up from analogue cabling. The sensors have a high bandwidth of 0–1 kHz and are suitable for measuring low-frequency vibrations below 1 Hz, as expected for the DC2 Tower based on static design estimates [27]. Vibration accelerations in the X, Y and Z directions were recorded with a measuring range of ±2 g and a sampling rate of 100 Hz (i.e., 100 records per second).
The wind speed and direction were recorded by the WS700-UBM sensor [28]. This all-in-one weather station also measures air temperature, relative humidity, air pressure, precipitation and radiation energy. It has a diameter of 150 mm and a height of 344 mm. The wind direction was measured as an angle between 0° and 359.9°, with the sensor aligned to North (i.e., 0° is North, 90° East, 180° South, and 270° West; see Figure 1). Wind speed was recorded in km/h, with a measuring range of 0–270 km/h. Both wind speed and direction were recorded at a sampling rate of 1 Hz (i.e., one record per second).

3.1.2. Recording of Sensor Data

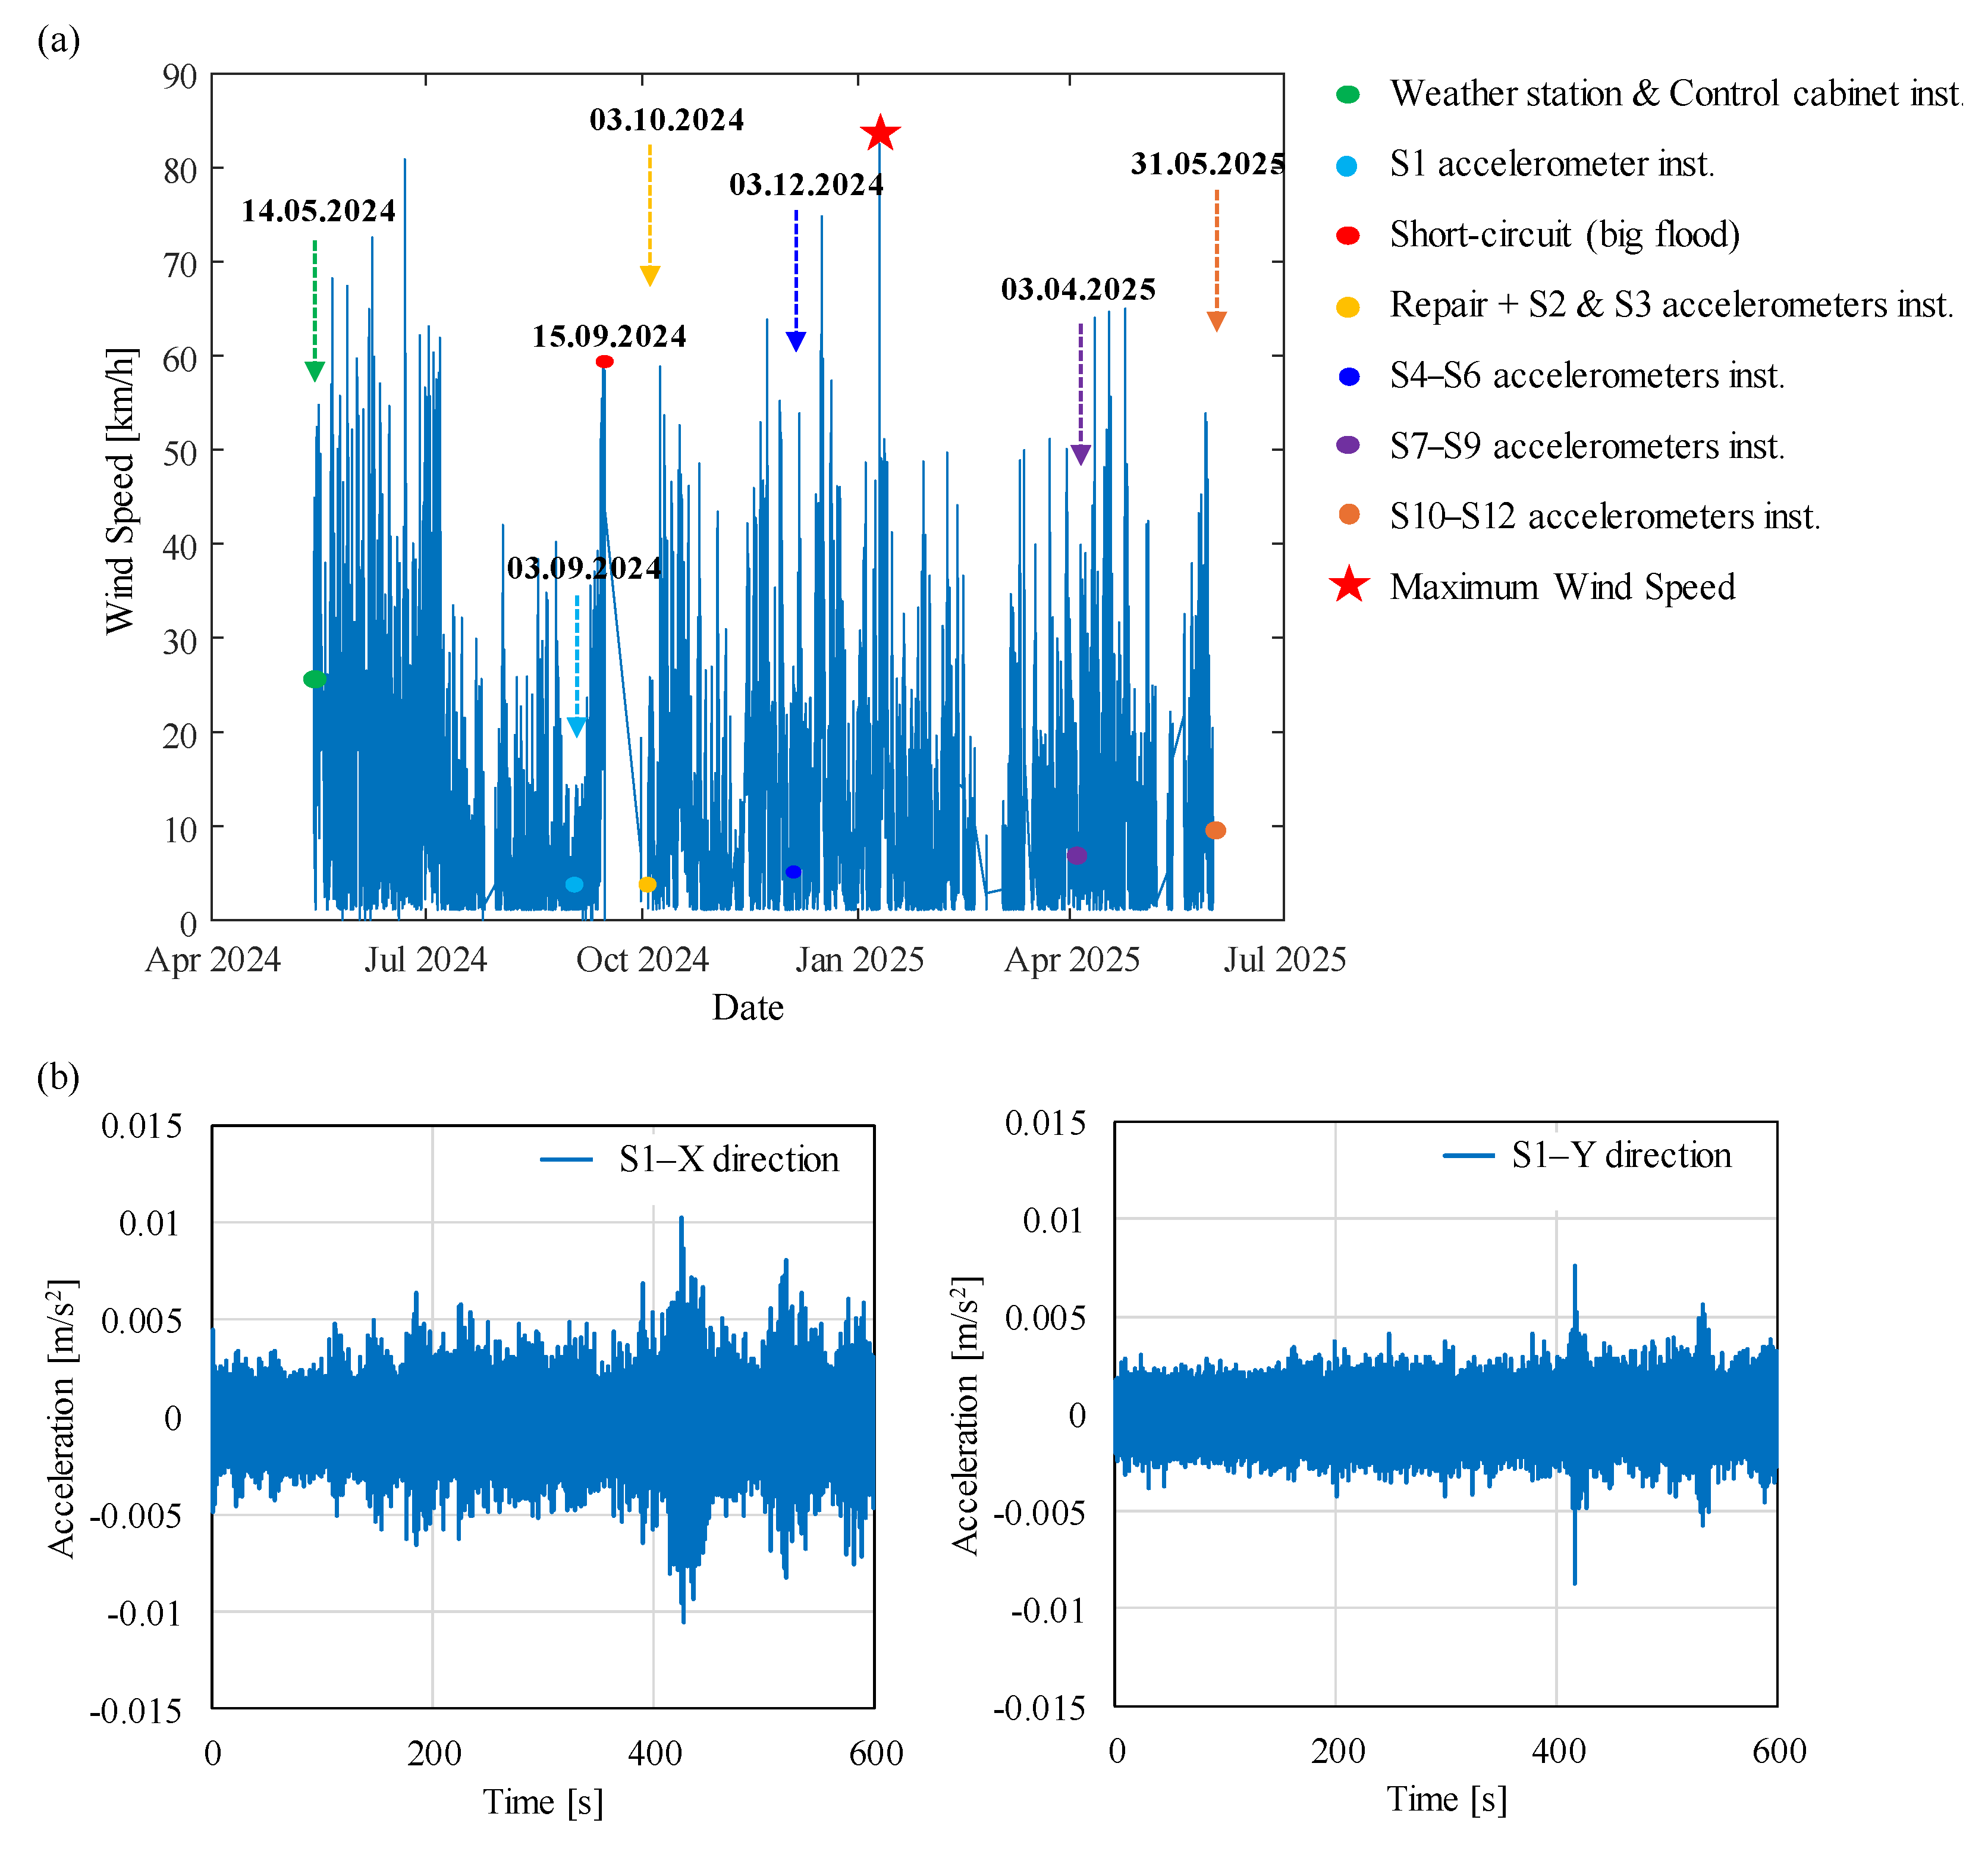
The wind speed and direction were recorded by the weather station, which was the first sensor installed in May 2024 (green dot in Figure 3a). The maximum recorded wind speed was 82.56 km/h on 10 January 2025 (red star in Figure 3a), with a corresponding wind direction of North–West (Figure 1). On 15 September 2024, Vienna was hit by a severe flood that caused a short circuit in the measurement system (red dot in Figure 3a). The first sensor (S1) recording the DC2 Tower’s forced vibration responses was installed at the first quarter height of the tower on 3 September 2024, before the flood (light-blue dot in Figure 3a). Figure 3b shows the accelerations recorded in the X- and Y-directions by S1 over a 10 min period during the night of the flood. Similar diagrams were obtained for subsequently installed sensors, each recorded over 10 min intervals throughout construction. S2 and S3 were installed at the first quarter height after the flood event (yellow dot in Figure 3a). The remaining sensors (S4–S12 in Figure 1) were installed as construction progressed (blue, purple and orange dots in Figure 3a).
It should be noted that S1 and the weather station temporarily stopped recording due to the short circuit caused by the flood (red dot in Figure 3a); however, they were repaired a few days later (yellow dot in Figure 3a).

3.2. Digital Twin Model

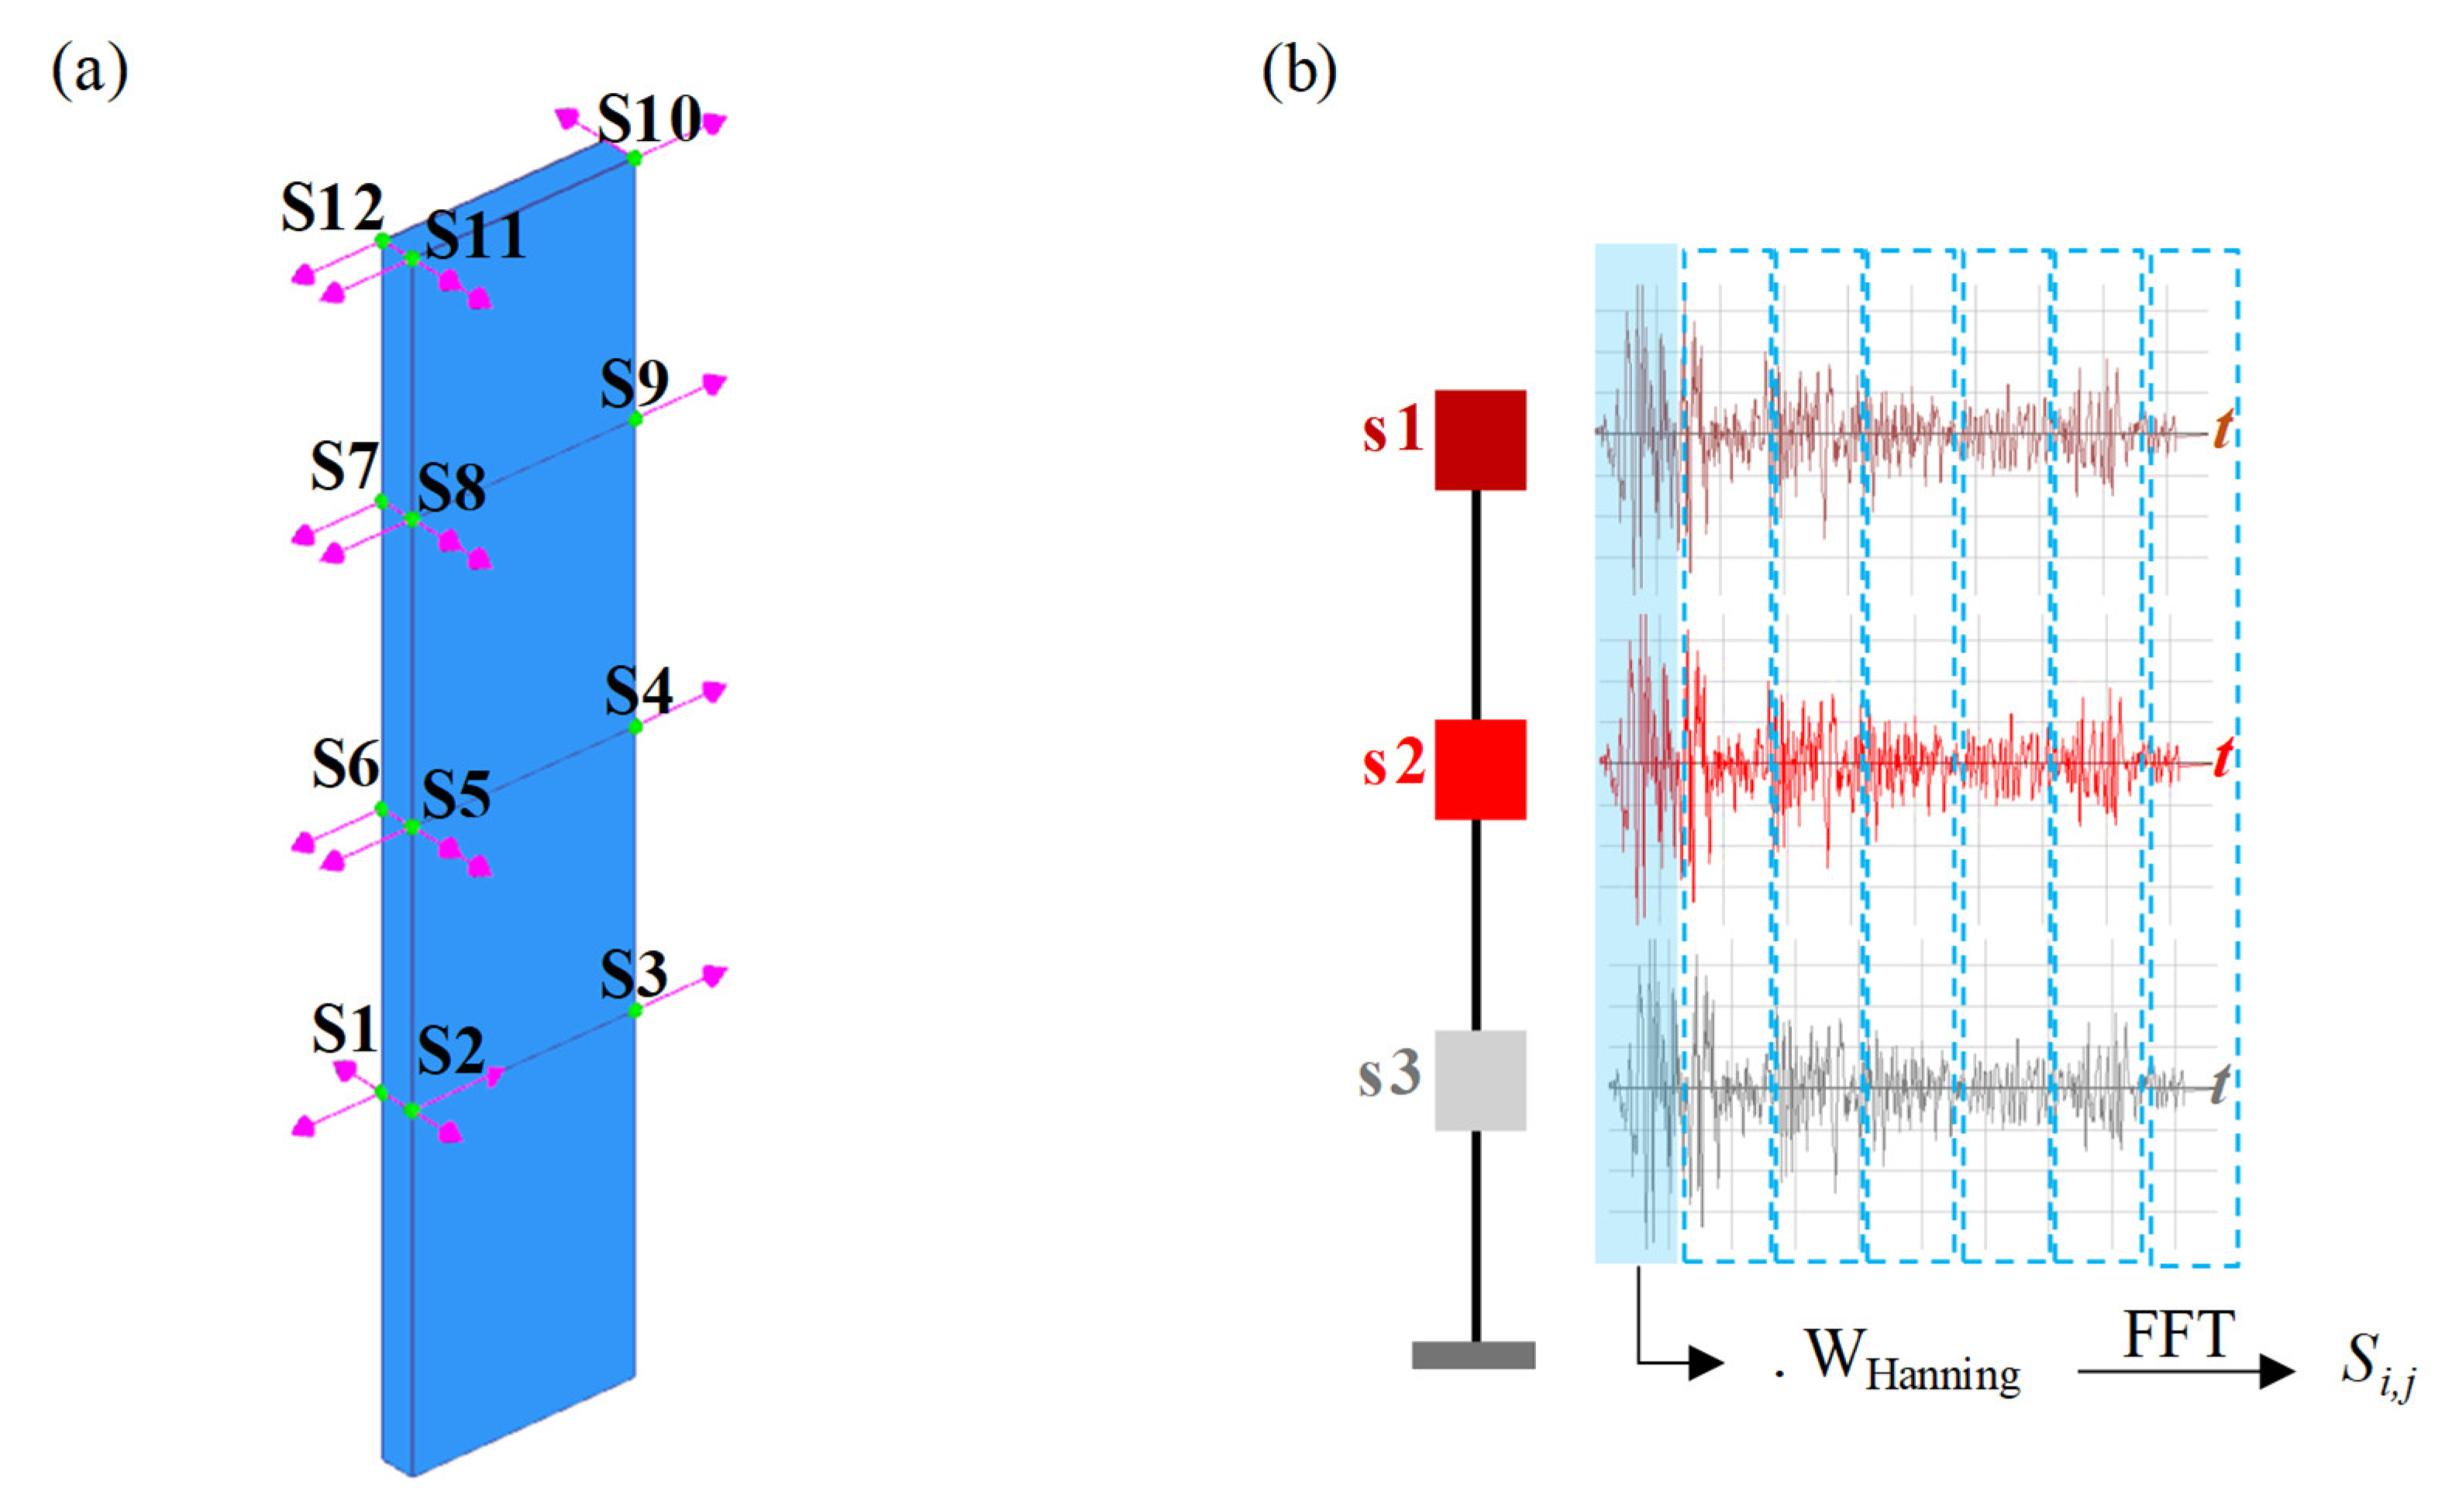
The global vibration modes corresponding to the natural frequencies of the DC2 Tower were displayed in 3D using the digital twin model, built in Artemis [20] and updated in parallel with the construction progress. It is noted that the digital twin model built in Artemis is not a FEM model; it is a pure geometrical model accounting for the stiffening core geometry (Figure 1) and it grew alongside the real DC2 Tower (Figure 4a).
In the digital twin model, the sensors were positioned identically to those on the real tower (Figure 4a), and the acceleration records represented the tower’s vibration response resulting from dynamic wind effects and ambient excitations. The system initially incorporated the real-time acceleration records from three sensors (S1–S3 on the 16th floor) and, at the end, real-time records from all installed sensors (S1–S12), as shown in Figure 4a.
Without a FEM structural model, the digital twin built in Artemis [20] reproduces the full dynamic behaviour of the structure, because it can estimate the actual modal parameters—mode shapes, natural frequencies and damping ratios—of the real DC2 Tower under construction by applying OMA, using only output data (i.e., structural vibration responses such as accelerations) recorded under uncontrolled excitation conditions (e.g., dynamic wind impact). In OMA, the input signal is considered unknown and is often modelled as Gaussian white noise. The technique used in Artemis for modal estimation of the DC2 Tower was enhanced frequency domain decomposition (EFDD) [20].
In OMA, the modal parameters are estimated purely through signal processing. Artemis includes up to three OMA techniques [20]. For this study, the EFDD technique was selected for modal estimation. The remaining two techniques, frequency domain decomposition (FDD) and curve-fit frequency domain decomposition (CFDD), were excluded due to specific methodological limitations. FDD is incapable of estimating the damping ratio, as it only identifies natural frequencies. Meanwhile, CFDD implements a curve-fitting technique to estimate both frequencies and damping ratios in the frequency domain. In this study, the EFDD method was preferred to ensure that the modal parameters were extracted directly from the raw data, avoiding potential biases introduced by external fitting.
EFDD is derived from frequency domain decomposition (FDD) [18], in which the structural response is approximately decomposed into a set of independent single-degree-of-freedom systems, one for each mode.
First, the spectral density matrices are estimated from the raw time-series data across the entire frequency range. For example, if a cantilever is considered, the raw time-series data are the responses recorded by the individual sensors located along it (three accelerograms in Figure 4b, corresponding to sensors s1, s2 and s3). The recorded time signals are then divided into overlapping segments (e.g., 0% overlap—light blue boxes in Figure 4b). The windowing function (e.g., Hanning) is applied to each i-th segment to reduce spectral leakage and smooth discontinuities at the boundaries. For each i-th segment and each j-th sensor signal, the fast Fourier transform (FFT) is computed, yielding the spectrum Si,j.
The auto- and cross-power spectral densities are then computed for each i-th segment and each frequency f:
S i , 11 f   S i , 12 f S i , 13 f S i , 21 f S i , 22 f S i , 23 f S i , 31 f S i , 32 f S i , 33 f = S i , 1 f   .     S * i , 1 f S i , 1 f   .     S * i , 2 f S i , 1 f   .     S * i , 3 f S i , 2 f   .     S * i , 1 f S i , 2 f   .     S * i , 2 f S i , 2 f   .     S * i , 3 f S i , 3 f   .     S * i , 1 f S i , 3 f   .     S * i , 2 f S i , 3 f   .     S * i , 3 f
where S*i,j is the complex conjugate of Si,j. To obtain a stable estimate of the full spectral density matrix, an average over all segments is computed for each frequency f:
S x y f = 1 N i = 1 N S i , x y f
where x   = 1, 2, 3 and y = 1, 2, 3. N is the number of segments (e.g., 7 in Figure 4b). The full spectral density matrix for each frequency f is then defined as:
S f = S 11 f   S 12 f S 13 f S 21 f S 22 f S 23 f S 31 f S 32 f S 33 f
The singular value decomposition (SVD) of the spectral density matrix is then performed for each frequency f:
S f = U f Σ f U H f
where Σ f contains the singular values representing the energy contribution of each mode at f, and U f contains the singular vectors. Σ ( f ) is a diagonal matrix:
Σ f = σ 1 f   0 0 0 σ 2 f 0 0 0 σ 3 f
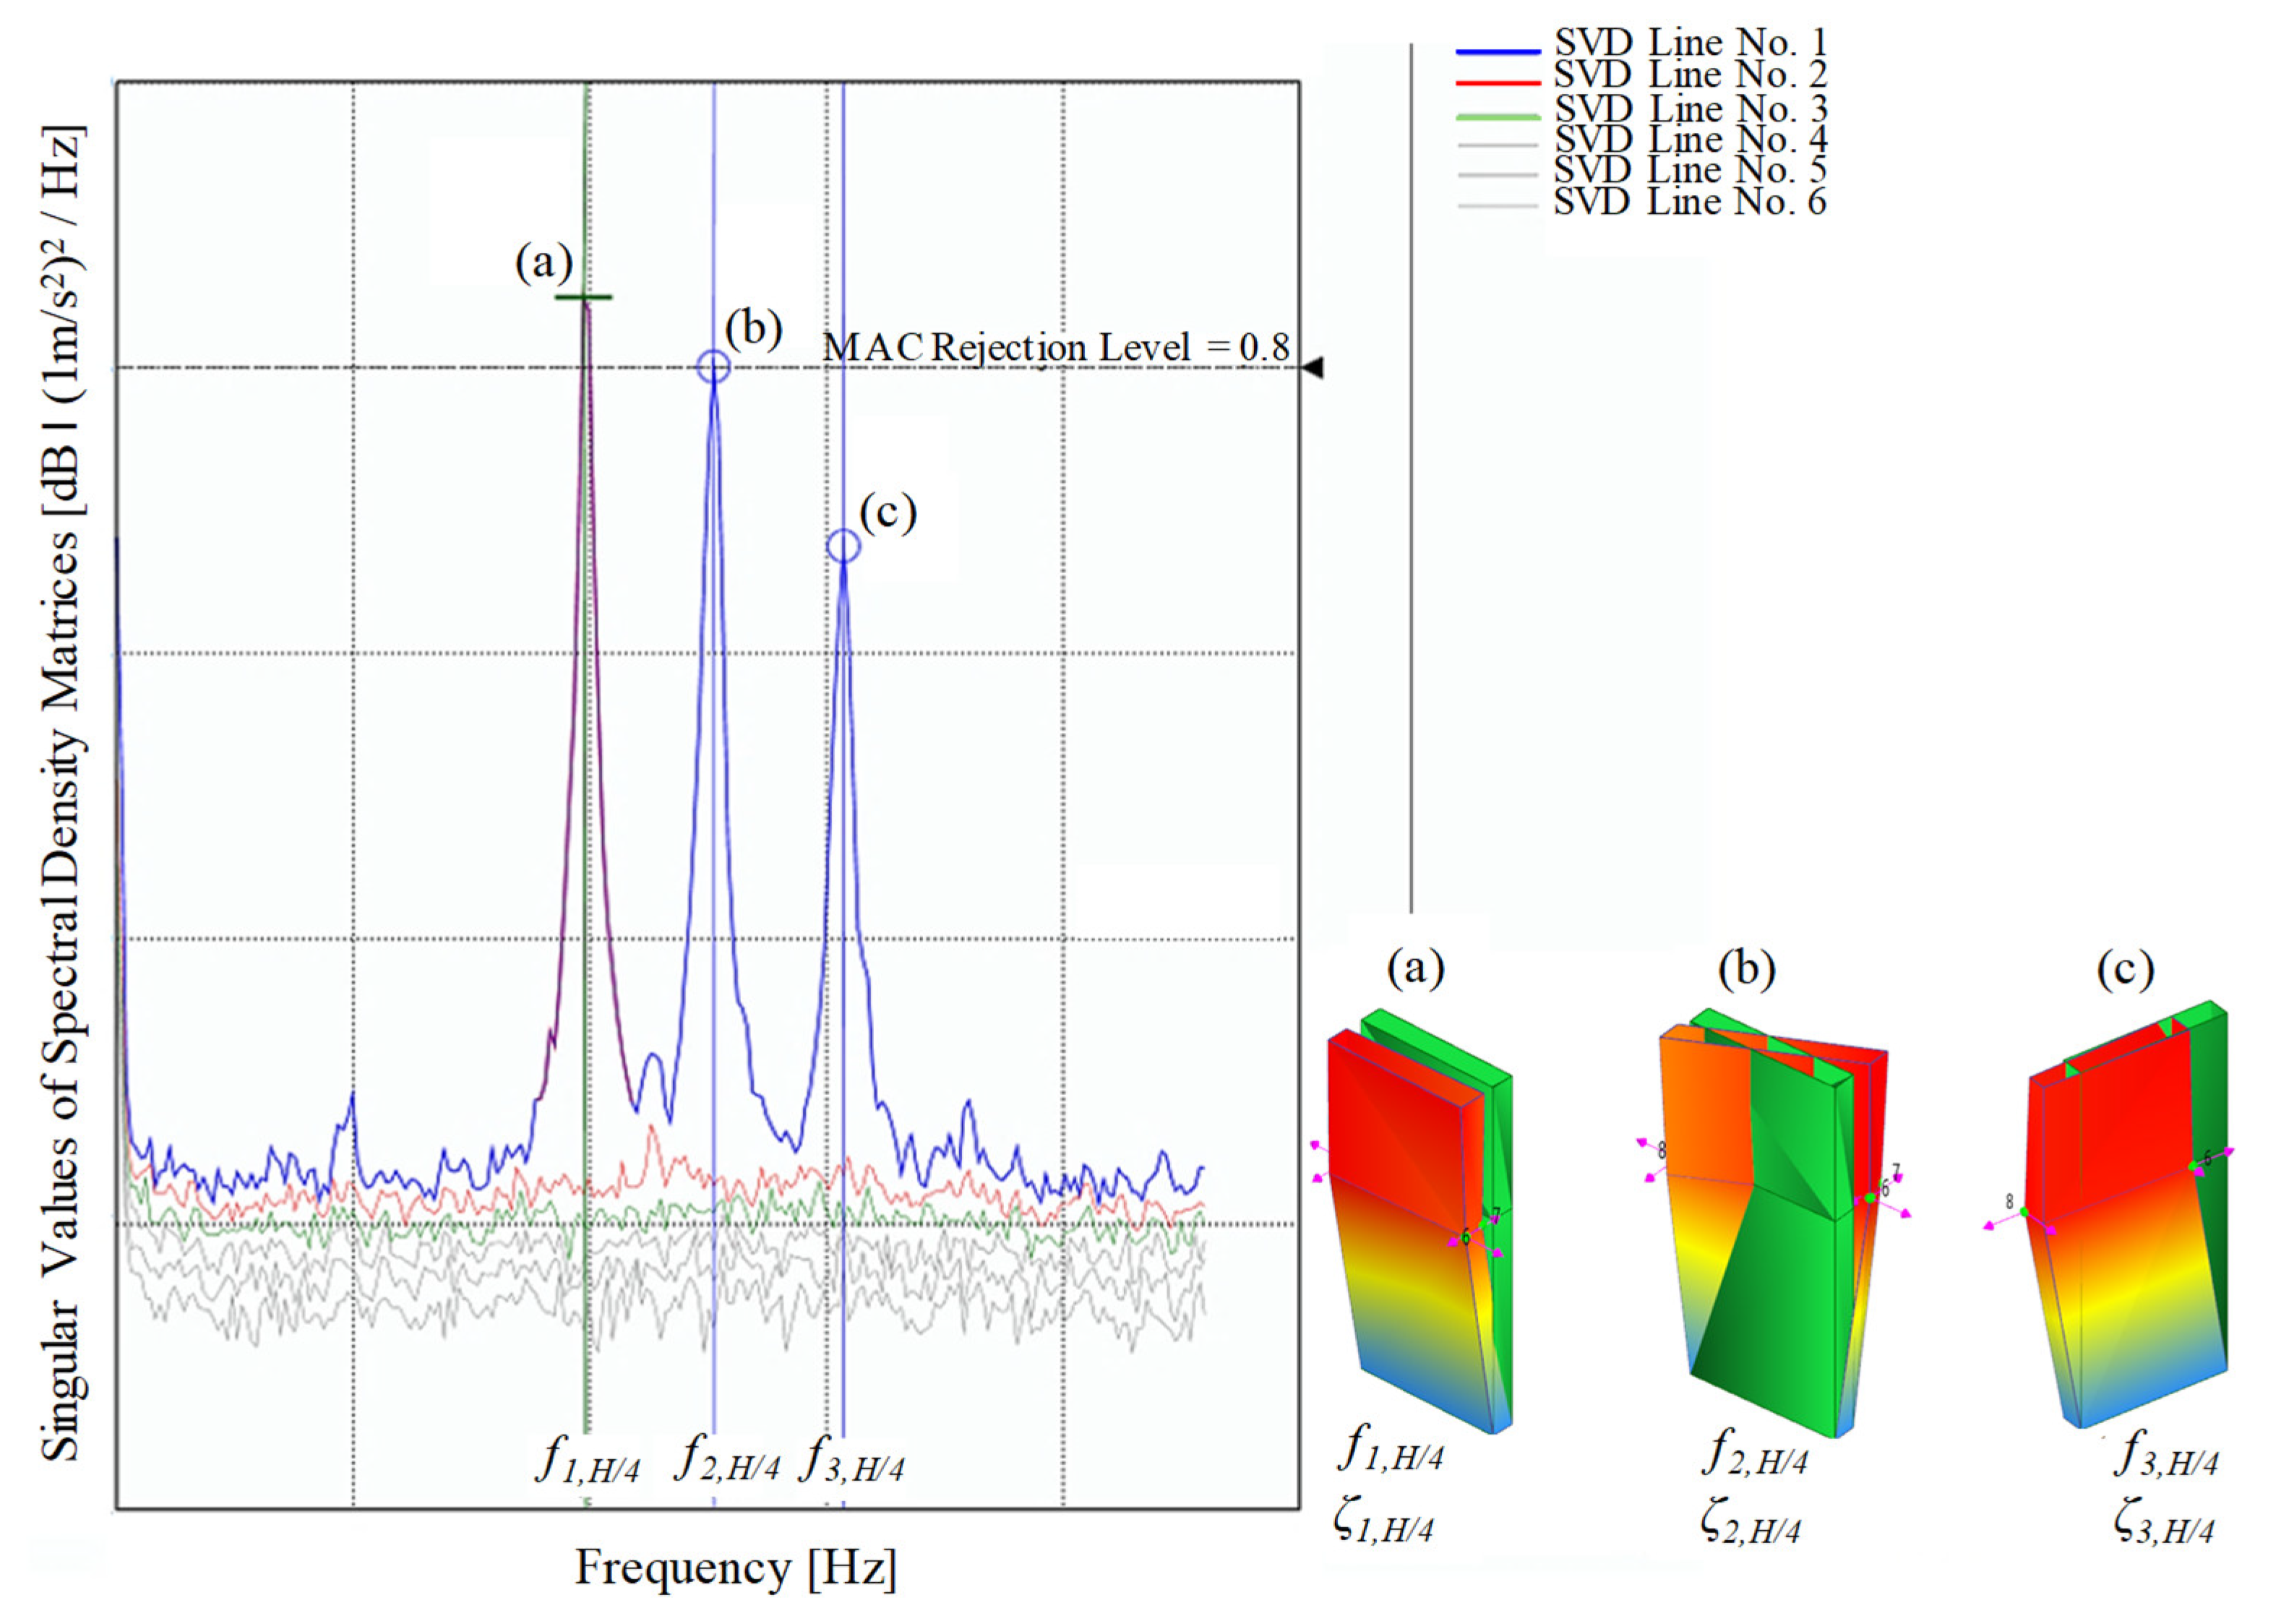
with σ 1 f > σ 2 f > σ 3 f . There are as many singular values as measurement channels at f. The SVD is performed over the entire frequency range. Peaks in the SVD are then identified, and the corresponding singular vectors are taken as the identified mode shapes (e.g., Figure 5).
The identified mode shapes are used to define the single-degree-of-freedom (SDOF) spectral bell of each mode (e.g., the red bell in Figure 5a for the first mode), from which the frequency f and damping ratio ζ are estimated. On both sides of the identified peak, a modal assurance criterion (MAC) vector is calculated between the reference vector (i.e., the identified mode shape) and the singular vectors corresponding to a certain frequency. If the largest value of the MAC vector exceeds a user-specified MAC rejection level, the corresponding singular value is included in the SDOF spectral bell. A common choice is an initial MAC rejection level of 0.8 [20]. Outside the search range, the values of the SDOF spectral bell are set to zero. In addition to storing the singular values that define the SDOF spectral bell, the corresponding singular vectors are averaged to obtain an improved estimate of the mode shape. The average is weighed by multiplying each singular vector by its corresponding singular value, meaning that singular vectors closer to the peak of the SDOF spectral bell contribute more to the mode shape estimate.
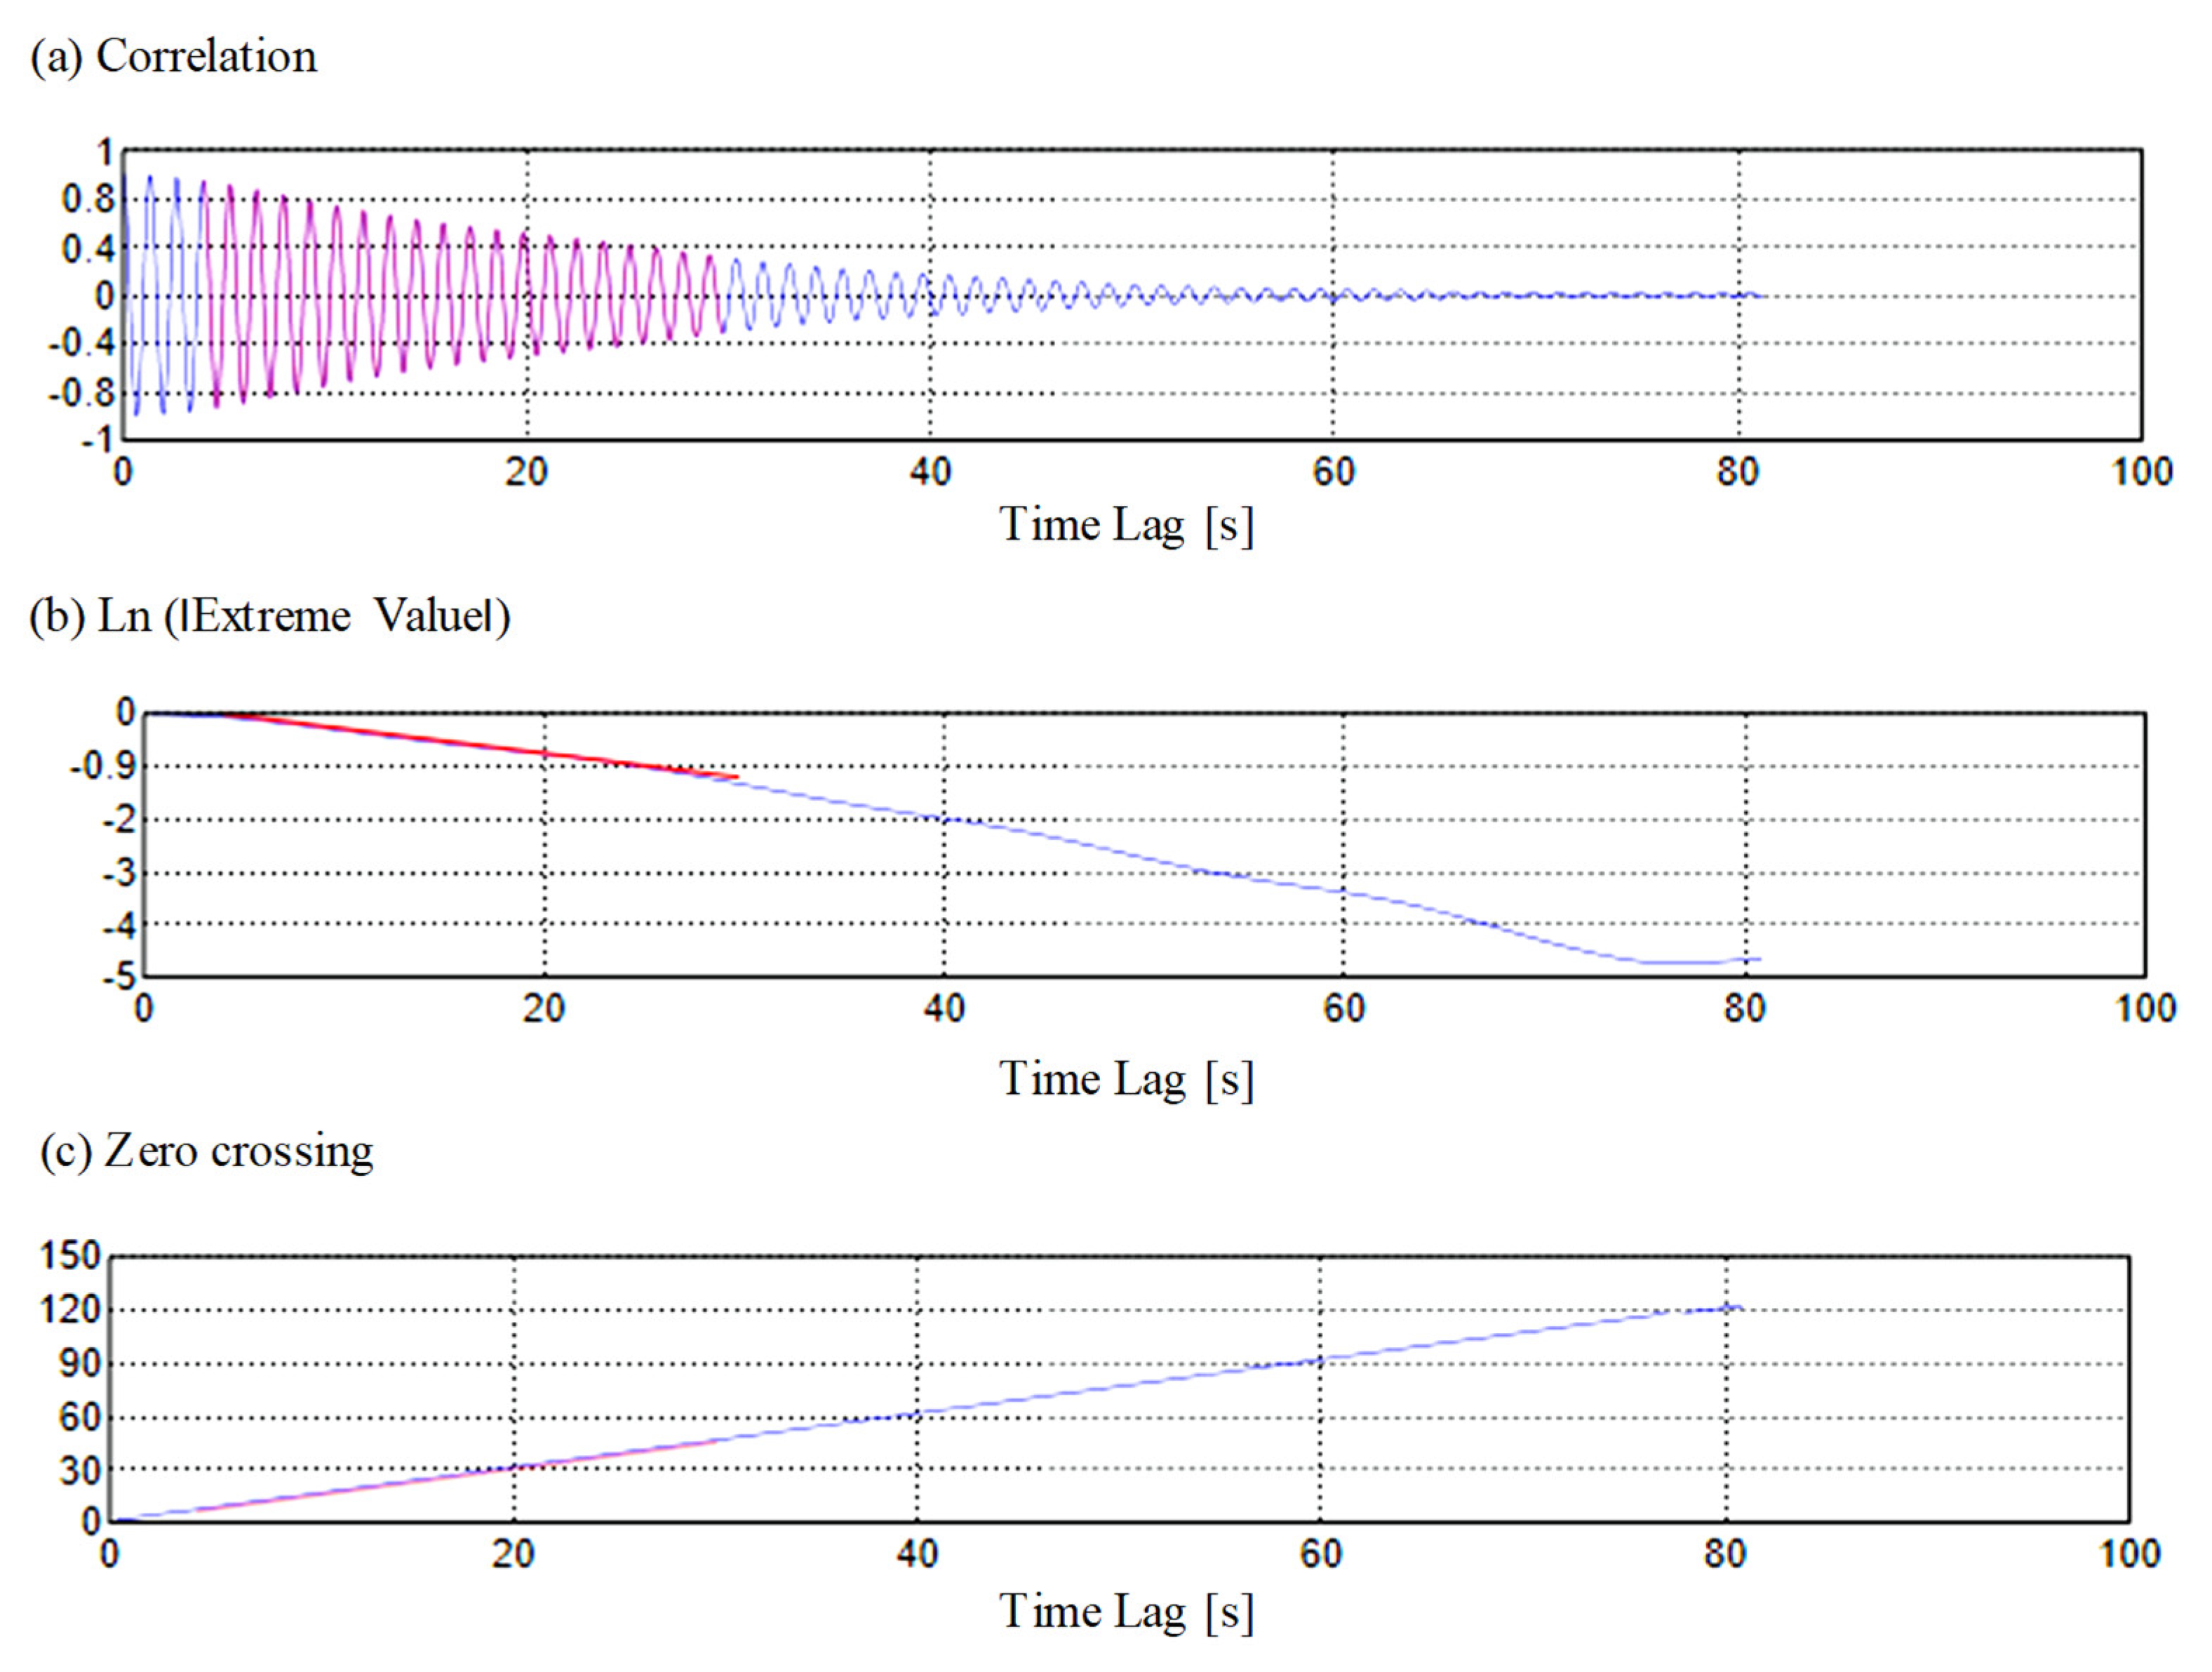
To estimate the natural frequency f and the corresponding damping ratio ζ of the identified mode, the SDOF spectral bell is transformed into the time domain, producing an SDOF correlation function (e.g., Figure 6a). The correlation function must decay to a sufficiently low level (e.g., red curve in Figure 6a) to obtain accurate estimates of f and ζ. The damping ratio ζ can be determined by identifying the positive and negative extrema of the correlation function [19]. For viscously damped linear systems, taking the natural logarithm of this decaying curve produces a straight line (e.g., red line in Figure 6b), from which ζ can be estimated using linear regression. The natural frequency f is estimated by performing linear regression on the straight line representing the zero crossings of the correlation function (e.g., red line in Figure 6c). Due to broadband noise, non-linearities, or both, the beginning and end of the line may not be straight and should be excluded from the regression (e.g., Figure 6b,c).
Note that, thanks to the digital twin model of the DC2 Tower, the first mode shapes—corresponding to bending in the X-direction, torsion and bending in the Y-direction, respectively—were identified from the beginning of construction, when only three sensors were installed at quarter height (Section 4). The corresponding natural frequencies and damping ratios were determined from the SDOF correlation function derived from the spectral bell of each mode (three peaks in Figure 5). Figure 6a shows the SDOF correlation function of the second torsional mode at the quarter height of the DC2 Tower, while Figure 6b,c show the resulting decaying curve and zero-crossing line used to estimate the damping ratio ζ2,H/4 and natural frequency f2,H/4, respectively.

3.3. Prognosis

Given the discrepancies between the measured frequencies (Section 4) and the expected values from static design [27] obtained at quarter height of the tower, and the urgent need to know the final actual stiffness of the DC2 Tower, a prognosis of the final natural frequencies was made based on the data recorded by the first-installed sensors S1–S3. The data considered for the prognosis were the acceleration records from 4 November 2024, when S1–S3 were the only sensors installed at quarter tower height. At that time, the height of the under-construction tower core was on the 30th floor, and the slabs were on the 26th floor (Section 4). The frequencies obtained from measurements (Section 4) were f1,H/4 = 0.65 Hz (bending in the weak X-direction), f2,H/4 = 0.82 Hz (torsion) and f3,H/4 = 0.99 Hz (bending in the strong Y-direction), which are 23%, 12% and 16% higher, respectively, than the design values [27].
The design engineers then reduced the FEM model to the state of the DC2 Tower on 4 November 2024 and tuned it to match the measured frequencies. This was done by increasing the concrete Young’s modulus of the tower core by 20%, applying rigid constraints for the soil spring support, and horizontally fixing the basement. The FEM model was then expanded to determine the natural frequencies of the DC2 Tower in its final state. The final actual stiffness of the DC2 Tower was predicted with high accuracy, yielding final predicted frequencies of f1,prognosis = 0.21 Hz, f2,prognosis = 0.3 Hz and f3,prognosis = 0.39 Hz when accounting for dead load and 30% of live loads; and f1,prognosis = 0.25 Hz, f2,prognosis = 0.37 Hz and f3,prognosis = 0.47 Hz when accounting only for dead loads. It should be noted that the final frequencies of the DC2 Tower were predicted at a very early stage of construction (i.e., core on the 30th floor and slabs on the 26th floor out of 53 floors).
The predicted frequencies of the DC2 Tower were provided to the wind engineers, who computed the top acceleration in the final state of the tower [29]. For a 10-year return period, the predicted top acceleration was 1.11% g [29], which did not exceed the limit of 1.5% g. It should be noted that the top acceleration expected at the design stage [27] would have been reduced by 30% if the predicted value obtained from the proposed framework (Figure 2) is considered. The prediction demonstrated that a passive TMD was no longer required, saving installation effort and costs.
To ensure safety, the prediction was also checked. The calibrated and expanded FEM model was further trimmed to predict the natural frequencies at different tower states, and these values were compared with measurements taken every two weeks until the end of construction (Figure 2—Verification). The results consistently showed good agreement (Table 1).

4. Intermediate and Final-State Results: Natural Frequencies, Vibration Modes and Damping Ratios

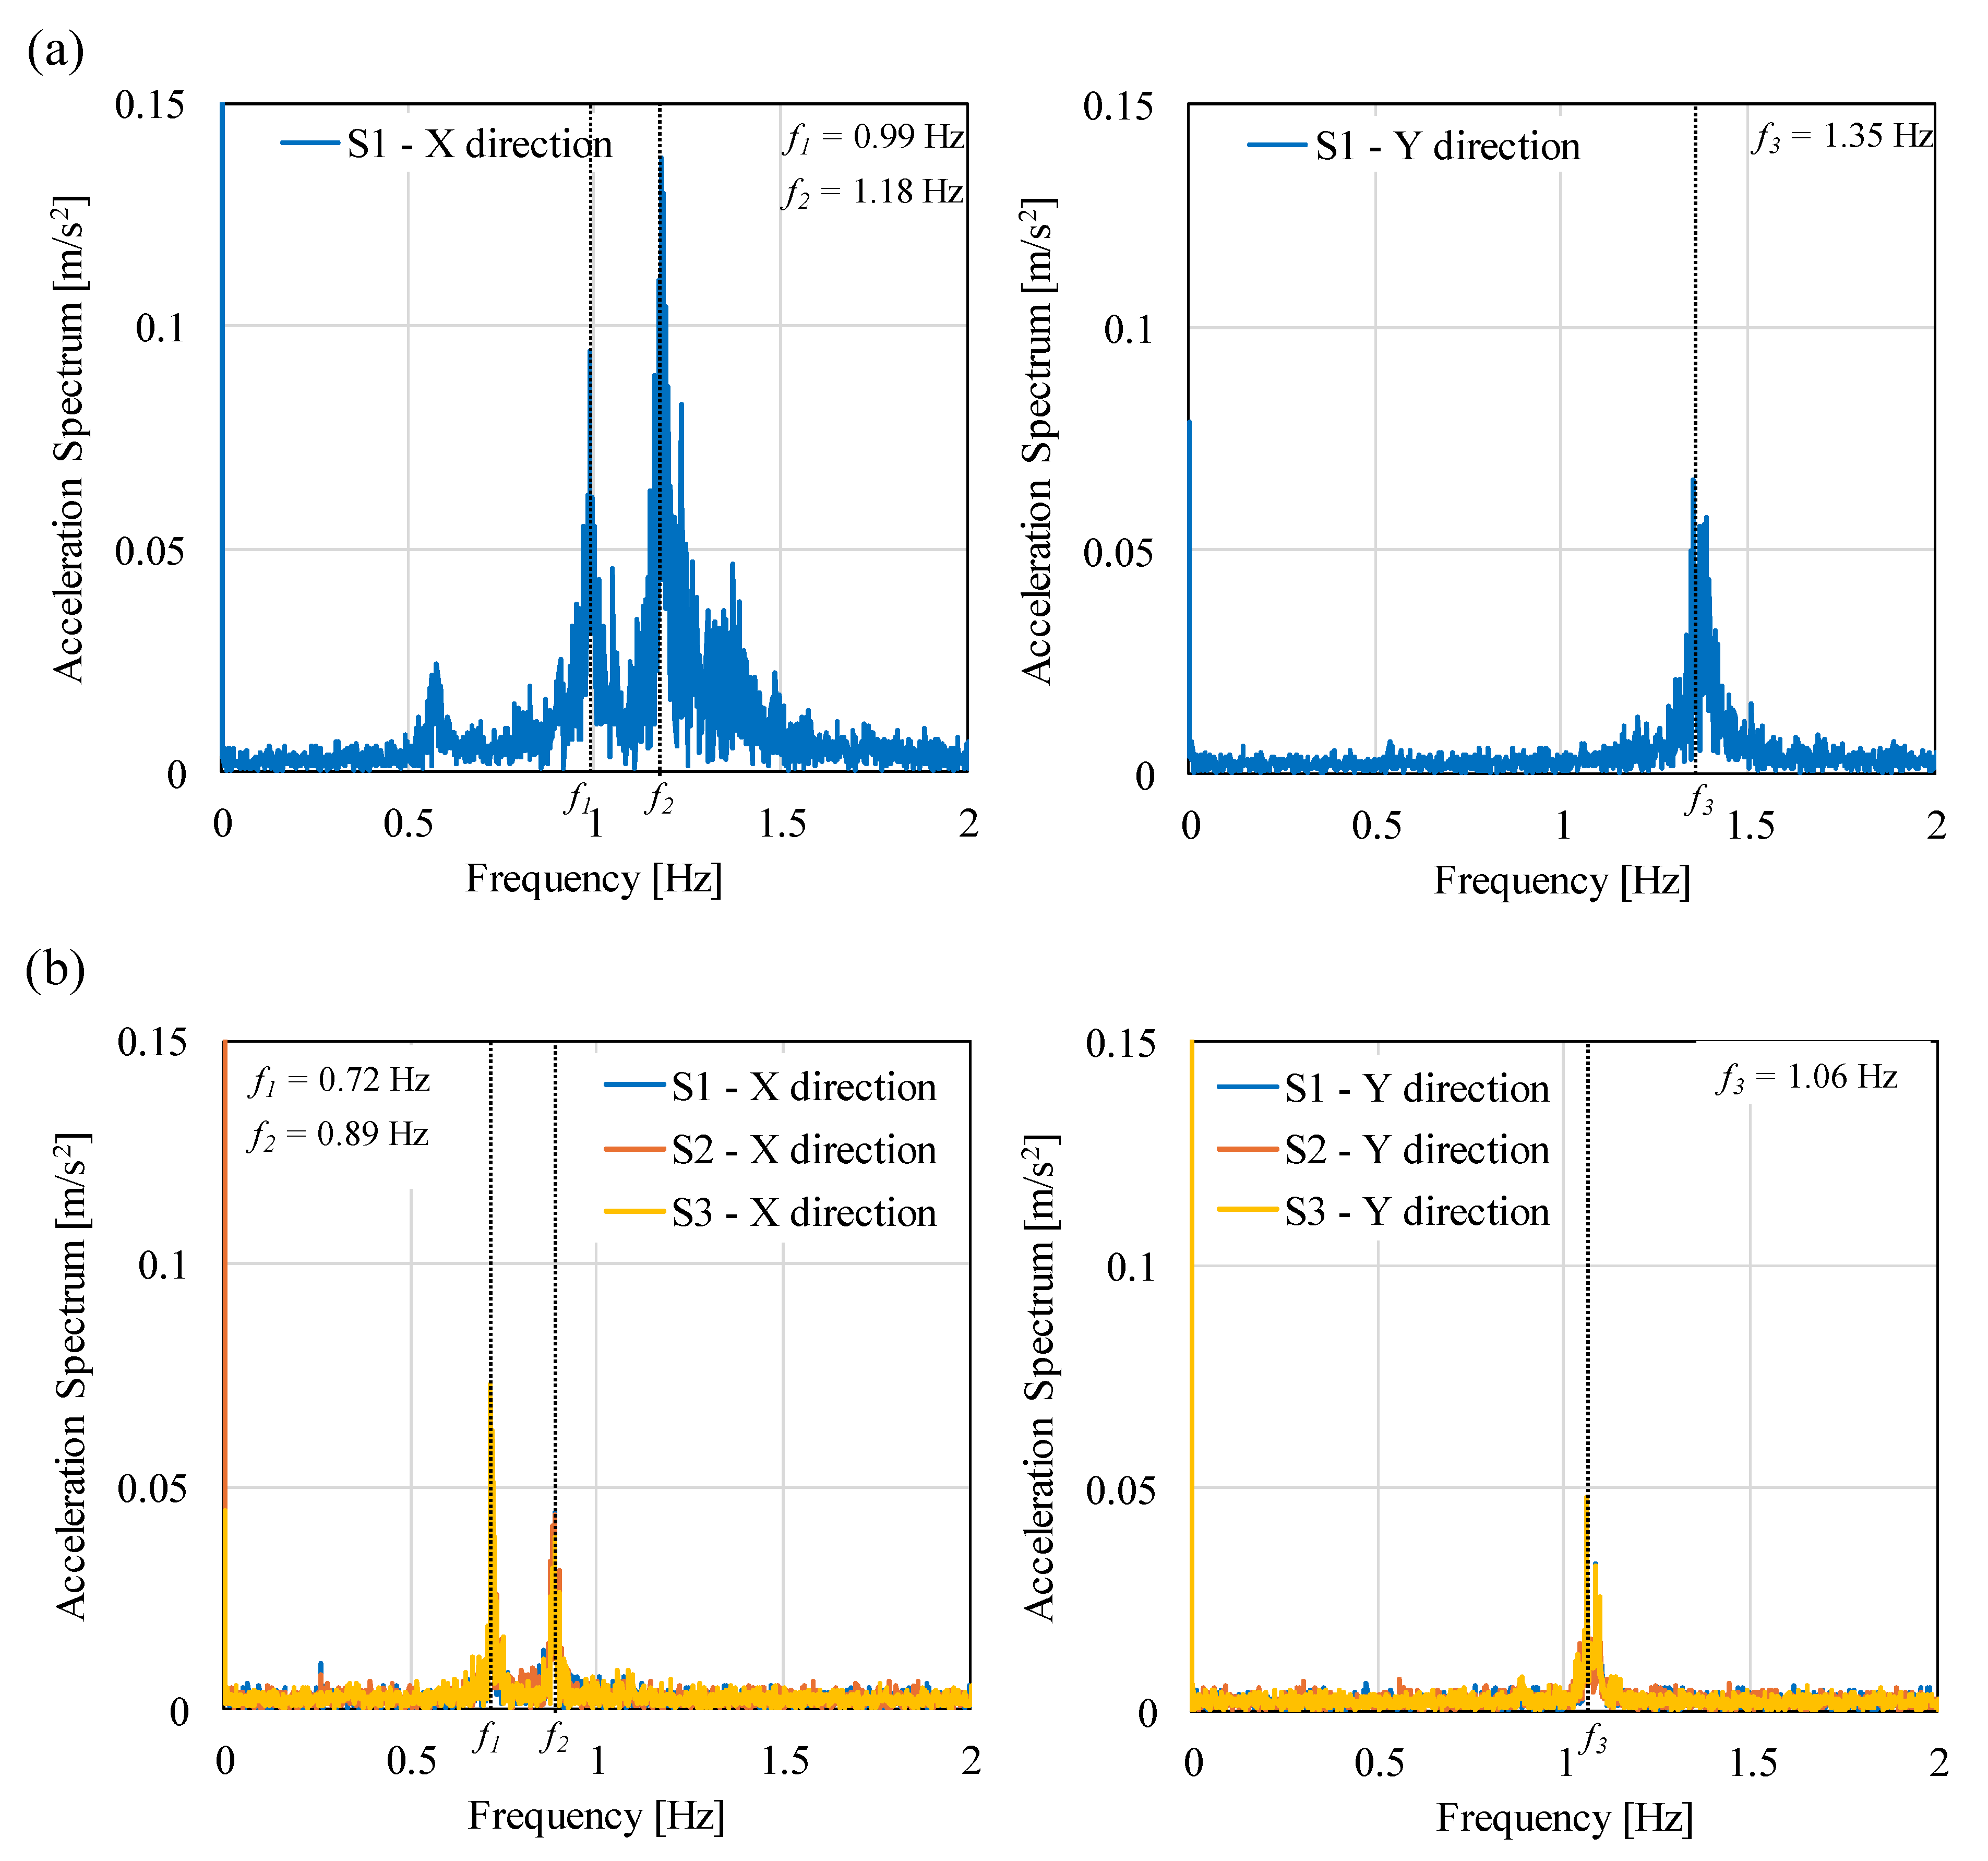
The first results obtained from the real-time monitoring are the natural frequencies of the DC2 Tower. The permanently recorded tower accelerations in the X- and Y-directions (Figure 3b, shown for sensor S1) were processed in parallel with the construction progress, and the frequency spectra of the accelerations in both directions were computed in real time (Figure 7a). The recorded data were available on the REVOTEC zt gmbh platform (https://data.revotec.at) and processed using the company’s software Revo-Visual (v. 29) [30]. It should be noted that the frequency spectra of the accelerations generated by Revo-Visual provide the complex magnitude of the FFT spectrum of the recorded acceleration, multiplied by a scale factor (1/sampling rate). Figure 7a shows the frequency spectra obtained from the accelerations recorded by sensor S1 over 10 min on the night of the severe flood in Vienna (Figure 3a). Similar diagrams were obtained for all installed sensors at 10 min intervals throughout the construction stage. To avoid external disturbances, only data recorded at night (00:00 to 04:00) were considered for determining the modal parameters.
From the frequency spectra, it is possible to identify the natural frequencies of the DC2 Tower throughout the construction process. The peaks shown in the X-direction spectrum correspond to the natural frequencies whose vibration modes involve displacement in the X-direction (Figure 7a). Similarly, the peaks in the Y-direction spectrum correspond to the natural frequencies whose vibration modes involve displacement in the Y-direction (Figure 7a). It should be noted that peaks related to local vibration modes were also visible in the acceleration spectra (e.g., X-direction in Figure 7a). For this reason, the installation of three sensors per floor at every quarter height of the tower was fundamental to identify the global vibration modes of the tower in its actual state and to compare them with those estimated at the design stage [26]. From the spectra of 10 min night records of the first-installed sensors S1–S3 on 17 October 2024, the peaks associated with the first three global vibration modes—bending in the X-direction, torsion and bending in the Y-direction—were observed at the same frequencies (f1, f2 and f3, respectively) for all S1–S3 sensors (Figure 7b).
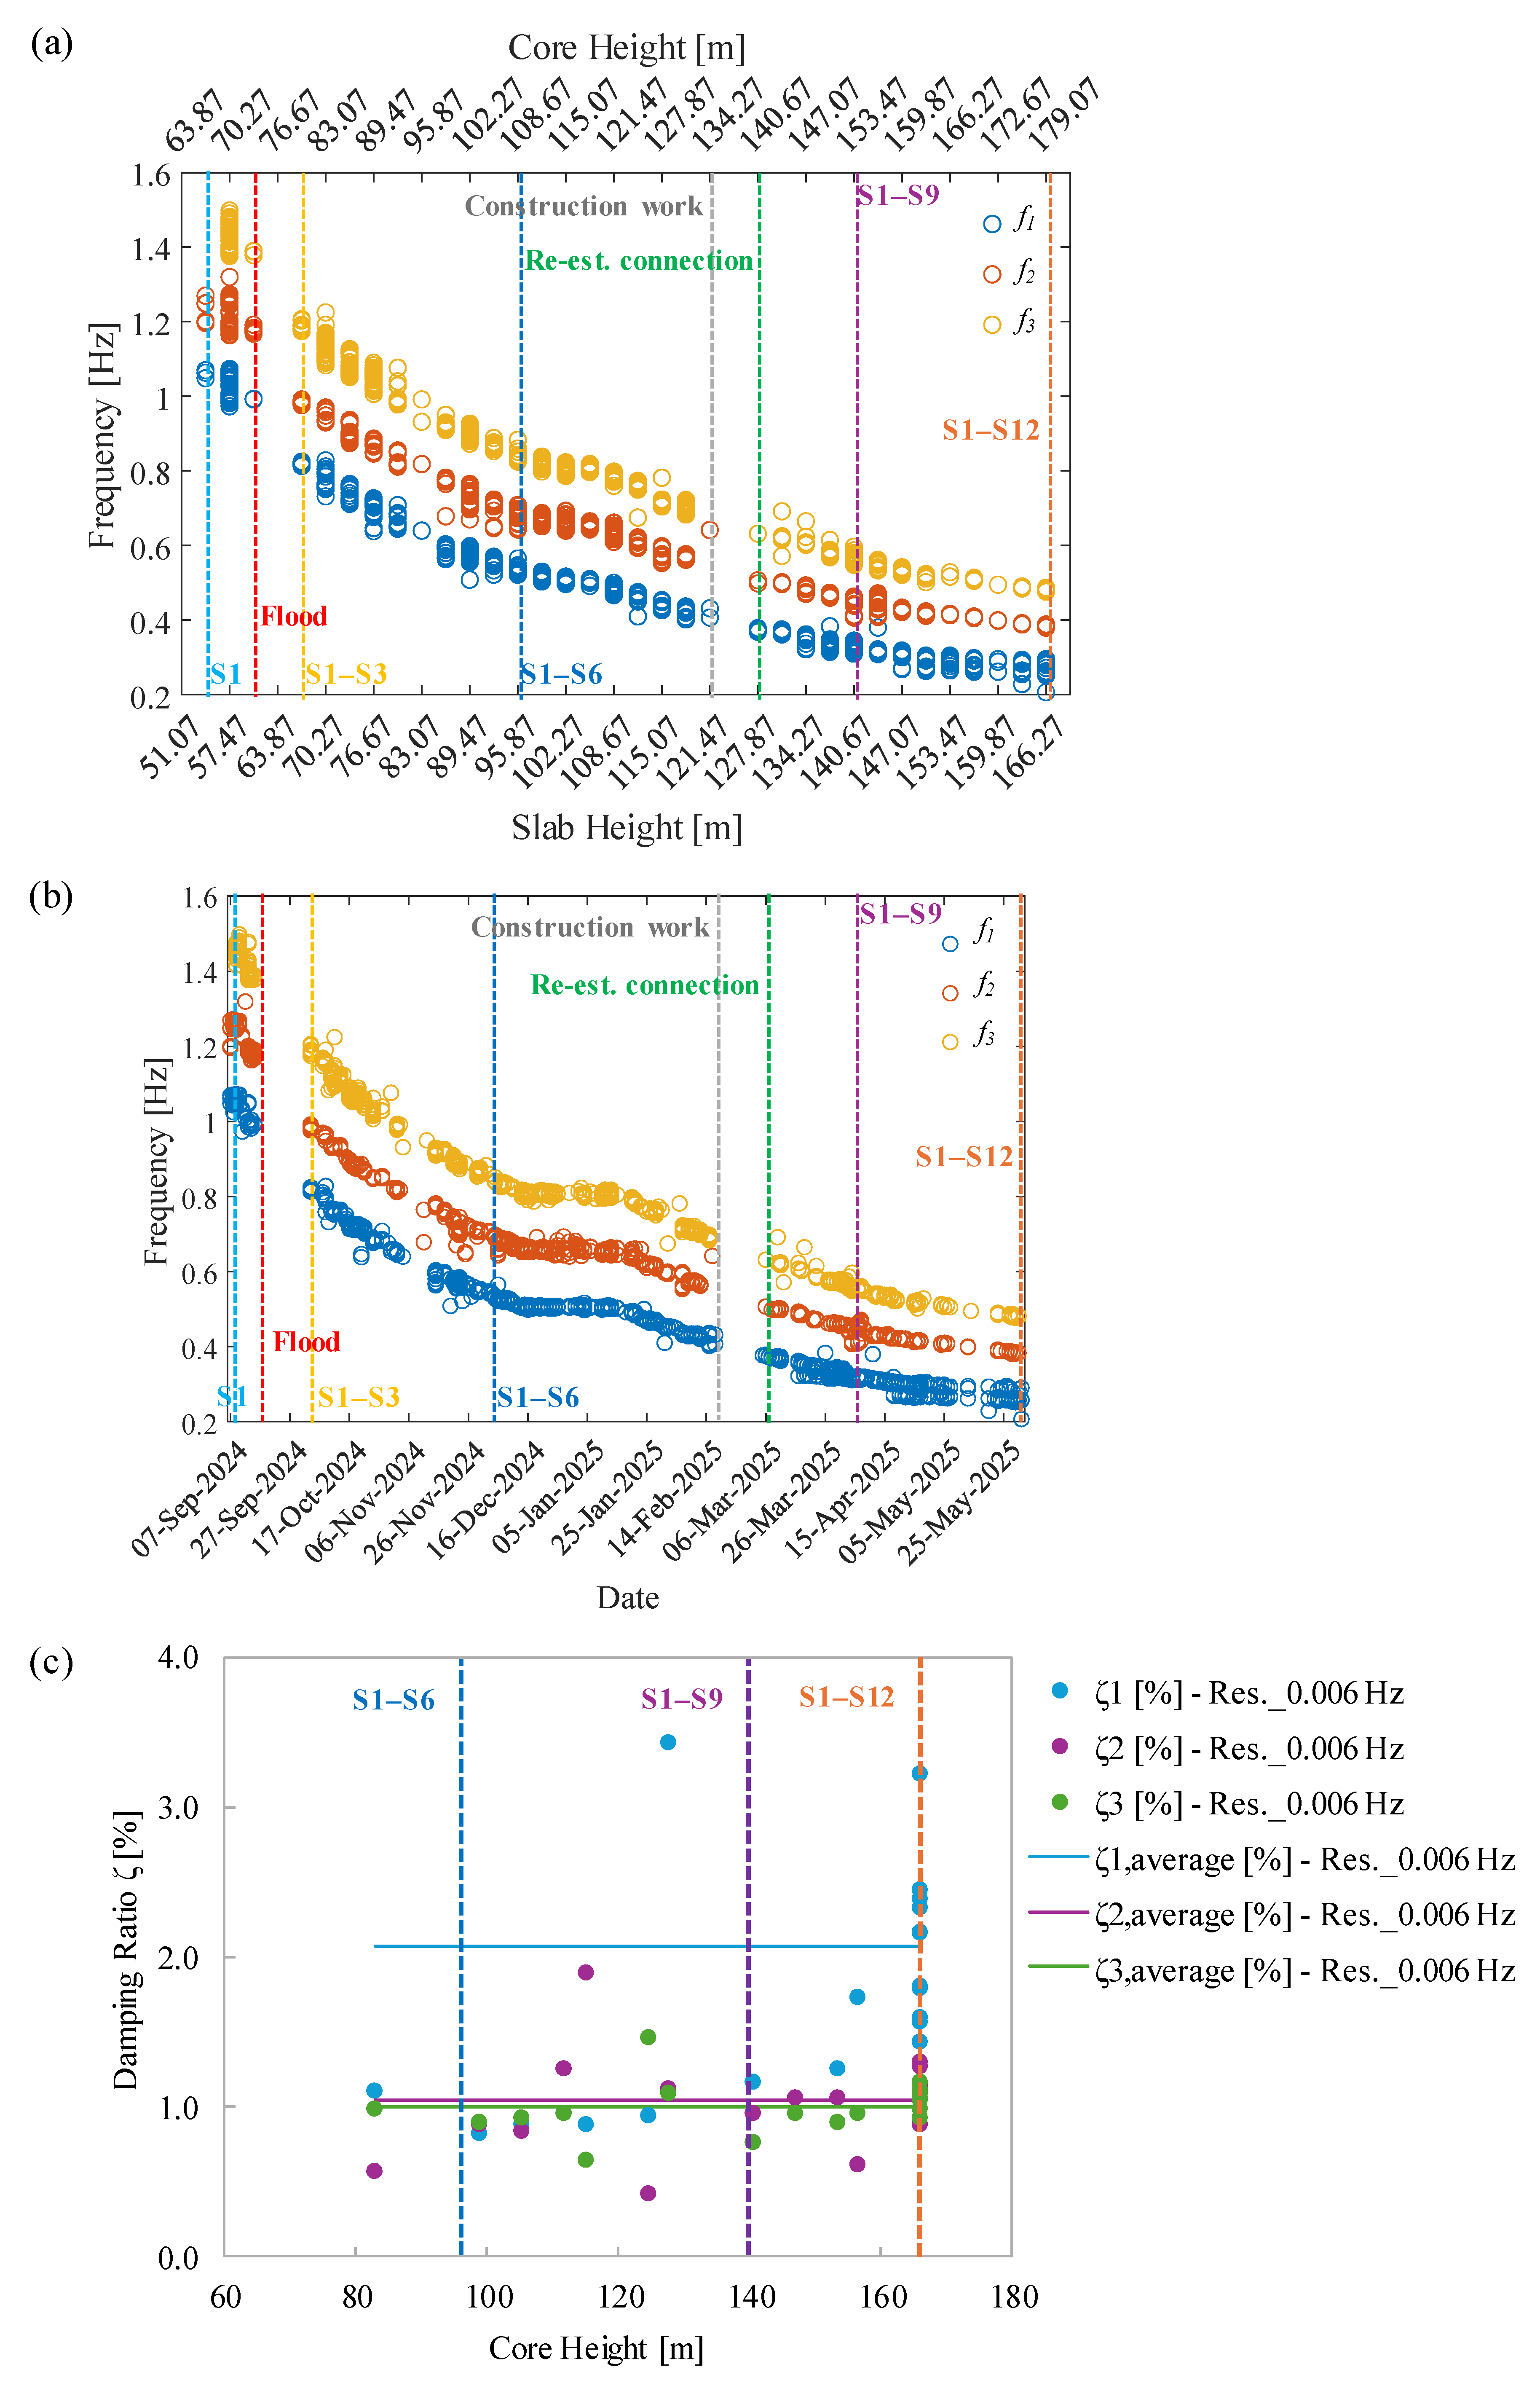
The spectra of the sensors installed during the construction progress (S1–S12) consistently showed peaks corresponding to the same natural frequencies f1, f2 and f3. However, the values of f1, f2 and f3 varied with the construction progress and were recorded in real time until the end of construction (Figure 8b). As expected, the frequencies decreased with the tower height (Figure 8a) and the construction progress (Figure 8b). During the construction stage, the tower core was consistently built ahead of the floor slabs using a climbing formwork (Figure 8a). At the beginning of the measurement, only f1 and f2 were recorded by sensor S1 (dashed light-blue line in Figure 8a), explained by the stronger inertia of the stiffening core in the Y-direction than in the X-direction (Figure 1). Due to the strong winds in Vienna a week before and during the severe flood, as recorded by the weather station (red dot in Figure 3a), f3 was also identified at quarter height of the DC2 Tower (16th floor), despite its near-rigid behaviour in the Y-direction. Missing data occurred due to the severe flood (dashed red line in Figure 8b), until the sensors were repaired (dashed yellow line in Figure 8b), and due to construction work (dashed grey line in Figure 8b), until the electrical connection was reestablished (dashed green line in Figure 8b).
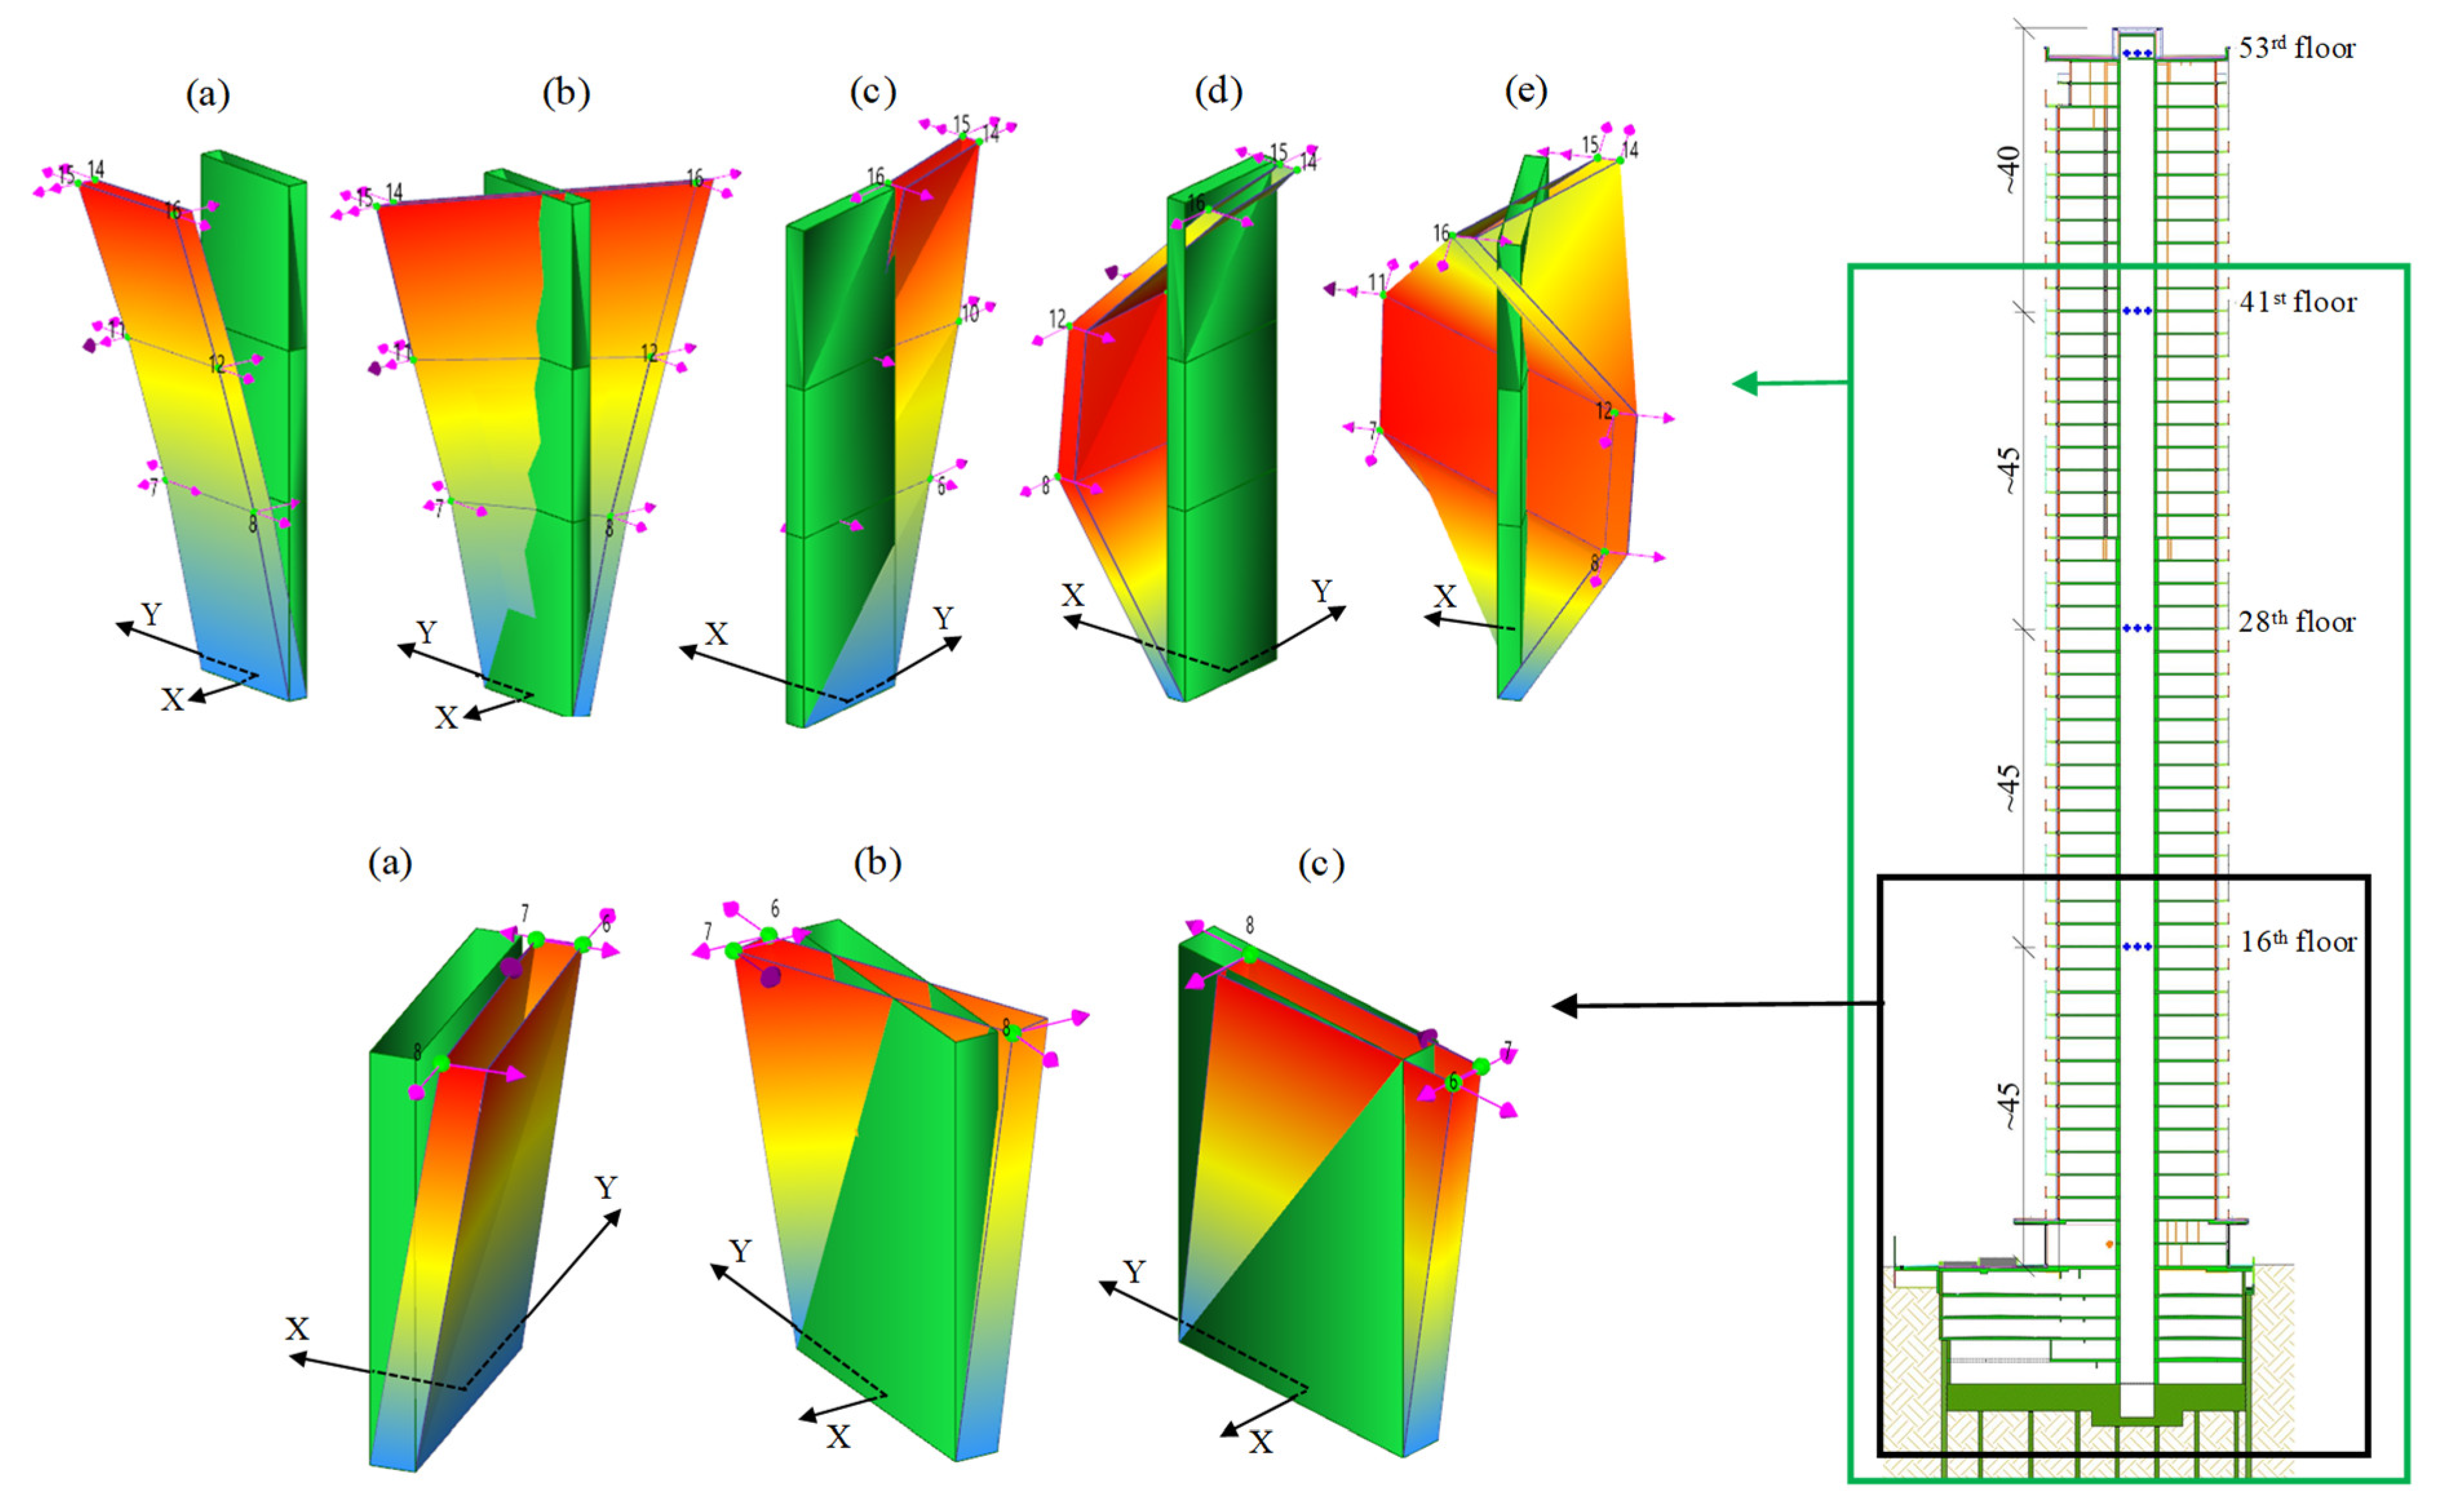
It was also possible to display the vibration modes in 3D view using an OMA-based digital twin of the DC2 Tower (Section 3.2). Figure 9 shows the first three vibration modes in 3D view (i.e., bending in the X-direction, torsion, and bending in the Y-direction) identified at quarter tower height, when only S1–S3 sensors were installed. The digital twin model grew alongside the construction progress, and the shapes of the first three modes remained practically unchanged (Figure 9). Additional vibration modes were identified later as more sensors were installed. Figure 9 shows the 3D vibration modes identified on 6 May 2025 at three-quarters of the tower height, with corresponding natural frequencies of f1 = 0.28 Hz, f2 = 0.41 Hz, f3 = 0.51 Hz, f4 = 1.22 Hz and f5 = 1.38 Hz. The natural frequencies identified at the end of the tower construction (i.e., final state of the DC2 Tower), based on the acceleration records of S1–S12 sensors on 31 May 2025, were f1 = 0.26 Hz, f2 = 0.39 Hz, f3 = 0.48 Hz, f4 = 1.15 Hz and f5 = 1.30 Hz. The 3D vibration modes observed in the final state were practically identical to those identified during the construction stage (Figure 9).
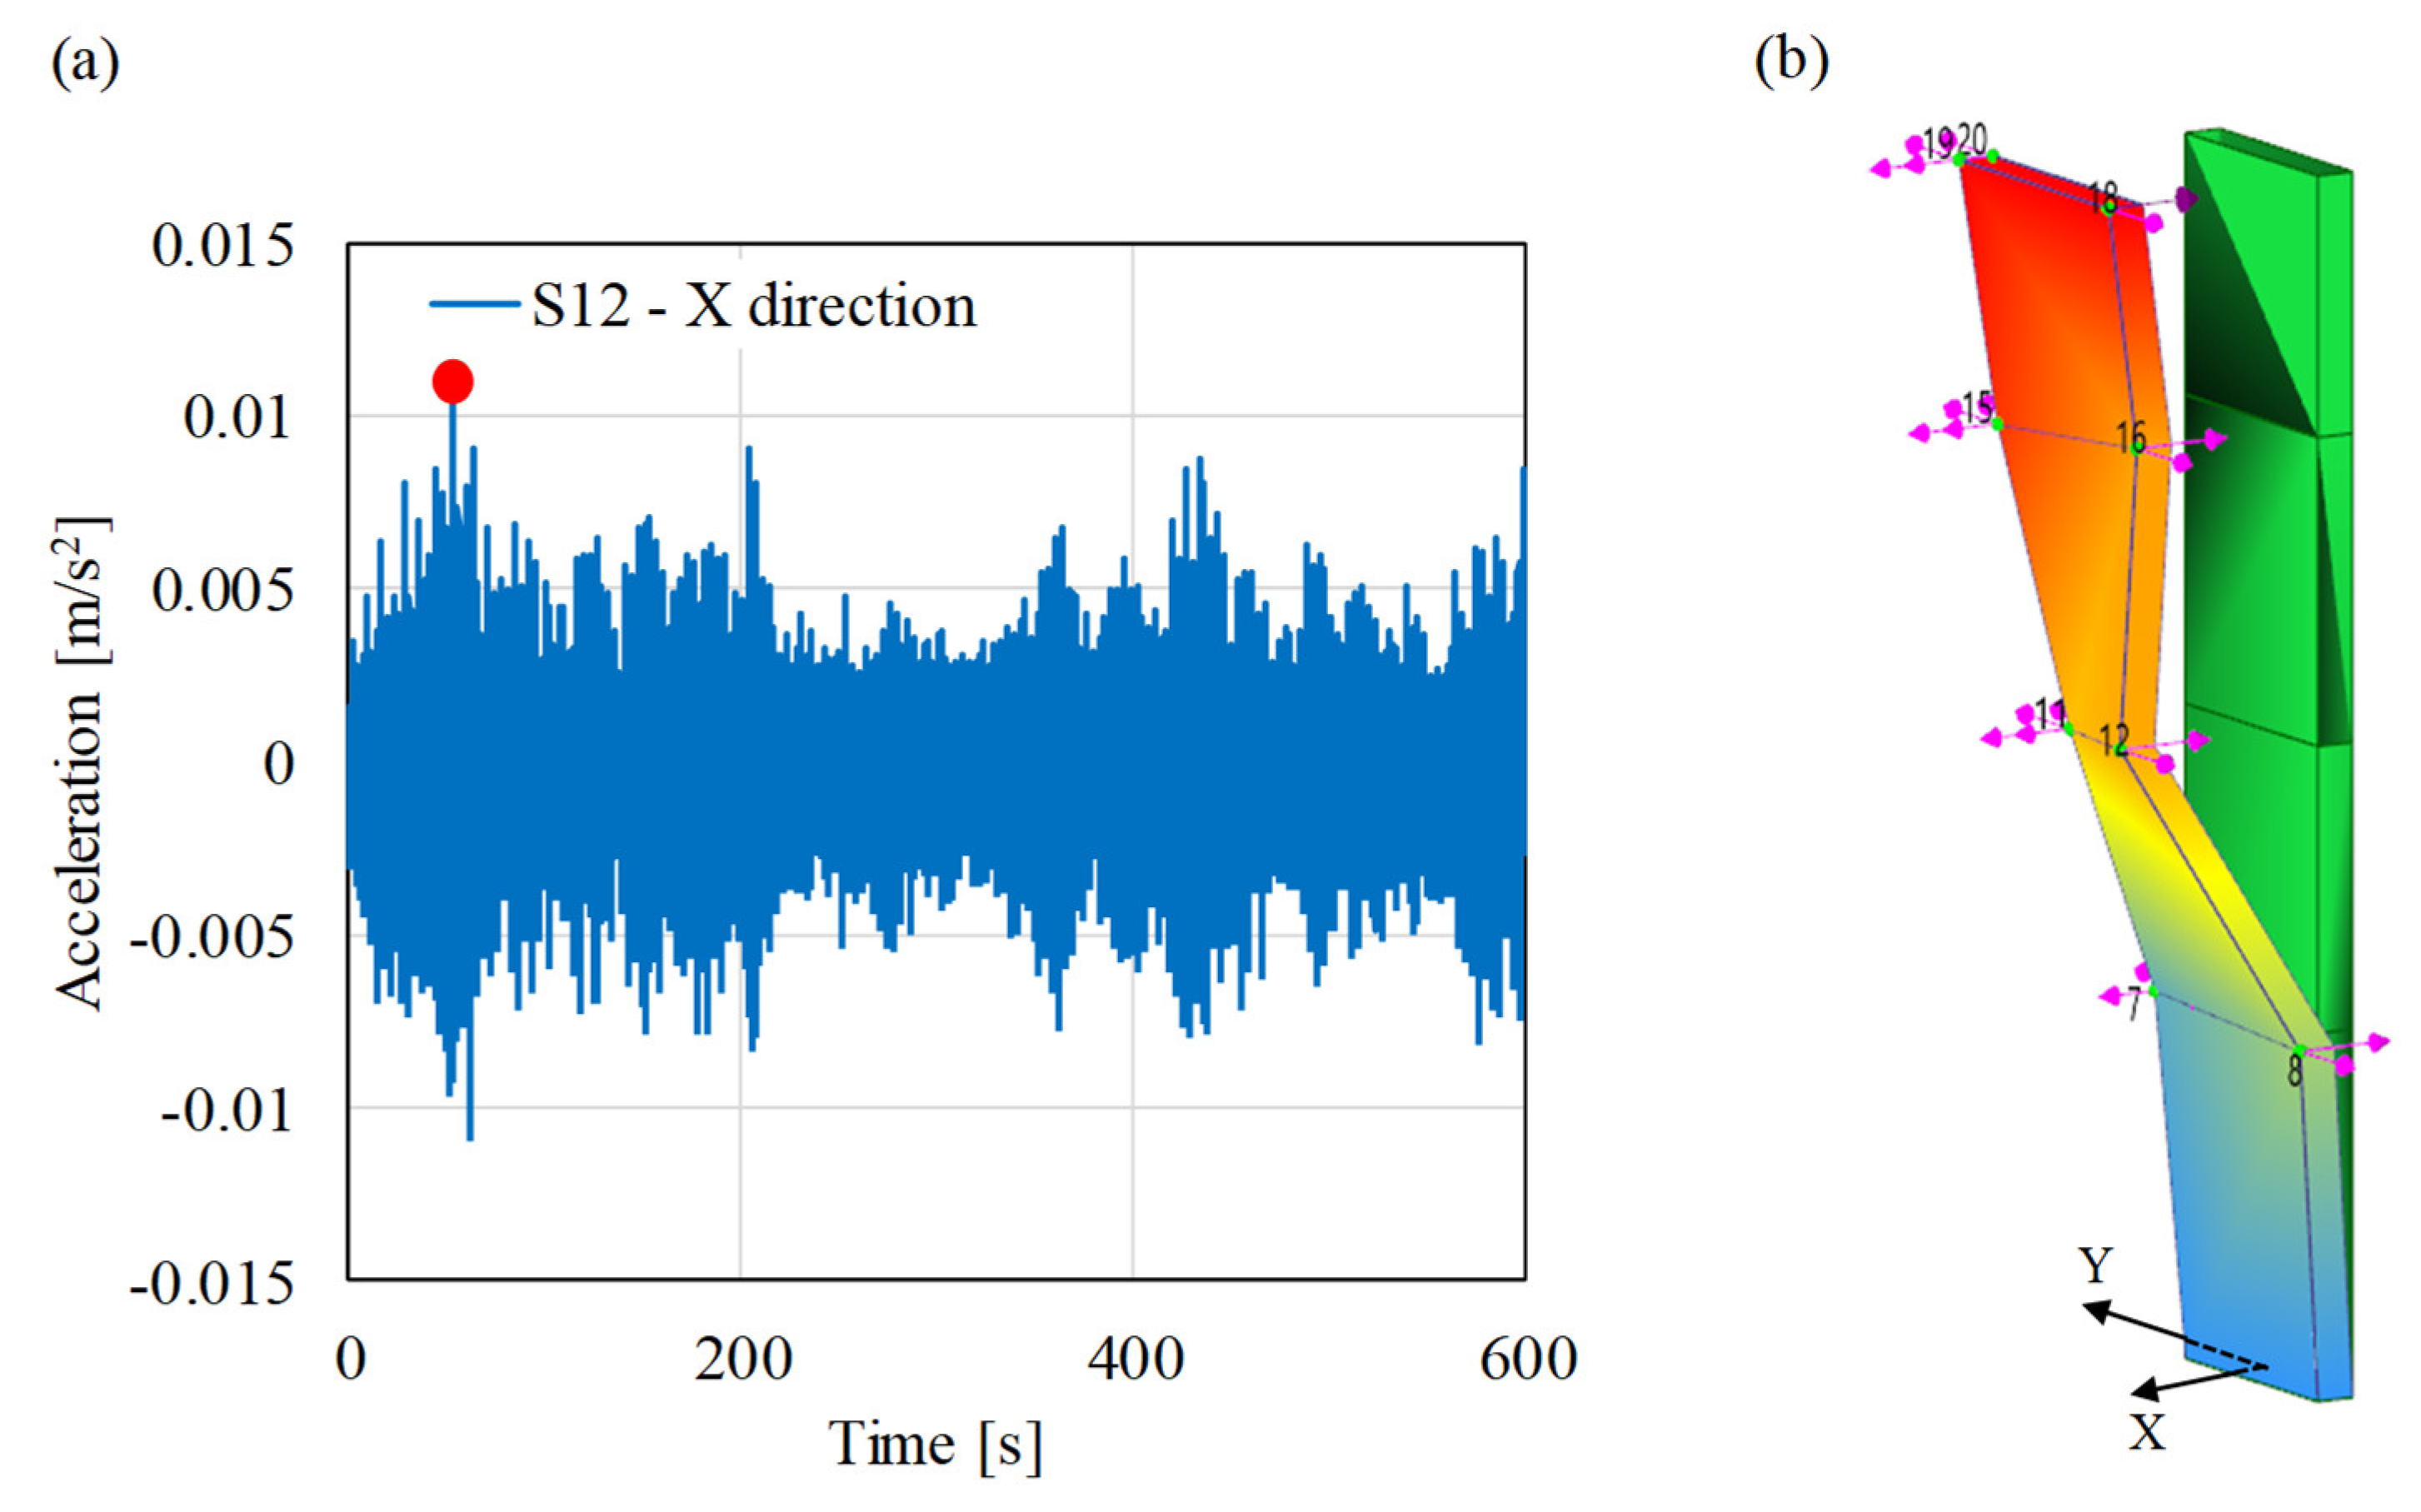
It is noted that, once the tower construction was completed, it was also possible to observe the actual top acceleration in the time domain, identify its maximum value and visualize the corresponding deflection in 3D using the digital twin model of the DC2 Tower. The tower deflection is regarded as a linear combination of its natural vibration modes. Since the X-axis was the critical weak direction of the tower core (Figure 1), the maximum top acceleration in X-direction was observed for a wind speed of 46.08 km/h, recorded on 25 June 2025 at 14:59. The maximum acceleration was recorded by the S12 sensor, with a value of 0.011m/s2 (Figure 10a), corresponding to 0.11% g. The tower deflection corresponding to this maximum top acceleration is shown in Figure 10b.
In addition to the natural frequencies and mode shapes, the modal damping ratio ζ was determined from the developed digital twin model of the DC2 Tower (Section 3.2). It was analyzed for the first three vibration modes of the tower (ζ1 for bending in the X-direction, ζ2 for torsion and ζ3 for bending in the Y-direction) throughout the construction progress (Figure 8c). The damping ratio results are sensitive to the frequency spectrum resolution; for this study, a resolution of 0.006 Hz was used, typically for assessing the dynamic behaviour of high-rise buildings [31]. The damping ratios ζ2 and ζ3 (torsion and bending in the Y-direction, respectively) showed dispersion around an average value of 1% throughout construction. The damping ratio ζ1 (bending in the X-direction) remained nearly constant up to 140 m. However, during the construction of the final quarter height, ζ1 increased significantly. In the final state of the DC2 Tower, ζ1 values were distributed around 2.1%, with the 95th percentile equal to 2.9%.

5. Discussion of the Results

The real-time monitoring coupled with the OMA-based digital twin proposed herein helped to bridge the gap between the design estimates and the actual dynamic parameters (i.e., natural frequencies, vibration modes and damping ratios) of the DC2 Tower. The results obtained during the different stages of construction (Section 4) helped to close this gap well before completion (or operability) and allowed for the prediction of the final actual natural frequencies of the DC2 Tower (Section 3.3). In the following, the actual values of the dynamic parameters (Section 4) are compared with the design estimates [26,27].
The identified 3D vibration mode shapes of the DC2 Tower (Figure 9) were as expected at the design stage. However, the natural frequencies corresponding to these modes were significantly higher in the proposed framework linking real-time monitoring and OMA-based digital twin than in the design stage (Figure 8a). In other words, the DC2 Tower was considerably stiffer than expected at the design stage. The expected frequencies when the height of the tower core was on the 21st floor, and the slabs were on the 17th floor of 53, were f1 = 0.67 Hz, f2 = 0.93 Hz and f3 = 1.04 Hz [26], which were 58%, 37% and 41% lower, respectively, than the values obtained via the proposed framework (Figure 8a). Consequently, the natural frequencies expected in the final state of the DC2 Tower (f1,d = 0.15 Hz, f2,d = 0.26 Hz and f3,d = 0.27 Hz, accounting for dead load and 30% of live load) were notably low [26].
Note that the difference between the values estimated at the design stage and the ones measured at the end of the construction arose from two factors: (i) the soil restraints, modelled as springs during design, were in reality stiffer than assumed, and the horizontally free basement levels were in reality fixed by anchors; and (ii) the concrete Young’s modulus increased during construction due to material ageing, continued hydration, and high vertical compressive stresses in the tower core, which produced confinement effects. In contrast, the design stage considered only the characteristic value of the concrete young modulus, leading to an underestimation of stiffness and thus lower natural frequencies.
The final stiffness expected from the static design thus overestimated the tower’s top acceleration, a crucial parameter for deciding on the installation of a passive TMD to mitigate wind-induced vibrations. With a 10-year return period, the top acceleration of the DC2 Tower was required not to exceed 1.5% g. The acceleration estimated at the design stage did, however, exceed this limit [27]. It was therefore decided to make a prognosis of the final actual natural frequencies of the DC2 Tower (Section 3.3), based on those identified when only sensors S1–S3 were installed at quarter tower height, with the core built to the 30th floor and the slabs to the 26th floor of 53 (Figure 8a).
The natural frequencies identified at the end of construction (Figure 8b), accounting only for the structural loads (f1,H = 0.26 Hz, f2,H = 0.39 Hz and f3,H = 0.48 Hz), closely matched the prognosis values (f1,prognosis = 0.25 Hz, f2,prognosis = 0.37 Hz and f3,prognosis = 0.47 Hz). Following the developed framework (Figure 2), the prognosis proved accurate in foreseeing the final natural frequencies (i.e., stiffness) of the tower. The predicted top acceleration of 1.11% g (Section 3.3), obtained from the predicted and verified natural frequencies in the final state, was therefore considered accurate and reliable. This prediction showed that the design value of top acceleration was reduced by 30% for the 10-year return period wind [29].
Although the predicted top acceleration was not directly compared with the value recorded in the final state of the tower for a wind speed of 46.08 km/h (Figure 10), the excellent agreement between the identified frequencies and the predicted values made it possible to affirm with high reliability that the DC2 Tower top acceleration induced by dynamic wind effects for a 10-year return period did not exceed the limit of 1.5% g required to ensure resident comfort in the upper-floor apartments. This finding justified the decision not to install a passive TMD in the DC2 Tower and led to a significant cost reduction of approximately €2 million.
It is noted that an alternative prediction method is regression analysis of the identified frequencies, which decrease with increasing tower height (Figure 8a). However, care must be taken in selecting the regression model, as its accuracy can vary significantly with the addition of new data during construction. The natural frequencies, for instance, decreased sharply up to half the tower height (dashed blue line in Figure 8a); after which the decrease became less steep (Figure 8a). Therefore, it is recommended that regression analysis be performed using the frequencies identified up to three-quarters of the tower height to obtain reliable results for the final state of the DC2 Tower.
At the design stage, the damping ratio of the DC2 Tower in its final state was assumed to depend on the wind return period (ζd = 1.4% for a 10-year wind and ζd = 1% for a 1-year wind). However, a single value was used for all vibration modes of the tower (Section 2). In contrast, the proposed framework (Figure 2), integrating real-time monitoring with the OMA-based digital twin, enabled the determination of damping ratios for individual vibration modes (Figure 5). At the end of construction, the damping ratios of the second (torsion) and third (bending in the Y-direction) modes matched the design value of 1% assumed for a 1-year wind (green and purple lines in Figure 8c). The damping ratio of the first mode (bending in the X-direction) was distributed around 2.1% (light-blue line in Figure 8c), with the 95th percentile equal to 2.9%, thus exceeding the design value for both 1- and 10-year winds and ensuring vibration levels lower than those estimated at the design stage.

6. Conclusions

A novel framework was developed to predict the actual natural frequencies (i.e., stiffness) of the tower in its final real state, based on monitoring data recorded when the tower had reached only one-quarter of its total height. Using real-time monitoring of the tower during construction, acceleration records were integrated into a 3D digital twin model that evolved in parallel with the building’s progress. Via OMA, the digital twin—which is distinct from a conventional FEM model—enabled the real-time determination of actual natural frequencies, damping ratios, and corresponding mode shapes. Due to the strategic sensor configuration, which was designed based on expected mode shapes, both bending and torsional vibration modes were reliably identified. The actual natural frequencies identified at quarter-tower height were used to predict the tower’s final-state dynamic parameters. Design engineers calibrated the initial FEM model to match the frequencies identified by the digital twin, using only the data from the first three sensors. This calibrated model was then extended to predict the frequency values for the complete DC2 Tower.
As expected, natural frequencies decreased as the tower height increased. Specifically, the first natural frequency (bending in the weak X-axis) was 1.06 Hz at the start of monitoring and 0.26 Hz in the final state. While the shapes of the first three vibration modes remained practically unchanged throughout construction, additional modes became identifiable from half-tower height onwards.
The predicted final-state frequencies showed excellent agreement with the data recorded upon completion, confirming that the structural stiffness in real estate was higher than initially estimated at the design stage. This predictive capability establishes a complete and high-utility engineering decision-making chain for supertall building construction. By utilizing real-time monitoring data from early construction phases to accurately calibrate the Finite Element Models (FEM), wind engineers can perform subsequent dynamic analyses with unprecedented confidence. In this study, this refined approach allowed for an accurate evaluation of the top acceleration, revealing that for a 10-year return period wind, acceleration was 30% lower than the initial design estimate. By providing early and reliable forecasting that the comfort criterion (<1.5% g) was successfully met, this comprehensive workflow mathematically justified the dismissal of a passive tuned mass damper (TMD) installation, resulting in significant savings in both cost and structural effort.
Finally, the framework enabled the determination of mode-specific damping ratios throughout the construction process. In the final state, damping values were distributed around average values of ζ1 = 2.1%, ζ2 = 1.0% and ζ3 = 1.0%. Notably, ζ1 (bending in the weak X-axis) was higher than its design value, further ensuring that vibration levels remain below the initial design estimates.

Author Contributions

Conceptualization, M.R. and H.W.M.; methodology, M.R. and H.W.M.; software, L.E.V.M.; validation, H.W.M. and L.E.V.M.; formal analysis, L.E.V.M.; investigation, L.E.V.M.; resources, H.W.M.; data curation, L.E.V.M.; writing—original draft preparation, L.E.V.M.; writing—review and editing, M.R. and H.W.M.; visualization, L.E.V.M.; supervision, M.R. and H.W.M.; project administration, M.R. and H.W.M.; funding acquisition, M.R. and H.W.M. All authors have read and agreed to the published version of the manuscript.

Funding

This research received no external funding.

Data Availability Statement

The data supporting the findings of this study are available upon request from the authors. The data are hosted on a private platform (https://data.revotec.at/comapp/DC_Tower; accessed on 20 May 2026) which requires login credentials to ensure the security of concurrent projects hosted on the same server and to maintain a record of data access.

Acknowledgments

This research was financially supported by the Technology Management and Innovation Department of PORR Bau GmbH (Christian Rauch, head), whose support is gratefully acknowledged. The authors also acknowledge the TU Wien Bibliothek for financial support through its Open Access Funding Programme, thereby promoting international accessibility of Austrian research. Special thanks are also extended to the colleagues involved in on-site installation and supervision from PORR Bau GmbH and REVOTEC zt gmbh.

Conflicts of Interest

Author Luz Elizabeth Vasquez Munoz was employed by the company REVOTEC zt gmbh. Author Herbert Wolfgang Müllner was employed by the company PORR Bau GmbH. The remaining author declares that the research was conducted in the absence of any commercial or financial relationships that could be construed as a potential conflict of interest.

References

  1. AlBalkhy, W.; Karmaoui, D.; Ducoulombier, L.; Lafhaj, Z.; Linner, T. Digital twins in the built environment: Definition, applications, and challenges. Autom. Constr. 2024, 162, 105368. [Google Scholar] [CrossRef]
  2. Chen, S.; Zheng, Y.; Wang, F.; Cai, E.; Zhang, Y.; Liu, H.; Qu, Z. Computer vision-based reliability analysis in digital twinning for structural dynamic safety assessment. Eng. Struct. 2025, 326, 119532. [Google Scholar] [CrossRef]
  3. Winkler, J.; Hendy, C. Improved Structural Health Monitoring of London’s Docklands Light Railway Bridges Using Digital Image Correlation. Struct. Eng. Int. 2017, 27, 435–440. [Google Scholar] [CrossRef]
  4. Shao, Y.; Miao, C.; Chen, Z.; Zhuang, M.L.; Sun, C.; Zhu, H.; Zhang, Y. Damage-Sensitive Feature for Long-Span Steel Box-Girder Suspension Bridges Under Service Loads Based on Long-Term Monitoring. Struct. Eng. Int. 2024, 35, 383–390. [Google Scholar] [CrossRef]
  5. As-Saadi, O.K.; Sun, Z.; Evans, K.; Moutinho, C.; Inglis, T.; Caetano, E. Suspender Tension Evaluation Integrating Detailed Model and Vibration Testing: Insights from the Menai Suspension Bridge. Struct. Eng. Int. 2025, 1–14. [Google Scholar] [CrossRef]
  6. Mordini, A.; Savov, K.; Wenzel, H. The Finite Element Model Updating: A Powerful Tool for Structural Health Monitoring. Struct. Eng. Int. 2007, 17, 352–358. [Google Scholar] [CrossRef]
  7. Anjuna, S.; Radhakrishnan, N.; George, G. Establishment of a Real-time Vibration Monitoring System on Cauvery Bridge in India. Struct. Eng. Int. 2025, 1–14. [Google Scholar] [CrossRef]
  8. Shao, H.; Lu, W.; Zheng, W.; Hu, W.; Teng, J.; Lui, E.M. Multi-scale digital twin for a high-rise structure combining ANN and monitoring data. In Proceedings of the International Conference on Structural Health Monitoring of Intelligent Infrastructure, Graz, Austria, 1–5 September 2025. [Google Scholar]
  9. Jirawattanasomkul, T.; Hang, L.; Srivaranun, S.; Likitlersuang, S.; Jongvivatsakul, P.; Yodsudjai, W.; Thammarak, P. Digital twin-based structural health monitoring and measurements of dynamic characteristics in balanced cantilever bridge. Resilient Cities Struct. 2025, 4, 48–66. [Google Scholar] [CrossRef]
  10. Jiang, F.; Ma, L.; Broyd, T.; Chen, K. Digital twin and its implementations in the civil engineering sector. Autom. Constr. 2021, 130, 103838. [Google Scholar] [CrossRef]
  11. Lu, R.; Brilakis, I. Digital twinning of existing reinforced concrete bridges from labelled point clusters. Autom. Constr. 2019, 105, 102837. [Google Scholar] [CrossRef]
  12. Ghaffari, A.; Shahbazi, Y.; Mokhtari Kashavar, M.; Fotouhi, M.; Pedrammehr, S. Advanced Predictive Structural Health Monitoring in High-Rise Buildings Using Recurrent Neural Networks. Buildings 2024, 14, 3261. [Google Scholar] [CrossRef]
  13. Real, J.; Cabezas, R.; Alandí, G.; Rubio, L. Integrated Structural Health Monitoring and Digital Twin Calibration for Predictive Maintenance of Existing Bridges. e-J. Nondestruct. Test. 2026, 31, 1–12. [Google Scholar] [CrossRef] [PubMed]
  14. Shoag, M.D.; Zaman, S.U. AI-Driven Structural Health Monitoring for Early Detection of Fatigue-Induced Failures in High-Rise Buildings. Res. Sq. 2025; preprint. [CrossRef]
  15. Quesada-Olmo, N.; Jimenez-Martinez, M.J.; Farjas-Abadia, M. Real-time high-rise building monitoring system using global navigation satellite system technology. Measurement 2018, 123, 115–124. [Google Scholar] [CrossRef]
  16. Zhang, F.L.; Xiong, H.B.; Shi, W.X.; Ou, X. Structural health monitoring of Shanghai Tower during different stages using a Bayesian approach. Struct. Control Health Monit. 2016, 23, 1366–1384. [Google Scholar] [CrossRef]
  17. Zhang, F.-L.; Yang, Y.-P.; Xiong, H.-B.; Yang, J.-H.; Yu, Z. Structural health monitoring of a 250-m super-tall building and operational modal analysis using the fast Bayesian FFT method. Struct. Control Health Monit. 2019, 26, e2383. [Google Scholar] [CrossRef]
  18. Brincker, R.; Zhang, L.; Andersen, P. Modal identification from ambient responses using frequency domain decomposition. In Proceedings of the International Modal Analysis Conference (IMAC), San Antonio, TX, USA, 7–10 February 2000. [Google Scholar]
  19. Zhang, L.; Tamura, Y.; Yoshida, A.; Cho, K.; Nakata, S.; Naito, S. Ambient vibration testing and modal identification of an office building. In Proceedings of the International Modal Analysis Conference (IMAC), Los Angeles, CA, USA, 2–5 February 2002. [Google Scholar]
  20. Structural Vibration Solutions. Artemis Modal, version 8.0.1.1; Structural Vibration Solutions: Aalborg, Denmark, 2024.
  21. Lam, H.F.; Hu, J.; Adeagbo, M.O. Bayesian model updating of a 20-story office building utilizing operational modal analysis results. Adv. Struct. Eng. 2019, 22, 3385–3394. [Google Scholar] [CrossRef]
  22. Müllner, H.W.; Kremnitzer, P. Consideration of long-term material behaviour on numerical design of concrete skyscrapers by means of in situ measurements. In Proceedings of the Central European Congress on Concrete Engineering, Zakopane, Poland, 13–14 September 2022. [Google Scholar]
  23. Müllner, H.W.; Steiner, A. Hochhaus Q-Tower—Gelebte Innovation. In Proceedings of the Baukongress, Vienna, Austria, 25–26 April 2024. [Google Scholar]
  24. GmeinerΙHaferl. Statische Berechnung—Projekt DC Tower 2; GmeinerΙHaferl: Vienna, Austria, 2020. [Google Scholar]
  25. Wacker Ingenieure. Donau City—Tower 2 (DC2). Windgutachten: Ermittlung der Bemessungswindlasten für das Hochhaus Inklusive Untersuchung der Dynamischen Windlasten und der Beschleunigungen. Entwurfsphase; Wacker Ingenieure: Vienna, Austria, 2019. [Google Scholar]
  26. Munoz, L.E.V.; Müllner, H.W.; Rauch, C.; Reiterer, M. Real-time Monitoring Coupled with Digital Twin Model for Vibration Analysis of DC2-Tower. In Proceedings of the D-A-CH Tagung Erdbebeningenieurwesen und Baudynamik, Vienna, Austria, 18–19 September 2025. [Google Scholar]
  27. Munoz, L.E.V.; Müllner, H.W.; Reiterer, M. Vibration Monitoring Eliminates the Need for a Tuned Mass Damper in Vienna’s DC Tower 2 Building. In Proceedings of the DEWESOFT Measurement Conference, Laško, Slovenia, 21–23 April 2026. [Google Scholar]
  28. Lufft. WS700-UMB; Lufft: Fellbach, Germany, 2022. [Google Scholar]
  29. Wacker Ingenieure. Donau City—Tower 2 (DC2). Windgutachten: Ermittlung der Bemessungswindlasten für das Hochhaus Inklusive Untersuchung der Dynamischen Windlasten und der Beschleunigungen. Bauphase; Wacker Ingenieure: Vienna, Austria, 2024. [Google Scholar]
  30. REVOTEC ZT GmbH. Revo-Visual; REVOTEC ZT GmbH: Vienna, Austria, 2024. [Google Scholar]
  31. Brownjohn, J.M.W.; Pan, T.-C. SHM of a Tall Building. In Encyclopaedia of Structural Health Monitoring; John Wiley & Sons: New York, NY, USA, 2009. [Google Scholar] [CrossRef]
Figure 1. Location of the installed acceleration sensors (blue crosses) and the control cabinet (orange crosses) in planar view. The control cabinet is on the ground floor. Accelerometers S1–S3 are on the 16th floor, S4–S6 on the 28th floor, S7–S9 on the 41st floor and S10–S12 on the 53rd floor [24,25].
Applsci 16 05139 g001
Figure 2. Flowchart of the developed framework to early predict the actual natural frequencies of the DC2 Tower: (a) FEM model at the design stage, (b,e) FEM model updating to the current construction stage (i.e., quarter tower height, H/4); (c,d) real-time monitoring data coupled with OMA-based digital twin to be used for the FEM model updating; (f) extension of updated FEM model to the total height (H) to predict the final natural frequencies; (g) validation of the prediction with the frequencies recorded at the end of the construction.
Applsci 16 05139 g002
Figure 3. Maximum wind speed recorded over 1 min during the DC2 Tower construction. Note that ‘inst.’ stands for ‘installation’ (a); and DC2 Tower vibration accelerations recorded by S1 sensor over 10 min on 15 September 2024 (during the severe flood in Vienna) (b) [24,25].
Applsci 16 05139 g003
Figure 4. Digital twin model of the DC2 Tower in its final state, showing sensors S1–S12 (a); and schematic representation for determining the auto- and cross-power spectral densities (b). Sensors s1, s2 and s3 record the cantilever vibrations. Si,j is the spectrum obtained for the i-th segment and j-th sensor.
Applsci 16 05139 g004
Figure 5. Digital twin-identified vibration modes at ¼ tower height (a): bending in the X-direction (a), torsion (b), and bending in the Y-direction (c).
Applsci 16 05139 g005
Figure 6. Identified damping ratio ζ2,H/4 and natural frequency f2,H/4, derived from the SDOF correlation function (a) of the second torsional mode at ¼ height of the DC2 Tower, obtained from the natural logarithm of the decaying curve (b) and the zero-crossing line (c), respectively.
Applsci 16 05139 g006
Figure 7. Natural frequencies f1, f2 and f3 of the DC2 Tower identified from the spectra of 10 min night records of the S1 sensor on 15 September 2024 (a) [24,25]; and of the S1–S3 sensors on 17 October 2024 (b) [24].
Applsci 16 05139 g007
Figure 8. Natural frequencies f1, f2 and f3 of the DC2 Tower identified in relation to core and slab height (a) and construction progress (b) [24,25]; and damping ratios ζ1, ζ2 and ζ3 of the DC2 Tower. (c) Bending in the X-direction (ζ1), torsion (ζ2) and bending in the Y-direction (ζ3). ‘Res.’ indicates ‘Resolution’.
Applsci 16 05139 g008
Figure 9. Vibration modes of the DC2 Tower identified at ¼ and ¾ tower height: bending in the X-direction (a), torsion (b), bending in the Y-direction (c), higher-order bending in the X-direction (d) and higher-order torsion (e).
Applsci 16 05139 g009
Figure 10. Maximum top acceleration of the DC2 Tower in the X-direction recorded by sensor S12 on 25 June 2025 at 14:59 (red dot in 10 min record (a)) and the corresponding tower deflection (b) [24,25].
Applsci 16 05139 g010
Table 1. Comparison between the predicted values and measured values of the natural frequencies at different tower states until the end of construction.
Date 1Predicted f1, f2, f3 [Hz]Measured f1, f2, f3 [Hz]
22 November 20240.55, 0.70, 0.900.58, 0.76, 0.89
7 January 20250.48, 0.63, 0.810.52, 0.65, 0.80
10 February 20250.39, 0.53, 0.690.44, 0.57, 0.72
12 March 20250.34, 0.47, 0.610.37, 0.50, 0.62
31 May 20250.25, 0.37, 0.470.26, 0.39, 0.48
1 A representative subset of dates was selected for clarity and visualization purposes.
Disclaimer/Publisher’s Note: The statements, opinions and data contained in all publications are solely those of the individual author(s) and contributor(s) and not of MDPI and/or the editor(s). MDPI and/or the editor(s) disclaim responsibility for any injury to people or property resulting from any ideas, methods, instructions or products referred to in the content.