Article

Experimental and Numerical Study on Dynamic Response of High-Pier Ballastless Continuous Beam Bridge in Mountainous Area

by
Wenshuo Liu
*,
Qiong Luo
,
Gonglian Dai
and
Xin Tang
School of Civil Engineering, Central South University, Changsha 410075, China
*
Author to whom correspondence should be addressed.
Appl. Sci. 2025, 15(8), 4341; https://doi.org/10.3390/app15084341
Submission received: 15 February 2025 / Revised: 18 March 2025 / Accepted: 25 March 2025 / Published: 15 April 2025

Abstract

:
The dynamic performance of a ballastless track on bridges affects the vibration performance of the vehicle–bridge coupling system, which, in turn, will affect safety, the smoothness of operating trains, and passenger comfort. However, in the existing literature, few studies focus on the coupled vibration response analysis of large-span continuous beam bridges for high-speed railways, especially high-pier bridges. Dynamic response tests with multiple measurement points installed on the rail, concrete slab, and bridge deck are conducted. This study investigates the dynamic characteristics of bridges with high piers under train loads. A dynamic system is built by the co-simulation platform of SIMPACK v9 and ANSYS v2022, consisting of several models, a coupling mechanism, etc. The vibration response of a train passing through the bridge at 300 km/h is analyzed, and the influence of operating speed on the motivation performance of the coupled system is further studied. The results indicate that the simulation results are validated against experimental data, showing good agreement; the train–track–continuous beam bridge coupling system meets the specification limits and has some margins for further optimization with an operating speed of 300 km/h. The refined model of train–rail–bridge coupling vibration established in this paper provides theoretical guidance for the design and application of high-speed railways.

1. Introduction

With the continuous improvement in comprehensive national power, the construction layout of China’s high-speed railway (HSR) is becoming more and more complete. In order to save land and protect the environment around the railway lines, HSR mostly adopts the form of bridges instead of roads. In order to cross valleys and rivers, HSR adopts a large number of high-pier bridges as support structures of their lines during the design and construction process. The dynamic performance of the ballastless track will affect the dynamic response of the bridge, which will affect safety, and thus the smoothness of operating trains correspondingly. Moreover, the height of the pier affects the dynamic response indices of the train. Ensuring the safety of HSR bridges is a growing concern [1,2,3]. Meanwhile, finding a way to swiftly and precisely estimate structural deformation and dynamic response is critical for railway safety assessment, especially in bridge engineering, which accounts for the highest proportion of HSR infrastructure [4,5]. Vehicles traveling through the bridge, due to the weight of the vehicle itself and the vibration of the driving process, will have an impact on the bridge and thus the bridge’s structure by the impact of the role played by vibration. When the vibration amplitude and frequency of the bridge reach a certain limit, this affects the durability of the bridge structure and can even lead to the destruction of the bridge structure due to fatigue, resulting in casualties and property damage. When vehicles are on the bridge at the same time, the bridge road surface can become uneven, and the inherent vibration of the bridge itself will also exacerbate the vibration of the vehicle; this interaction between the vehicle and the bridge, mutual influence, is called the train–track–bridge coupled (TTBC) system by many researchers [6,7]. Therefore, understanding the coupled vibration of TTBC systems is of great value for the safe and smooth operation of HSR.
However, the existing literature on vehicle–bridge coupled vibration research predominantly focuses on the coupled vibration response analysis of simply supported beam bridges [8,9,10], with fewer studies addressing large-span continuous beam bridges for high-speed railways. To ensure the safe operation of these large-span continuous beam bridges in HSR, it is necessary to study the vehicle–bridge coupled vibration of such structures.
Experts and scholars have been exploring the dynamics of vehicle–bridge interactions for a long time. Since Timoshenko, many researchers have contributed to the study of vehicle–bridge dynamic responses [11,12]. In the 1970s, Chu K.H. et al. [13,14] regarded the vehicle–bridge system as a three-dimensional system, establishing spatial computational models that have had a significant impact on subsequent research. In 2003, Xia [15] conducted a dynamic test on the Antoing Bridge between Paris and Brussels, obtaining natural vibration characteristics such as frequency, mode shapes, and damping of multi-span 50 m prestressed concrete simply supported through beams, as well as the dynamic deflection of the bridge, vertical accelerations of beams and piers, and relative displacements of bearings. In 2005, Lee et al. [16] presented a detailed study of axle coupling dynamics and proposed a comprehensive axle coupling model for a wide range of bridge structures. Yang et al. [17] found that for the response of the bridge and the vehicle, it can be confirmed that a fairly accurate solution can be obtained by considering only the first mode. In 2013, Liu et al. [18] conducted dynamic tests and theoretical calculations on HSR with a design speed of 200–250 km/h, finding that 24 m simply supported beams have a third-order super-harmonic resonance speed of 230.7 km/h, while 32 m simply supported box beams have a second-order super-harmonic resonance speed of 263.4 km/h. In the same year, Yang et al. [19] conducted dynamic tests and theoretical calculations on HSR with a design speed of 300–350 km/h, finding that 32 m simply supported beams have a second-order super-harmonic resonance speed of 306.0 km/h, while 40 m simply supported box beams have a second-order super-harmonic resonance speed of 263.7 km/h. In 2015, Meng et al. [20] conducted dynamic characteristic tests on the Dashengguan Yangtze River Bridge to test the derailment coefficient, wheel weight reduction rate, axle transverse force, and rail displacement of a large-span bridge under the action of HSR. In 2019, Li et al. [21] established a multi-cross-section and multi-structure monitoring system to carry out the dynamic response test of the ballast track–bridge structure and to study the dynamic response law of each structural layer of the ballast track–bridge and the coordinated deformation characteristics of the track structure and the bridge deck under different traveling speeds.
This paper presents a dynamic response test on the Jianxi high-pier continuous beam bridge in Nanping, investigating the dynamic characteristics and working features of high-pier bridges under train loads. Based on SIMPACK v9 and ANSYS v2022, a vehicle–bridge coupled vibration analysis model is established to analyze the response characteristics of both trains and bridges during train passage, and the effects of train speed and pier height on the vehicle–bridge coupled vibration response are studied. This study aims to provide a basis for the optimization of bridge design and a guideline for the construction plan of high-pier ballastless bridges in mountainous areas.

2. Project Summary

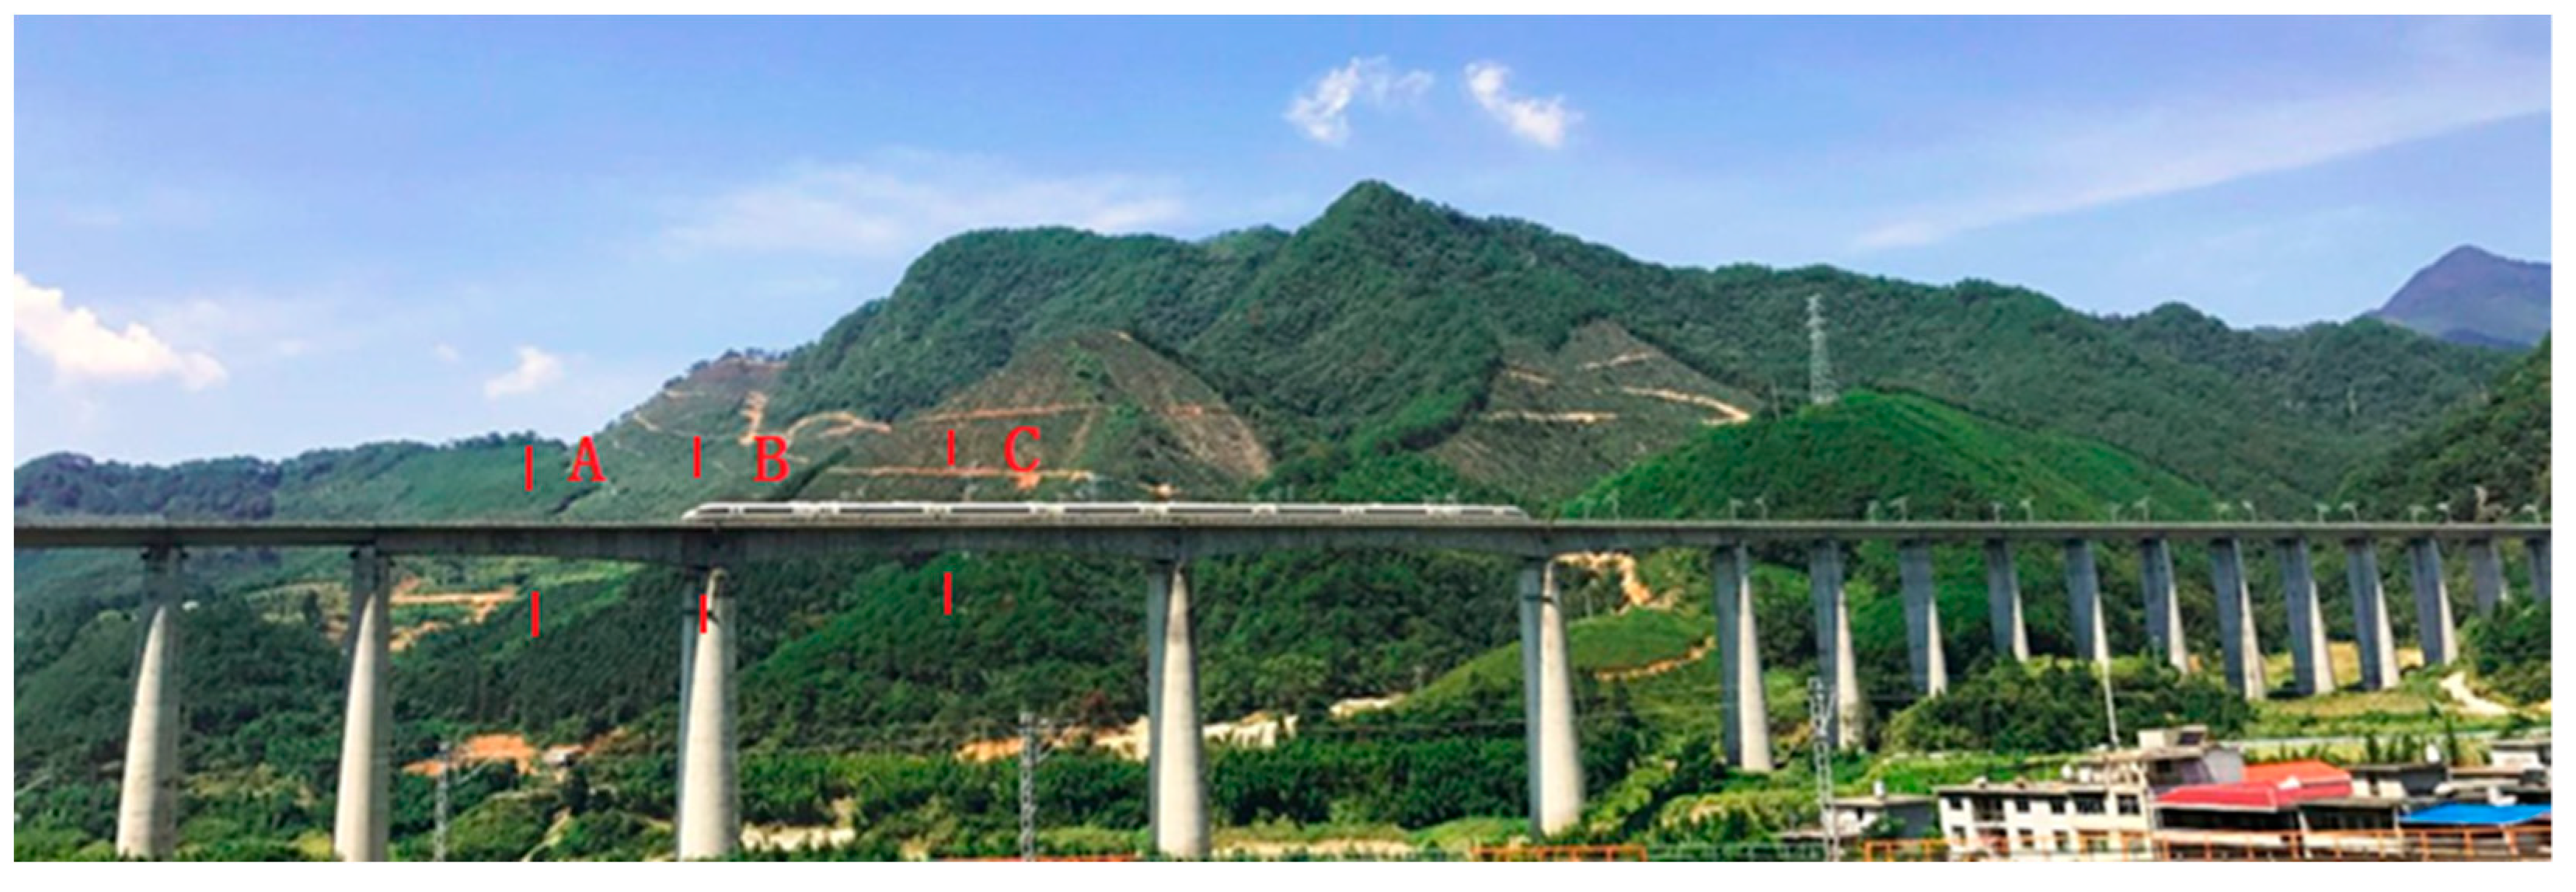
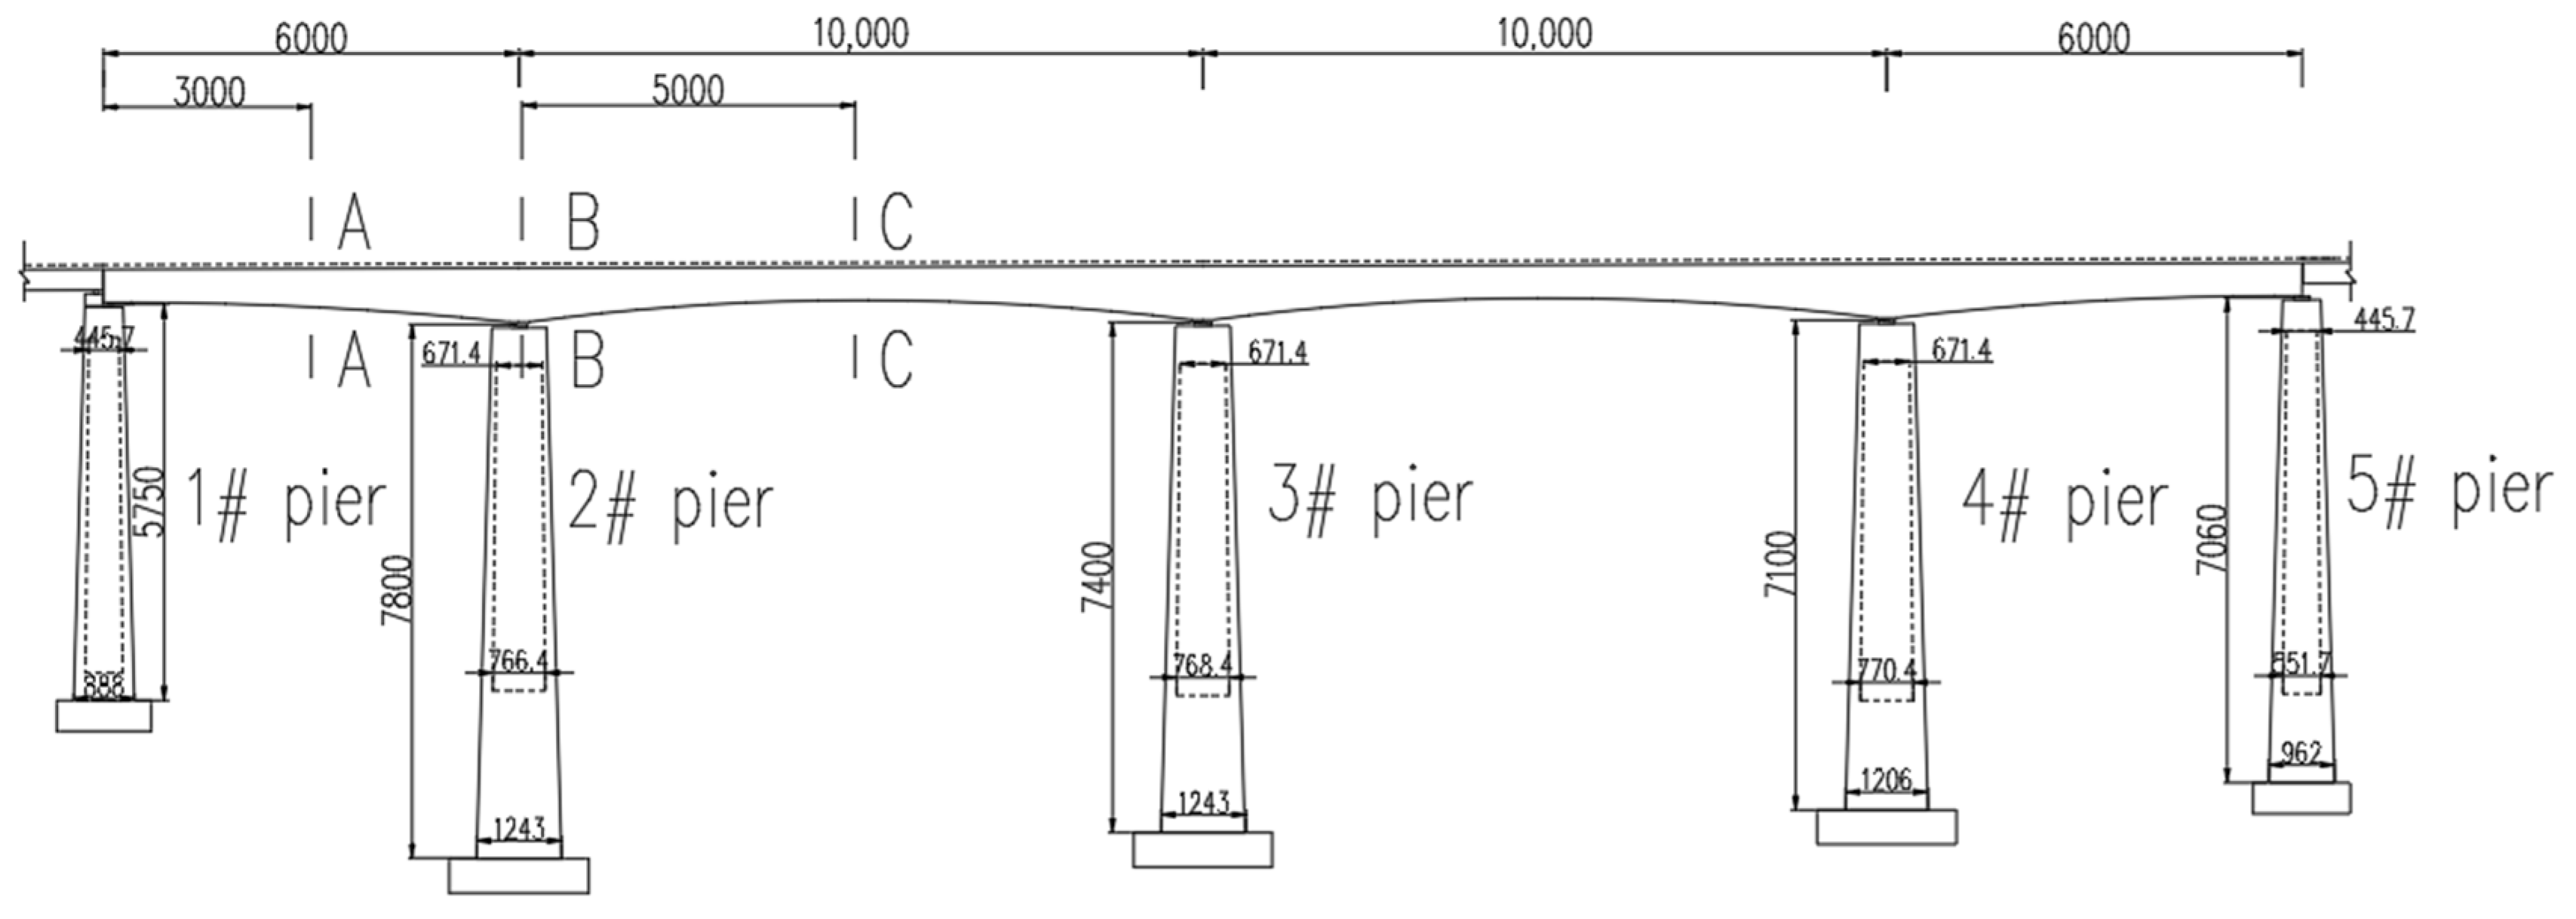
2.1. Jianxi Bridge in Nanping City

Nanping Jianxi Bridge, situated in the Yanping District of Nanping City, Fujian Province, is an HSR standard continuous beam bridge with a total length of 320 m (60 + 2 × 100 + 60 m) (see Figure 1). To better accommodate the diverse requirements of large-span bridge projects, the design incorporates a variable cross-section, featuring a single box and single chamber structure. The top slab of the girder measures 12.6 m in width, while the bottom width of the box girder is 6.7 m. The thickness of the top plate is 40 cm, except for a thickness of 65 cm near the ends of the girder. The thickness of the bottom plate varies from 40 to 100 cm, following a linear gradient, and the thickness of the web plate ranges from 48 to 60 cm and from 60 to 90 cm, depending on the folding line changes.
The height of the beam at the center pivot point is 6 m. The height of the beam at the 10 m straight section in the middle of the span and at the 15.75 m straight section in the side span is 3.85 m. Additionally, the bottom edge of the beam follows a quadratic parabolic curve.
The girder is constructed using C50 concrete, with a Poisson’s ratio of 0.2. The bridge is supported by rectangular thin-walled piers measuring 57.5 m, 78 m, 74 m, 71 m, and 70.5 m, made from C30 concrete, which also has a Poisson’s ratio of 0.3. The longitudinal and transverse prestressing strands consist of 1x7-15.2-1860-GB/T5224-2003 [22] prestressing strands, featuring a standard strength of 1860 MPa and a modulus of elasticity of Ey = 1.95 × 10⁵ MPa. For vertical and lateral prestressing, 25 high-strength fine-rolled rebars with a standard strength of 785 MPa are utilized.
The bridge is constructed with CRTS I ballastless track, featuring two parallel train lines. The test train model utilized is the CRH380A-001. Each carriage consists of two frames and four pairs of wheels, arranged in the configuration of one driving car, six trailers, and one additional driving car, with a wheelbase of 2.5 m.

2.2. Measurement Setup

The Jianxi Bridge was selected as the test bridge, the 60 m span midspan section is defined as Section A, the 60 m span and 100 m span connected pier section is defined as Section B, and the 100 m span midspan section is defined as Section C, as illustrated in Figure 2. The measurement points of each section were arranged at the rail, concrete slab, and bridge deck, as shown in Figure 3. The arrangement of the measurement points was consistent in Sections A and C.

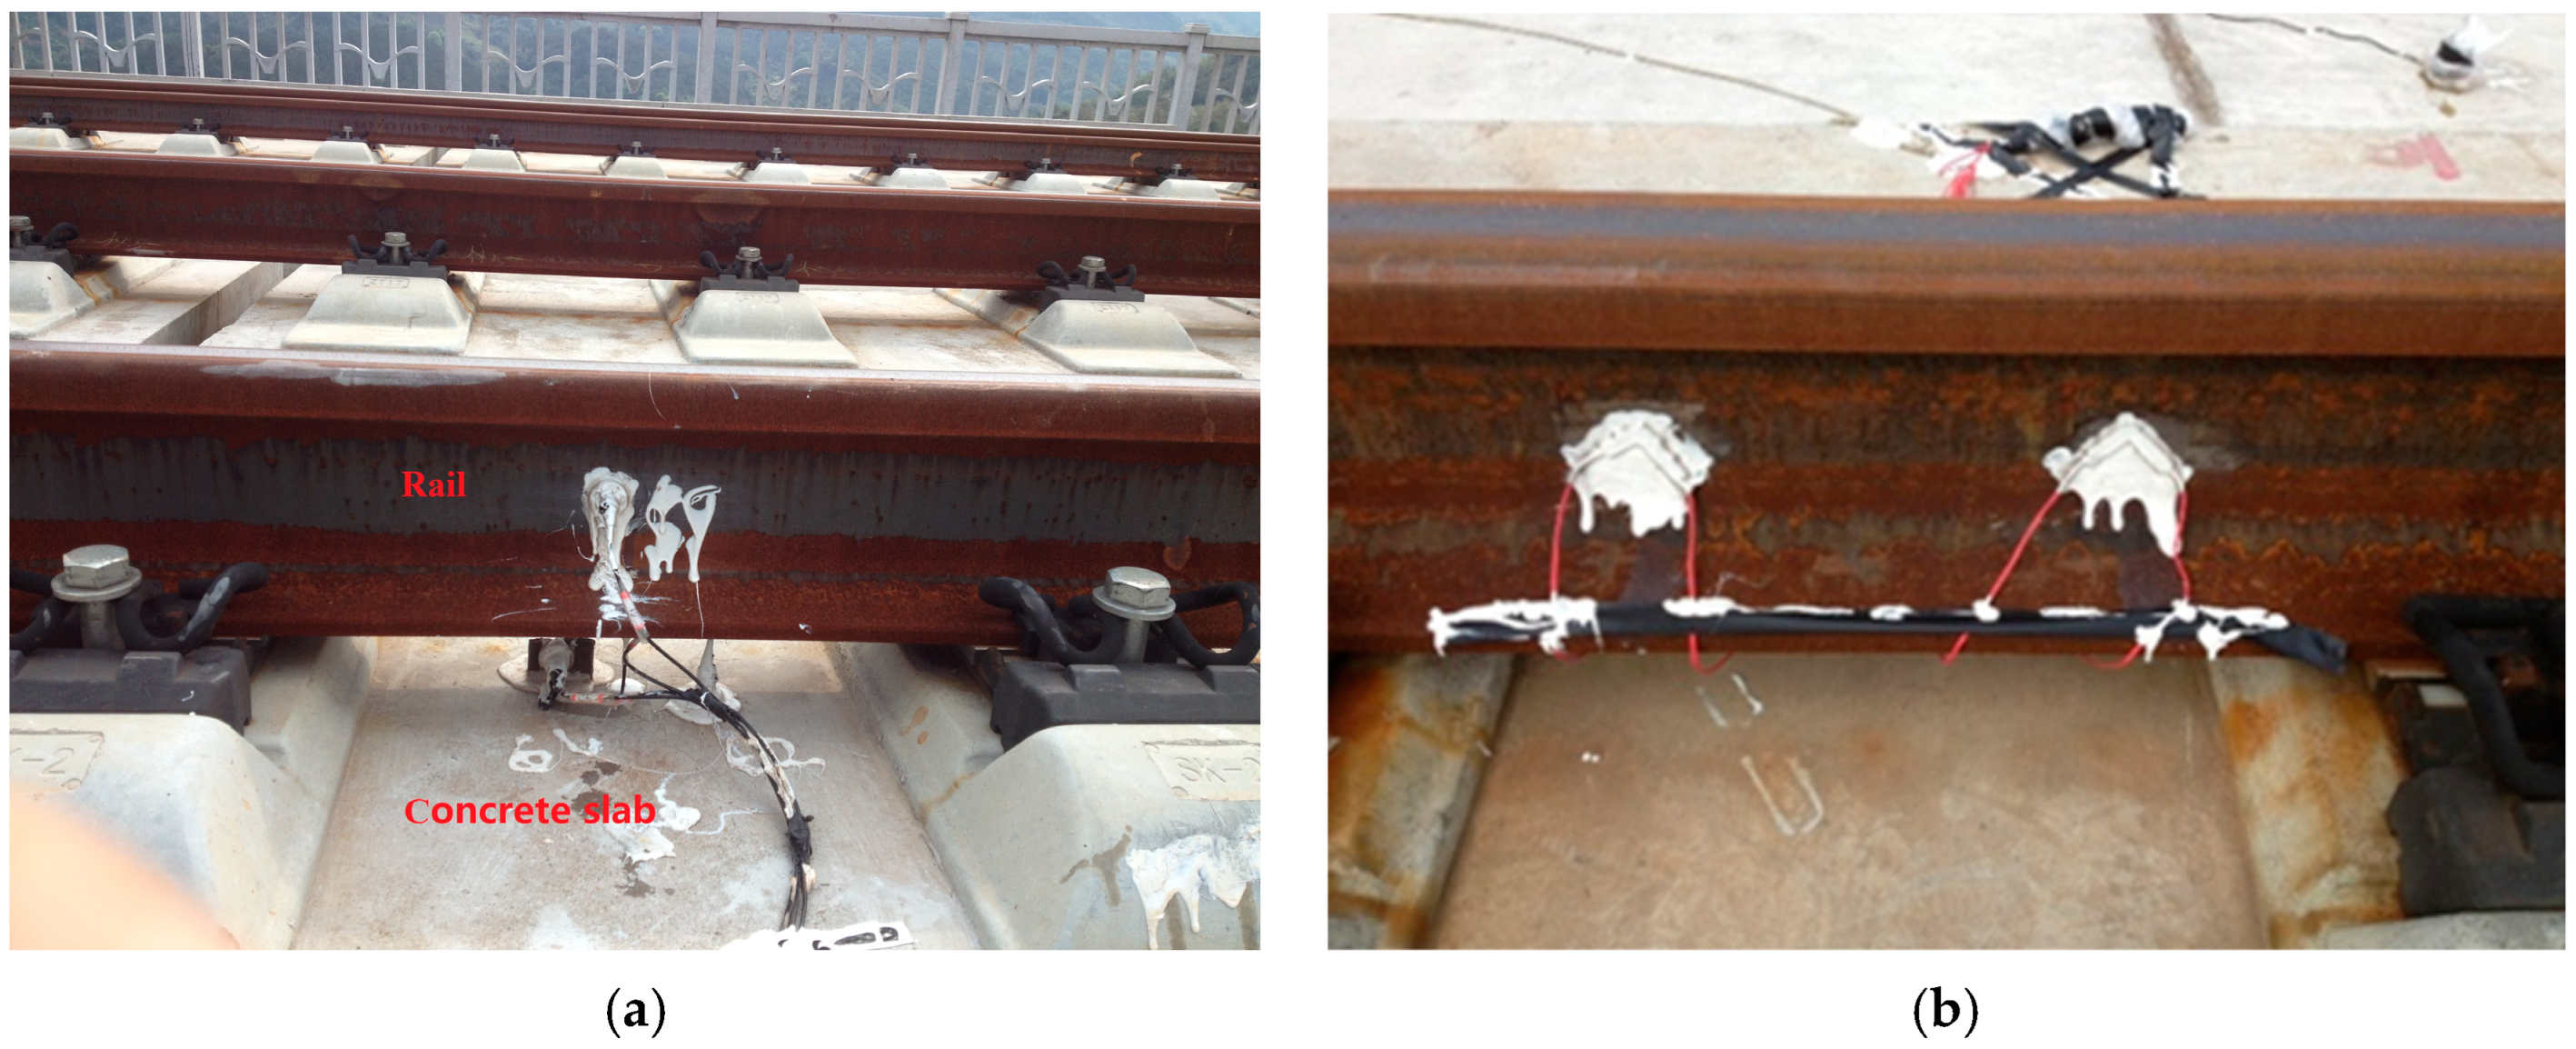
2.3. Instrumentation

The on-site test was conducted using a networked portable dynamic data synchronization acquisition system developed by the Beijing Oriental Institute of Vibration and Noise Technology for data acquisition (see Figure 4). Multiple points of measurement, remote, and wireless synchronous data acquisition and transmission could be achieved through the General Packet Radio Service (GPRS). Specific test equipment and components are listed in Table 1. All from China except for strain gauges (made in Japan). Part of the measurement point layout of the actual photo see Figure 4 and Figure 5.

3. On-Site Test Results and Analysis

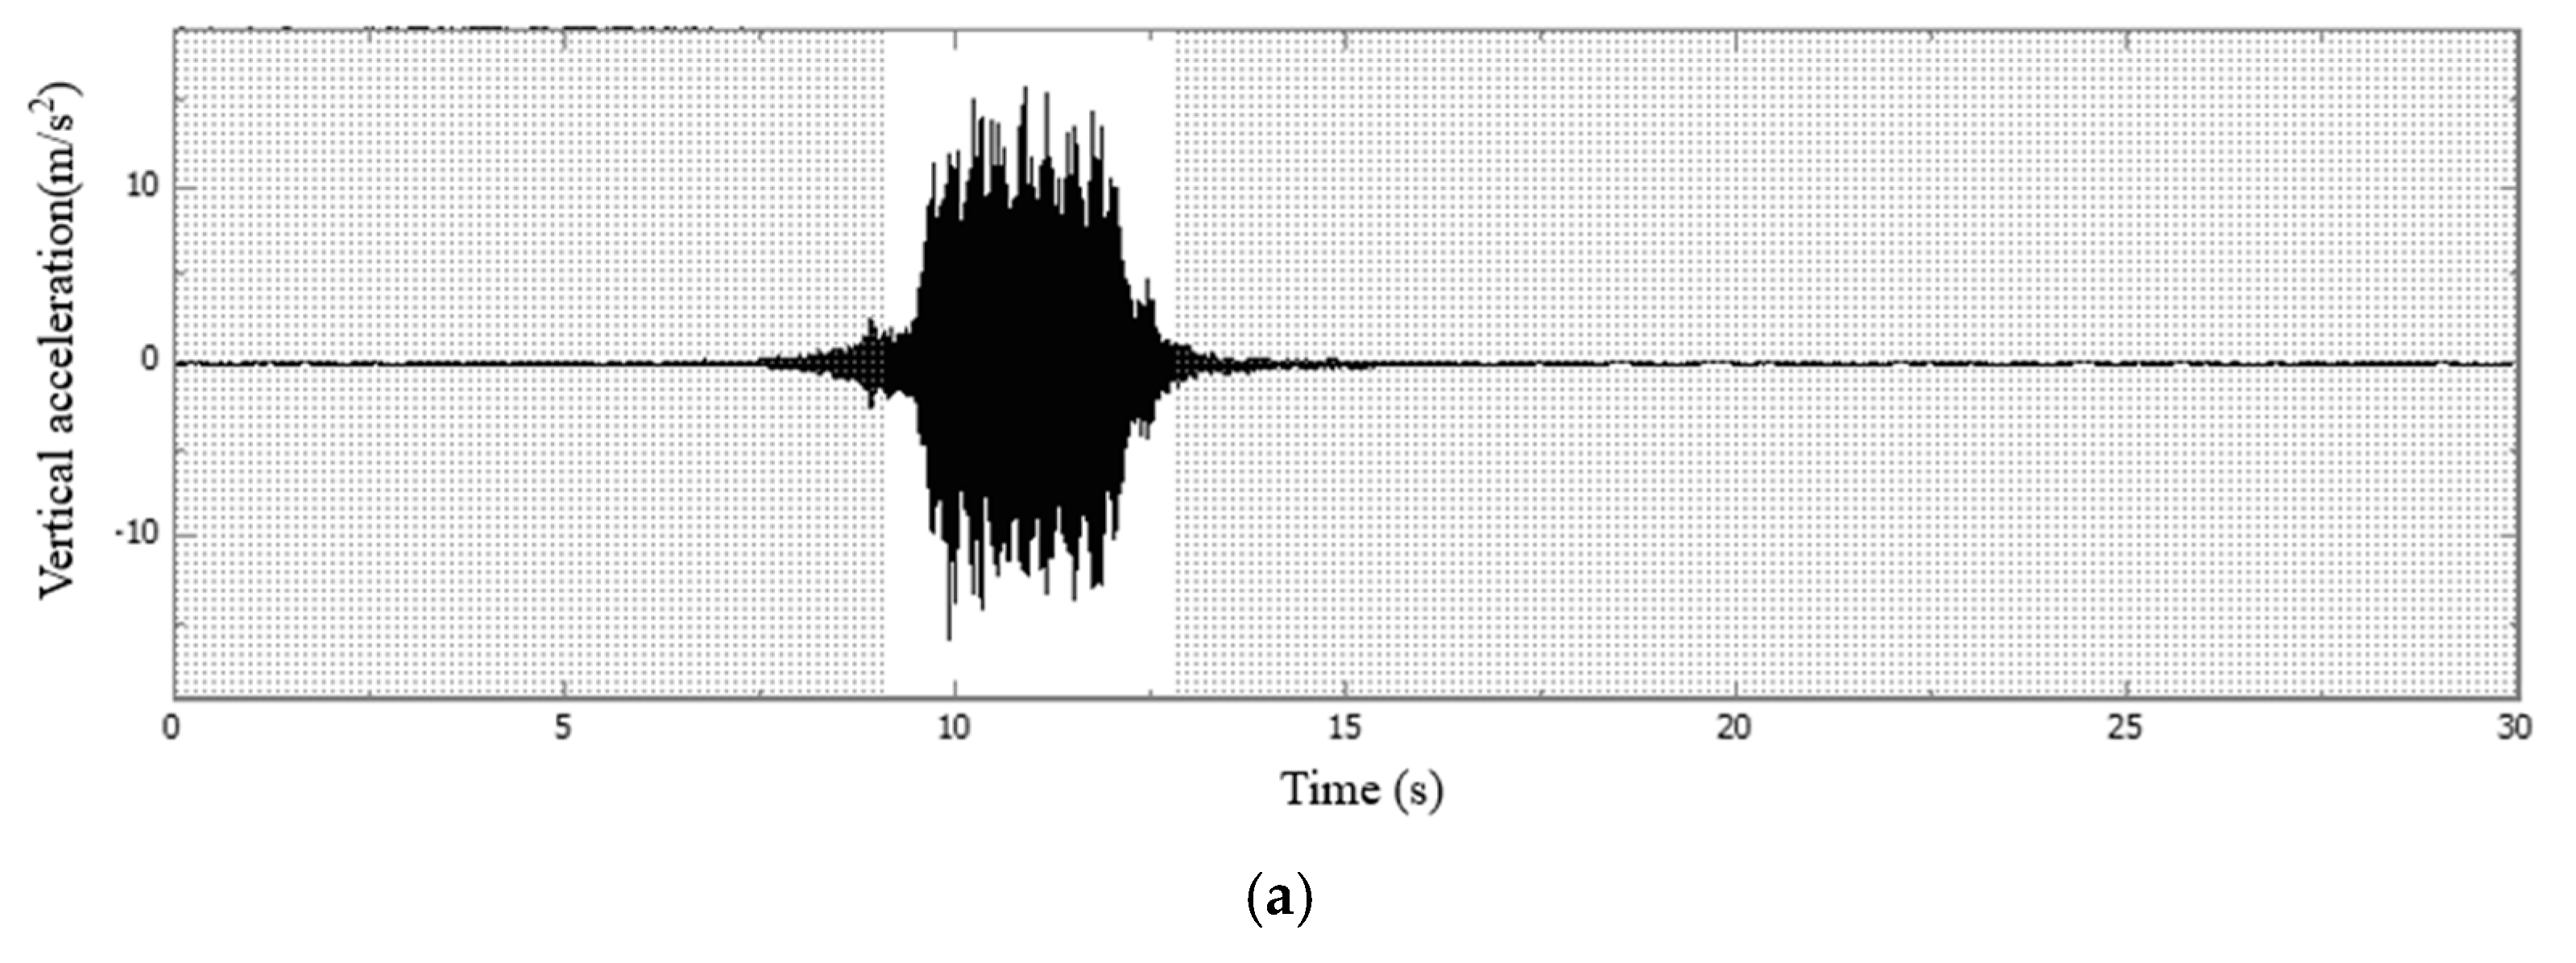
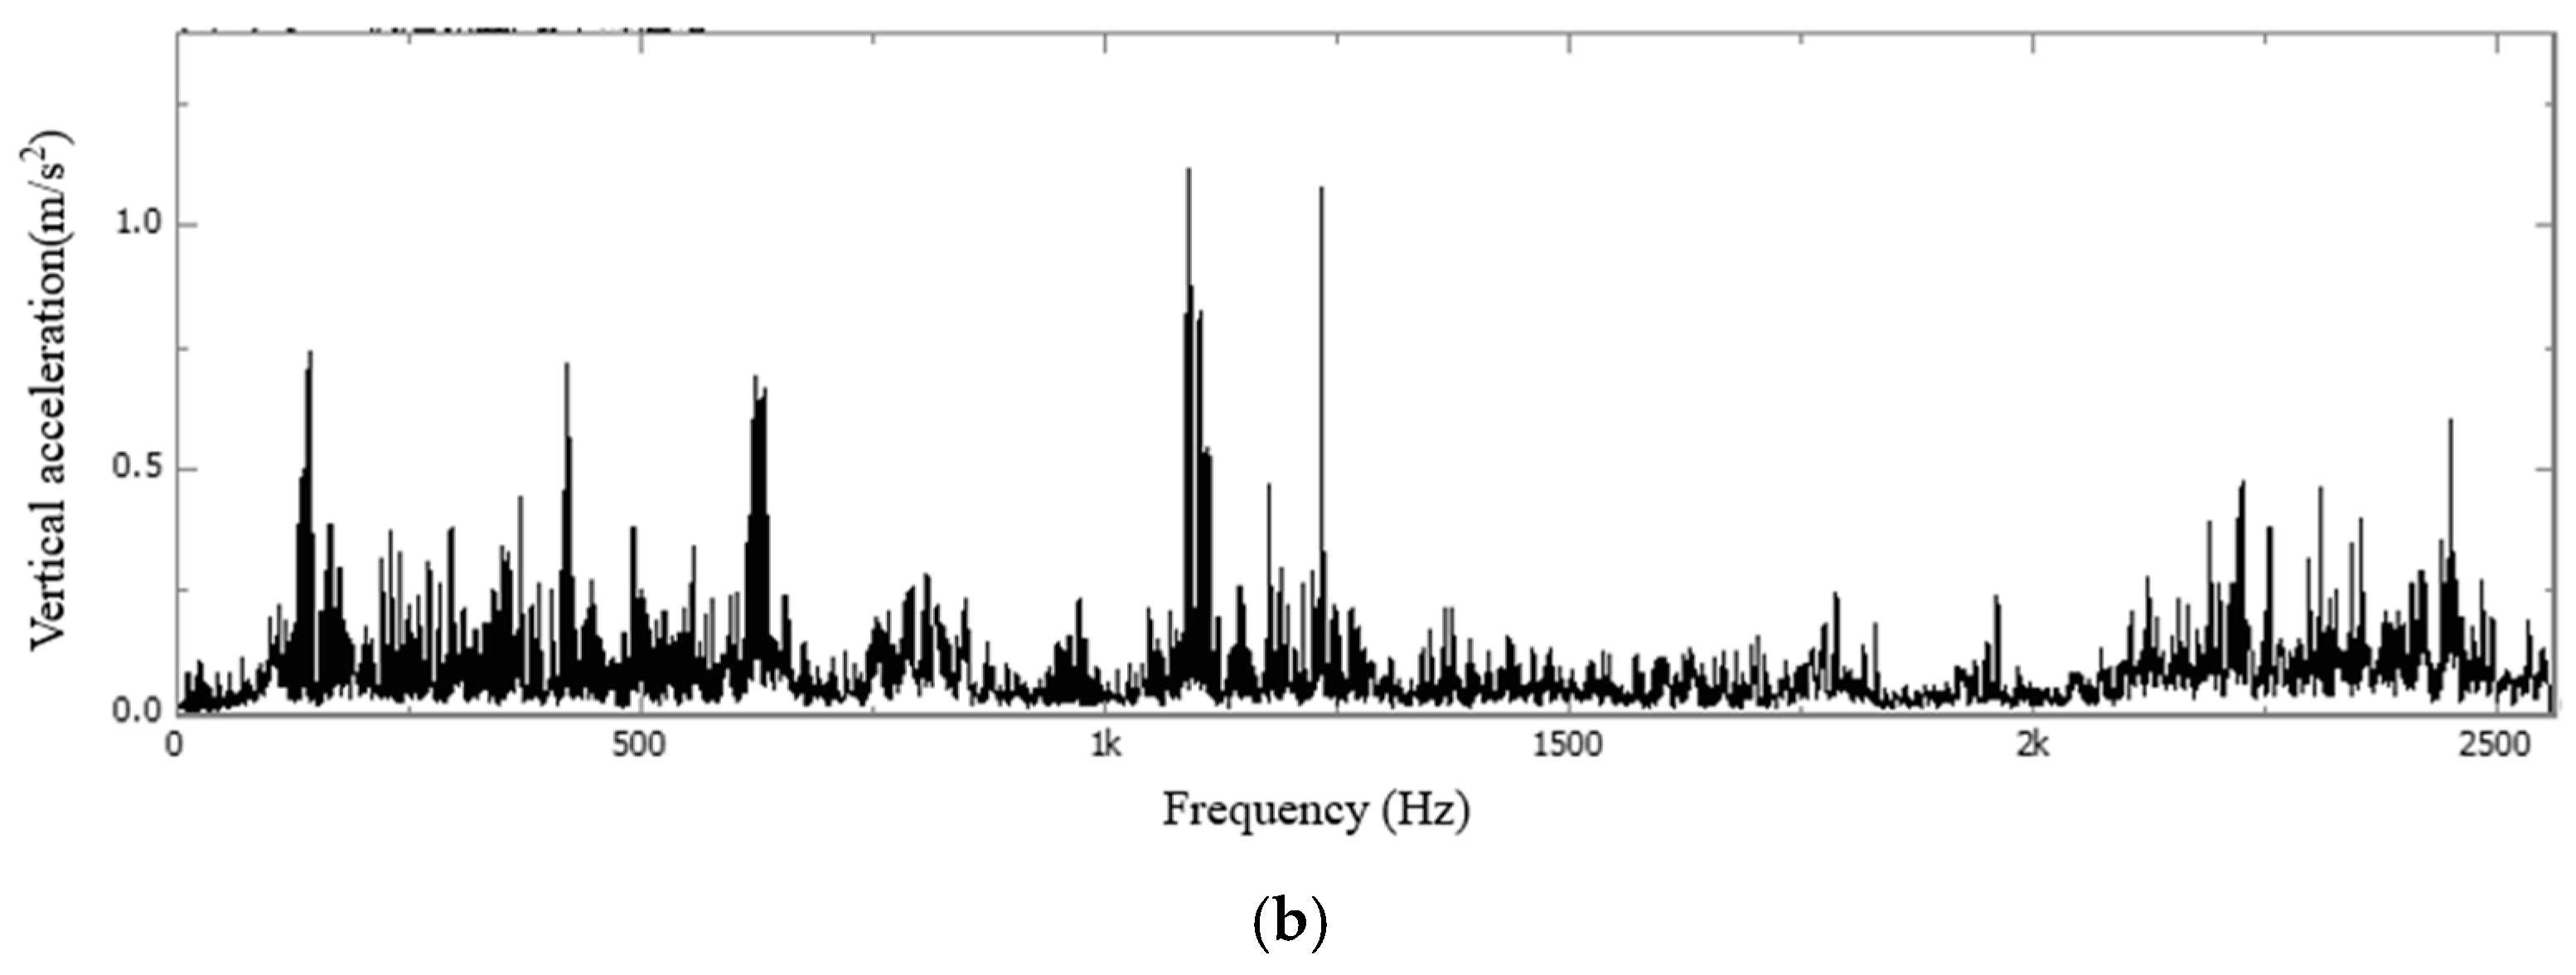
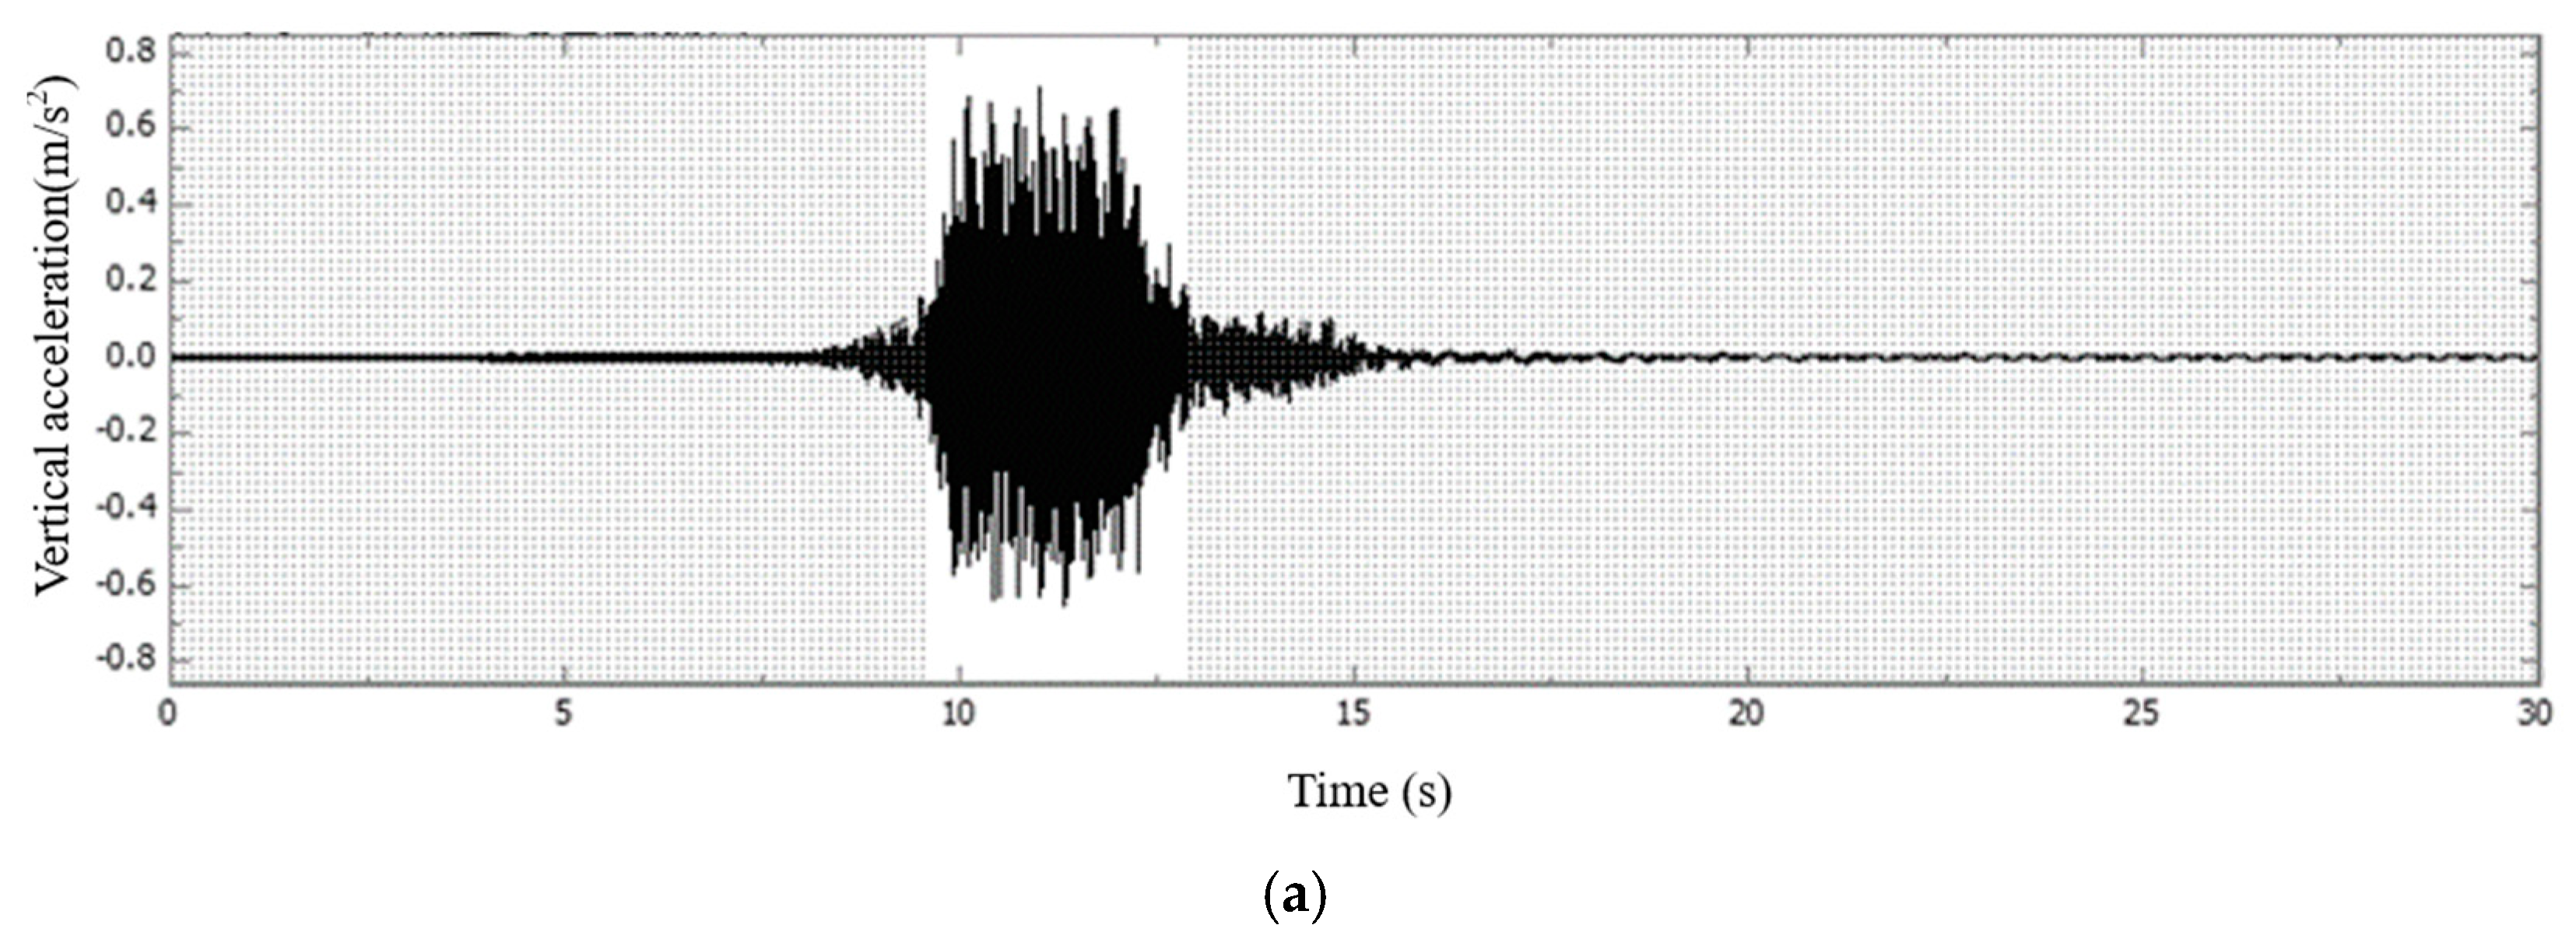
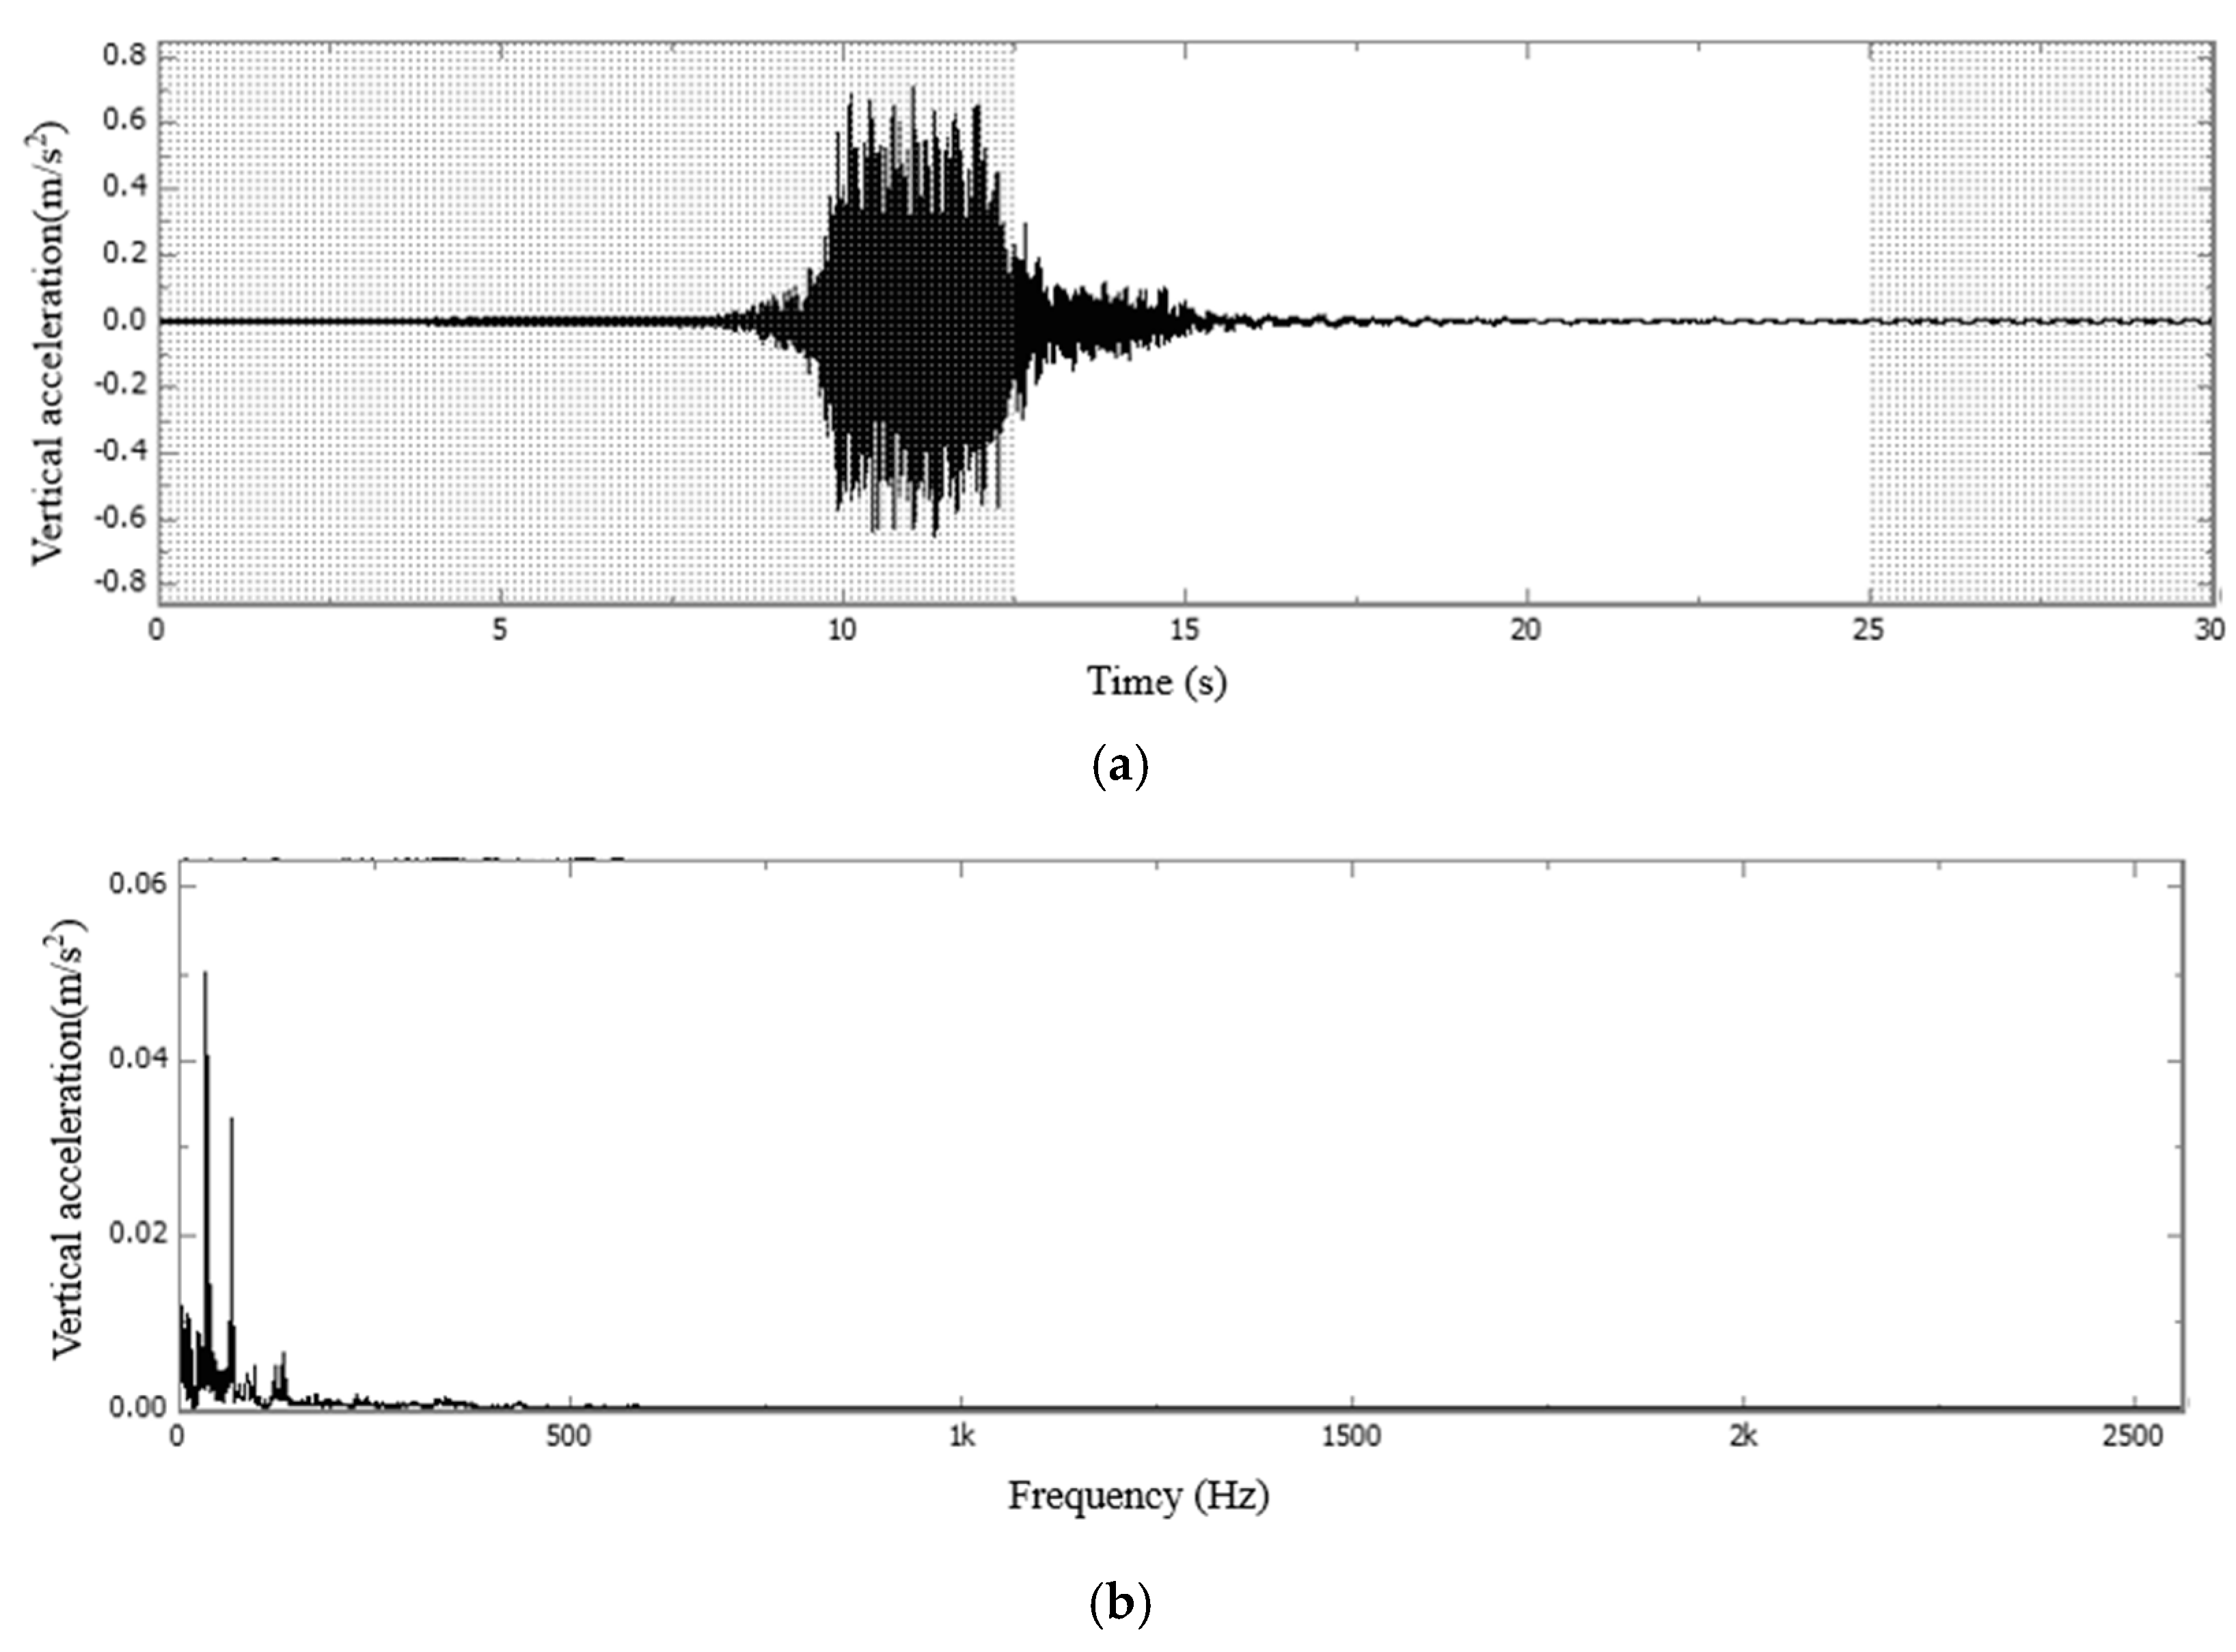
3.1. Acceleration Test Results

The root mean square (RMS) value of acceleration characterizes the energy of the vibration; the time course of the vibration is taken into account and can be used to describe the overall intensity of the vibration. By relating the RMS values of acceleration at different spatial points within the same structure, the vibration behavior of the whole track structure under the action of the train can be observed. Table 2 and Table 3 provide a statistical analysis of the data measured at each measurement point and show the characteristics of the distribution of longitudinal and transverse accelerations along the travel line.
In the traveling direction, when the rail and the concrete plate are closer to Section C, the vertical vibration will be stronger correspondingly. The maximum vibration signals of Section C and Section A increase to 228% and 316%, respectively. The vertical vibration of the bridge deck suddenly decreases to the minimum value of the whole continuous girder in Section B and then gradually increases in Section C, which reflects that the abutments have a considerable influence on the vertical vibrations of the continuous girders.
The lateral vibration of the continuous girder is similar to the vertical vibration; when the rail and the concrete plate are placed closer to Section C, the vertical vibration is stronger. The maximum vibration signals of Section C and Section A increase to 201% and 247%, respectively; the lateral vibration of the deck is not significantly reduced at Section B, but it also stays at a lower level throughout the continuous girder.

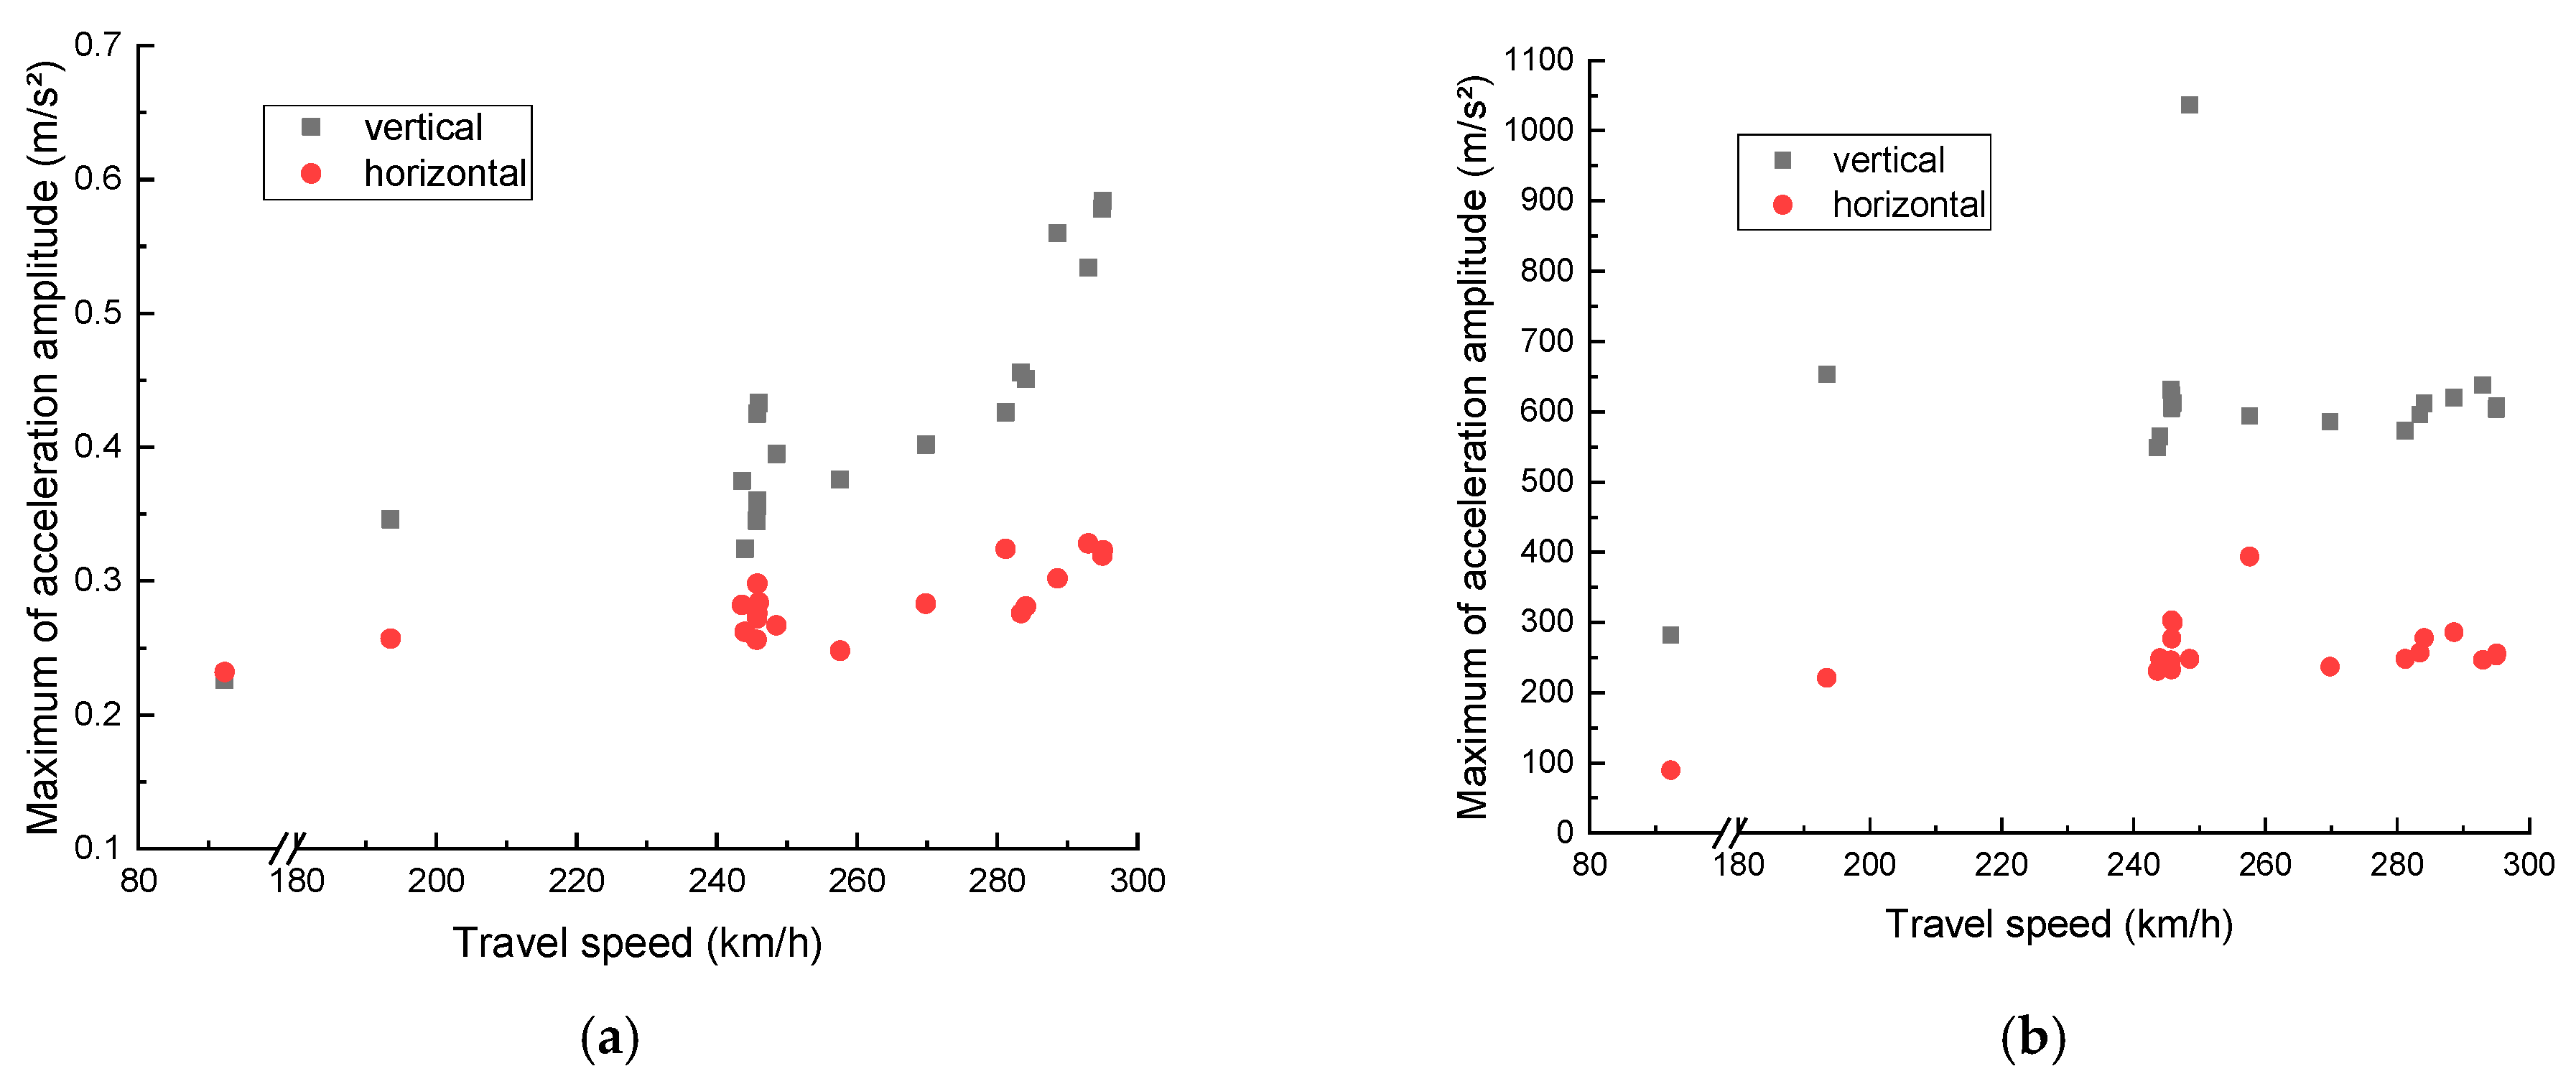
3.2. Analysis of the Midspan Section Acceleration for the Largest Span

A comparison of the measured horizontal and vertical acceleration data of the track structure at Section C is shown in Figure 6. The rail is directly subjected to train load, and its vertical vibration is strong. In addition to individual test results, the vertical acceleration amplitude of the rail is basically above 400 m/s2, while the maximum value at the bridge deck does not exceed 1 m/s2. According to Figure 6, it can be seen that in terms of the dispersion of the data, the dispersion of the maximum amplitude of the acceleration is stronger than the effective value within the travel time of the train due to the random vibration effect. As can be seen from the measurements, (1) the average amplitudes of the vertical acceleration of rails and the bridge deck are 589.3 m/s2 and 0.485 m/s2, with maximum amplitudes of 74.8% and 93.2% being greater than the average amplitude. The average amplitudes of the lateral acceleration are 197.99 m/s2 and 0.315 m/s2, while the maximum amplitudes are 96.6% and 100% greater than the average amplitude. (2) From the comparison of horizontal and vertical vibration, it is clear that the vertical vibrations of the rail and bridge deck are significantly stronger than the horizontal acceleration, and the amplitude of the vertical acceleration is about twice more than the horizontal acceleration.
After the train speed reaches 220 km/h, the horizontal and vertical vibration level of the deck increases with the increase in train speed, and there is a clear peak at 245 km/h. It can be seen from the rail signal of Section C that although the horizontal vibration level is relatively flat, it can also be observed that the structural response tends to increase to a certain extent with the gradual increase in the train speed, which resonates at 245 km/h.
By performing Fast Fourier Transformation (FFT) on the acceleration signals at different vehicle speeds, the acceleration signal spectra can be obtained for the vehicle-induced vibration time range and the free vibration time range, respectively.
Taking the concrete slab and bridge deck of Section C as examples, the acceleration signal time–frequency diagrams are illustrated in Figure 7, Figure 8, Figure 9 and Figure 10.
Figure 7 and Figure 9 demonstrate that during the vehicle-induced vibration stage of the concrete slab, a high-frequency bandwidth ranging from 2200 to 2500 Hz is observed, along with two distinct high-frequency eigenvalues at 2210 Hz and 2440 Hz within this range. In contrast, during the forced vibration stage of the bridge deck, high-frequency signals above 1000 Hz were nearly completely attenuated to 0, resulting in the concentration of all signal energy within the frequency band of 500 Hz and peak eigenfrequency of approximately 200 Hz.
By analyzing Figure 8 and Figure 10, it is obvious that the free vibration bandwidth of the slab is down to 150–650 Hz, and the main characteristic frequencies are 130 Hz, 230 Hz, 295 Hz, 330 Hz, 430 Hz, 465 Hz, 565 Hz, etc. The free vibration bandwidth of the bridge deck is within 0–200 Hz, and the main characteristic frequencies are 2.5 Hz, 6.5 Hz, 10 Hz, 22.5 Hz, 28.5 Hz, 32.5 Hz, 65.5 Hz, 130 Hz, etc.
It is evident that both forced and free vibrations exhibit significant differences in the vibration signal frequencies of the deck and slab. This discrepancy arises from their intrinsic physical properties—such as mass, stiffness, and damping—as well as structural coupling effects. Free vibration directly reflects the inherent frequency differences, while forced vibration amplifies these differences due to the dynamic response characteristics and the interaction with the excitation frequency. In practical engineering applications, it is essential to clarify the frequency characteristics of each component through modal analysis or experimental testing to optimize the vibration damping design.
The acceleration response at the rail and deck of the continuous girder in Section C significantly increases at 245 km/h. The corresponding train loading frequency is about 2.7 Hz, which approaches the lowest dominant frequency of 2.5 Hz for the time–frequency analysis of the deck signal, and 2.5 Hz can be considered the first-order vertical intrinsic frequency of the continuous girder. The first-order vertical inherent frequency of the structure analyzed by ANSYS is 2.321 Hz, and the difference between the calculated and experimental results is 7.71%, indicating that the finite element model predicts reasonably.

4. Finite Element Model

TTBC is a large-scale analysis model composed of several subsystems, mainly consisting of a train model (including car-body, bogies, wheel-sets, and suspension), track model, bridge model, wheel–rail (WR) contact model, coupling mechanism, external excitations, etc. It simulates the overall dynamic behavior of a train running on a bridge by coupling the equations of motion of the train, the mechanical behavior of the track, and the structural response of the bridge. Vibrations and deformations of the bridge structure will in turn act on the track, thus affecting the vibrations of the train.
The track and bridge subsystem is established based on the co-simulation of SIMPACK and ANSYS. The bridge and tracks are modeled separately in ANSYS; the main girder and pier are simulated by the space beam elements with six degrees of freedom. The track plate is added to the main beam only as additional mass, while the track is regarded as the Euler beam, and the freedom of the three directions of vertical, transverse, and torsion is considered. The bridge and track model are introduced into the SIMPACK, respectively, and the vertical and lateral interaction between them can be transmitted by linear fastenings and damping simulations.

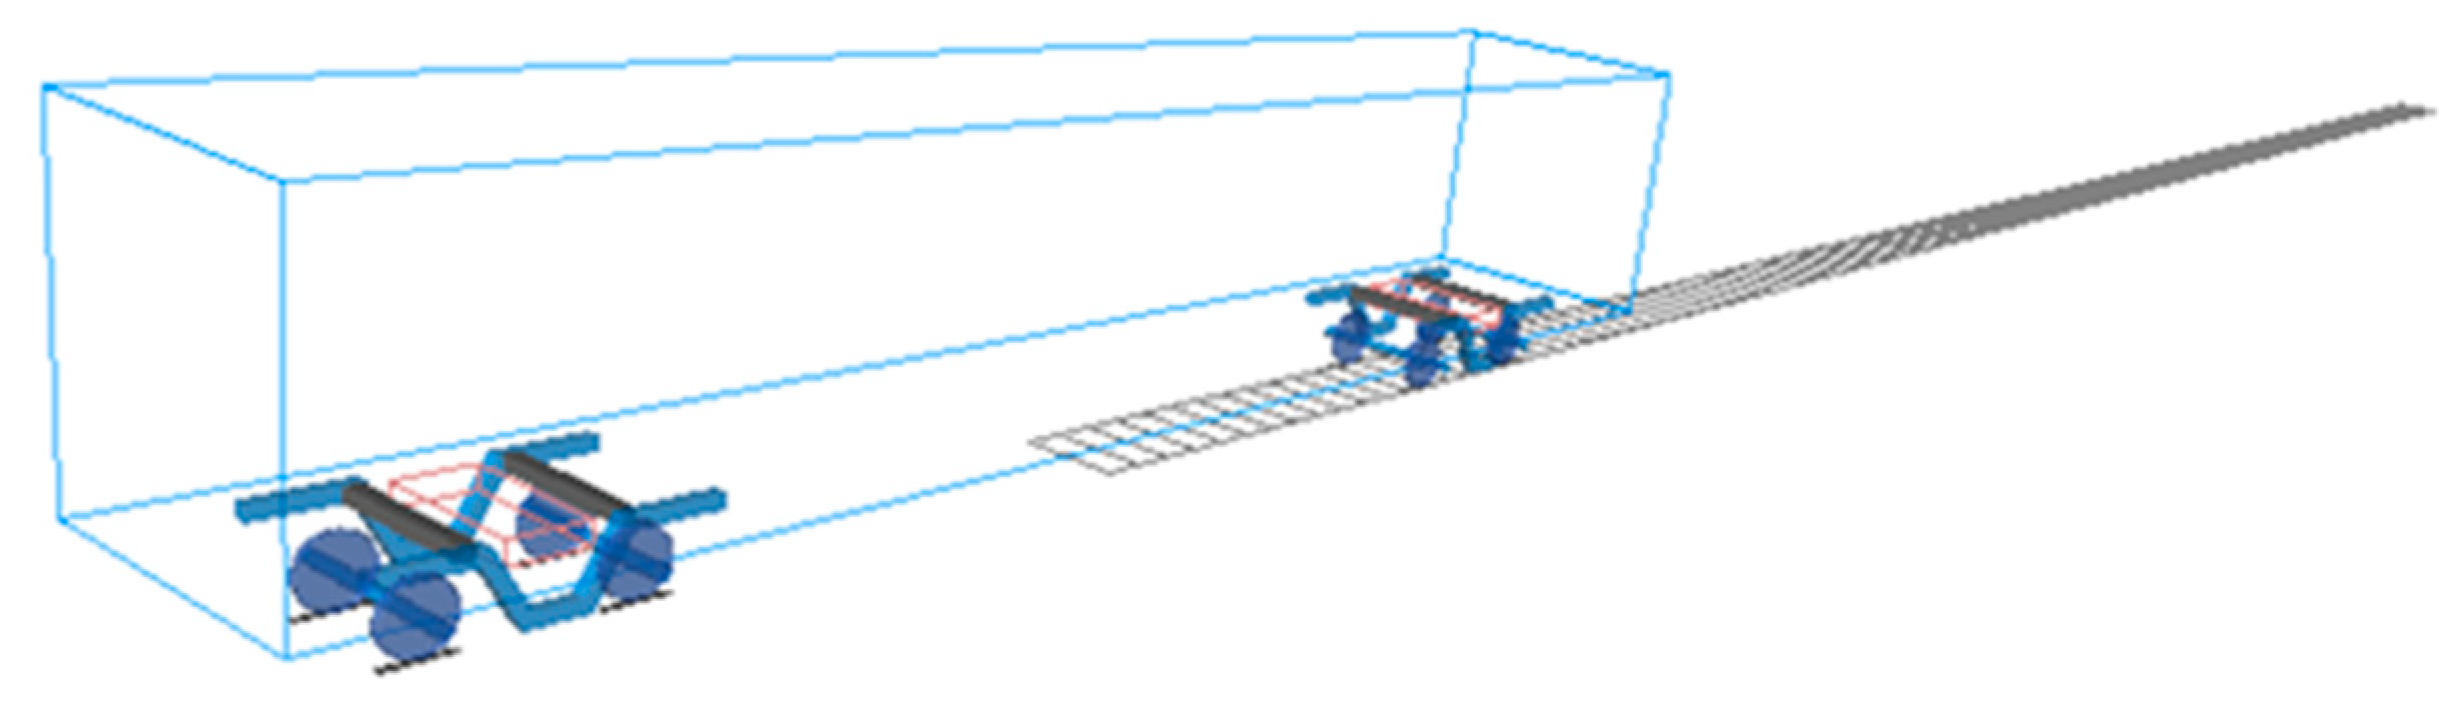
4.1. Vehicle Dynamic Simulation Model

The train model was established in SIMPACK, and a single train model includes one car-body, two bogies, and four wheel-sets; in total, seven rigid bodies are considered. Each rigid body includes floating, yawing, telescoping, shaking, nodding, and rolling 6° of freedom, respectively, so a single train model is considered to be 42° of freedom.
Based on the theory of multi-body dynamical systems [23], the dynamical equations of the vehicle can be expressed as follows:
M V X ¨ V + C V X ˙ V + K V X V = F V
where M v , C v , and K v are the mass, damping, and stiffness matrices of the vehicle, respectively; X v , X ˙ V , and X ¨ V are the nodal displacement, velocity, and acceleration vectors of the vehicle, respectively; and   F v denotes the vector of forces transmitted from the wheel-sets to the bogies through the first suspension system.
The car-body and bogies are connected by a secondary suspension system, while the wheel-set and the bogie are connected by a primary suspension system. When building the train model in this paper, the CRH2 train set is chosen as a reference. The model of a single locomotive set built in SIMPACK according to the relevant parameters of the vehicle is shown in Figure 11.
Through the substructure import function in SIMPCAK, the motor car and trailer single model were set up as the train set model. In this paper, the train set model is composed of eight train groups with the form of six motor cars and two trailers (T + M + M + M + M + M + M + T). The train set model is shown in Figure 12.

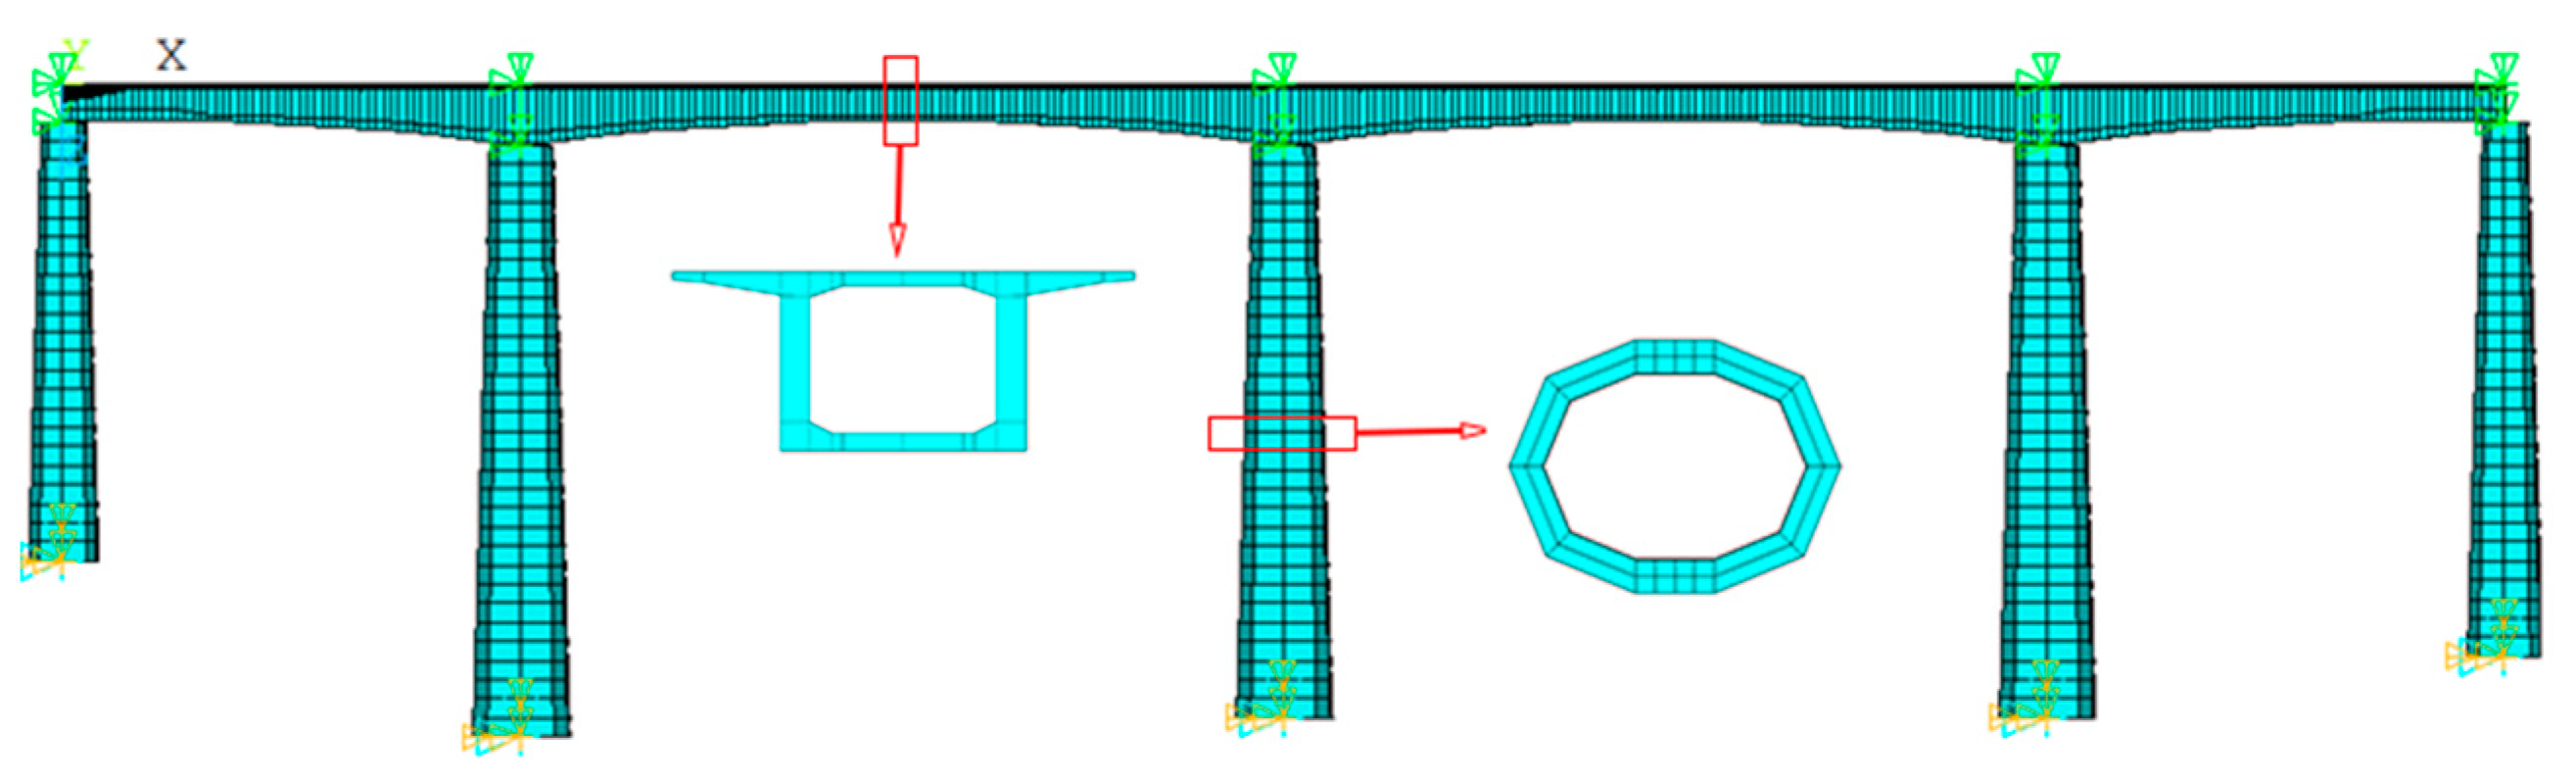
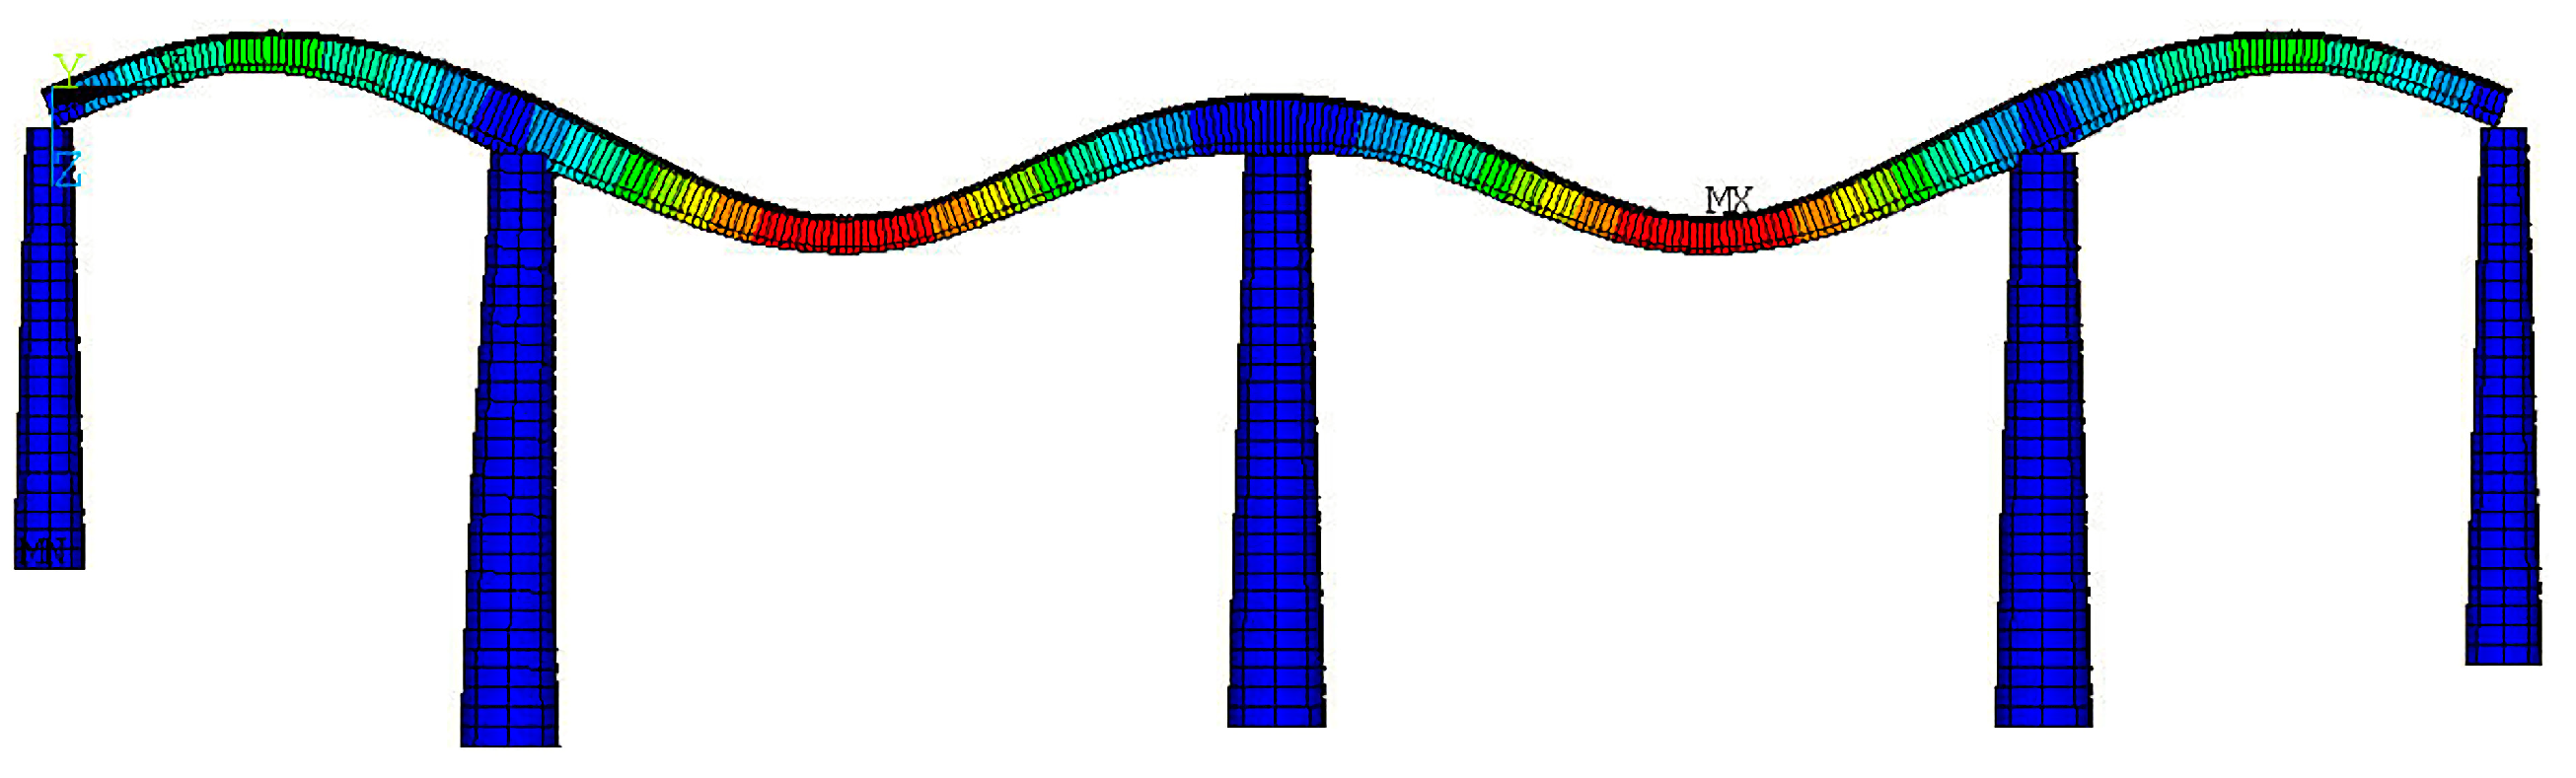
4.2. Analysis Model of Bridge–Track Structure

The bridge dynamic simulation model is established by ANSYS, in which the “BEAM188 element” is used to simulate the superstructure of the bridge, and the “BEAM44 element” is used to simulate the pier part; the constraint condition of the beam pier support is handled by the master-slave node [23,24,25]. The finite element model of the constructed bridge is shown in Figure 13. Its vertical first-order vibration pattern is shown in Figure 14.
The vibration equation of the bridge can be expressed as follows:
M b X ¨ b + C b X ˙ b + K b X b = F b
where M b , C b , and K b are the mass, damping, and stiffness matrices of the bridge–track structure, respectively; X b , X ˙ b , and X ¨ b are the nodal displacement, velocity, and acceleration vectors of the bridge–track model, respectively; and F b is the vector of forces from the wheel-sets of the train on the bridge deck through the track.

4.3. TTBC Rigid–Flexible Model

In the high version of SIMPACK, the WR contact can be realized not only between the rigid body but also between the flexible rigid body and flexible track. Therefore, the wheel rail relationship is established by introducing the track into the SIMPACK by a flexible track so as to realize the coupled vibration of train–track–bridge.
The separation iterative method is used to solve the system equations of motion [25,26], where the vehicle and the bridge are viewed as two relatively independent subsystems and the two subsystems are linked by the displacement coordination condition and the force equilibrium condition, and the coordination condition and the equilibrium relationship are satisfied by an iterative process. The coupling between the vehicle and the bridge is shown below:
M d ¨ + C d ˙ + K d = F w + F g
where M, C, and K are the mass, damping, and stiffness matrices of the TTBC model, respectively; F w and F g are the dynamic load matrices caused by the unevenness of the bridge deck and the self-weight of the train, respectively. This paper adopts the ballast track unevenness spectrum of Chinese HSR.

5. Analysis of Dynamic Effects of Train–Bridge System

5.1. Model Validation

In order to verify the correctness and reliability of the standard continuous beam established in this paper, based on the data samples collected during one day when 49 trains with speeds between 280 km/h and 305 km/h passed by, the measured values of vertical displacement and vertical acceleration of Section C are compared with the simulation results under the design speed of 300 km/h, as shown in Figure 15.
As can be seen from the above figure, the measured values of vertical acceleration and displacement of the continuous beam show an overall upward trend during the day, and the measured values are larger in the time period from 12 to 15 pm. The calculated values of vertical acceleration and displacement in Section C are 0.293 m/s2 and 2.061 mm, which are all within the distribution range of the measured values in the dynamic test, indicating that the theoretically calculated values are more in line with the measured values, and verifying the reliability of the train–bridge system.

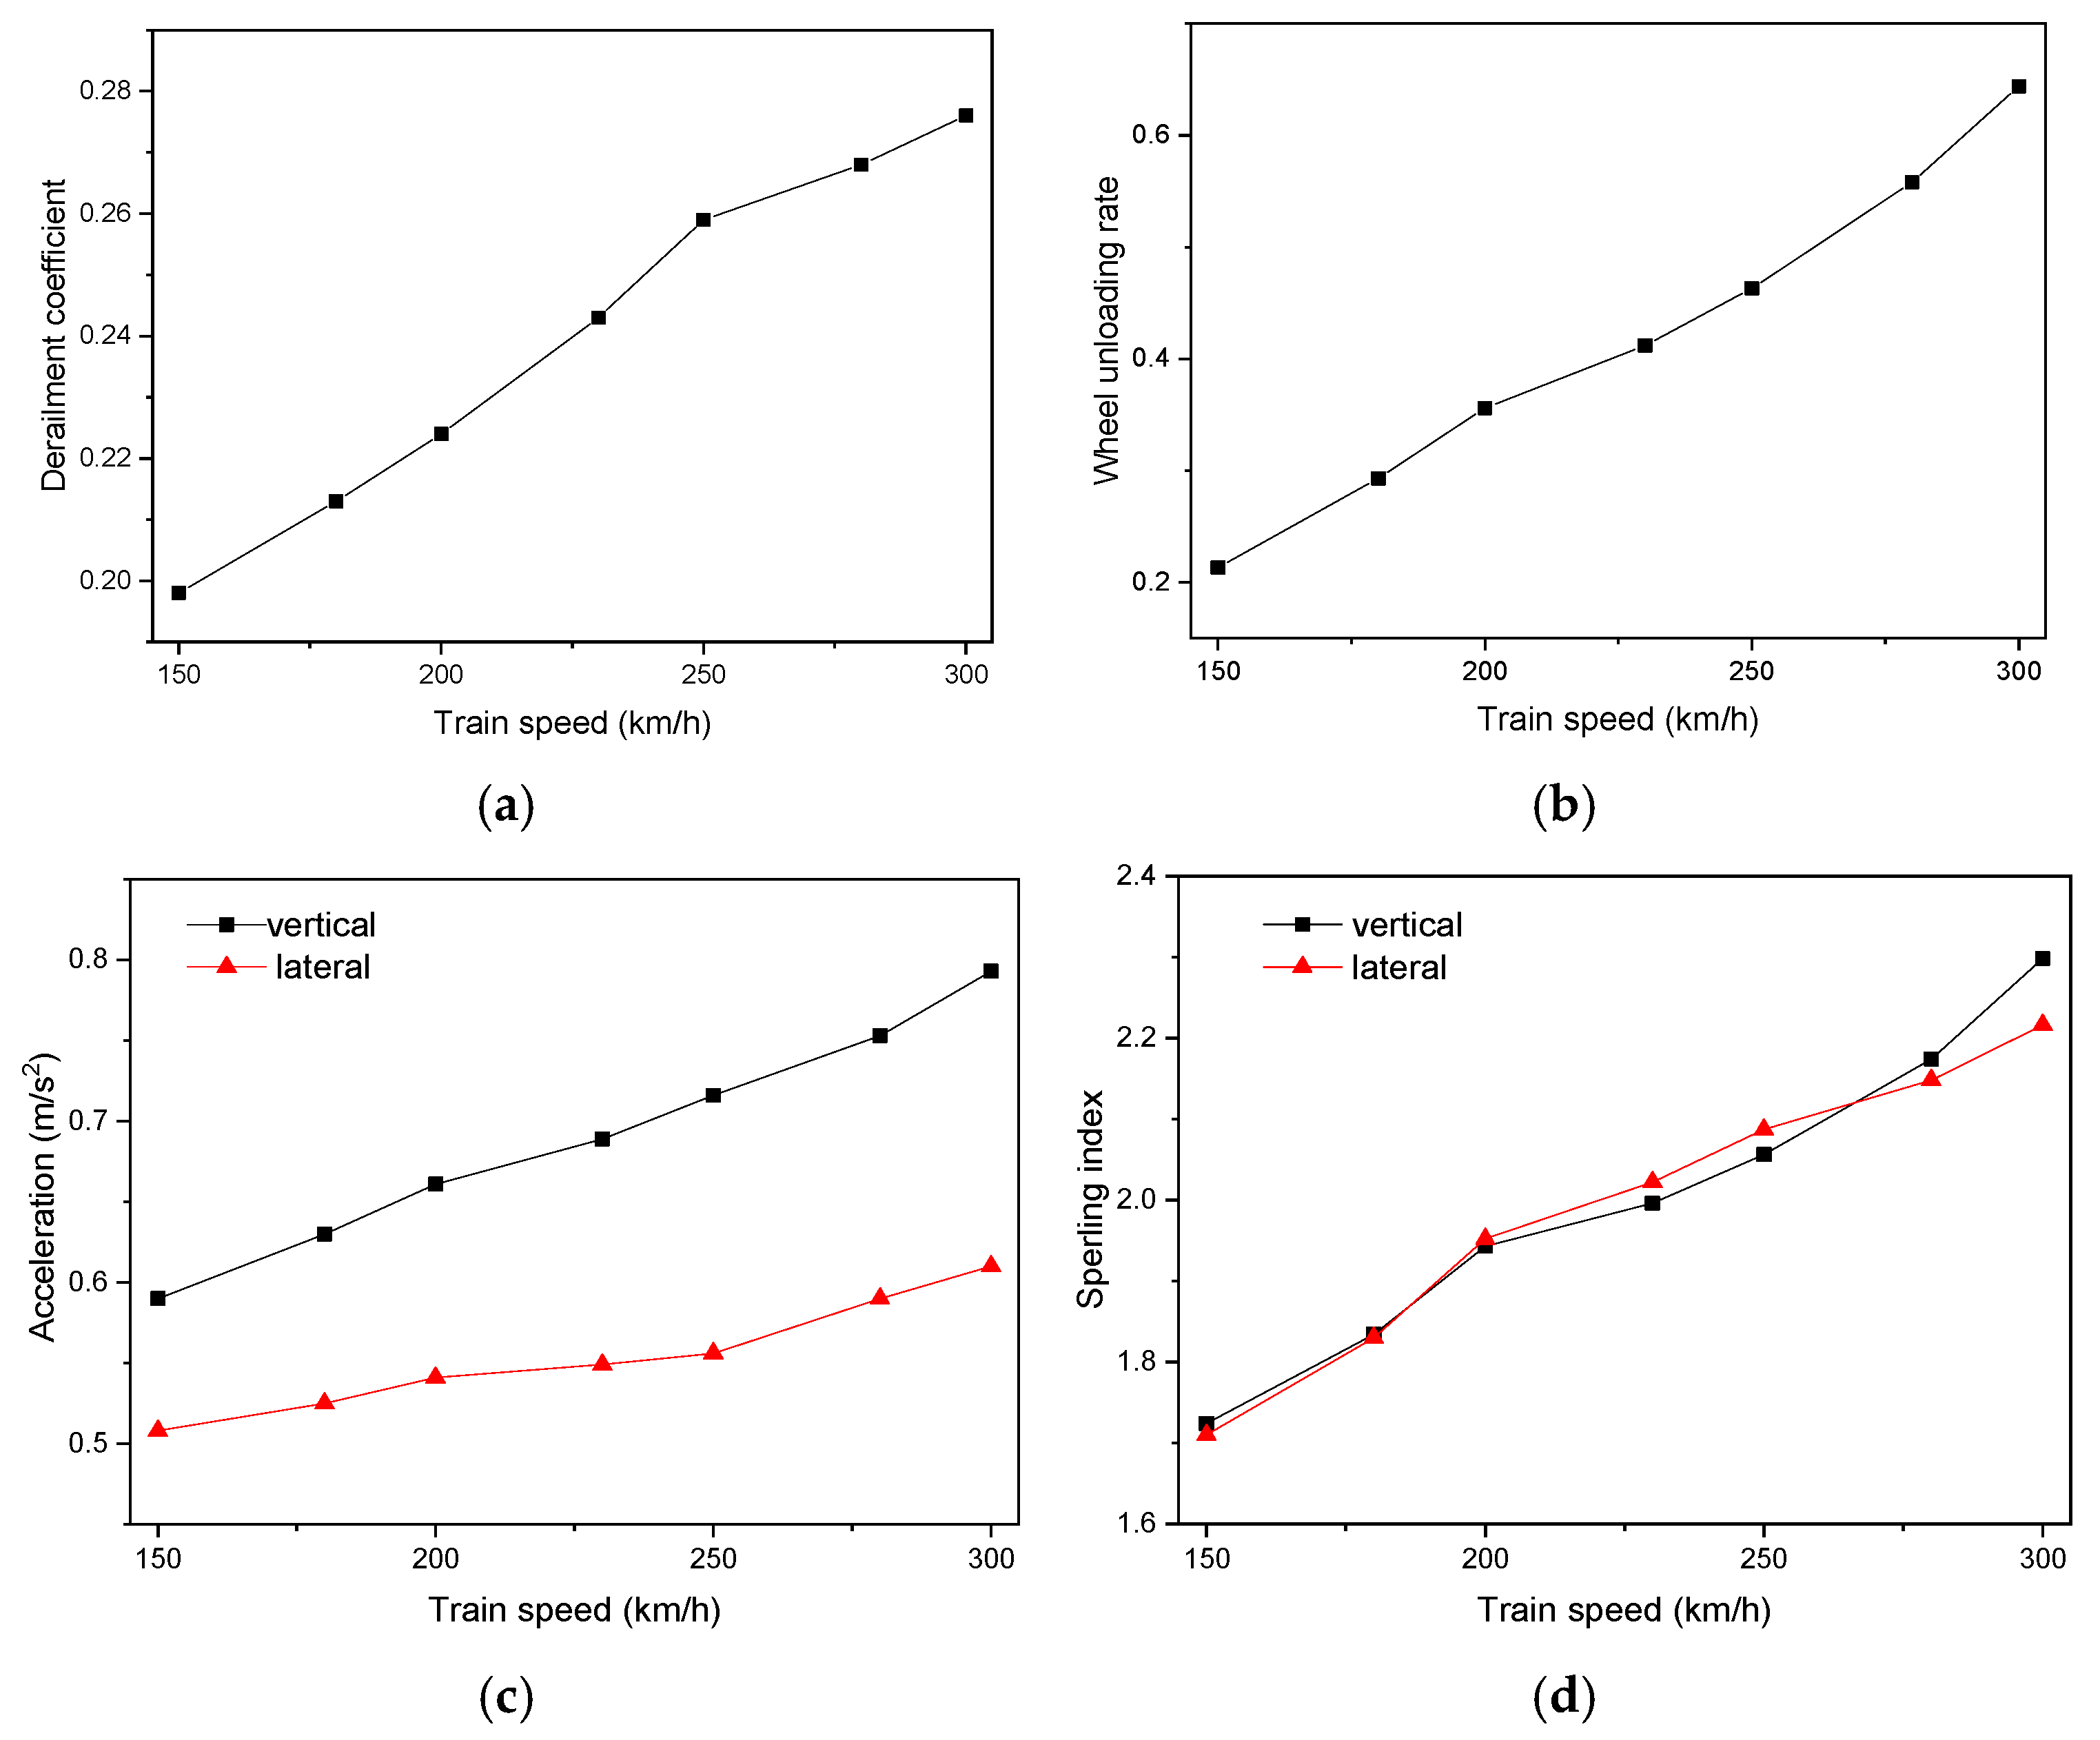
5.2. Effect of Traveling Speed

According to the CRH2 model established earlier, a total of seven kinds of speed conditions of 150, 180, 200, 230, 250, 280, and 300 km/h were selected to calculate the dynamic response of the vehicle and bridge with the integral step of 0.0001 s when the train runs upstream. Before the calculation, we set the train running smoothly and then drove the bridge after a certain distance; after the train was completely out of the bridge, the calculation was finished.
The calculated dynamic responses included the index for safety of the train operation (derailment coefficient, wheel unloading rate, wheel rail lateral force) and index for stability of the train operation (lateral acceleration of the train, vertical acceleration of the train, lateral Sperling index, vertical Sperling index). The calculated bridge dynamic responses included lateral displacement (pier top, midspan), vertical displacement (midspan), lateral acceleration (pier top, midspan), and vertical acceleration (midspan).
In the speed range of 150–300 km/h, the maximum dynamic response indices of the vehicle vary with train speed, as shown in Figure 16.
As illustrated in Figure 16, the dynamic responses of the train increase with the train speed. The derailment coefficient, wheel unloading rate, and wheel–rail lateral force all rise as the train speed increases, but the maximum is within the limit of the standard requirement. With the increase in the train speed, the stability indexes, such as lateral and vertical acceleration and lateral and vertical Sperling index, gradually increase, indicating that the ride comfort is gradually decreasing, but the indexes do not exceed the established standard requirements. In addition, lateral and vertical comfort indexes present excellent grades.
Similarly, in the speed range of 150–300 km/h, the maximum dynamic response of the bridge varies with the train speed, as shown in Figure 17 and Figure 18.
Figure 17 and Figure 18 show that the dynamic responses of the bridge increase with train speed. The acceleration of the midspan has a greater change range than the displacement, indicating that it is more sensitive to the change in train speed. The lateral acceleration of the pier’s top increases with the increase in vehicle speed. When the vehicle speed is 300 km/h, the lateral acceleration of the pier’s top increases obviously.

5.3. Effect of Pier Height

Considering that the bridge is located in the mountainous area, the surface is highly undulating. The bridge piers are generally taller compared to the flat hills, and the height of the pier affects the dynamic response index of the train. Therefore, we have added work conditions that consider different pier heights. The train passes through the continuous beam bridge at a speed of 300 km/h, and the ballast track unevenness spectrum of the Chinese high-speed railway is used as the excitation source of the coupled vibration of the vehicle and bridge so as to study and analyze the laws of the vibration response of the coupled vehicle and bridge system with different pier heights. The calculated conditions are shown in Table 4, and the calculation results are shown in Table 5 and Table 6.
Comparing and analyzing the results of the dynamic response of the train at each pier height, the following can be seen:
(1)
Within the range of pier heights studied, the impact of pier height on train operating safety is minimal. The train safety indicators show almost no change with increasing pier heights.
(2)
Within the range of pier heights studied, both vertical and lateral indicators increase with the increase in pier height, which shows that the smoothness of the train operation on high-pier bridges is poorer than that on low-pier bridges.
Comparing and analyzing the results of the dynamic response of the bridge at each pier height, the following can be seen:
(1)
Over the range of pier heights studied, the lateral displacement increases as the height of the piers increases, both at the midspan of the main span (Section C) and the pier’s top (Section B). Especially for Case 1, the lateral displacement of the bridge structure increases significantly
(2)
Vertical and lateral accelerations at the midspan of the main span (Section C) and midspan of the side span (Section A) up to 0.731 m/s2, 0.445 m/s2, 0.634 m/s2, and 0.365 m/s2, respectively, which are less than the specified limits (0.35 g and 0.14 g).

6. Conclusions

Dynamic response tests were conducted on bridges with high piers to investigate their dynamic characteristics and operating features of bridges with high piers under train loads. The joint simulation platform of SIMPACK and ANSYS is used as the research object of the HSR continuous beam bridge (60 + 100 + 100 + 60 m). In this study, the coupled vibration response analysis model of the train–track–continuous beam bridge is established, the vibration response of a train passing through the bridge at 300 km/h is analyzed, and the influence of the train speed and pier height on the vibration response of the coupling system is further studied. The conclusions are as follows:
(1)
In the measurement points of concrete slabs and decks, after the vehicle speed reaches 240 km/h, the acceleration response increases with the increase in vehicle speed, and there is a resonance phenomenon with a significant increase in response at the measurement point of the girder end cross-section, where the vehicle speed is about 245–250 km/h. When the track structure is optimized and maintained, in addition to the self-oscillation frequency of the structure that should be avoided, the line level, the speed range of the train on the line, and other factors should also be considered so that the corresponding main frequency of the track structure under the train running speed is avoided to ensure that the damage brought by resonance to the track structure is reduced.
(2)
The dynamic response of the train–bridge system under various train speeds was calculated, and the results indicated that when the train passes through the continuous beam bridge with 300 km/h, the train safety index, wheel rail interaction, and train body comfort index are all less than the limit value standard; the deflection span ratio and acceleration of the bridge structure are all less than the limit value standard. Thus, the train–track–continuous beam bridge coupling system meets the specification limits and has some margin for further optimization with an operating speed of 300 km/h.
(3)
Within the range of pier heights studied, both vertical and lateral indicators of train increase with the increase in pier height, which shows that the smoothness of the train operation on high-pier bridges is poorer than that on low-pier bridges. Meanwhile, the lateral stiffness of the bridge structure changes faster than its vertical stiffness, so the lateral displacement and lateral acceleration of the bridge structure change more than its vertical displacement and vertical acceleration. Especially when the pier height changes from 50 m to 70 m, the lateral displacement of the bridge structure increases significantly. Therefore, in the design process of high-pier bridges in mountainous areas, certain measures should be taken to limit the lateral displacement of the structure to ensure the safe operation of the line.

Author Contributions

Conceptualization, W.L. and G.D.; data curation, Q.L. and X.T.; formal analysis, W.L., Q.L. and X.T.; funding acquisition, W.L. and G.D.; investigation, Q.L.; methodology, W.L., G.D. and X.T.; project administration, W.L.; resources, W.L. and G.D.; software, Q.L. and X.T.; supervision, W.L.; validation, Q.L. and W.L.; visualization, Q.L. and W.L.; writing—original draft, Q.L. and W.L.; writing—review and editing, Q.L. and W.L. All authors have read and agreed to the published version of the manuscript.

Funding

This research was funded by the National Natural Science Foundation of China (Grant No. 52278234); the Natural Science Foundation of Hunan Province (Grant No. 2018JJ3672); and the Science and Technology Research and Development Program of China Railway Corporation (Grant No. K2018G017).

Institutional Review Board Statement

Not applicable.

Informed Consent Statement

Not applicable.

Data Availability Statement

The original contributions presented in this study are included in the article. Further inquiries can be directed to the corresponding author.

Acknowledgments

The authors would like to acknowledge Southeast Coastal Railway Fujian Co., Ltd. for their support and for providing organization and coordination assistance during the test.

Conflicts of Interest

The authors declare that this study received funding from China Railway Corporation. The funder was not involved in the study design, collection, analysis, interpretation of data, the writing of this article or the decision to submit it for publication.

References

  1. Mao, W.-Q.; Hu, X.-W. Latest Developments and Prospects for Long-Span Bridges in China. Bridge Constr. 2020, 50, 13–19. [Google Scholar]
  2. Xiang, P.; Xu, S.; Zhao, H.; Jiang, L.; Ma, H.; Liu, X. Running safety analysis of a train-bridge coupled system under near-fault ground motions considering rupture directivity effects. Structures 2023, 58, 105382. [Google Scholar] [CrossRef]
  3. Chen, Z. Evaluation of longitudinal connected track under combined action of running train and long-term bridge deformation. J. Vib. Control 2007, 26, 599–609. [Google Scholar] [CrossRef]
  4. Chen, Z.; Zhai, W.; Cai, C.; Sun, Y. Safety threshold of high-speed railway pier settlement based on train-track-bridge dynamic interaction. China Technol. Sci. 2015, 58, 202–210. [Google Scholar] [CrossRef]
  5. Liang, L.; Li, X.Z.; Li, R.B.; Gong, Z.H.; Sun, Y.D. Investigation of the effect of vibration-reducing tracks on the vibration and noise from a large-span steel bridge. J. Vib. Control 2023, 29, 2184–2197. [Google Scholar] [CrossRef]
  6. Shi, Y.; Chen, W.; Zhou, S. A review of the development of coupled vibration research on highway and urban bridges with vehicles and bridges. China Waterw. Mon. 2013, 2, 214–217. [Google Scholar]
  7. Fan, X.H.; Wu, H.L. A review of coupled axle vibration research methods. Sci. Technol. Eng. 2009, 9, 4090–4099. [Google Scholar]
  8. Xia, H.; Zhang, N.; Guo, W.W. Analysis of resonance mechanism and conditions of train-bridge system. J. Sound Vib. 2006, 297, 810–822. [Google Scholar] [CrossRef]
  9. Eberle, R.; Oberguggenberger, M. Vibrations of a Bridge with Random Structural Irregularities Under Random Traffic Load and a Probabilistic Structural Degradation Assessment Approach. J. Vib. Eng. Technol. 2023, 11, 1851–1865. [Google Scholar] [CrossRef]
  10. Lee, S.Y.; Cheng, Y.C. A New dynamic model of high-speed railway vehicle moving on curved tracks. J. Vib. Acoust. 2014, 130, 011009. [Google Scholar] [CrossRef]
  11. Timoshenko, S. On the forced vibrations of bridges. Philos. Mag. Ser. 1922, 6, 1018–1019. [Google Scholar]
  12. Timoshenko, S. Vibrations of bridges. ASME Trans. 1928, 49–50, 121009. [Google Scholar]
  13. Chu, K.H.; Garg, V.K.; Wiriyachai, A. Dynamic Interaction of Railway Train and Bridges. Veh. Syst. Dyn. 2007, 9, 207–236. [Google Scholar]
  14. Wiriyachai, A.; Chu, K.H.; Garg, V.K. Bridge Impact due to Wheel and Track Irregularities. J. Eng. Mech. Div. 1982, 108, 648–666. [Google Scholar]
  15. Xia, H.; Zhang, N.; Zhang, H.R. Experimental study of a prestressed trough bridge for high speed railway. Eng. Mech. 2003, 20, 99–105. [Google Scholar]
  16. Lee, Y.S.; Kim, S.H.; Jung, J. Three-dimensional finite element analysis model of high-speed train-track-bridge dynamic interactions. Adv. Struct. Eng. 2005, 8, 513–528. [Google Scholar]
  17. Yang, Y.B.; Lin, C.W. Vehicle–bridge interaction dynamics and potential applications. J. Sound Vib. 2005, 284, 205–226. [Google Scholar]
  18. Liu, P.H.; Yao, J.C.; Yin, J.; Dong, Z.S.; Meng, X.; Yang, Y.Q. Experimental Study on Dynamic Performance of High-speed Railway Bridges with a Speed of 200–250 km per Hour. J. Sound. Vib. 2005, 46, 96–102. [Google Scholar]
  19. Yang, Y.Q.; Yao, J.C.; Meng, X.; Liu, P.H.; Yin, J. Experimental Study on Dynamic Performance of High-Speed Railway Bridges at 300–350 km per hour. J. China Civl. Eng. 2013, 34, 14–19. [Google Scholar]
  20. Meng, X.; Yao, J.C.; Liu, P.H.; Yin, J.; Wang, W.; Yang, Y.Q.; Ke, Z.T. Field Test and Analysis on Dynamic Performance of Dashengguan Yangtze River Bridge. China Rail. Sci. 2015, 34, 30–36. [Google Scholar]
  21. Li, Z.M.; Tang, Q.L. Experimental Study on Dynamic Response of Ballastless Track-Bridge Structure on High Speed Railway. J. Chongqing Jiaotong Univ. 2019, 38, 26–33. [Google Scholar]
  22. GB/T 5224-2003; Steel Strand for Prestressed Concrete. China Standards Press: Beijing, China, 2003.
  23. Zhang, N.; Xia, H.; Guo, W.W. Vehicle–bridge interaction analysis under high-speed. J. Sound. Vib. 2008, 309, 407–425. [Google Scholar] [CrossRef]
  24. Zhai, W.; Han, Z.; Chen, Z.; Ling, L.; Zhu, S. Train–Track–Bridge Dynamic Interaction: A State-of-the-Art Review. Veh. Syst. Dyn. 2019, 57, 984–1027. [Google Scholar] [CrossRef]
  25. He, Z.-X.; Zhai, W.-M.; Yang, J.-Z.; Zhao, H.-Y. Train-Track-Ground Coupling Numerical Method for Railway Traffic Induced Ground Vibration. Zhendong Gongcheng Xuebao/J. Vib. Eng. 2008, 21, 488–492. [Google Scholar]
  26. Zhang, Q.; Gao, M.; Ma, L.; Xuan, Y.; Li, H. Train-Bridge Coupled Vibration of Hutong Yangtze River Bridge’s Approach Bridge. J. Vib. Shock 2018, 37, 132–138. [Google Scholar]
Figure 1. The Nanping Jianxi Bridge. (Section A is the 60 m span midspan section, Section B is the pier section, and Section C is the 100 m span midspan section).
Applsci 15 04341 g001
Figure 2. Sketch of the Nanping Jianxi Bridge (unit: cm).
Applsci 15 04341 g002
Figure 3. Arrangement of measurement points on the bridge (unit: cm): (a) measurement points of Section B; (b) measurement points of Section C.
Applsci 15 04341 g003
Figure 4. Measurements on the track: (a) acceleration sensors on the rail and concrete slab; (b) strain gauges on the rail.
Applsci 15 04341 g004
Figure 5. Measurements on the uplink of bridge deck: (a) acceleration and displacement sensors of Section C; (b) acceleration sensors of Section B.
Applsci 15 04341 g005
Figure 6. Comparison of horizontal and vertical acceleration amplitudes in Section C: (a) bridge deck; (b) rail.
Applsci 15 04341 g006
Figure 7. FFT time−frequency diagram of vertical acceleration during the vehicle-induced vibration phase of the concrete slab in Section C: (a) waveform diagram; (b) single peak spectrum.
Applsci 15 04341 g007aApplsci 15 04341 g007b
Figure 8. FFT time−frequency diagram of vertical acceleration during the free vibration phase of the concrete slab in Section C: (a) waveform diagram; (b) single peak spectrum.
Applsci 15 04341 g008
Figure 9. FFT time−frequency diagram of vertical acceleration during the vehicle-induced phase of the bridge deck in Section C: (a) waveform diagram; (b) single peak spectrum.
Applsci 15 04341 g009aApplsci 15 04341 g009b
Figure 10. FFT time−frequency diagram of vertical acceleration during the free vibration phase of the bridge deck in Section C: (a) waveform diagram; (b) single peak spectrum.
Applsci 15 04341 g010
Figure 11. Single train model.
Applsci 15 04341 g011
Figure 12. The train set simulation model.
Applsci 15 04341 g012
Figure 13. Finite element model of Nanping Jianxi Bridge.
Applsci 15 04341 g013
Figure 14. First order symmetrical vertical bending vibration mode.
Applsci 15 04341 g014
Figure 15. Comparison of measured and simulated vertical acceleration and displacement of continuous beam: (a) vertical acceleration; (b) vertical displacement.
Applsci 15 04341 g015
Figure 16. Relationship between stability index and speed of train operation: (a) derailment coefficient; (b) wheel unloading rate; (c) train body acceleration; (d) Sperling index.
Applsci 15 04341 g016
Figure 17. Relationship between the displacement of bridge and train speed.
Applsci 15 04341 g017
Figure 18. Relationship between the acceleration of bridge and train speed.
Applsci 15 04341 g018
Table 1. Major test equipment.
EquipmentNumber
1941 Acceleration Pickup
(for bridge decks)
Vertical9
Lateral3
Portrait1
2ICP Acceleration Sensor100 G (for concrete slabs)6
1000 G (for rails)6
3LVDT Displacement Gauge5
4Strain Gauge12
516-channel Dynamic Data Collector3
6Wireless Communication System3
7Router2
8Portable Computer1
9Mobile Power Battery6
Table 2. Characteristic statistics of the effective value of vertical acceleration of bridges along the traveling direction.
LocationRange of Effective Values of Vertical Acceleration (m/s2)
Section ASection BSection C
Rail18.87–25.4226.51–37.6435.26–46.58
Concrete slab0.614–0.9781.029–1.3441.576–2.024
Deck0.032–0.0590.030–0.0330.068–0.072
Table 3. Characteristic statistics of the effective value of lateral acceleration of bridges along the traveling direction.
LocationRange of Effective Values of Lateral Acceleration (m/s2)
Section ASection BSection C
Rail7.86–11.399.93–13.5316.73–17.36
Concrete slab0.627–1.4880.669–1.1851.722–2.215
Deck0.023–0.0320.023–0.0250.043–0.048
Table 4. Pier height setting for different working conditions.
Case1#2#3#4#5#
157.5 m78 m74 m71 m70.5 m
237.5 m58 m54 m51 m50.5 m
317.5 m38 m34 m31 m30.5 m
Table 5. Dynamic response indicators of train under different pier height conditions.
CaseDynamic Response Indicators
Derailment CoefficientWheel Unloading RateTrain Body Acceleration Vertical(m/s2)
Lateral
VerticalSperling Index Lateral
10.2380.5860.7350.5571.9672.026
20.2360.5860.7360.5591.9652.025
30.2360.5870.7330.5571.9632.022
Table 6. Dynamic response indicators of bridge under different pier height conditions.
CaseDynamic Response Indicators
Section ASection BSection C
Displacement (mm)Acceleration
(m/s2)
Displacement (mm)Acceleration (m/s2)Displacement
(mm)
Acceleration
(m/s2)
VerticalLateralVerticalLateralLateralLateralVerticalLateralVerticalLateral
12.3610.4440.6150.2630.4130.2982.9950.8160.7120.443
22.3440.4360.6060.260.2660.3012.9780.4460.7030.44
32.3240.3940.6340.2650.2570.2882.9580.3790.7310.445
Disclaimer/Publisher’s Note: The statements, opinions and data contained in all publications are solely those of the individual author(s) and contributor(s) and not of MDPI and/or the editor(s). MDPI and/or the editor(s) disclaim responsibility for any injury to people or property resulting from any ideas, methods, instructions or products referred to in the content.

