Article

Pull-Out Test and Mechanical Properties Analysis Based on Intelligent Bolt and Internet of Things

1
College of Architecture and Civil Engineering, Xi’an University of Science and Technology, Xi’an 710000, China
2
College of Sciences, Xi’an University of Science and Technology, Xi’an 710000, China
3
The-First-Company of China Construction Sixth Engineering Bureau Corp., Ltd., Xi’an 710000, China
4
Electronic Comprehensive Survey Research Institute of Information Industry Department, Xi’an 710000, China
*
Author to whom correspondence should be addressed.
Appl. Sci. 2025, 15(7), 3901; https://doi.org/10.3390/app15073901
Submission received: 21 January 2025 / Revised: 3 March 2025 / Accepted: 31 March 2025 / Published: 2 April 2025

Abstract

:
The disadvantages of traditional bolt support technology relying too much on engineering experience in slope engineering in China are becoming more and more obvious. Aiming at this problem, this paper establishes an intelligent bolt pull-out test system based on the Internet of Things, monitors the whole process of a bolt pull-out test, determines the ultimate pull-out bearing capacity, and grasps the friction of a bolt in real time. Based on the local common deformation theory, the force of the bolt is analyzed theoretically. The results show that the stress process of bolt rod end tension–rod end displacement is divided into quasi-elastic stage, strengthening stage and failure stage. The stress history of bolts with different anchorage lengths is the same, but the curve shape changes from steep to slow with the increase in anchorage length. Increasing the length of the long bolt can increase the ultimate pull-out bearing capacity of the bolt.

1. Introduction

With the advent of the industry 4.0 era, China is undergoing a new wave of scientific and technological revolution and industrial transformation. New technologies, such as the Internet of Things, big data, and cloud computing, are being increasingly applied in engineering project construction [1], making efficient and high-speed access to big data possible, providing the basis for the digitization of the industry [2]; it provides help for the research and development of intelligent construction technology and engineering applications in the engineering field [3]. With the rapid development of infrastructure construction in China, slope instability issues are becoming increasingly prevalent. As one of the widely used reinforcement technologies in slope reinforcement, the theory of bolt support design is not mature at present, and the engineering design often relies more on the existing engineering experience. However, with the increasing complexity of practical engineering, its requirements are becoming more and more stringent. It is indispensable to take account of feedback and guide the bolt design in the project through the actual monitoring information of bolt support. In addition, the influence of environmental changes during the use of the bolt will cause the degradation of the anchoring function. To ensure the safety of bolt support projects, it is crucial to conduct long-term monitoring and safety assessments of the anchoring system.
Compared with traditional anchors, intelligent anchor detection technology has many significant advantages. In terms of detection accuracy, intelligent technology can monitor mechanical parameters such as axial force, strain and displacement in real time, automatically collect and transmit data, and reduce human error. In terms of safety, intelligent technology can analyze data in real time and predict disasters in advance. Economically, intelligent technology grasps the state of the bolt in real time, aids in targeted maintenance, and reduces construction costs. Therefore, both domestic and international scholars have conducted extensive research on the integration of Internet of Things technology with bolt support technology. Zhang et al. [4] employed their self-developed random non-destructive testing technology and equipment to conduct non-destructive testing and early warning analysis of bolt support quality in deep roadways across various mining areas. They summarized the relationship between changes in bolt axial force and the deformation and stability of roadway-surrounding rock at different mining stages. They proposed early warning technology for roadway-surrounding rock stability based on bolt axial force detection. Additionally, they provided early warning indices for bolt axial force at different mining stages and presented several successful early warning cases. Addressing the importance of monitoring roadway bolt loads and the limitations of conventional methods, Liang et al. [5] developed a novel fiber Bragg grating bolt dynamometer, utilizing fiber Bragg grating (FBG) as the core sensing element through theoretical analysis, laboratory tests, and field trials. Calibration and performance testing of the bolt dynamometer demonstrated excellent linearity, repeatability, and high sensitivity. The monitoring system features intrinsic safety, electromagnetic interference resistance, and high reliability, making it well suited for broader adoption and application. Wang et al. developed a real-time monitoring system with an intelligent early warning function by using LabVIEW software platform and applied it in the actual field. It is proved that the monitoring effect of the intelligent monitoring system developed by the grading development of the safety early warning of the bolt supporting slope is better, which can provide ideas for the intelligent monitoring and early warning system of the bolt-supporting slope structure [6]. Based on the fiber grating sensing technology, Lin and Dong [7] proposed an experimental method to measure the lateral load and lateral deformation of the bolt. This method not only fulfills the traditional axial strain measurement requirements for bolts but also incorporates the ability to measure lateral load, direction, and deformation. This advancement opens up new possibilities for applying optical fiber sensing technology in bolt monitoring. Liu [8] studied the reinforcement and monitoring effects of intelligent FRP anchors on slopes, established a finite element model of FRP anchor-reinforced slopes and verified its effectiveness. The key monitoring points in the FRP anchor reinforcement-monitoring slope were obtained, and then the application effect of intelligent FRP anchors in slope reinforcement and monitoring was evaluated, which provided a theoretical basis for slope monitoring. Cheng et al. [9] proposed a new type of intelligent bolt assembly, which can detect the change in ground anchor load. By using linear potentiometers, data loggers, power supplies and data transmitters, the intelligent anchor enables automatic self-checking of load monitoring. The reliability of the automatic load monitoring function of the intelligent anchor has been confirmed through sensing tests conducted on field anchors. Bai et al. [10] utilized fiber Bragg grating sensing technology to monitor glass fiber-reinforced polymer (GFRP) anti-floating anchors. They measured strain at various points, including the anchor–body interface, the anchor-surrounding rock interface, and within the anchor body itself, achieving comprehensive multi-interface and full-length measurements of the GFRP anti-floating anchor. The results demonstrate that fiber grating sensing technology can accurately record strain changes in GFRP anti-floating anchors throughout the entire pull-out test. Xu et al. [11] proposed a rapid connection technology for anchor field detection based on the self-developed intelligent anchor pull-out test system, which realized the intelligent analysis and visualization of load and displacement data in the whole process of anchor pull-out. Based on the application technology of Internet of Things, Wang et al. [12] developed a remote monitoring and early warning system for detecting deformation in deep foundation pit retaining structures. Liao et al. [13] collected and fed back monitoring data timely and accurately through an intelligent real-time monitoring system and Internet of Things technology, with monitoring cloud platform, monitoring all-in-one machine and various sensor devices as the core. Huang [14] obtained the stress distribution characteristics and evolution law of slope anchors based on three research methods and verified the effectiveness and reliability of intelligent anchors.
Some scholars have carried out research on geotechnical anchors by combining theory, experiment and practical engineering. Cheng et al. [15] introduced three forms of anchors that can significantly improve the uplift bearing capacity of ordinary prestressed anchors in view of the low bearing capacity of ordinary prestressed anchors, and reflected their anchoring effect through engineering measurement. Wu studied the working performance, reinforcement mechanism and applicable performance of a recyclable anchor (cable) [16]. Mirzaghorbanali et al. [17] determined through experimental research that the height and spacing of the transverse ribs significantly affect the anchoring performance of bolts. Malvar et al. [18] studied the influence of the surface state and diameter of the bolt material on the rod body and the reinforcement. As an effective means to analyze the working mechanism of a bolt, some scholars have studied it and found that when the length of the metal nut reaches 10 cm, the anchor head of a glass fiber-reinforced polymer bolt reaches its ultimate pull-out bearing capacity [19]. The evolution law of bolt force transmission and interface deformation between the anchoring agent and surrounding rock was analyzed by means of a digital speckle test [20]. Xiao et al. [21] investigated the weak surrounding rock, resin anchorage, and mine bolt support system using a multi-functional bolt pull-out test system. They revealed the mechanical properties of a coal mine bolt pull-out under varying anchorage lengths. Tu et al. [22] analyzed the impact of the anchoring section length of bolts in weathered rock layers on the ultimate pull-out bearing capacity and the shear stress behavior between the anchoring section and the weathered rock layer through field pull-out tests.
The above results greatly enrich the theoretical research and engineering application of rock and soil anchors. However, there are few studies on the intelligent testing of long anchors. The theoretical model lacks on-site long anchor test verification. There are few studies on the anchorage characteristics of long anchors, especially super-long anchors, in engineering. Whether the anchoring force of the super-long anchor rod can meet the design requirements, whether the anchoring length is reasonable, and how the friction resistance plays an effect are still unsolved problems. Due to the complex environment of slope support engineering, it is difficult to calculate the anchoring force of an anchor bolt, and the pull-out test of an anchor bolt is an effective means to analyze the working mechanism of the anchor bolt. Based on this, this paper relies on a high and steep slope and mountain ecological protection and restoration project; it has independently developed an intelligent test system for bolt drawing and collected and analyzed the whole process of drawing data. At the same time, five kinds of long anchor bolts were selected for field pull-out tests. Combined with theoretical analysis, the stress characteristics of anchor bolts under different anchorage lengths were studied, which provided a reference for the design of anchor bolts in loess areas.

2. Research and Design of Intelligent Pull-Out Test System for Rock Bolt

2.1. Design of Intelligent Pull-Out Test Scheme for Anchor Bolt

To achieve automation, informatization, and intelligence in monitoring data from bolt pull-out tests and to enhance the level of intelligence, this paper implements real-time monitoring of the ultimate pull-out bearing capacity, axial force, and friction resistance of different bolt lengths using an automatic monitoring and early warning platform. Firstly, according to the monitoring requirements, the measuring points and sensors are arranged, the monitoring integrated machine is set up and the equipment is networked. Through the monitoring-integrated machine, the data of the measuring points of the foundation pit collected by the sensor are transmitted to the massive data platform of the Internet of Things, and the background data are sorted out and analyzed. In addition, the early warning value should be set on the PC side in advance. When the monitoring data exceed the early warning value, the platform will notify the pre-set project early warning receiver through an SMS or message, and push it to the project group and mobile client. The automatic monitoring and early warning system, along with the early warning information setting system, are illustrated in Figure 1.

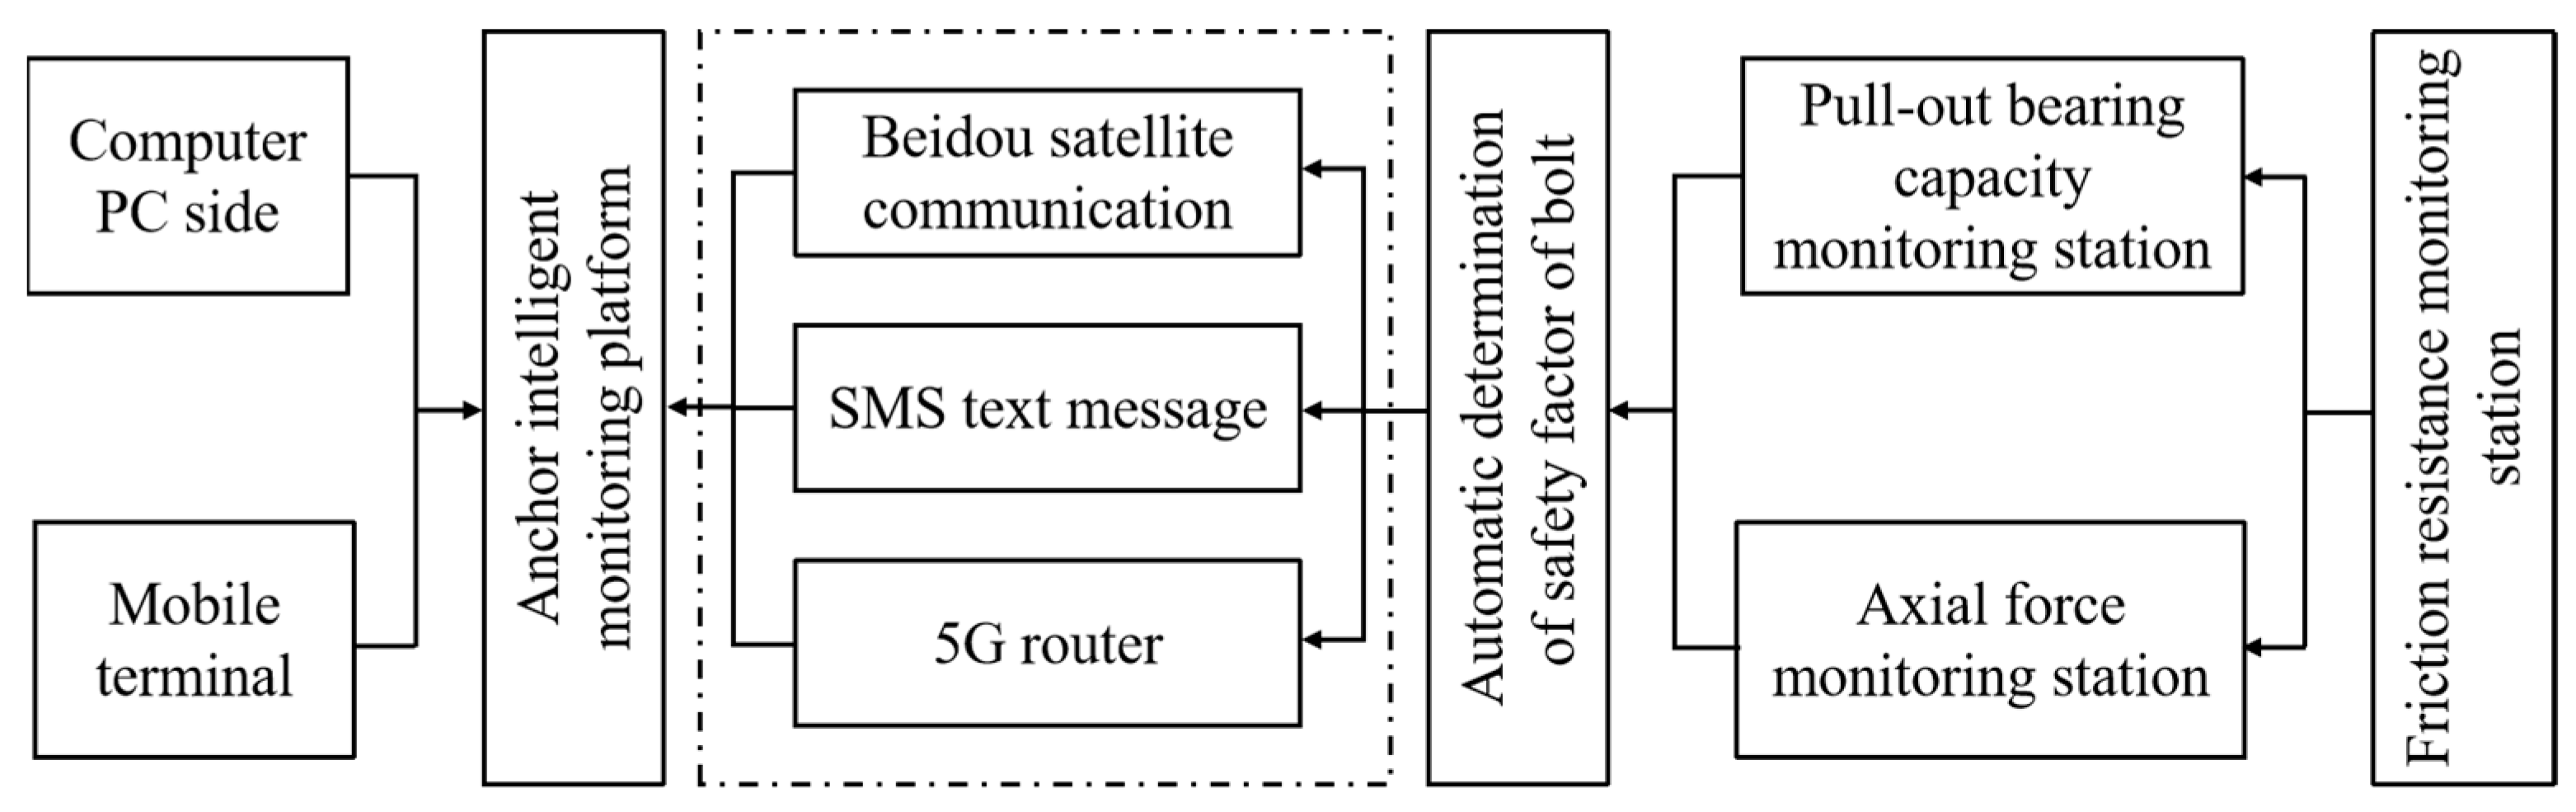
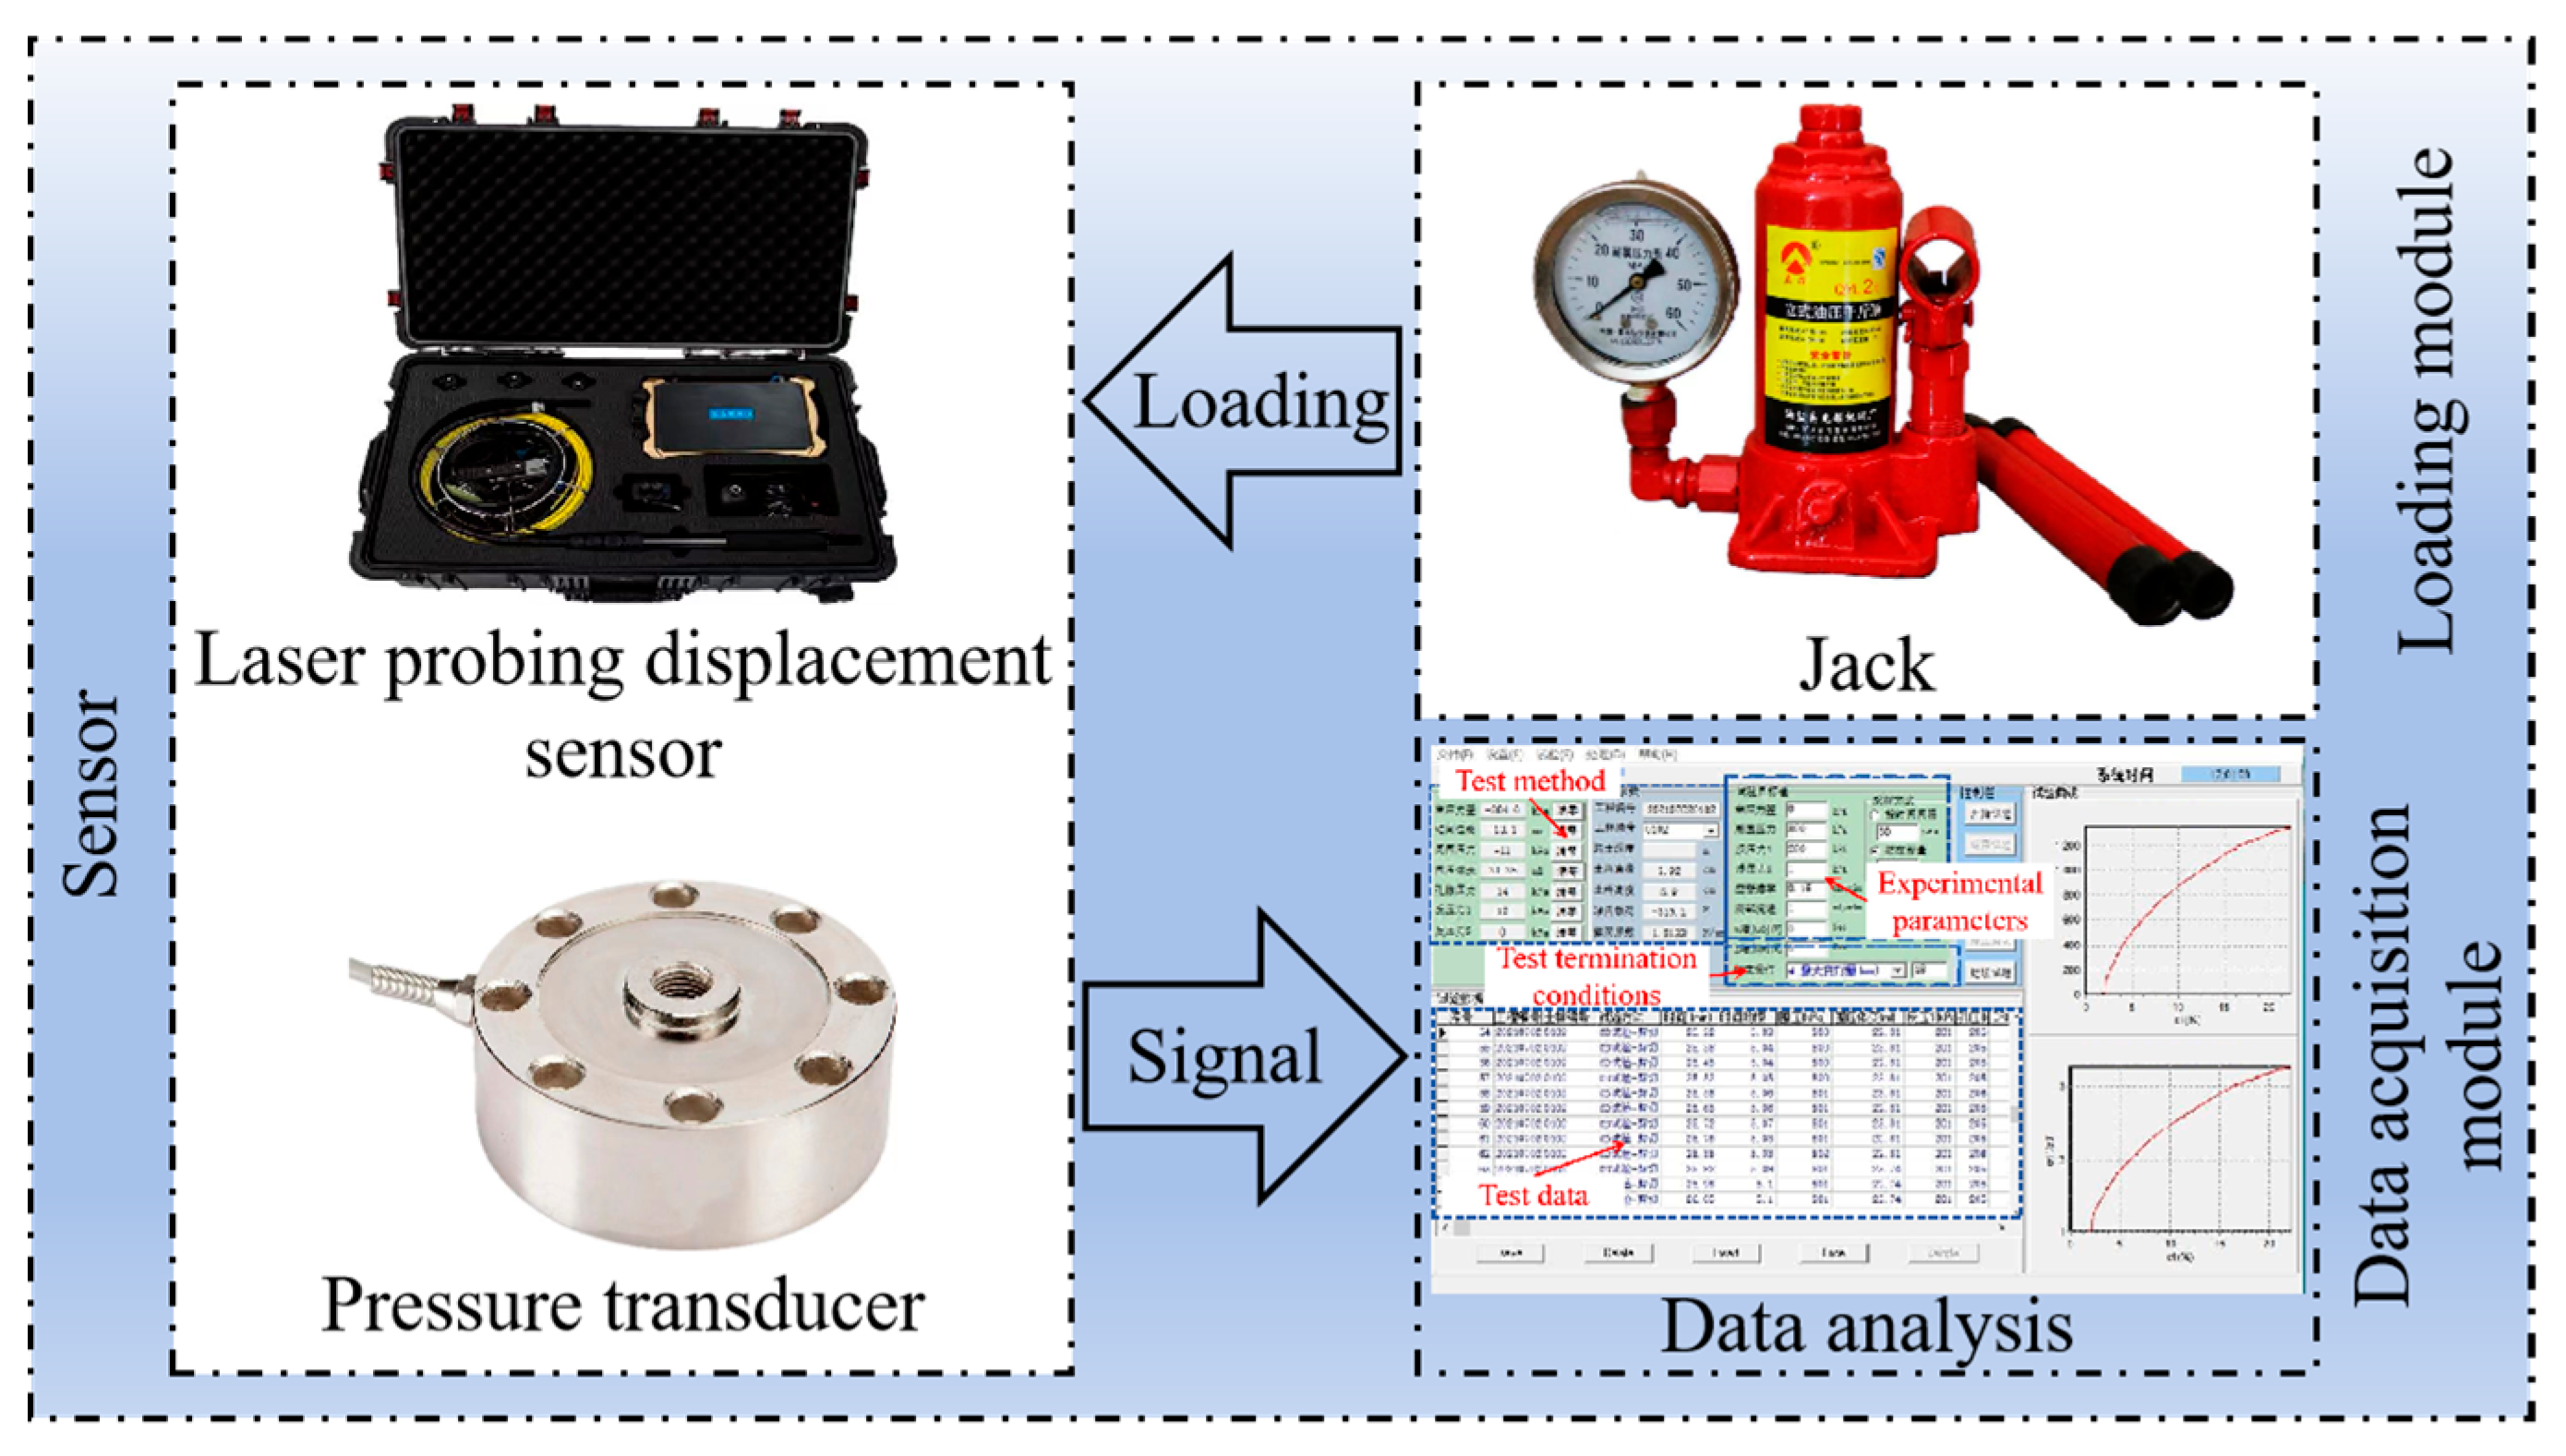
2.2. The Composition of Intelligent Pull-Out Test System for Anchor Rod Is Introduced

The bolt pull-out test system is mainly composed of a loading module and data acquisition module. The load module is mainly composed of a portable high-voltage power source, reaction cylinder, related connectors, nuts, etc. The data acquisition module is composed of analysis software, a signal converter, a display interface and a power supply unit.
The working principle of the intelligent pull-out test system of the anchor rod is shown in Figure 2. During the use of the system, the jack is driven by a portable high-pressure oil pump to apply a load to the wrong rod. At this time, the pressure sensor and the displacement sensor output the collected 4–20 mA signal to the IO module and perform signal conversion. Finally, it is transmitted to the data acquisition module through the USB interface. The data acquisition module features an intelligent data acquisition and analysis terminal that performs real-time analysis and visualization of force and displacement data. The collected data can be directly exported to CSV files and graphical formats.
The working parameters of the staggered rod intelligent pull-out test system are set as follows: drawing force 0–30 t, tensile displacement 0–200 mm, force loading rate 1–20 kN/min, maximum working time 8 h, four-channel acquisition signal.

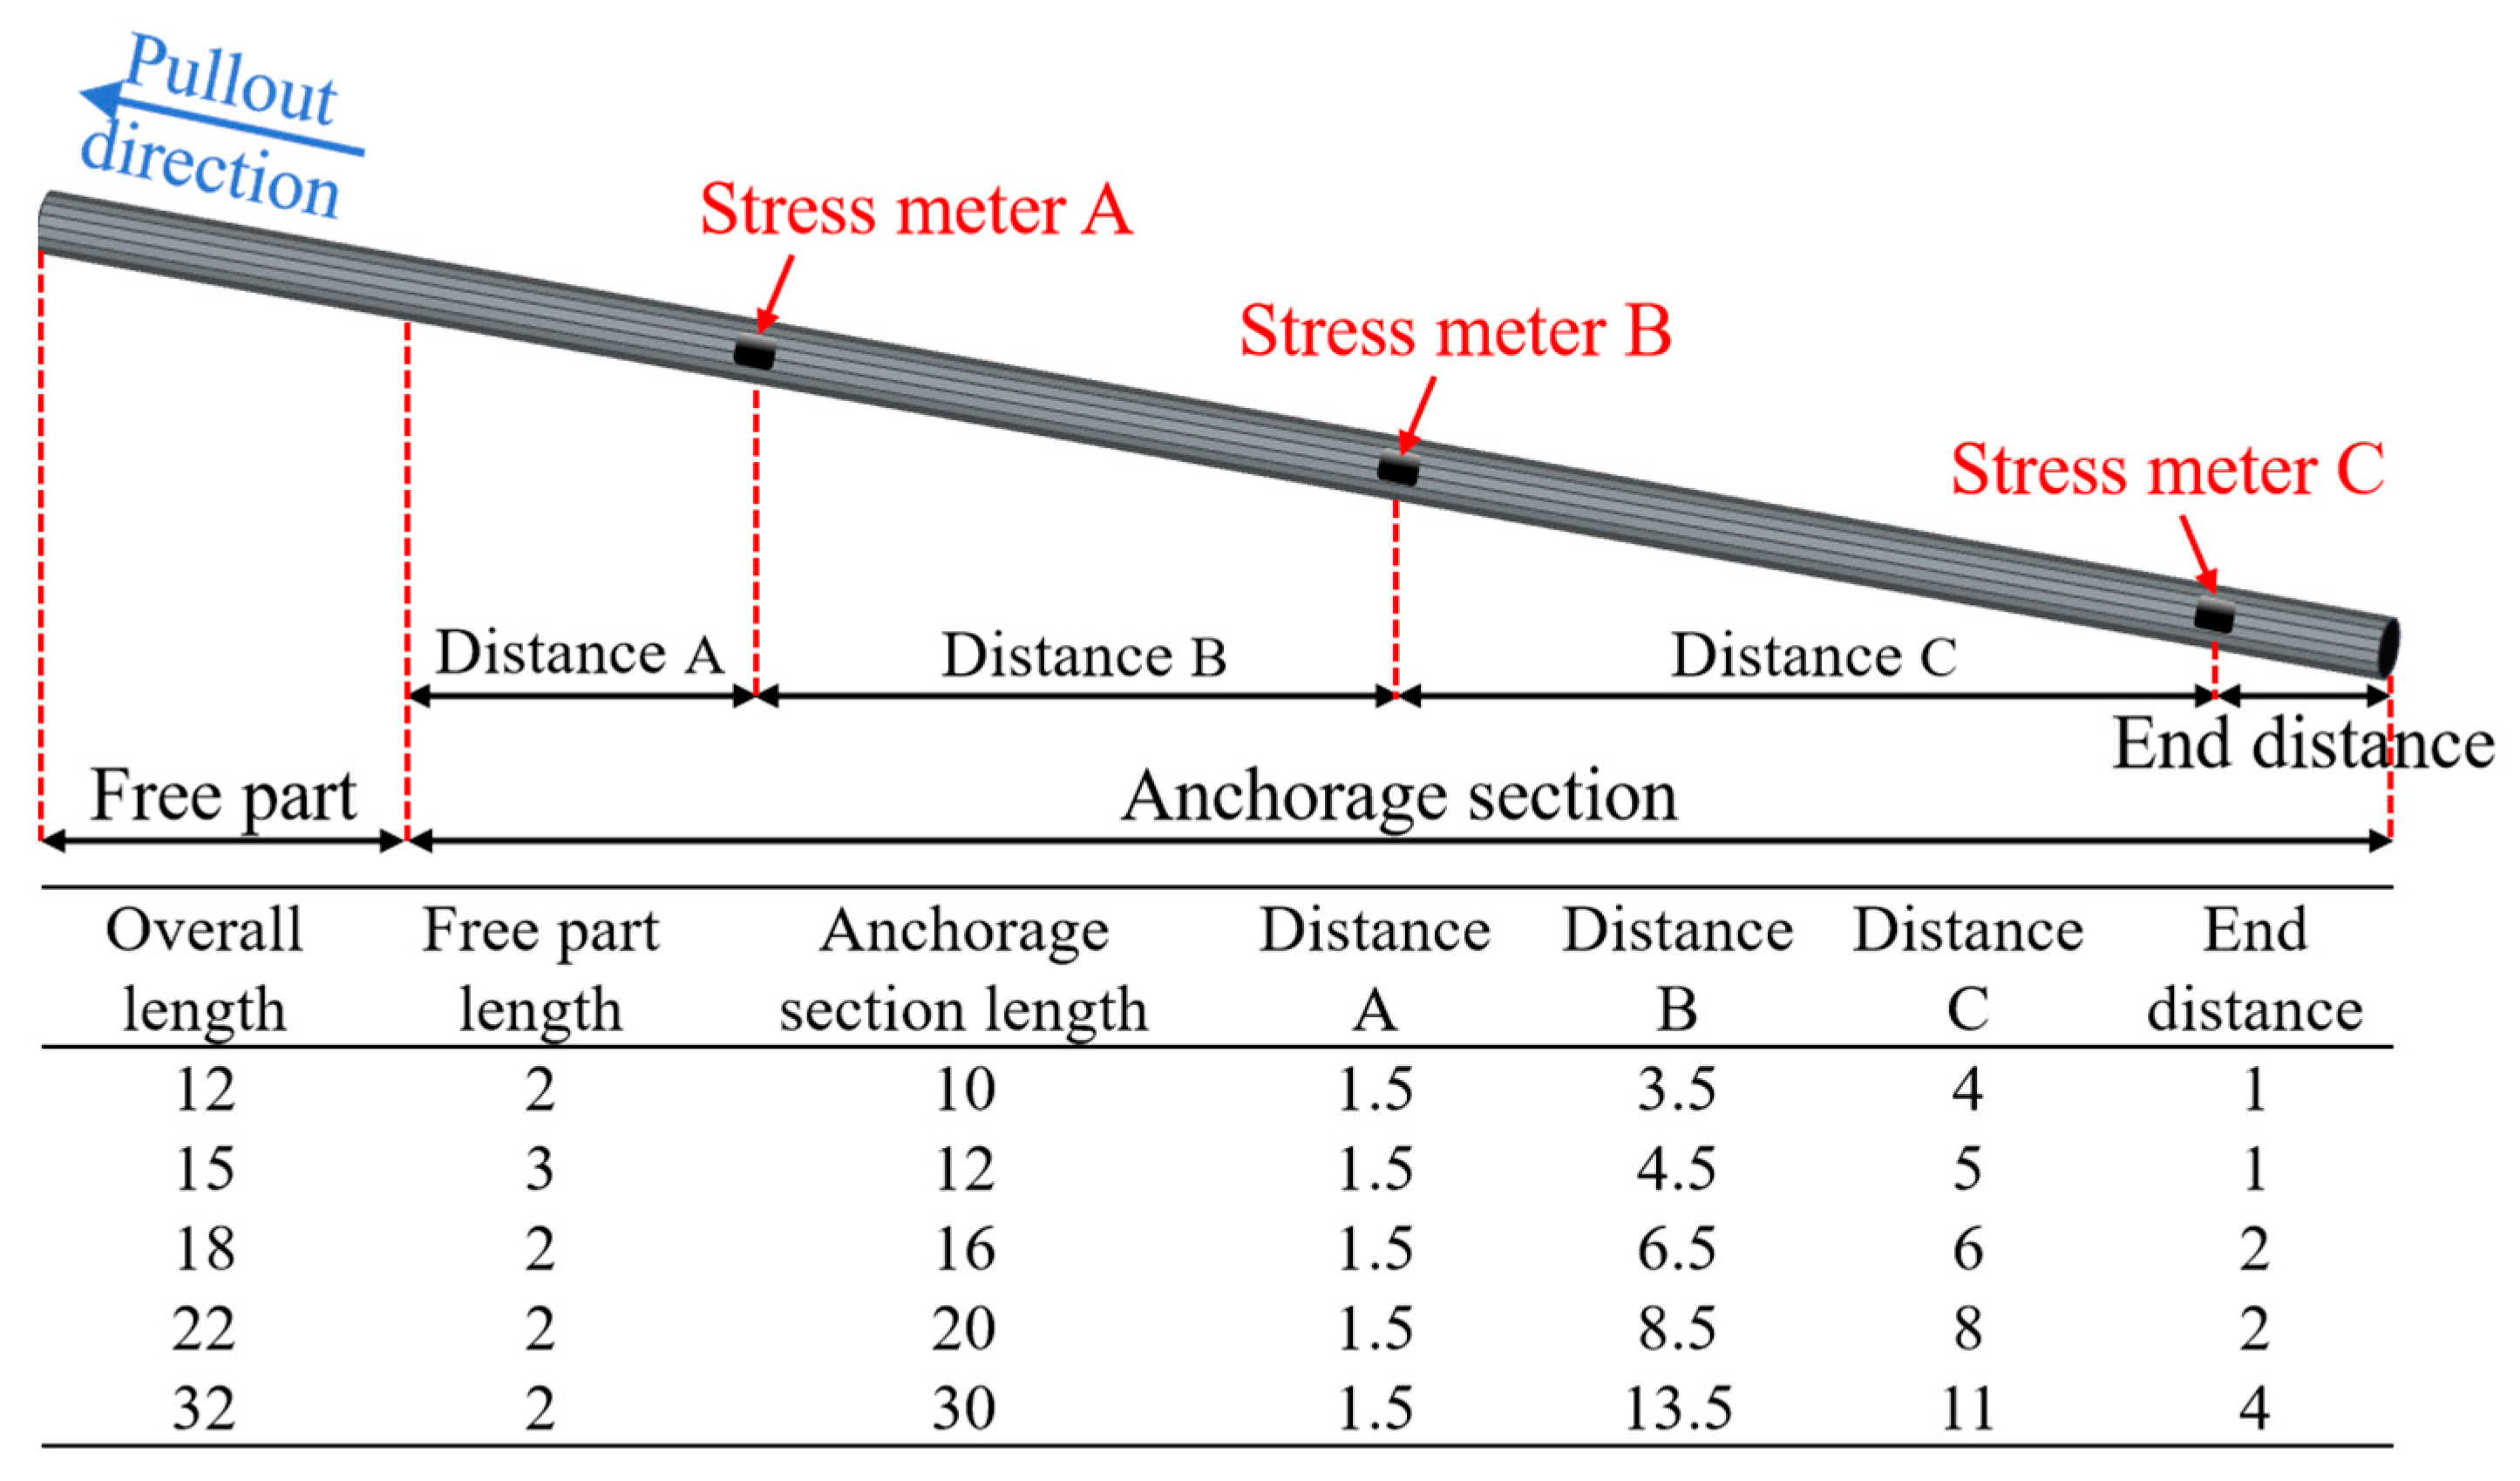
2.3. Dynamic Design of Intelligent Bolt Pull-Out Test

Before initiating the pull-out test, the intelligent pull-out test system must be calibrated to ensure its reliability. The pull-out test is proposed to be carried out using an oil pump and a 50 t hydraulic jack in conjunction with a manual hydraulic pump to pressurize the system step by step. Five kinds of bolts, with lengths of 12 m, 15 m, 18 m, 22 m and 32 m, are selected for the pull-out test. The testing methodology employs a cyclic loading and unloading approach. A displacement sensor is affixed to the outer wall of the jack, enabling it to move with the balance ring and collect real-time displacement signals. After completing the layout of the sensor and the loading system, the jack is connected to the power source sensor and the acquisition system through the tubing, and the data recording software is started to put it in working condition, and then the oil pump is started. By controlling the oil supply rate of the oil pump, the drawing force continues to increase steadily. When the pressure or displacement reaches a predetermined value, the test can be stopped and the test data can be saved. The schematic diagram of the pull-out test is shown in Figure 3.

3. Field Test

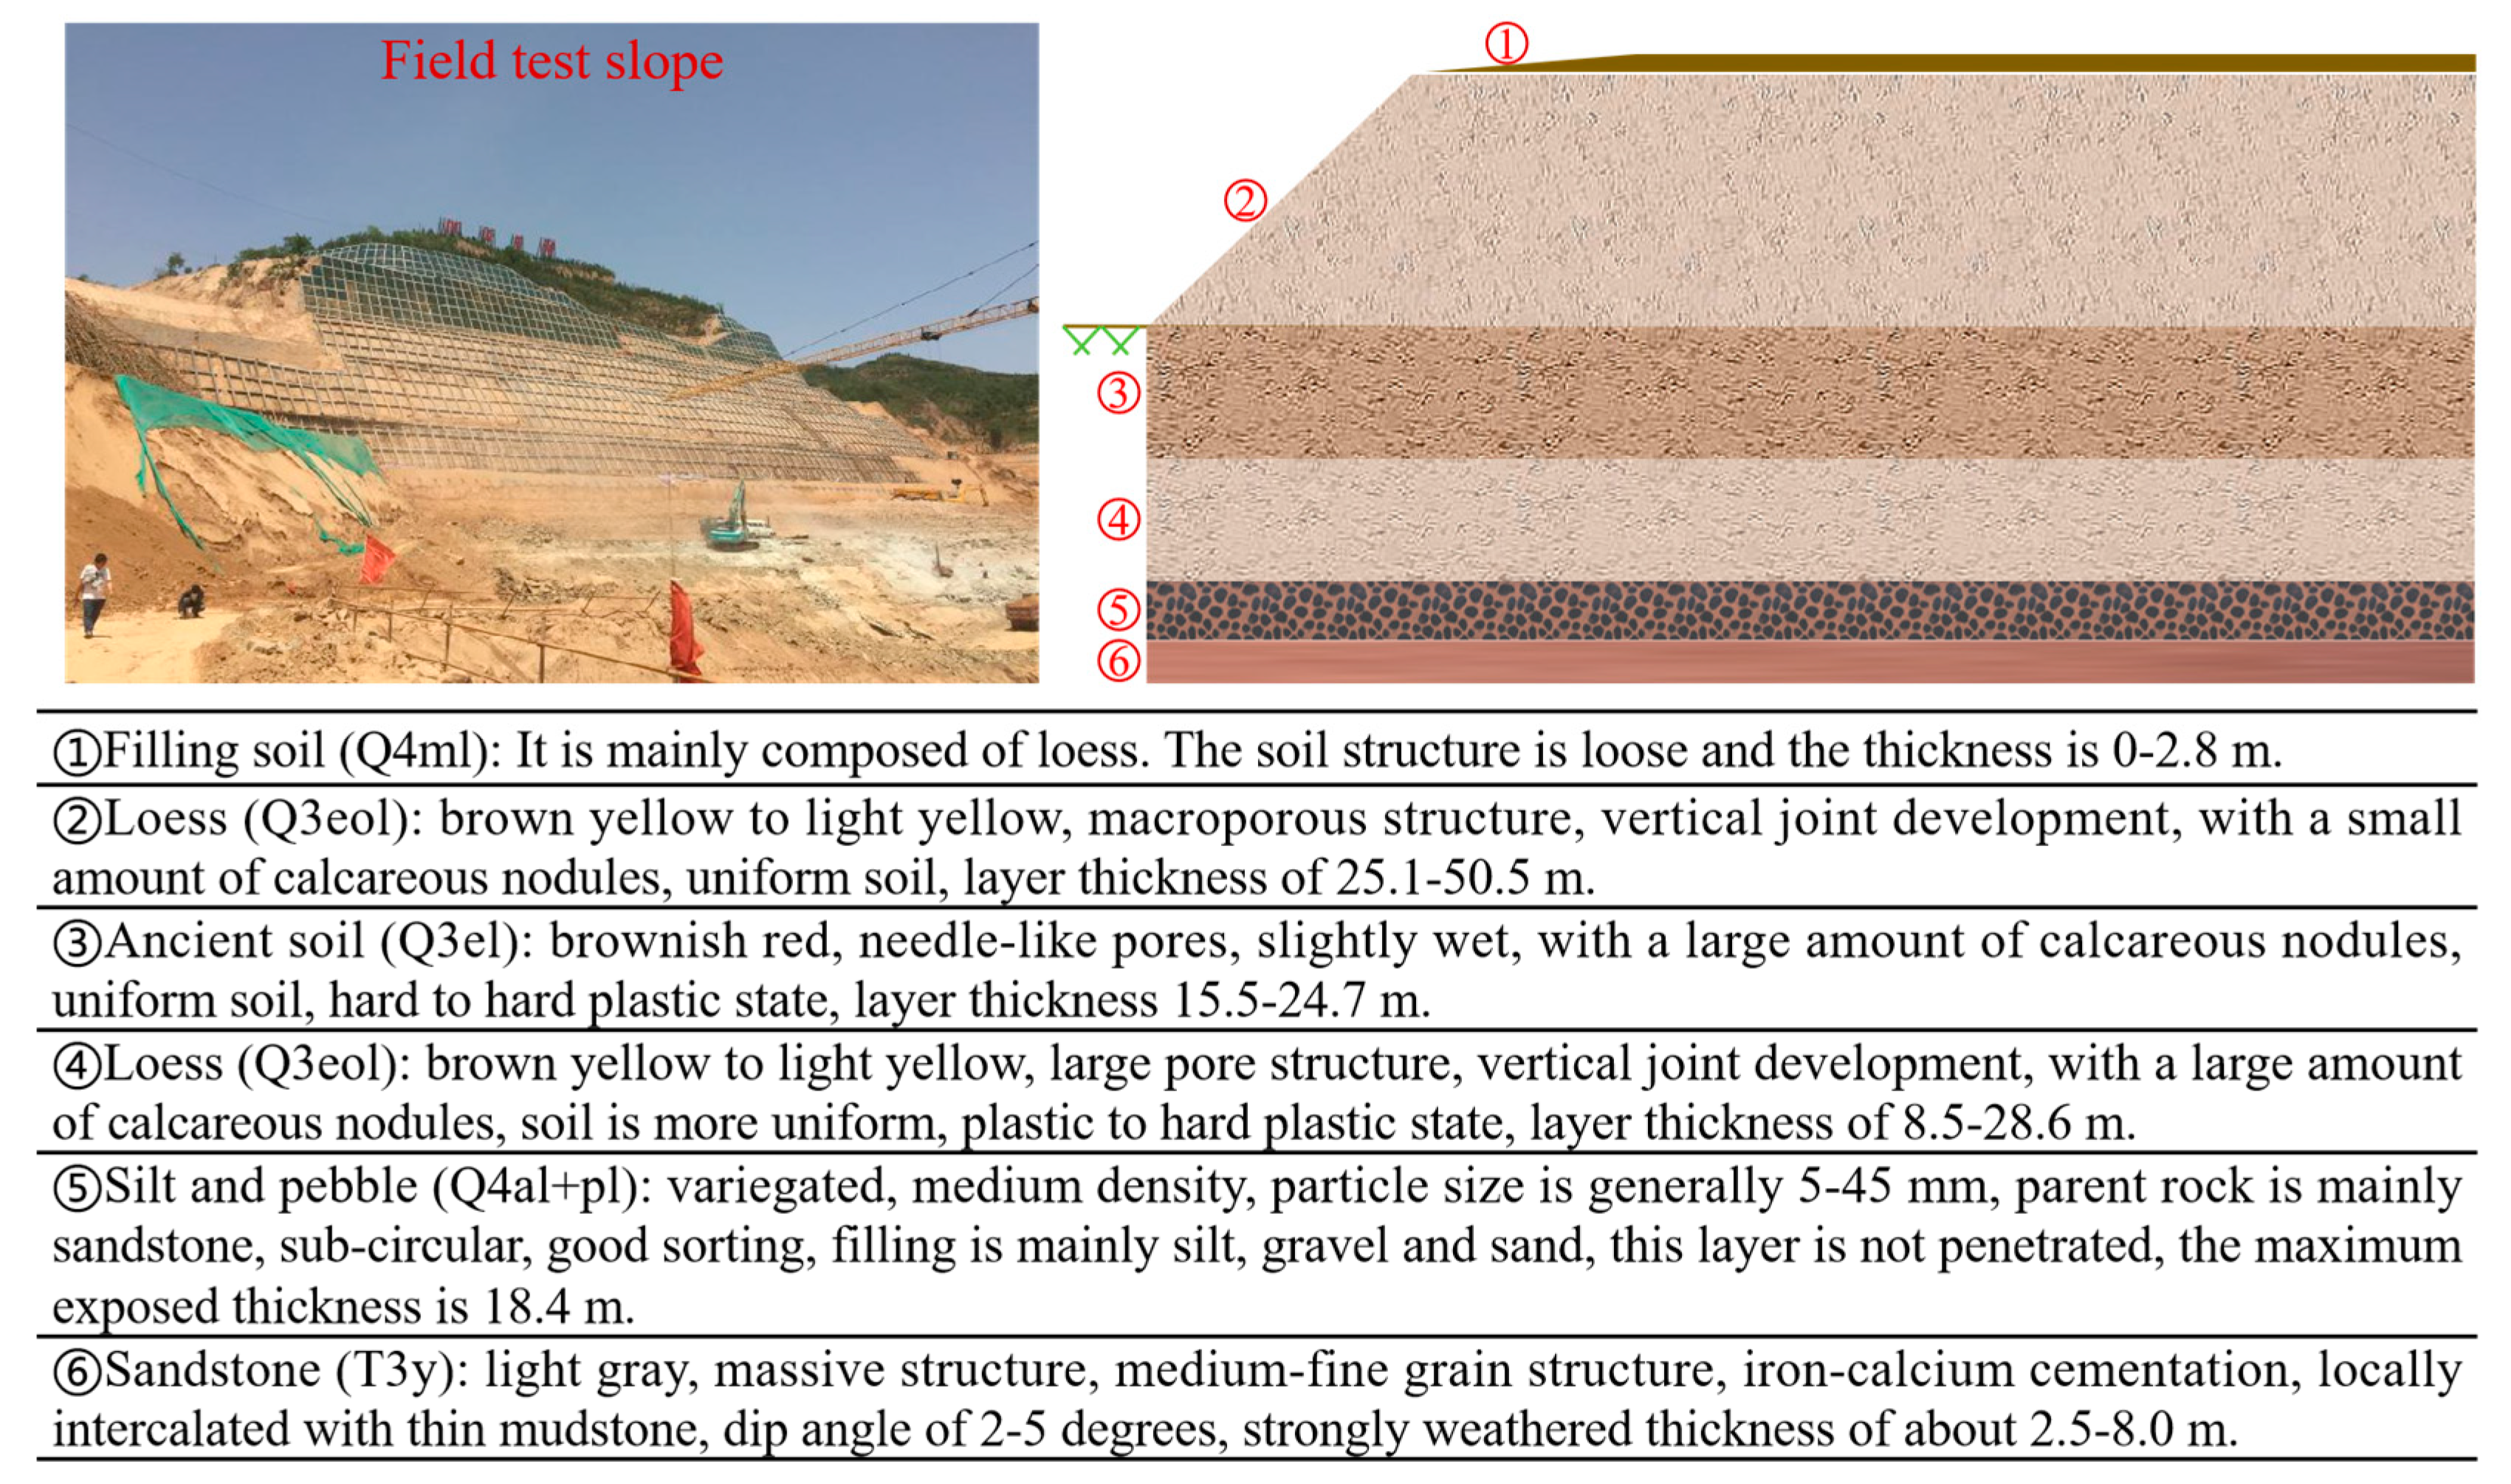
3.1. Engineering Geology

This project is located on both sides of a river in northern Shaanxi, China. The project area covers an area of 70.33 km2. The overall length of the high and steep slope is approximately 2800 m, with a total mountainside area of 126,415 m2. The test area is located in the loess beam slope section; the south slope toe is the government and the planning and construction area; the east and west slope toe is the concentrated residential area; the slope is a 30 m high excavation slope; and the slope gradient is 25–70°. The test location and site formation information are shown in Figure 4.

3.2. Testing Material
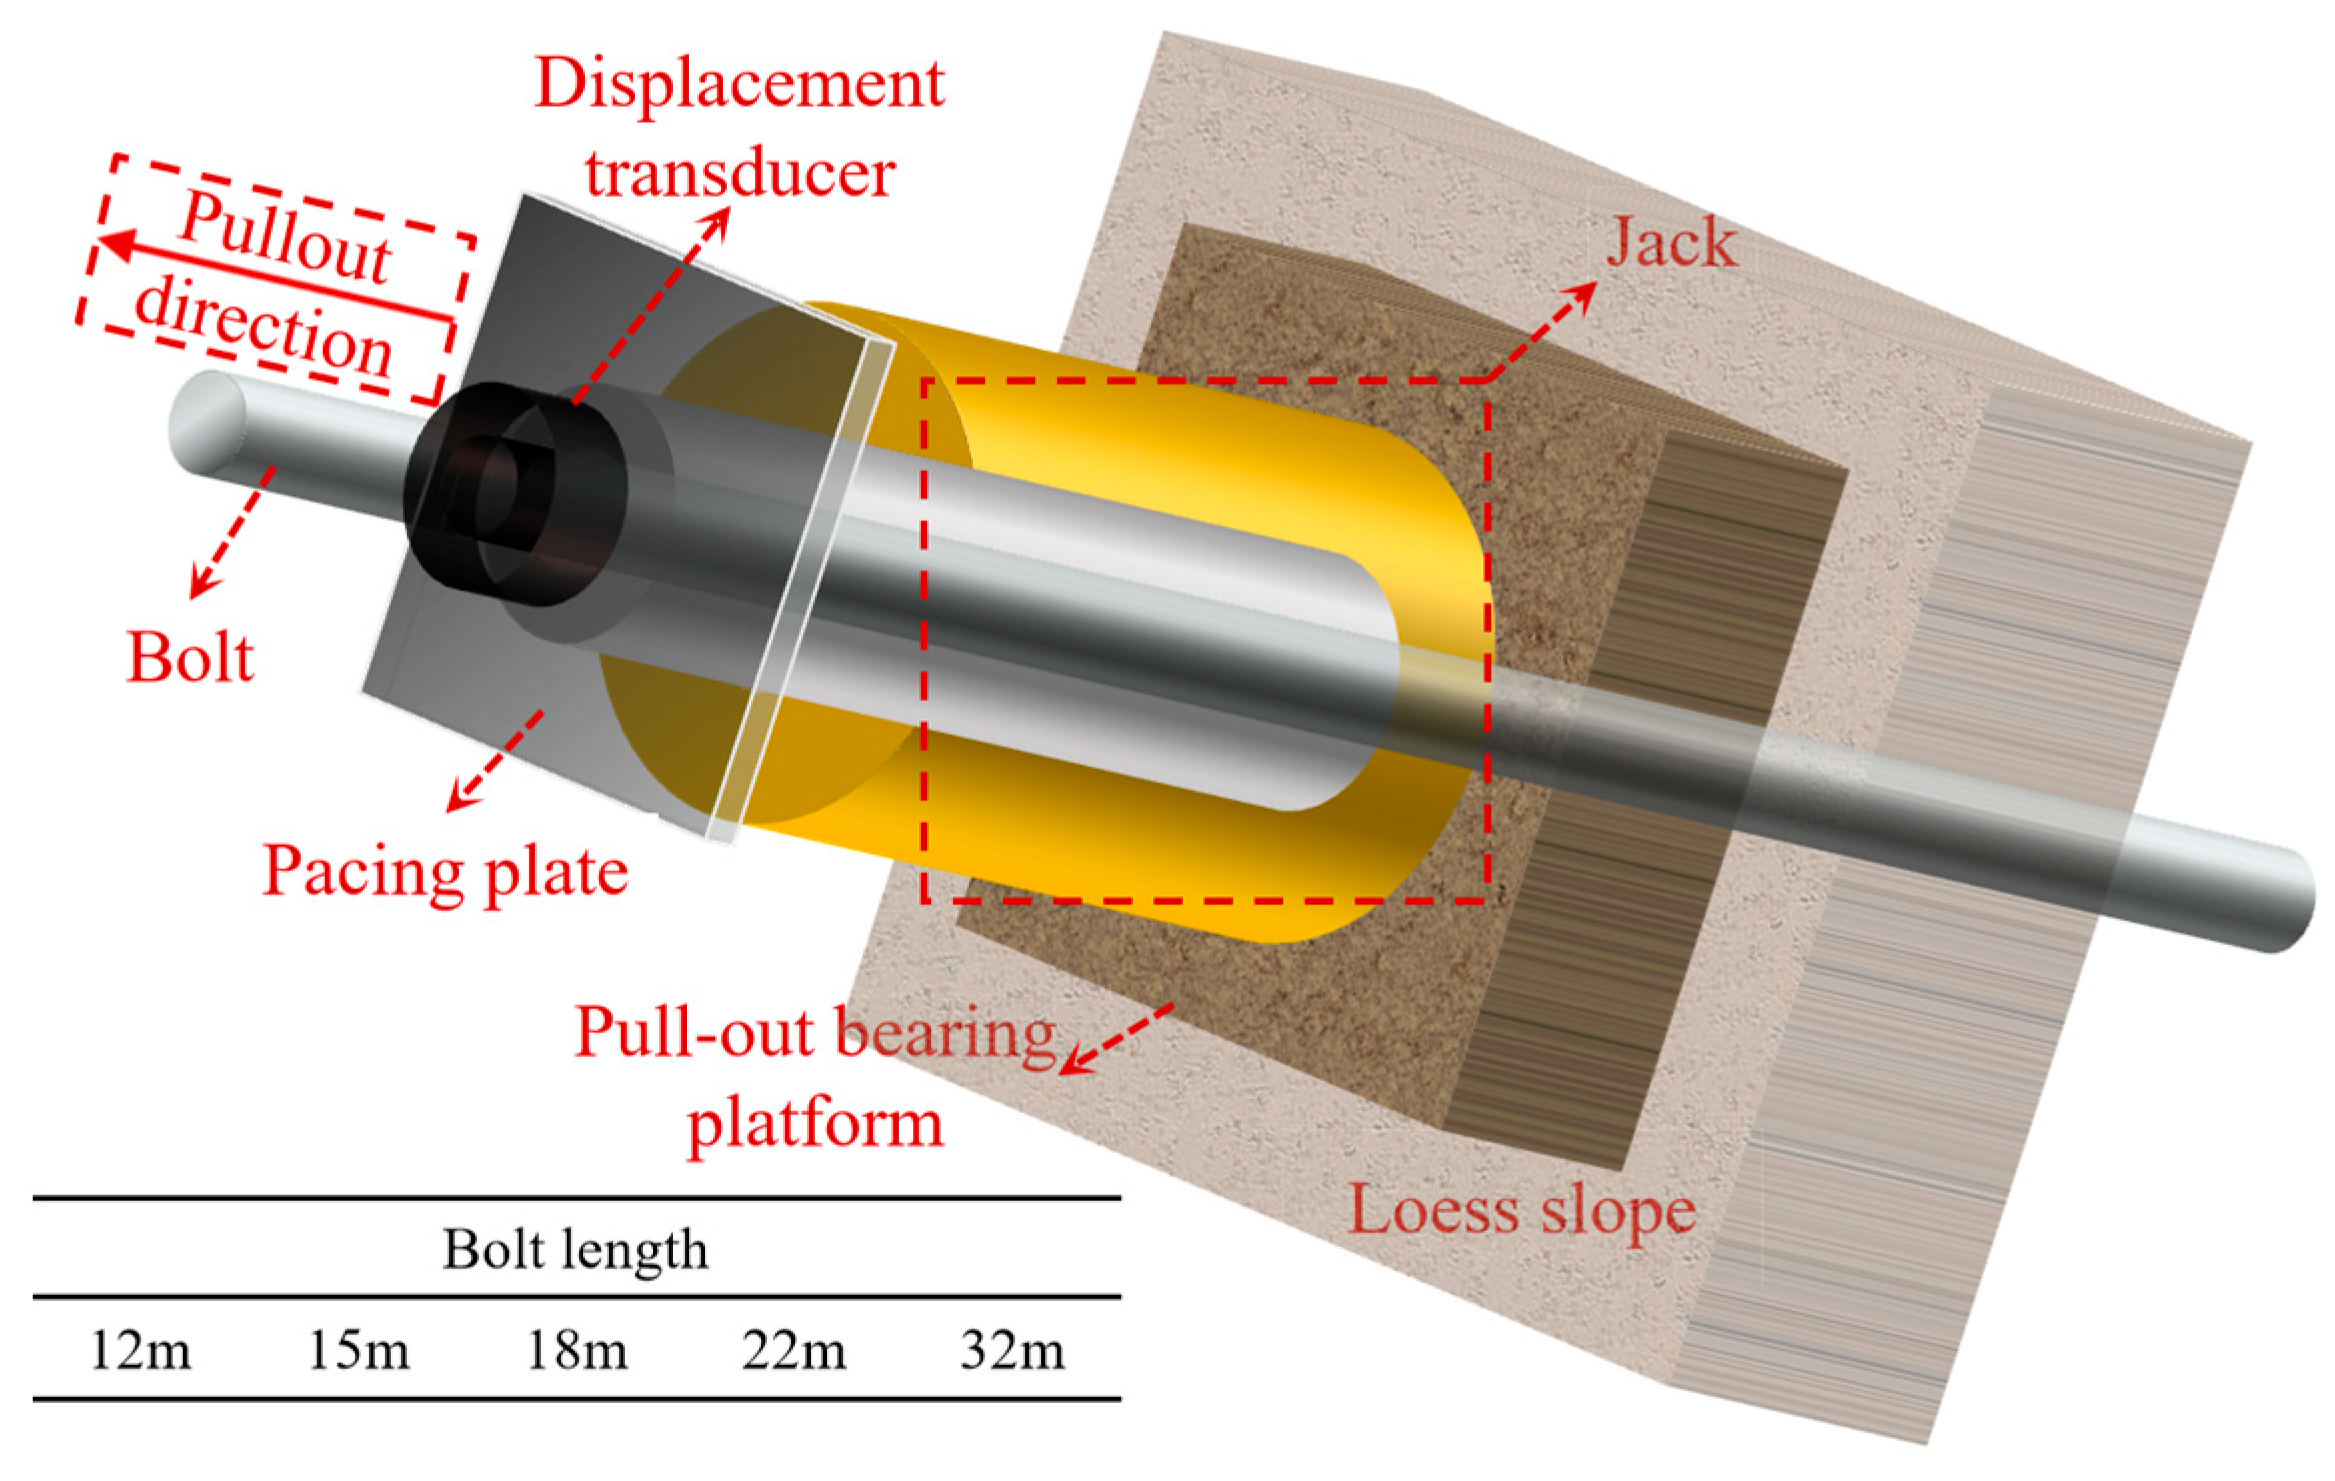
The test site is divided into five levels of slope. According to the size of the section, a number of anchor bolts are set up. The anchor bolts have a length ranging from 12 to 32 m, with a vertical spacing of 2.5 m and a horizontal spacing of 2.0 m. The borehole diameter is 200 mm, and the inclination angle is 15°. The bar is made of HRB400 steel with a diameter of 28 mm. The entire anchorage section is grouted, and the pull-out equipment is installed in the free section. The mechanical parameters are detailed in Table 1.
The test utilizes the JMZX-432B steel bar stress meter to monitor the axial stress of the bolt. The stress meter is connected to the steel bar via a steel casing. During the stress process of the bolt, the steel bar stress meter deforms and its frequency changes accordingly. The JMZX-300X portable comprehensive tester is employed to collect test data. The JMZX-432B steel bar stress meter and JMZX-300X portable comprehensive tester used in this test are produced by Changsha Jinma Measurement and Control Technology Co., Ltd. (Changsha, China) The arrangement of the stress meter is illustrated in Figure 5.
The test equipment uses an oil pump and a 50 t hydraulic jack. The hydraulic jack is placed between the pallet and the nut, the nut is tightened, and a certain amount of prestress is applied. Then, the manual hydraulic pump is used to gradually increase the pressure. The cyclic loading and unloading method is used to pull out the bolt. The loading and unloading force at each stage is 40 kN. After the load is applied or unloaded at each stage, the pressure value of the hydraulic gauge, the displacement of the rod end and the frequency of the stress meter are read. The displacement of the rod end is measured by a dial gauge with a range of 50 mm. The displacement is measured three times for each stage of loading and unloading. Once the cumulative variable of the three dial gauge readings is less than 0.1 mm, the first stage load is loaded and unloaded until it is destroyed.

3.3. Pull-Out Test

Before the start of the test, the following preparations are required:
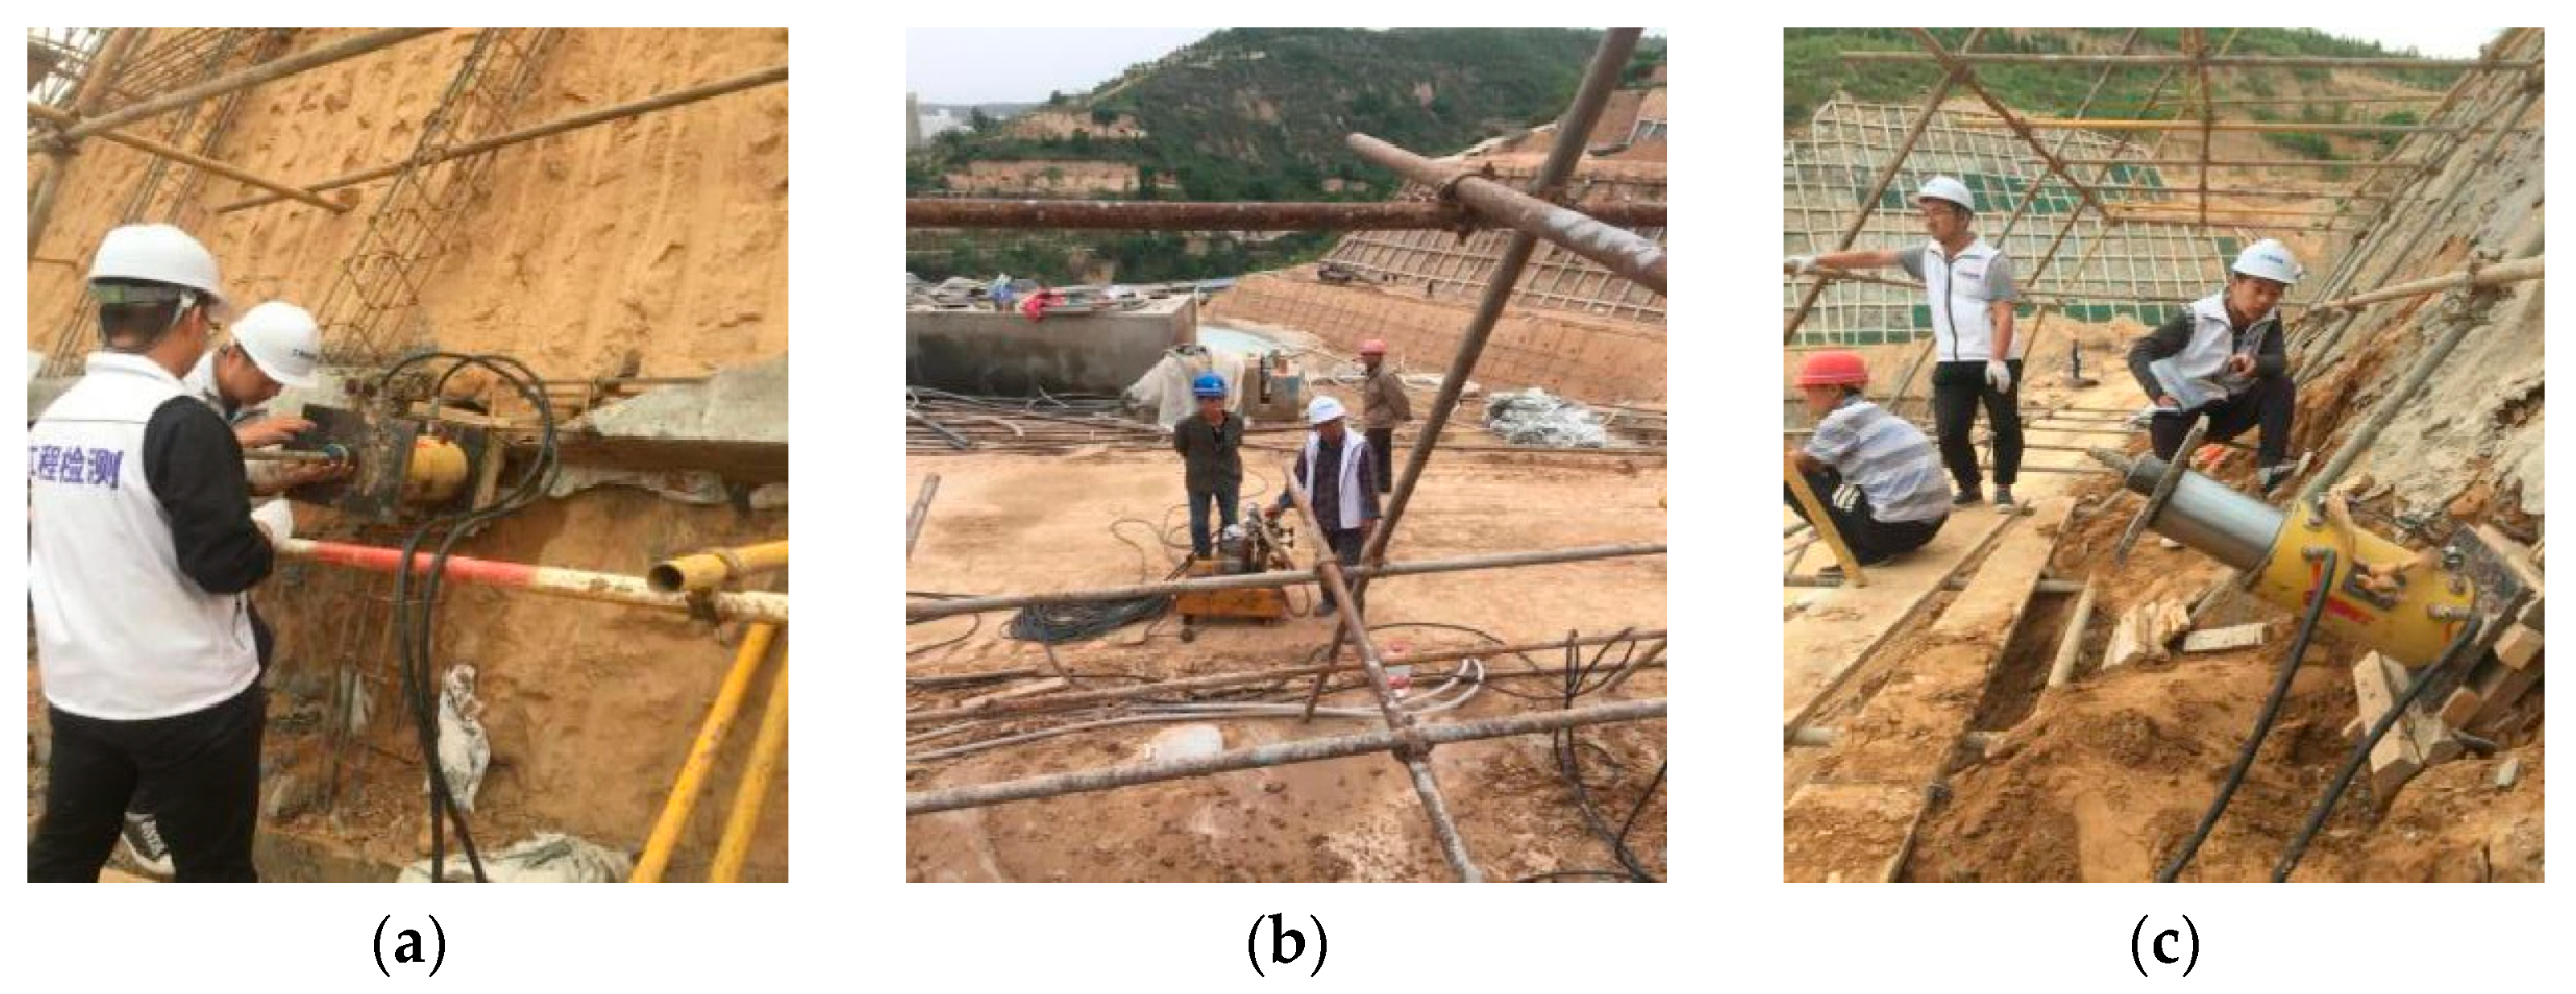
  • Drilling: The drilling is performed using a crawler rotary jet drilling rig. The vertical spacing between drill holes is 2.5 m, and the horizontal spacing is 2.0 m. The diameter of each drill hole is 200 mm. The drilling direction has a horizontal inclination angle of 15°, and all drill holes are located at the same depth within the slope.
  • Bolt installation and grouting: The anchor rod is assembled according to the design length, and the positioning bracket and steel bar stress meter are installed before being manually inserted into the hole. M25 cement paste, with a water–cement ratio of 0.45:1, is injected into the hole using a two-stage grouting process. First, normal pressure grouting is performed at a pressure of 0.3–0.5 MPa. After 2 h, secondary grouting is carried out by inserting the grouting pipe to the bottom of the hole, with a pressure of 1.0–1.5 MPa. Pull-out tests are conducted after 28 days of curing following the grouting.
The procedure for the field pull-out test is illustrated in Figure 6. According to the “GB50330-2013 Technical Code for Building Slope Engineering” [23] loading must be terminated under the following conditions: (1) Starting from the second loading cycle, the displacement increment at the rod end caused by the current load is at least twice that of the previous load’s increment. (2) The displacement of the soil nail becomes unstable. (3) The soil nail rod shows signs of damage. The load applied at the end of the test is recorded as the maximum test load, and the ultimate uplift bearing capacity is determined as the load value just before reaching this maximum test load.

4. Test Result Analysis

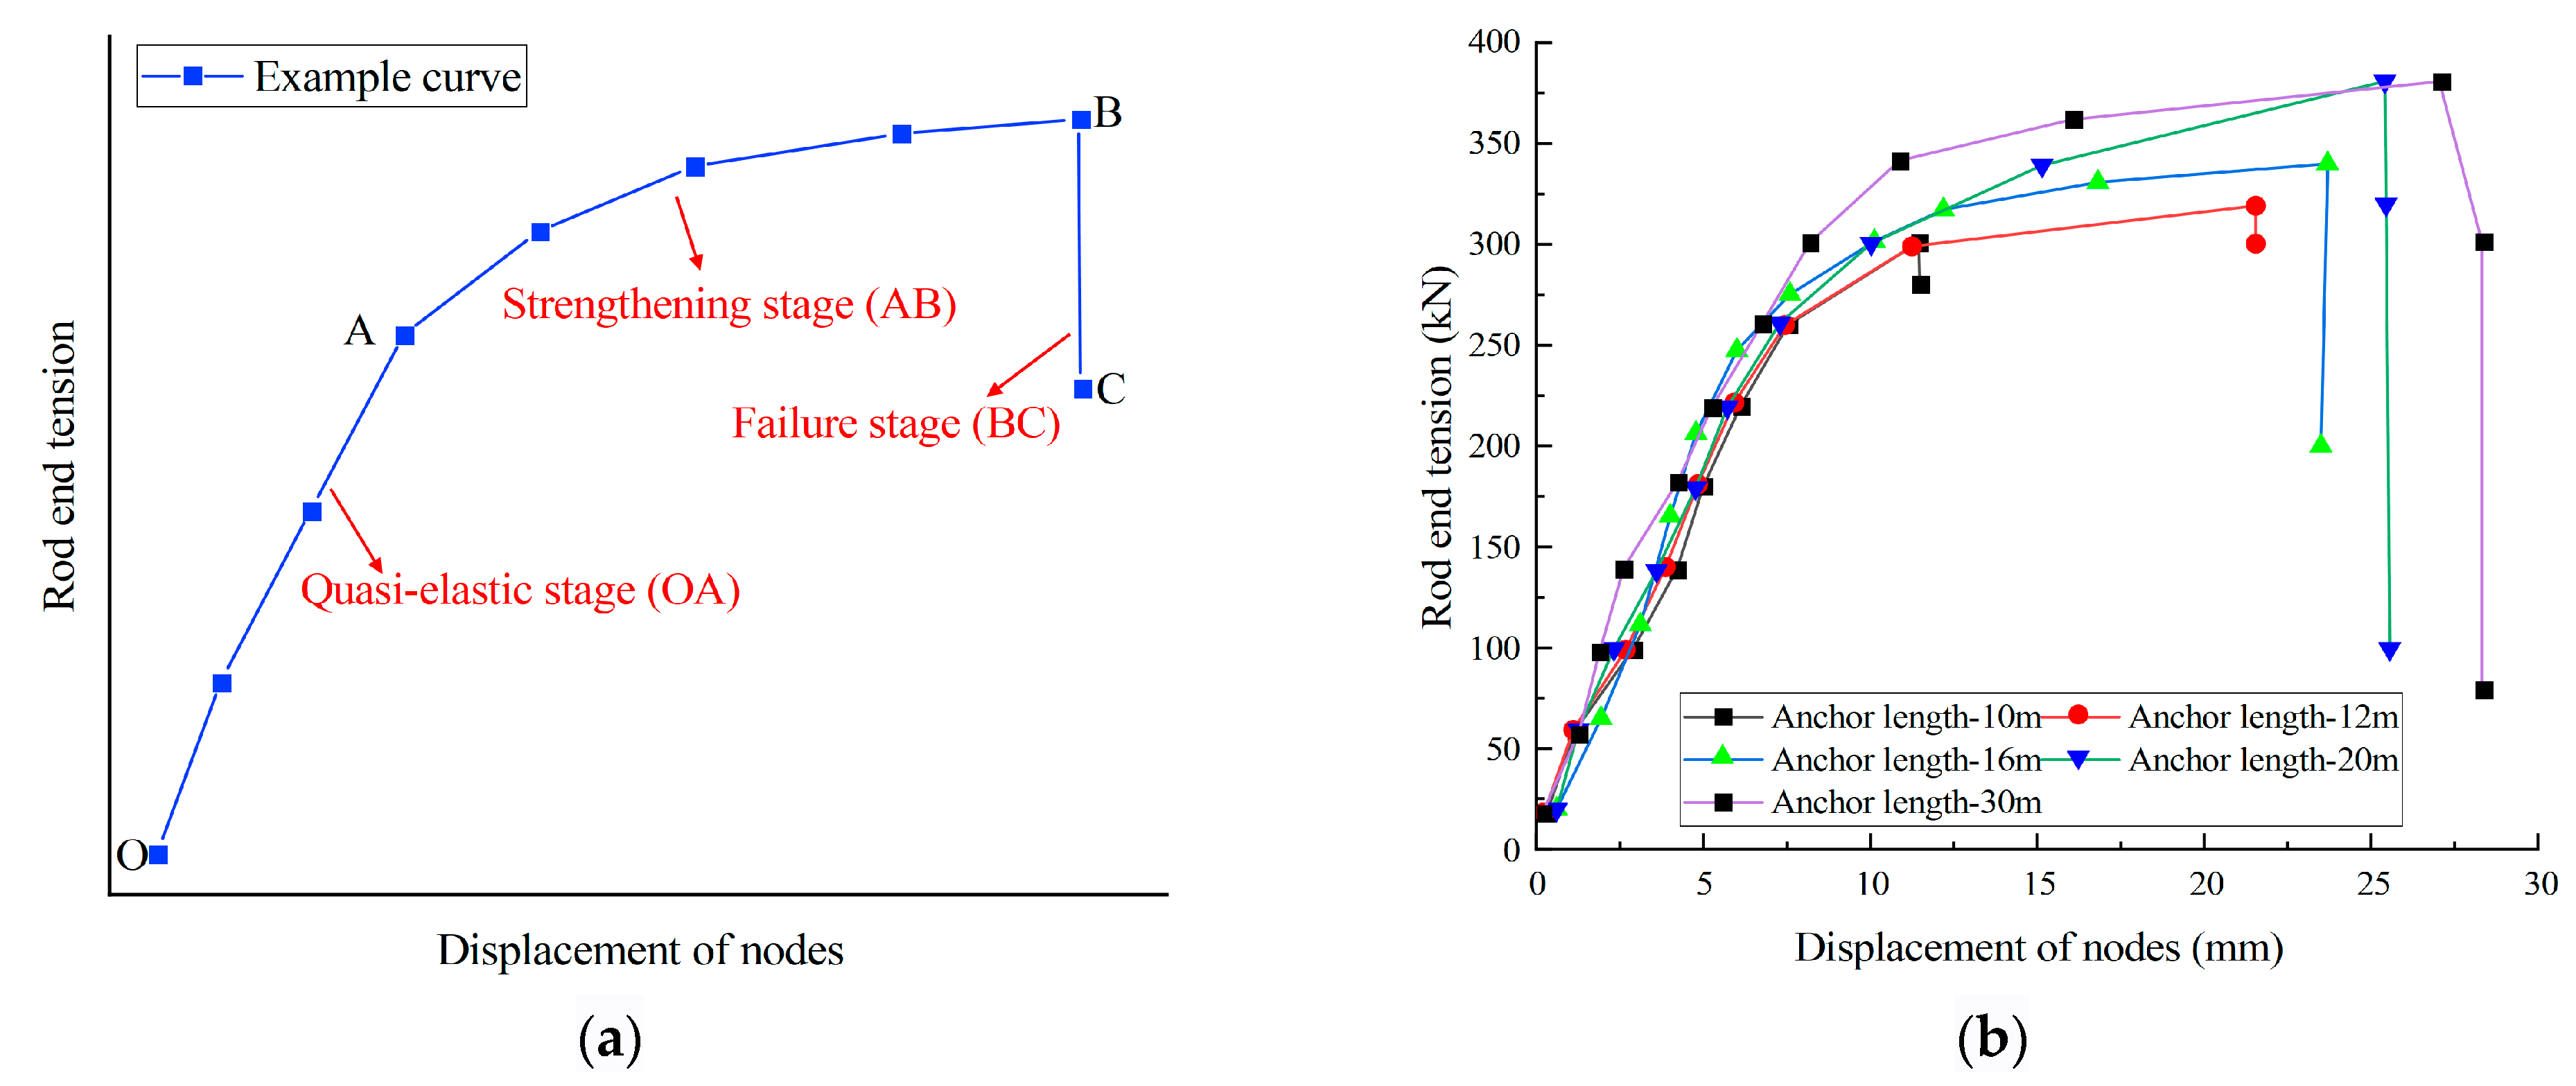
4.1. Analysis of Pull-Out Effects of Bolts with Varying Anchorage Lengths

After sorting out the monitoring data, four kinds of bolts with lengths of 12 m, 14 m, 18 m, 22 m and 32 m were selected for force analysis, and the relationship curve between the tension of the rod end and the displacement of the rod end was obtained, as shown in Figure 7.
According to the diagram, the stress process goes through three stages:
(1)
Quasi-elastic stage (OA): the rod end tension and the rod end displacement basically increase linearly, the plastic deformation of the bolt is small, and the rod end tension increases rapidly. The tension value under different anchorage lengths can be found. The load value of point A is the elastic limit.
(2)
Strengthening stage (AB): Different from the previous studies on a pull-out test of short bolts, it is found that when the bolt length is long, the curve shows obvious strengthening characteristics. It is because when the length of the bolt is long, with the increase in the tension at the end of the bolt during the drawing process, the friction force, cohesive force and other resistance between the bolt and the rock and soil mass are not evenly exerted. The longer anchorage section enables the bolt to mobilize more rock and soil to participate in the bearing, so that more rock and soil are activated and play a bearing role, which leads to the continuous increase in the tension at the end of the rod and shows the strengthening characteristics. In addition, with the increase in the pull force of the rod end during the drawing process, the relative displacement between the anchor rod and the rock and soil mass increases, and the friction force also increases. The longer anchor rod provides a larger friction area, resulting in the rod end tension continuing to rise, and shows strengthening characteristics. At the same time, when the bolt length is long, the curve does not show the yield characteristics. This is because, compared with the short bolt, the stress distribution of the long bolt body is not uniform. With the gradual increase in the stress in each part during the drawing process, the whole bolt and rock and soil system gradually exert the bearing capacity, and there will be no stress concentration phenomenon, so that a certain part reaches the yield strength first. The synergistic effect between the longer anchor and the surrounding rock and soil is more significant, and the deformation of the anchor will be constrained and limited by the rock and soil, so that the anchor will not show obvious plastic deformation and the yield phenomenon, as will the short anchor under stress, but will show continuous strengthening characteristics. With the increase in the tension at the end of the bolt, the displacement of the end of the bolt increases rapidly, and the plastic deformation of the anchorage body also increases.
(3)
Failure stage (BC): After reaching the ultimate pull-out bearing capacity, the tension at the end of the rod continues to increase, and the anchorage body disengages and slips or the bolt body is destroyed. The tension value decreases rapidly, and the displacement at the end of the rod remains unchanged or increases. The failure mechanism of the failure stage mainly has the following two aspects: First, the anchorage body disengages and slips. During the pull-out process of the bolt, the load is mainly transmitted by the cohesive force between the bolt and the surrounding rock and soil. With the increase in the tension at the end of the rod, after reaching the ultimate uplift bearing capacity, the bonding force at the interface between the bolt and the rock and soil is gradually overcome. At the same time, the displacement of the rod end increases rapidly in the strengthening stage, and the plastic deformation of the anchorage body increases, which makes the relative displacement between the bolt and the rock and soil mass accumulate continuously, which leads to the aggravation of the failure of the bonding surface. Finally, the anchorage body disengages and slips, the bolt cannot effectively transfer the load to the surrounding rock and soil mass, and the tension value decreases rapidly. The second aspect is the failure of the anchor rod body. In the strengthening stage, the anchor rod body produces a certain plastic deformation. With the continuous increase in the drawing force, once the plastic deformation accumulates to a certain extent, the bearing capacity of the rod body decreases sharply, which eventually leads to the failure of the rod body, and the tension value also decreases rapidly.
By examining the tension values for different anchorage lengths, it is observed that the tension at the rod end in the quasi-elastic stage ranges from 0 to 220 kN. As shown in Figure 7, when the anchorage length is 10 m, the rod body enters the strengthening stage after the tension at the rod end reaches 180 kN. The tension is less than the yield load value of the bolt, at 246 kN, and the displacement of the rod end is 4.9 mm. With the increase in the tension of the rod end, when the displacement of the rod end reaches 11.5 mm, the anchorage failure enters the failure stage. The tension value is only 300 kN, which is less than the failure load value of the bolt, at 332 kN. The anchorage body disengages and slips, which is manifested in the failure stage.
When the anchorage length is 12 m, 20 m and 30 m, the rod end tension reaches 220 kN and then enters the strengthening stage. The corresponding rod end displacements are 5.8 mm, 5.7 mm and 5.3 mm, respectively. The rod end tension continues to increase, and the rod end displacement increases rapidly. The curve changes from steep to slow, and the convex is obvious. When the anchorage length is 12 m, the rod end tension reaches 320 kN. When the rod end displacement reaches 21.5 mm, the failure mode of the anchorage is identical to that observed with an anchorage length of 10 m. At this point, the rod end tension increases by only 20 kN, and the rod end displacement increment reaches 10 mm. For anchorage lengths of 20 m and 30 m, no disengaging and slipping occur in the anchorage body. As the load increases, the rod end tensile force reaches 380 kN, exceeding the failure load of the anchor rod, leading to the destruction of the rod body. The corresponding displacement of the rod end is 25.3 mm and 27.2 mm, respectively, which shows that the curve of the failure stage has a significant steep drop, and the tensile force of the rod end decreases rapidly.

4.2. Analysis of Ultimate Uplift Bearing Capacity

Based on the results of the pull-out test, the tensile load and displacement of the rod end are summarized in Table 2, which is used to determine the ultimate pull-out bearing capacity.
Based on the criteria for determining the ultimate uplift bearing capacity of the anchor rod, the data in Table 2 show that the displacement increments at the rod end for anchor rods with anchorage lengths of 10 m, 12 m, and 16 m are 300 kN, 320 kN, and 340 kN, respectively. These increments are 2.8 times, 2.7 times, and 3.1 times greater than those produced by the previous load. Therefore, the ultimate uplift bearing capacity is 260 kN, 300 kN and 320 kN. The displacement increments of the last-stage loading of the anchor rod with the anchorage lengths of 20 m and 30 m are 2.0 times and 2.2 times that of the displacement increment of the previous stage loading, and the rod end tension–rod end displacement curve has a steep drop section at 380 kN. Therefore, the upper rod end tension of 340 kN and 360 kN is taken as its ultimate uplift bearing capacity. The curve representing anchorage length vs. ultimate pull-out bearing capacity is presented in Figure 8.
From the diagram, it can be seen that with the increase in anchorage length, the ultimate uplift bearing capacity increases, but the two do not increase linearly, and the growth ratio is different. The anchorage length increases from 10 m to 12 m and 16 m; the length increases by 20% and 33%, respectively; the ultimate bearing capacity increases by 15.4% and 26.9%, respectively, and the growth ratio is about 0.8. The anchorage length is increased to 20 m and 30 m, respectively; the length is increased by 100% and 200%; the ultimate bearing capacity is increased by 23.1% and 38.5%; and the growth ratio is about 0.2. By comparison, it is found that the growth ratio is the same when the anchorage lengths are 12 m and 16 m, and the ultimate bearing capacity is obviously improved by 0.8. When the anchorage length reaches 20 m, the growth ratio is only 0.2, and the ultimate bearing capacity increases little with the increase in length. When the anchorage length increases from 20 m to 30 m, the ultimate bearing capacity only increases by 11.8%. Therefore, by increasing the length of the bolt, the improvement of the ultimate pull-out bearing capacity is limited. The anchorage length of the long bolt in the loess layer selected in this test is recommended to be 10–16 m.
According to the above test results, the anchorage length has a non-linear relationship with the ultimate pull-out bearing capacity. The reason is that, compared with the short anchorage length, the tension diffusion attenuation of the long anchorage length is large, the stress of the distal rock and soil mass is small, and the contribution of the new length to the bearing capacity is reduced. With the increase in anchorage length, the bolts pass through different regions; the bearing contribution of some regions is limited, and the stress transfer is uneven, which makes the bearing capacity growth nonlinear.
The growth rate of pull-out capacity decreases with the increase in anchor length. The analysis shows that with the increase in anchorage length, the relative displacement between bolt and rock mass is more likely to be unevenly distributed. In the process of long bolt drawing, the loading end first shows a large relative displacement, which leads to the failure of interface bonding force, the occurrence of interface slip, and the decrease in friction force and bonding force. With the development of slip, it will gradually expand to the depth, which will reduce the bearing efficiency of the whole anchorage section. From the perspective of the effectiveness of friction resistance, the friction resistance is unstable due to the uneven stress distribution and the change in rock and soil properties. In the long anchorage section, the normal stress of the deep rock and soil is relatively small. According to the law of friction, the friction force is proportional to the normal stress, so the friction resistance provided by the deep rock and soil is limited. In addition, due to the attenuation of stress transfer, the deformation of deep rock and soil is small, and it is difficult to give full play to its frictional resistance.

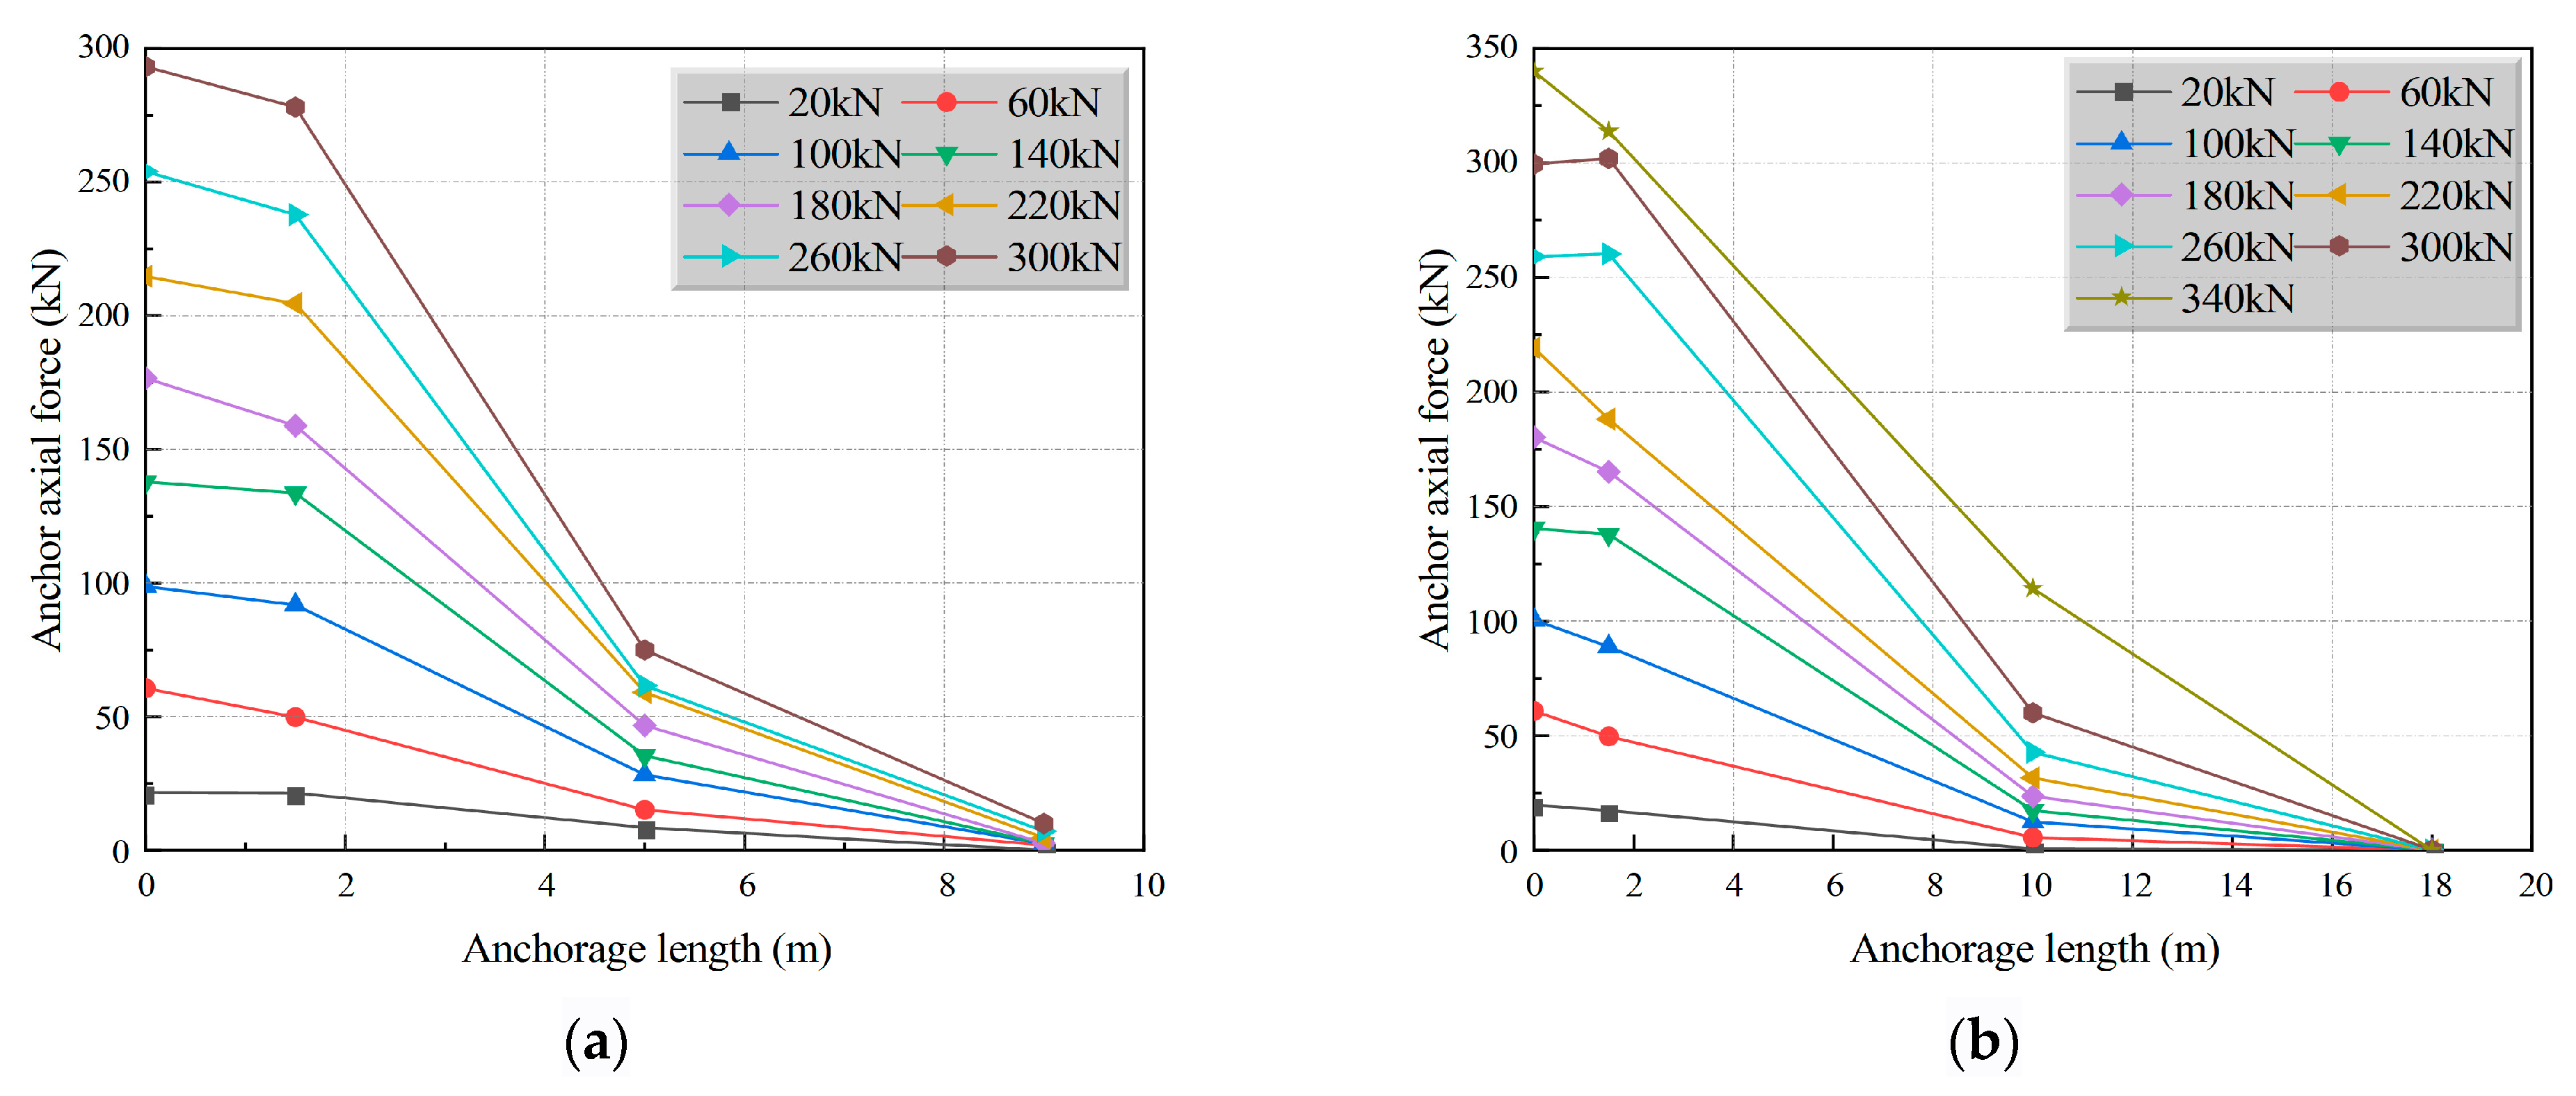
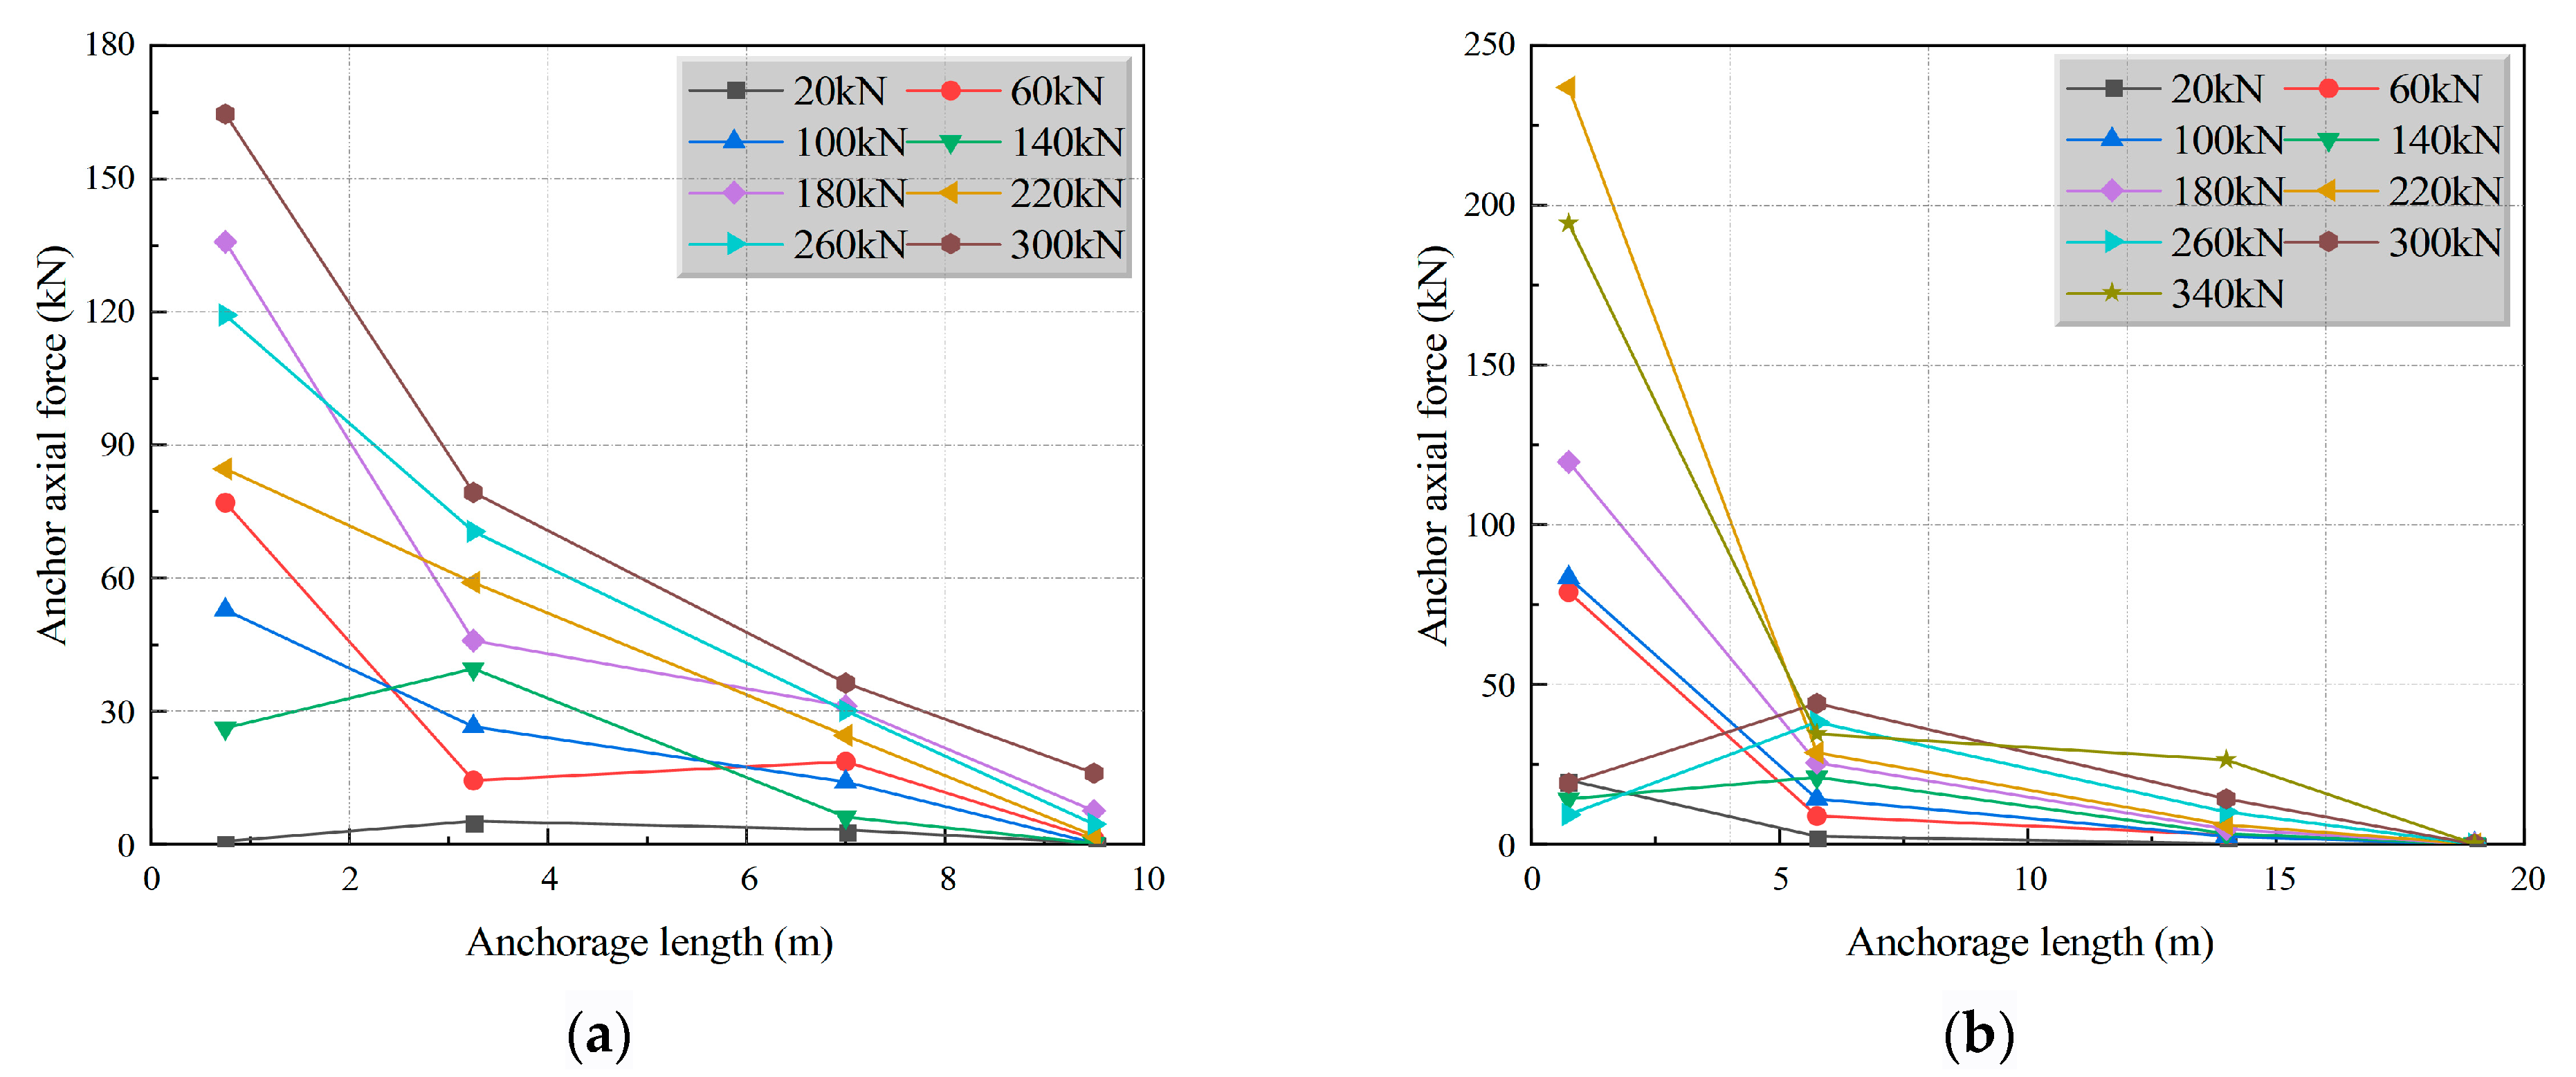
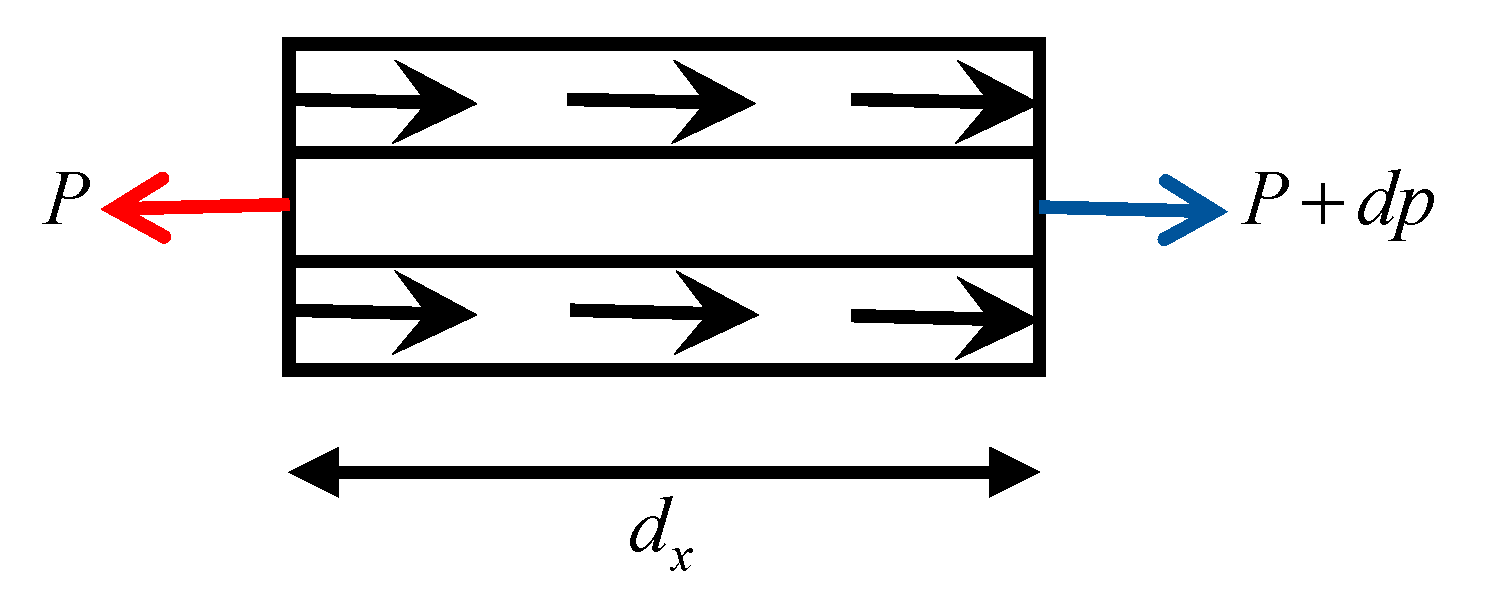
4.3. Distribution Law of Axial Force and Friction Resistance of Bolt

By monitoring the steel bar stress gauges during the pull-out test, the axial force for each measured section under various levels of tensile load is calculated, as illustrated in Figure 9, and the distribution of friction resistance is shown in Figure 10. Since the stress distribution of anchors with anchorage lengths of 20 m and 30 m is similar, anchors with anchorage lengths of 10 m and 20 m are selected for stress analysis.
As shown in Figure 9, the axial force in the bolt gradually increases with the increase in tension at the bolt end. However, it decreases along the direction of the anchorage depth, with the greatest attenuation occurring in the first half of the bolt body. When the tension at the end of the rod is less than the elastic ultimate load value (180 kN when the anchorage length is 10 m, and 220 kN when the anchorage length is 20 m), the curve is concave; as the tension at the end of the rod continues to increase, the anchorage body enters the strengthening stage. The curve is obviously convex at the end of the anchorage body. For a bolt with an anchorage length of 20 m, when the tension at the end of the bolt reaches its ultimate pull-out bearing capacity, the curve becomes a smooth straight line. The axial force in the bolt approaches its maximum value, which is approximately one third of the tension at the end of the bolt.
Through comparison, it is observed that under varying rod end tensions, the axial force of the anchor rod with both anchorage lengths exhibits a gradual attenuation along the anchorage depth. However, the patterns of attenuation differ across various stress stages. The reason for the attenuation of the shorter anchor is that the anchorage length of the short anchor is shorter, the tension can be directly diffused into the surrounding rock and soil, and the stress equilibrium state can be reached quickly between the rock and soil and the anchor, which shows that the attenuation degree is relatively small. Secondly, the short anchor involves a small range of rock and soil, and the properties of the anchored rock and soil are relatively uniform, which makes the axial force attenuation more stable. The reason for the attenuation of the long anchor is that the tensile force transmission path of the long anchor is long, and the stress transmission gradually weakens as the depth increases, resulting in uneven attenuation of the axial force in the long-distance transmission, and the attenuation degree is greater and the distribution is uneven. Secondly, the long anchor passes through a large range of rock and soil, and the properties of rock and soil are obviously different, resulting in different interactions between different positions of the anchor and the rock and soil, which makes the attenuation of the axial force in the long anchor complex and uneven. In addition, the deformation of different parts of the long anchor is inconsistent when it is pulled, which makes the deformation of the rock and soil in some areas inconsistent with that of the anchor, affecting the cohesion and friction, which leads to the reduction of the axial force transmission efficiency, and the attenuation is obvious and uneven.
The axial force In the bolt with an anchorage length of 10 m is relatively more uniform compared to the bolt with a 20 m anchorage length, and the degree of attenuation is reduced. The axial force in a bolt with an anchorage length of 10 m is relatively uniform compared to that of a 20 m bolt, showing less attenuation. When the tensile force at the end of the rod is 300 kN, the axial forces at each measurement point for the 10 m anchorage length are 278 kN, 75 kN, and 10 kN, respectively. The axial force is used for the whole section of the anchorage body. The axial forces in the bolt with an anchorage length of 20 m are measured as 302 kN, 60 kN, and 0.17 kN, respectively. It is observed that the axial force is primarily concentrated in the first half of the anchorage section. By analyzing the above reasons, from the perspective of key sliding behavior, the first half of the anchor rod bears the largest tension, and the shear stress on the interface between the anchor rod and the rock and soil mass is also the largest. When the shear stress exceeds the bond strength or friction strength of the interface, the bond slip phenomenon will occur. Once the key slip occurs, the cohesion and friction between the bolt and the rock and soil will decrease sharply. The effect of transferring the axial force to the rock and soil mass by these forces is greatly weakened, so that the axial force cannot continue to be effectively transmitted to the back half, and can only decay rapidly in the key slip area. From the perspective of stress redistribution, when the rock and soil mass in the first half of the bolt reaches its bearing limit, the stress will be redistributed. The force originally borne by the first half of the rock and soil mass needs to be transferred to the second half of the rock and soil mass. However, the latter half of the rock and soil mass bears less stress in the initial stage, and the exertion of its bearing capacity requires a certain deformation process. At the moment of stress redistribution, the axial force of the first half will decrease rapidly, and the axial force of the latter half will increase relatively slowly. This results in the phenomenon that the axial force attenuates the most in the first half.
It can be clearly seen from Figure 10 that the friction resistance is unevenly distributed along the length of the anchorage body, and the linear distribution trend is not obvious. Specifically, the friction resistance peaks at 0.75 m from the front end of the anchorage body and then gradually decreases as the anchorage depth increases, resulting in a single-peak curve. With the increase in the tension at the end of the rod, the peak friction resistance moves downward when the anchor length is 10 m and the tension value is 140 kN. When the anchorage length is 20 m, the peak friction resistance moves downward when the tension value is 140 kN, 260 kN and 300 kN. This is because the peak friction resistance precedes the convex section of the plastic deformation stage of the anchor body, which corresponds to the axial force of the anchor rod. Following the peak friction resistance, the elastic stage ensues, where there is a gradual attenuation along the depth direction as the rod end tension increases, aligning with the axial force distribution law.
When comparing the friction resistance of bolts with varying anchorage lengths under ultimate pull-out bearing capacity, it is observed that the peak friction resistance remains largely consistent. However, as the depth increases, bolts with longer anchorage lengths exhibit lower friction resistance and a more uneven distribution curve. Taking the average friction resistance of the smooth section of the curve, the average friction resistance of the bolt with an anchorage length of 10 m is 57 kN, while the average friction resistance of the bolt with an anchorage length of 20 m is 30.5 kN, which is reduced by 46.4%. Based on the axial force transfer law of the bolt and the analysis of frictional resistance, it is evident that the strength of the first half of the bolt should be increased when using long bolts to support a slope.

5. Theoretical Analysis

Through field test analysis, under the influence of rod end tension, the frictional resistance of the super-long bolt is concentrated at the frontal one third of the bolt, while the plastic deformation in the remaining two thirds of the bolt is minimal. Therefore, based on the local common deformation theory, the force of the super-long bolt is theoretically analyzed in the elastic strain range. It is assumed that the stress in the micro-segment of the anchorage body is linearly related to the relative displacement between the anchorage body and the surrounding rock and soil mass. The mechanical calculation diagram is shown in Figure 11 below:
The total displacement S produced by the anchor under rod-end tension consists of the elastic deformation S 1 of the anchor solid and the relative slip S 2 of the anchor solid and the soil:
S = S 1 + S 2
Shear force per unit length of anchor solid:
q = d p d x
Relationship between anchor solid axial force p x and elastic deformation S 1 :
p x = E a A a ε = 1 4 π D 2 E a d S 1 d x
where A a is the cross-sectional area of the anchor solid; D is the diameter of the anchor solid; and E a is the equivalent modulus of elasticity of the anchor solid.
Substituting Equation (3) into Equation (2) gives the following:
q x = 1 4 π D 2 E a d 2 S 1 d x 2
Assuming a linear elastic relationship between the frictional resistance of the anchor solid and the geotechnical body and the relative slip between them, we obtain:
q = k S 1
where k is the integrated shear modulus.
From Equation (1):
S 1 = S S 2
Substituting Equations (4)–(6) into Equation (2) and combining with the boundary condition: x = 0 , p x = P 0 ; x = L a , p x = 0 solves for:
S 2 = β P 0 k cosh β L a x sinh β L a
where β = k E a A a , L a is the anchoring length and P 0 is the rod end tension.
The axial and frictional forces of the anchor solid under rod end tension are:
p x = P 0 sinh β L a x sinh β L a
τ x = β P 0 π D cosh β L a x sinh β L a
Substituting Equation (8) into Equation (3) and integrating, the elastic deformation of the anchor solid under the rod-end tension S 1 can be obtained:
S 1 = β P 0 k cosh β L a cosh β L a x sinh β L a
Make x = 0 in Equations (7) and (10) and bring in Equation (1) to determine the relationship between the displacement at the rod end and the tensile force at the rod end.
S = β P 0 k coth β L a
According to the theoretical derivation, the calculation formulas of axial force and friction resistance of anchorage body are derived in the range of elastic strain. The comprehensive shear modulus k is calculated according to Equation (11) combined with field test research, and the calculation results are presented in Table 3.
Through theoretical calculation, the comprehensive shear modulus is in the range of 300–800 kPa. The comprehensive shear modulus is influenced by soil properties, soil pressure, bolt length, and the shear characteristics of the interface between the anchorage body and the rock–soil layer. This information can serve as a reference for designing bolt supports in similar loess strata.

6. Conclusions

The intelligent bolt pull-out test system based on the Internet of Things proposed in this paper can play a role in comprehensive monitoring of the bolt pull-out test process, and can provide more basis for deformation analysis and safety state evaluation of supporting rock and soil masses.
(1)
The stress process of bolt rod end tension–rod end displacement is divided into three stages, namely quasi-elastic stage, strengthening stage and failure stage. The stress history of bolts with different anchorage lengths is the same, but the curve shape changes from steep to slow with the increase in anchorage length. Under normal working conditions, increasing the length of the bolt can reduce the deformation of the bolt to a certain extent and effectively exert the passive anchoring effect of the bolt.
(2)
By increasing the length of the anchor rod, the ultimate uplift bearing capacity of the anchor rod can be improved, but the improvement is very limited. The anchorage length of the anchor rod in the loess layer selected in this experiment is suggested to be 10–16 m, which can not only meet the requirements of engineering safety and quality, but also avoid waste and save cost.
(3)
The axial force of the bolt gradually decays along the length direction of the anchorage section, and the axial force decays the most in the first half of the rod body. Compared with the high anchorage length bolt, the axial force of the low anchorage length bolt is relatively uniform, and the range of axial force is increased. The frictional resistance of the bolt is unevenly distributed along the length direction of the anchorage body, reaching a peak at the front end of the anchorage body, and gradually decreasing with the increase in the anchorage length, showing a single peak curve. When the tension at the end of the rod reaches the ultimate pull-out bearing capacity, the peak friction resistance is basically unchanged with the increase in the anchorage length, while the average friction resistance in the middle of the rod body is significantly reduced.
Intelligent bolts can monitor key information in real time and have great application value in many fields. Its further research direction mainly has two aspects:
(1)
Data processing and analysis: With the help of big data and cloud computing, the massive monitoring data generated by the increase in applications are efficiently stored, managed and analyzed, and the rules are mined to accurately predict the performance and safety status ; intelligent algorithms such as machine learning and deep learning are studied, and prediction models are established through historical data training to achieve fault diagnosis and early warning, such as using neural networks to evaluate forces.
(2)
Material and structure design: Explore new materials (such as high-strength alloy steel, composite materials) to manufacture bolt anchors, improve mechanical properties and durability, and ensure the compatibility of materials and sensors; the structure design is optimized to make the installation, maintenance and replacement more convenient, improve the anti-interference ability and reduce the maintenance cost.

Author Contributions

Study conception and design: Z.L. and H.Z.; data collection: J.H.; analysis and interpretation of results: Z.L. and X.L.; draft manuscript preparation: Z.L. and X.L. All authors have read and agreed to the published version of the manuscript.

Funding

The authors received no specific funding for this study.

Institutional Review Board Statement

Not applicable.

Informed Consent Statement

Not applicable.

Data Availability Statement

The raw data supporting the conclusions of this article will be made available by the authors on request.

Conflicts of Interest

Author Xin Li was employed by the company The-First-Company of China Construction Sixth Engineering Bureau Corp., Ltd. The remaining authors declare that the research was conducted in the absence of any commercial or financial relationships that could be construed as a potential conflict of interest.

Nomenclature

FBGFiber Bragg grating
FRPFiber-reinforced polymer
GFRPGlass fiber-reinforced polymer

References

  1. You, Z.J.; Feng, L.J. Integration of industry 4.0 related technologies in construction industry: A framework of Cyber-Physical system. IEEE Access 2020, 8, 122908–122922. [Google Scholar]
  2. Zhang, J.P.; Lin, J.R.; Hu, Z.Z.; Wang, Y.W. Digitally driven intelligent construction. Build. Technol. 2022, 53, 1565–1571. [Google Scholar]
  3. You, Z.J.; Wu, C.; Liu, Z.W. Research review on intelligent construction. J. Civ. Eng. Manag. 2022, 39, 82–87. [Google Scholar]
  4. Zhang, H.Q.; Miao, X.X.; Zhang, G.M.; Wu, Y.; Chen, Y.L. Non-destructive testing and pre-warning analysis on the quality of bolt support in deep roadways of mining districts. Int. J. Min. Sci. Technol. 2017, 27, 989–998. [Google Scholar] [CrossRef]
  5. Liang, M.F.; Fang, X.Q.; Xue, G.Z.; Li, H.W.; Wu, G. Development and field test of FBG bolt dynamometer. J. Min. Saf. Eng. 2017, 34, 549–555. [Google Scholar]
  6. Wang, G.X.; Huang, P.; Zhao, J. Research on early warning threshold of bolt supporting slope and development of intelligent monitoring system. J. Shenyang Jianzhu Univ. (Nat. Sci. Ed.) 2021, 37, 668–675. [Google Scholar]
  7. Lin, L.B.; Dong, X.P. Identification method and experiment of bolt lateral load based on fiber grating sensing technology. J. Xiamen Univ. (Nat. Sci. Ed.) 2023, 62, 576–581. [Google Scholar]
  8. Liu, Q. Research on the Application of Intelligent FRP Bolt in Slope Reinforcement and Monitoring. Master’s Thesis, Harbin University of Technology, Harbin, China, 2021. [Google Scholar]
  9. Cheng, S.H.; Chen, S.S.; Yang, K.H. Self-inspection system for ground anchors monitoring on long-term load change. Transp. Geotech. 2022, 36, 100825. [Google Scholar] [CrossRef]
  10. Bai, X.Y.; Zhang, M.Y.; Kuang, Z.; Wang, Y.H.; Yan, N.; Zhu, L. Application of fiber grating sensing technology in pull-out test on glass fiber reinforced polymer anti-floating anchor. Rock Soil Mech. 2018, 39, 3891–3899. [Google Scholar]
  11. Xu, S.; Guo, M.Z.; Ji, X.B.; Yang, Z.M. Based on intelligent testing system of drawing bolt anchoring force field efficient evaluation method. J. Met. Mine 2022, 551, 56–61. [Google Scholar]
  12. Wang, H.D.; Qin, Y.B.; Cui, T.J.; Ma, Y.D. Remote monitoring and early warning system of Deep foundation pit envelope deformation. J. Liaoning Tech. Univ. (Nat. Sci. Ed.) 2013, 32, 14–18. [Google Scholar]
  13. Liao, Y.; Qiao, S.C.; Huang, H.R.; Deng, Y.; Gui, J.Y.; Yang, T. Support design and application of intelligent monitoring technology for a super high-rise deep foundation pit. J. Guilin Univ. Technol. 2023, 43, 100–107. [Google Scholar]
  14. Huang, M.H. Analysis of Pulling Load Transfer of Rock and Soil Bolt and Monitoring Verification of FRP Smart Bolt. Ph.D. Thesis, Harbin Institute of Technology, Harbin, China, 2014. [Google Scholar]
  15. Cheng, L.K.; Fan, J.L.; Zhang, P.W.; Zhou, J.M. The ways and methods to improve the bearing capacity of geotechnical anchor uplift and its effect. Ind. Constr. 2015, 45, 103–109. [Google Scholar]
  16. Wu, Q. Study on Action Mechanism and Applicability of Recoverable Prestressed Anchor Bolt (Cable). Master’s Thesis, Lanzhou University of Technology, Lanzhou, China, 2022. [Google Scholar]
  17. Mirzaghorbanali, A.; Rasekh, H.; Aziz, N.; Yang, G.Y.; Khaleghparast, S.; Nemcik, J. Shear strengthproperties of cable bolts using a new double shear instrument, ex-perimental study, and numerical simulation. Tunn. Undergr. Space Technol. 2017, 40, 240–253. [Google Scholar]
  18. Malvar, L.J. Tensile and bond properties of GFRP reinforcingbars. ACI Mater. J. 1995, 92, 276–285. [Google Scholar]
  19. Sun, T.; Zhou, F.Y.; Liu, Q.; Yang, J.J.; Liu, T.C. Test study of glass fiber reinforced polymer anchor head. J. China Res. Inst. Water Resour. Hydropower Res. 2017, 15, 250–255. [Google Scholar]
  20. Song, Y.M.; Deng, L.L.; Lv, X.F.; Zhao, Z.X.; Wu, J.N. Study on the law of force transfer of anchoring system in bolt drawing process. J. Min. Saf. Eng. 2008, 35, 1122–1128. [Google Scholar]
  21. Xiao, T.Q.; Li, H.M.; Li, H.Y.M. Wang. Pull-out properties of bolt with different anchorage length. J. Min. Saf. Eng. 2017, 34, 1075–1080. [Google Scholar]
  22. Tu, B.X.; Li, S.C. In-situ test study on critical anchoring length of weathering rock bolt. Cryog. Build. Technol. 2018, 40, 84–89. [Google Scholar]
  23. GB50330-2013; Technical Code for Building Slope Engineering. Ministry of Housing and Urban-Rural Development. China Construction Industry Press: Beijing, China, 2013.
Figure 1. Automatic bolt pull-out data monitoring system.
Applsci 15 03901 g001
Figure 2. System working principle.
Applsci 15 03901 g002
Figure 3. Pull-out test diagram.
Applsci 15 03901 g003
Figure 4. The test location and site formation information.
Applsci 15 03901 g004
Figure 5. Reinforcement stress gauge layout diagram (unit: m).
Applsci 15 03901 g005
Figure 6. Field pull-out test process. (a) Loading equipment installation; (b) Step by step control loading; (c) Bolt pull-out.
Applsci 15 03901 g006
Figure 7. Curve of tension and displacement of rod end. (a) The stress history diagram of anchor bolt; (b) The measured diagram of bolt stress history.
Applsci 15 03901 g007
Figure 8. Anchorage length-ultimate pull-out bearing capacity curve.
Applsci 15 03901 g008
Figure 9. Axial force distribution curve. (a) Anchorage length 10 m; (b) Anchorage length 20 m.
Applsci 15 03901 g009
Figure 10. Friction resistance distribution curve. (a) Anchorage length 10 m; (b) Anchorage length 20 m.
Applsci 15 03901 g010
Figure 11. Mechanical distribution diagram.
Applsci 15 03901 g011
Table 1. Mechanical parameters of bolt.
Bar ParametersDiameterYield LoadFailure LoadElastic Modulus
Numerical value28 mm246 kN332 kN200 GPa
Table 2. Bolt end tension and rod end displacement.
Anchorage LengthLoad/kNDisplacement/mmLoad/kNDisplacement/mmLoad/kNDisplacement/mm
10 m2206.12607.530011.5
12 m2607.430011.232021.5
16 m2808.632012.334023.7
20 m30010.034015.138025.3
30 m34011.036016.138027.2
Table 3. Comprehensive shear modulus k calculation table.
NO.Free Part/mAnchorage Section/mk/kPa
A-1-2210423.31
A-1-9312315.75
B-2-1216433.98
B-2-9220566.59
C-1-3230757.65
Disclaimer/Publisher’s Note: The statements, opinions and data contained in all publications are solely those of the individual author(s) and contributor(s) and not of MDPI and/or the editor(s). MDPI and/or the editor(s) disclaim responsibility for any injury to people or property resulting from any ideas, methods, instructions or products referred to in the content.

