Article

Enhancing the Anti-Interference Capability of Orbital Angular Momentum Beams Generated by an Ultra-Large-Scale Metasurface

1
School of Electronic and Information Engineering, Beijing Jiaotong University, Beijing 100044, China
2
Hebei Key Laboratory of Seismic Disaster Instrument and Monitoring Technology, Institute of Disaster Prevention, Sanhe 065201, China
3
State Key Laboratory of Advanced Rail Autonomous Operation, Beijing Jiaotong University, Beijing 100044, China
*
Author to whom correspondence should be addressed.
Appl. Sci. 2025, 15(7), 3900; https://doi.org/10.3390/app15073900
Submission received: 28 February 2025 / Revised: 25 March 2025 / Accepted: 31 March 2025 / Published: 2 April 2025
(This article belongs to the Section Electrical, Electronics and Communications Engineering)

Abstract

:
Orbital angular momentum beams have been extensively researched due to their ability to enhance the channel capacity of microwave systems. Metasurface near-field calculations of different sizes have been completed. Near-field calculations with Gaussian noise for metasurfaces of different sizes were also completed. The presence of noise suggests that the vortex electric field generated by the small metasurface of the vortex wave may experience disturbance and be overwhelmed by strong noise. On the other hand, the large vortex wave metasurface exhibits superior anti-noise capability. Its anti-interference characteristic was verified by conducting full-wave simulations on metasurfaces of l = −3 and l = −5. Based on the OAM spectral analysis, the mode purity of the generated vortex waves was calculated in detail. Simulation results indicated that a large-scale metasurface exhibits stronger anti-interference capability, which may inspire the design and research of vortex wave metasurfaces in the future.

1. Introduction

OAM is one of the fundamental physical quantities of electromagnetic waves. OAM can theoretically achieve larger channel capacity and spectral efficiency by using the orthogonality of different OAM modes. Vortex beams have been widely used in super-resolution imaging [1,2], structure field formation [3,4], the manipulation of nanoparticles [5], and data communications [6,7,8,9]. Metasurfaces have been reported to generate single-mode vortex beams and multimode vortex beams for generating integer and fractional orbital angular momentum [10], synthesizing arbitrary vortex beams [11], and producing crosstalk-free amplitude-modulated vortex beams [12]. They have also been reported to produce a novel method to control the divergence angle of multimode vortex beams [13], a minimalist single-layer metasurface for arbitrary and full control of vector vortex beams [14], a proposed phase plate for generating superimposed orbital angular momentum states [15], a fully phase-modulated metasurface as an energy-controllable circular polarization router [16], a single non-interleaved metasurface for high capacity [17], a method for independent phase modulation of quadruplex polarization channels enabled by chirality-assisted geometric phase metasurfaces [18], and an arbitrary spin-to-orbital angular momentum conversion of light [19]. Deep recurrent neural networks have also been used to enhance the misalignment estimation of the OAM signal [20]. However, the issues of crosstalk in OAM systems still deserve further study. A detailed investigation of the impact of metasurface size on the generation of vortex waves in the near-field has not been conducted.
Based on the Pancharatnam–Berry phase concept, an abrupt phase change can be conveniently introduced for fabricating broadband ultrathin metasurfaces [21,22,23,24]. The OAM vortex beams exhibit a helical phase front with an azimuthal phase term of e j l φ (where l represents the mode of vortex beams and φ denotes the azimuthal angle around the propagation axis). Hence, it is a fundamental principle to generate vortex beams with the OAM mode l by introducing a constant electric current along a circular path with a consecutive phase shift of . An analysis of near-field electromagnetic energy densities for uniform circular array-orbital angular momentum has been conducted [25,26,27]. The performances of a general formulation employing radiation matrix eigenfields of multi-port antennas to synthesize near-field distributions were investigated. The propagation characteristics of diffraction-resistant Bessel, OAM Bessel, and Airy beams in their actual finite-energy implementation, when they were excited by finite-size antenna arrays, were also investigated [28].
In this article, a near-field calculation model is proposed in Figure 1 to demonstrate ultra-large-scale metasurfaces capable of generating vortex beams. On the one hand, as the metasurface size increases, the resulting vortex waves converge toward the center, creating a stronger doughnut-shaped electric field on the same sampling surface and generating fewer side lobes. On the other hand, with an increase in metasurface size comes stronger anti-interference ability, rendering noise signals ineffective against both the amplitude and phase of the generated vortex waves and the OAM spectrum. A reflection-type metasurface composed of rotated EE unit cells was further designed and simulated to verify the anti-interference capabilities of a large-scale metasurface. Near-field simulations of the compact metasurface were conducted under both linearly polarized plane waves and circularly polarized plane waves. Additionally, similar near-field simulations were performed for large-scale metasurfaces under identical conditions. Through full-wave simulation, it is feasible to extract the OAM spectrum, amplitude, phase, and purity of the OAM spectrum of the scattered electric field, even in the presence of noise.

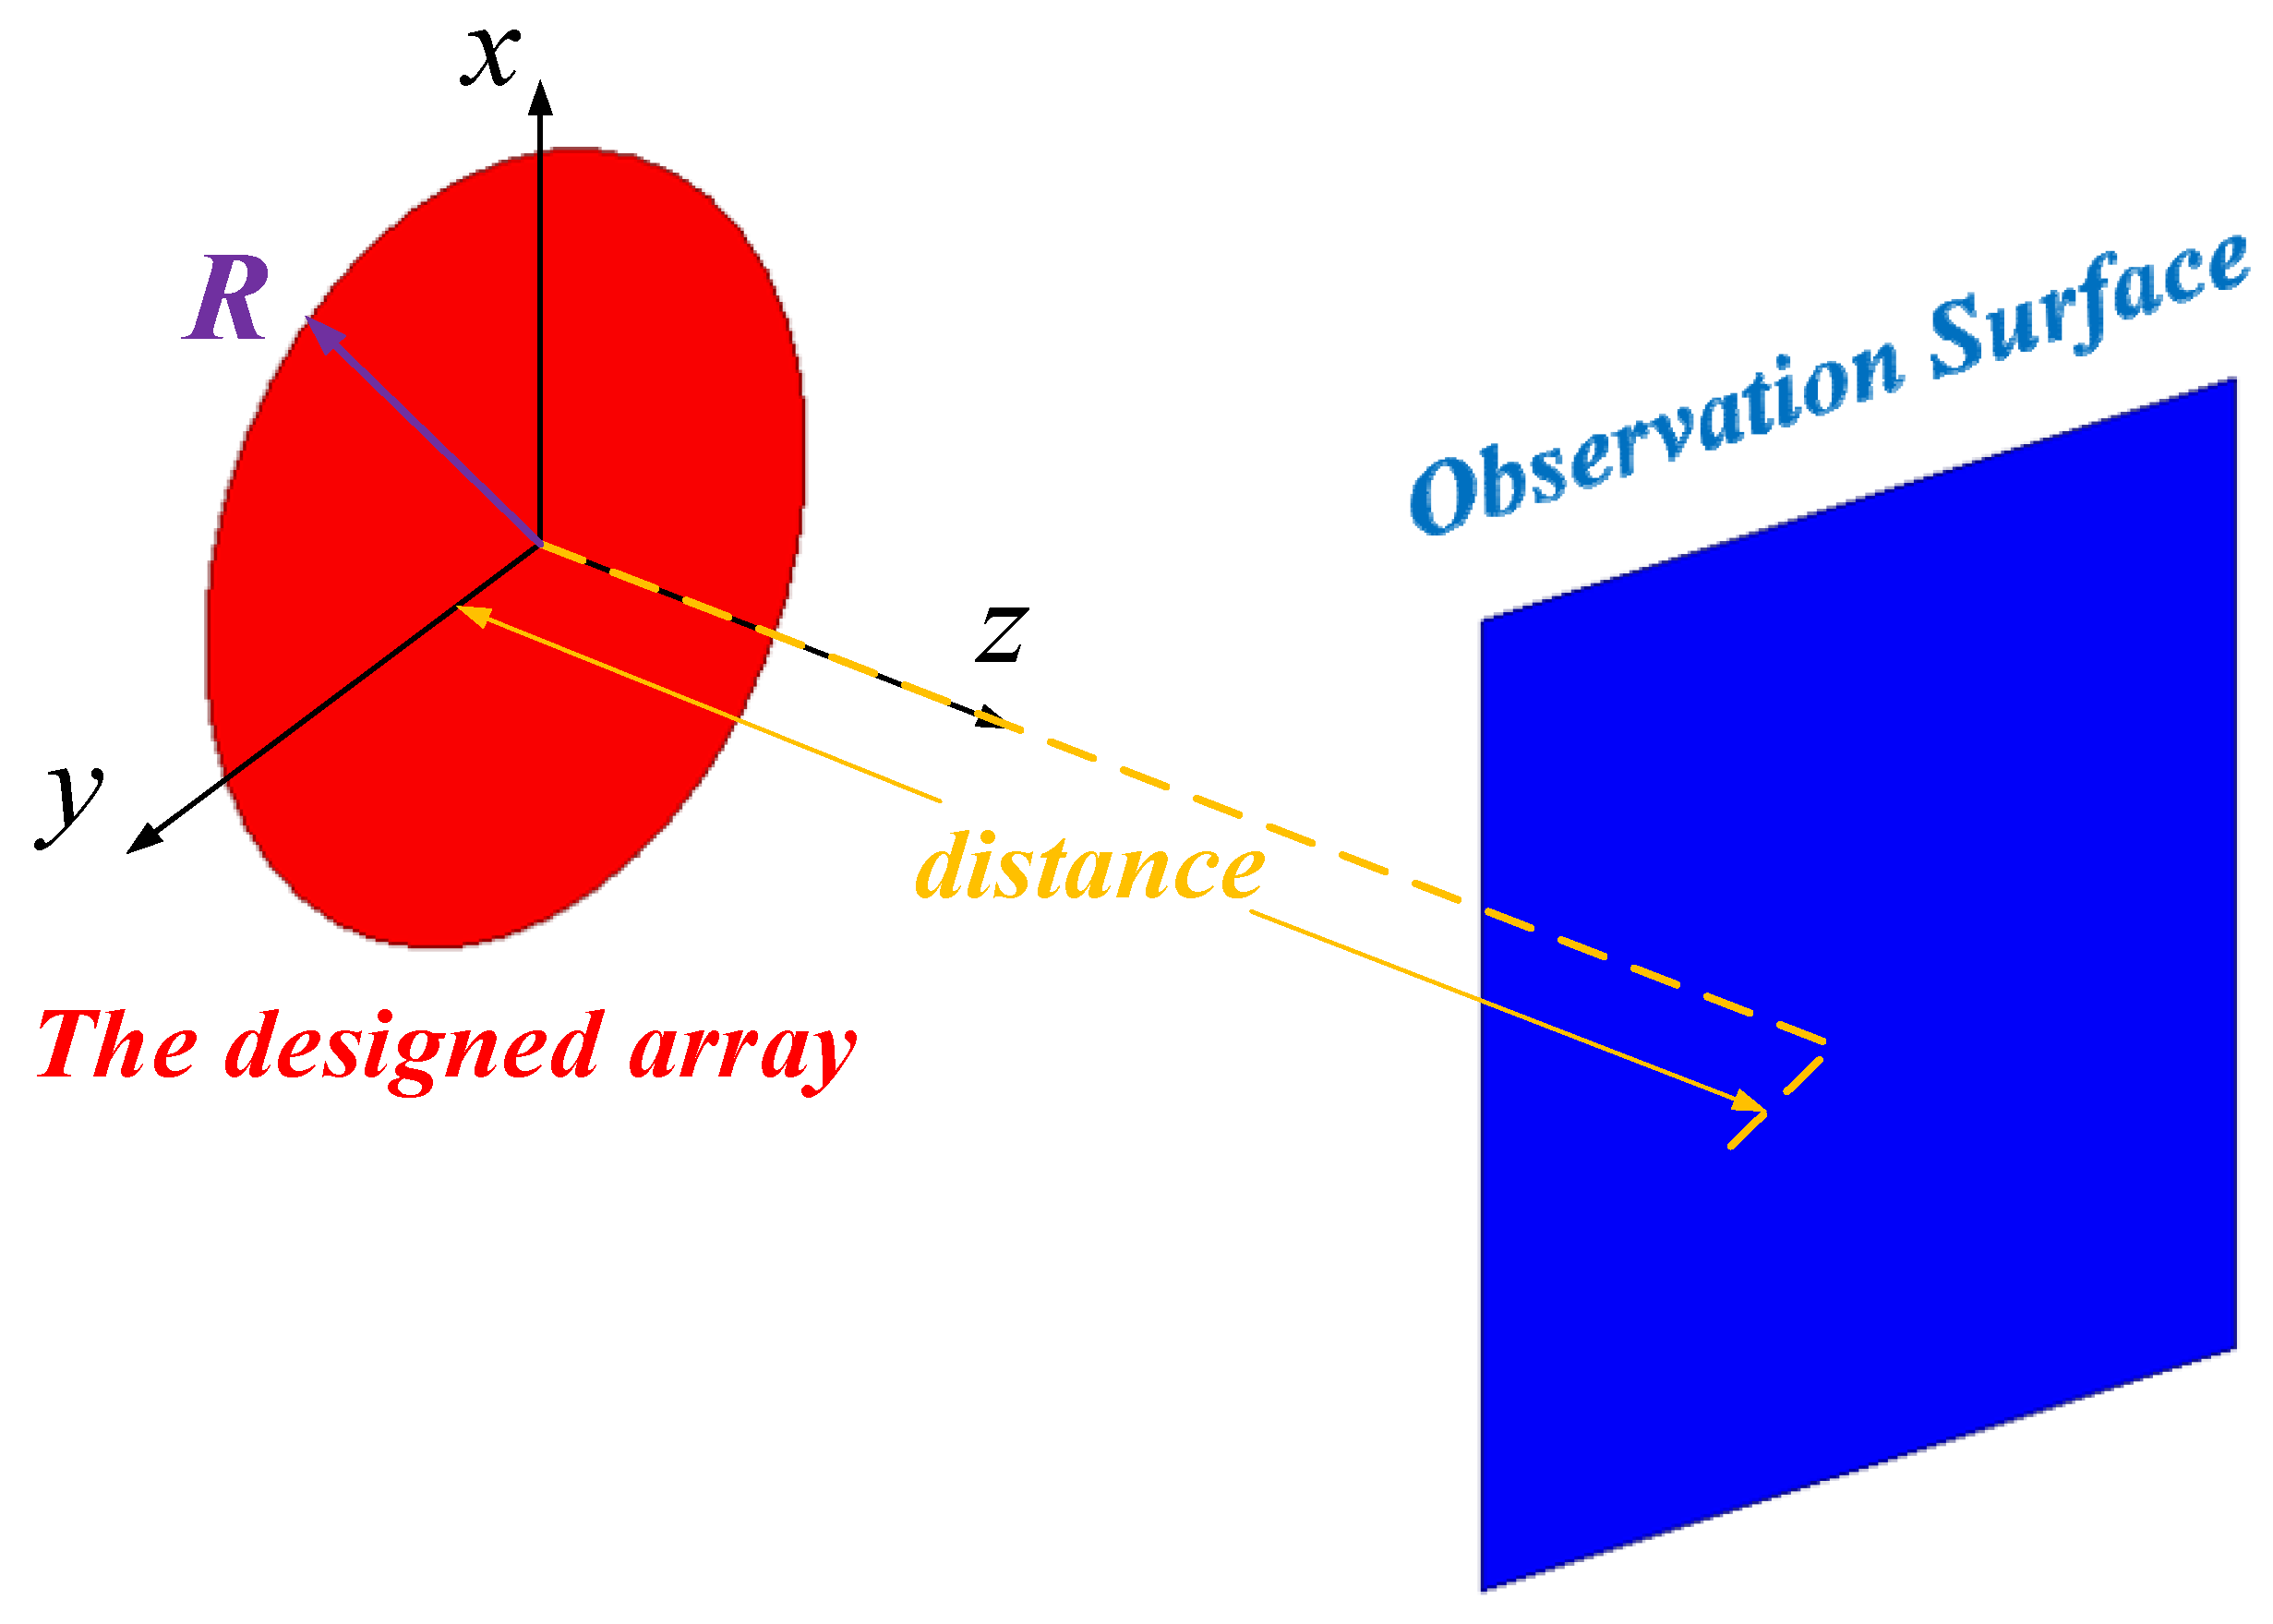
2. Theoretical Analysis of the near Field of an Ultra-Large-Scale Metasurface

Theoretical analysis of the near-field calculation model is presented in Figure 1, validating the feasibility of generating vortex beams using ultra-large-scale metasurfaces. This study conducted numerical calculations for near-field metasurfaces under both noise-free and noisy conditions and compared the differences in the generated orbital angular momentum (OAM) beams at observation distances of 0.9 m and 1.2 m.

2.1. Calculation of a Noiseless Near-Field Metasurface

The calculation program for determining the near-field of the array was designed according to Figure 1. In this interim design, vortex wave modes with l = −5 were generated at a calculated frequency of 10 GHz and a wavelength of 0.03 m (λ0). The observation distance was set at both 0.9 m and 1.2 m. To verify the mode purity, the OAM spectrum can be obtained by expanding the vortex wave mode on the electric field of the observed surface according to Equation (1).
A l = 1 2 π 0 2 π E ( φ ) e j l φ d φ
The normalized amplitude, phase, and OAM spectrum of vortex waves observed on the observation surface with different sizes at an observation distance of 0.9 m are depicted in Figure 2. A total of 201 × 201 points were sampled on the observation surface. In Figure 2a, the sampling interval is 0.007 m and the period of the unit cell is 10 mm, resulting in a sampling surface size of 1.407 m × 1.407 m. On the other hand, in Figure 2b–d, the sampling interval is reduced to 0.005 m, leading to a smaller sampling surface size of 1.005 m × 1.005 m due to the better centering capabilities of larger arrays compared to smaller arrays. For example, when R = 20 × p, it requires a larger sampling surface for displaying generated vortex waves.
The small metasurface R = 20 × p in Figure 2a exhibits periodic fluctuations in both the three-dimensional (3D) and two-dimensional (2D) OAM amplitude graphs. The phase diagram reveals a vortex phase with multiple turns, resulting in the generation of sidelobes for the vortex beam. The OAM spectrum depicted in Figure 2a demonstrates the generation of a high-mode purity vortex wave with l = −5. The OAM amplitude graphs in Figure 2b–d) demonstrate that as the metasurface size increases (R = 40 × p, R = 80 × p, R = 120 × p), the edges of both the 3D and 2D patterns exhibit ideal circular shapes. Moreover, the energy distribution converges toward the center of the metasurface while gradually reducing the radius of the resulting OAM beam. Simultaneously, there is an increase in the normalized amplitude of vortex waves. Additionally, enlarging the metasurface size leads to a decrease in phase cycles and consequently reduces the sidelobes. Furthermore, Figure 2b–d illustrate that with increasing metasurface size, there is a gradual improvement in purity within the calculated OAM spectral patterns, and specifically for Figure 2c,d models, where the purity approaches close to 98%.
The normalized amplitude, phase, and OAM spectrum of the vortex waves observed on the observation surface with different metasurface sizes are depicted in Figure 3 for an observation distance of 1.2 m. A total of 201 × 201 points are sampled on the observation surface. In Figure 3a, the sampling interval is 0.007 m, resulting in a sampling surface size of 1.407 m × 1.407 m. For Figure 3b–d, the sampling interval is 0.005 m, leading to a sampling surface size of 1.005 m × 1.005 m. In Figure 3a, where R = 20 × p represents a small metasurface, it can be observed that both the 3D and 2D normalized amplitude graphs exhibit periodic fluctuations in the amplitude margin. The phase diagram demonstrates multiple turns for vortex phases, which generate more sidelobes for the vortex beam formation. The OAM spectrum in Figure 3a reveals the generation of an l = −5 vortex wave with high mode purity. From Figure 3b–d, as the metasurface size increases, ideal circular edges without fluctuations appear in both the 3D and 2D OAM amplitude graphs. The energy converges toward the center of the metasurface, resulting in a gradually smaller OAM beam radius and increased normalization amplitude for the vortex waves. As the metasurface size increases, the number of phase cycles decreases, indicating a reduction in sidelobes. It can also be observed from the OAM spectra shown in Figure 3b–d that the calculated OAM spectral pattern exhibits a gradual improvement in purity with increasing metasurface size. The models in Figure 3b,c achieve close to perfect purity. Compared to Figure 2, the near-field amplitude radius on the observation surface also increases as the observation distance expands.

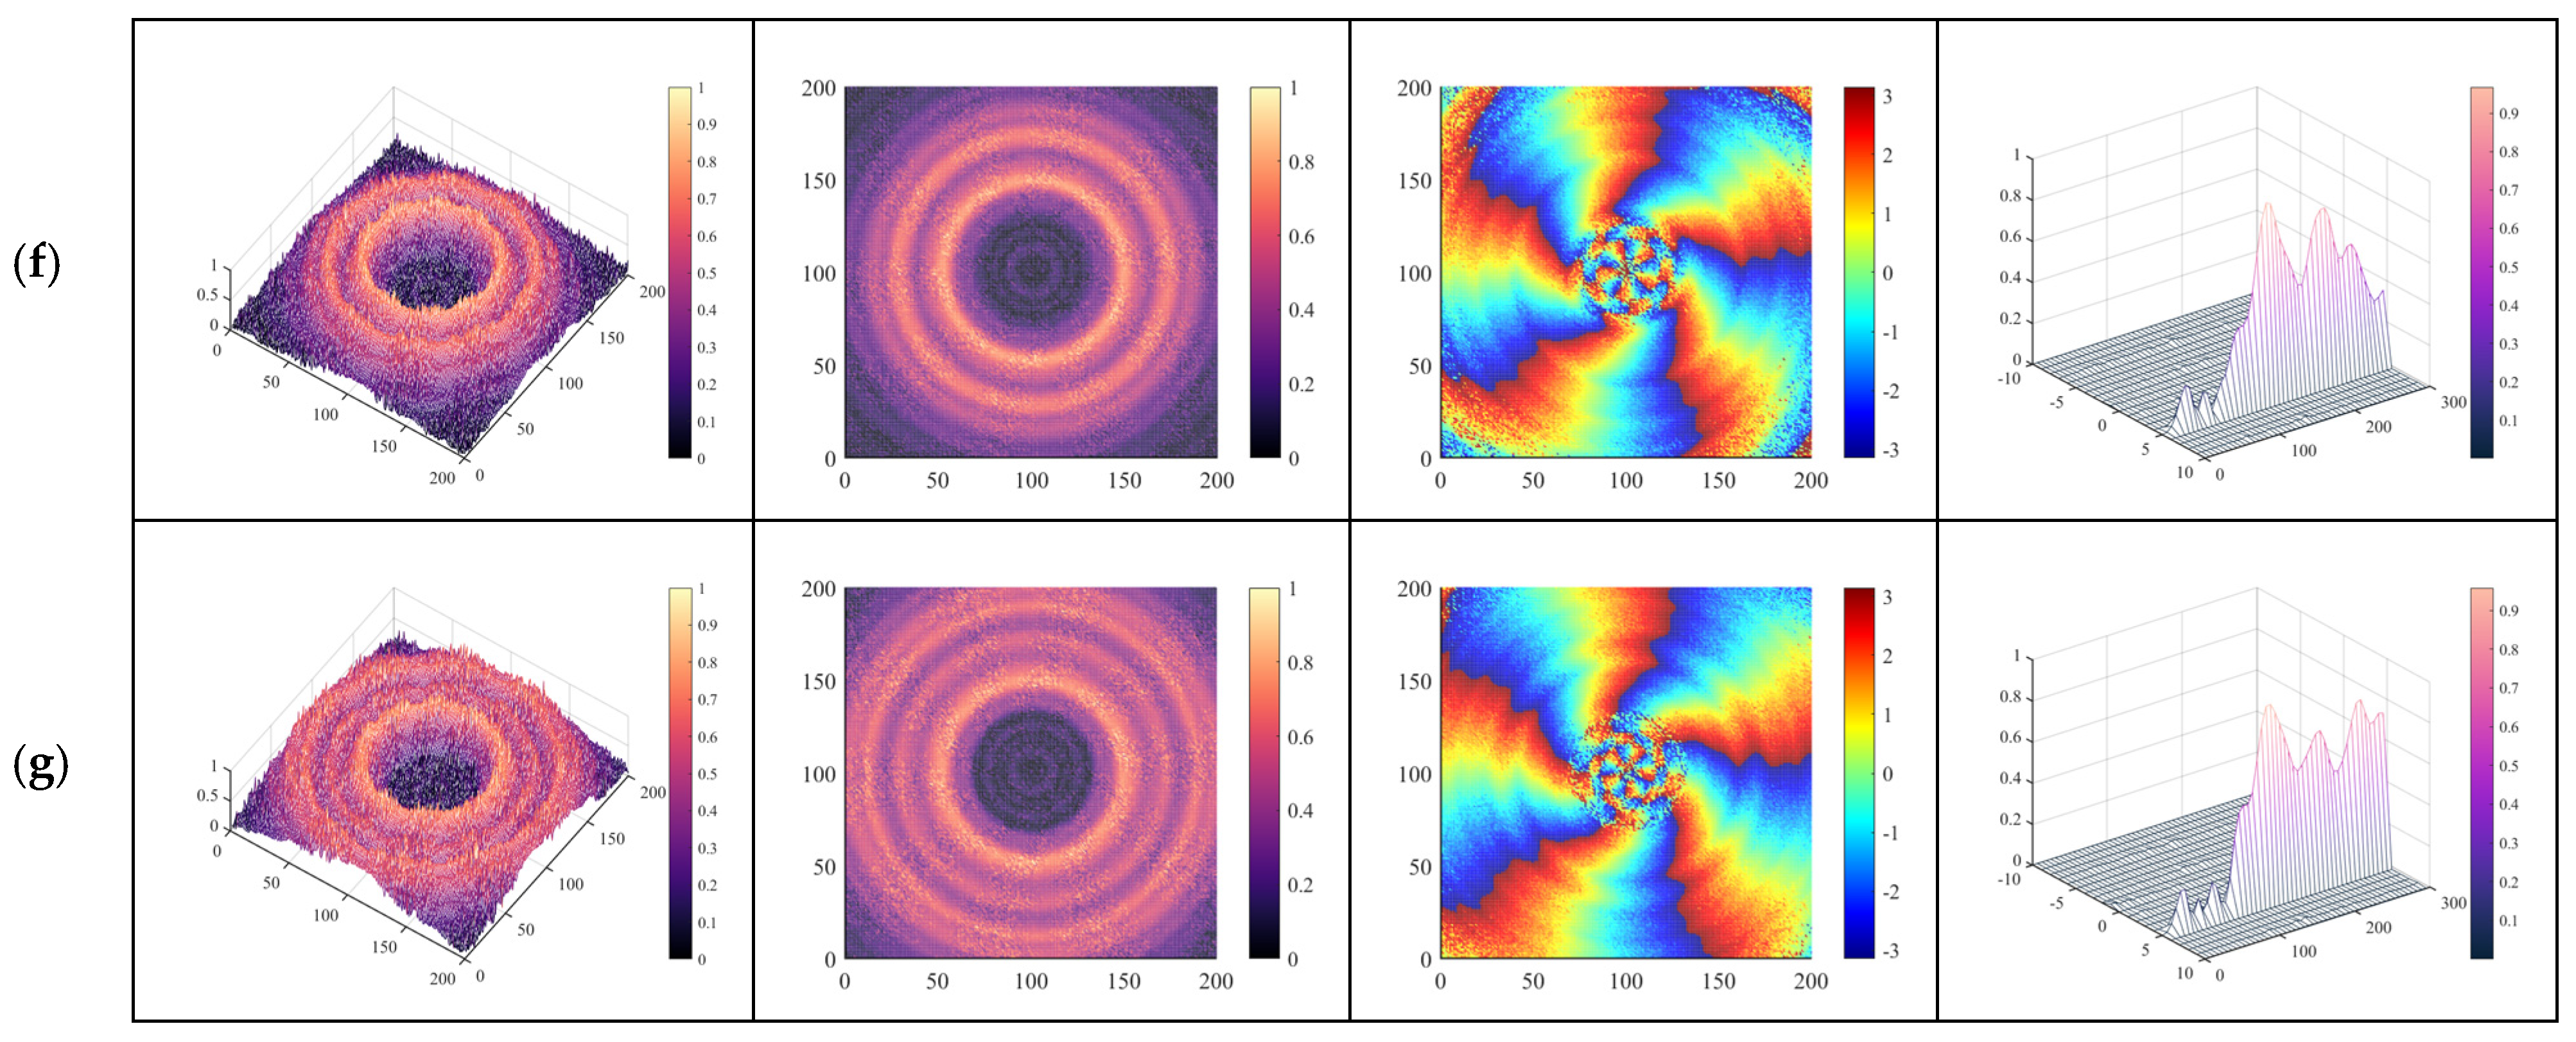
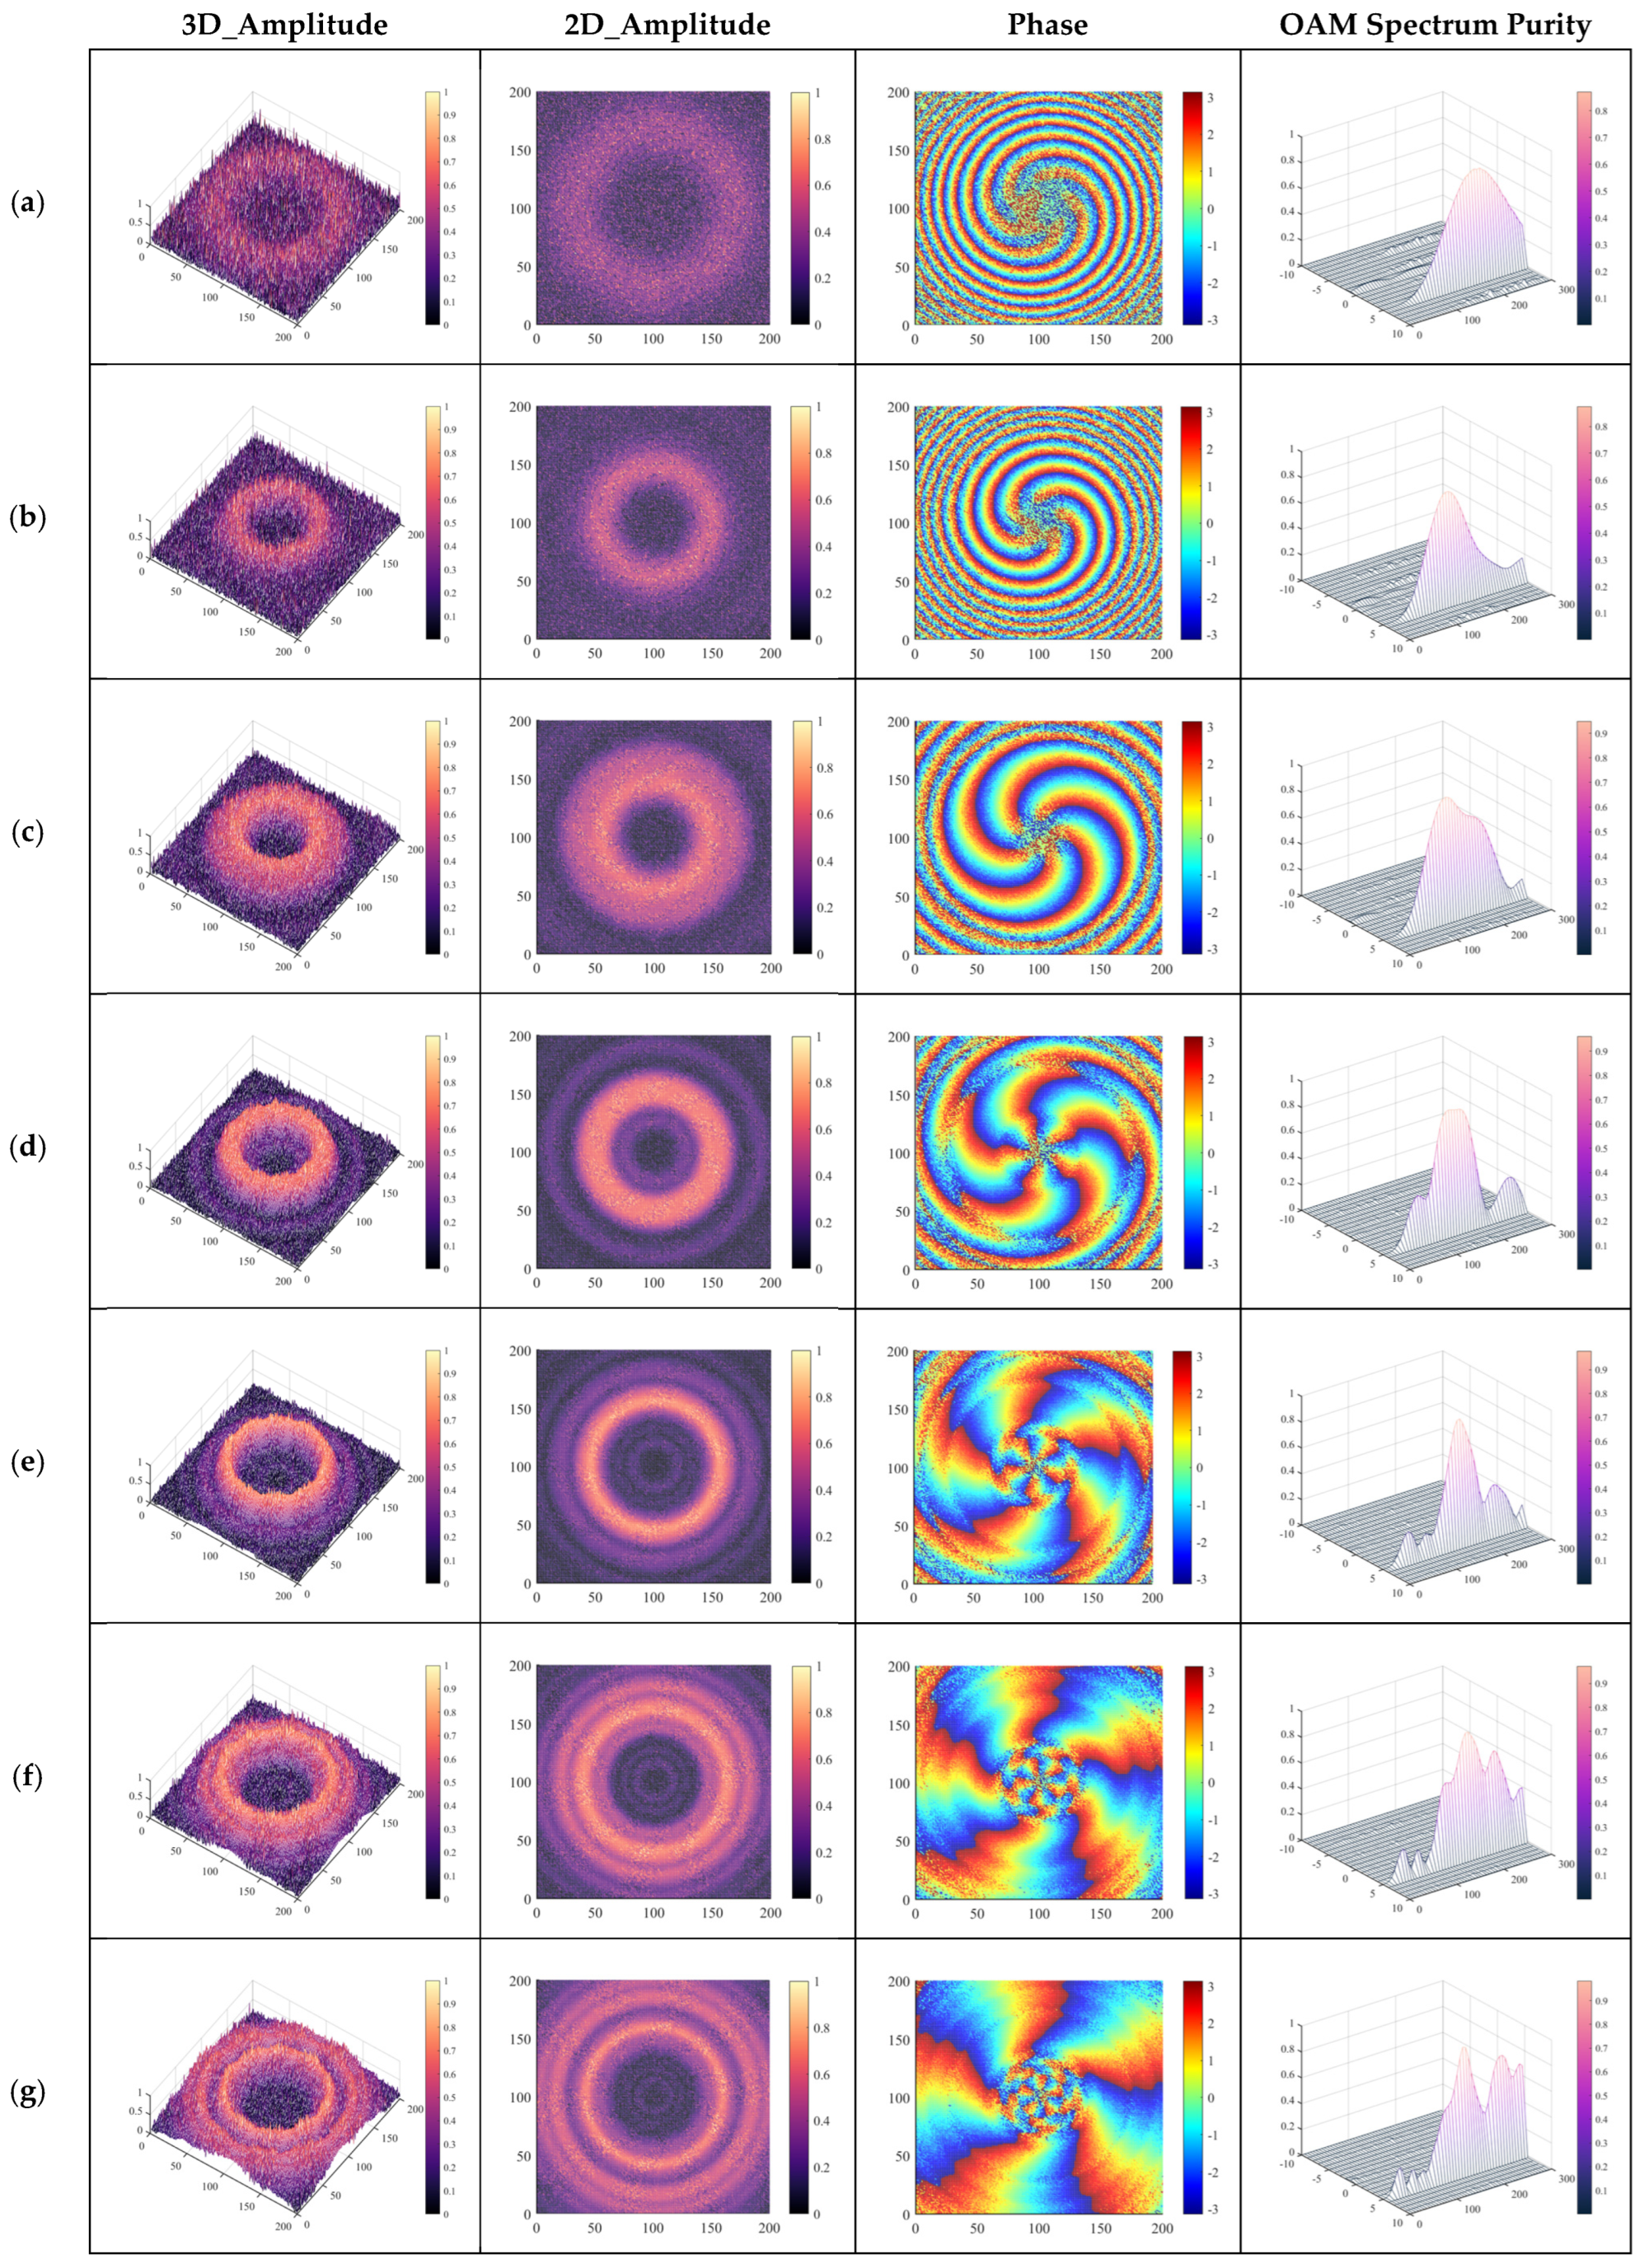
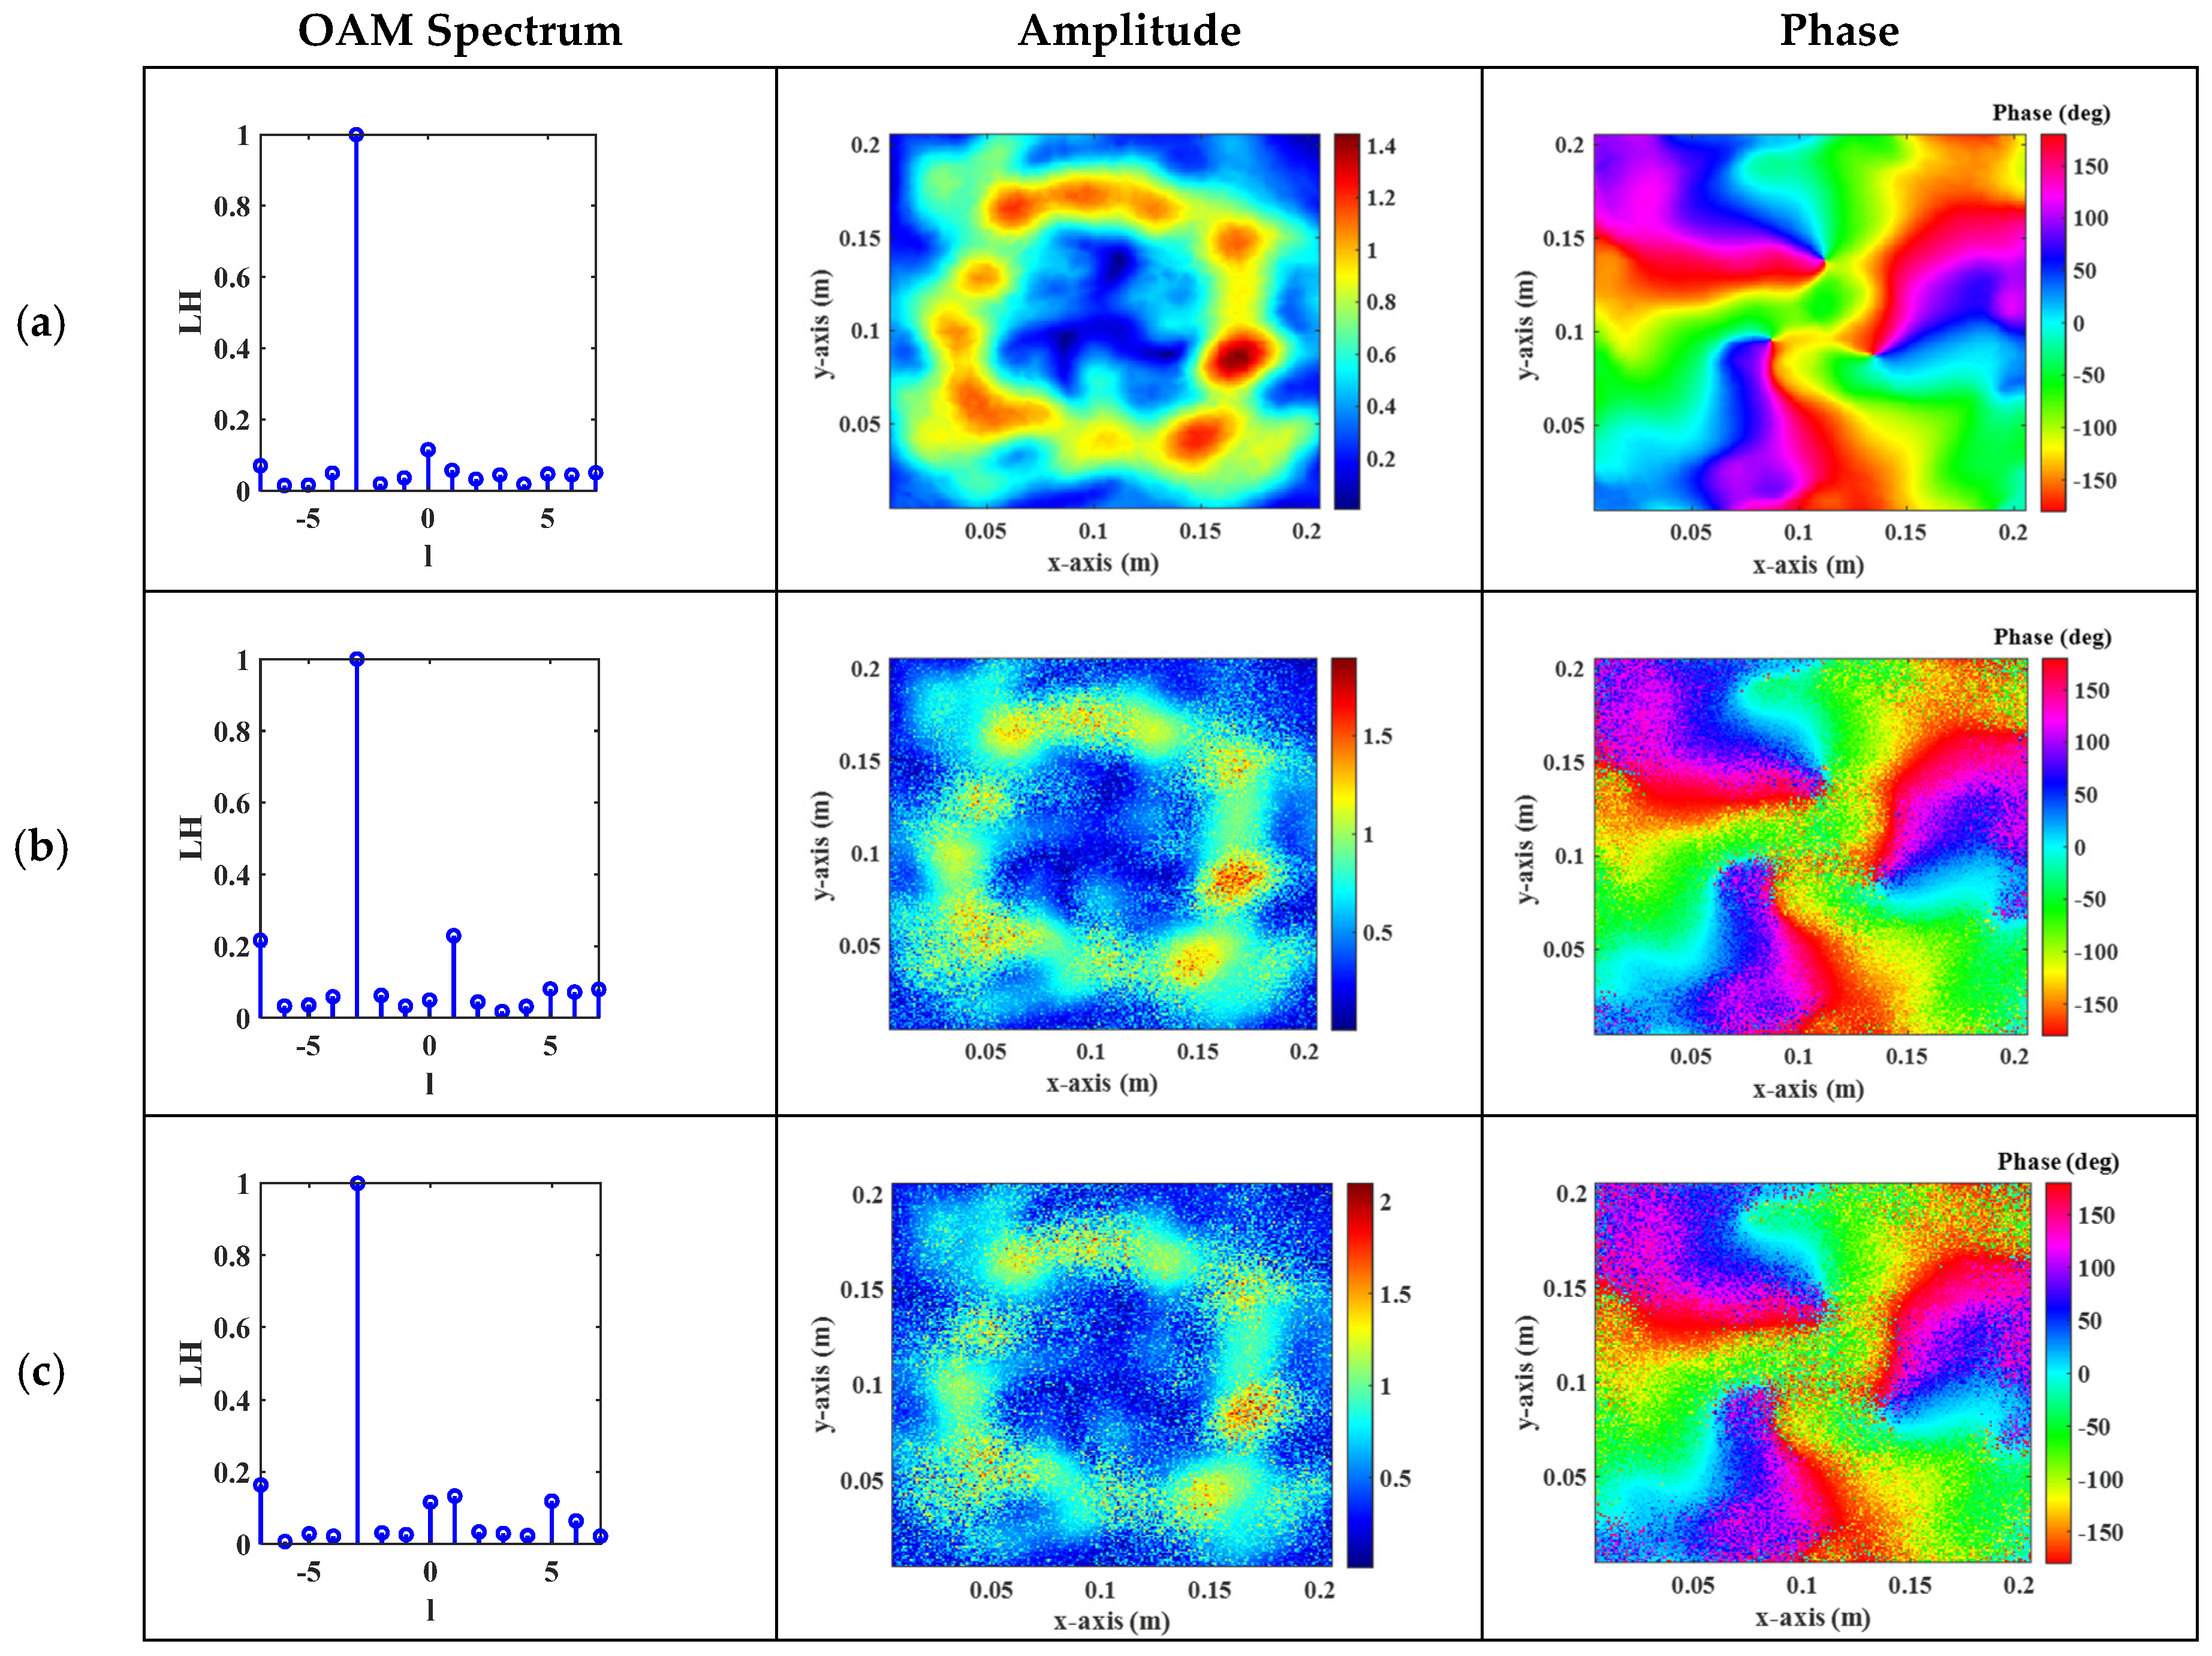
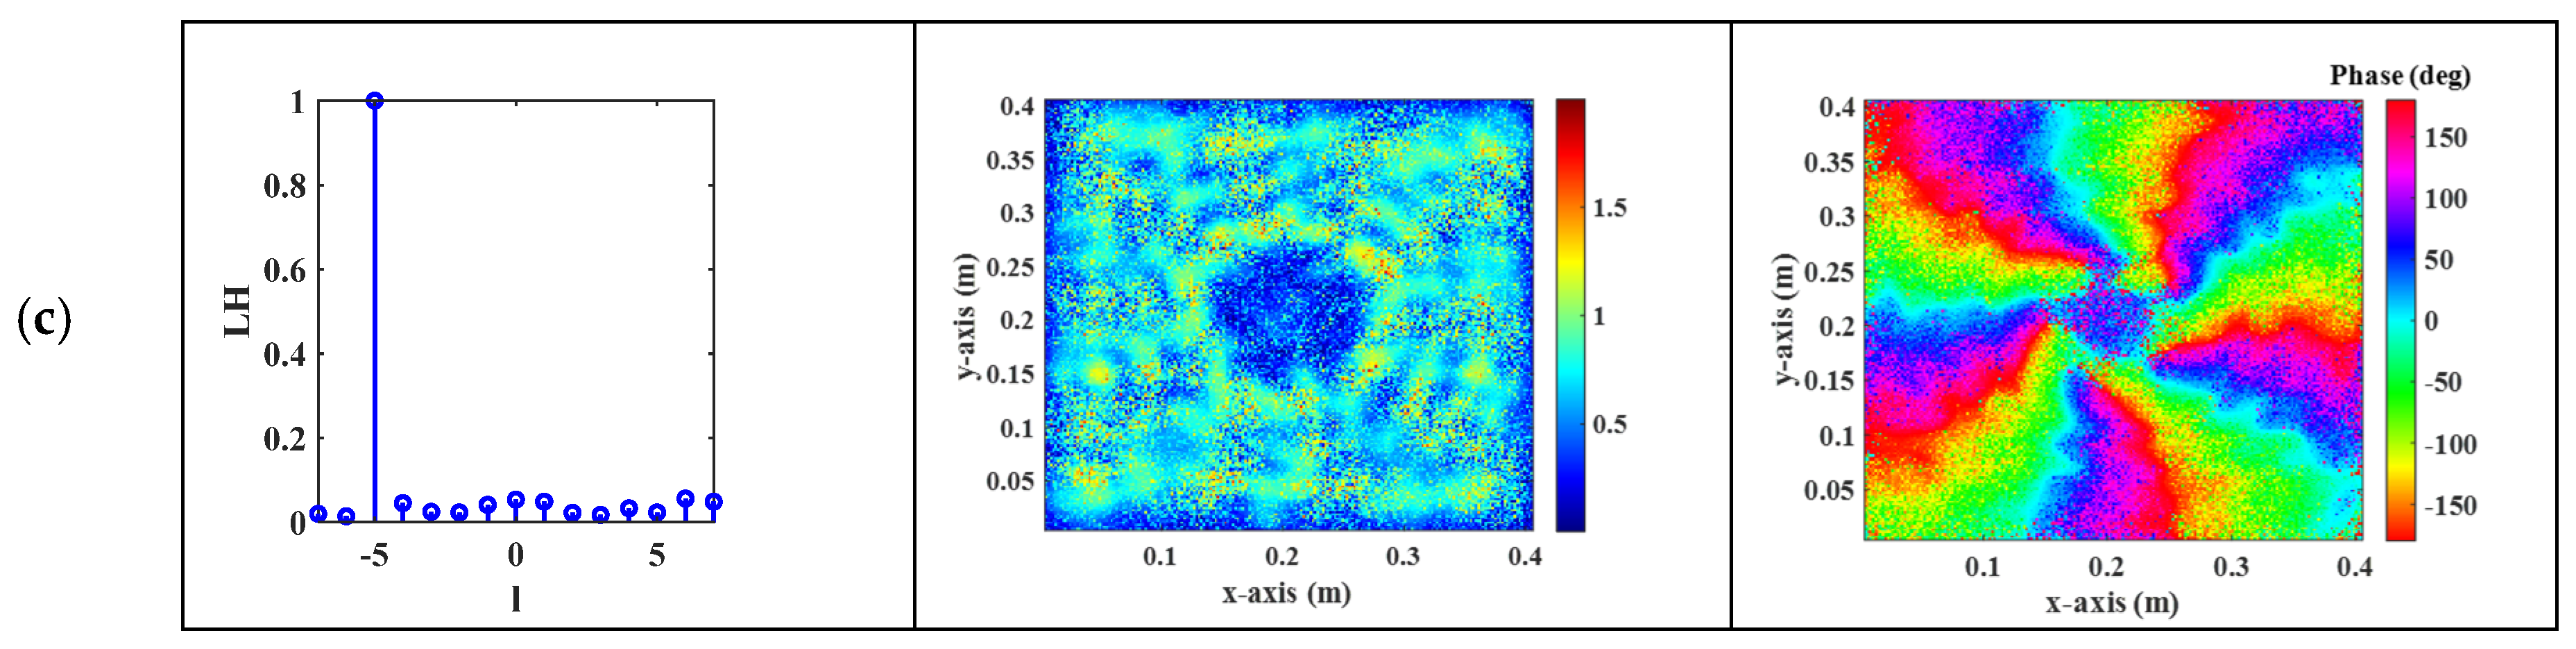
2.2. Calculation of Noisy Near-Field Metasurface

Gaussian noise was generated using the randn function as shown in Equation (2). In practical engineering applications, the amplitude of an amp typically amounts to one-fourth of the maximum electric field amplitude, while decibels were set at 35 and 25 for this particular design.
n o i s e _ g a u s s i a n = a m p r a n d n ( 201 , 201 ) + 1 i r a n d n ( 201 , 201 )

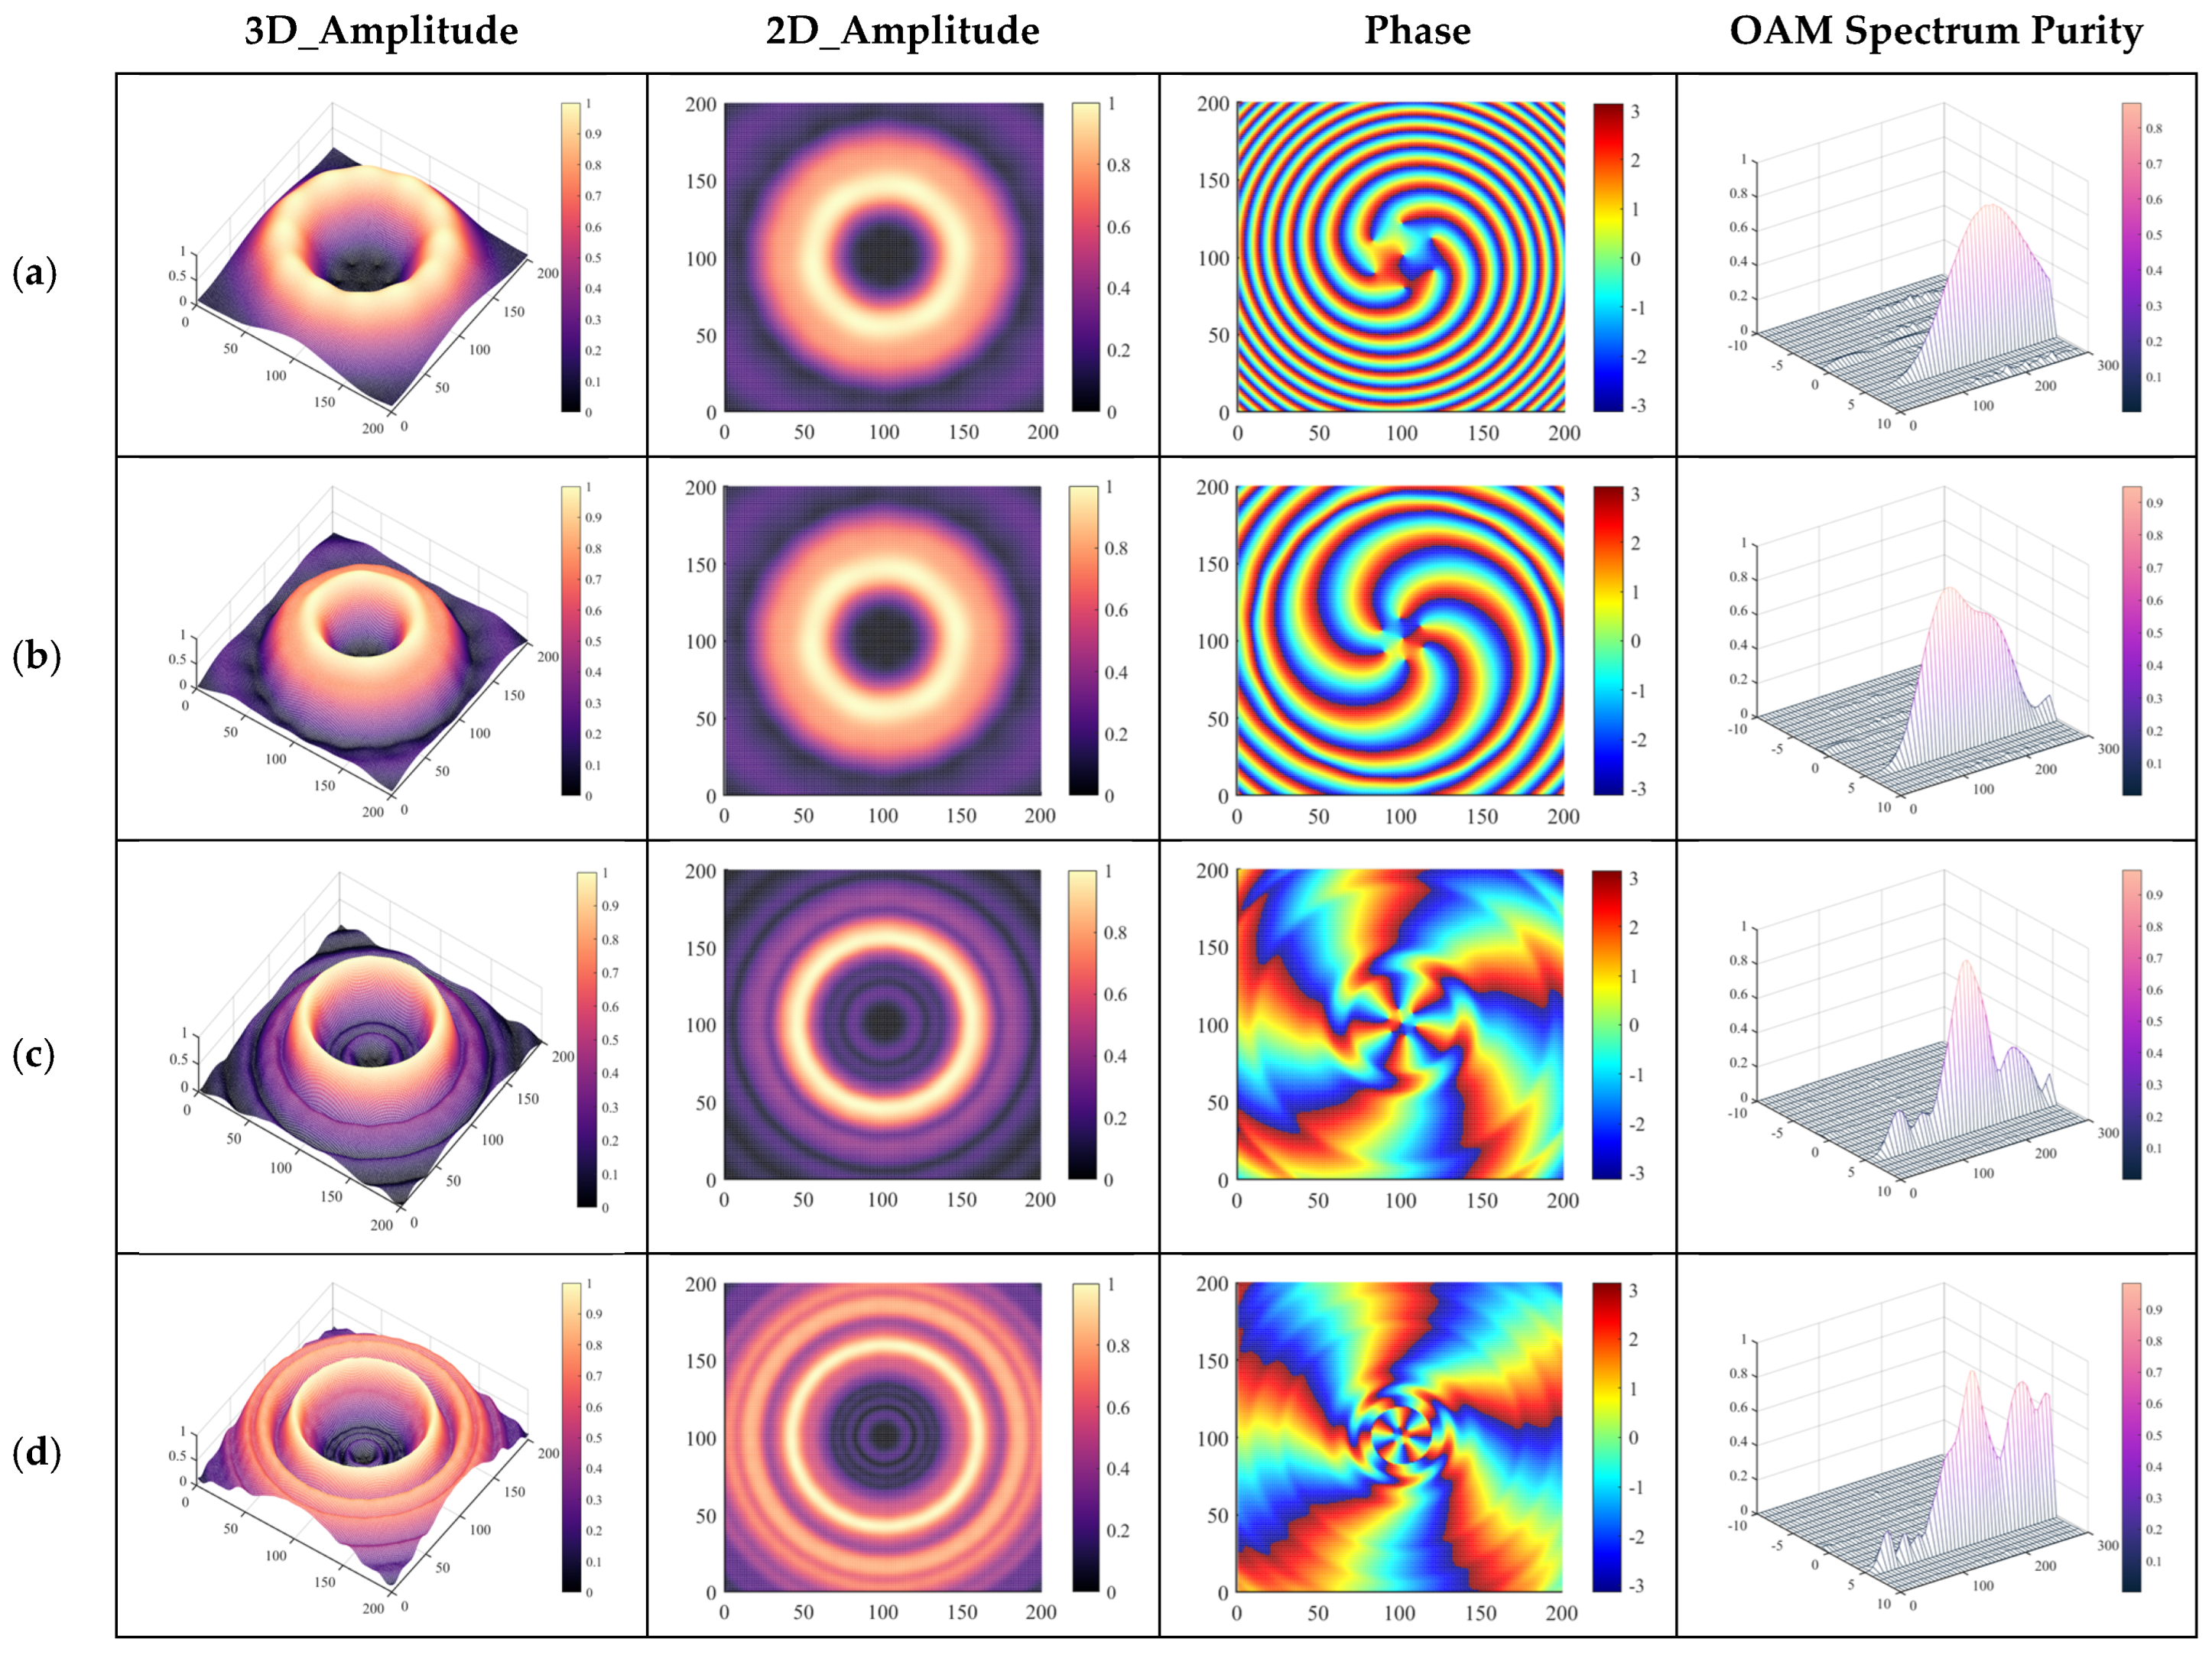
2.2.1. Observation Surface Distance Is 0.9 m

First, when the observation surface is positioned at a distance of 0.9 m from the metasurface, the noise amplitude is set as amp = 35. The observation surface in Figure 4a,b is 1.407 m × 1.407 m, while that in Figure 4c–g is 1.005 m × 1.005 m. It can be observed from Figure 4 that for the small metasurface depicted in Figure 4a,b, both the 3D and 2D normalized amplitude diagrams indicate that crosstalk occurs and is predominantly overshadowed by noise interference. The phase diagram also reveals the excitation of vortex waves with l = −5 mode; however, due to excessive noise presence, it becomes challenging to discern the vortex phase except within a limited area at approximately one-fourth of its center (3.14 × R2/4). On the other hand, for the large metasurfaces shown in Figure 4c–e, where R equals 40 × p, R equals 60 × p, and R equals 80 × p, respectively, the 3D and 2D amplitude diagrams demonstrate an absence of crosstalk as well as the effective isolation of electric field amplitudes from disruptive noise interference. Similarly, the phase diagram confirms the excitation of vortex waves with l = −5 mode, and notably, the extent of the vortex phase on the sampling surface gradually expands with increasing array size. Furthermore, in the ultra-large-scale metasurface illustrated in Figure 4f,g, multiple concentric circles are excited by vortex wave amplitudes, resulting in efficient noise isolation. The phase diagram indicates the successful acquisition of undisturbed vortex phases on the observation surface without any interference caused by noise. In addition, the OAM spectrum exhibits high mode purity throughout all scenarios in Figure 4, and this remains true even after superimposing noise. It can be inferred that a larger metasurface possesses superior anti-interference capabilities under identical levels of noise interference.

2.2.2. Observation Surface Distance of 1.2 m

When the observation surface is positioned at a distance of 1.2 m from the metasurface, the noise amplitude is set as amp = 25. The sampling surface dimensions in Figure 5a,b are 1.407 m × 1.407 m, while those in Figure 5c–g are 1.005 m × 1.005 m. In contrast to Figure 4, it is slightly closer to the metasurface and has a larger noise amplitude setting, whereas Figure 5 has a smaller noise amplitude setting. As depicted in Figure 5a,b, both the 3D and 2D amplitude diagrams reveal that the small metasurface is overwhelmed by noise. The phase diagram also indicates the excitation of the vortex wave with l = −5 mode; however, due to significant noise interference, it becomes challenging to obtain an effective phase for this vortex wave on the submerged sampling surface area. The large metasurfaces shown in Figure 5c–e, with R = 40 × p, R = 60 × p, and R = 80 × p, respectively, exhibit good isolation of the electric field amplitudes from noise disturbances, as evident from both the 3D and 2D amplitude diagrams. The phase diagram further demonstrates the excitation of the vortex wave with l = −5 mode for these large metasurfaces; moreover, as the metasurface size increases, the area of the vortex phase on the sampling surface gradually expands toward obtaining a vortex phase within a central quarter area (3.14 × R2/4). The ultra-large-scale metasurfaces illustrated in Figure 5f,g generate multi-circle vortex wave amplitudes while effectively isolating them from any interfering noises. The phase diagram reveals the successful acquisition of vortex phases without any interference across all sampling surfaces for the ultra-large-scale metasurfaces shown in Figure 5f,g. Finally, in Figure 5, the OAM spectral mode exhibits high purity unaffected by Gaussian noise.

3. Near-Field Simulation of Metasurfaces with Varying Dimensions

This section will introduce the design of the unit cell that constitutes the metasurface. Near-field simulations of the compact metasurface were performed under both linearly polarized plane waves and circularly polarized plane waves. Additionally, near-field simulations of large-scale metasurfaces were conducted under the same conditions. Through full-wave simulation, it is possible to obtain the OAM spectrum, amplitude, phase, and purity of the OAM spectrum of the scattering electric field, even when affected by noise.

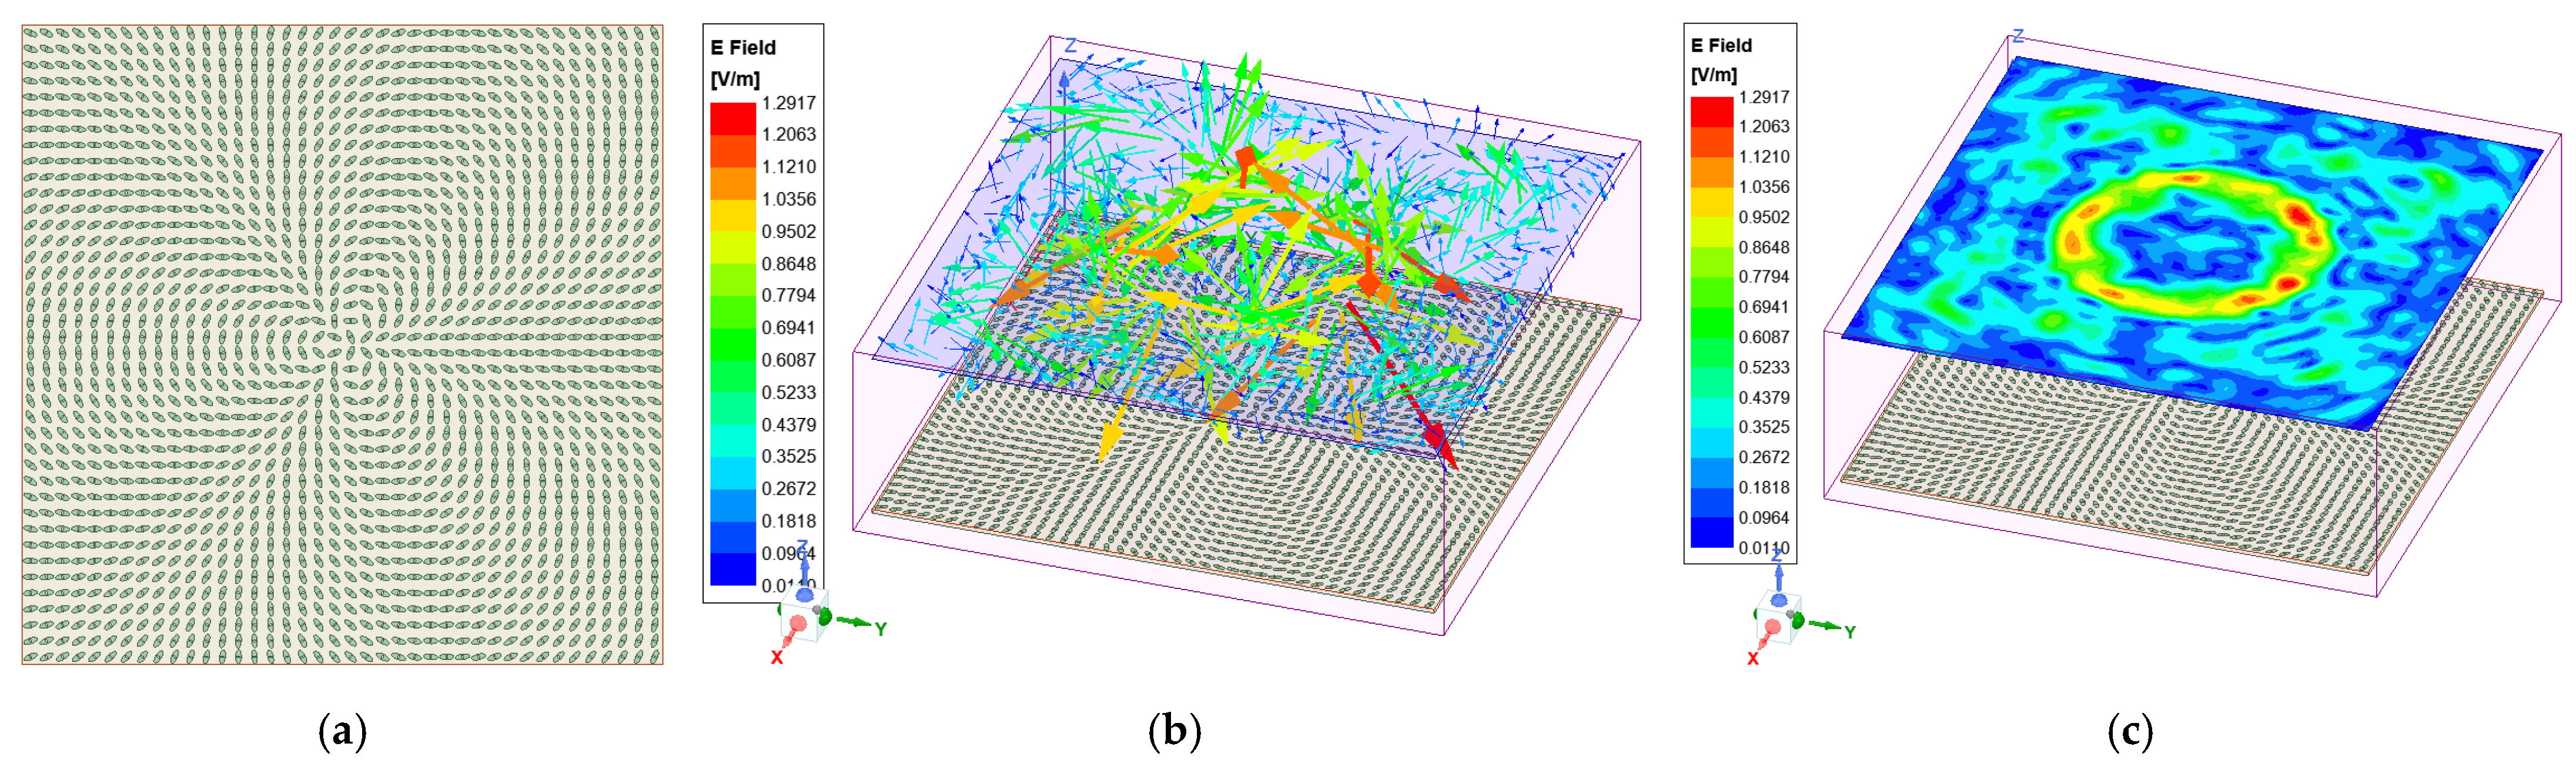
3.1. EE Unit Cell Design

A dielectric material, F4BM265, with a relative permittivity ( ε r = 2.65, tanδ = 0.0015), served as the substrate. The period of the EE unit is 10 mm, and the EE unit cell was located on the top of a substrate with a PEC ground at the bottom. The simulation of the EE unit cell was conducted using the periodic boundary condition, and this unit was designed for circularly polarized reflection. The rll represents the co-polarized reflection coefficient for left circularly polarized normal incidence. The phase changes, denoted as 2 × Theta degree, can be introduced by a unit with a rotation angle of Theta, where Theta is the rotation angle of the unit cells in Figure 6, the phase responses match different angles, and the co-polarization reflection coefficients are above 0.87 in the frequency range from 8 GHz to 20 GHz.

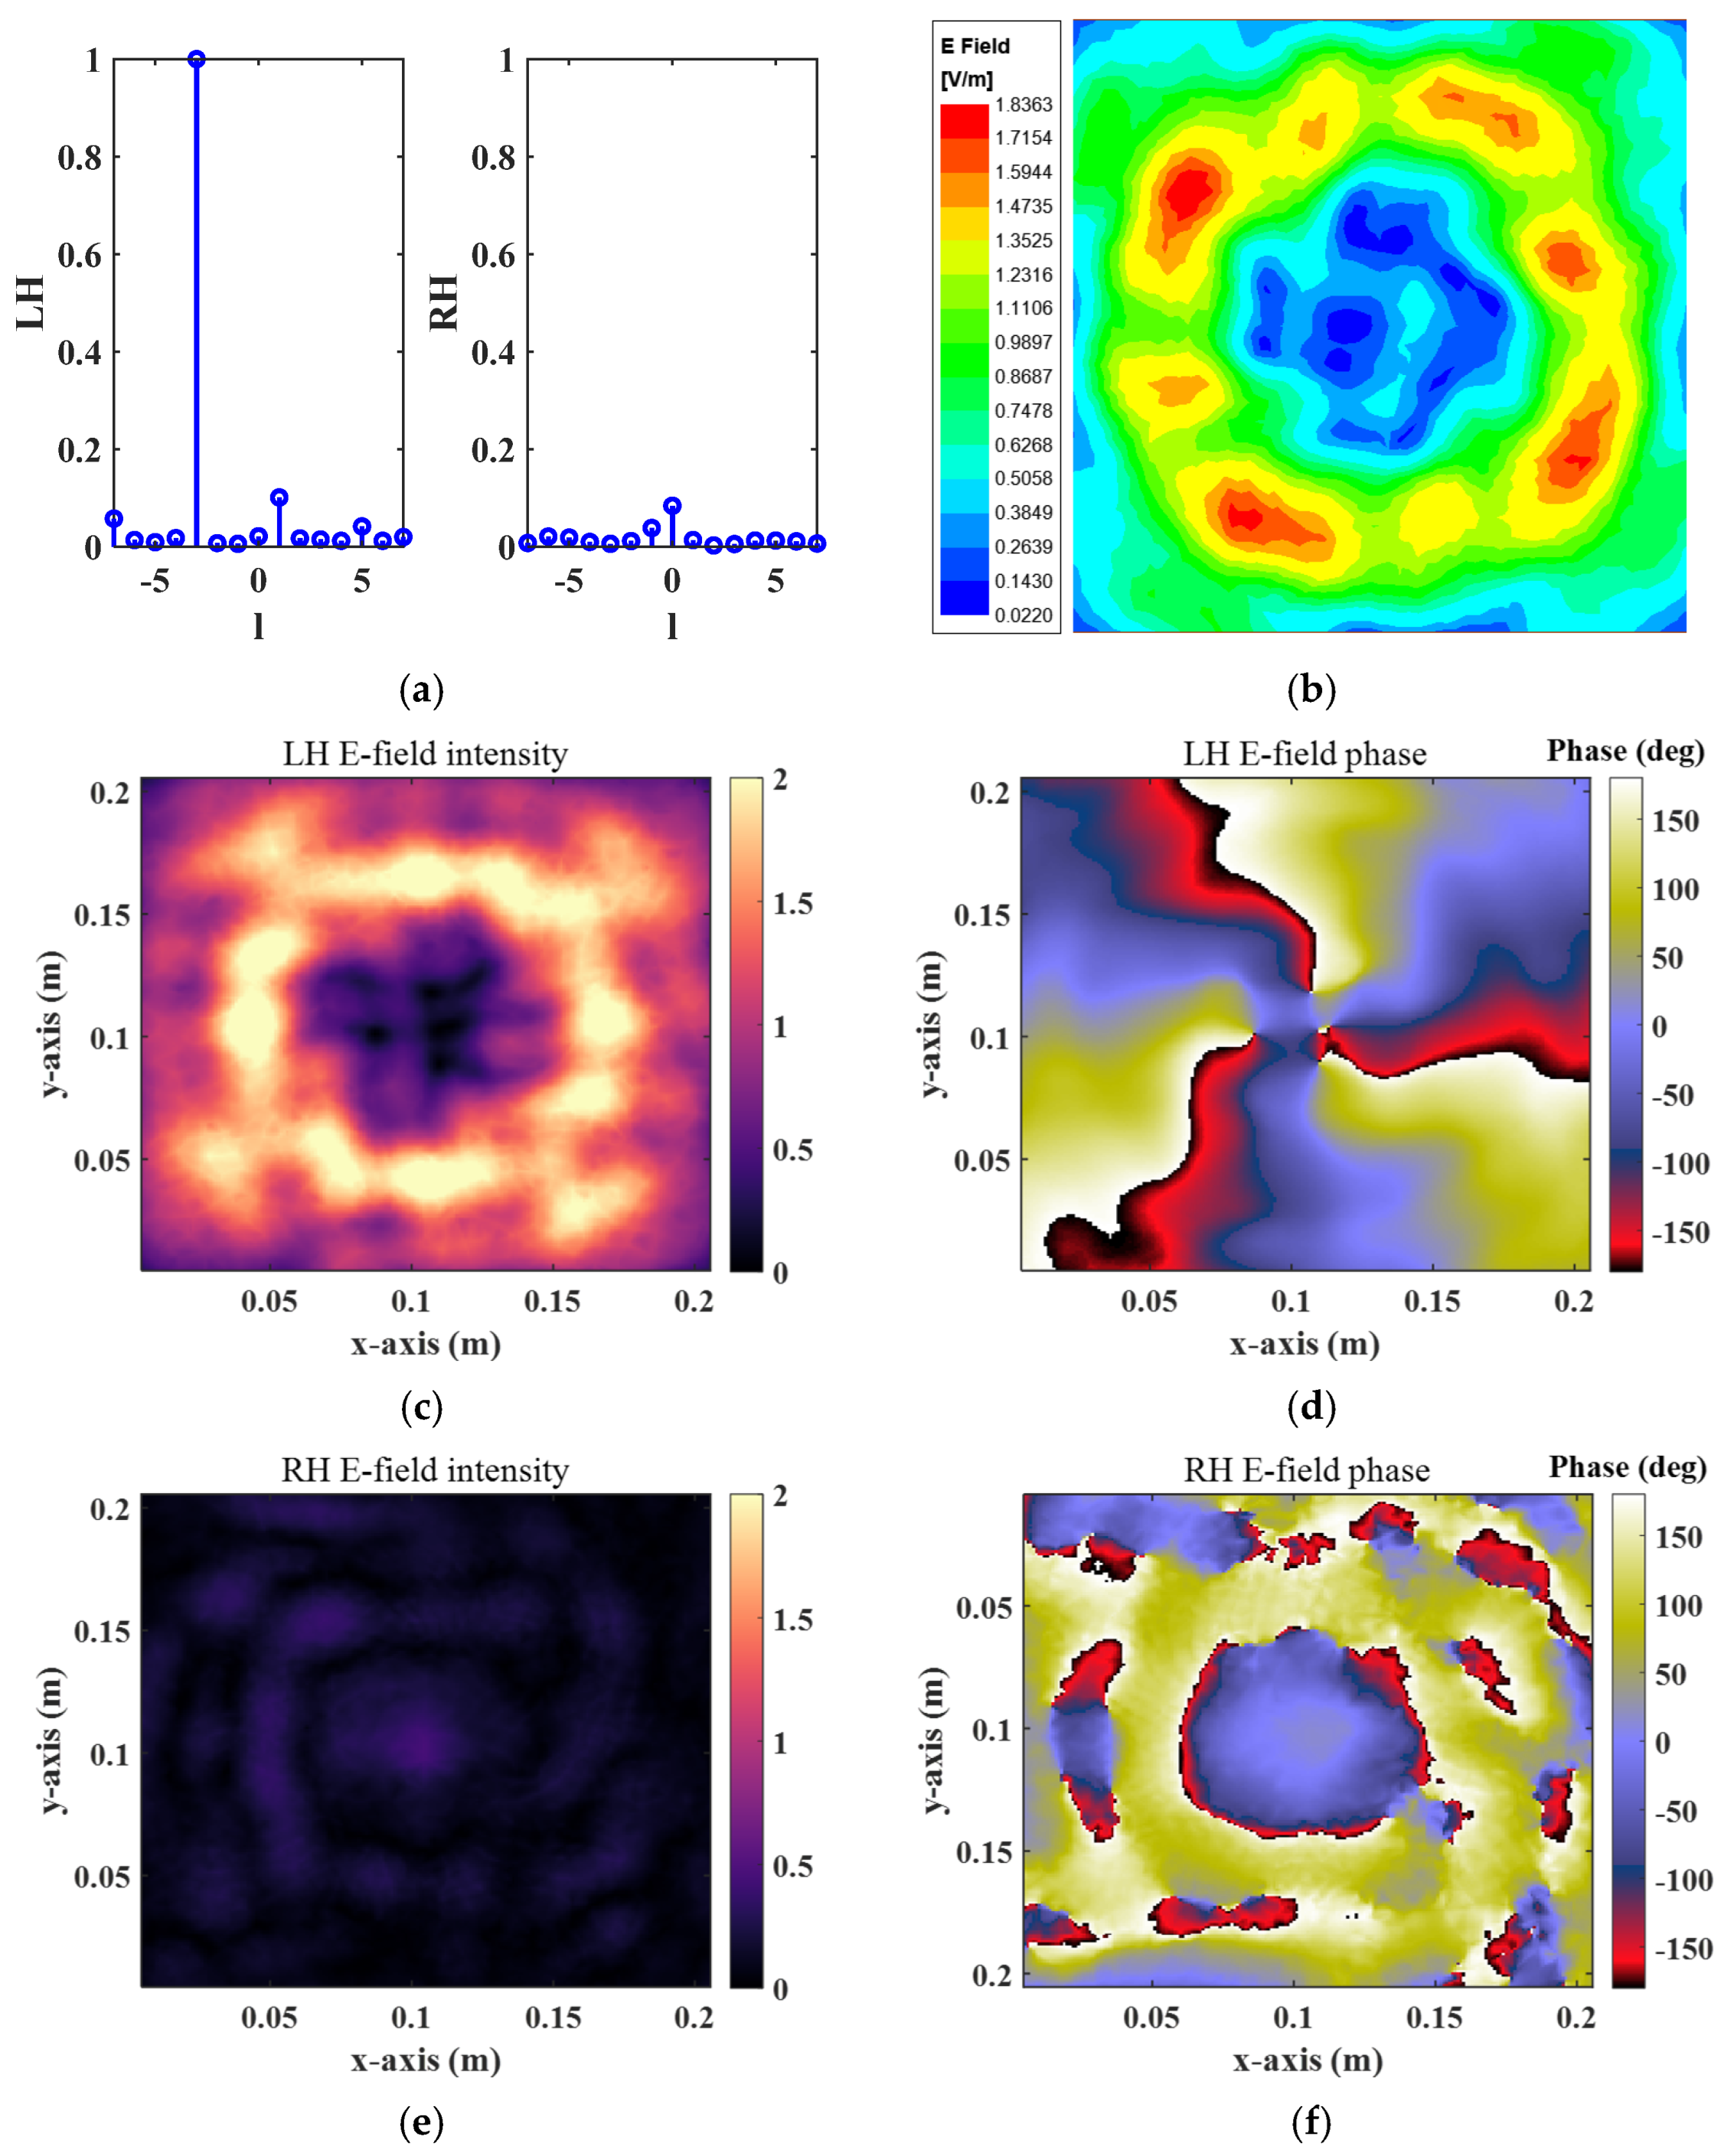
3.2. Near-Field Simulation of the Compact Metasurface

3.2.1. Normal Incidence of a Linearly Polarized Plane Wave on a Compact Metasurface

The expression for the change in the electric field of the multi-mode vortex wave with an azimuth angle φ can be represented by Equation (3), where m can be an arbitrary integer or fraction. Based on the size of the metasurface, a design phase can be generated for each coordinate position of the metasurface element. The desired rotation phase can be obtained by dividing the design phase by two, and an EE unit is used to generate the required rotation phase, as depicted in Figure 7a. Figure 7b,c illustrate, respectively, the vector E field and amplitude field of E obtained through full-wave simulation software.
E = m e j l m φ
The design simulation of a 20 × 20 rectangular metasurface’s vortex wave is depicted in Figure 8 using full-wave simulation software. The design mode is l = −3, with the incident wave being a uniform linearly polarized wave. The calculated frequency is 10 GHz. Figure 8a,b illustrate the vector electric field and electric field amplitude observed at z = 130 mm, where the maximum electric field amplitude measures 1.59 V/m. It can be observed that the electric field amplitude generated by the metasurface takes on an irregular ring shape. Figure 8a showcases the scattering electric field, which has been extracted from the full-wave simulation software. By calculating its OAM spectrum, amplitude, and phase, it becomes evident that a vortex wave with mode l = −3 is generated while maintaining high mode purity. Figure 8b,c demonstrate complex vector noise superimposed on the extracted scattering electric field, with noise amplitudes of 0.2 and 0.3, respectively. Through calculation, one can obtain the OAM spectrum, amplitude, and phase of this scattering electric field affected by noise; it should be noted that there is a reduction in purity within its OAM spectrum due to the noise influence.

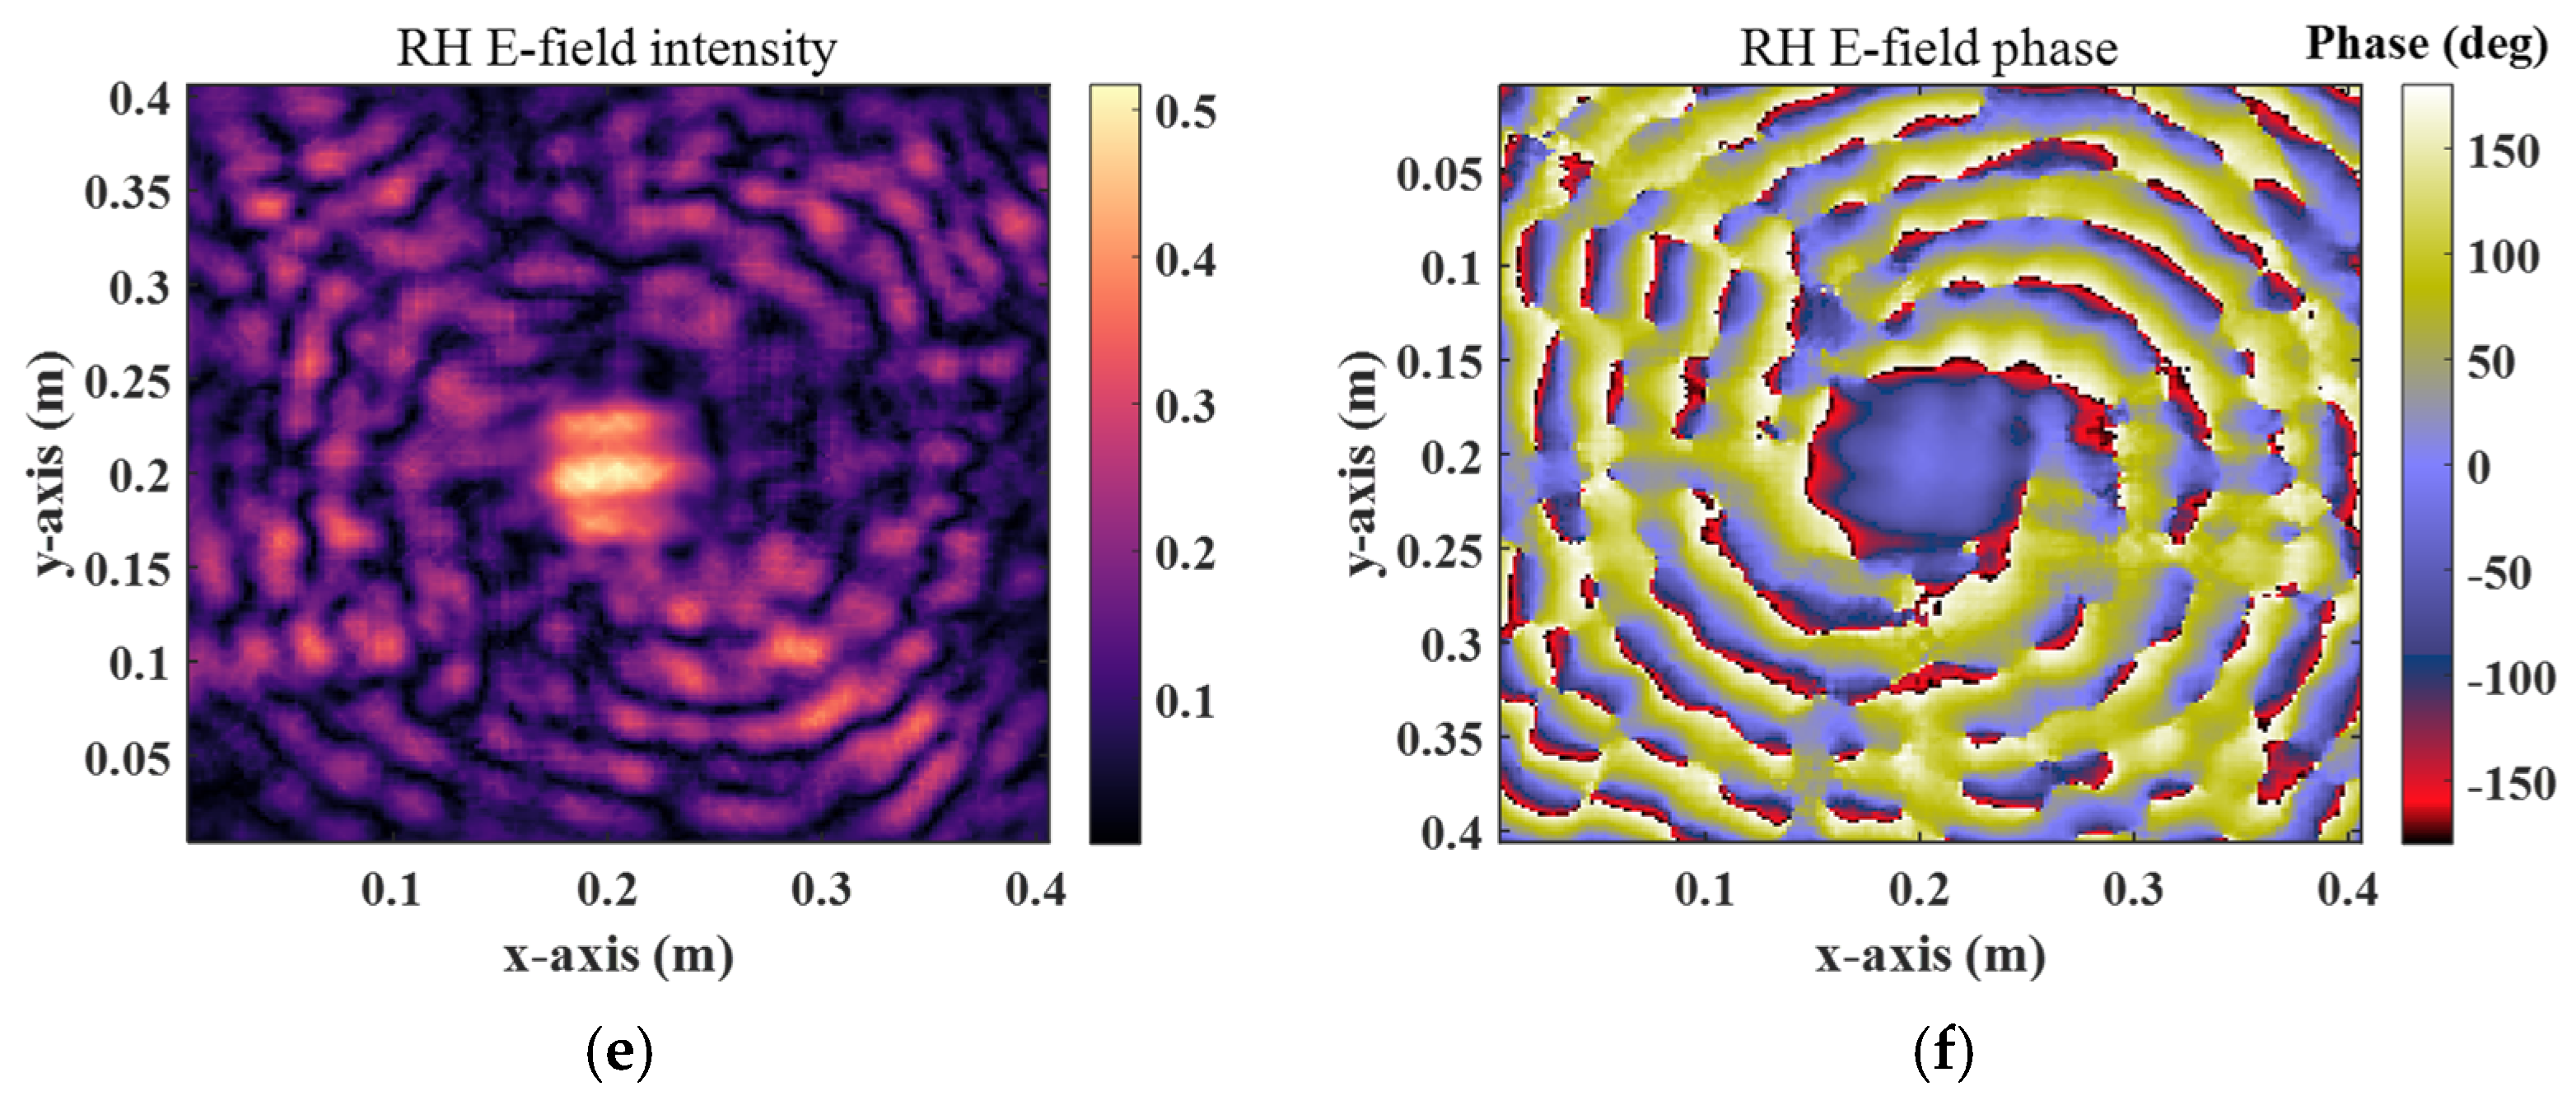
3.2.2. Normal Incidence of a Circularly Polarized Plane Wave on a Compact Metasurface

The design simulation of a 20 × 20 rectangular metasurface vortex wave in the full-wave simulation software is illustrated in Figure 9. The design mode is l = −3, and the incident wave is circularly polarized. The calculated frequency is 12 GHz. Figure 9a displays the OAM spectrum observed at z = 130 mm. It can be observed that LH = −3 dominates as the main polarization component, while RH right-hand circular polarization remains low as a cross-polarization component. A high-purity vortex wave with mode LH = −3 is generated, exhibiting a maximum electric field amplitude of 1.83 V/m in Figure 9b. Figure 9c,d depict the calculated ring-shaped intensity of the left-polarized electric field and three-period helical phase, respectively, confirming that the metasurface generates an expected mode vortex wave characterized by a regular ring-shaped electric field amplitude. Figure 9e,f present both the intensity and phase of the calculated right-handed polarization electric field, demonstrating sufficiently low undesired right-handed circular polarization amplitudes and verifying the high conversion efficiency achieved by the designed metasurface. It can be seen that using circularly polarized wave excitation yields better results.

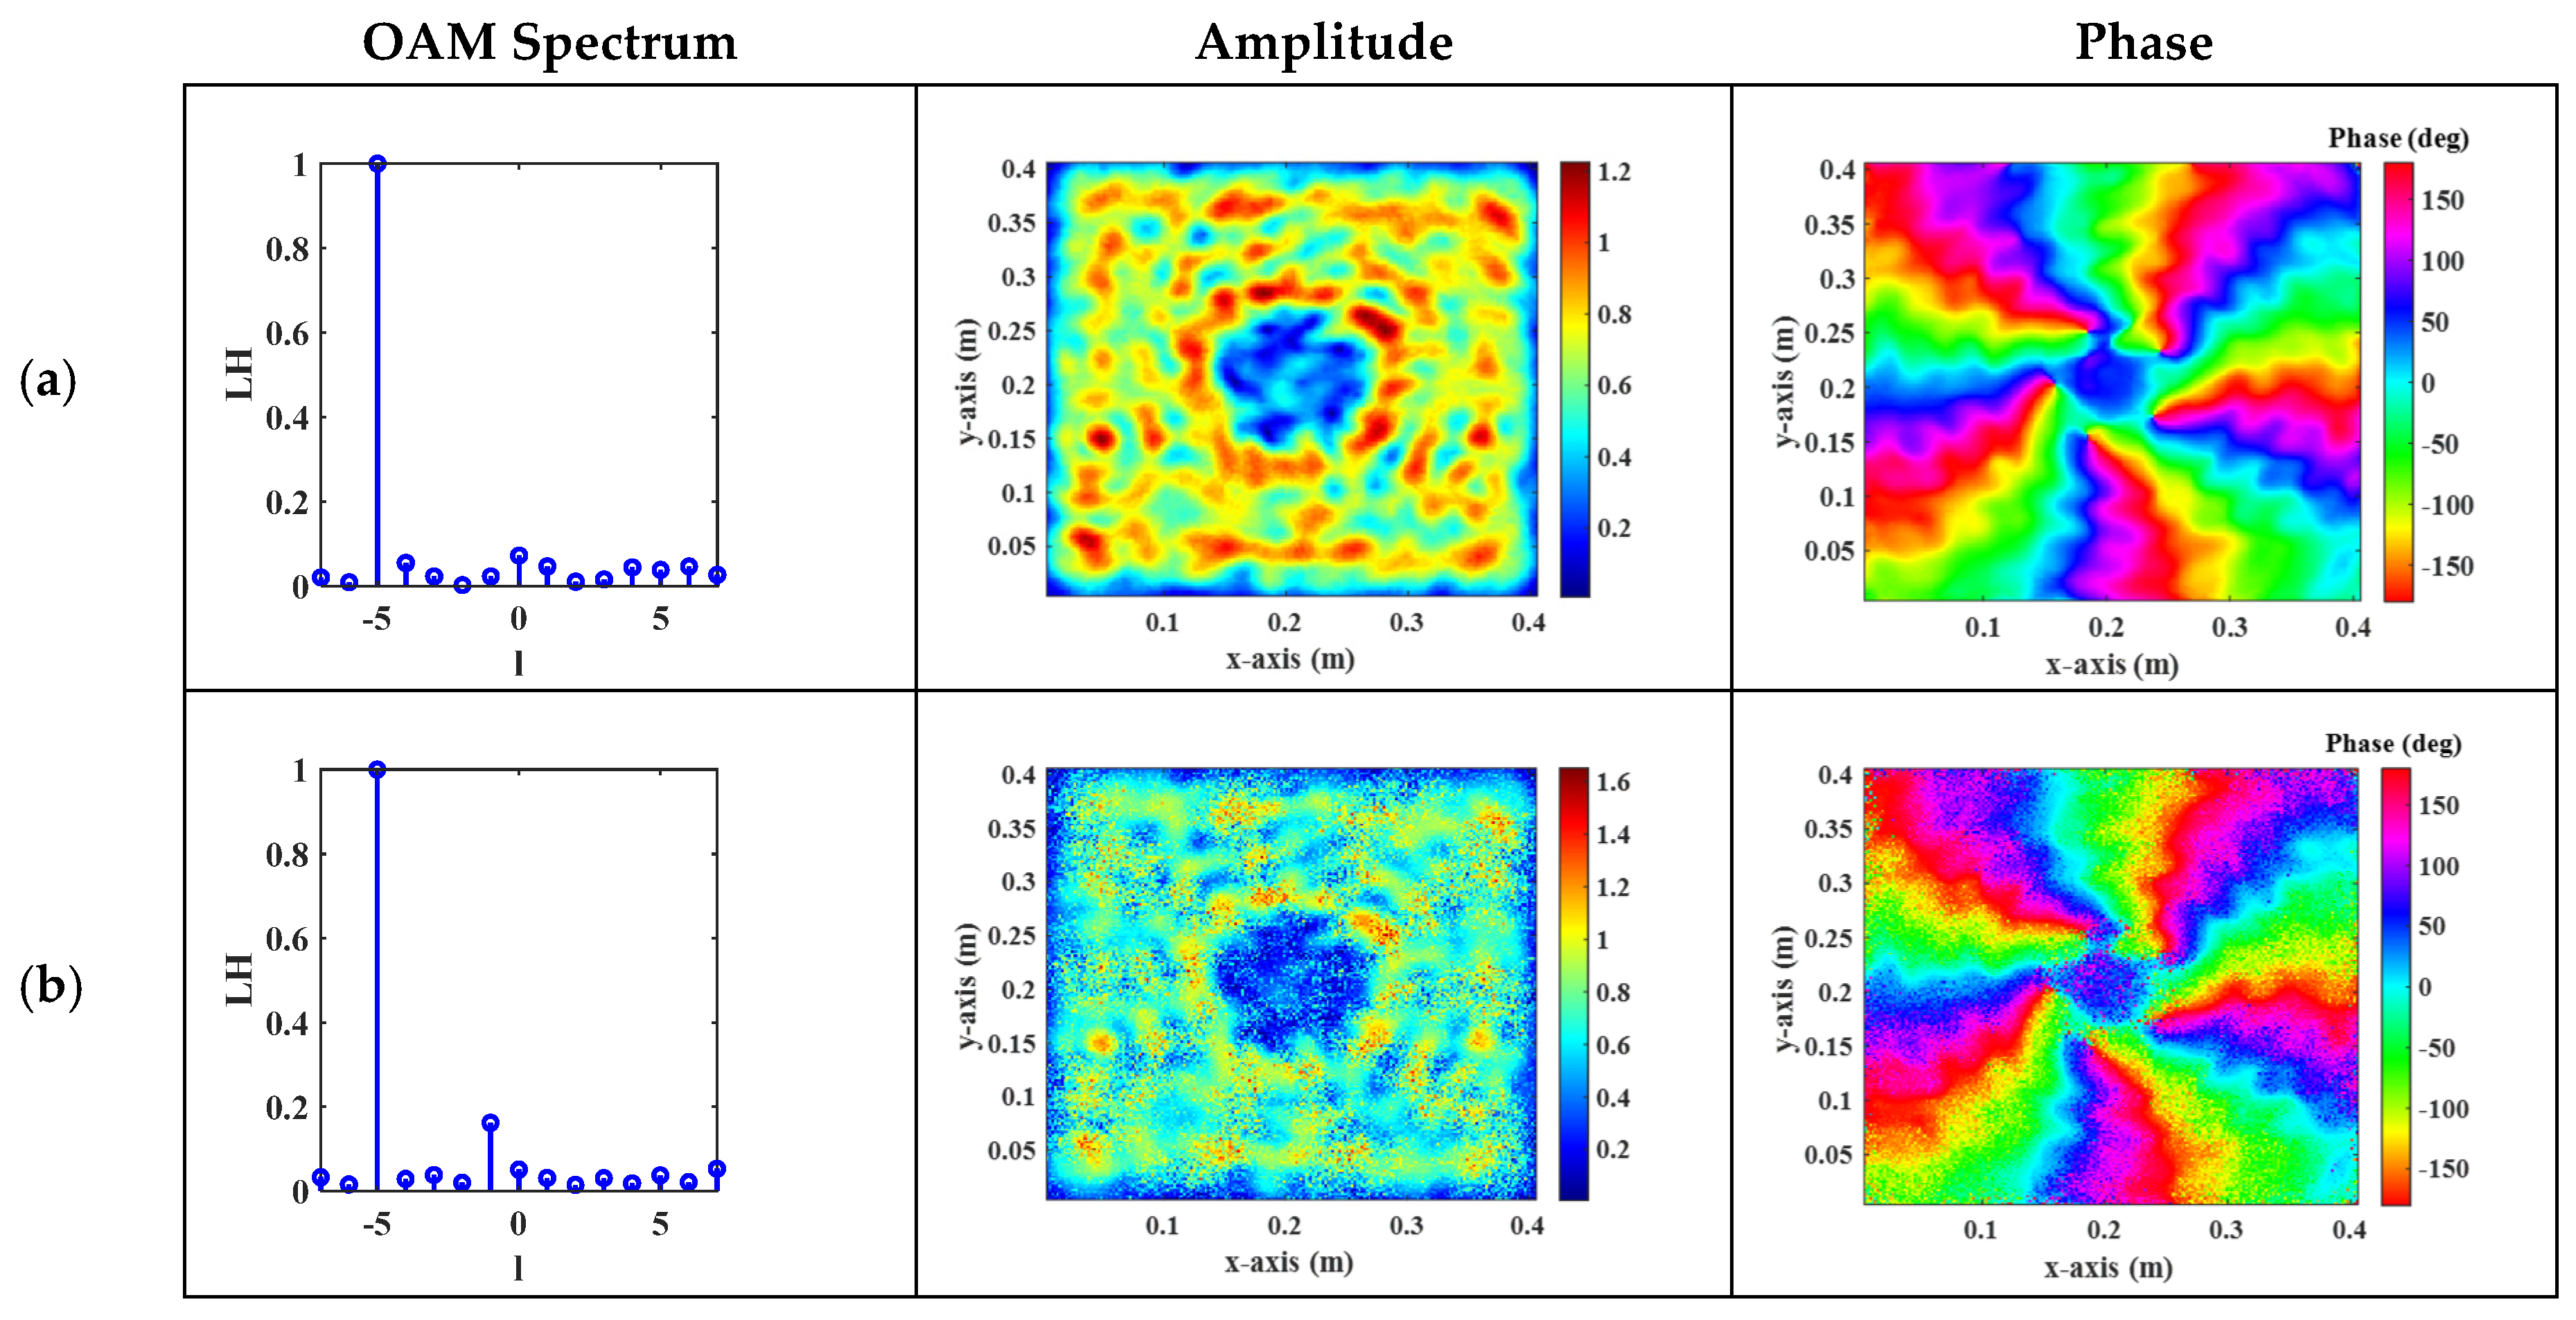
3.3. Near-Field Simulation of Large-Scale Metasurfaces

3.3.1. Normal Incidence of a Linearly Polarized Plane Wave on a Large-Scale Metasurface

The design simulation of a 40 × 40 rectangular array vortex wave is presented in Figure 10a, conducted using full-wave simulation software. The design mode is l = −5, with the incident wave being a linearly polarized uniform plane wave. The calculated frequency is 10 GHz. Figure 10b,c illustrate the vector electric field and electric field amplitude observed at z = 120 mm, where the maximum electric field amplitude reaches 1.29 V/m. It can be observed that the electric field amplitude generated by the metasurface exhibits a highly regular ring shape.
In Figure 11a, we present the scattering electric field, which was extracted from the full-wave simulation software. By calculating its OAM spectrum, amplitude, and phase, it becomes evident that a vortex wave with mode l = −5 is generated while maintaining high mode purity. Figure 11b,c demonstrate complex vector noise superimposed on the extracted scattering electric field, with noise amplitudes of 0.2 and 0.3, respectively. Despite this influence of noise, the calculations reveal that the OAM spectrum purity remains high and that the scattering electric field remains unaffected by such noise.

3.3.2. Normal Incidence of a Circularly Polarized Plane Wave on a Large-Scale Metasurface

The design simulation of a 40 × 40 rectangular metasurface vortex wave in the full-wave simulation software is illustrated in Figure 12. The design mode is l = −5 and the incident wave is circularly polarized. The calculated frequency is 12 GHz. Figure 9a displays the OAM spectrum observed at z = 120 mm. It can be observed that LH = −5 dominates as the main polarization component, while RH right-hand circular polarization remains low as a cross-polarization component. A high-purity vortex wave with mode LH = −5 is generated, exhibiting a maximum electric field amplitude of 1.81 V/m in Figure 12b. Figure 12c,d depict the calculated ring-shaped intensity of the left-polarized electric field and five-period helical phase, respectively, confirming that the metasurface generates an expected mode vortex wave characterized by a regular ring-shaped electric field amplitude. Figure 12e,f present both the intensity and phase of the calculated right-handed polarization electric field, demonstrating sufficiently low undesired right-handed circular polarization amplitudes and verifying the high conversion efficiency achieved by the designed metasurface.

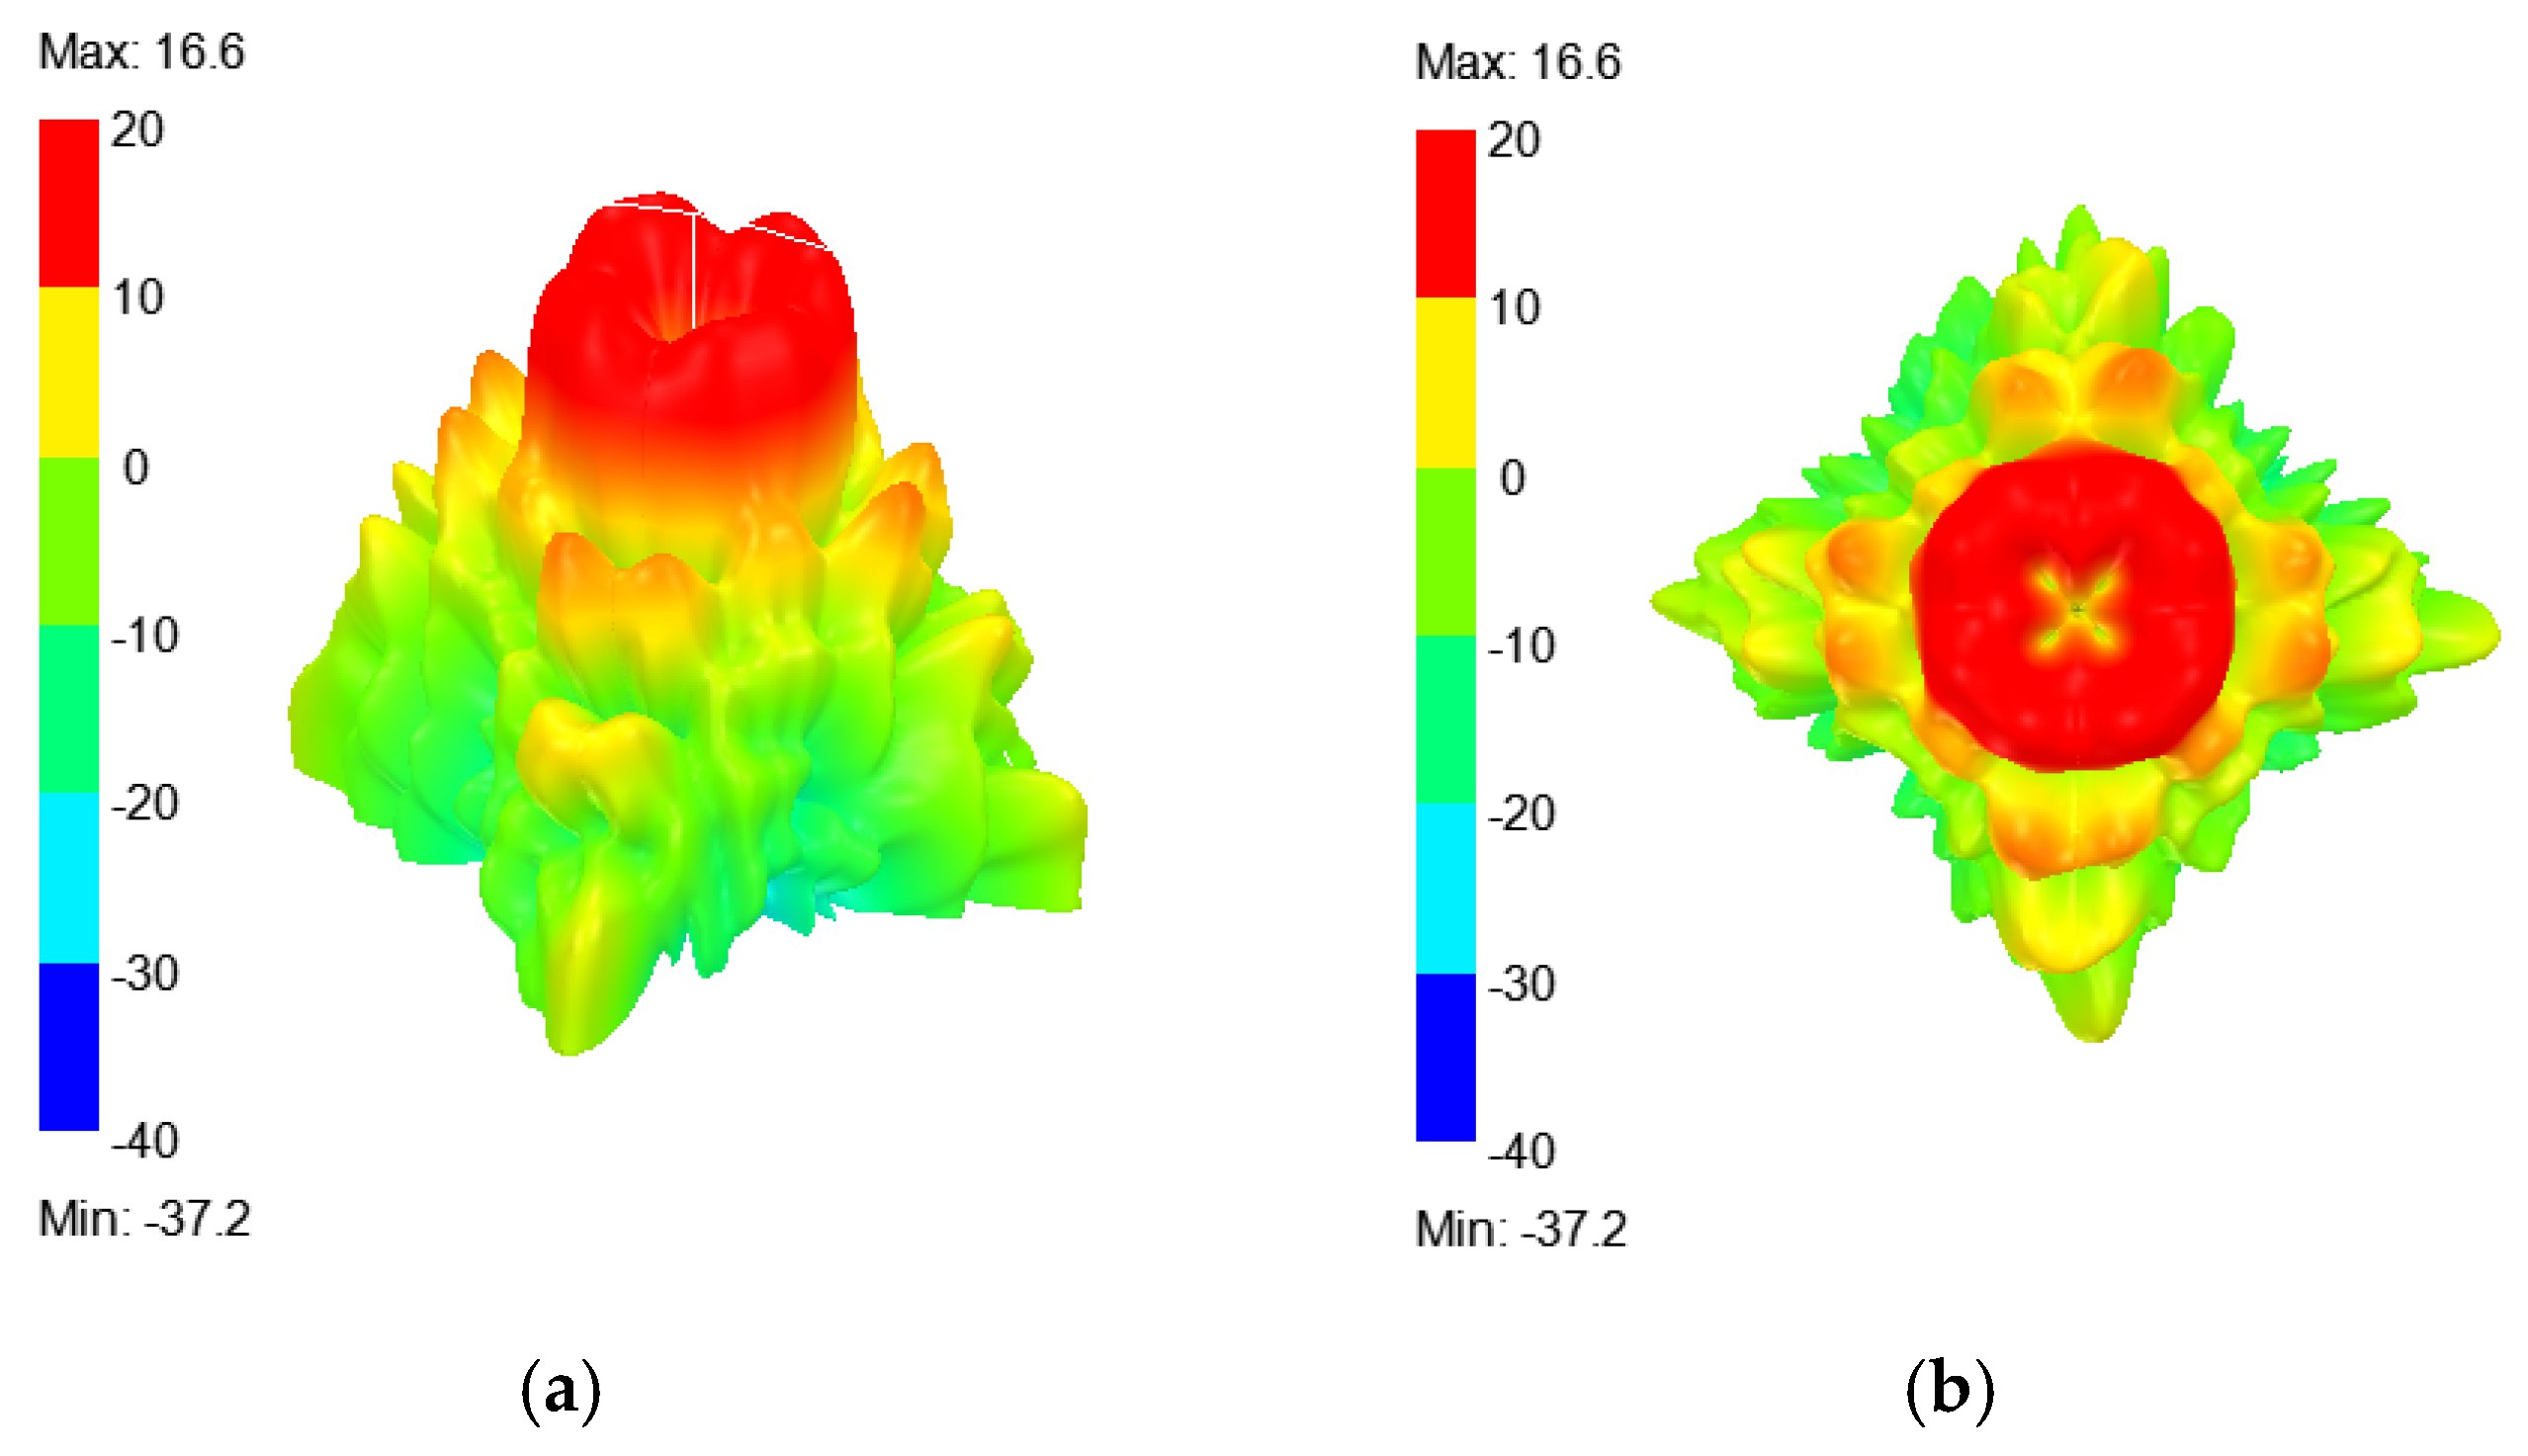
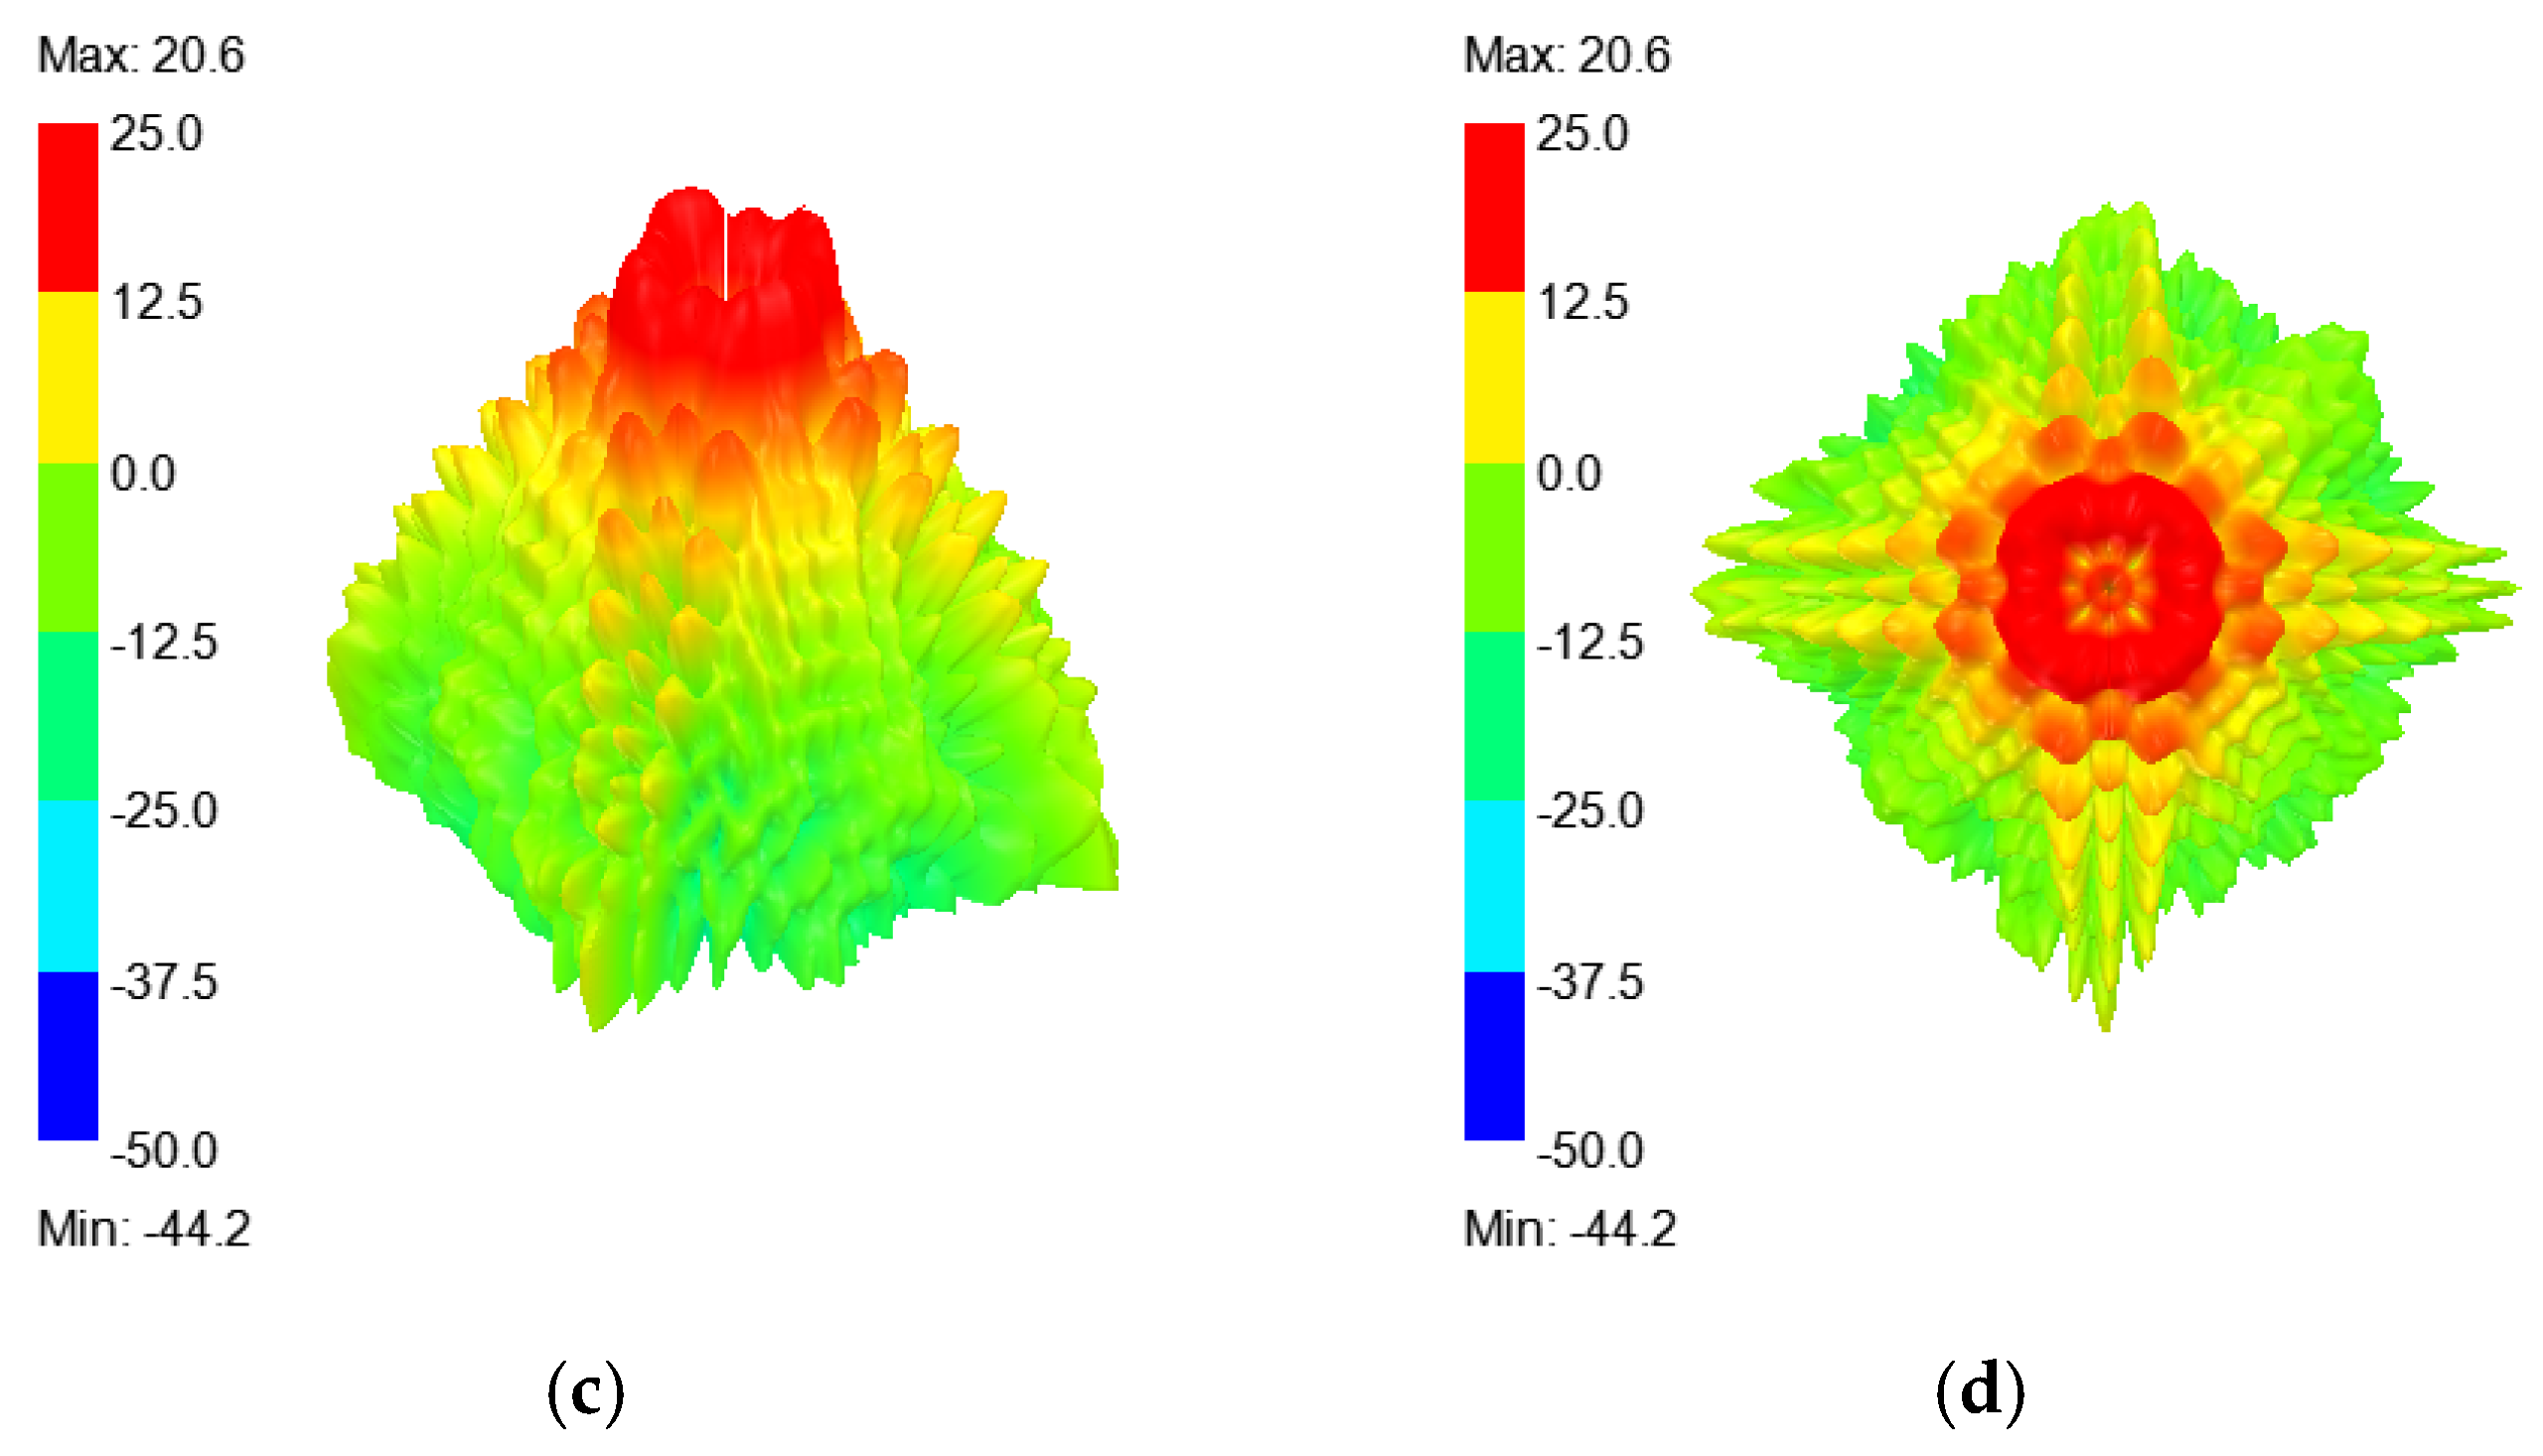
4. Discussion of Far-Field Patterns with Varying Dimensions

The near-field calculation of a very large metasurface, such as a 60 × 60 array, necessitates an expanded radiation box as depicted in Figure 8 and Figure 10. However, when the metasurface size is increased to 60 × 60, the computational workload grows exponentially, surpassing the capabilities of a single workstation for completing the task. At 12 GHz, Figure 13 illustrates the far-field diagram for metasurfaces of varying sizes. It can be observed that the far field exhibits a hollow circular beam characteristic of vortex waves. In this context, circularly polarized waves are employed to excite metasurfaces measuring 20 × 20 and 40 × 40 to obtain the far-field patterns.

5. Conclusions

In this article, a theoretical analysis of the near field of an ultra-large-scale metasurface has been performed based on calculations. The vortex beams generated by the large metasurface array converged toward the center and generated fewer beam sidelobes. Gaussian noise was used to simulate the actual noise distribution. The findings demonstrate that as the metasurface size increases, the metasurface utilized for generating vortex waves exhibits enhanced anti-interference capability, enabling a clear distinction of both the amplitude and phase of the electric field on the sampling surface. Conversely, smaller arrays exhibit weaker anti-interference ability. A single-layer broadband EE unit cell has been proposed to design a vortex beam metasurface. Vortex beams with different sizes were also simulated and analyzed and may find further applications in communication systems.

Author Contributions

B.S.: materials and method, conclusions and suggestions, writing—original draft, and writing—review and editing. K.G.: numerical calculation and simulation analysis and writing—original draft. A.Q.: introduction, numerical calculation, writing—original draft, and writing—review. All authors have read and agreed to the published version of the manuscript.

Funding

This research was funded by the Self-Funded Project of the Scientific Research of Hebei Department of Education, grant numbers ZC2025077 and ZC2023117; Hebei Key Laboratory of Resource and Environmental Disaster Mechanism and Risk Monitoring, grant number FZ248108; and the State Key Laboratory of Advanced Rail Autonomous Operation Project, grant number RAO2023ZZ004.

Institutional Review Board Statement

Not applicable.

Informed Consent Statement

Not applicable.

Data Availability Statement

The original contributions presented in this study are included in the article. Further inquiries can be directed to the corresponding author.

Conflicts of Interest

The authors declare no conflicts of interest.

References

  1. Liu, K.; Cheng, Y.; Gao, Y.; Li, X.; Qin, Y.; Wang, H. Super-resolution radar imaging based on experimental OAM beams. Appl. Phys. Lett. 2017, 110, 164102. [Google Scholar] [CrossRef]
  2. Bu, X.; Zhang, Z.; Liang, X.; Chen, L.; Tang, H.; Zeng, Z.; Wang, J. A Novel Scheme for MIMO-SAR Systems Using Rotational Orbital Angular Momentum. Sensors 2018, 18, 3511. [Google Scholar] [CrossRef]
  3. Zhang, C.; Chen, D. Large-Scale Orbital Angular Momentum Radar Pulse Generation with Rotational Antenna. IEEE Antennas Wirel. Propag. Lett. 2017, 16, 2316–2319. [Google Scholar] [CrossRef]
  4. Grier, D.G.; Han, Y. Erratum: Vortex rings in a constant electric field. Nature 2003, 424, 267–268. [Google Scholar] [CrossRef] [PubMed]
  5. Herring, R.A. Physics. A new twist for electron beams. Science 2011, 331, 155–156. [Google Scholar] [CrossRef]
  6. Bozinovic, N.; Yue, Y.; Ren, Y.; Tur, M.; Kristensen, P.; Huang, H.; Willner, A.E.; Ramachandran, S. Terabit-Scale Orbital Angular Momentum Mode Division Multiplexing in Fibers. Science 2013, 340, 1545–1548. [Google Scholar] [CrossRef] [PubMed]
  7. Yan, Y.; Xie, G.; Lavery, M.P.J.; Huang, H.; Ahmed, N.; Bao, C.; Ren, Y.; Cao, Y.; Li, L.; Zhao, Z.; et al. High-capacity millimetre-wave communications with orbital angular momentum multiplexing. Nat. Commun. 2014, 5, 4876. [Google Scholar] [CrossRef]
  8. Barbuto, M.; Miri, M.A.; Alù, A.; Bilotti, F.; Toscano, A. A Topological Design Tool for the Synthesis of Antenna Radiation Patterns. IEEE Trans. Antennas Propag. 2020, 68, 1851–1859. [Google Scholar] [CrossRef]
  9. Wen, Y.; Chremmos, I.; Chen, Y.; Zhu, G.; Zhang, J.; Zhu, J.; Zhang, Y.; Liu, J.; Yu, S. Compact and high-performance mode sorter enabling a multi-dimensional multiplexed 50-km vortex fiber communication system. Optica 2020, 7, 254–262. [Google Scholar] [CrossRef]
  10. Yang, L.J.; Sun, S.; Sha, W.E.I. Ultrawideband Reflection-Type Metasurface for Generating Integer and Fractional Orbital Angular Momentum. IEEE Trans. Antennas Propag. 2020, 68, 2166–2175. [Google Scholar] [CrossRef]
  11. Yang, L.J.; Sun, S.; Sha, W.E.I.; Huang, Z.; Hu, J. Arbitrary Vortex Beam Synthesis With Donut-Shaped Metasurface. IEEE Trans. Antennas Propag. 2021, 70, 573–584. [Google Scholar] [CrossRef]
  12. Yang, L.J.; Sun, S.; Xu, H.X.; Qiu, C.W. Broadband Amplitude–Phase Metasurface for Generating Crosstalk-Free Amplitude-Modulated Vortex Beams. IEEE Trans. Antennas Propag. 2025, 73, 421–431. [Google Scholar] [CrossRef]
  13. Tao, K.; Sun, S.; Chen, P.Y.; Yang, L.J.; Yang, Y.; Hu, J. A Novel Method for Controlling the Divergence Angle of Multimode Vortex Beams. IEEE Antennas Wirel. Propag. Lett. 2025, 24, 344–348. [Google Scholar] [CrossRef]
  14. Bao, Y.; Ni, J.; Qiu, C.W. A Minimalist Single-Layer Metasurface for Arbitrary and Full Control of Vector Vortex Beams. Adv. Mater. 2020, 32, 1905659. [Google Scholar] [CrossRef]
  15. Liu, H.; Teng, C.; Yang, H.; Deng, H.; Xu, R.; Deng, S.; Chen, M.; Yuan, L. Proposed phase plate for superimposed orbital angular momentum state generation. Opt. Express 2018, 26, 14792–14799. [Google Scholar] [CrossRef]
  16. Yuan, Y.; Sun, S.; Chen, Y.; Zhang, K.; Ding, X.; Ratni, B.; Wu, Q.; Burokur, S.N.; Qiu, C.-W. A Fully Phase-modulated Metasurface as An Energy Controllable Circular Polarization Router. Adv. Sci. 2020, 7, 2001437. [Google Scholar] [CrossRef]
  17. Jiang, Z.H.; Kang, L.; Yue, T.; Xu, H.X.; Yang, Y.; Jin, Z.; Yu, C.; Hong, W.; Werner, D.H.; Qiu, C.W. A Single Noninterleaved Metasurface for High-Capacity and Flexible Mode Multiplexing of Higher-Order Poincaré Sphere Beams. Adv. Mater. 2020, 32, e1903983. [Google Scholar] [CrossRef]
  18. Yuan, Y.; Zhang, K.; Ratni, B.; Song, Q.; Ding, X.; Wu, Q.; Burokur, S.N.; Genevet, P. Independent phase modulation for quadruplex polarization channels enabled by chirality-assisted geometric-phase metasurfaces. Nat. Commun. 2020, 11, 4186. [Google Scholar] [CrossRef]
  19. Devlin, R.C.; Ambrosio, A.; Rubin, N.A.; Mueller, J.P.B.; Capasso, F. Arbitrary spin-to-orbital angular momentum conversion of light. Science 2017, 358, 896–901. [Google Scholar] [CrossRef]
  20. Sun, J.J.; Sun, S.; Yang, L.J.; Hu, J. Enhanced Misalignment Estimation of Orbital Angular Momentum Signal Based on Deep Recurrent Neural Networks. IEEE Trans. Antennas Propag. 2023, 71, 5522–5527. [Google Scholar] [CrossRef]
  21. Xu, H.X.; Liu, H.; Ling, X.; Sun, Y.; Yuan, F. Broadband vortex beam generation using multimode Pancharatnam–Berry metasurface. IEEE Trans. Antennas Propag. 2017, 65, 7378–7382. [Google Scholar]
  22. Akram, M.R.; Ding, G.; Chen, K.; Feng, Y.; Zhu, W. Ultrathin single layer metasurfaces with ultra-wideband operation for both transmission and reflection. Adv. Mater. 2020, 32, e1907308. [Google Scholar] [PubMed]
  23. Luo, W.; Sun, S.; Xu, H.X.; He, Q.; Zhou, L. Transmissive ultrathin pancharatnam-berry metasurfaces with nearly 100% efficiency. Phys. Rev. Appl. 2017, 7, 044033. [Google Scholar]
  24. Tang, S.; Cai, T.; Liang, J.-G.; Xiao, Y.; Zhang, C.-W.; Zhang, Q.; Hu, Z.; Jiang, T. High-efficiency transparent vortex beam generator based on ultrathin Pancharatnam–Berry metasurfaces. Opt. Express 2019, 27, 1816–1824. [Google Scholar] [PubMed]
  25. Jeong, J.; Kim, Y.-D. Analysis of Near-Field EM Energy Densities for UCA-OAM Wave Based on Infinitesimal Dipoles. IEEE Acess 2024, 12, 81518–81526. [Google Scholar]
  26. He, D.; Guan, K.; Yan, D.; Yi, H.; Zhang, Z.; Wang, X. Physics and AI-based digital twin of multi-spectrum propagation characteristics for communication and sensing in 6G and beyond. IEEE J. Sel. Areas Commun. 2023, 41, 3461–3473. [Google Scholar] [CrossRef]
  27. He, D.; Ai, B.; Guan, K.; Wang, L.; Zhong, Z.; Kürner, T. The Design and Applications of High-Performance Ray-Tracing Simulation Platform for 5G and Beyond Wireless Communications: A Tutorial. IEEE Commun. Surv. Tutor. 2019, 21, 10–27. [Google Scholar]
  28. Cicchetti, R.; Faraone, A.; Testa, O. Near Field Synthesis Based on Multi-Port Antenna Radiation Matrix Eigenfields. IEEE Access 2019, 7, 62184–62197. [Google Scholar]
Figure 1. Schematic of the theoretical analysis of the near field. R = N × p, where p is the period of the unit cell.
Applsci 15 03900 g001
Figure 2. Near-field simulation of metasurfaces with different sizes at an observation distance of 0.9 m. (a) R = 20 × p, R = 0.2 m, sampling interval = 0.007 m, and metasurface size of 6.66 × 6.66λ02; (b) R = 40 × p, R = 0.4 m, sampling interval = 0.005 m, and super surface size of 13.33 × 13.33λ02; (c) R = 80 × p, R = 0.8 m, sampling interval = 0.005 m, and metasurface size of 26.66 × 26.66λ02; (d) R = 120 × p, R = 1.2 m, sampling interval = 0.005 m, and metasurface size of 40 × 40λ02.
Applsci 15 03900 g002
Figure 3. Near-field simulation of metasurfaces with different sizes at an observation distance of 1.2 m. (a) R = 20 × p, R = 0.2 m, sampling interval = 0.007 m, and metasurface size of 6.66 × 6.66λ02; (b) R = 40 × p, R = 0.4 m, sampling interval = 0.005 m, and super surface size of 13.33 × 13.33λ02; (c) R = 80 × p, R = 0.8 m, sampling interval = 0.005 m, and metasurface size of 26.66 × 26.66λ02; (d) R = 120 × p, R = 1.2 m, sampling interval = 0.005 m, and metasurface size of 40 × 40λ02.
Applsci 15 03900 g003
Figure 4. Near-field metasurface simulation with noise interference and observation distance of 0.9 m. (a) R = 20 × p, R = 0.2 m, sampling interval = 0.007 m, and metasurface size of 6.66 × 6.66λ02; (b) R = 28 × p, R = 0.28 m, sampling interval = 0.007 m, and metasurface size of 9.33 × 9.33λ02; (c) R = 40 × p, R = 0.4 m, sampling interval = 0.005 m, and metasurface size of 13.33 × 13.33λ02; (d) R = 60 × p, R = 0.6 m, sampling interval = 0.005 m, and metasurface size of 20 × 20λ02; (e) R = 80 × p, R = 0.8 m, sampling interval = 0.005 m, and metasurface size of 26.66 × 26.66λ02; (f) R = 100 × p, R = 1 m, sampling interval = 0.005 m, and metasurface size of 33.33 × 33.33λ02; (g) R = 120 × p, R = 1.2 m, sampling interval = 0.005 m, and metasurface size of 40 × 40λ02.
Applsci 15 03900 g004aApplsci 15 03900 g004b
Figure 5. Near-field metasurface simulation with noise interference and an observation distance of 1.2 m. (a) R = 20 × p, R = 0.2 m, sampling interval = 0.007 m, and metasurface size of 6.66 × 6.66λ02; (b) R = 28 × p, R = 0.28 m, sampling interval = 0.007 m, and metasurface size of 9.33 × 9.33λ02; (c) R = 40 × p, R = 0.4 m, sampling interval = 0.005 m, and super surface size of 13.33 × 13.33λ02; (d) R = 60 × p, R = 0.6 m, sampling interval = 0.005 m, and metasurface size of 20 × 20λ02; (e) R = 80 × p, R = 0.8 m, sampling interval = 0.005 m, and metasurface size of 26.66 × 26.66λ02; (f) R = 100 × p, R = 1 m, sampling interval = 0.005 m, and metasurface size of 33.33 × 33.33λ02; (g) R = 120 × p, R = 1.2 m, sampling interval = 0.005 m, and metasurface size of 40 × 40λ02.
Applsci 15 03900 g005
Figure 6. EE unit and reflection spectrum for the EE unit with different rotation angles under circular polarization wave excitations. (a) Top view and (b) side view of the EE unit, where ra = 1.75 mm, ellipticity is 2.55, rb = 1.3 mm, ellipticity is 0.4, period = 10 mm, H = 3 mm. (c) The magnitude (rll) of the unit; (d) the phase of the unit.
Applsci 15 03900 g006
Figure 7. Near-field simulation of the compact metasurface. (a) The designed 20 × 20 metasurface; (b) vector electric field; (c) magnitude of the electric field.
Applsci 15 03900 g007
Figure 8. Near-field calculation of vortex waves generated by the l = −3 metasurface. (a) Noiseless. (b) The noise amplitude is 0.2. (c) The noise amplitude is 0.3.
Applsci 15 03900 g008
Figure 9. Near-field simulation results of vortex waves generated by the l = −3 metasurface with a frequency of 12 GHz. (a) OAM spectrum; (b) magnitude of E field from full wave software; (c,d) intensity and phase of left-handed circular polarization electric field; (e,f) intensity and phase of right-handed circular polarization electric field.
Applsci 15 03900 g009
Figure 10. Near-field simulation of a large-scale metasurface. (a) The designed 40 × 40 metasurface; (b) vector electric field; (c) magnitude of the electric field.
Applsci 15 03900 g010
Figure 11. Near-field calculation of vortex waves generated by the l = −5 metasurface. (a) Noiseless. (b) The noise amplitude is 0.2. (c) The noise amplitude is 0.3.
Applsci 15 03900 g011aApplsci 15 03900 g011b
Figure 12. Near-field simulation results of vortex waves generated by the l = −5 metasurface with a frequency of 12 GHz. (a) OAM spectrum; (b) magnitude of E field from full wave software; (c,d) intensity and phase of left-handed circular polarization electric field; (e,f) intensity and phase of right-handed circular polarization electric field.
Applsci 15 03900 g012aApplsci 15 03900 g012b
Figure 13. Far-field calculation of vortex waves generated by the l = −3 metasurface and l = −5 metasurface at 12 GHz. (a) Trimetric view and (b) top view of the l = −3 metasurface; (c) trimetric view and (d) top view of the l = −5 metasurface.
Applsci 15 03900 g013aApplsci 15 03900 g013b
Disclaimer/Publisher’s Note: The statements, opinions and data contained in all publications are solely those of the individual author(s) and contributor(s) and not of MDPI and/or the editor(s). MDPI and/or the editor(s) disclaim responsibility for any injury to people or property resulting from any ideas, methods, instructions or products referred to in the content.

