Article

Analysis and Optimization Design of Internal Flow Evolution of Large Centrifugal Fans Under Inlet Distortion Effects

1
College of Mechanical Engineering, Zhejiang University of Technology, Hangzhou 310023, China
2
Institue of Innovation Research of Shengzhou, Zhejiang University of Technology, Shengzhou 312400, China
*
Author to whom correspondence should be addressed.
Appl. Sci. 2025, 15(7), 3521; https://doi.org/10.3390/app15073521
Submission received: 5 February 2025 / Revised: 10 March 2025 / Accepted: 11 March 2025 / Published: 24 March 2025

Abstract

:
Large curvature, high pre-swirl large high-speed centrifugal fans are the preferred choice for industrial gas quenching furnaces, as they need to operate under non-uniform inlet conditions for extended periods. The resulting inlet distortion disrupts the symmetric flow of the gas, leading to reduced fan stability and phenomena such as flow separation and rotational stall. This issue has become a key research focus in the field of large centrifugal fan applications. This paper introduces an eddy viscosity correction method, and compares it with experimental results from U-shaped pipe curved flow. The corrected SST k-ω model shows a maximum error of only 4.7%. Simulation results show that the fan inlet generates a positive pre-swirl inflow with a relative distortion intensity of 3.83°. The flow characteristics within the impeller passage are significantly affected by the swirl angle distribution. At the maximum swirl angle, the leakage flow at the blade tip develops into a stall vortex that spans the entire passage, with an average blockage coefficient of 0.29. At the minimum swirl angle, the downstream leakage flow at the blade tip is suppressed on the suction side by the main flow, leading to a reduced vortex structure within the passage and an average blockage coefficient of 0.21. To address the design challenges of large high-speed centrifugal fans under inlet distortion, a blade design method based on secondary flow suppression is proposed. Eleven impeller flow surfaces are selected as control parameters, and the centrifugal impeller blade profile is redesigned. Numerical simulations and experimental results of the gas quenching furnace’s flow and temperature fields indicate that the modified impeller significantly reduces the blade tip leakage flow strength, with the average blockage coefficient decreasing to 0.07 and 0.04, respectively. The standard deviation of the average flow velocity at the test section is reduced by 42.78% compared to the original, and the temperature fluctuation at the workpiece surface is reduced by 53.09%. Both the flow and temperature field uniformity are significantly improved.

1. Introductory

To address the dual challenges of energy consumption and environmental pollution, improving the efficiency of energy production and utilization has become increasingly urgent on a global scale [1,2]. Fans have widespread applications in various fields such as energy, construction, machinery, chemical engineering, and aerospace [3,4,5,6,7], with the impeller and blade components being the most critical parts of the fan, playing a primary role in energy transmission and significantly impacting fan efficiency [8,9,10].
In the design of centrifugal impellers, the assumption is often made that the impeller inlet has uniform inflow. However, in practical applications, factors such as limited installation space, structural design requirements, and the layout of inlet piping often lead to non-uniform inflow in centrifugal impellers [11,12,13,14], as illustrated by the occurrence of the pre-rotation phenomenon in engineering applications shown in Figure 1. In actual operation, the non-uniform inflow caused by the inlet piping contradicts the assumption of uniform inflow made during design, which can negatively impact the performance and stable operation of the equipment [15].
Curved pipe inflow is one of the most common causes of non-uniform inflow in centrifugal impellers [16]. Some researchers [17,18] have conducted experiments on the flow field in curved pipes and found that the axial velocity of the main flow begins to distort at the entrance of the bend, forming a recirculation zone, or vortex, as the flow develops through the curved pipe. Mittag [19] discovered that the additional losses and secondary flows caused by the curved inlet pipe lead to non-uniform velocity and pressure distributions at the centrifugal pump inlet. This non-uniform distribution can alter the inlet angle of attack of the impeller, thereby affecting the transient flow within the impeller passage.
Many scholars have conducted extensive research on the performance of impellers under non-uniform inlet flow conditions. Luo [20] found that non-uniform inflow reduces the efficiency of jet pumps and increases axial force fluctuations on the impeller, leading to performance instability. Song [21] indicated that the impact of non-uniform inflow on pump performance might stem from the non-uniform pressure field, which can generate low-pressure regions on the impeller, causing cavitation. Liu [22] showed that reverse-rotating distorted vortices lead to greater efficiency losses than co-rotating ones. Zhang [23] revealed that inlet distortion causes blockage in the rotor tip passages, and the greater the distortion, the more significant the inlet blockage, resulting in greater flow losses. Zhang [24] also pointed out that flow separation due to asymmetric chamber structures and abrupt contraction sections are the main causes of non-uniform flow, which leads to a threefold increase in flow fluctuation in one impeller passage and a twofold increase in the other, ultimately reducing the stability of the pump’s operation.
High-pressure gas quenching heat treatment offers many advantages, including oxidation-free, decarbonization-free, pollution-free, and high surface finish [25,26,27]. In the gas quenching process, the rapid flow of gas is primarily relied upon to carry away heat, achieving rapid cooling. Improving the flow conditions of high-pressure gas within the gas quenching furnace is crucial to enhancing its performance [28,29]. Among the key components, the centrifugal fan impeller serves as the power source for air circulation in the high-pressure gas quenching cooling system [30]. It must overcome the system’s resistance to deliver gas into the heat treatment furnace, and its performance directly affects the entire air-cooling system, with efficiency being a critical factor impacting overall system energy consumption. Therefore, the design of a centrifugal fan impeller with optimal performance and high efficiency is a practical and meaningful issue.
A review of the research on the internal flow characteristics of centrifugal impellers and non-uniform inflow reveals that non-uniform inflow complicates the flow state within the impeller, leading to performance degradation and deterioration of the internal flow field. However, the mechanisms governing the interaction between inlet distortion and the evolution of the internal flow in large high-speed centrifugal fans remain unclear. This study focuses on a specific model of a large high-speed centrifugal fan and modifies the eddy viscosity coefficient in the SST k-ω turbulence model to enhance the accuracy of vortex structure identification. Starting from the causes of secondary flow generated within the rotating passage, the centrifugal impeller blade profile is redesigned, providing a reference for the optimization of large high-speed centrifugal impellers under inlet distortion conditions.

2. Numerical Simulation and Experimental Validation

2.1. Research Object

The subject of this study is a large high-speed centrifugal fan used in the Vacuum High-Pressure Gas Quenching Furnace (VHPGQ). Its main components include the impeller, volute, and collector circle, as shown in Figure 2, with the key parameters listed in Table 1.

2.2. Numerical Simulation

The computational domain is divided into the impeller rotating domain, the volute domain, the inlet domain, and the outlet domain, as shown in Figure 3a. The interaction between the rotating impeller and the stationary guide structures is modeled using the Multi-Reference Frame (MRF) method, with the rotating and stationary domains connected via an interface. Different flow conditions are simulated by controlling the impeller rotational speed, with the inlet and outlet boundaries set as pressure-inlet and pressure-outlet, respectively. The turbulence intensity at the inlet boundary is 5%, with a hydraulic diameter of 0.281 m, corresponding to a turbulence viscosity of 10. The steady-state flow field results after 5000 steps are used as initial conditions for the transient simulations. The steady-state solution is obtained using the SIMPLE algorithm, while the transient solution is obtained using the PISO algorithm. The time step for transient numerical simulations is selected based on the Courant–Friedrichs–Lewy (CFL) condition, ensuring that CFL < 1 within the computational domain. The time step is set to correspond to the time required for the impeller to rotate by 1°, and the residual convergence criterion is set to 1.0 × 10⁻⁵. The pressure term is discretized using a second-order scheme, while the momentum, turbulence kinetic energy, and turbulence dissipation rate are discretized using a second-order upwind scheme. The impeller is meshed with structured grids, while other components are meshed using unstructured grids with ICEM (a commercial grid generation software, version number 2022R1), as shown in Figure 3b. Local mesh refinement is applied to complex flow passage components, such as the volute.
One disadvantage of the eddy viscosity model is its insensitivity to the curvature of streamlines and system rotation [31]. However, rotational turbulence is inevitable in large, high-speed, highly-curved centrifugal impellers. The presence of rotational turbulence not only diminishes the accuracy of predictions made by two-equation models, but also tends to prematurely estimate the location of flow separation. Considering the limited capability of traditional eddy viscosity models in predicting curvature effects, this study enhances numerical accuracy by modifying the eddy viscosity coefficient in the SST k-ω model to account for curvature effects in near-wall turbulence, thereby improving the accuracy of vortex structure identification. The modified eddy viscosity coefficient v t is expressed as [32]:
v t = C μ C μ k ω
C μ = C μ α 1 η 3 η 3 + 1 min α 2 η 3 , 0.99 1
In the expression, η 1 = ( S k / ε ) 2 / 2 ,   η 2 = ( Ω k / ε ) 2 / 2 ,   η 3 = η 1 η 2 ,   α 1 = 0.055 , α 2 = 0.5 , C μ is the model constant, Ω is the vorticity, ε is the dissipation rate, k is the turbulent kinetic energy, and ω is the specific dissipation rate.
The modified turbulence model is validated by selecting a 180° U-shaped channel flow to assess its ability to capture the flow characteristics over curved walls and its applicability. The computational domain is shown in Figure 4, which includes a 10H-long inflow section, a 180° bend, and a 12H-long outflow section. The grid is arranged with 151 × 211 nodes. For computational convenience, a layer of mesh is stretched normal to the surface. Both the inner and outer solid walls are treated as no-slip boundaries. The inlet is specified with a uniform inflow (Normal Velocity, 10.07 m/s), while the outlet is set with a pressure outlet (Relative Pressure, 0 Pa). The side walls formed by the normal stretching are assigned symmetric boundary conditions.
By comparing the experimental results [33], the velocity distribution at three different cross-sections of the 180° U-shaped channel flow is analyzed, as shown in Figure 5. The modified SST k-ω model effectively captures the non-uniform velocity distribution caused by the curvature of the streamlines, with a maximum error of only 4.7%, meeting the requirements for engineering applications.
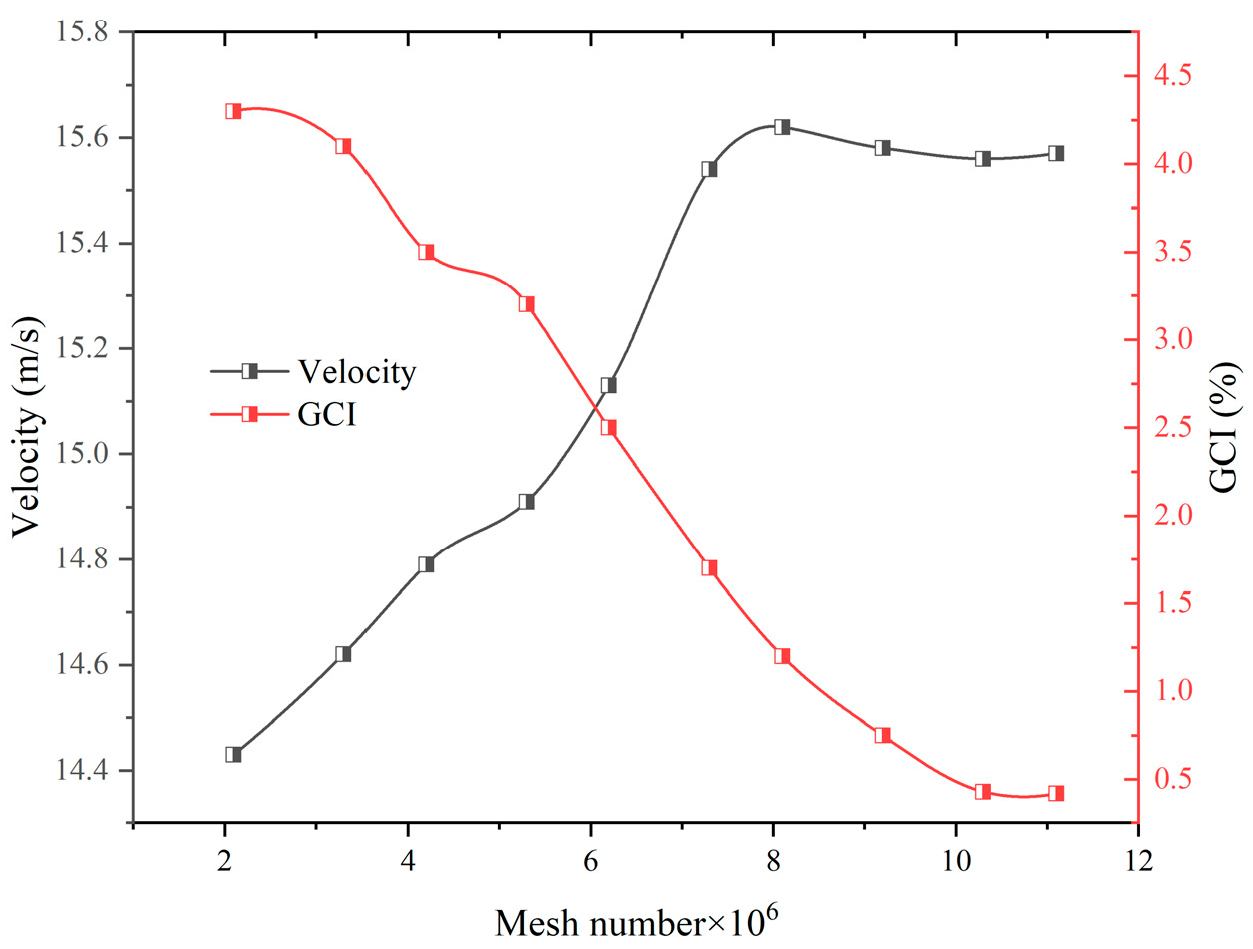
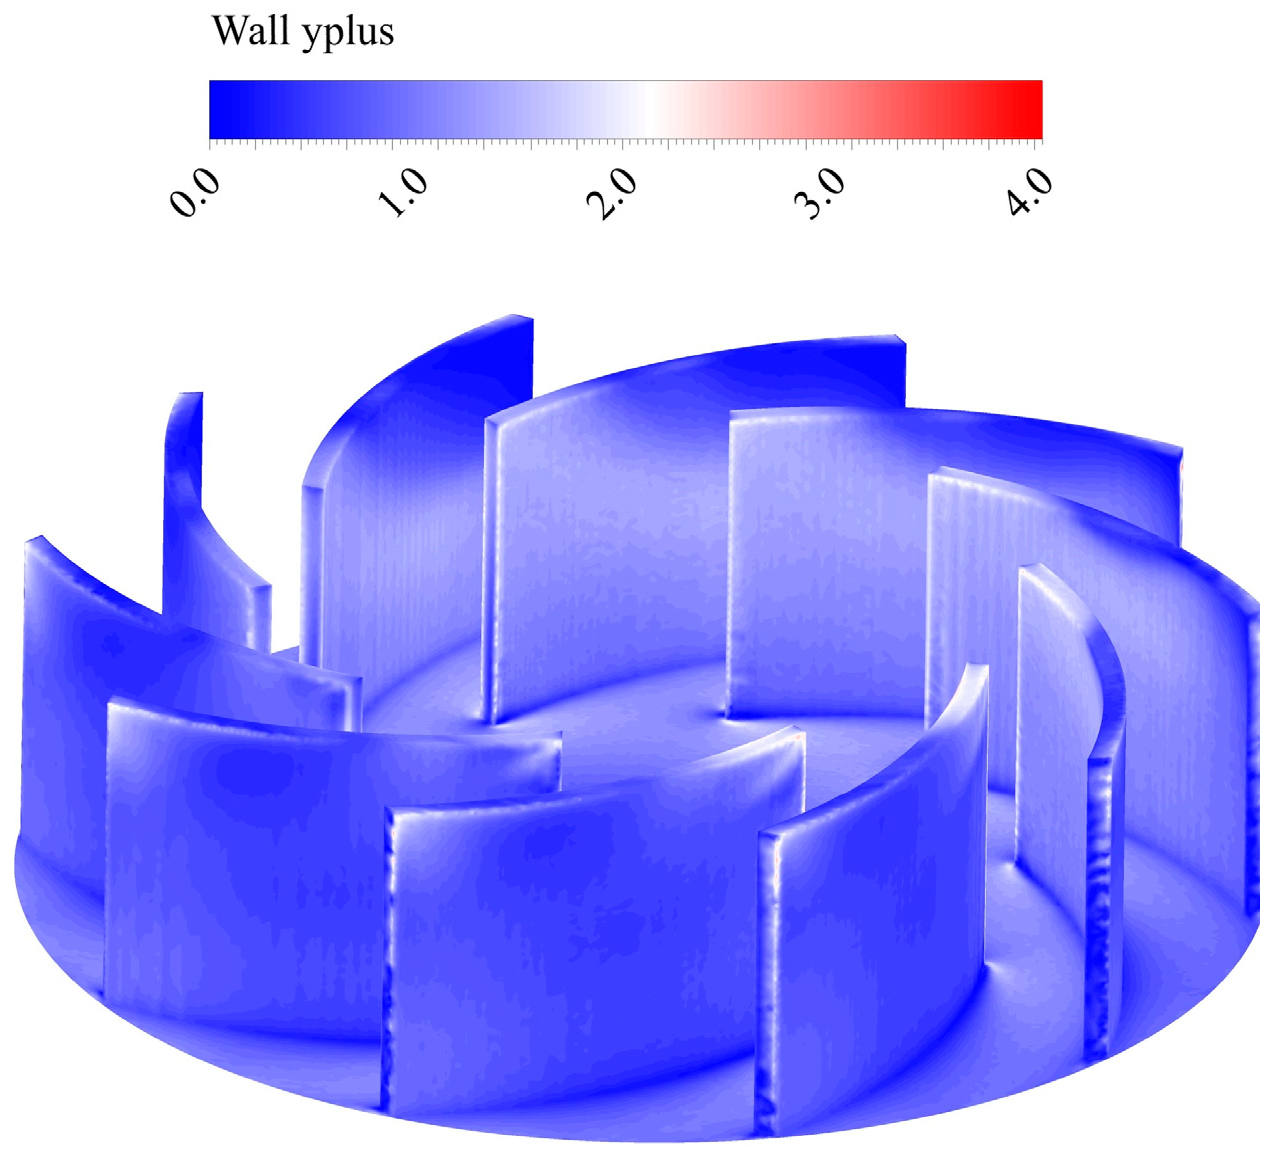
To ensure that the computational grid meets the accuracy requirements, numerical simulations were conducted with grids of different cell counts. Furthermore, the Grid Convergence Index (GCI) method was applied to verify grid independence, using the average inlet flow velocity of the impeller as the error assessment parameter. The average inlet flow velocity of the impeller and the corresponding GCI values for different grid sizes are shown in Figure 6. The final selected computational grid size for the entire domain is 10,064,702 cells, with a GCI value of 0.43%. Table 2 presents the grid sizes for each flow domain. The average y+ value on the impeller surface is 0.12, as shown in Figure 7, which satisfies the accuracy requirements.

3. The Impeller Optimization Design Method

3.1. Theoretical Analysis

Figure 8 illustrates the forces acting on a fluid particle within the rotating centrifugal impeller, where the effects of gravity and fluid viscosity are neglected, and it is assumed that the velocity component perpendicular to the plane of the figure is zero. Assuming the fluid particle inside the impeller has a mass m , it experiences centrifugal force F R = m ω 2 R , Coriolis force F C , and centrifugal force F S due to the curvature of the streamlines. The forces are decomposed In the direction perpendicular to the streamline as follows [34]:
F S 2 = m ω 2 R cos β
F S = m W 2 R s 1
F c = 2 m W × ω
where ω is the angular velocity of the impeller, W represents the local relative velocity, and β denotes the blade setting angle.
In general, the generation of secondary flows within the impeller is due to the forces acting perpendicular to the direction of the streamlines. Therefore, the introduction of the R O B number is used to characterize the relative magnitude of the forces acting perpendicular to the streamlines on the fluid inside the impeller:
R O B = F S 2 + F S F c
The value of R O B determines the direction of motion of the fluid particles relative to the main flow. When R O B is approximately equal to 1, the forces acting perpendicular to the streamlines are balanced, and there is no significant secondary flow within the impeller. When R O B is less than 1, the Coriolis force dominates, causing the fluid to shift towards the pressure surface. When R O B is greater than 1, secondary flows drive the fluid to deviate towards the suction surface of the blade.
By combining the above expressions and setting R O B , Equation (6) can be rewritten as:
( 1 2 ω 2 R sin 2 β sin β R s 1 ) A 2 2 ω Q sin β R s 1 A + Q 2 = 0
Define x 1 = R s i n ( 2 β ) s i n β R s 1 and x 2 = s i n β R s 1 ; by calculating the linear correlation coefficients between variables x 1 and x 2 with the radius R, it is found that their values are as high as 0.99. This indicates that variables x 1 and x 2 can be approximated as linear functions of R:
x = m R + n
where m and n are constant coefficients, whose values can be calculated based on the original impeller geometric parameters. By substituting these values into Equation (7), the optimal flow area distribution at different radii within the impeller passage can be determined.

3.2. Impeller Flow Passage Cross-Section Design

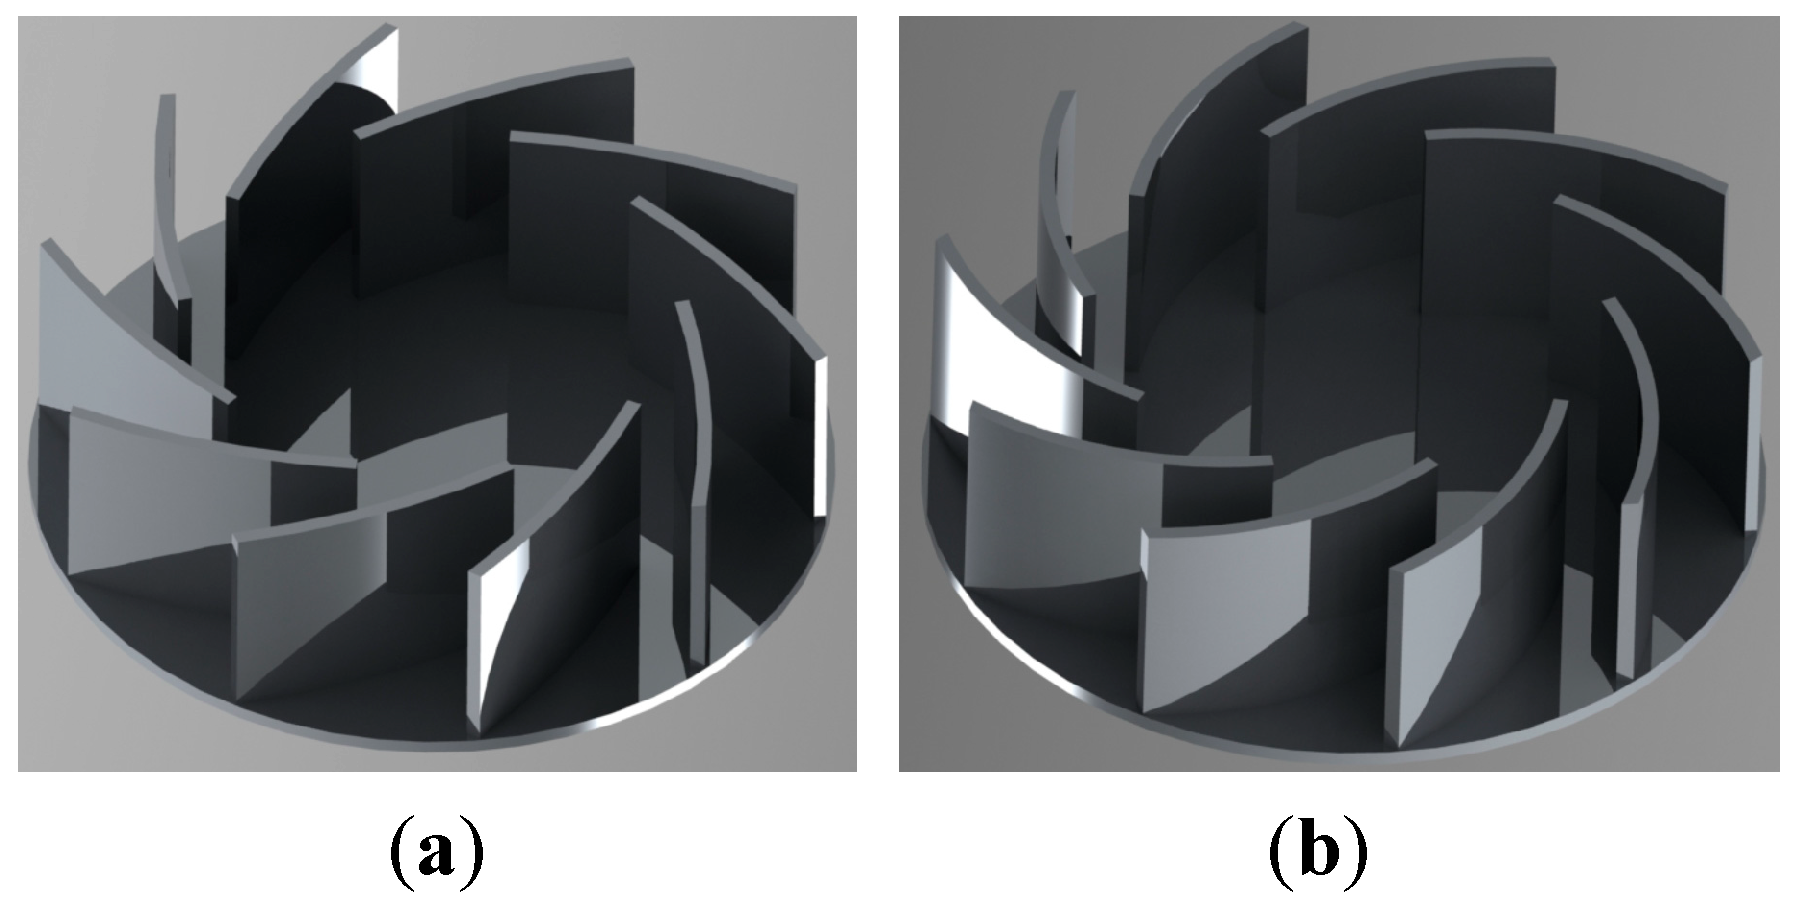
Based on the theoretical analysis in Section 3.1, the flow area distribution within the impeller passage can be calculated, as shown in Figure 9a. Eleven circular arc cross-sections are uniformly selected along the streamline direction, and the flow area for each section is computed as a control point for the impeller design. The final blade thickness distribution, as shown in Figure 9b, is obtained by connecting these control points using a B-spline. The comparison of the impeller models before and after modification is shown in Figure 10.

4. Results and Discussion

4.1. Comparative Analysis of Internal Flow Characteristics

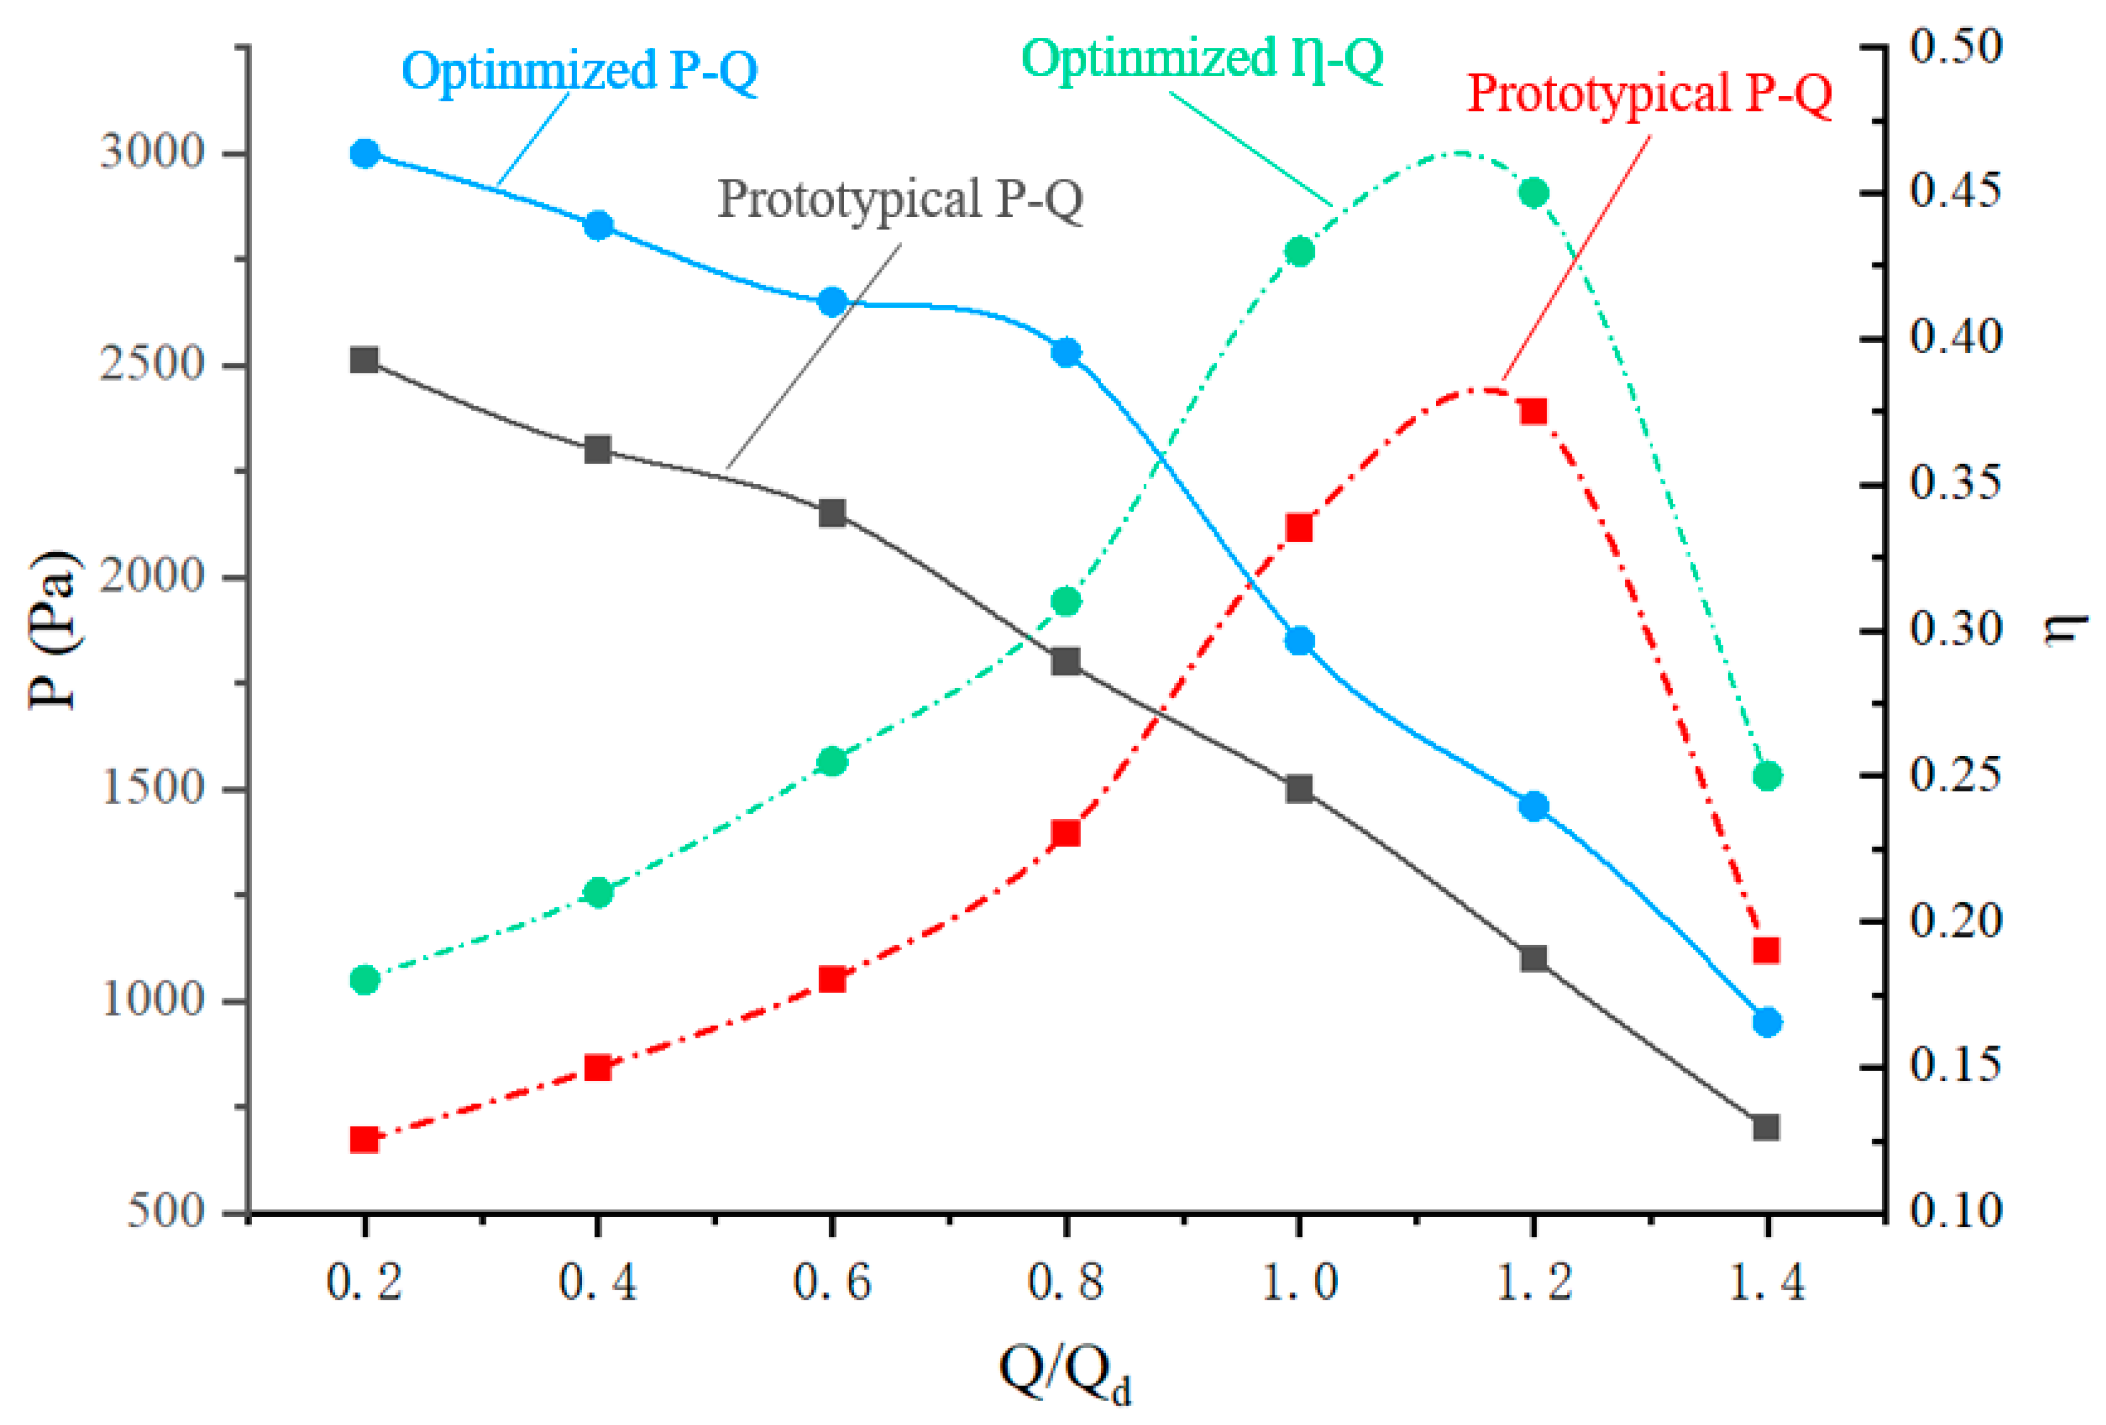
The flow pressure and total pressure efficiency curves of the impeller before and after modification, obtained through CFD simulations, are shown in Figure 11. Compared to the original impeller, the modified impeller demonstrates an improvement in total pressure efficiency across all flow conditions, with the highest efficiency of the modified impeller showing an increase of 11.7% over the original. The total pressure efficiency η is calculated using the following formula:
η = Q × p s P
In the formula, Q represents the flow rate, p s is the static pressure at the outlet, and P is the power.
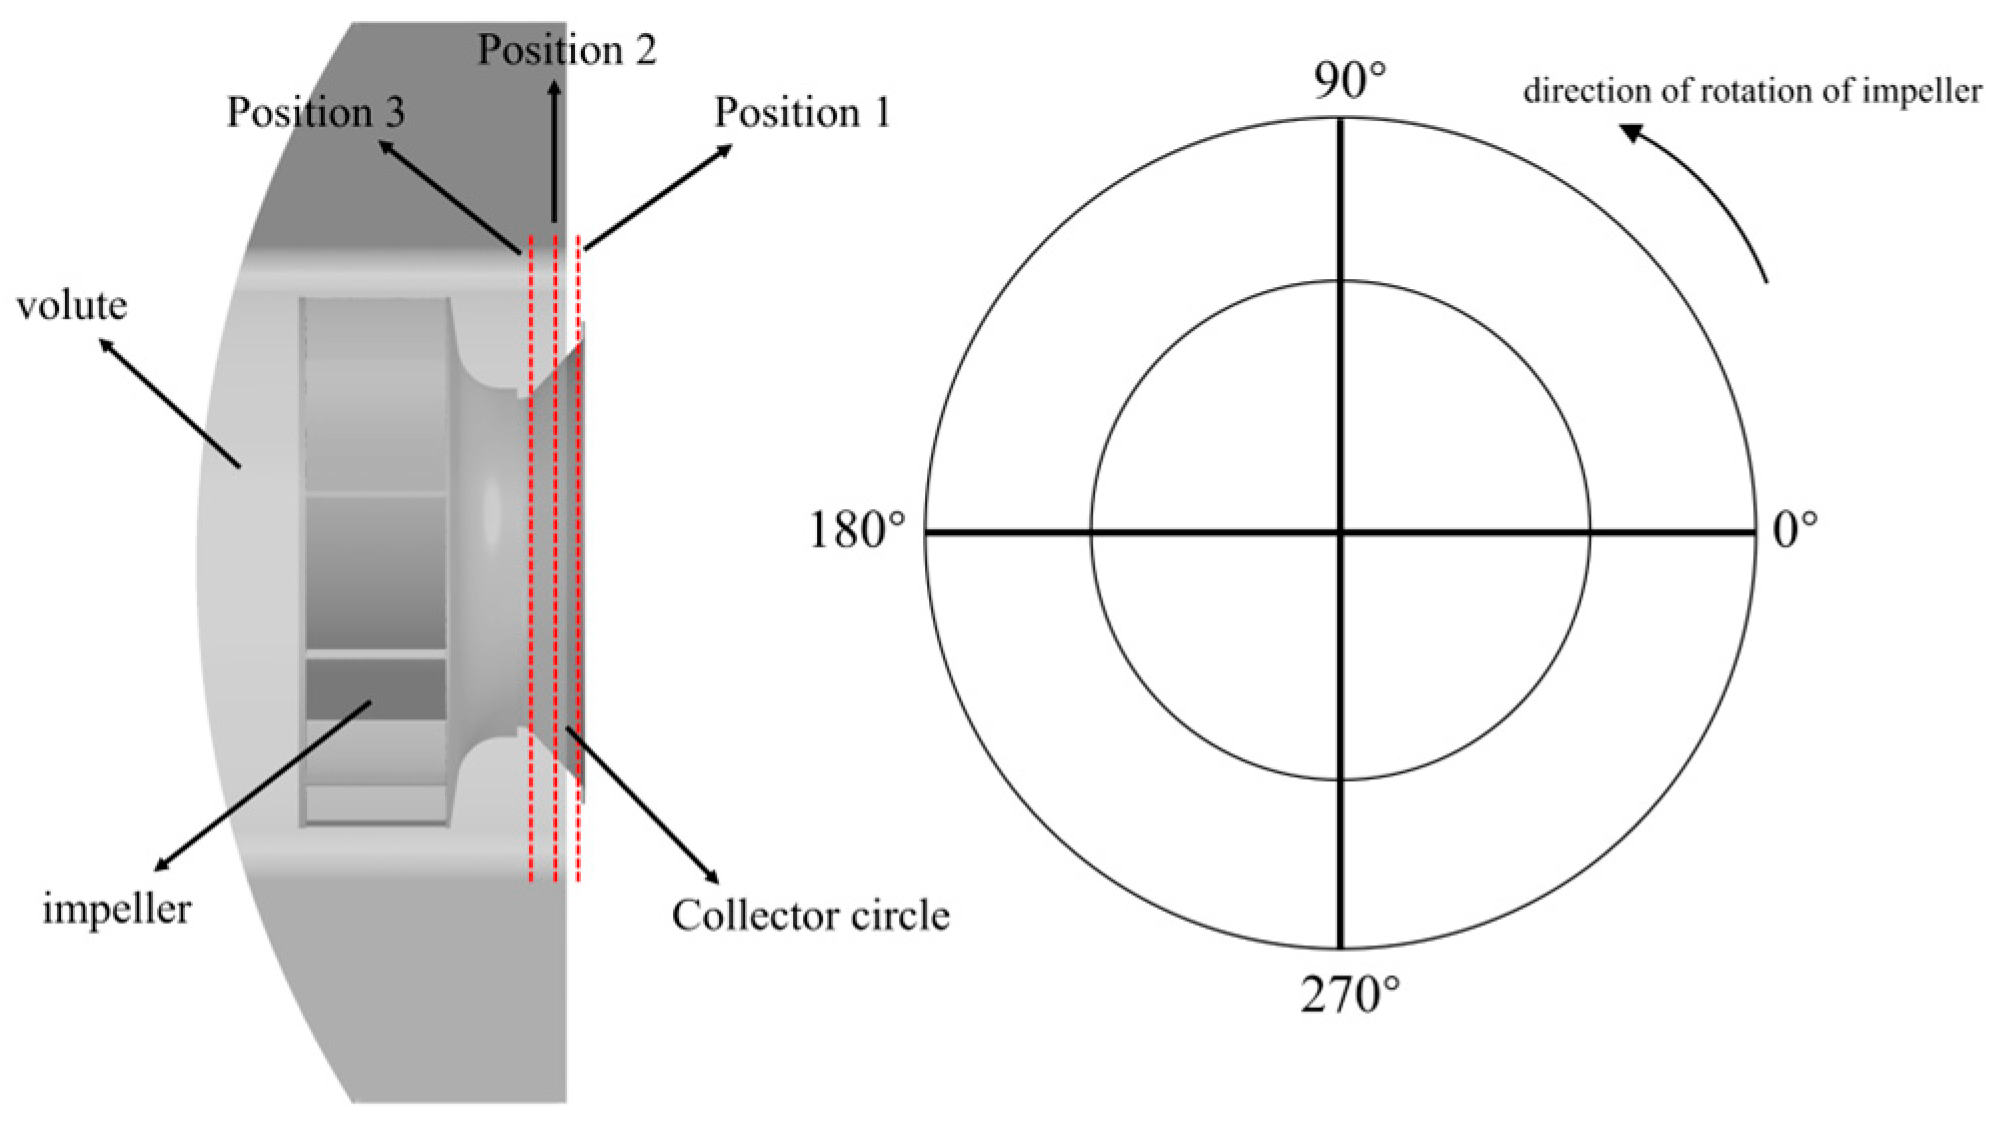
To analyze the impact of incoming flow distortion on the inlet parameters of large high-speed centrifugal fans and the transmission of the distorted flow field along the axial direction, this study takes the design operating point as an example. The circumferential distribution of aerodynamic parameters at three cross-sections of the upstream collector ring, as shown in Figure 12, is analyzed for the centrifugal impeller.
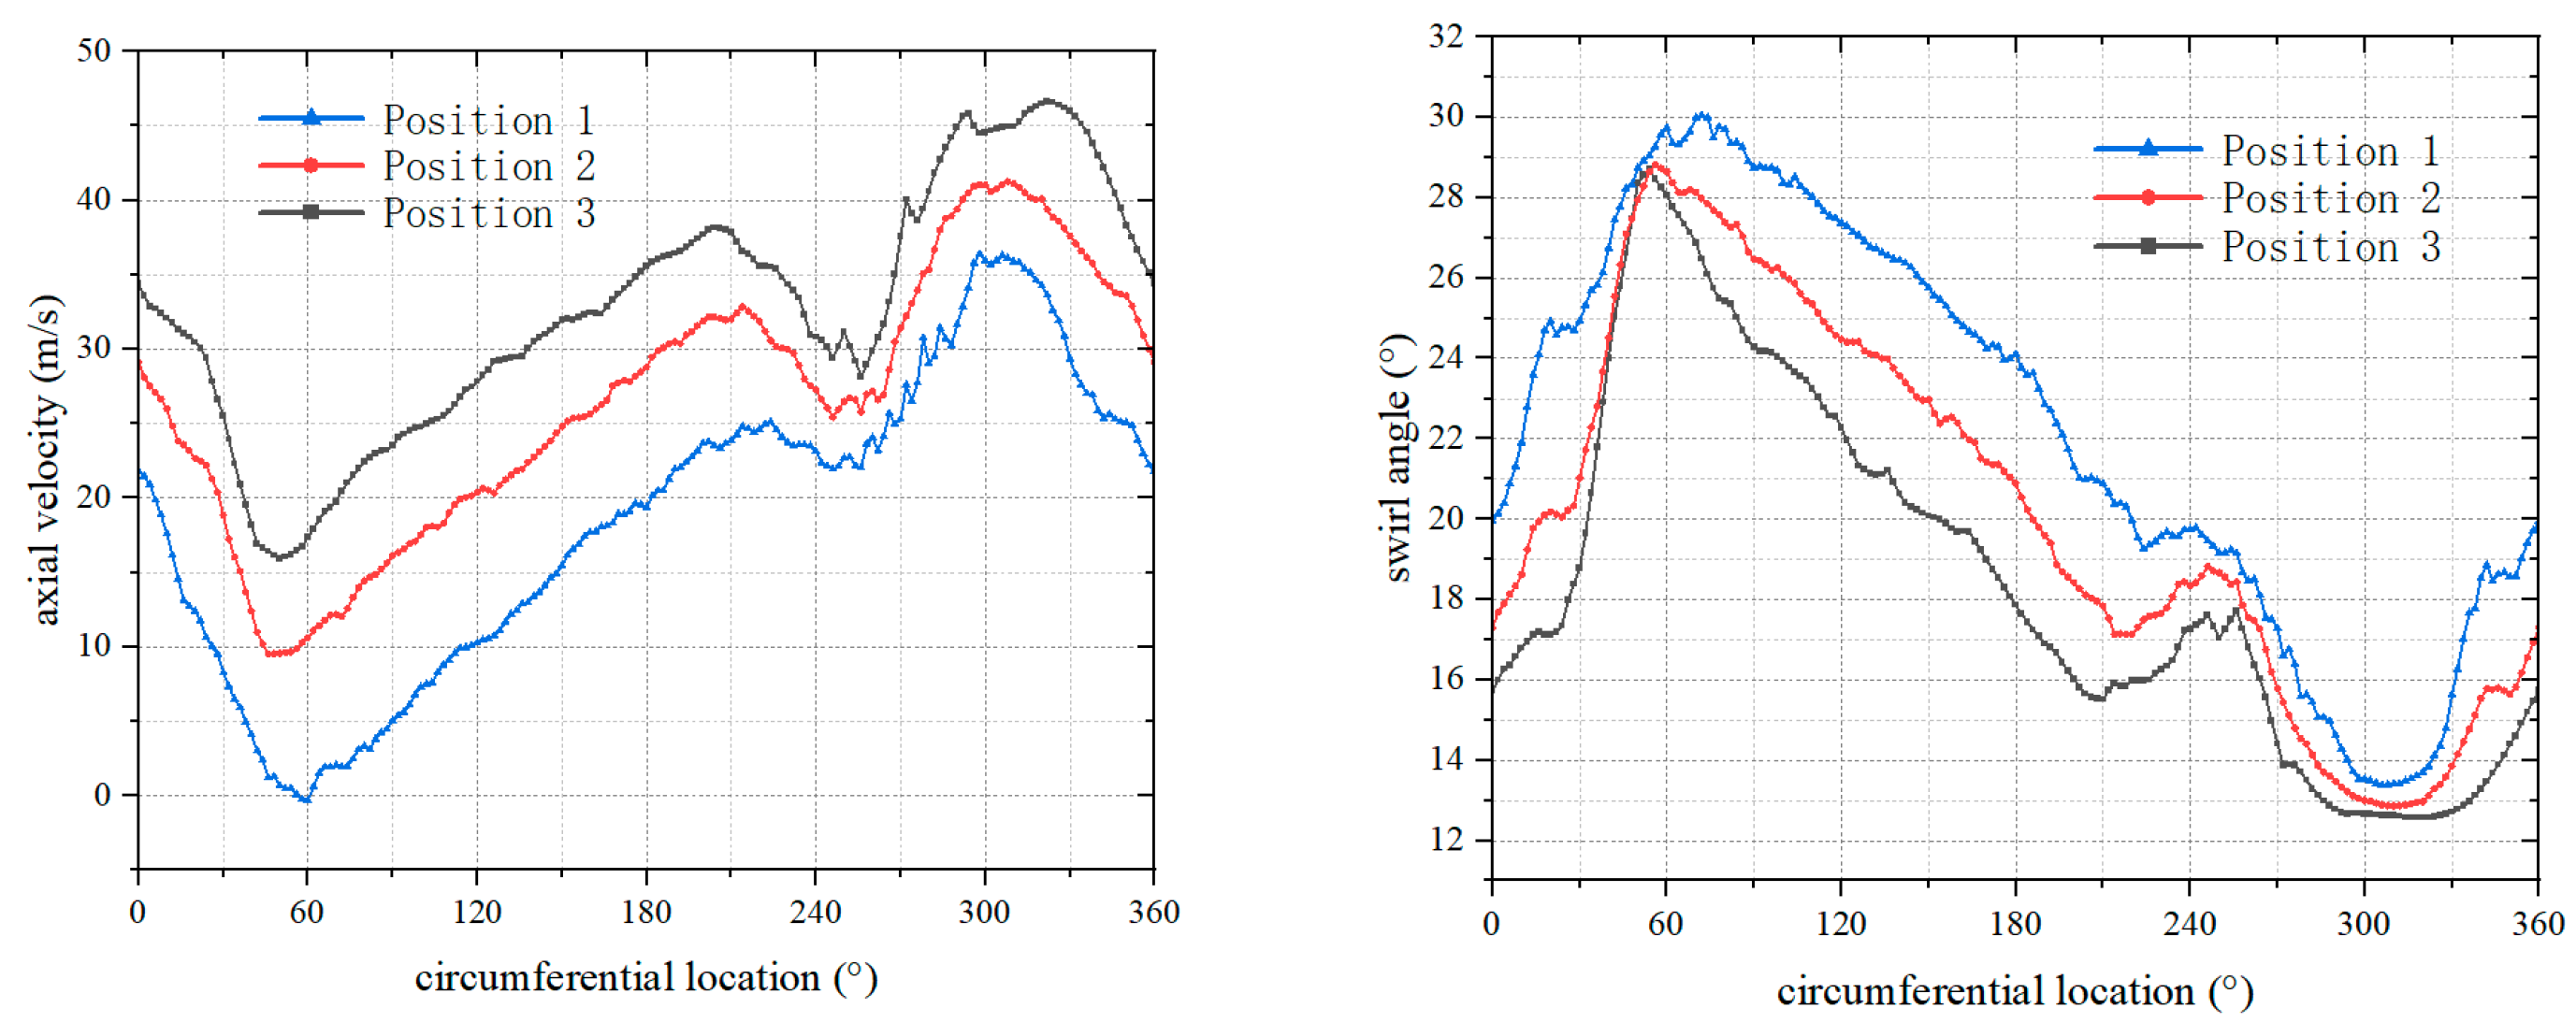
As shown in Figure 13, the circumferential distribution of axial velocity V z and swirl angle α at 0.6 times the radius of the three cross-sections is presented. From the figure, it can be observed that the circumferential distribution of the swirl angle from Section 1 to Section 3 is similar. The relative swirl distortion intensity S I r e l from Section 1 to Section 3 are 3.83°, 2.04°, and 2.23°, respectively, indicating a reduction of 41%. This suggests that the swirl distortion significantly attenuates during downstream development due to mixing effects. The expression for the above circumferential relative distortion intensity S I r e l is as follows:
S I r e l = θ α θ α a v d θ 360
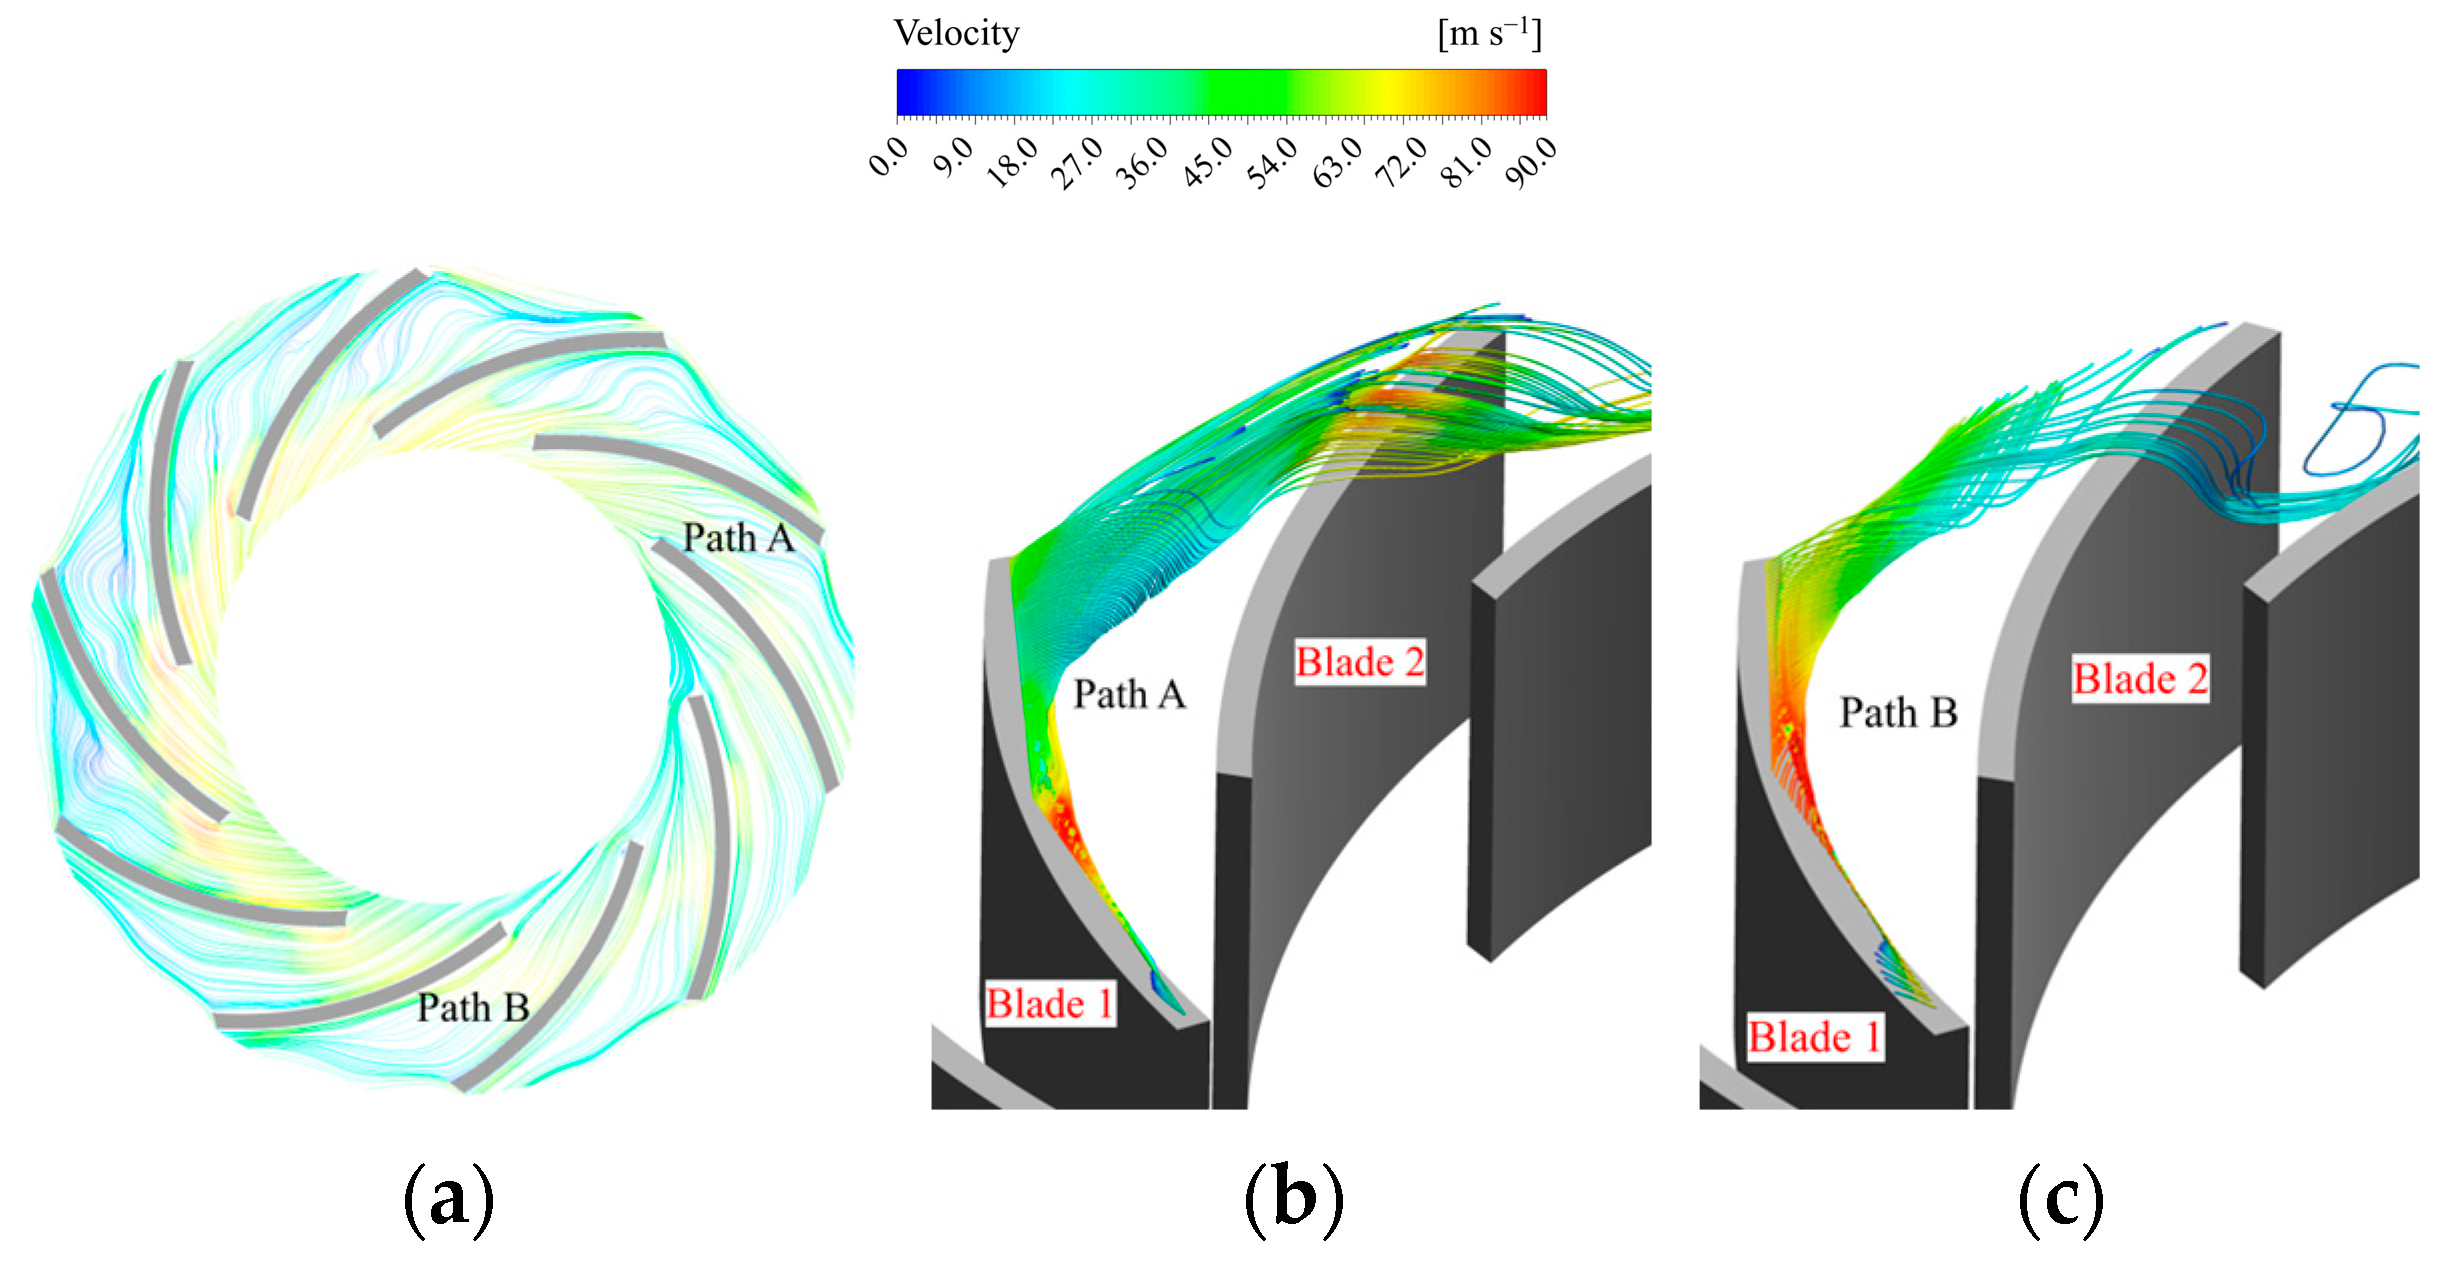
Simultaneously influenced by the distorted flow field, the axial velocity at the impeller inlet cross-section also exhibits distortion, showing a quasi-sinusoidal distribution in the circumferential direction. The maximum swirl angle occurs near the 60° circumferential position, while the minimum swirl angle appears near 300°. To further analyze the impact of inlet distortion on the internal flow field of the impeller, flow passages A and B, corresponding to the 60° and 300° circumferential positions, respectively, are selected for analysis. The 3D tip leakage flow streamline diagrams for flow passages A and B in both the original and modified designs are shown in Figure 14 and Figure 15, respectively.
Figure 14a illustrates the streamline distribution at the 0.9 blade height section of the original impeller. Within the original flow passage, various complex vortex structures of different scales are present. As shown in Figure 14b, under the impact of the high-speed mainstream, the leakage flow at the front of the blade tip moves downstream along the suction surface in the direction of the mainstream. The rim leakage flow in the middle section of the impeller is influenced by the vortex, converging along the suction surface and eventually mixing with the vortex. This interaction further leads to the formation of a large-scale vortex, known as a stall cell, in the downstream region of the flow passage. The stall cell develops slowly in the axial direction of the impeller, but grows more rapidly in the radial direction. From the inlet to the outlet of the impeller passage, the rotational vortex continuously expands in scale until it eventually forms a stall vortex spanning multiple impeller passages, inducing an abrupt-type rotating stall phenomenon. The characteristics of this stall phenomenon are primarily manifested in the interaction between the tip leakage flow and the rotating vortex spanning multiple impeller passages [35].
As shown in Figure 15c, flow passage B is located near the 300° circumferential position, where the inlet swirl angle reaches its minimum. In this region, the tip leakage flow is significantly weaker compared to flow passage A. The tip leakage flows at the leading and trailing edges are suppressed by the main flow and move downstream along the suction side. The trailing-edge leakage flow forms strip-like patterns without developing large-scale vortex structures. As shown in Figure 15, the modified impeller exhibits significantly reduced tip leakage flow at the leading edge and mid-span regions. The trailing-edge leakage vortex is reduced to a thin strip, and no additional vortex structures appear within the impeller passage. The overall flow is stable.
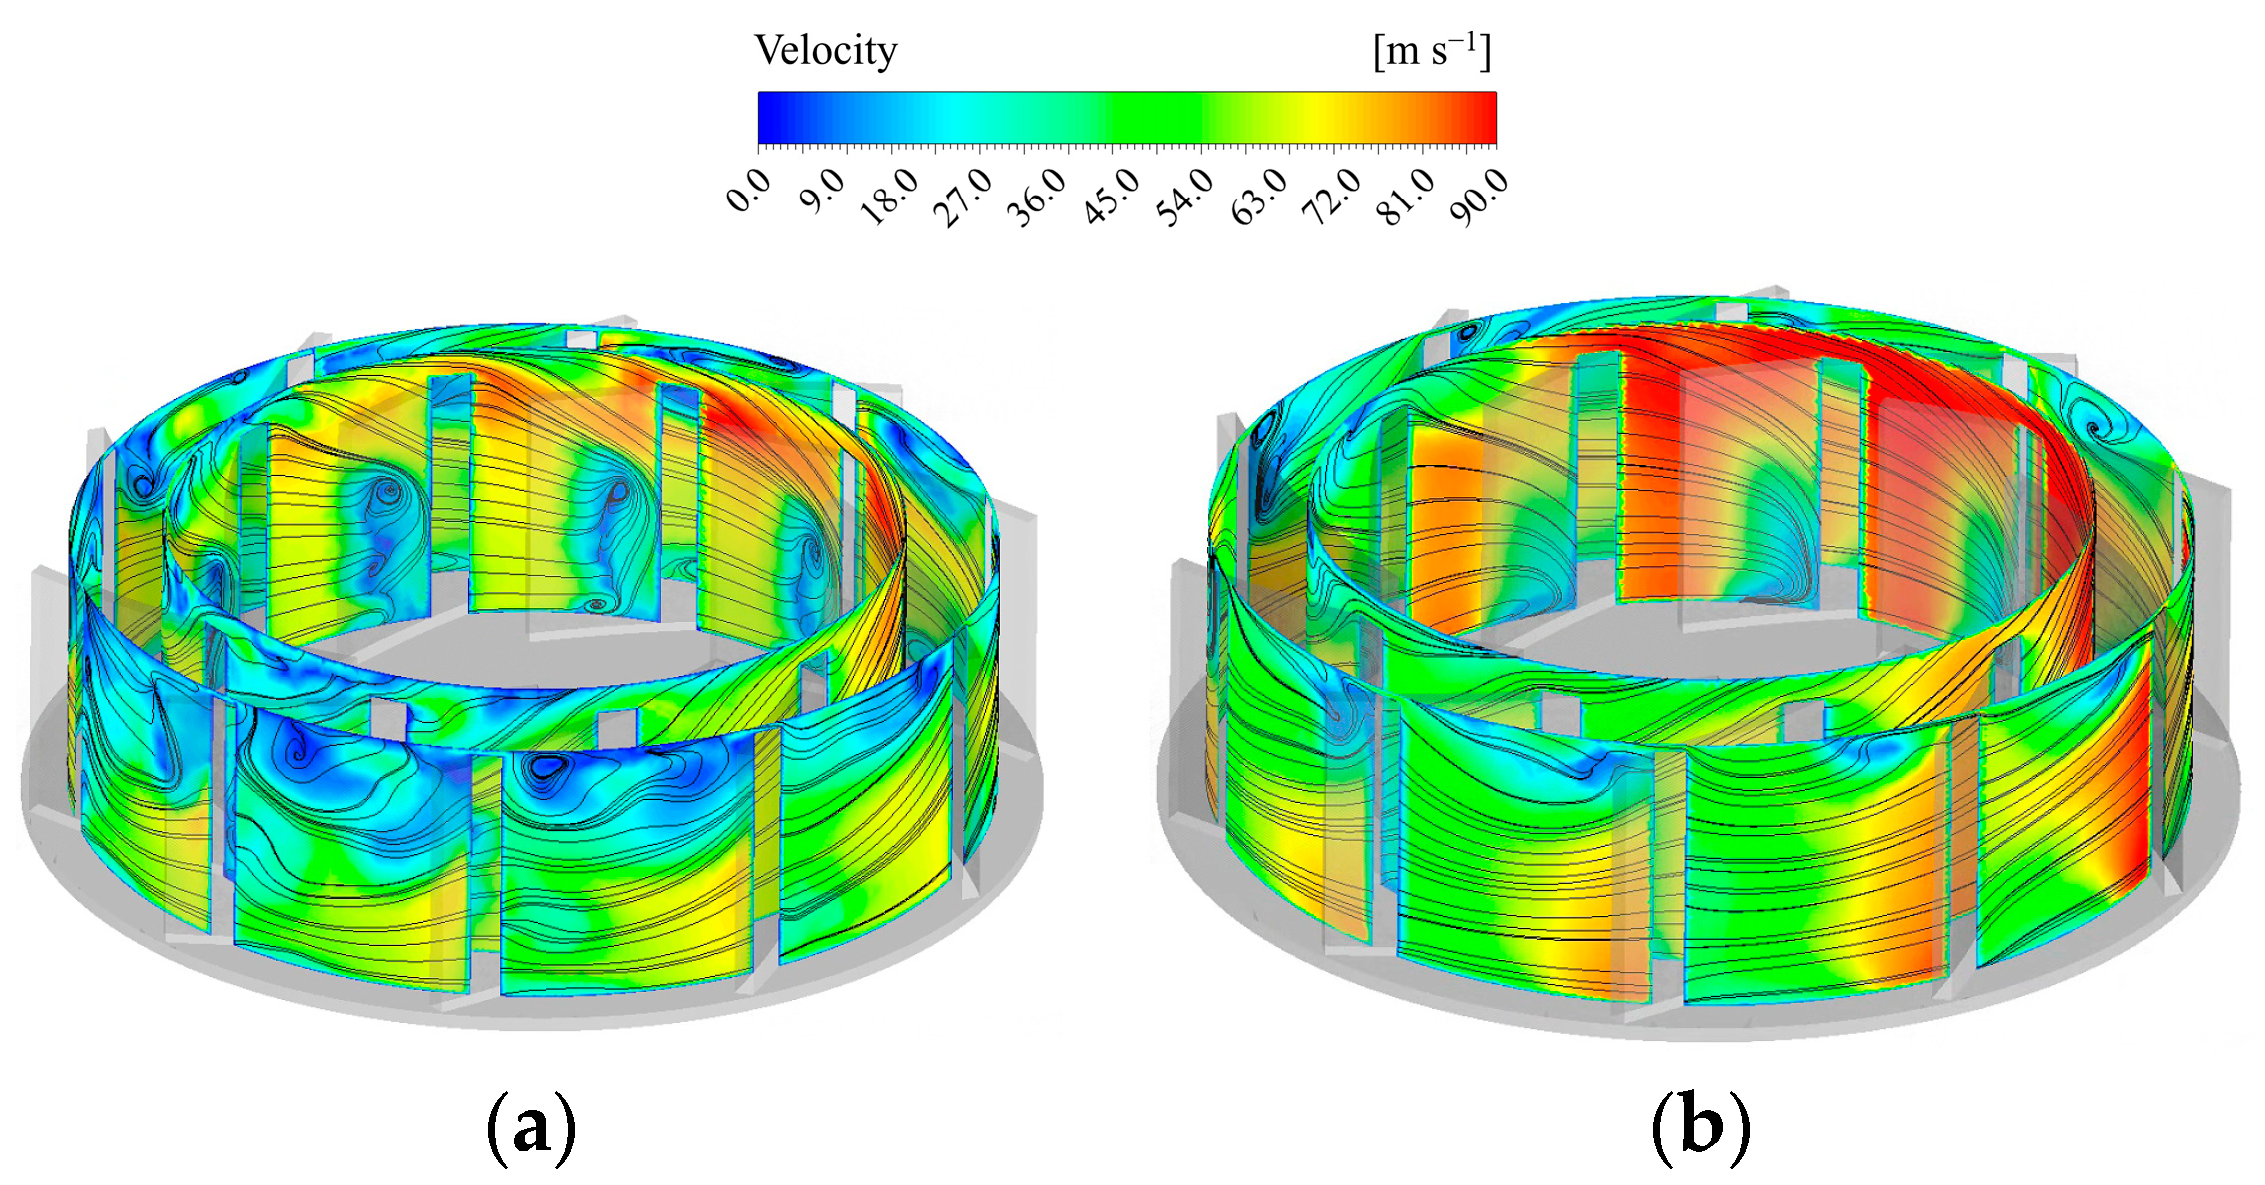
The streamline distribution of the blades before and after optimization is shown in Figure 16. The original impeller exhibits significant low-velocity regions and local vortices near the blade surface, leading to increased fluid energy losses and reduced impeller efficiency. In contrast, the modified impeller shows a noticeable increase in flow velocity near the blades, with the suppression of flow vortices. Phenomena such as flow separation and reattachment, which contribute to flow deterioration, are reduced. This improvement enhances the consistency of the airflow direction at the blade inlet and outlet, thereby improving the aerodynamic performance of the impeller.
Tip leakage flow often results in significant axial velocity deficits, commonly referred to as flow blockage. Its presence not only reduces the flow capacity near the rotor tip but also induces substantial flow losses. To quantitatively analyze the extent of flow blockage, the average blockage factor is defined, with its formula expressed as follows [36]:
B = 1 A a c t 1 ρ W m ρ W m e d g e d A
In the formula, A a c t represents the area of the flow cross-section, ρ W m is the meridional momentum, and ( ρ W m ) e d g e is the edge momentum. At the blockage boundary, ρ W m is equal to ( ρ W m ) e d g e .
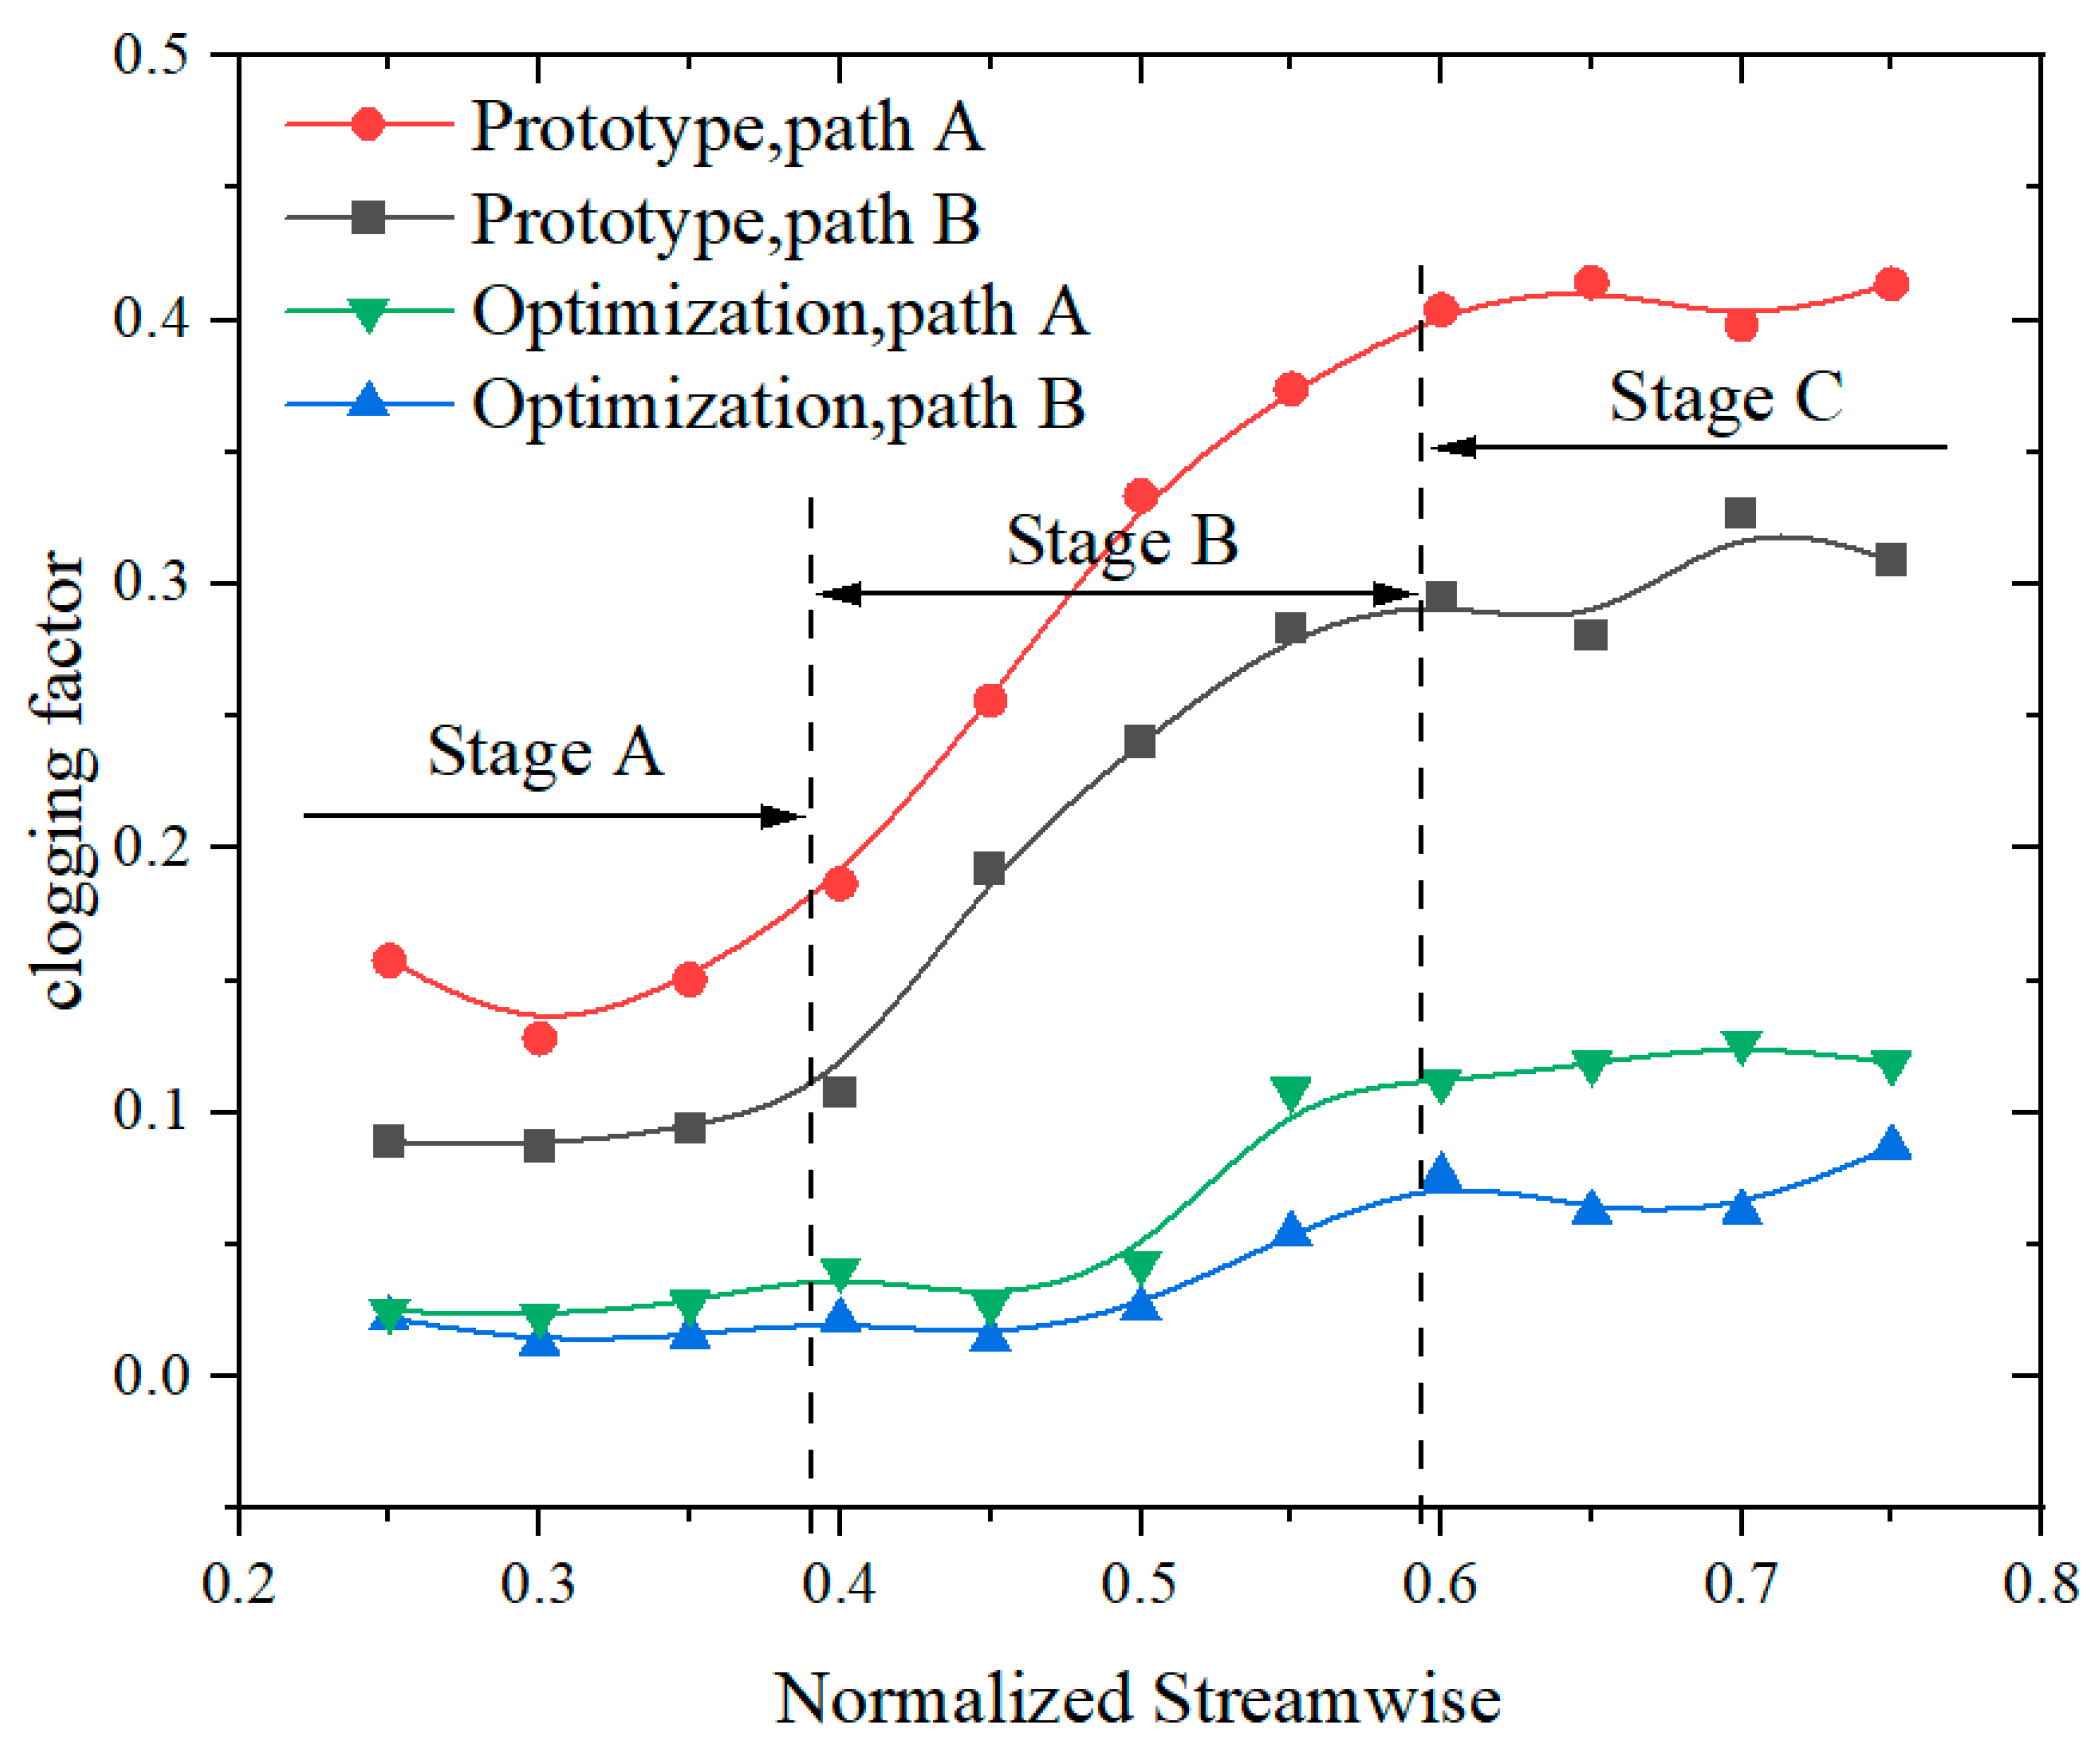
Figure 17 shows the distribution of the meridional average blockage factor along the flow direction in the impeller passages A and B. From the figure, it can be seen that the blockage factors in both the original and modified designs increase from the impeller inlet to the outlet across different cross-sections. Moreover, the blockage factor in impeller passage A is significantly higher than that in passage B. This is because the maximum swirl angle occurs near the 60° circumferential position at the impeller inlet, where the flow passage A is greatly influenced by incoming flow distortion. In contrast, flow passage B is located near the 300° circumferential position at the impeller inlet, close to the minimum swirl angle, and is less affected by the incoming flow distortion. This indicates that incoming flow distortion causes an asymmetric distribution of blockage in the impeller passages, with the inlet distortion vortex exacerbating the blockage phenomenon downstream.
The blockage factor curve can be divided into three stages based on its growth trend. In Stage A, the blade tip leakage flow at the front of the impeller is squeezed towards the suction surface under the high-speed incoming flow, and the mixing effect with the main flow in the impeller passage weakens, leading to a slow increase in the blockage factor. In Stage B, the leakage at the blade tip in the middle section of the impeller increases, and the leakage flow mixes with the main flow along the suction surface to form a leakage vortex at the blade edge, disturbing the main flow and causing the blockage factor to rise rapidly. In Stage C, the leakage vortex at the rear of the impeller fully develops and interacts with the stall vortex in the passage, causing the blockage factor to reach its maximum value.
The average blockage factors for the original impeller passages A and B are 0.29 and 0.21, respectively, while for the modified impeller passages A and B, the average blockage factors are 0.07 and 0.04, respectively. This indicates that the impeller optimization design method based on secondary flow suppression can effectively improve flow stability and mitigate the deterioration of leakage vortices and passage blockage caused by incoming flow distortion.

4.2. Comparative Analysis of Experimental Results

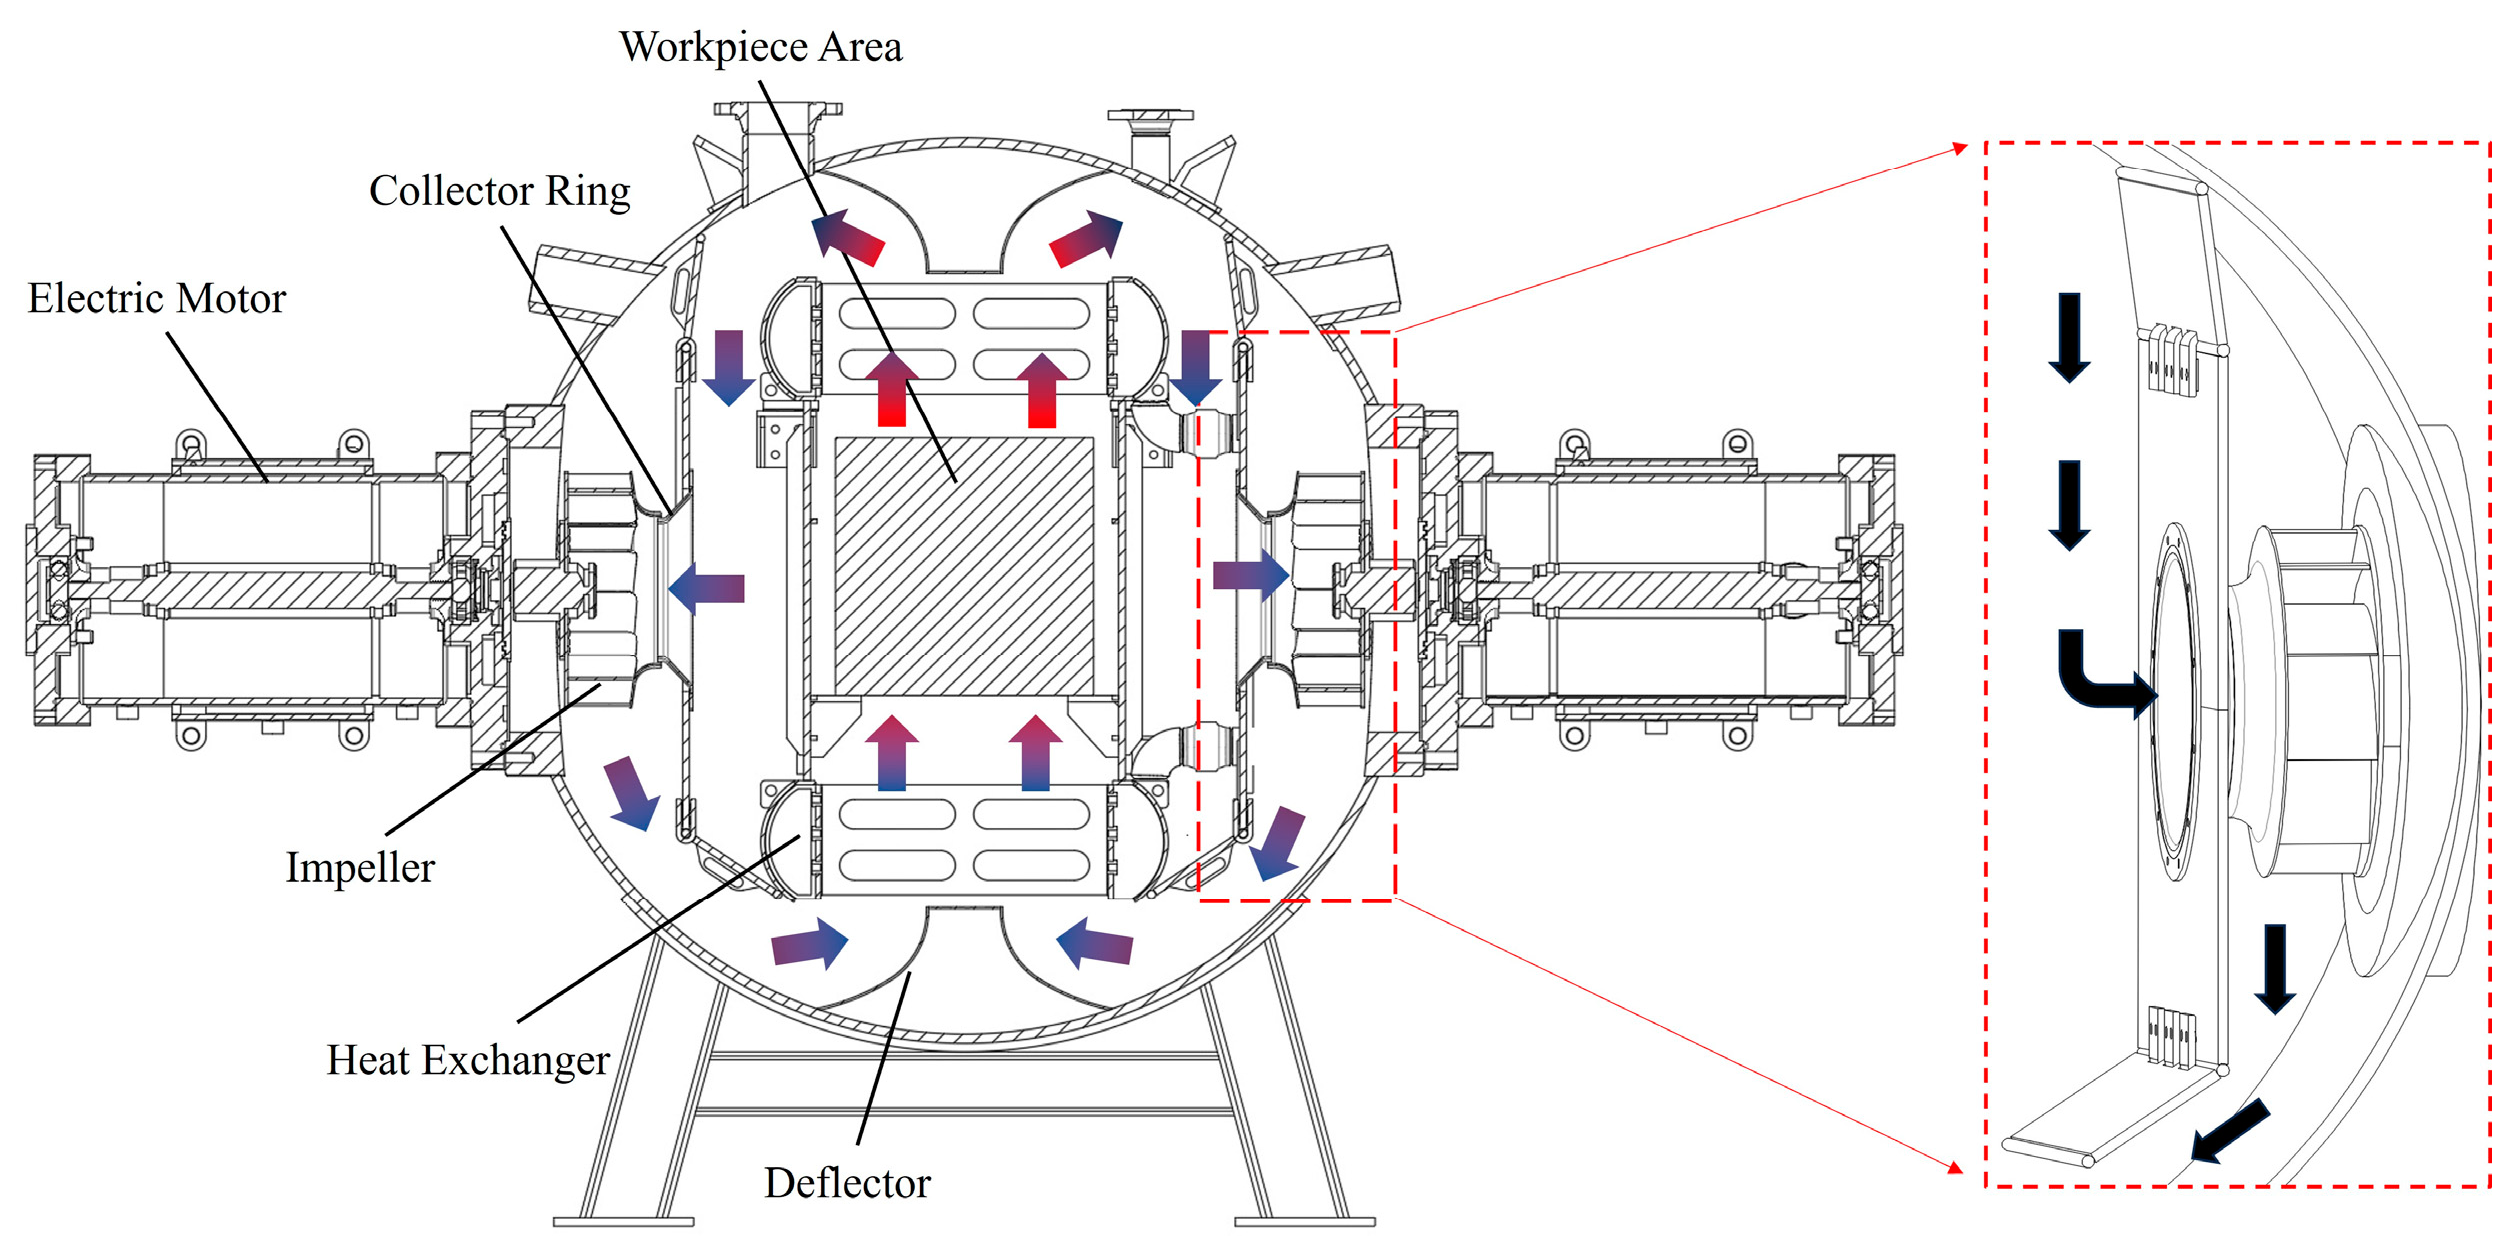
To verify the feasibility and effectiveness of the impeller optimization scheme, this study takes the VHGQ-D-9912 dual-chamber vacuum gas quenching furnace as the application scenario, with its main structure shown in Figure 18. Flow field and temperature field experiments are conducted on the gas quenching furnace using both the original and modified impellers.
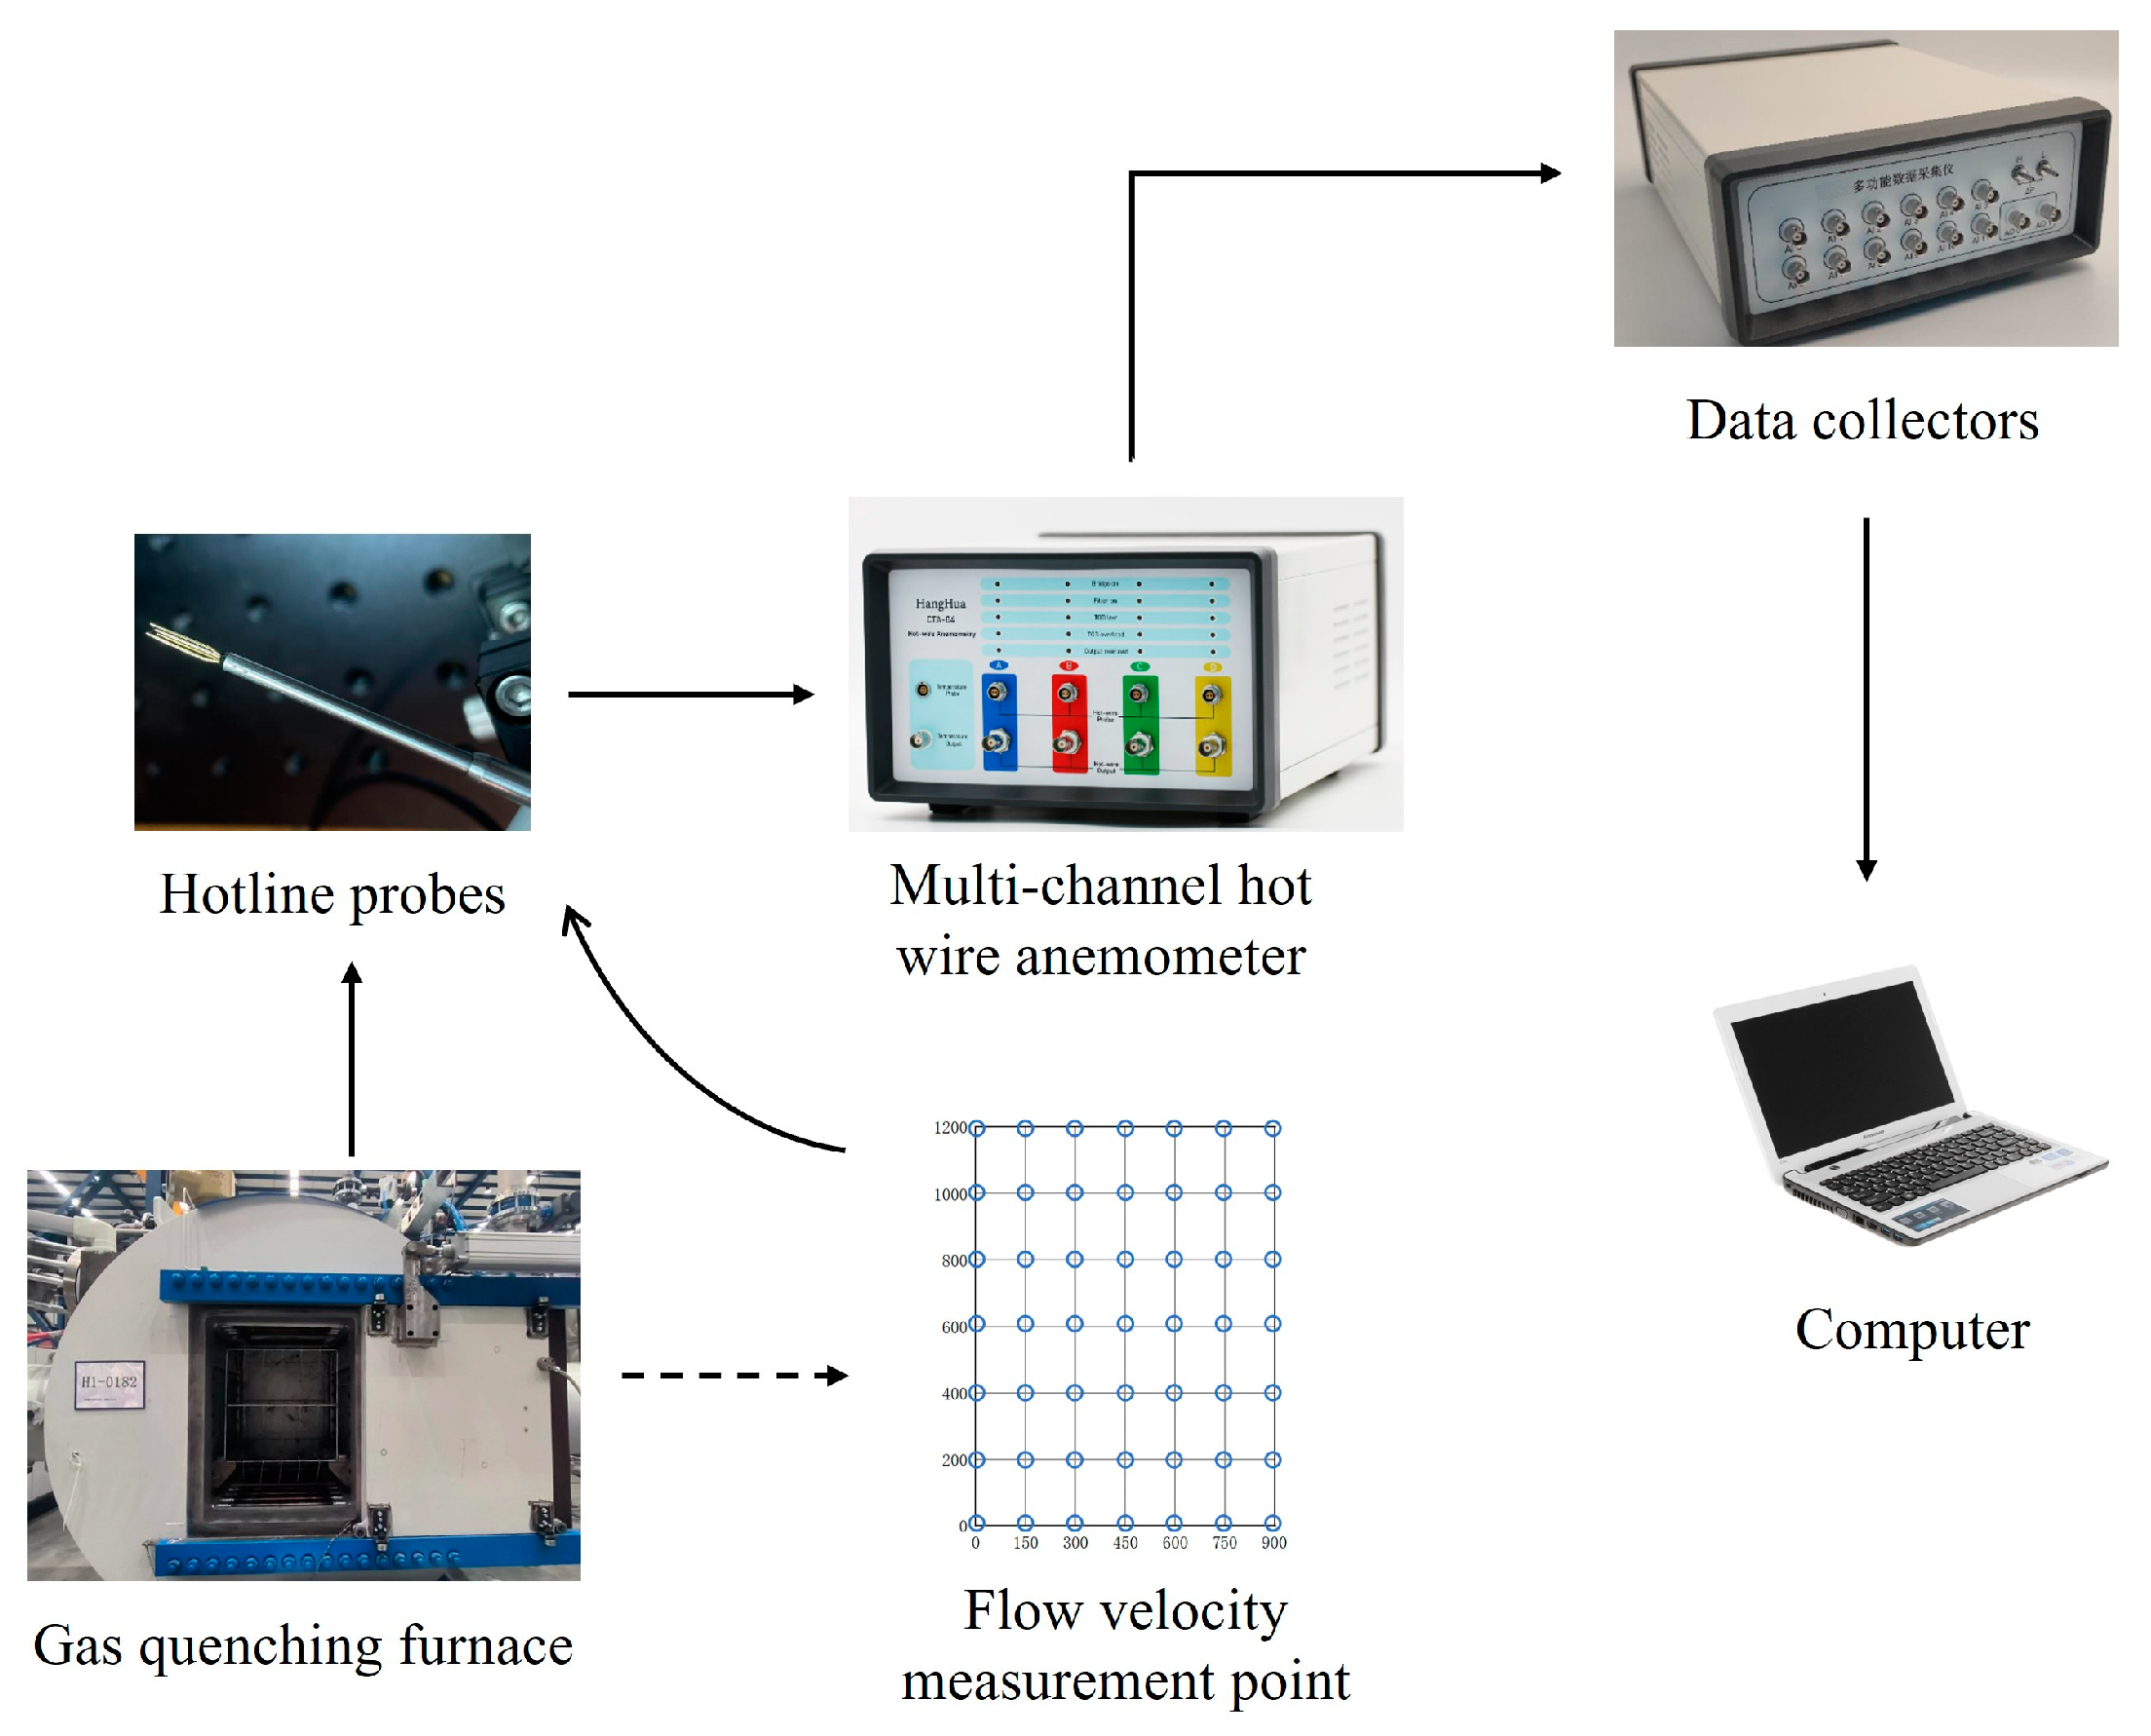
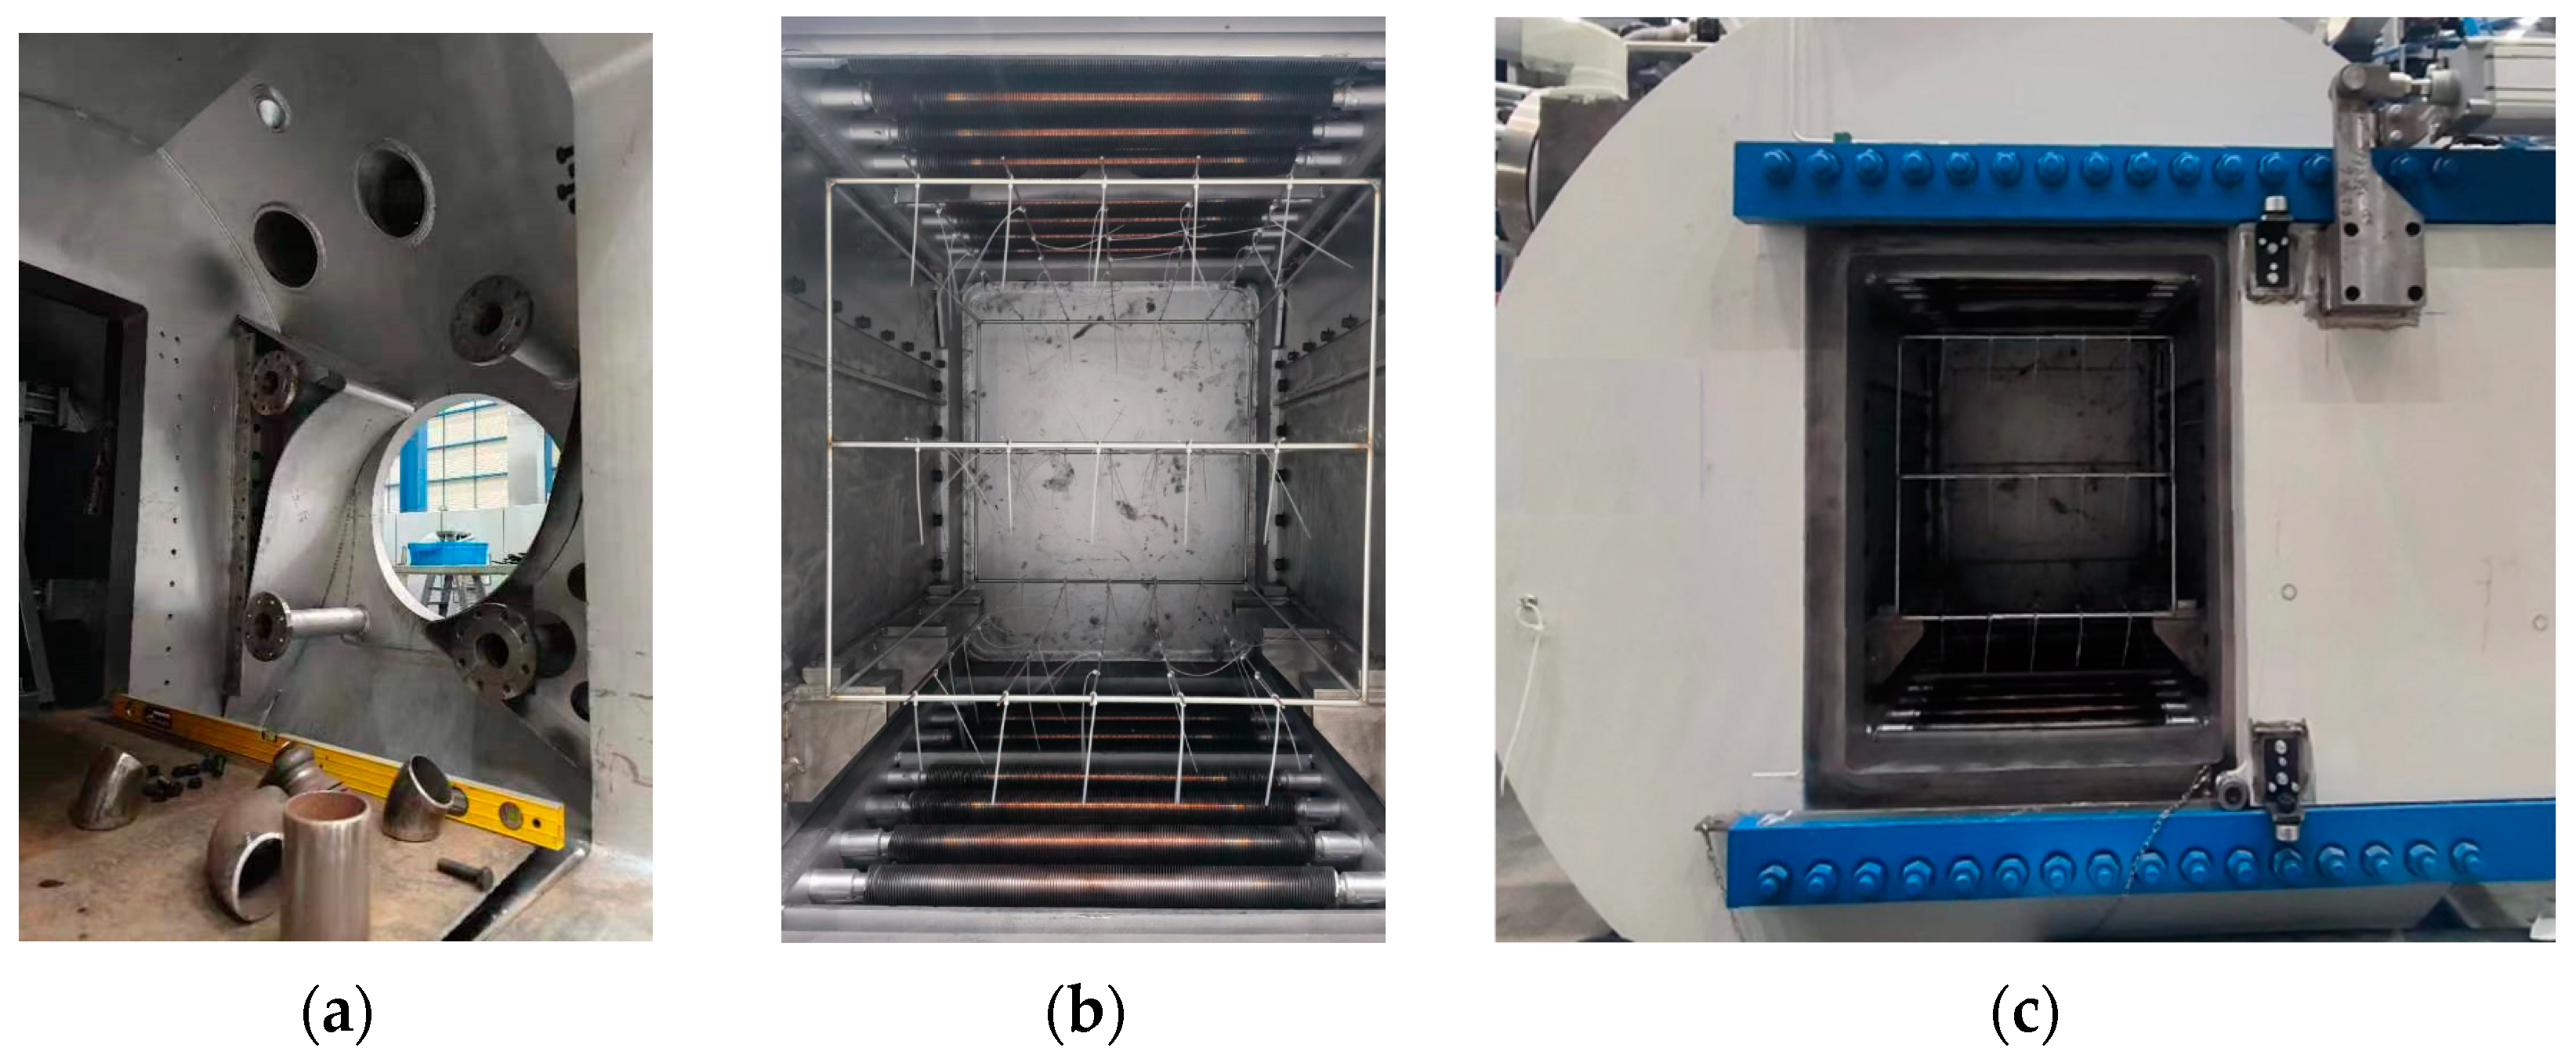
The flow velocity measurement device used is the Kanomax 6243 multi-channel hot-wire anemometer from Japan, with a measurement range of 0 m/s to 50 m/s. For velocities less than 10 m/s, its accuracy is 0.01 m/s. The working principle involves placing a fine electrically heated metal wire perpendicular to the airflow. As the airflow passes over the wire, heat is transferred, causing a temperature change in the wire, which in turn alters its electrical resistance. This change in resistance is used to convert the airflow velocity signal into an electrical signal, which is then transmitted to the anemometer’s main unit. The testing process is shown in Figure 19, and the on-site installation diagram of the modified structure is shown in Figure 20.
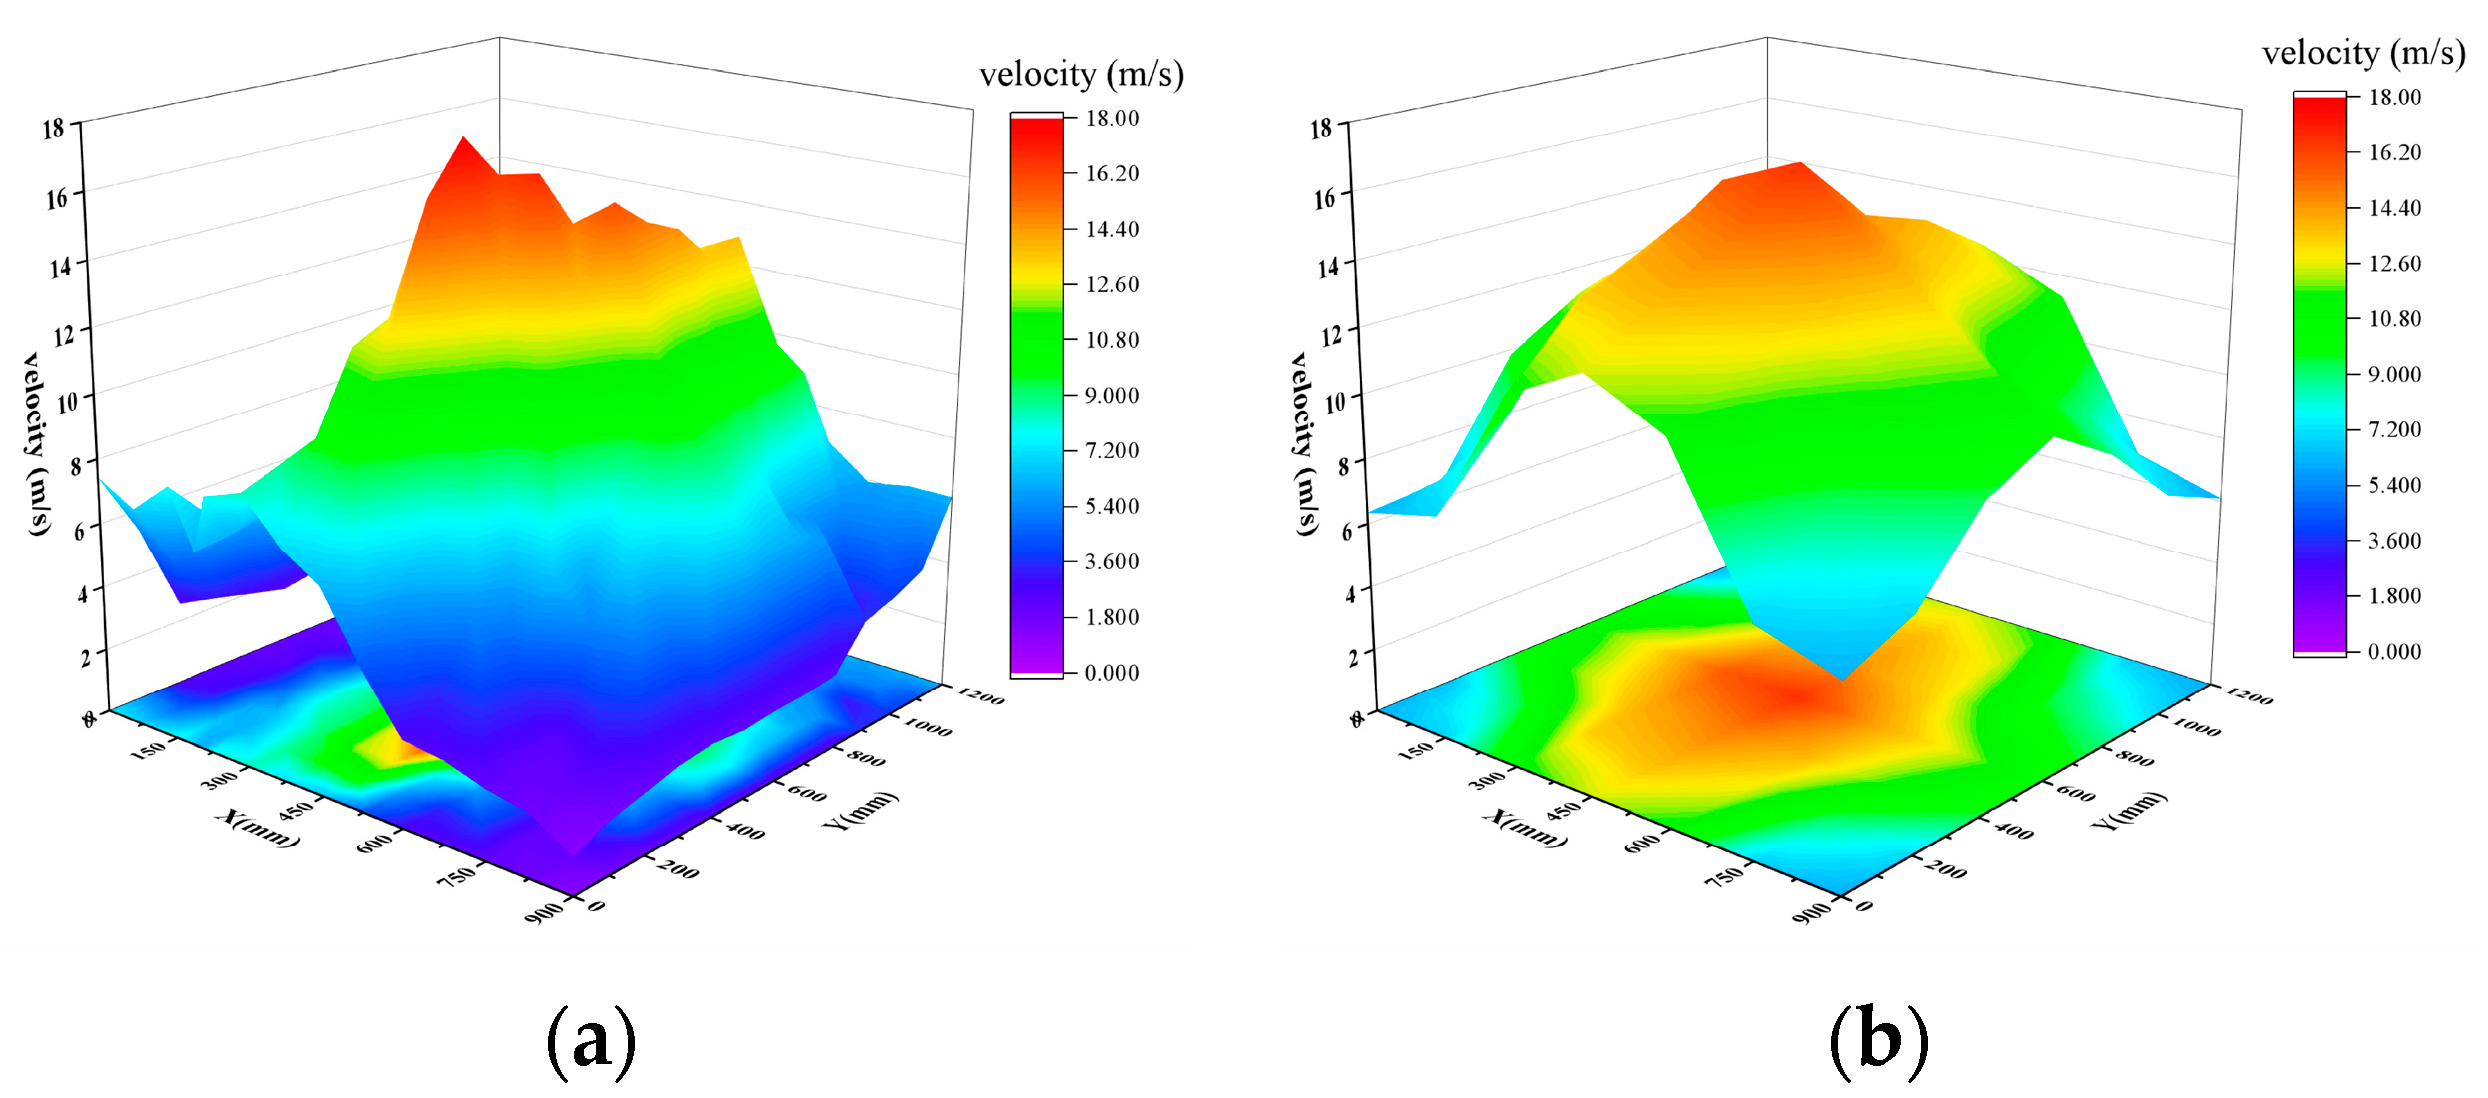
The velocity measurement section is located at the central cross-section of the workpiece area of the quenching furnace, with a total of 7 × 7 measurement points. Figure 21 shows the velocity distribution at the test section. From the figure, it can be observed that both the original and optimized impellers exhibit a velocity distribution with the highest velocity at the center and lower velocities at the periphery. However, the original structure further demonstrates a distribution where the flow velocity on one diagonal side is significantly greater than that on the opposite side. After the impeller optimization, the overall velocity distribution becomes more uniform compared to the original, with a substantial increase in velocity at the periphery.
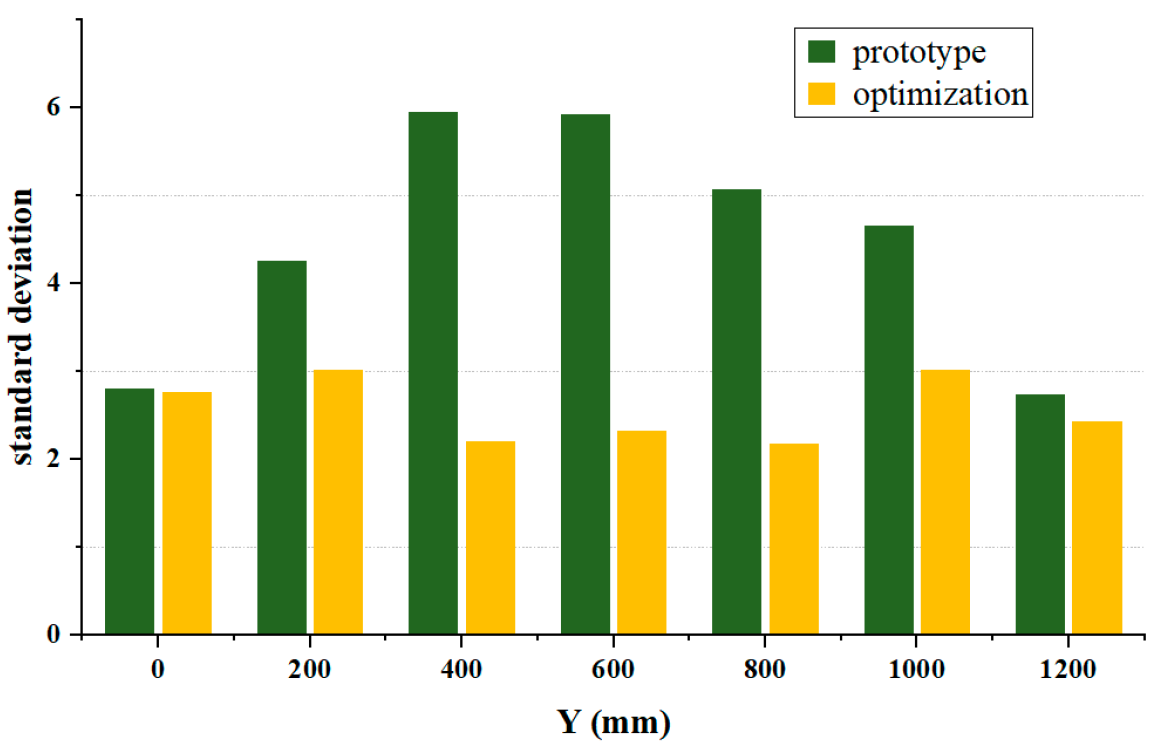
The velocity test data for the original and modified impellers were statistically analyzed, and the standard deviation was used to measure the uniformity of the velocity distribution, as shown in Figure 22. It can be seen that the standard deviation of the velocity data is significantly reduced after optimization. The average velocity standard deviation at the test section is 42.78% lower than that of the original impeller. Specifically, the standard deviations at Y = 400, Y = 600, and Y = 800, located at the center of the test section, are reduced by 62.97%, 60.69%, and 57.14%, respectively, compared to the original, indicating a more uniform flow.
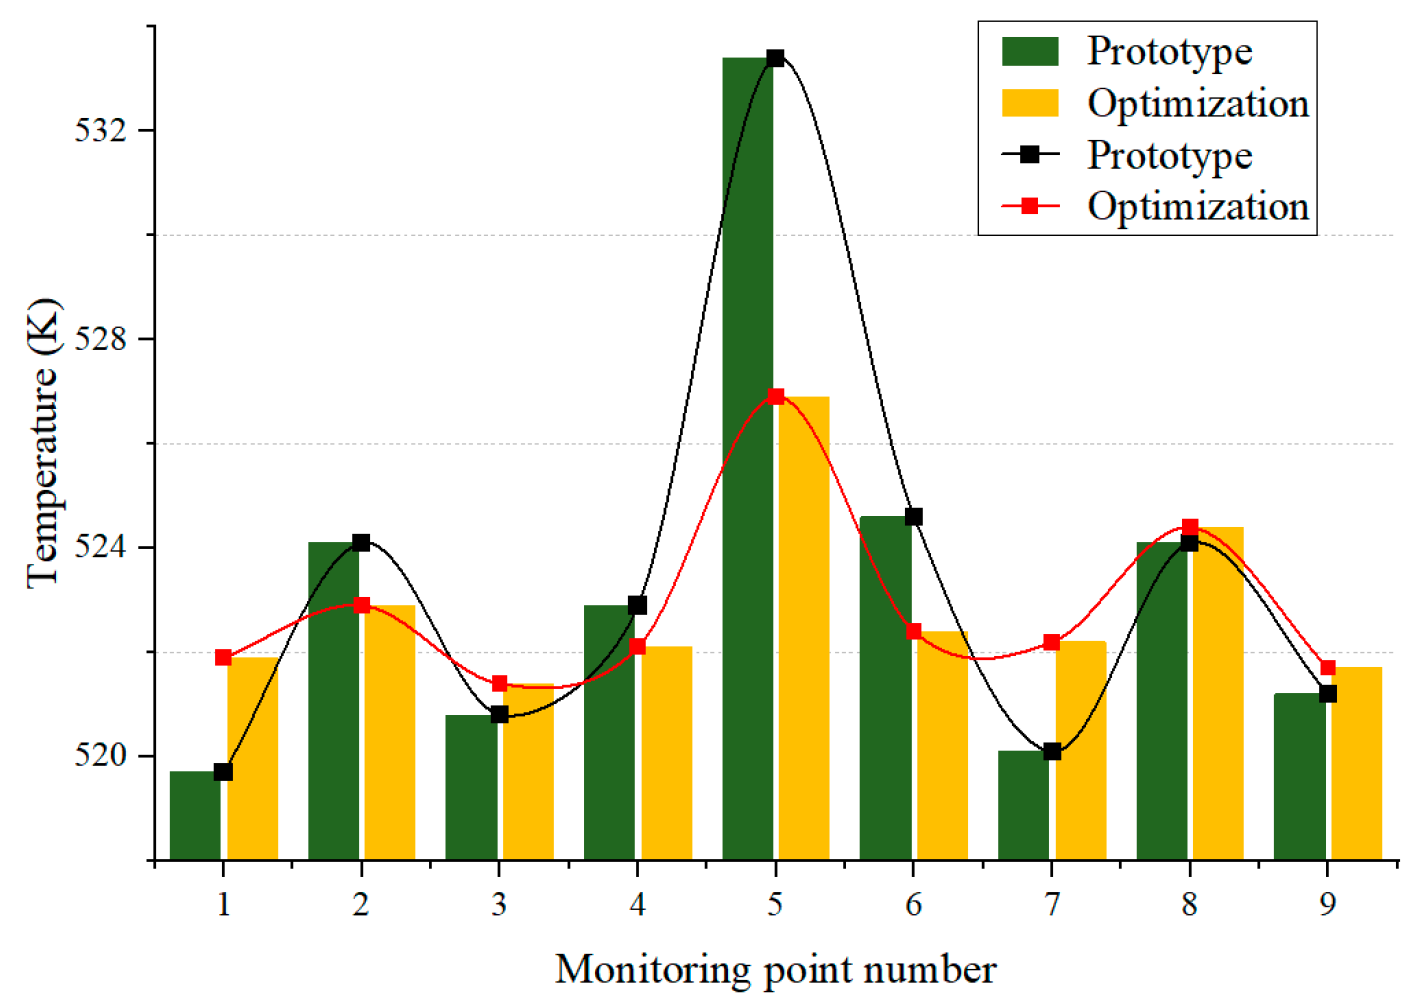
The temperature tests were conducted by placing a 400 mm × 400 mm × 400 mm H13 hot work steel specimen at the center of the workpiece area. During the cooling process of the gas quenching furnace, nine thermocouples were passed through flange holes and fixed at nine measurement points evenly distributed at the lower part of the workpiece. The temperature was recorded using these thermocouples. The temperature recorder selected was the DAQ970A model from KEYSIGHT, which includes 14 thermocouple input ports, enabling simultaneous data recording from 14 channels. This system was able to meet the measurement requirements for the nine temperature points in this experiment. A comparison of the temperatures at the measurement points when the average workpiece temperature is 523 K is shown in Figure 23. After the optimization of the blades, the temperature differences at each measurement point are significantly reduced. To quantify the deviation of temperatures at each monitoring point from the average value, a temperature uniformity coefficient, σ T , is introduced to assess the uniformity of the workpiece surface temperature field during the gas quenching process. The expression for this coefficient is as follows:
σ T = 1 N i = 1 N T N ¯ T i 2
In the formula, N represents the total number of measurement points, T N ¯ denotes the average temperature of the N measurement points, and T i represents the temperature value at the i measurement point. For the original gas quenching furnace, σ T is 4.146, while after optimization, σ T decreases to 1.945, a reduction of 53.09%. This indicates that the temperature uniformity in the workpiece area has significantly improved following the blade optimization.

5. Conclusions

This paper focuses on a large, high-speed centrifugal fan and analyzes the impact of incoming flow distortion on the internal flow evolution of the impeller. To address the design challenges of large, high-speed centrifugal fans under incoming flow distortion, a blade modification method based on the suppression of internal secondary flows is proposed. Experimental tests were conducted on the entire vacuum quenching furnace system before and after impeller optimization. The results show significant improvement, leading to an increase in the centrifugal fan’s operating efficiency. The main conclusions of this paper are as follows:
(1)
The SST k-ω turbulence model, modified with the eddy viscosity coefficient, was compared with experimental results of flow in a U-shaped pipe. The modified SST k-ω model effectively captures the non-uniform velocity distribution characteristics, with a maximum error of only 4.7%. The refined computational model improves the accuracy of the results, thereby providing a more precise analytical tool for evaluating the impact of subsequent impeller structural optimizations on performance improvements.
(2)
Under the influence of the complex flow channel structure within the gas quenching furnace, the airflow parameters at the fan inlet cross-section undergo distortion. The maximum swirl angle appears at the circumferential position of 60°, corresponding to downstream passage A. In this passage, the mid-span tip leakage flow along the suction side is affected by vortices, eventually mixing with them. This interaction forms a large vortex in the rear section of the passage. Additionally, a stall vortex perpendicular to the blade and spanning the entire passage develops in the downstream section, resulting in an average blockage coefficient of 0.29. At the circumferential position of 300°, where the minimum swirl angle occurs, the corresponding downstream impeller passage B exhibits strip-like leakage flow at the rear of the blade tip. However, no large-scale vortex structure is formed, and the average blockage coefficient decreases to 0.27.
(3)
The impeller flow passage optimization design method based on the suppression of secondary flows effectively improves the secondary flow phenomena and the intensity of tip leakage flows within the impeller. The modified impeller achieves an 11.7% increase in maximum efficiency compared to the original design, with the blockage coefficients in passages A and B reduced to 0.07 and 0.04, respectively. Additionally, flow field and temperature field experimental tests were conducted on the entire vacuum quenching furnace system. The test results show that the standard deviations of the velocity at the center of the test sections at Y = 400, Y = 600, and Y = 800 were reduced by 62.97%, 60.69%, and 57.14%, respectively, compared to the original impeller. The temperature fluctuation range at the surface measurement points was reduced by 53.09%, indicating a significant improvement in the uniformity of the flow and temperature fields.
It should be noted that the proposed model has been validated specifically for the VHPGQ centrifugal fan under high rotational speed and strong rotational flow conditions. The applicability of this model may be limited to similar fan configurations, and for other types of fluid machinery with significant differences in fan geometry or operating conditions, appropriate adjustments may be required. Furthermore, the modified SST k-ω turbulence model, on which the proposed model relies, performs well under these conditions but may need to be adjusted for more complex turbulent flow states. Although the proposed model was developed and validated specifically for the centrifugal fan in the VHPGQ gas quenching furnace, it may potentially be extended to similar centrifugal fans or other fluid machinery operating under comparable conditions.

Author Contributions

Conceptualization, S.Z. and T.W.; methodology, Z.M.; software, L.L.; validation, T.W. and Z.M.; formal analysis, S.Z.; investigation, S.Z.; resources, S.Z.; data curation, T.W.; writing—original draft preparation, T.W.; writing—review and editing, S.Z.; visualization, Z.M.; supervision, S.Z.; project administration, S.Z. All authors have read and agreed to the published version of the manuscript.

Funding

This research received no external funding.

Institutional Review Board Statement

Not applicable.

Informed Consent Statement

Not applicable.

Data Availability Statement

The original contributions presented in the study are included in the article, further inquiries can be directed to the corresponding author.

Acknowledgments

We extend our sincere gratitude to all the authors for their invaluable contributions and dedicated efforts, which have been instrumental in the successful completion of this work.

Conflicts of Interest

The authors declare no conflict of interest.

References

  1. Zhao, J.; Pei, J.; Wang, W.; Gan, X. Blade redesign based on inverse design method for energy performance improvement and hydro-induced vibration suppression of a multi-stage centrifugal pump. Energy 2024, 308, 132862. [Google Scholar] [CrossRef]
  2. Ruiz, G.R.; Bandera, C.F. Analysis of uncertainty indices used for building envelope calibration. Appl. Energy 2017, 185, 82–94. [Google Scholar] [CrossRef]
  3. Wang, L.; Han, Y.G.; Chen, H.B.; Wang, N.; Fu, J.Y. Research on Energy Efficiency Status of Fans in Zhejiang Province. Appl. Mech. Mater. 2015, 737, 963–966. [Google Scholar] [CrossRef]
  4. Xu, Y.N.; Chen, N.; Shen, X.; Xu, L.; Pan, Z.; Pan, F. Proposal and experimental case study on building ventilating fan fault diagnosis based on cuckoo search algorithm optimized extreme learning machine. Sustain. Energy Technol. Assess. 2021, 45, 100975. [Google Scholar] [CrossRef]
  5. Piwowarski, M.; Jakowski, D. Areas of Fan Research—A Review of the Literature in Terms of Improving Operating Efficiency and Reducing Noise Emissions. Energies 2023, 16, 1042. [Google Scholar] [CrossRef]
  6. Ferrari, C.; Beccati, N.; Pedrielli, F. CFD Methodology for an Underhood Analysis towards the Optimum Fan Position in a Compact Off-Road Machine. Energies 2023, 16, 4369. [Google Scholar] [CrossRef]
  7. Ferrari, C.; Pinelli, M.; Spina, P.R.; Bolognin, P.; Borghi, L. Fluid Dynamic Design and Optimization of Two Stage Centrifugal Fan for Industrial Burners. In Proceedings of the ASME Turbo Expo 2011, Vancouver, BC, Canada, 6–10 June 2011; Amer Soc Mechanical Engineers: New York, NY, USA, 2012; pp. 483–490. [Google Scholar] [CrossRef]
  8. Zhang, Y.; Dou, H.-S. Effect of Blade Profile on the Performance of a Centrifugal Fan with Different Velocity Distribution Functions. Int. J. Fluid Mach. Syst. 2020, 13, 623–634. [Google Scholar] [CrossRef]
  9. Shen, Y.; Li, Y.; Wang, H.; Shen, W.; Chen, Y.; Si, H. Numerical simulation and performance optimization of the centrifugal fan in a vacuum cleaner. Mod. Phys. Lett. B 2019, 33, 1950440. [Google Scholar] [CrossRef]
  10. Chen, G.; Xu, W.; Zhao, J.; Zhang, H. Energy-Saving Performance of Flap-Adjustment-Based Centrifugal Fan. Energies 2018, 11, 162. [Google Scholar] [CrossRef]
  11. Yuan, Y.; Fang, Y.; Tang, L. Effects of non-uniform elbow inflow on the unsteady flow and energy development characteristics of a centrifugal pump. Phys. Fluids 2023, 35, 015152. [Google Scholar] [CrossRef]
  12. Long, Y.; Wang, D.; Yin, J.; Hu, Y.; Ran, H. Numerical investigation on the unsteady characteristics of reactor coolant pumps with non-uniform inflow. Nucl. Eng. Des. 2017, 320, 65–76. [Google Scholar] [CrossRef]
  13. Liu, Z.; Yang, H.; He, H.; Yu, P.; Wei, Y.; Zhang, W. Flow instability in a volute-free centrifugal fan subjected to non-axisymmetric pre-swirl flow from upstream bended inflow tube. Proc. Inst. Mech. Eng. Part A J. Power Energy 2022, 236, 689–713. [Google Scholar] [CrossRef]
  14. Song, G.; Li, J.; Tang, M.; Wu, Y.; Luo, Y. Experimental simulation methodology and spatial transition of complex distortion fields in a S-shaped inlet. Aerosp. Sci. Technol. 2021, 116, 106855. [Google Scholar] [CrossRef]
  15. Cao, P.; Wang, Y.; Kang, C.; Li, G.; Zhang, X. Investigation of the role of non-uniform suction flow in the performance of water-jet pump. Ocean Eng. 2017, 140, 258–269. [Google Scholar] [CrossRef]
  16. Si, Q.; Tang, Y.; Gan, X.; Li, H.; Yang, S. Parametric analysis and validation of inlet elbow and impeller of vertical pipeline pump. J. Agric. Eng. 2020, 36, 54–63+313. [Google Scholar] [CrossRef]
  17. Yang, W.; Kuan, B. Experimental investigation of dilute turbulent particulate flow inside a curved 90° bend. Chem. Eng. Sci. 2006, 61, 3593–3601. [Google Scholar] [CrossRef]
  18. Ma, H.; Dai, C.; Dong, L.; Wu, X. PIV test of internal flow field in a 90° square bend. Adv. Water Resour. Hydropower Sci. Technol. 2013, 33, 31–34+56. [Google Scholar] [CrossRef]
  19. Mittag, S.; Gabi, M. Experimental and numerical investigation of centrifugal pumps with asymmetric inflow conditions. J. Therm. Sci. 2015, 24, 516–525. [Google Scholar] [CrossRef]
  20. Luo, X.; Ye, W.; Huang, R.; Wang, Y.; Du, T.; Huang, C. Numerical investigations of the energy performance and pressure fluctuations for a waterjet pump in a non-uniform inflow. Renew. Energy 2020, 153, 1042–1052. [Google Scholar] [CrossRef]
  21. Song, Y.; Xu, R.; Song, Y.; Long, Y.; Yin, J.L.; Wang, D. Hydrodynamics characteristics of non-uniform inflow in reactor coolant pump based on time-resolved tomographic particle image velocimetry. Phys. Fluids 2022, 34, 125132. [Google Scholar] [CrossRef]
  22. Liu, Z.; Huang, G.; Chen, J.; Yu, Z. Coupling Effect between Inlet Distortion Vortex and Fan. J. Therm. Sci. 2023, 32, 1089–1104. [Google Scholar] [CrossRef]
  23. Zhang, H.; Li, Q.; Dong, F.; Chu, W. Mechanism of Affecting the Performance and Stability of an Axial Flow Compressor with Inlet Distortion. J. Therm. Sci. 2021, 30, 1406–1420. [Google Scholar] [CrossRef]
  24. Zhang, H.; Liu, L.; Liu, L. Study on the effect of non-uniform incoming flow on the internal flow and performance of CAP1400 nuclear main pump. J. Xi’an Jiaotong Univ. 2023, 57, 39–48. [Google Scholar] [CrossRef]
  25. Hu, S.; Zhu, L.; Zhang, M.; Tang, X.; Wang, X. Development and Prospect of Vacuum High-Pressure Gas Quenching Technology. Materials 2023, 16, 7413. [Google Scholar] [CrossRef]
  26. Kohne, T.; Fahlkrans, J.; Haglund, S.; Stormvinter, A.; Troell, E.; Hedström, P.; Borgenstam, A. Impact of Cooling Rate during High-Pressure Gas Quenching on Fatigue Performance of Low Pressure Carburized Gears. Metals 2022, 12, 1917. [Google Scholar] [CrossRef]
  27. Wang, J.; Gu, J.; Shan, X.; Hao, X.; Chen, N.; Zhang, W. Numerical simulation of high pressure gas quenching of H13 steel. J. Mech. Work. Technol. 2008, 202, 188–194. [Google Scholar] [CrossRef]
  28. Meng, F.; Zhu, X.; Qiu, C.; Zhang, C. Simulation study on vacuum heat treatment process of 300M steel. Heat Treat. Technol. Equip. 2023, 44, 27–31. [Google Scholar] [CrossRef]
  29. Yang, S.; Li, J.; Liu, D.; He, D.; Bi, X.; Gao, T. Simulation of the flow field in the temperature field of gas quenching and cooling of sintered NdFeB vacuum sintering furnaces based on Fluent. Funct. Mater. Met. 2023, 30, 113–117. [Google Scholar] [CrossRef]
  30. Yang, J.; Zhang, H.; Wang, Y.; Wang, J. Analysis of gas cooling process and design of cooling system for vacuum furnace. Vacuum 1999, 39–43. [Google Scholar] [CrossRef]
  31. Huang, H.; Sun, T.; Li, N.; Zhang, G. Sensitization of the modified SST model to the swirling and curvature for turbulent impinging jet heat transfer. Int. J. Heat Mass Transf. 2022, 182, 121980. [Google Scholar] [CrossRef]
  32. Arolla, S.K.; Durbin, P.A. Modeling rotation and curvature effects within scalar eddy viscosity model framework. Int. J. Heat Fluid Flow 2013, 39, 78–89. [Google Scholar] [CrossRef]
  33. Monson, D.; Seegmiller, H.; Mcconnaughey, P. Comparison of experiment with calculations using curvature-correctedzero and two equation turbulence models for a two-dimensional U-duct. In Proceedings of the 21st Fluid Dynamics, Plasma Dynamics and Lasers Conference, Seattle, WA, USA, 18–20 June 1990. [Google Scholar] [CrossRef]
  34. Wu, C.; Pu, K.; Shi, P.; Wu, P.; Huang, B.; Wu, D. Blade redesign based on secondary flow suppression to improve the dynamic performance of a centrifugal pump. J. Sound Vib. 2023, 554, 117689. [Google Scholar] [CrossRef]
  35. Vo, H.D.; Tan, C.S.; Greitzer, E.M. Criteria for Spike Initiated Rotating Stall. J. Turbomach. 2008, 130, 011023. [Google Scholar] [CrossRef]
  36. Wang, C.; Feng, J.J.; Luo, X.Q.; Lu, J.L.; Zhu, G.J. Numerical prediction of rotating stallin a low-specific speed centrifugal pump. In IOP Conference Series: Earth and Environmental Science, Proceedings of the Asian Working Group- IAHR’s Symposium on Hydraulic Machinery and Systems, Beijing, China, 16–19 November 2017; IOP Publishing Ltd.: Bristol, UK, 2018; Volume 163, p. 012091. [Google Scholar] [CrossRef]
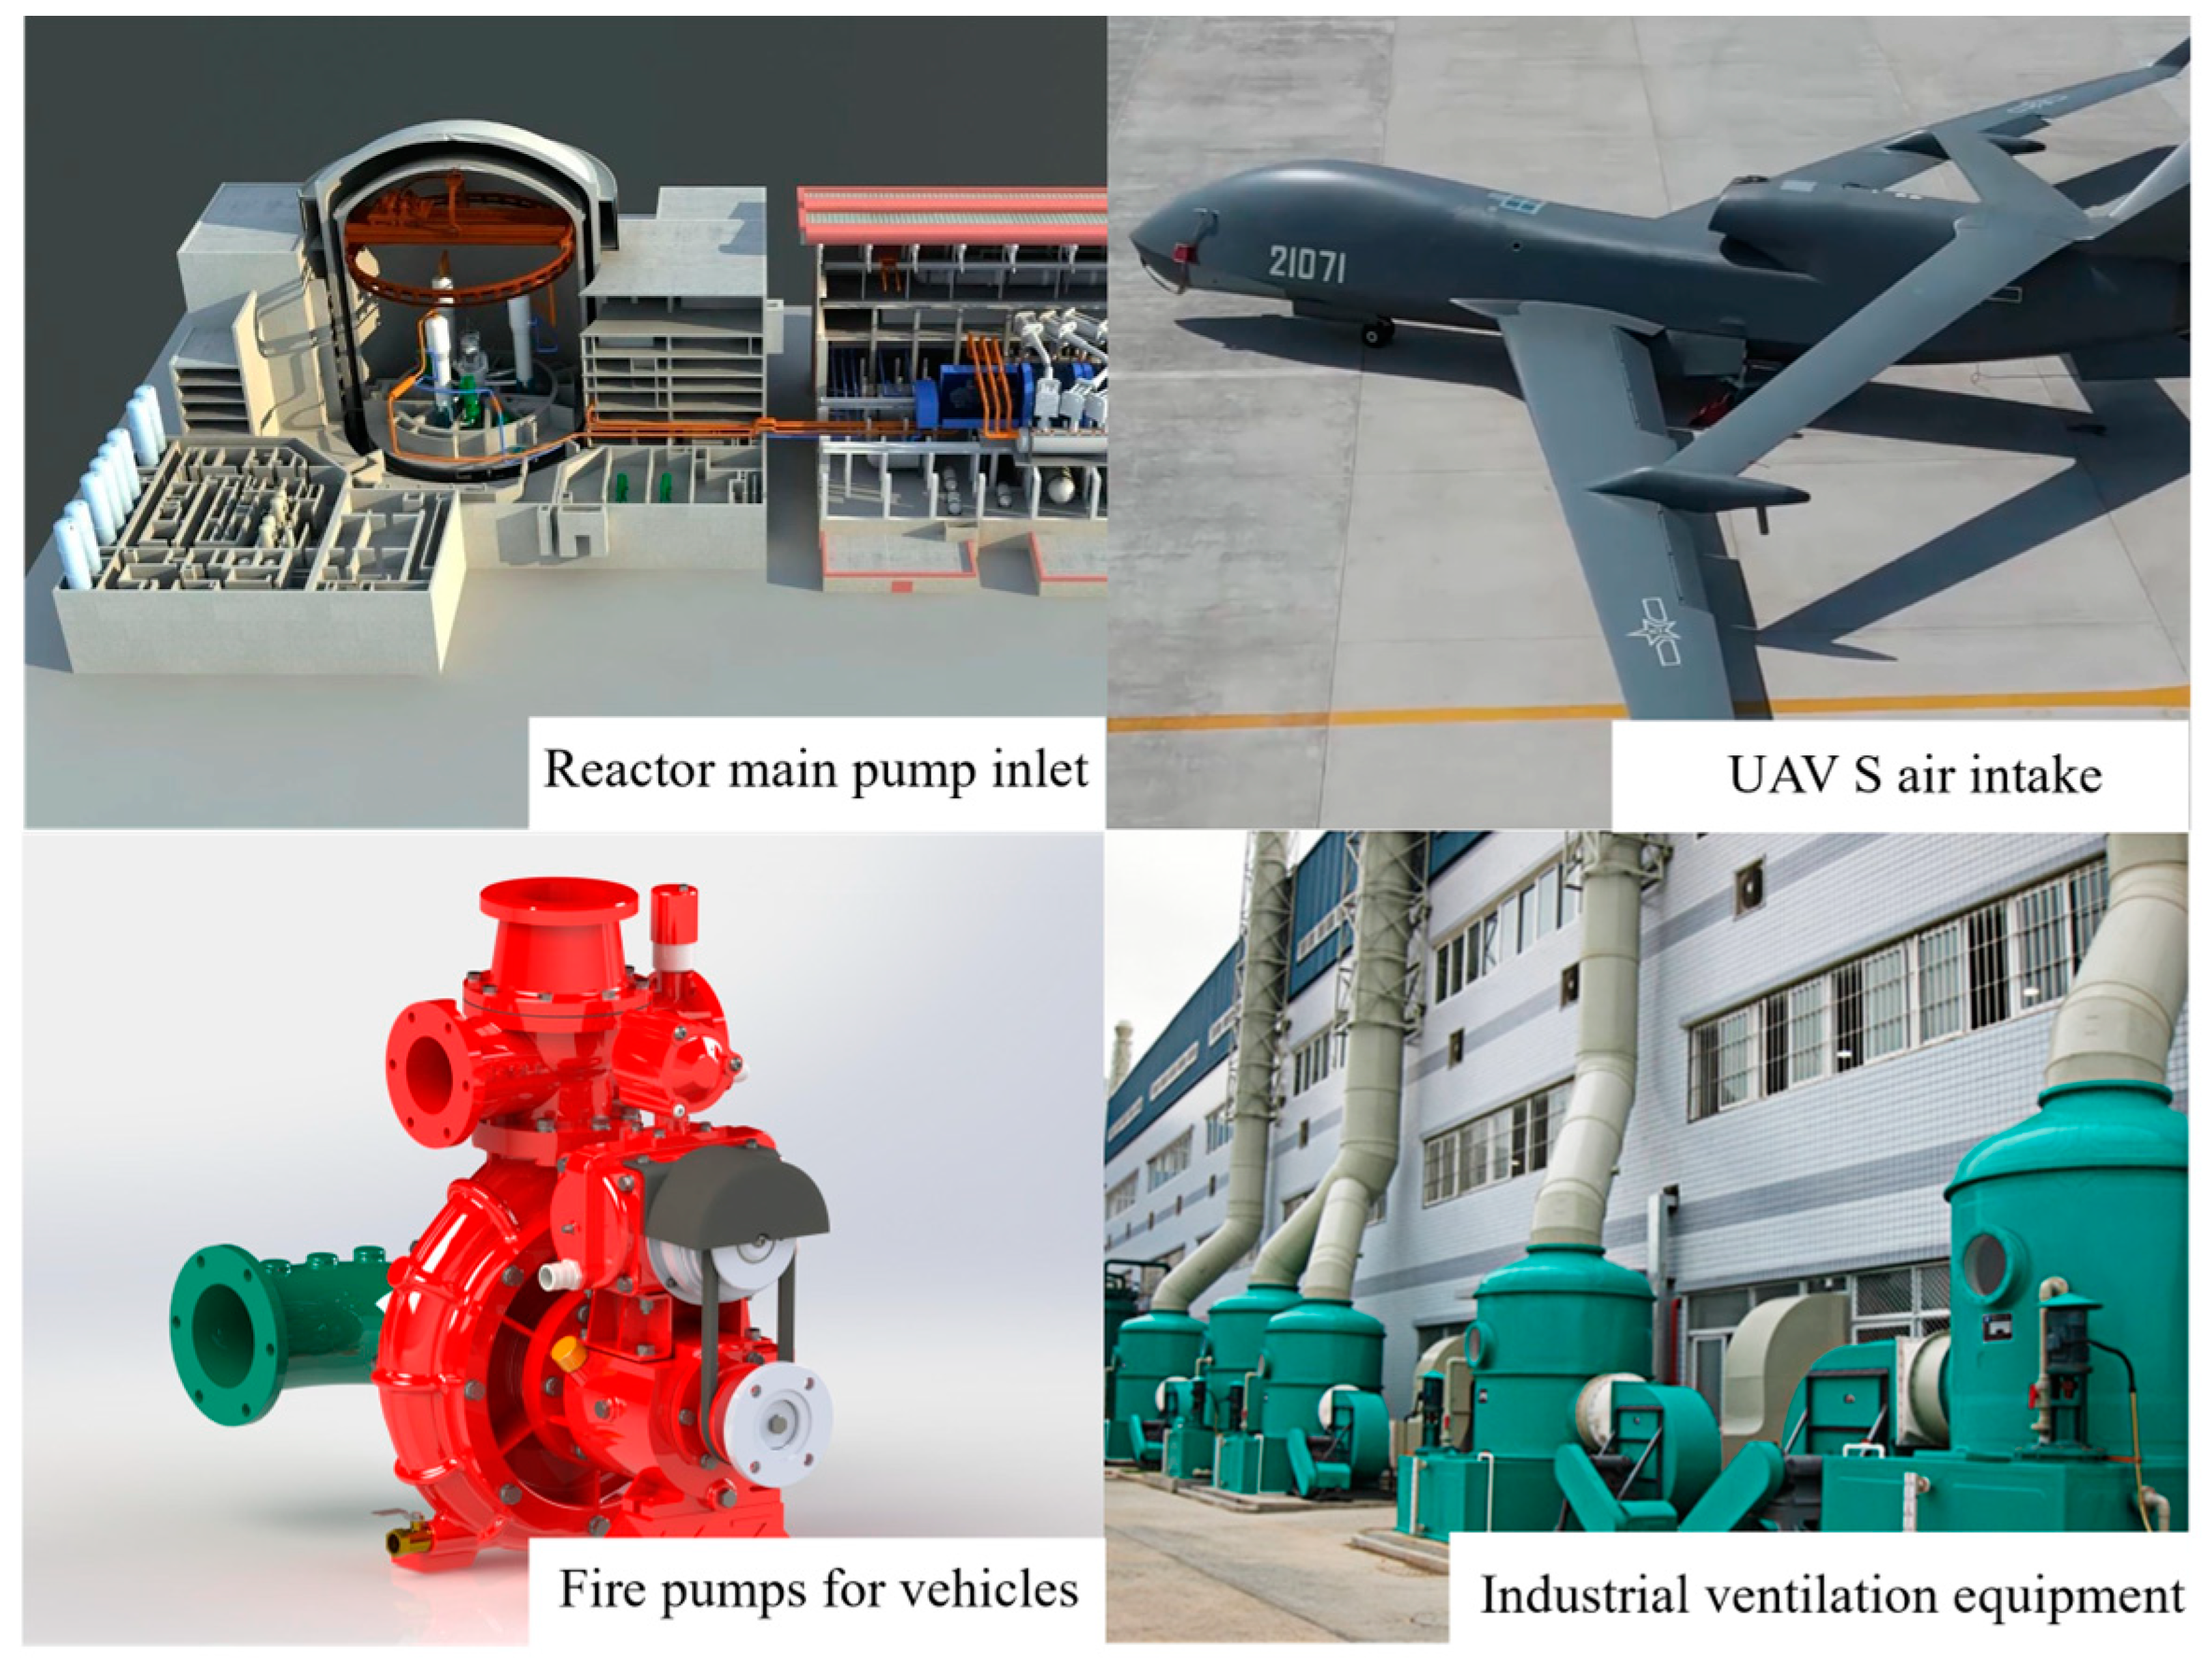
Figure 1. Scenario of pre-rotation phenomenon occurrence.
Applsci 15 03521 g001
Figure 2. Geometric dimensions of the centrifugal fan.
Applsci 15 03521 g002
Figure 3. Schematic of the fluid domain and impeller mesh structure: (a) computational domain schematic, (b) structured mesh of the impeller.
Applsci 15 03521 g003
Figure 4. Schematic of the 180° U-shaped pipe computational domain and mesh.
Applsci 15 03521 g004
Figure 5. Velocity distribution at three different cross-sections of the 180° U-shaped channel flow.
Applsci 15 03521 g005
Figure 6. Grid independence verification.
Applsci 15 03521 g006
Figure 7. Wall y+ distribution.
Applsci 15 03521 g007
Figure 8. Force acting on fluid particles within the rotating impeller.
Applsci 15 03521 g008
Figure 9. Distribution of the impeller flow area along the streamline: (a) arc section position, (b) chord length of each section.
Applsci 15 03521 g009
Figure 10. Comparison of impeller models before and after modification: (a) original model and (b) modified model.
Applsci 15 03521 g010
Figure 11. Comparison of pressure and efficiency at different flow rates before and after modification.
Applsci 15 03521 g011
Figure 12. Axial position distribution of monitoring cross-sections in the centrifugal fan flow passage.
Applsci 15 03521 g012
Figure 13. Circumferential distribution of axial velocity and swirl angle at the monitoring cross-sections.
Applsci 15 03521 g013
Figure 14. Blade tip leakage flow in the original impeller: (a) streamlines at 0.9 blade height section (b) three-dimensional streamlines in flow passage A (c) three-dimensional streamlines in flow passage B.
Applsci 15 03521 g014
Figure 15. Blade tip leakage flow in the modified impeller. (a) streamlines at 0.9 blade height section (b) three-dimensional streamlines in flow passage A (c) three-dimensional streamlines in flow passage B.
Applsci 15 03521 g015
Figure 16. Comparison of blade passage velocity streamlines: (a) original design and (b) modified design.
Applsci 15 03521 g016
Figure 17. Blockage factor distribution in the flow passages A and B of the original and modified impellers.
Applsci 15 03521 g017
Figure 18. Main structure of the vacuum quenching furnace.
Applsci 15 03521 g018
Figure 19. Schematic diagram of the testing process.
Applsci 15 03521 g019
Figure 20. On-site installation diagram of the modified structure: (a) disassembly diagram of the air chamber (b) schematic of the workpiece area, (c) exterior view of the gas quenching furnace.
Applsci 15 03521 g020
Figure 21. Velocity contour map at the test section: (a) original design and (b) optimized design.
Applsci 15 03521 g021
Figure 22. Standard deviation of velocity for the original and optimized designs.
Applsci 15 03521 g022
Figure 23. Comparison of temperature before and after optimization.
Applsci 15 03521 g023
Table 1. Main parameters of the centrifugal fan.
ParametersValueParametersValue
Nominal speed n (r/min)3000Impeller suction diameter D1 (mm)354
Nominal flow rate Qd (m3/h)14,500Impeller outlet diameter D2 (mm)520
Nominal wind pressure (Pa)3200Impeller outlet width b1 (mm)145
Work pressure (MPa)2.0Blade number Z10
Number of finned tubes176Blade inlet angle β1 (°)13.7
Blade thickness (mm)10Blade outlet angle β2 (°)36.0
Volute height D3 (mm)1120Collector circle inlet diameter D4 (mm)520
Table 2. The mesh numbers for each domain.
Inlet DomainOutlet DomainVolute DomainImpeller DomainTotal
1,308,4111,207,7653,019,4094,529,11710,064,702
Disclaimer/Publisher’s Note: The statements, opinions and data contained in all publications are solely those of the individual author(s) and contributor(s) and not of MDPI and/or the editor(s). MDPI and/or the editor(s) disclaim responsibility for any injury to people or property resulting from any ideas, methods, instructions or products referred to in the content.