1. Introduction
Professional truck drivers spend most of their working hours seated, often for more than eight hours per day [
1]. Prolonged static sitting, combined with restricted movement and exposure to whole-body vibration, leads to discomfort and fatigue [
2]. Seating comfort directly influences alertness, task performance, and perceived well-being during long-duration driving [
3]. Understanding, measuring, and improving seating comfort is therefore not a matter of luxury but a central ergonomic requirement in occupational transport design.
Despite advances in vehicle seat technology, discomfort among professional drivers remains common. Many commercial seats follow a “one-size-fits-most” design logic derived from certain anthropometric databases [
4]. However, drivers differ substantially in body dimensions, body composition, posture preferences, and support needs [
5]. When seat geometry does not match an individual’s morphology, it can produce uneven pressure distribution, localized stress points, and postural instability [
6]. Over time, such mismatches accumulate, resulting in discomfort and fatigue during extended driving sessions.
Seating comfort is a multidimensional construct that combines physiological, physical, and psychological aspects [
7,
8]. Among these, pressure distribution is one of the most direct physical determinants of perceived comfort, as it reflects how body loads are supported by the seat [
6,
9,
10]. Pressure distribution can be quantified through several measurable features: mean pressure (MP), representing overall load intensity; peak pressure (PP), capturing local stress concentrations; and contact area (CA), indicating how extensively the body is supported. Additional descriptors such as standard deviation (SD), variance (Var), and seat pressure distribution percentage (SPD%) describe the uniformity and balance of interface loads [
11]. Together, these metrics provide an objective means to evaluate seat performance. As summarized in
Table 1, automotive seating studies consistently show that lower MP and PP and a larger CA are associated with higher comfort, while lower SD, Var, and SPD% indicate more even pressure distribution and improved postural stability. Overall, a well-distributed pressure profile remains a reliable indicator of seating quality and perceived comfort, especially for the seat pan, which may bear up to 90% of the total body weight [
12].
Beyond conventional pressure-distribution studies, several related fields have explored digital or morphology-based approaches to improving seated support. Research in rehabilitation and wheelchair seating has shown that individualized contouring can reduce pressure hotspots and improve pelvic stability [
17,
18], while computational modelling studies demonstrated that human morphology and internal tissue mechanics can predict high-pressure zones and guide geometry adaptation [
19]. Complementing these findings, recent additive-manufacturing research has introduced lattice and functionally graded structures that enable tunable stiffness and improved load distribution compared with uniform foams [
20,
21]. Together, these studies highlight the importance of matching seat-support geometry and stiffness to individual morphology in order to achieve more favorable pressure distributions.
Integrating individual morphology into product design requires a smooth and coherent workflow. Personalized orthotic workflows have established the value of integrating 3D scanning, parametric modelling, and additive manufacturing to create patient-specific support surfaces with improved fit and biomechanical performance [
22,
23]. Similarly, computational approaches to personalized seating have demonstrated how digital human body models can predict seat–body interaction and generate optimized support surfaces for specific postures (e.g., Leimer et al. [
24]), and complete end-to-end workflows have been developed for translating morphology into manufacturable geometry (e.g., Hale et al. [
22]). Minnoye et al. [
25] linked anthropometric inputs with parametric modelling and fabrication parameters, enabling a reproducible process for personalized seating design. However, despite these advances, most existing developments remain concentrated in medical or non-dynamic anthropometry applications, with limited translation to occupational driving environments where constrained posture, long-duration sitting, and vibration impose unique ergonomic demands.
Existing digital workflows have rarely been applied or validated in occupational transport settings, where long-term sitting and task-specific postures impose distinct ergonomic demands. This study addresses that gap by applying personalized product design to truck-driver seating comfort. In detail, it investigates whether 3D-printed, geometry-personalized seat inserts can be produced and whether they can improve pressure distribution and perceived comfort compared with a standard truck seat. Accordingly, the research questions are defined as follows: (1) How can 3D scanning, computational design, and additive manufacturing be used to design personalized seat inserts for truck drivers? (2) How does a personalized insert influence pressure distribution and perceived comfort compared with a standard seat? By addressing these scientific gaps, this study contributes a context-driven personalization workflow for truck-driver seating and provides empirical evidence that personalized geometry improves pressure distribution and perceived comfort compared with a standard seat.
3. Results
3.1. Demographics of the Participants
Seventeen Dutch participants (11 males, 6 females) were initially recruited for the study. One male participant withdrew before completion, resulting in 16 valid data sets used for analysis. As summarized in
Table 3, participant ages ranged from 24 to 60 years, covering both younger and older adult groups commonly found in the logistics workforce. Male participants were generally taller and heavier, with greater seated height and leg length, whereas female participants exhibited slightly larger mean hip widths and greater variability in lower-body dimensions, particularly in buttock–knee depth.
3.2. Seat-Insert Design
All sixteen personalized seat inserts were successfully generated and fabricated following the workflow described in
Section 2.
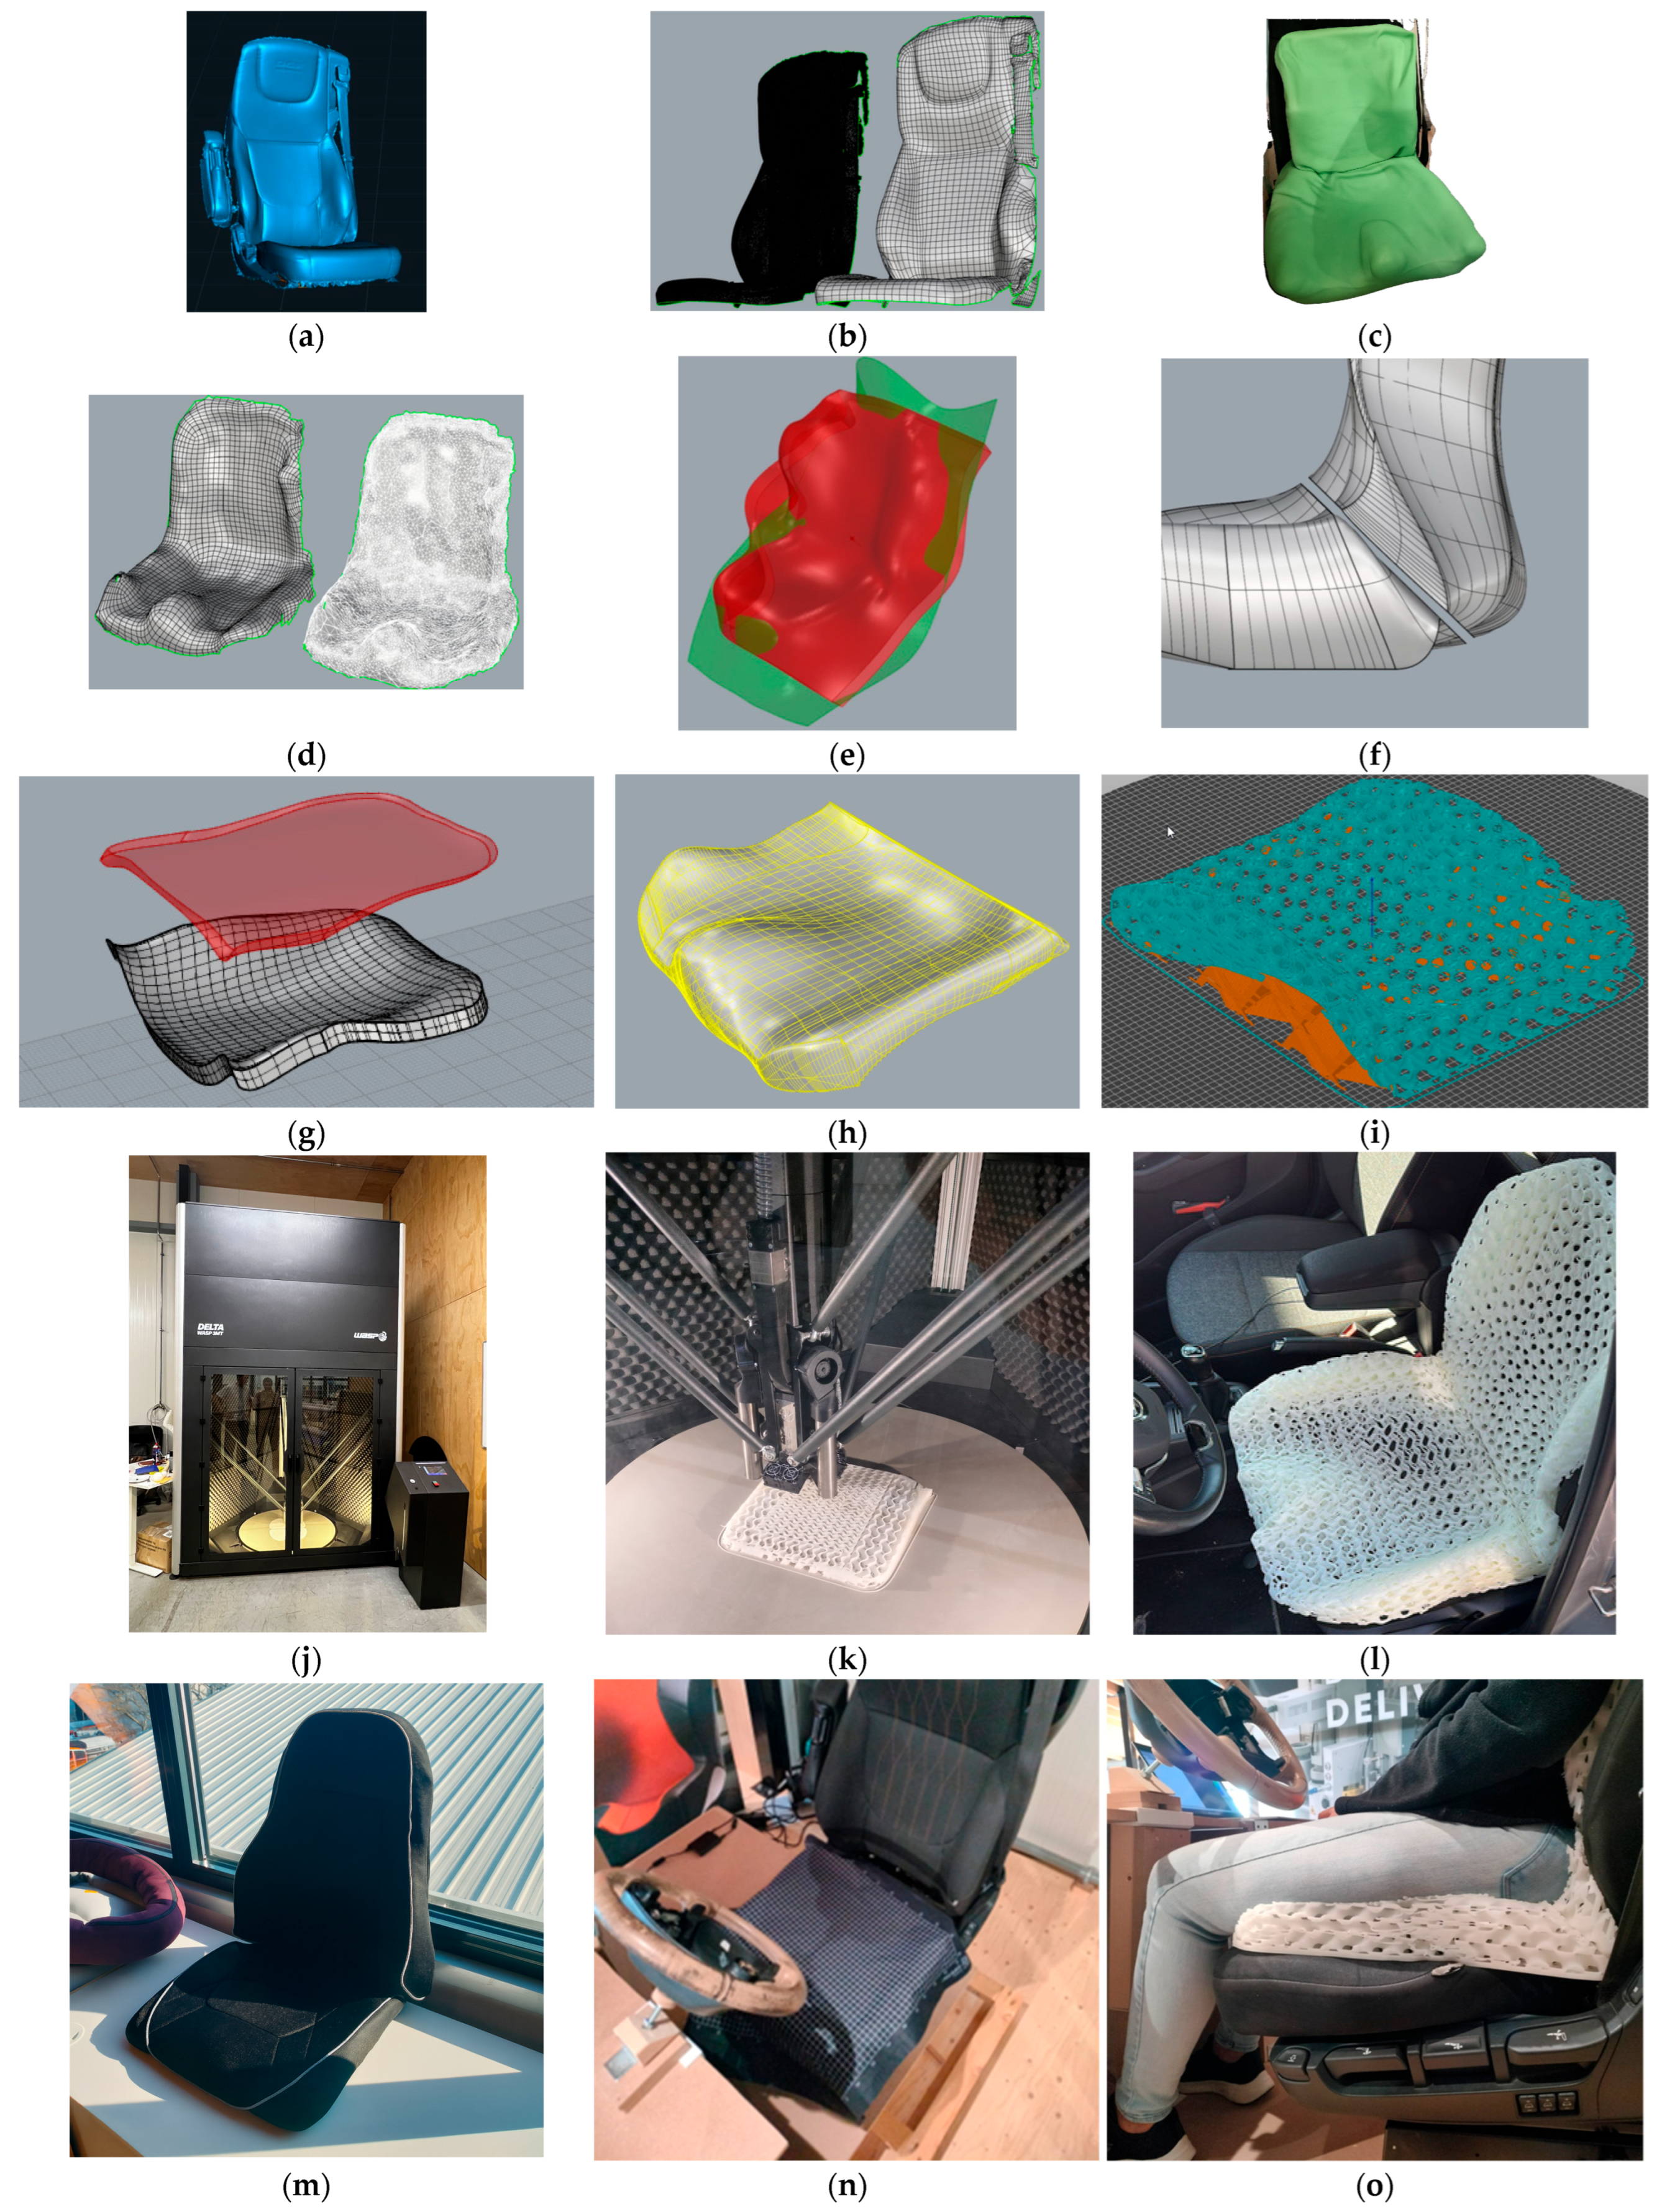
Figure 3 illustrates the outcomes of each step in the design and manufacturing workflow for the personalized seat inserts. The reference truck seat was first scanned (a), and its surface geometry was reconstructed (b). Each participant’s vacuum-molded form was then digitized (c) and converted into a continuous surface (d). The personalized insert geometry was generated between the reconstructed mold and seat surfaces (e) and subsequently segmented into printable components (f), including the backrest (g) and cushion (h). The printing process was prepared and visualized in PrusaSlicer (i) and fabricated using a WASP large-format FDM printer (j,k) [WASP S.r.l., Massa, Lombarda, Italy]. The assembled insert was installed on a reference seat (l), and the final upholstery-applied version is shown in (m). During the experiment, pressure profiles were captured for the original truck seat without an insert (n) and for the seat with the insert installed.
Figure 3o shows a participant sitting on the insert; the upholstery was removed for improved visualization of the geometry.
3.3. Pressure-Distribution Analysis
Objective seat-interface pressure data were collected for all 16 participants in both the baseline (regular seat) and personalized-insert conditions.
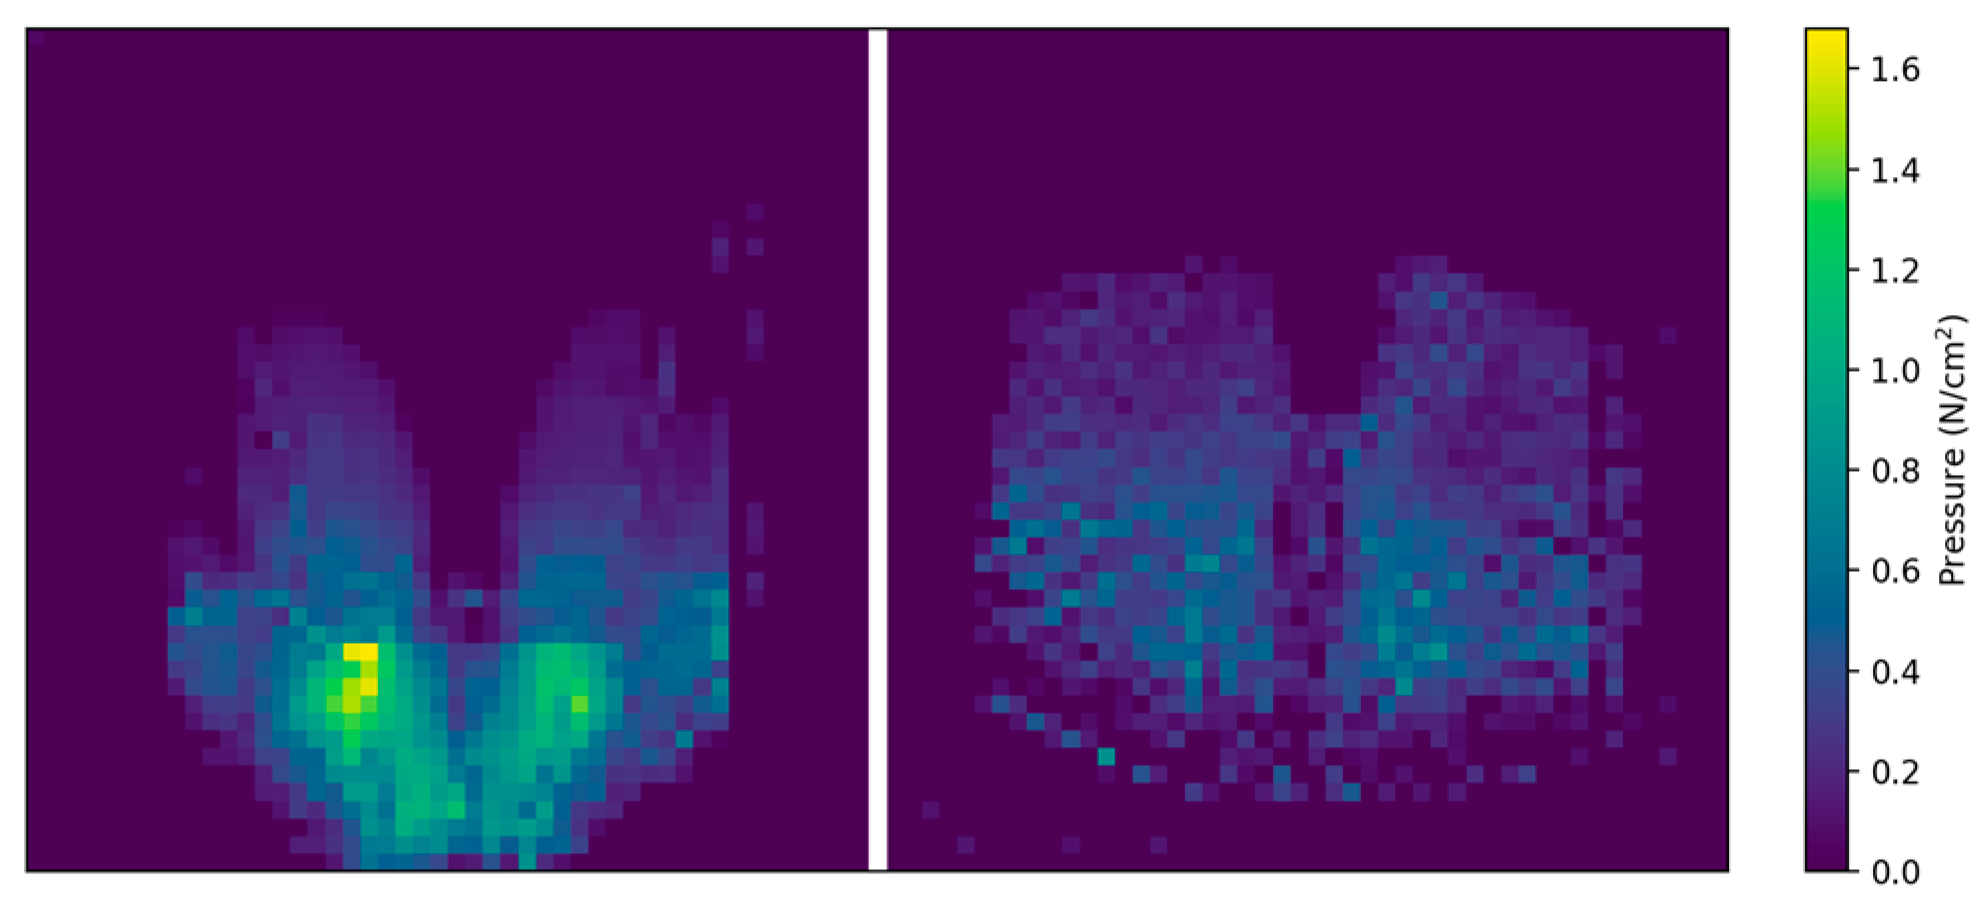
Figure 4 shows examples of pressure maps from one participant: the left panel corresponds to the baseline condition, and the right panel to the personalized-insert condition.
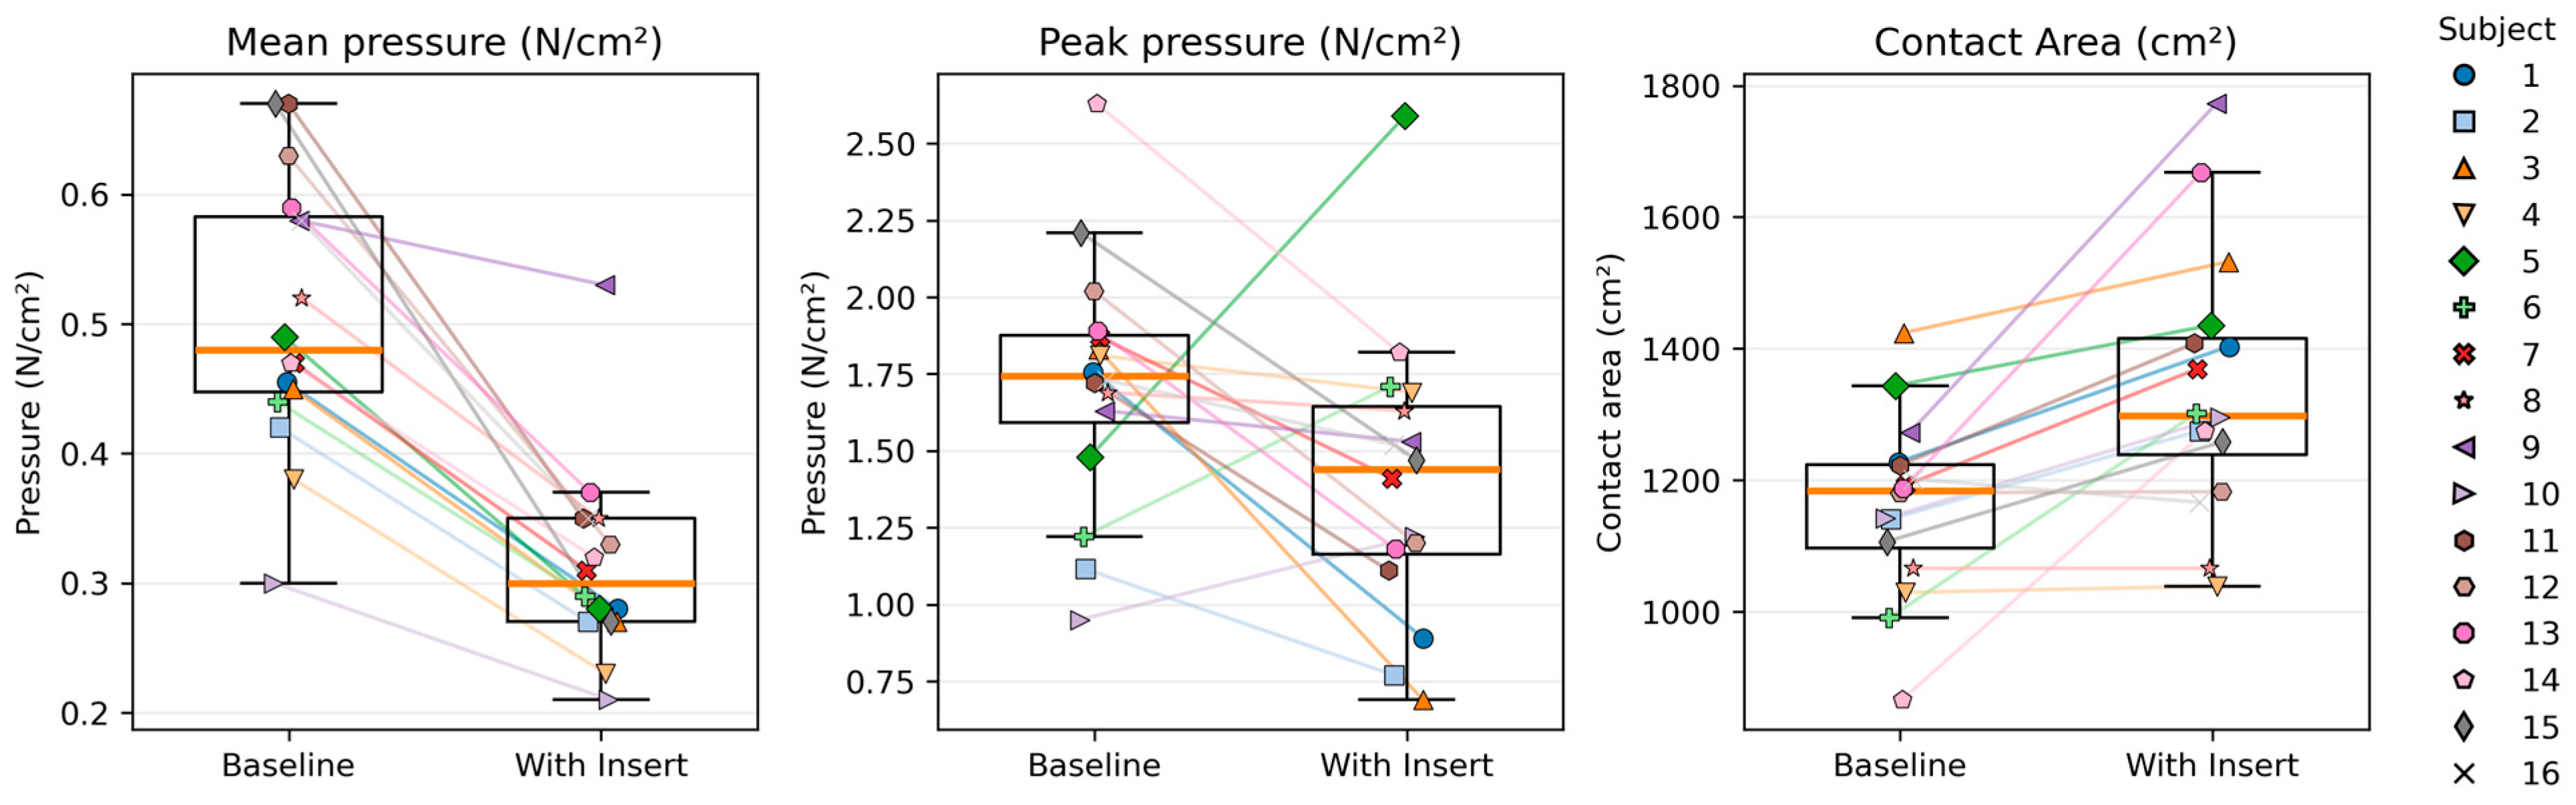
Figure 5 illustrates the distribution of the three-pressure metrics across participants. Each box indicates the median and interquartile range, while the colored dots represent individual participant values connected across conditions. The figure highlights a consistent downward shift in both mean pressure (MP) and peak pressure (PP) with the personalized inserts, accompanied by an increase in contact area (CA), suggesting a more even load transfer and improved pressure dispersion.
Table 4 summarises the results of the pressure-mapping analysis. The personalised inserts produced a 39% reduction in MP, an 18% reduction in PP, and a 15% increase in CA compared with the baseline seat. All differences were statistically significant (
p < 0.05), confirming the beneficial effect of the inserts on pressure distribution and seated comfort potential.
3.4. Subjective Comfort Ratings
Subjective comfort was evaluated immediately after each sitting condition using a 10-point scale (1 = no comfort, 10 = very comfortable). Participants provided ratings for overall comfort, seat cushion, backrest, thigh support, and buttock comfort.
Table 5 summarizes the mean comfort ratings for the baseline and personalized-insert conditions. Across all regions, comfort scores improved significantly (
p < 0.05). Overall comfort increased by +1.9 points. Region-wise, the largest increases were observed for the buttock (+2.4 points), followed by the thigh (+1.7) and the back (+0.9).
3.5. Qualitative Feedback
Qualitative insights were obtained from short semi-structured interviews conducted immediately after each test session. Participants were invited to describe their comfort experience, perceived differences between the two seat conditions, and any sensations of support, stability, or thermal perception. Their comments revealed three recurring themes.
First, support and pressure distribution. Most participants described the personalized insert as providing firmer yet more stable support, particularly under the buttocks and thighs. Several reported a more even pressure distribution and less localized discomfort or numbness during the 20-min sitting period.
Second, postural control and stability. Many participants noted that the insert reduced the tendency to slide forward and helped them maintain a neutral posture with less effort. These perceptions of improved stability aligned with the reduced peak-pressure and increased contact-area measurements.
Third, surface feel and thermal perception. A few participants mentioned that the insert felt slightly warmer than the baseline seat, although none associated this with discomfort. Several participants also noted that the surface felt smoother when the pressure-mapping mat was placed on top.
Overall, participants perceived the personalized insert as more supportive, stable, and comfortable than the baseline truck seat. These qualitative impressions reinforce the quantitative trends observed in the pressure-mapping and comfort-rating analyses.
4. Discussion
4.1. Overview and Main Findings
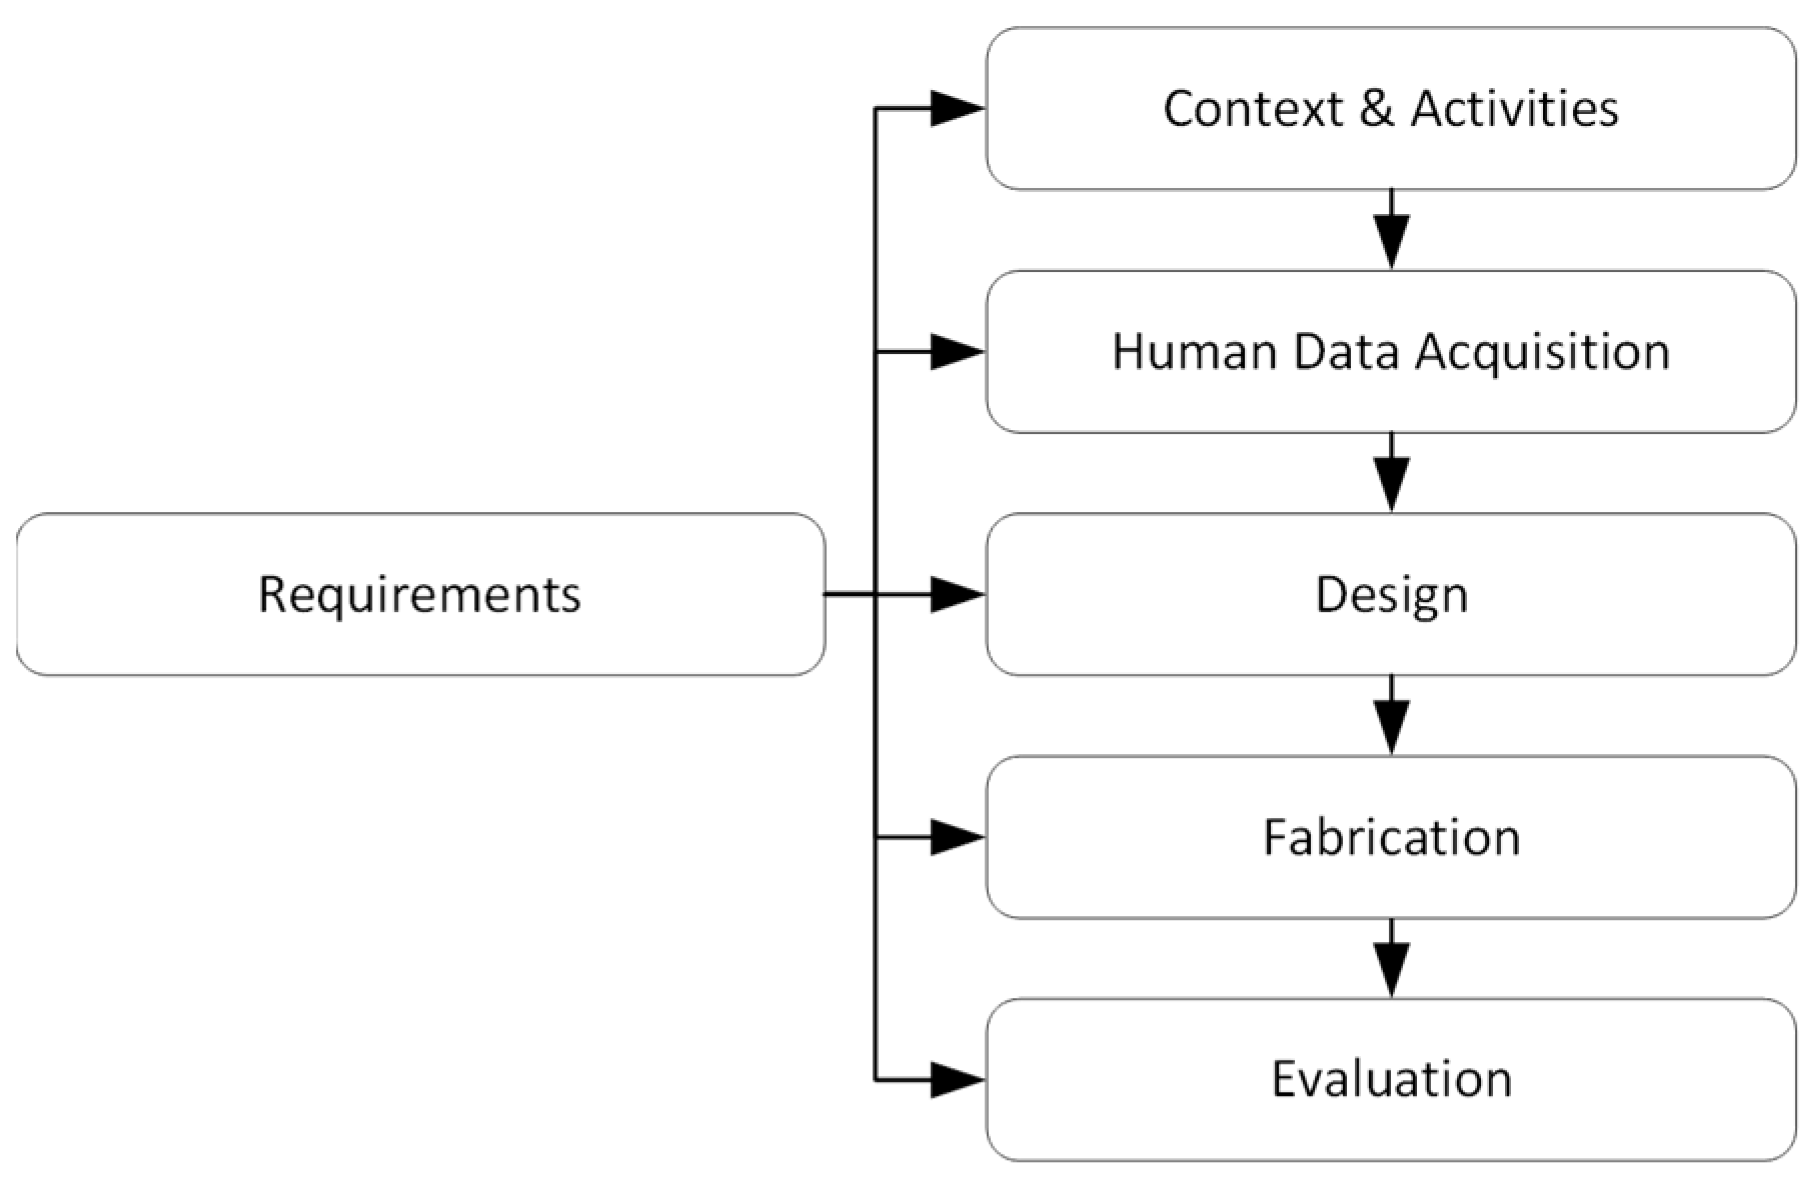
This study aimed to address two research questions: (1) How can 3D scanning, computational design, and additive manufacturing be used to design personalized seat inserts for truck drivers? (2) How does a personalized insert influence pressure distribution and perceived comfort compared with a standard seat? Regarding the first question, the study demonstrated a reproducible end-to-end workflow consisting of five sequential phases: Context & Activities, Human Data Acquisition, Design, Fabrication, and Evaluation as shown in
Figure 1. Requirements informed each phase, ensuring that the workflow remained grounded in real driving posture, cabin geometry, and task constraints. The integration of vacuum molding, 3D scanning, computational design, and large-format additive manufacturing proved technically feasible, and the resulting inserts were successfully integrated into an existing truck seat without affecting its adjustability.
For research question 2, both objective and subjective results indicated significant benefits of personalization. Interface pressure analysis revealed a 39% reduction in mean pressure (MP) and an 18% reduction in peak pressure (PP), alongside a 15% increase in contact area (CA). Correspondingly, all comfort ratings improved significantly (p < 0.05), with the largest gains observed in the buttock region (+2.4 points). Participants described firmer yet more stable support and reduced local discomfort. Together, these findings confirm that personalized inserts enhance comfort and pressure distribution, and that the proposed workflow offers a viable pathway for implementing personalization in occupational seating.
4.2. Pressure Distribution
The inserts effectively altered the physical interaction between body and seat. Lower MP and PP indicate that loads were spread across a wider contact surface, reducing localized stress beneath the ischial tuberosities. The larger CA supports this interpretation, suggesting improved conformity between the seat pan and body contours.
These findings are consistent with prior comfort studies that have identified a more uniform pressure distribution as a key determinant of perceived support quality [
6,
9]. Kilincsoy et al. [
12] and Halder et al. similarly reported that even small reductions in local pressure peaks can lead to notable improvements in comfort ratings. The magnitude of improvement observed in the present study—up to a 40% reduction in MP—is greater than typically achieved through material changes alone, highlighting the importance of geometric adaptation rather than solely modifying foam or damping properties.
Although this experiment was static, the reduction in concentrated load areas suggests that, under dynamic driving conditions, the inserts may mitigate micro-movements and muscular tension required to maintain posture, thereby delaying the onset of discomfort.
4.3. Subjective Comfort
The subjective ratings closely mirrored the pressure-mapping results. Participants consistently rated the personalized inserts as more comfortable, with significant improvements across all measured regions. The greatest gains were observed for the buttock area, which also exhibited the largest reductions in interface pressure. This correspondence reinforces the established relationship between pressure distribution and perceived comfort [
6,
9].
Interestingly, several participants described the inserts as firmer yet more stable. This suggests that comfort improvements are derived primarily from geometric conformity rather than material compliance. Similar observations were reported by Vink and Hallbeck [
7], who noted that comfort involves both physical and psychological factors such as predictability, balance, and perceived fit. In this context, firmness may have contributed to a stronger sense of stability, allowing participants to maintain an upright and balanced posture with less effort.
4.4. Qualitative Interviews
The interviews provided complementary insights consistent with the quantitative findings. Three themes emerged: support stability, pressure relief, and thermal perception. Most participants reported improved lateral and vertical stability, reduced sliding, and easier posture maintenance, echoing Porter et al. [
5], who emphasized the importance of stable support for driver comfort and perceived safety.
Participants also reported more even pressure under the buttocks and thighs, consistent with the measured pressure redistribution. A few participants mentioned a slightly warmer seat surface. Future work should therefore examine the thermal performance of the upholstery and its influence on humidity accumulation and airflow.
4.5. Personalized Product Design and Fabrication
Beyond the ergonomic outcomes, this study demonstrates the feasibility of integrating 3D scanning, computational design, and additive manufacturing into a coherent workflow for personalized seating insert design [
31]. Each insert was designed, printed, and installed using commercially available tools, with fabrication times ranging from 10 to 14 h per participant. Comparable levels of efficiency and workflow structure have been reported in digital orthotic fabrication pipelines, where 3D scanning and additive manufacturing enable individualized support surfaces with reasonable turnaround times [
22]. Research on customized wheelchair seating similarly highlights the potential of additive manufacturing for low-volume, user-specific seating components [
32].
From a design perspective, the workflow translates human morphology directly into manufacturable geometry, thereby reducing reliance on empirical fitting or manual adjustments. This mirrors the processes used in bespoke orthosis design that combine 3D body scanning with parametric CAD to achieve reproducible, user-specific geometries [
22]. The inserts maintained full compatibility with the existing seat structure and adjustment mechanisms, demonstrating how individualization can be embedded within conventional seat architectures without extensive redesign.
A key advancement of the proposed workflow is the explicit inclusion of contextual and activity-based factors as the starting point of personalization. Unlike previous approaches such as Minnoye et al. [
25], which derive support surfaces primarily from morphology, the present workflow uses the driver’s use scenario, task constraints, and cabin layout to establish the target posture and ergonomic configuration. By grounding personalization in both context and activities, the resulting geometry addresses functional and situational needs rather than purely anatomical fit.
These results suggest broader applications in mass personalization and inclusive design, including wheelchair seating for persons with reduced mobility (PRM), rehabilitation seating, and operator environments where extended sitting is required. In such scenarios, individualized support informed by both anthropometric and contextual data has the potential to substantially enhance long-term comfort and performance.
4.6. Limitations
Several methodological considerations should be acknowledged when interpreting the results. Overall, the study represents an initial laboratory validation of the personalization workflow rather than a full dynamic or long-duration driving evaluation. All measurements were conducted in a static seating buck, which ensured experimental control and repeatability but did not capture dynamic influences such as vibration, acceleration, active seat suspension, or prolonged exposure to road-induced movements. The relatively short sitting duration (approximately 20 min per condition) also limits insights into long-term discomfort. Previous research suggests that meaningful differences in discomfort may emerge only after 40 min or more of continuous sitting [
6]. Accordingly, the present findings should be interpreted as reflecting short-term comfort responses only. We have therefore clarified that future work should include experiments in real vehicles or high-fidelity driving simulators with representative vibration profiles and long-duration or repeated-measures protocols.
The sample provided realistic anthropometric diversity but did not include professional truck drivers, who represent the intended end-user group. Professional drivers may have distinct postural habits, musculoskeletal adaptations, and comfort expectations developed through long-haul experience. This limits the ecological validity of the present findings for occupational transport. The age and gender distribution also differed from the current workforce. Given the modest sample size (n = 16), the study was adequately powered for within-subject comparisons but not for subgroup analyses such as gender or body-size clusters. As a result, population-level generalization is limited, and a follow-up study involving more professional long-haul drivers in operational environments is required to confirm the transferability and usability of the personalized inserts in real-world practice. In addition, body-shape capture was performed with participants wearing indoor clothing; while clothing thickness was relatively consistent due to the climate-controlled environment, small variations may still influence local geometry and frictional behavior, suggesting that future protocols could standardize garments or compensate for clothing thickness during digital processing.
Using a single thermoplastic elastomer restricted the ability to tailor the stiffness properties of the inserts. Multi-material or functionally graded printing may support local stiffness tuning and improved thermal comfort. Moreover, the current seat-insert design employed a fixed lattice topology and uniform parametric settings; exploring computationally optimized lattice geometries and locally varied stiffness gradients may further enhance adaptability and comfort performance.
The pressure-mapping system measured only normal forces, preventing analysis of shear loading and micro-movements that contribute to discomfort during real driving. Incorporating shear sensors, posture-tracking, or physiological indicators (e.g., muscle activity) in future work would allow a more comprehensive assessment of tissue loading, postural stability, and fatigue development over time. Finally, although spatial pressure data were available, region-level comparisons (e.g., ischial tuberosities, thighs) were not performed because the personalized inserts reposition participants slightly within the seat pan, preventing consistent anatomical alignment across subjects. Future work will incorporate anatomical registration methods to enable robust region-by-region analysis.
5. Conclusions
This study demonstrated that integrating 3D scanning, computational design, and large-format additive manufacturing enables the creation of personalized seat inserts that measurably improve seating comfort for truck drivers. Across 16 participants, the inserts reduced mean pressure by 39%, peak pressure by 18%, and increased contact area by 15%, indicating a more even pressure distribution and improved physical support. Subjective comfort ratings were consistently higher for the personalized condition, with the largest improvements reported for buttock and thigh comfort. Qualitative feedback further highlighted enhanced postural stability, reduced sliding, and a generally firmer yet more secure seating experience. Together, these results confirm that geometry-based personalization offers a practical and quantifiable route to improving seating comfort in occupational transport.
Beyond the empirical findings, the study contributes a reproducible, context-driven personalization workflow that incorporates occupational posture, seat layout, and task constraints as design inputs. By anchoring personalization in real use context rather than generic anthropometry alone, the workflow provides a foundation for translating digital-fabrication methods into realistic transport applications, enabling individualized comfort solutions that remain compatible with existing seat architectures.
Future investigations should include long-duration and dynamic on-road evaluations, ideally involving a larger sample of professional truck drivers, to assess sustained comfort and the influence of vibration, motion, and seat-suspension dynamics. Integrating shear-force sensors, motion-tracking systems, or physiological measures would enable a more comprehensive understanding of posture stabilization, micro-movements, and comfort or discomfort development [
33]. Further development of multi-material or functionally graded inserts may allow localized stiffness tuning and improved thermal behavior. In addition, establishing quantitative links between insert geometry and pressure-distribution outcomes would support data-driven refinement of personalized designs. Simulation-based approaches, such as finite element analysis (FEA) or machine-learning-assisted geometry optimization, may further enable predictive tuning of local stiffness and deformation characteristics. Future work should also include formal long-term durability testing of the printed materials to evaluate performance under repeated loading cycles. Finally, because the current process is semi-automated, advancing the workflow toward more automated or batch-personalization processes would increase scalability and reduce production time and cost, supporting broader adoption in occupational transport, rehabilitation seating, and inclusive mobility applications.