Abstract
Drug-resistant Mycobacterium tuberculosis (Mtb) remains a major global health challenge, prompting the need for new therapeutics targeting essential bacterial proteins. The caseinolytic protein C1 (ClpC1) is a promising drug target, and accurate measurement of its ATPase activity is critical for understanding drug mechanisms. We optimized a sensitive luminescence-based ATPase assay and evaluated ClpC1 constructs with various tag positions and truncations. N-terminal tagging significantly impaired enzymatic activity, whereas C-terminal tagging had no effect; truncated domains showed reduced activity compared to native full-length (FL) ClpC1. Using the native FL-ClpC1, we assessed ecumicin (ECU) and five analogs via ATPase activity and surface plasmon resonance (SPR), using rufomycin (RUF) and cyclomarin A (CYMA) as controls. RUF and CYMA bound tightly (KD = 0.006–0.023 µM) and inhibited Mtb growth (MIC90 = 0.02–0.094 µM) but modestly stimulated ATPase activity (≤2-fold). In contrast, ECU and its analogs strongly enhanced ATPase activity (4–9-fold) despite slightly weaker binding (KD = 0.042–0.80 µM) and growth inhibition (MIC90 = 0.19 µM). The partial correlation among AC50, KD, and MIC values highlights the complementary value of enzymatic, biophysical, and cellular assays. Our assay platform enables mechanistic characterization of ClpC1-targeting compounds and supports rational antitubercular drug development.
1. Introduction
Tuberculosis (TB) is a contagious disease that predominantly targets the lungs and is caused by the bacterium Mycobacterium tuberculosis (Mtb) [1]. According to reports from the World Health Organization (WHO), TB remains a critical global health issue, responsible for approximately 1.5 million deaths each year [2]. Alarmingly, the COVID-19 pandemic has further exacerbated the burden of TB worldwide [2]. Current treatment strategies for TB are lengthy and often suboptimal [3]. Drug-sensitive (DS) TB is typically treated over a period of 6 to 9 months with a combination of up to four antibiotics, including rifampicin (RIF), isoniazid (INH), pyrazinamide (PZA), and ethambutol (EMB). The growing prevalence of multidrug-resistant (MDR) TB (defined by resistance to RIF and INH) as well as extensively drug-resistant (XDR) TB and totally drug-resistant (TDR) strains, has significantly complicated treatment [4,5]. XDR-TB is resistant to RIF, INH, a fluoroquinolone, and one of three second-line injectable drugs (amikacin, kanamycin, or capreomycin), while TDR-TB strains exhibit resistance to nearly all known first- and second-line drugs. These challenges highlight the pressing need for new, more effective therapies that target novel biological pathways and involve innovative chemical scaffolds.
One promising therapeutic target is the essential ClpC1–ClpP1–ClpP2 complex of Mtb [6] which plays a crucial role in the bacterium’s viability [7,8]. The functional ATPase-protease complex is formed by an association of a hexameric, ring-forming ATPase (six subunits forming a ring shape, which is crucial for the ATPase’s function, enabling the enzyme to bind and hydrolyze ATP), ClpC1, and heptameric barrel-forming peptidases ClpP1 and ClpP2 (two heptameric units each of ClpP1 and ClpP2 assemble to form ClpP, a cylindrical barrel comprising a total of fourteen subunits) [9]. The ClpC1 utilizes the energy of ATP binding and hydrolysis to engage, unfold, and translocate substrates into the catalytic chamber of tetradecameric ClpP, where they are degraded [10]. ClpC1 is a 95 kDa caseinolytic AAA+ unfoldase consisting of an N-terminal domain (NTD) and two nucleotide binding domains (D1 and D2) (Figure 1). The D2 has a long C-terminal sub-domain containing several motifs important for substrate interaction [11]. The NTD has been studied extensively to understand the critical residues for the binding of ClpC1 to several natural cyclopeptides with potent anti-TB activity [12].
Cyclic peptides are polypeptide chains whose N- and C-termini are covalently linked to form a ring structure, conferring exceptional conformational rigidity, membrane permeability, and resistance to proteolytic degradation. Many naturally occurring cyclic peptides are secondary metabolites of soil-dwelling bacterial strains and have been recognized for their potent antimicrobial activities. Among them, Rufomycin (RUF) and Cyclomarin (CYMA) are cyclic peptides isolated from Streptomyces species, while Ecumicin (ECU) is produced by Nonomuraea species [13,14,15]. These natural products act as modulators of the M. tuberculosis ClpC1/P1/P2 proteolytic complex by binding to the N-terminal domain of ClpC1 and perturbs the function of the ClpC1/P1/P2 degradation machinery—an essential process for maintaining protein quality control—ultimately leading to inhibition of M. tuberculosis growth [16,17,18,19,20]. Given the growing resistance to existing small-molecule anti-TB agents, naturally derived cyclic peptides such as RUF, CYMA, and ECU represent promising scaffolds for the development of next-generation therapeutics with distinct mechanisms of action.

Figure 1.
Background information. (a) Schematic representation of the M. tuberculosis ClpC1 protein with three domains, NTD (cyan), D1 (tan), and D2 (orange) [17]. (b) Overall structure of the FL-ClpC from Bacillus subtilis colored in cyan for NTD, tan for D1, and orange for the D2 domain (PDB code: 3J3S [21]). The hexameric form is also shown on the right with each monomer in different colors. (c) Representation of ClpC1-ClpP1-ClpP2 assembly. The hexameric ClpC1 is shown in blue, and heptamers of ClpP1 and ClpP2 are shown in different shades of purple.

To evaluate the functional effects of such macrocyclic peptides on ClpC1, ATPase activity is commonly measured in vitro in the presence of these peptides. Two widely used non-radioactive enzymatic assays for this purpose are the Malachite Green assay and the Pyruvate Kinase (PK)/Lactate Dehydrogenase (LDH) coupled assay (Figure 2a). The Malachite Green assay relies on the colorimetric detection of inorganic phosphate (Pi), which is frequently used to evaluate ATPase or phosphatase activity [22]. In this method, malachite green dye reacts with phosphomolybdate to form a complex that absorbs light at 620 nm [23]. One of the major limitations of this method is the possibility of ATP undergoing spontaneous hydrolysis in the presence of the strong acids required for stabilizing the dye complex. This can lead to the release of Pi during the color development stage, potentially interfering with accurate quantification of Pi produced by enzymatic activity, especially when ATP is present at low micromolar levels [24].
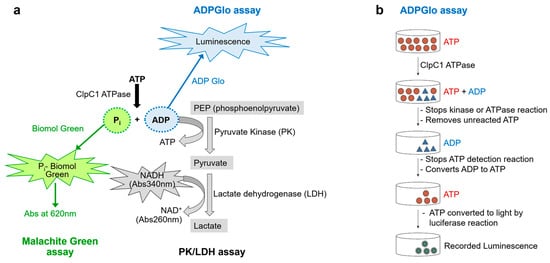
Figure 2.
Three potential non-radioactive enzyme assays to measure ATPase activity. (a) Diagrams of the three assays outlined, the Malachite Green Assay (green), the PK/LDH coupled assay (gray), and the ADP-Glo luminescence (blue) assay. (b) A diagram of the detailed ADP-Glo luminescence assay steps. This diagram has been modified from the manufacturer’s instructions (Promega, Madison, WI, USA).
The PK/LDH assay is a well-established coupled-enzyme method [25], used to indirectly measure ATPase activity by monitoring the formation of ADP. In this system, PK utilizes the ADP generated by the ATPase to convert phosphoenolpyruvate into pyruvate while simultaneously regenerating ATP. Subsequently, LDH reduces the pyruvate to lactate, a reaction that is coupled with the oxidation of NADH to NAD+. The decrease in NADH concentration is monitored spectrophotometrically as a reduction in absorbance at 340 nm. A key advantage of this assay is its continuous nature, which allows for real-time monitoring of enzymatic activity and accurate determination of reaction rates within a single experiment. However, a notable limitation is that the assay’s readout at 340 nm can be affected by absorbance or fluorescence interference from test compounds, particularly those with overlapping spectral properties.
The ADP-Glo™ assay is a luminescence-based method designed to quantify ADP production as an indicator of enzyme activity [26,27]. The assay is compatible with a wide range of ATP and substrate concentrations, making it broadly applicable across enzyme classes. Following the completion of the kinase or ATPase reaction (Figure 2b), the assay proceeds in two steps. First, the ADP-Glo™ Reagent is added to stop the enzymatic reaction and deplete any remaining ATP. Next, a Detection Reagent is introduced to convert the ADP formed during the reaction back into ATP. This newly synthesized ATP is then quantified through a luciferase-luciferin bioluminescent reaction, with the resulting signal measured using a microplate reader. A key advantage of the ADP-Glo™ assay is its excellent signal-to-noise ratio, which ensures a broad dynamic range and reliable detection. This makes it particularly well suited for drug screening and enzyme profiling applications.
Previous studies have used Malachite Green and PK/LDH coupled assays to investigate the effects of RUF, ECU, and CYMA on ClpC1 ATPase activity [28,29,30]. In this study, we employed an optimized ADP-Glo™ assay to reliably measure ClpC1 ATPase activity and assess the modulatory effects of RUF, CYMA, ECU, and ECU analogs under uniform, high-sensitivity conditions. Combined with surface plasmon resonance (SPR) direct binding analysis, antimicrobial assays, and molecular docking, this integrated approach provides a comprehensive view of how these macrocyclic peptides influence the ClpC1/P1/P2 proteolytic complex in Mtb.
2. Materials and Methods
2.1. Preparation and Purification of Full-Length (FL)-ClpC1
The Mtb FL-clpC1 gene (Rv3596c) was cloned into a modified pET-15b vector (Invitrogen, Waltham, MA, US) with a His6-SUMO-tag at the N-terminus. BL21(DE3) cells (Invitrogen, Waltham, MA, US) containing the recombinant plasmid were grown in SuperLB autoinduction media for 24 h at 25 °C with shaking at 220 rpm. The cells were harvested and resuspended in lysis buffer (1 mg/mL lysozyme, 0.025 mg/mL DNase I, 1% Triton X-100, one tablet of protease inhibitor cocktail in buffer A: 50 mM Phosphate, pH 8.0, 500 mM NaCl, 20 mM imidazole, and 4 mM β-mercaptoethanol (β-ME)), and then lysed by emulsification (Emulsiflex C5, Avestin, Ottawa, ON, Canada) The His6-SUMO-tagged protein was purified by two-steps, a 1 mL HisTrap HP column (Cytiva, Marlborough, MA, USA) followed by a HiLoad 16/60 Superdex 200 pg size exclusion chromatography (SEC) column (Cytiva, Marlborough, MA, USA). The HisTrap HP step was run with buffer and with a stepwise gradient (4 and 100%) of elution buffer B (50 mM Phosphate, pH 8.0, 500 mM NaCl, 500 mM imidazole, and 4 mM β-ME), and SEC column was run with a buffer C (50 mM Phosphate, pH 7.5, 250 mM NaCl, 5 mM β-ME, and 5% glycerol) using an AKTA Pure FPLC (Cytiva, Marlborough, MA, USA). The pooled proteins were incubated with SUMO protease (1:100 dilution) at room temperature for 90 min. The digested protein sample was then loaded onto a 10 mL nickel bead gravity column to remove the cleaved His6-SUMO-tags and uncleaved His6-SUMO-FL-ClpC1. The column was then sequentially treated with 0 mM, 5 mM, 10 mM, and 500 mM imidazole containing buffer A. The flow-through containing purified native FL-ClpC1 was collected and concentrated in the storage buffer (50 mM Phosphate, pH 7.5, 250 mM NaCl, 5 mM b-ME, 25 µM ATP, and 5% Glycerol). Purified His6-SUMO-FL-ClpC1 and native FL-ClpC1 were bead frozen as 20 μL aliquots in liquid nitrogen and stored at −80 °C. The protein samples were analyzed by SDS-PAGE at each step, and purity was approximately 95%.
Four smaller constructs of ClpC1, NTD (1–145), NTD–D1 (1–493), D1–D2 (146–848), and D1 (146–493) were also cloned with a His6-SUMO-tag at the N-terminus and purified in a similar way as the FL-ClpC1 described above.
2.2. Circular Dichroism Spectroscopy
FL-ClpC1 and D1D2-ClpC1 were diluted in CD buffer containing 50 mM Tris-HCl, 33 mM KCl, and 0.5 mM dithiothreitol (DTT) (pH 7.5) to final concentrations of 0.05 mg/mL and 0.15 mg/mL, respectively. Sample solutions were each transferred into a 0.1 cm cuvette. The CD measurements were made by scanning wavelengths 190–240 nm at room temperature using a JASCO 815 spectropolarimeter (Jasco, Easton, MD, USA) with 100 nm/min of scanning speed, 0.2 nm data pitch, 2 s Digital Integration Time (D.I.T), and 1 nm band width. The final CD spectrum for each protein was obtained by averaging data from 5 accumulations. CD buffer without proteins was also acquired and used as a control. The buffer-control-subtracted CD data were analyzed on DichroWeb (http://dichroweb.cryst.bbk.ac.uk; accessed on 29 November 2023).
2.3. Mass Photometry
The oligomerization status of the wild-type Mtb FL-ClpC1 was monitored with a TwoMP Mass photometer (Refeyn Ltd., Oxford, UK). A clean glass coverslip (Refeyn Ltd., Oxford, UK) was mounted onto the TwoMP Mass photometer, and a 6-well Gasket (Refeyn Ltd., Oxford, UK) was placed on the top of the coverslip. A calibration curve was obtained by measuring two standard proteins, B-Amylase (BAM, monomer: 56 kDa, dimer: 112 kDa, and tetramer: 224 kDa) and Thyroglobulin (TG, dimer: 669 kDa). A well in the gasket was filled with 16 μL of PBS, pH 7.4, and 4 μL of either BAM or TG was added and quickly mixed well followed by data collection for 60 s using the Acquire MP software version 2023 R1.1. The measurements were made at a final concentration of 10 nM for both BAM and TG. The contrast-to-mass calibration curve had R2 = 0.998 and a mass error of 2.9%. The native Mtb FL-ClpC1 were initially diluted to 20 μM in a 20 mM Tris, pH 8.0, 25 mM KCl, 20 mM MgCl2, 5 mM ATP, and 1 mM DTT buffer and allowed to incubate while the instrument was calibrated with standard proteins. Mtb-FL-ClpC1 samples were monitored at a final concentration of 10 nM in wells of the same gasket and glass slide immediately after calibration in a same manner. Mass photometry movies were analyzed using DiscoverMP (Refeyn Ltd., Oxford, UK) version 2023 R1.2.
2.4. ATPase Assay Optimization, Enzyme Activity, and pH Dependence
The ADP-Glo Kinase Assay Kit (Promega, Madison, WI, USA) was used to measure ATPase activity by quantifying the amount of ADP produced during the ClpC1 ATPase reaction. Both the native ClpC1-FL and His6-SUMO-FL-ClpC1 were prepared as 2× concentrations (0 µM, 0.250 µM, 0.50 µM, 1.0 µM, and 2.0 µM) of the respective final aims for 1× concentrations (0 µM, 0.125 µM, 0.25 µM, 0.5 µM, and 1.0 µM) by dilution of the protein stocks in the ATPase assay buffer containing 50 mM Tris-HCl, pH 7.5, 5 mM MgCl2, 200 mM KCl, and 0.5 mM DTT. An amount of 2× (200 µM) of ATP was prepared. ClpC1 enzyme reactions were assembled in a standard 384-well plate (Greiner Bio-One, Kremsmünster, Austria) at room temperature (RT) by mixing 40 µL of 2× ClpC1 enzyme and 40 µL of 2× ATP solutions to produce a final solution with 1× ClpC1 enzyme and 1× ATP. The enzyme reaction was allowed to occur for a total of 1 h. A total of 10 µL each of the assembled samples were taken and distributed to a white 384-well plate (Greiner Bio-One, Kremsmünster, Austria) every 10 min of the enzyme reaction to measure ATPase activity. To this, 10 µL of ADP-Glo Reagent (Promega, Madison, WI, USA) was added and was allowed to incubate for 40 min at RT in order to stop the ATPase reaction and deplete the unconsumed ATP, leaving only newly produced ADP by the enzyme reaction. A total of 20 µL of Kinase Detection Reagent (Promega, Madison, WI, USA) was added to convert the produced ADP to ATP for 40 min. The luminescence intensity was measured by the Victor 3V Plate Reader (PerkinElmer, Shelton, CT, USA). To optimize the ATP concentration and buffer pH, a series of ATP concentrations (7.81–500 µM at 2-fold dilution) and buffers with various pHs (pH 5.0, 5.5, 6.5, 7.5, 8.5, and 10.0) were prepared and incubated with the native FL-ClpC1, and ATPase activities were monitored in the same manner. The obtained luminescence signals were plotted with the tested ATP concentrations and fitted with a single rectangular two-parameter equation, Equation (1), embedded in Sigmaplot v15, where y is the initial velocity, x is the concentration of ATP, and a is the half-maximum ATP concentration. Percent activity (%Act) was calculated using Equation (2), where μneg is the signal from the negative control, which has only ATP, and μpos is the signal from the positive control, which has ClpC1 and ATP but no compounds.
2.5. The Effects of Macrocyclic Peptides on FL-ClpC1 ATPase Activity
All compounds were initially prepared as 10 mM stock in 100% dry DMSO. 50× of a series of increasing concentrations (0–2000 nM final concentration at 2-fold serial dilution) in 100% DMSO were prepared first in a DMSO-resistant 384-well plate (Greiner Bio-One, Kremsmünster, Austria), and 3× compound solutions were prepared in enzyme assay buffer. Solutions of 375 nM (3×) of native FL-ClpC1 and 240 µM (3×) ATP were prepared in the same enzyme assay buffer. A measure of 20 µL of 3× enzyme solution was distributed into a standard 384-well plate, and 20 µL each of varying concentrations of 3× compounds were added and incubated for 10 min at room temperature prior to the addition of ATP. The enzyme reaction was initiated by adding 20 µL of the 3× ATP, which was allowed to have an enzyme reaction for a total of 1 h with activity measurement every 10 min in the same way described above. The percent enzyme activation (%Act) was calculated using Equation (2) followed by fitting the data to the Hill equation (Equation (3)) where yi is the % activation in the presence of the compound, Vmax is the maximum % inhibition, x is the inhibitor concentration, and n is the Hill coefficient to calculate AC50 (half-maximal activation concentration) values.
2.6. Direct Binding Analysis by Surface Plasmon Resonance (SPR)
Direct binding analyses were performed by surface plasmon resonance (SPR) using either a Biacore T200 or Biacore 8K (Cytiva, Marlborough, MA, USA), as previously reported [12]. In short, native FL-ClpC1 protein was immobilized on a CM5 sensor chip using standard amine coupling. All tested compound solutions were initially prepared as 10 mM stocks in 100% DMSO and diluted to a series of increasing concentrations (50× of final concentrations) in 100% DMSO in order to keep final DMSO concentration at 2%. Compound solutions were then prepared in SPR binding buffer consisting of 10 mM Na2HPO4 (pH 7.4), 1.8 mM KH2PO4, 137 mM NaCl, 2.7 mM KCl, 0.5 mM TCEP, and 2% DMSO and injected into both blank surfaces and FL-ClpC1 protein-immobilized surfaces at a 30 μL/min flow rate at 25 °C. All sensorgrams were double-referenced with a blank channel and 2% DMSO concentration, and solvent correction cycles were run before and after compound runs. Control-subtracted data were fitted with a 1:1 Langmuir kinetic model and multi-site kinetic model using Biacore Insight evaluation software v 5.0.18.22102. In addition, the same data were fitted with a steady-state affinity model; the RU values and corresponding concentrations were plotted using the single hyperbolic function (Equation (4)), where y is the response, ymax is the maximum response, x is the compound concentration, and KD is the equilibrium dissociation constant.
2.7. Molecular Docking
Glide [31] from Schrodinger Inc. (Maestro version 14.0.134) [32] was used in this work, to predict the binding of macrocyclic ligand complexes. Constraint-based molecular docking was performed. The crystal structure of ECU bound to NTD of ClpC1 (RCSB PDB 6pbs) [33] was used as a receptor to dock the analogs, saved as a sdf file. The ligand structures were prepared using ICM version 3.9-4 modeling software (MolSoft LLC, San Diego, CA, USA) [34]. The ecumicin ligand was extracted from the PDB entry 6pbs and subsequently modified to generate five ecumicin analogs. Each ligand was energy-minimized in ICM using internal coordinate mechanics, which combines Monte Carlo conformational sampling with gradient-based energy minimization to optimize geometries and relieve steric strain prior to docking. The bound ECU1 monomer (d chain) was used as a template. In the docking calculation, precision was set to “SP-Peptide” and ligand sampling was allowed to be flexible. The docking was restricted to the reference position (of the template) with the allowed tolerance value set at 10 Angstroms. The core comparison method was “Maximum common substructure”. The above protocol was able to reproduce the crystal pose for ECU (the resulting pose showed good agreement with the experimental conformation (RMSD < 2.0 Å) and hence was the method of choice over the other, more computationally extensive, method (Glide XP—extra precision) to dock the ECU analogs. The Glide gscores of the resulting docked conformations are reported, and the docked poses were analyzed using ICM.
3. Results
3.1. His6-SUMO-FL-ClpC1 and Native FL-ClpC1 Purification and Oligomerization Status
The Mtb clpC1 gene (2544 base pairs) was cloned with a His6-SUMO-tag at the N-terminus of the FL-ClpC1, encoding an 848 amino acid residue protein. The SUMO is an 11 Kda sized small ubiquitin-related modifier, and SUMO protease recognizes SUMO structure and cleaves at the C-terminal end of the SUMO without leaving any extra amino acid residues, producing a native FL-ClpC1 protein. Despite the relatively large molecular weight of His6-SUMO-FL-ClpC1 at 107 kDa, its overexpression in E. coli exhibited notable levels of expression and solubility (lanes 2 and 3 in Figure 3a). After two-step (HisTrap affinity-Size Exclusion Chromatography) purification, fractions with over 90% purity were pooled (lanes 6 and 7 in Figure 3a), followed by His6-SUMO tag cleavage. The His6-SUMO-tagged FL-ClpC1 was also collected for enzyme activity comparison. According to the UV280 profile from 16/60 Superdex 200 Size Exclusion chromatography, the His6-SUMO-tagged FL-ClpC1 was eluted out as ~83% monomers and ~10% oligomers in a buffer with no ATP present (Figure 3b).
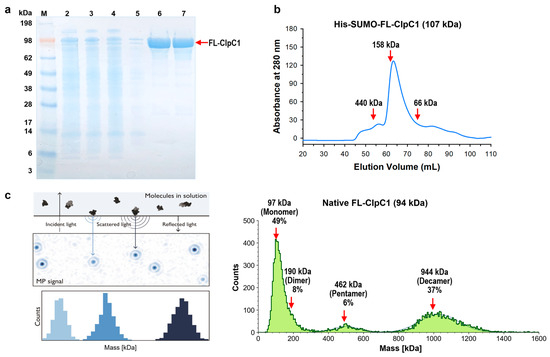
Figure 3.
Purification and oligomer characterization of His6-SUMO-FL-ClpC1 and native FL-ClpC1. (a) SDS-PAGE image of FL-ClpC1 purification. Lane 1 ladder, lane 2 whole lysate, lane 3 soluble supernatant, lane 4 flow-through, lane 5 unbound wash, lanes 6–7 fractions from 16/60 Superdex 200. FL-ClpC1 was highly expressed and was soluble, as indicated by the large FL-ClpC1 band in both the whole lysate and soluble supernatant, respectively. FL-ClpC1 was purified at relatively high purity (~90%). (b) UV280 profile from 16/60 Superdex 200 (Column volume = 120 mL). His6-SUMO-tagged FL-ClpC1 eluted out primarily (~83%) as a monomer. A minority (~10%) eluted out as oligomers. (c) Oligomerization profile measured by Refeyn TwoMP Mass Photometry (MP). The principles of MP on the left panel (Refeyn Ltd., Oxford, UK), and native FL-ClpC1 MP results are shown on the right panel. The MP shows that roughly half of the FL-ClpC1 population is present as a monomer. The other half is present mainly as pentamers (6%) or decamers (37%). Figure courtesy of Refeyn (https://www.refeyn.com/post/how-does-mass-photometry-work, accessed on 21 October 2025).
Recent studies have shown that ClpC1 protein exhibits various oligomerization states, two of which are the active and functional hexameric form and the inactive decamers [28,35]. Decamers are formed by two pentamers stacked head-to-head via M-domain. We investigated oligomerization status with the Mass Photometry (MP) technique. The Refeyn TwoMP Mass photometer can measure single molecules in solution in their native state, acquiring molecular weight distribution and relative concentrations of all species in a sample using scattered light and reflected light. The purified native FL-ClpC1 existed as three species, 49% monomers, 6% pentamers, and 37% decamers in the buffer containing 5 mM ATP (Figure 3c). Dimers were also observed as a tail of the monomers, although they were not prominent. Native FL-ClpC1 seems to be able to form oligomers in the presence of 5 mM ATP, but it remains in inactive forms in the absence of its substrate, since hexamers are not detected.
3.2. ATPase Activity Comparison of His6-SUMO-FL-ClpC1 and Native FL-ClpC1
The ClpC1 ATPase breaks down ATP to free phosphate and ADP (Figure 2a), and hence we optimized highly sensitive luminescence assay detecting ADP formation by ClpC1 using a commercially available ADP-Glo kinase assay kit. First, we tested a series of increasing concentrations of ATP from 7.8 µM to 500 µM to find the best ATP concentration for investigating ClpC1 ATPase activity using 1 µM ClpC1. The half maximum ATP concentration was determined to be 125.4 ± 7.4 µM (Figure 4a), and slightly lower (80 µM) ATP concentration was selected for ClpC1 enzyme assay. Second, the pH effect on ClpC1 ATPase activity was determined by testing various pHs from pH 5.0 to pH 10.0. The ATPase activity of ClpC1 was shown higher in acidic conditions compared to basic conditions with the most active at pH 7.5 (Figure 4b). Therefore, ClpC1 enzyme assay buffer was finalized with 50 mM Tris-HCl (pH 7.5), 5 mM MgCl2, 200 mM KCl, 80 µM ATP, and 0.5 mM DTT.

Figure 4.
ATPase assay optimization. (a) Dose–response curve of ATP with a fixed concentration of native FL-ClpC1 fitted with Equation 1. (b) The pH profile for the native FL-ClpC1 enzyme activity from pH 5.0 to pH 10.0. ATPase activity (%) was derived with Equation 2. Enzyme activities were compared with a series of increasing concentrations of His6-SUMO-FL-ClpC1 (c) and native FL-ClpC1 (d). A linear regression was applied to the plots. Data are presented as mean ± SD (n = 3). Statistical significance was determined using Welch’s t-test, comparing each condition to the control; * p < 0.05, ** p < 0.01, and *** p < 0.001.
Enzyme activity of the two forms of FL-ClpC1 proteins, native FL-ClpC1 and His6-SUMO-FL-ClpC1, were compared with an optimized assay buffer to see whether the N-terminal His6-SUMO-tag affects enzyme activity of the ClpC1. Both native FL-ClpC1 and His6-SUMO-FL-ClpC1 were investigated in a series of concentrations (0–1.0 µM at 2-fold dilution). The native ClpC1 enzyme possessed 4–5-fold higher enzyme activity than that of the His6-SUMO-tagged one at all tested concentrations (Figure 4c,d), indicating the His6-SUMO-tag at the N-terminus does interfere with its enzyme activity. The results from the enzyme concentration of 1 µM were not presented in the graph due to excessive luminescence signals produced by native FL-ClpC1. We optimized enzyme concentration at lower concentrations that can still produce remarkable signal to noise (S/N) ratio, while remaining within linear ranges so as to accurately measure initial velocity. According to these data, native ClpC1 enzyme concentration can be used between 0.125 and 0.25 µM.
3.3. The Full-Length Is Required for the Full ATPase Activity of ClpC1
Mtb ClpC1 contains two ATP binding sites; one is in D1 and the other in D2 domains (Figure 1a,b). We were curious to find out which domains are required for ATPase activity of ClpC1, and hence various lengths of ClpC1 constructs were cloned and purified (Figure 5a). In addition to domains, C-terminal His6-tagged ClpC1 (1-842) was also prepared to see whether His6-tag at the C-terminus affects its enzyme activity or not since N-terminal His6-SUMO-tag significantly reduced ATPase activity. Interestingly, C-terminal His6-tag did not interfere with ATPase activity of ClpC1, possessing the exact same enzyme activity as the native ClpC1 (Figure 5b). D1 domain alone and D1-D2 domains together exhibited only 32% and 28% of the native FL-ClpC1, respectively (Figure 5b). NTD and NTD-D1 showed minimal enzyme activity levels below 10%. Oddly, D1 domain alone showed about 2-fold higher ATPase activity than that of NTD-D1, indicating NTD somehow interferes with enzyme activity of D1 domain. The Circular Dichroism (CD) profiles of FL-ClpC1 and D1D2 were similar, suggesting the absence of the NTD does not alter the overall secondary structure of D1D2 (Figure 5c). Taken together, native N-terminus is important for the ATPase activity of ClpC1. It is speculated that the NTD is important for substrate recognition, and thus the full-length ClpC1 is necessary for the full enzyme activity.
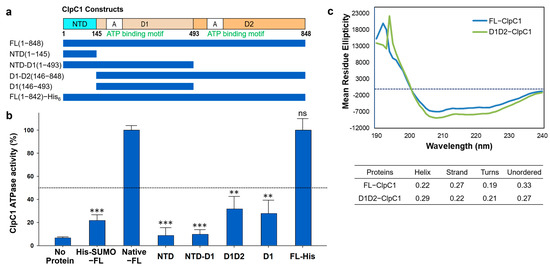
Figure 5.
ATPase activity comparison of different constructs. (a) Diagram of six different constructs of the Mtb ClpC1. (b) ATPase activity comparison of various lengths of the ClpC1. His-SUMO-FL represents a N-terminal His6-SUMO-tag, and FL-His is the His6-tag at the C-terminus with seven residues (KLAAALE) as a linker between ClpC1 (1-842) and His6-tag. Data are presented as mean ± SD (n = 3). Statistical significance was determined using Welch’s t-test, comparing each condition to the control; ns: not significant, ** p < 0.01, and *** p < 0.001. (c) Circular dichroism (CD) spectra of FL-ClpC1 and D1D2-ClpC1. The dashed line indicates a mean residue ellipticity value of 0.
3.4. Effects of Macrocyclic Peptide on Mtb ClpC1 ATPase Activity
Our previous studies have identified two natural products, RUF and ECU, with inhibitory activity against Mtb-infected cells [16]. Both RUF and ECU possess sub-micromolar minimum inhibitory concentration (MIC) values against the Mtb H37Rv strain at 0.02 and 0.16 µM, respectively [13]. Another already-known natural product, CYMA, exhibits an MIC value of 0.094 µM against the same strain. The direct binding affinities (KD) of RUF, ECU, and CYMA, with the FL-ClpC1 have also been determined to be 86.6, 70.9, and 3.1 nM, respectively [17,18]. However, how these natural products affect ClpC1 ATPase activity is still yet to be determined. We have investigated the ATPase activities of the native FL-ClpC1 using 0.125 µM enzyme concentration in the absence and presence of a series of increasing concentrations of these three natural products. Even though all three natural products enhanced the ATPase activity of the ClpC1, the degree of activation varied significantly, from only ~55% (CYMA) to almost 700% (ECU) (Figure 6a–c). The ATPase activity enhancement by RUF was in the middle at ~90%. Half-maximal activation concentration (AC50) values were similar at 0.23–0.38 µM. We further investigated the identical natural product effects with 2-fold higher ClpC1 concentration at 0.25 µM and observed ~2-fold higher activation by ECU, reaching to 1530%, while RUF and CYMA were slightly further enhanced, reaching to 155% and 75%, respectively (Figure 6d). The reported MIC values of ECU, RUF, and CYMA are 0.16, 0.02, and 0.094 µM, respectively [16]. Despite all three cyclic peptides having good MIC values against an Mtb strain, we show that they have drastically different levels of enhancements of ClpC1 ATPase activity.
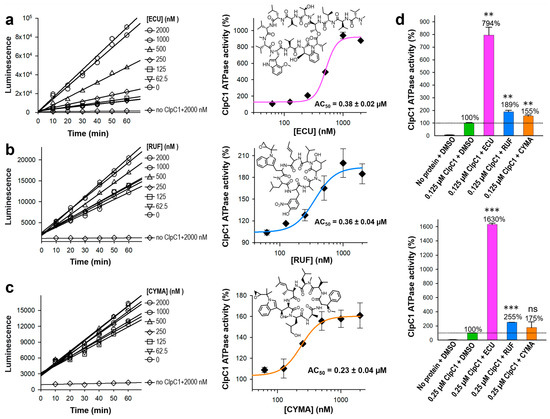
Figure 6.
Effects of the three cyclic peptides on FL-ClpC1 ATPase activity. The native FL-ClpC1 ATPase activities in the presence of a series of increasing concentrations of ECU (a), RUF (b), and CYMA (c). Activity curves up to 60 min and dose–response curves are on the left and on the right panels, respectively. (d) Comparison of ClpC1 ATPase activity at 0.125 µM (upper panel) and 0.25 µM (lower panel) in the presence and absence of three cyclic peptides, ECU, RUF, and CYMA. The dashed line indicates a ClpC1 ATPase activity (%) value of 100%. Data are presented as mean ± SD (n = 3). Statistical significance was determined using Welch’s t-test, comparing each condition to the control; ns: not significant, ** p < 0.01, and *** p < 0.001.
3.5. AC50 Value Comparison of ECU and Its Five Analogs
The ATPase activity of native ClpC1 was initially monitored every 10 min for a total of 1 h. As can be seen in Figure 4c,d and Figure 6, enzyme reactions showed a linear form during 1 h of measurement at both 0.125 µM and 0.25 µM ClpC1 concentrations. Hence, we could safely allow the enzyme reaction to occur for at least 40 min to 1 h and measure the signal without compromising the outcome. Next, we investigated the enzyme activity effect and binding affinities of ECU and its five analogs for comparison. These structures are shown in Figure 7a. All six cyclic peptides were incubated with ClpC1 for 40 min at various cyclic peptide concentrations to allow ATPase enzyme reactions to occur, and enzyme activities were measured at a single time point in order to simplify assay steps and to also save assay reagents. The determined AC50 value of ECU was reproducible at 0.34 ± 0.025 µM by single time point measurement, comparable to 0.38 ± 0.018 µM determined by six time point measurement. ClpC1 ATPase activity enhancement by ECU was highest at ~820%, while three analogs (norECU, deoxyECU, and nordeoxyECU) enhanced similarly at ~650% (Figure 7b,c). Two analogs with slightly shorter tails, OMSA and OMSB [15,36] showed lower activation levels at 470% and 236%, respectively. Analogs of ECU with the same tail length demonstrated comparable AC50 values ranging from 0.19 to 0.38 µM, whereas OMSA and OMSB displayed significantly higher AC50 values at 1.25 µM and 3.05 µM, respectively. This observation implies that the tail length may play a role in determining their activity.
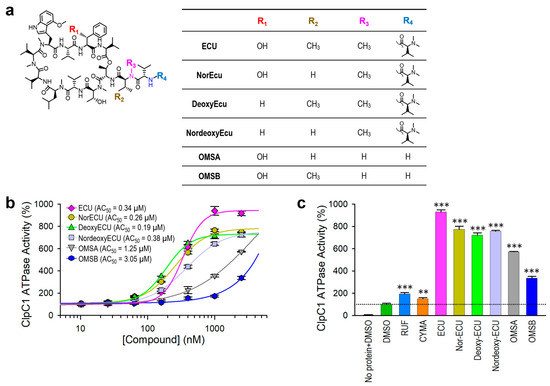
Figure 7.
Compound effect of ECU and five analogs. (a) Structures of ECU and its five analogs. Differences are shown in four locations, R1–R4 highlighted in different colors. (b) Dose–response curves of ClpC1 ATPase activity in the presence of ECU and five analogs. ECU analogs with the same tail length demonstrated comparable AC50 values to ECU, whereas the two analogs (OMSA and OMSB) with shorter tails displayed significantly higher AC50 values. (c) Comparison of the maximum enhancement of the ClpC1 ATPase activity by all tested cyclic peptides. The dashed line indicates a ClpC1 ATPase activity (%) value of 100%. Data are presented as mean ± SD (n = 3). Statistical significance was determined using Welch’s t-test, comparing each condition to the control; ** p < 0.01, and *** p < 0.001.
3.6. Comparison of AC50, KD, and MIC Values
Consistent with the AC50 values, the KD values of ECU and three analogs with the same tail length were comparable, whereas OMSB exhibited the weakest binding affinity at 2.15 µM (Table 1 and Figure 8). Finally, we compared KD and AC50 (with max activation) values with cellular activity by MIC values in Figure 9a. RUF and CYMA have very tight binding to ClpC1 with good MIC values at 0.02 µM and 0.094 µM, respectively. However, their ability to enhance ATPase activity of ClpC1 was low, at below 93%, whereas that of all ECU analogs and ECU was much higher, up to 830%. This suggests that RUF and ECU may have different mechanisms of action. Correlation among these three parameters, MIC, KD, and AC50, were analyzed by plotting them (Figure 9). The overall MIC values correlate KD1 and AC50 values in a log scale (Figure 9b,c). However, each of these three analyses can offer different aspects of the interaction between ClpC1 and its modulators, providing valuable information.

Table 1.
Summary of ATPase activation, binding affinities, and antimicrobial activities of ClpC1 modulators.
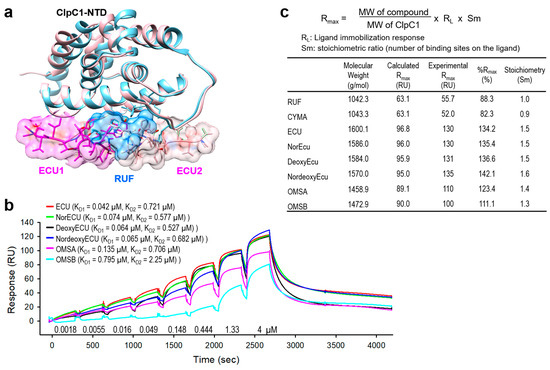
Figure 8.
Comparison of AC50 and direct binding affinity (KD). (a) Overlaid structures of ClpC1-NTD complexed with either RUF (blue) or ECU (pink). One RUF is bound to ClpC1-NTD (PDB code: 6CN8), while two ECUs are bound to ClpC1-NTD (PDB code: 6PBS). (b) Overlaid SPR sensorgrams of ECU and five analogs. Determined KD values are shown next to each cyclic peptide name. (c) Stoichiometry of cyclic peptides according to SPR response.
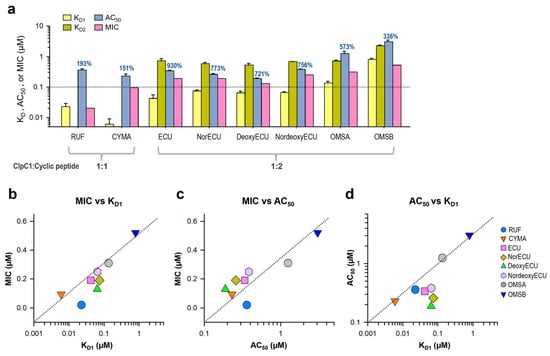
Figure 9.
Correlation among three parameters, MIC, KD, and AC50. (a) Bar graph with AC50, KD, and MIC values of all tested cyclic peptides. The maximum activation of ATPase activity by each cyclic peptide is written on top of each AC50 bar graph. Error bars represent the standard deviations from three measurements. (b) MIC and KD1 values are plotted against each other. Two other pairs, MIC vs. AC50 values (c) and AC50 vs. KD1 values (d) were also plotted. The dashed line is the line of unit slope, where y=x, and is presented to demonstrate correlation.
3.7. Computational Modeling
To shed more light on the structure activity relationship, molecular docking was per-formed using Glide [31] and Glide gscore was selected for final reporting. It is a combination of empirical and force-field-based terms that assess the energy of the docked pose. All ECU analogs were docked to the crystal structure of NTD of ClpC1 bound to the ECU [33]. ECU forms a dimer (Figure 8a) and it is highly likely that ECU1 binds first, followed by ECU2, because ECU1 shows more receptor contacts and hence higher affinity. All five ECU analogs were docked to the ECU1 binding site. Consistent with our experimental finding (AC50 and KD values) ECU showed the lowest gscore of −12.306, while OMSA showed the highest scores of −11.322 (Figure 10). The system failed to dock OMSB because the exceptionally high strain energy prevented successful scoring, and the excessive forces encountered during minimization displaced the ligand outside the defined grid box. The analysis of the receptor binding pocket suggests that the key differences in the interactions stem from the tail region which differs among the analogs, with OMSA and OMSB possessing the shorter tail than others. The hydrophobic surface formed by residues L92 and L96 seems to be playing a key role in binding of the tail region of these cyclic peptide analogs. Most importantly, the residue L96 showed minimal interaction with the analog OMSA, which showed lower activity and a high docking score. The crystal structures of ClpC1-NTD bound to RUF [18] and CYMA [17] show that these ligands, with high affinity but lower ATPase activity (Figure 9a), also do not interact with L96, which further supports that L96 is indeed an important residue for activity.
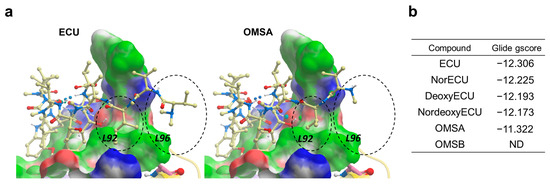
Figure 10.
Molecular docking of ECU and its analogs. (a) Docked conformations of ECU and OMSA. The NTD of ClpC1 is shown in surface representation with the following color code: white—neutral surface, green—hydrophobic surface, red—hydrogen bonding acceptor potential and, blue—hydrogen bonding donor potential. The corresponding hydrophobic surfaces of two residues (L92 and L96) are labeled. The compounds are shown in ball and stick representation (Carbon-light yellow, Nitrogen-blue and oxygen-red). The differences in the interaction of compound’s tail with L92 and L96 residue is highlighted using black dashed circles (b) The Glide gscores for ECU and its five analogs.
4. Discussion
Evaluation of potential drug candidates is an inherently complex, requiring a careful balance of biochemical, biophysical, and microbiological properties to achieve therapeutic efficacy. We established a comprehensive workflow to characterize modulators of Mycobacterium tuberculosis ClpC1 by integrating a highly sensitive luminescence-based ATPase assay, surface plasmon resonance (SPR), antibacterial susceptibility testing (MIC), and molecular docking. This multidimensional approach enabled a systematic investigation of a key therapeutic target in tuberculosis therapy.
Optimizing the luminescence-based ATPase assay was essential for obtaining reliable kinetic and mechanistic insights. Compared to the Malachite Green and PK/LDH coupled assays, the optimized ADP-Glo™ assay demonstrated significantly higher sensitivity, reduced background noise, and compatibility with low enzyme concentrations. These advantages are particularly beneficial for large proteins such as ClpC1 (~95 kDa monomer), where limited yield and stability can hinder assay throughput. The sigmoidal ATP dose–response curve (Figure 4a) confirmed the assay’s ability to capture ATP-dependent enzymatic turnover, while pH and protein concentration optimizations (Figure 4b–d) ensured consistency and reproducibility. These results establish ADP-Glo™ as a robust platform for ClpC1 functional analysis and modulator screening.
Analysis of various ClpC1 constructs revealed that N-terminal His6-SUMO tagging significantly impaired ClpC1 ATPase activity, while C-terminal tagging had no effect. Truncated constructs lacking one or more domains showed markedly reduced activity, underscoring the importance of preserving the full-length protein for functional integrity. ClpC1 consists of three major domains: the N-terminal domain (NTD), which is responsible for recognizing and binding potential substrates, and two AAA+ ATPase domains (D1 and D2), each containing an ATP-binding site. The coordinated function of all three domains appears essential for robust ATP hydrolysis, suggesting that disruption or removal of any domain compromises enzymatic performance.
We evaluated eight cyclic peptides—comprising three primary natural products (RUF, CYMA, ECU) and five ECU analogs—by assessing their effects on ATPase activation, binding affinity (via SPR), and antibacterial efficacy (MIC). This comparative analysis revealed two mechanistically distinct classes of ClpC1 modulators. RUF and CYMA exhibited strong binding affinities (KD = 0.006–0.023 µM) and potent antibacterial activity (MIC90 = 0.02–0.094 µM), but induced only modest ATPase stimulation. In contrast, ECU and its analogs caused robust ATPase hyperactivation (up to 9-fold), while displaying weaker binding affinities (KD = 0.042–0.80 µM) and slightly moderate antibacterial activity (MIC90 = 0.19–0.52 µM). This profile suggests distinct mechanisms: RUF and CYMA may modulate ClpC1 via tight binding and functional modulation, while ECU compounds likely promote ATP depletion through hyperactivation. Importantly, this mechanistic distinction underscores that compounds with comparable MICs can operate through fundamentally different biochemical pathways. Integrating enzymatic (AC50), biophysical (SPR-derived KD), and cellular (MIC) data provides a multidimensional assessment of ClpC1-targeting cyclic peptides. While AC50 and KD values partially correlate with MICs, each assay captures a distinct facet of compound behavior: enzymatic activity reflects functional modulation, SPR quantifies direct binding kinetics and affinities, and MICs indicate cellular efficacy. Together, these orthogonal datasets highlight the necessity of combining multiple assay modalities to accurately interpret drug mechanisms and therapeutic potential.
Molecular docking provided additional structural insights, despite the challenges posed by macrocyclic peptides, such as conformational flexibility and noncanonical residues. Docking analyses suggested plausible binding orientations for ECU analogs on the ClpC1 NTD, consistent with the experimental data. Subtle structural differences—such as hydroxyl or methyl group substitutions—affected hydrogen bonding and hydrophobic interactions within the binding pocket, offering plausible explanations for variations in KD and AC50. While modeling limitations remain, integrating docking with empirical data yielded a coherent structure–function model and informed hypotheses for future compound optimization.
The ATPase assay and SPR measurements were conducted under well-controlled in vitro conditions, offering valuable mechanistic insights into ClpC1 modulation. While these may not fully reflect the complexity of intracellular environments, the observed trends are supported by MIC data, which reflect biological activity in a cellular context. Similarly, the absence of high-resolution structural data (e.g., cryo-EM or X-ray crystallography) introduces some uncertainty in defining precise binding modes, particularly for flexible macrocyclic peptides. Incorporating such structural tools in future studies may further refine the mechanistic interpretations presented here.
Collectively, these findings support the use of both ATPase activation level and AC50 as mechanistically informative parameters for profiling ClpC1 modulators. While AC50 quantifies the concentration required for half-maximal effect, the activation level provides insight into the overall efficacy of enzymatic stimulation. When integrated with SPR binding affinities and MIC values, these metrics form a powerful and complementary framework for elucidating mechanisms of action and guiding rational drug design against M. tuberculosis.
5. Conclusions
This study establishes a sensitive and reliable luminescence-based ATPase assay for evaluating the enzymatic activity of Mycobacterium tuberculosis ClpC1 and its modulation by macrocyclic peptides. We demonstrate that full-length, untagged ClpC1 is essential for optimal function, and that N-terminal tagging significantly impairs enzymatic activity—likely due to disruption of the native substrate-recognition domain. Comparative analysis of natural products and ECU analogs reveals distinct mechanisms of action: RUF and CYMA bind tightly and inhibit Mtb growth with modest ATPase stimulation, whereas ECU and its analogs induce strong ATPase activation. Although AC50, KD, and MIC values display partial correlations, each assay provides unique and complementary insights into compound behavior. Enzymatic activity reflects functional modulation, SPR reveals direct binding affinity, and MIC captures whole-cell efficacy. Together, these orthogonal approaches offer a more accurate and comprehensive assessment of ClpC1-targeting drug candidates. This integrated strategy provides mechanistic clarity and supports rational development of new antitubercular agents.
Author Contributions
Conceptualization, H.L. (Hyun Lee), S.G.F. and S.C.; methodology, R.D., Y.K.,G.S. and T.M.V.; validation, H.L. (Hyun Lee), R.D. and G.S.; formal analysis, R.D., Y.K., G.S. and T.M.V.; investigation, H.L. (Hyun Lee) and S.C.; resources, J.-W.S., H.L. (Hanki Lee), Y.-H.S., J.C., D.-C.O. and S.G.F.; data curation, H.L. (Hyun Lee), R.D., Y.K., S.J., F.N. and T.T.; writing—original draft preparation, R.D., H.L. (Hyun Lee), Y.K., S.J. and T.T.; writing—review and editing, H.L. (Hyun Lee), S.G.F., T.M.V. and S.C.; visualization, H.L. (Hyun Lee); supervision, H.L. (Hyun Lee); project administration, H.L. (Hyun Lee), S.G.F. and S.C.; funding acquisition, S.G.F. and S.C. All authors have read and agreed to the published version of the manuscript.
Funding
This research was funded by the Centers of Excellence for Translational Research grant from the National Institute of Allergy and Infectious Diseases of the National Institutes of Health (U19AI142735). This research was supported in part by a grant of the Korea Health Technology R&D Project through the Korea Health Industry Development Institute (KHIDI), funded by the Ministry of Health and Welfare, Republic of Korea (grant number: HI22C1361). This study was partly supported by the Rural Development Administration in Korea via “Cooperative Research Program for Agriculture Science and Technology Development (Project No. PJ 015640)”.
Institutional Review Board Statement
Not applicable.
Informed Consent Statement
Not applicable.
Data Availability Statement
The original contributions presented in this study are included in the article. Further inquiries can be directed to the corresponding author.
Acknowledgments
We thank ChemAxon for a free academic license of their cheminformatics suite including JChem and JChem for excel for data analysis. Molecular graphics and analyses were performed with UCSF Chimera, developed by the Resource for Biocomputing, Visualization and Informatics at the University of California, San Francisco, with support from NIH P41--GM103311.
Conflicts of Interest
The authors declare no conflicts of interest.
Abbreviations
The following abbreviations are used in this manuscript:
| ClpC1 | Caseinolytic Protein C1 |
| FL | Full-Length |
| NTD | N-Terminal Domain |
| D1/D2 | Nucleotide Binding Domains |
| ECU | Ecumicin |
| RUF | Rufomycin |
| CYMA | Cyclomarin A |
| TB | Tuberculosis |
| Mtb | Mycobacterium tuberculosis |
| WHO | World Health Organization |
| DS | Drug-Sensitive |
| MDR | Multidrug-Resistant |
| XDR | Extensively Drug-Resistant |
| TDR | Totally Drug-Resistant |
| Rif | Rifampicin |
| INH | Isoniazid |
| PZA | Pyrazinamide |
| EMB | Ethambutol |
| CD | Circular Dichroism |
| DTT | dithiothreitol |
| D.I.T. | Digital Integration Time |
| MP | Mass Photometry |
| SEC | Size Exclusion Chromatography |
| SPR | Surface Plasmon Resonance |
| PK | Pyruvate Kinase |
| LDH | Lactate Dehydrogenase |
| Pi | Inorganic Phosphate |
| BAM | B-Amylase |
| TG | Thyroglobulin |
| KD | Binding affinity |
| MIC | Minimum Inhibitory Concentration |
| AC50 | Half-Maximal Activation Concentration |
| S/N | Signal to Noise Ratio |
References
- Barberis, I.; Bragazzi, N.L.; Galluzzo, L.; Martini, M. The history of tuberculosis: From the first historical records to the isolation of Koch’s bacillus. J. Prev. Med. Hyg. 2017, 58, E9–E12. [Google Scholar]
- Chakaya, J.; Petersen, E.; Nantanda, R.; Mungai, B.N.; Migliori, G.B.; Amanullah, F.; Lungu, P.; Ntoumi, F.; Kumarasamy, N.; Maeurer, M.; et al. The WHO Global Tuberculosis 2021 Report—not so good news and turning the tide back to End TB. Int. J. Infect. Dis. 2022, 124, S26–S29. [Google Scholar] [CrossRef] [PubMed]
- Tiwari, D.; Martineau, A.R. Inflammation-mediated tissue damage in pulmonary tuberculosis and host-directed therapeutic strategies. Semin. Immunol. 2023, 65, 101672. [Google Scholar] [CrossRef]
- Cegielski, J.P. Extensively drug-resistant tuberculosis: “there must be some kind of way out of here”. Clin. Infect. Dis. 2010, 50 (Suppl. S3), S195–S200. [Google Scholar] [CrossRef]
- Palomino, J.C.; Martin, A.; Von Groll, A.; Portaels, F. Rapid culture-based methods for drug-resistance detection in Mycobacterium tuberculosis. J. Microbiol. Methods 2008, 75, 161–166. [Google Scholar] [CrossRef]
- Raju, R.M.; Goldberg, A.L.; Rubin, E.J. Bacterial proteolytic complexes as therapeutic targets. Nat. Rev. Drug Discov. 2012, 11, 777–789. [Google Scholar] [CrossRef]
- Sauer, R.T.; Baker, T.A. AAA+ proteases: ATP-fueled machines of protein destruction. Annu. Rev. Biochem. 2011, 80, 587–612. [Google Scholar] [CrossRef]
- Mahmoud, S.A.; Chien, P. Regulated Proteolysis in Bacteria. Annu. Rev. Biochem. 2018, 87, 677–696. [Google Scholar] [CrossRef]
- Taylor, G.; Frommherz, Y.; Katikaridis, P.; Layer, D.; Sinning, I.; Carroni, M.; Weber-Ban, E.; Mogk, A. Antibacterial peptide CyclomarinA creates toxicity by deregulating the Mycobacterium tuberculosis ClpC1-ClpP1P2 protease. J. Biol. Chem. 2022, 298, 102202. [Google Scholar] [CrossRef]
- Gates, S.N.; Martin, A. Stairway to translocation: AAA+ motor structures reveal the mechanisms of ATP-dependent substrate translocation. Protein Sci. 2020, 29, 407–419. [Google Scholar] [CrossRef]
- Bajaj, D.; Batra, J.K. The C-terminus of ClpC1 of Mycobacterium tuberculosis is crucial for its oligomerization and function. PLoS ONE 2012, 7, e51261. [Google Scholar] [CrossRef]
- Kar, N.P.; Sikriwal, D.; Rath, P.; Choudhary, R.K.; Batra, J.K. Mycobacterium tuberculosis ClpC1: Characterization and role of the N-terminal domain in its function. FEBS J. 2008, 275, 6149–6158. [Google Scholar] [CrossRef] [PubMed]
- Gao, W.; Kim, J.Y.; Anderson, J.R.; Akopian, T.; Hong, S.; Jin, Y.Y.; Kandror, O.; Kim, J.-W.; Lee, I.-A.; Lee, S.-Y.; et al. The cyclic peptide ecumicin targeting ClpC1 is active against Mycobacterium tuberculosis in vivo. Antimicrob. Agents Chemother. 2015, 59, 880–889. [Google Scholar] [CrossRef] [PubMed]
- Takita, T.; Naganawa, H.; Maeda, K.; Umezawa, H. The Structures of Ilamycin and Ilamycin B2. J. Antibiot. 1964, 17, 129–131. [Google Scholar]
- Um, S.; Choi, T.J.; Kim, H.; Kim, B.Y.; Kim, S.H.; Lee, S.K.; Oh, K.-B.; Shin, J.; Oh, D.-C. Ohmyungsamycins A and B: Cytotoxic and antimicrobial cyclic peptides produced by Streptomyces sp. from a volcanic island. J. Org. Chem. 2013, 78, 12321–12329. [Google Scholar] [CrossRef]
- Choules, M.P.; Wolf, N.M.; Lee, H.; Anderson, J.R.; Grzelak, E.M.; Wang, Y.; Ma, R.; Gao, W.; McAlpine, J.B.; Jin, Y.-Y.; et al. Rufomycin Targets ClpC1 Proteolysis in Mycobacterium tuberculosis and M. abscessus. Antimicrob. Agents Chemother. 2019, 63, e02204-18. [Google Scholar] [CrossRef]
- Vasudevan, D.; Rao, S.P.S.; Noble, C.G. Structural Basis of Mycobacterial Inhibition by Cyclomarin A. J. Biol. Chem. 2013, 288, 30883–30891. [Google Scholar] [CrossRef]
- Wolf, N.M.; Lee, H.; Choules, M.P.; Pauli, G.F.; Phansalkar, R.; Anderson, J.R.; Gao, W.; Ren, J.; Santarsiero, B.D.; Lee, H.; et al. High-Resolution Structure of ClpC1-Rufomycin and Ligand Binding Studies Provide a Framework to Design and Optimize Anti-Tuberculosis Leads. ACS Infect Dis. 2019, 5, 829–840. [Google Scholar] [CrossRef]
- Weinhäupl, K.; Meuret, L.; Desrat, S.; Roussi, F.; Morellet, N.; Beaupierre, S.; Guillou, C.; van Heijenoort, C.; Abian, O.; Vega, S.; et al. Identification of new ClpC1-NTD binders for Mycobacterium tuberculosis drug development. Sci. Rep. 2025, 15, 4146. [Google Scholar] [CrossRef]
- Makhoba, X.H.; Krysenko, S. Drug Target Validation in Polyamine Metabolism and Drug Discovery Advancements to Combat Tuberculosis. Future Pharmacol. 2025, 5, 32. [Google Scholar] [CrossRef]
- Liu, J.; Mei, Z.; Li, N.; Qi, Y.; Xu, Y.; Shi, Y.; Wang, F.; Lei, J.; Gao, N. Structural dynamics of the MecA-ClpC complex: A type II AAA+ protein unfolding machine. J. Biol. Chem. 2013, 288, 17597–17608. [Google Scholar] [CrossRef] [PubMed]
- Pederick, J.L.; Bruning, J.B. An antimony-phosphomolybdate microassay of ATPase activity through the detection of inorganic phosphate. Anal. Biochem. 2021, 623, 114170. [Google Scholar] [CrossRef] [PubMed]
- Itaya, K.; Ui, M. A new micromethod for the colorimetric determination of inorganic phosphate. Clinica Chimica Acta 1966, 14, 361–366. [Google Scholar] [CrossRef] [PubMed]
- Lanzetta, P.A.; Alvarez, L.J.; Reinach, P.S.; Candia, O.A. An improved assay for nanomole amounts of inorganic phosphate. Anal. Biochem. 1979, 100, 95–97. [Google Scholar] [CrossRef]
- Kornberg, A.; Pricer, W.E. Enzymatic phosphorylation of adenosine and 2,6-diaminopurine riboside. J. Biol. Chem. 1951, 193, 481–495. [Google Scholar] [CrossRef]
- Sanghera, J.; Li, R.; Yan, J. Comparison of the Luminescent ADP-Glo Assay to a Standard Radiometric Assay for Measurement of Protein Kinase Activity. ASSAY Drug Dev. Technol. 2009, 7, 615–622. [Google Scholar] [CrossRef]
- Zegzouti, H.; Zdanovskaia, M.; Hsiao, K.; Goueli, S.A. ADP-Glo: A Bioluminescent and homogeneous ADP monitoring assay for kinases. Assay. Drug Dev. Technol. 2009, 7, 560–572. [Google Scholar] [CrossRef]
- Weinhäupl, K.; Gragera, M.; Bueno-Carrasco, M.T.; Arranz, R.; Krandor, O.; Akopian, T.; Soares, R.; Rubin, E.; Felix, J.; Fraga, H. Structure of the drug target ClpC1 unfoldase in action provides insights on antibiotic mechanism of action. J. Biol. Chem. 2022, 298, 102553. [Google Scholar] [CrossRef]
- Fraga, H.; Rodriguez, B.; Bardera, A.; Cid, C.; Akopian, T.; Kandror, O.; Park, A.; Colmenarejo, G.; Lelievre, J.; Goldberg, A. Development of high throughput screening methods for inhibitors of ClpC1P1P2 from Mycobacteria tuberculosis. Anal. Biochem. 2019, 567, 30–37. [Google Scholar] [CrossRef]
- Hong, J.; Duc, N.M.; Jeong, B.C.; Cho, S.; Shetye, G.; Cao, J.; Lee, H.; Jeong, C.; Lee, H.; Suh, J.-W. Identification of the inhibitory mechanism of ecumicin and rufomycin 4-7 on the proteolytic activity of Mycobacterium tuberculosis ClpC1/ClpP1/ClpP2 complex. Tuberculosis 2023, 138, 102298. [Google Scholar] [CrossRef]
- Friesner, R.A.; Murphy, R.B.; Repasky, M.P.; Frye, L.L.; Greenwood, J.R.; Halgren, T.A.; Sanschagrin, P.C.; Mainz, D.T. Extra Precision Glide: Docking and Scoring Incorporating a Model of Hydrophobic Enclosure for Protein−Ligand Complexes. J. Med. Chem. 2006, 49, 6177–6196. [Google Scholar] [CrossRef]
- Schrödinger, L. Schrödinger Release 2024-2: Maestro; Schrödinger, LLC: New York, NY, USA, 2024. [Google Scholar]
- Wolf, N.M.; Lee, H.; Zagal, D.; Nam, J.W.; Oh, D.C.; Lee, H.; Suh, J.-W.; Pauli, G.F.; Cho, S.; Abad-Zapatero, C. Structure of the N-terminal domain of ClpC1 in complex with the antituberculosis natural product ecumicin reveals unique binding interactions. Acta Cryst. D 2020, 76, 458–471. [Google Scholar] [CrossRef] [PubMed]
- Abagyan, R.; Totrov, M.; Kuznetsov, D. ICM—A new method for protein modeling and design: Applications to docking and structure prediction from the distorted native conformation. J. Comput. Chem. 1994, 15, 488–506. [Google Scholar] [CrossRef]
- Wang, F.; Mei, Z.; Qi, Y.; Yan, C.; Hu, Q.; Wang, J.; Shi, Y. Structure and mechanism of the hexameric MecA-ClpC molecular machine. Nature 2011, 471, 331–335. [Google Scholar] [CrossRef] [PubMed]
- Hur, J.; Jang, J.; Sim, J.; Son, W.S.; Ahn, H.C.; Kim, T.S.; Shin, Y.; Lim, C.; Lee, S.; An, H.; et al. Conformation-Enabled Total Syntheses of Ohmyungsamycins A and B and Structural Revision of Ohmyungsamycin B. Angew. Chem. Int. Ed. Engl. 2018, 57, 3069–3073. [Google Scholar] [CrossRef]


Disclaimer/Publisher’s Note: The statements, opinions and data contained in all publications are solely those of the individual author(s) and contributor(s) and not of MDPI and/or the editor(s). MDPI and/or the editor(s) disclaim responsibility for any injury to people or property resulting from any ideas, methods, instructions or products referred to in the content. |
© 2025 by the authors. Licensee MDPI, Basel, Switzerland. This article is an open access article distributed under the terms and conditions of the Creative Commons Attribution (CC BY) license (https://creativecommons.org/licenses/by/4.0/).