1. Introduction
The acoustic properties of porous sound-absorbing materials are significantly influenced by viscous and thermal losses related to their microstructure [
1]. Specifically, the tortuosity and dynamic viscoelasticity of foam materials play crucial roles in controlling the attenuation characteristics of sound wave propagation [
2,
3]. Recent advancements in research using X-ray computer tomography (CT) have enabled the improved quantification of these microstructures and their link to acoustic properties [
4]. In this study, we incorporate geometric information extracted from CT images into an equivalent model and calculate the SAC using the transfer matrix method.
The foam sound-absorbing materials examined in this study develop a fine cell structure during manufacturing, with variations in porosity, cell size, and the proportion of membranes sealing the framework openings. Electron microscopy and computed tomography (CT) scan images have confirmed the presence of membranes connecting the skeletal structure [
5]. Further, experimental studies [
6,
7,
8] have demonstrated that the presence or absence of these membranes significantly influences the sound absorption coefficient.
Recent research has also explored sound absorbers based on frame or lattice network structures, such as metamaterials and knitted structures [
9,
10,
11]. Specifically, in frame structures composed of rods or cylinders arranged in a grid pattern, viscous losses occurring in the narrow gaps between the rods contribute to sound wave energy absorption [
12,
13]. Moreover, when the perpendicular incidence of sound waves to the longitudinal direction of the rods results in a high sound absorption coefficient owing to the continuous variation in the cross-sectional area of the gaps [
14]. Efforts are underway to enhance the sound absorption performance by employing multi-layered and -stage porous configurations within foam structures [
15]. The polyurethane foam skeleton forms a porous structure similar to these frame structures. This renders the investigation of the influence of its three-dimensional complexity essential, including the presence of membranes, on sound absorption properties.
In contrast to structured frame-based absorbers, foam sound-absorbing materials lack strict geometric regularity in their skeletal shapes, rendering it difficult to create precise geometric models. Polyurethane foam is used in automotive dashboards [
16] and seats [
17]. Currently, research is focusing on recycling polyurethane waste generated by the textile industry [
18]. Cell size and membrane proportion may fluctuate during the manufacturing process [
19,
20]. These fluctuations in the microstructure directly affect the sound absorption properties of foam material. Thus, the accurate numerical predictions of sound absorption properties would greatly enhance material development efficiency.
A previous study [
5] encountered challenges in recognizing membranes owing to the insufficient resolution of micro-CT tomographic images. Consequently, experiments and theoretical estimations were conducted using foam materials without membranes. The effects of the presence and absence of membranes on the sound absorption coefficient have been demonstrated in prior studies through both calculations and experiments [
7]. However, the frame structures analyzed in these studies [
7] comprised considerably larger skeletal elements and voids compared to the foam materials. Therefore, the possibility of theoretically estimating the increase in the sound absorption coefficient owing to membrane presence at the actual cell size of foam sound absorbers must be verified. Previous methods [
5] encountered limitations in imaging membranes within foam skeletons, and threshold selection was challenging due to the trade-off between preserving skeletal detail and minimizing noise. The present study addresses these issues by visualizing membrane structures using nano-CT and suppressing noise through image processing techniques, including morphological opening and closing. Additionally, the relationship between the imaging range and statistical reliability was demonstrated with practical examples, and the effect of membrane presence on the sound absorption performance was quantitatively evaluated.
This study theoretically estimated the sound absorption coefficient of foam materials with membranes using tomographic images obtained via a CT scanner with submicron resolution (hereafter referred to as nano-CT), which can capture membrane structures. To verify the possibility of theoretically estimating the contribution of membranes to the sound absorption coefficient, foam material without membranes was also analyzed as a supplementary validation using nano-CT images. This study represents the initial steps toward a theoretical method for estimating the SACs of foam materials with membranes, achieved by “imaging” the membranes via nano-CT scanning. Thus, the primary objective of this study is to validate this method. Our findings reveal that the presence of membranes enhances the sound absorption performance, particularly in the mid- to high-frequency range. This is supported by both theoretical analyses based on nano-CT images and experimental data. Moreover, by implementing image processing techniques, including opening and closing processes, we improved the accuracy of membrane structure extraction as compared to previous studies [
5].
The cross-sectional images of the foam material were processed through binarization and other techniques to extract the circumference of the foam skeleton cross-section and the cross-sectional area of the voids. Using these parameters, the propagation constant and characteristic impedance within the voids were determined by approximating the foam cross-section as a clearance between two planes. For these calculations, the effective density was adjusted based on the measured tortuosity. Consequently, the normal-incidence sound absorption coefficient, derived using the transfer matrix method was compared with experimental values obtained using a two-microphone impedance tube.
In addition, sensitivity analyses were conducted on the threshold used for image binarization and the correction factor applied to consider the variations in the surface area of the skeletal structure.
The focus of this study is to determine whether it is feasible to theoretically quantify the effects of naturally occurring membranes within foam materials on sound absorption characteristics based on cross-sectional data obtained from nano-CT images. By comparing SACs with and without membranes, we aim to elucidate the specific mechanisms by which membranes affect acoustic properties.
2. Materials and Methods
2.1. Samples Used for Measurement
Foam sound-absorbing material L-25 (Toyo Quality One Kawagoe, Saitama, Japan) was used to prepare samples with a diameter and height of 29 and 10 mm, respectively. To isolate and evaluate the effects of the membrane, additional samples with reduced membrane content were prepared. This was achieved by rubbing the foam material in water several dozen times. For convenience, these samples are referred to as “samples without membrane.” Owing to supplier constraints, the sample thickness was set to 10 mm. The peak absorption frequency is inversely proportional to thickness. Thus, if sound absorption at lower frequencies is required, the thickness should be increased. For example, doubling the thickness will halve the peak absorption frequency.
We should note that the properties of the skeletal structure deteriorate during the membrane removal process, and not all membranes are completely removed.
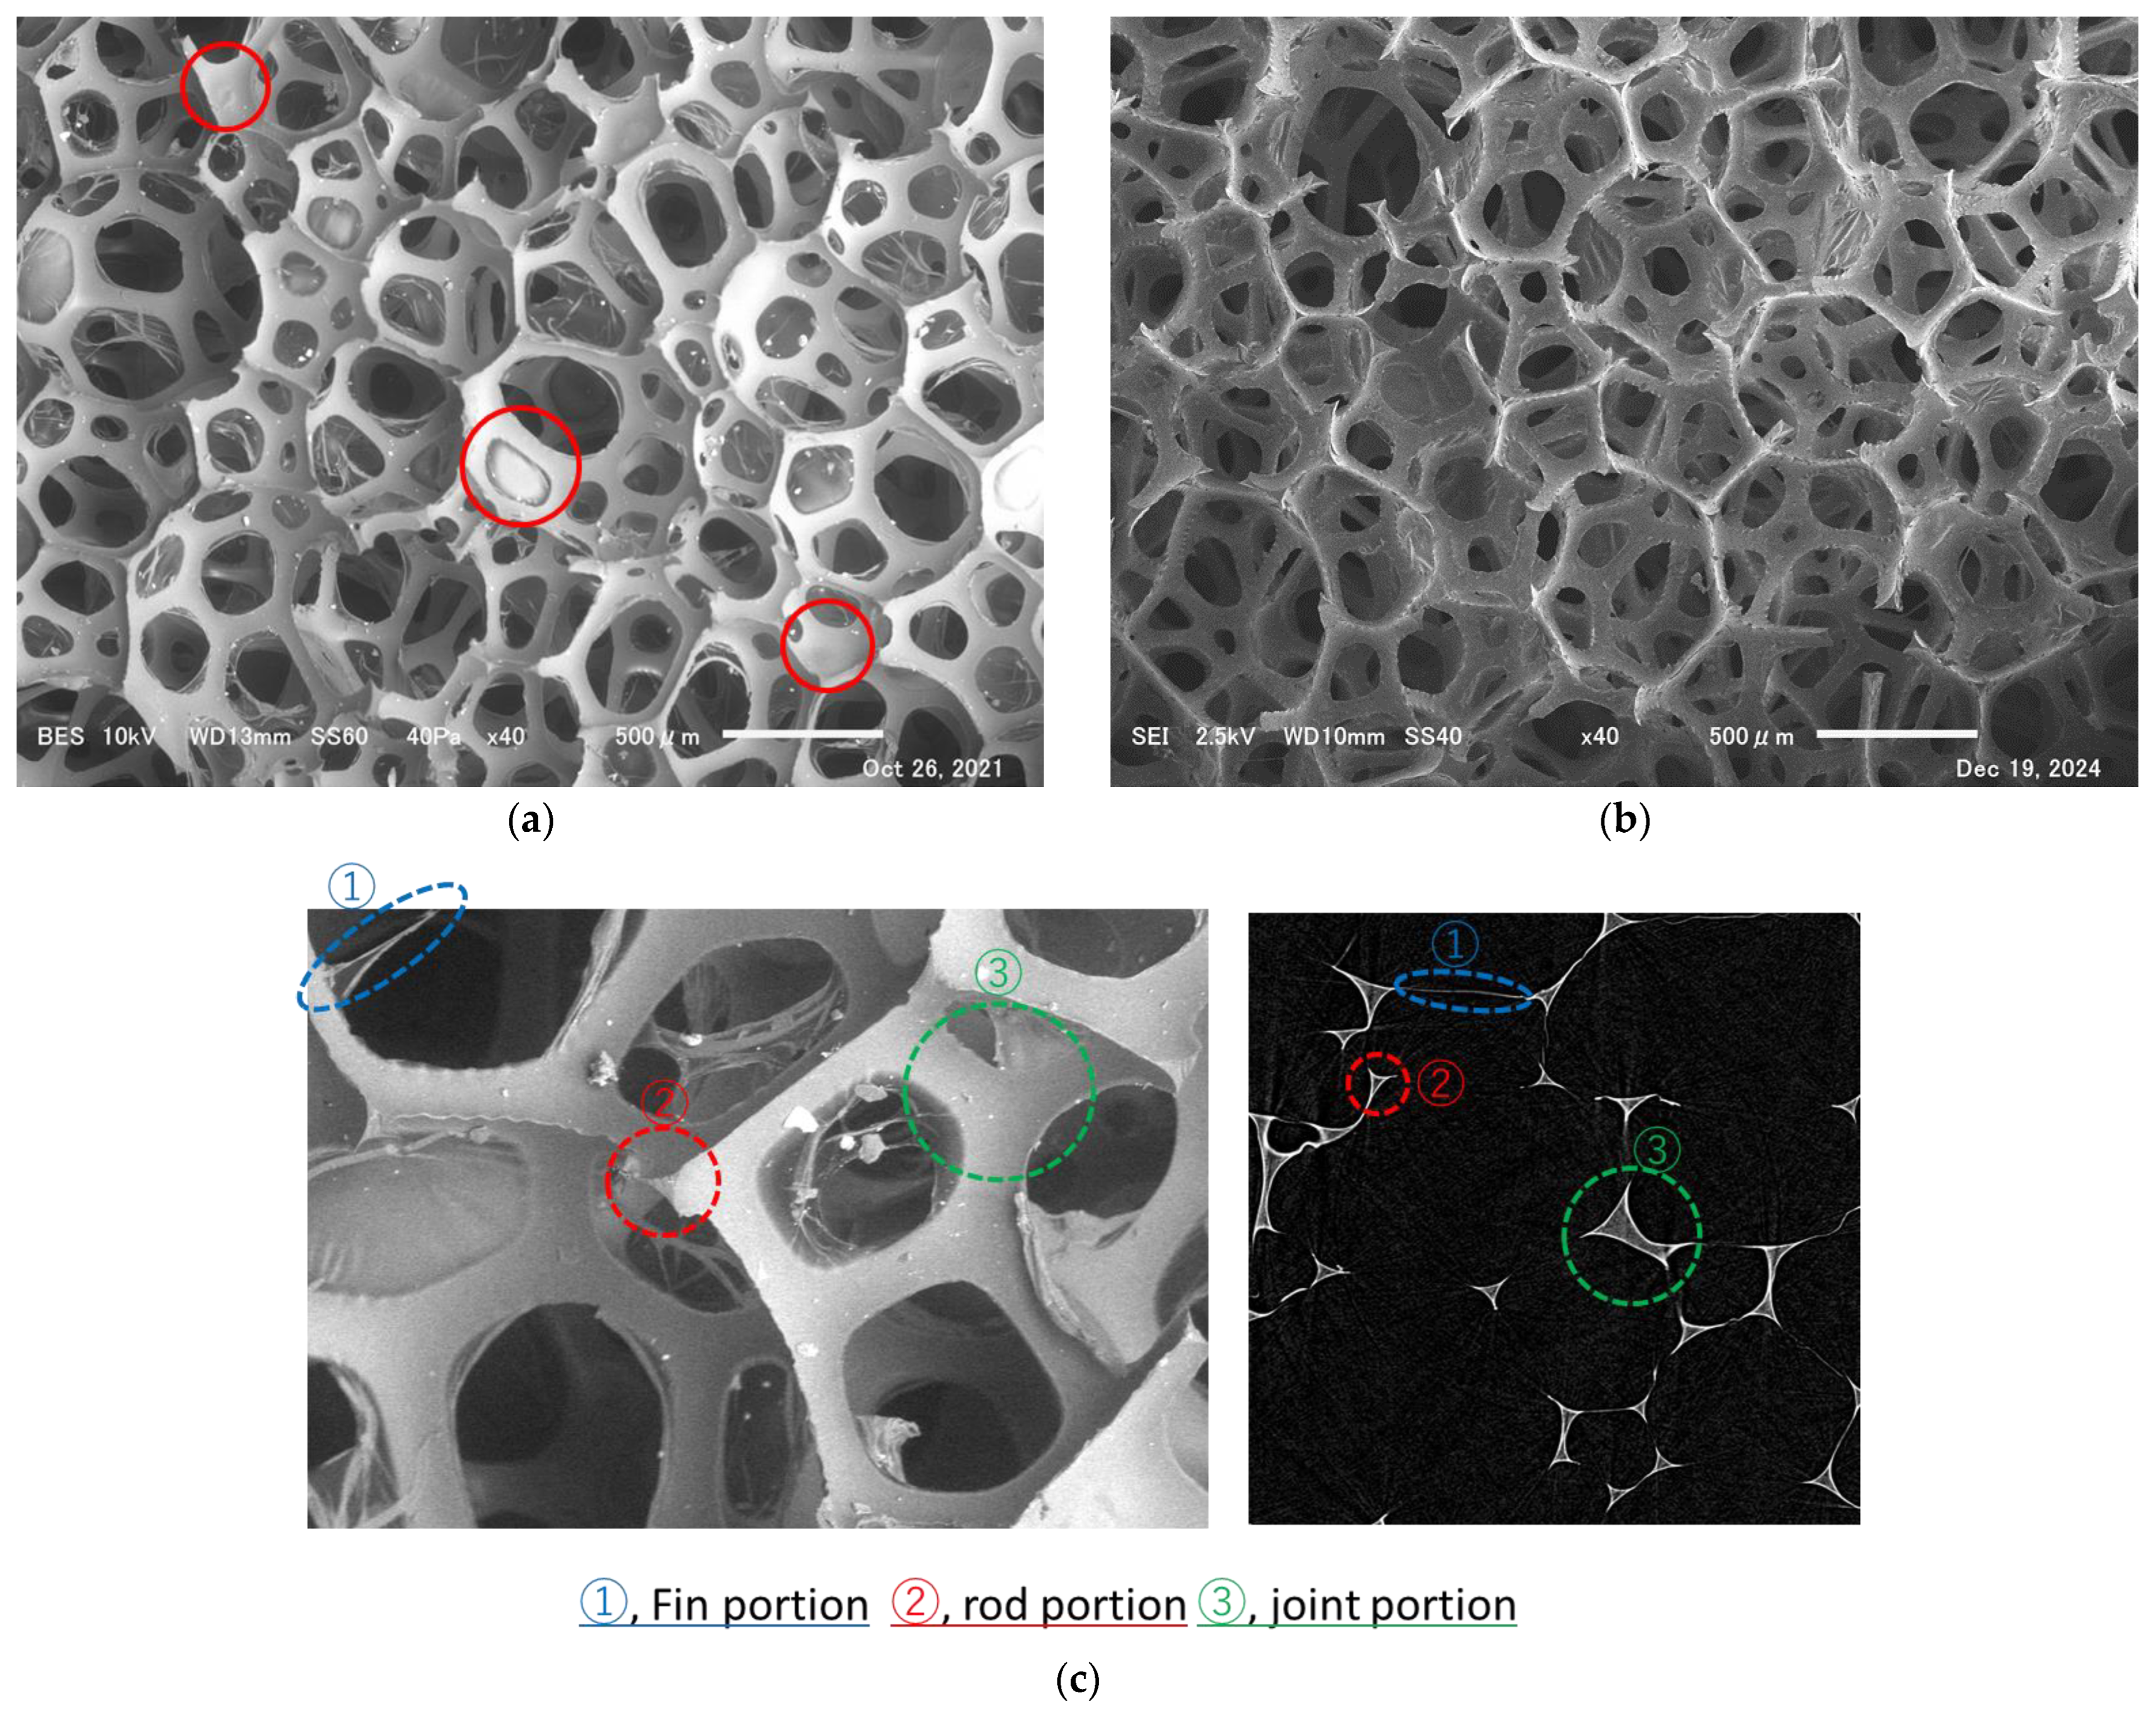
Figure 1a,b present scanning electron microscope (SEM) images of the samples with and without membranes, respectively, captured using an SEM (JEOL JSM-6010PLUS/LA, Tokyo, Japan). The skeleton and membrane are clearly visible [
8]. A comparison of
Figure 1b with
Figure 1a confirms the removal of the membrane. However, owing to the thinness of the membrane [
21], it was difficult to capture using the micro X-ray CT (NIKON MCT225 Metrology CT, Tokyo, Japan) employed in the previous study [
6]. Therefore, this study employed a high-resolution nano X-ray CT (SKYSCAN2214, Bruker Corp., Karlsruhe, Germany) to image the foam material, considering its capability of capturing membrane structures.
Figure 1c illustrates the structure of the CT and SEM images, highlighting the characteristic components of the foam material [
22].
2.2. Equipment for Measuring Sound Absorption Coefficient
A two-microphone acoustic impedance tube (Type 4206, Brüel & Kjær, Nærum, Denmark) was used to measure the normal-incidence sound absorption coefficient. A loudspeaker radiated sinusoidal sound waves, generated by a signal generator with a built-in fast Fourier transform (FFT) analyzer, into the tube. The wavelength of the sound wave is sufficiently smaller than the diameter of the impedance tube, allowing for the treatment of a sound wave as a plane wave. The FFT analyzer measured the transfer function between the sound pressure signals detected by the two microphones attached to the impedance tube. The distance between the microphones is 20 mm. Subsequently, the normal-incidence sound absorption coefficient was calculated using the measured transfer function in accordance with ISO 10534-2 [
23]. The critical frequency for establishing plane waves depends on the inner diameter of the acoustic tube. Herein, a tube with an inner diameter of 29 mm was used, corresponding to an upper measurable frequency limit of 6400 Hz. Measurements were conducted at an ambient temperature of 23 °C. The samples were placed in a sample holder in close contact with the inner wall, ensuring no gaps existed, while preventing compression deformation of the foam material. The incident surface of each sample was positioned perpendicular to the axis of the acoustic tube. The measured sound absorption coefficient is the normal-incidence sound absorption coefficient but not to the actual diffuse incidence sound absorption coefficient. In air, where sound waves follow a straight path without bends or obstructions,
= 1. By contrast, within a foam material, membranes create meandering, branching, and localized obstructions in the path, resulting in tortuosity
> 1.
2.3. Methods and Results of Measuring Tortuosity
When a porous material has a complex internal structure, sound waves propagate along paths longer than the material’s external dimensions. The parameter that quantifies this complexity is tortuosity. To incorporate tortuosity into the theoretical analysis, the tortuosity of the foam material was measured using the ultrasonic method. The measurement approach followed the same procedure as previously reported [
21,
22,
24].
The results indicated that the tortuosity of the foam with a membrane was = 1.95, whereas that of the foam without a membrane was lower, = 1.26, due to its simple structure.
2.4. CT Scan Tomographic Images
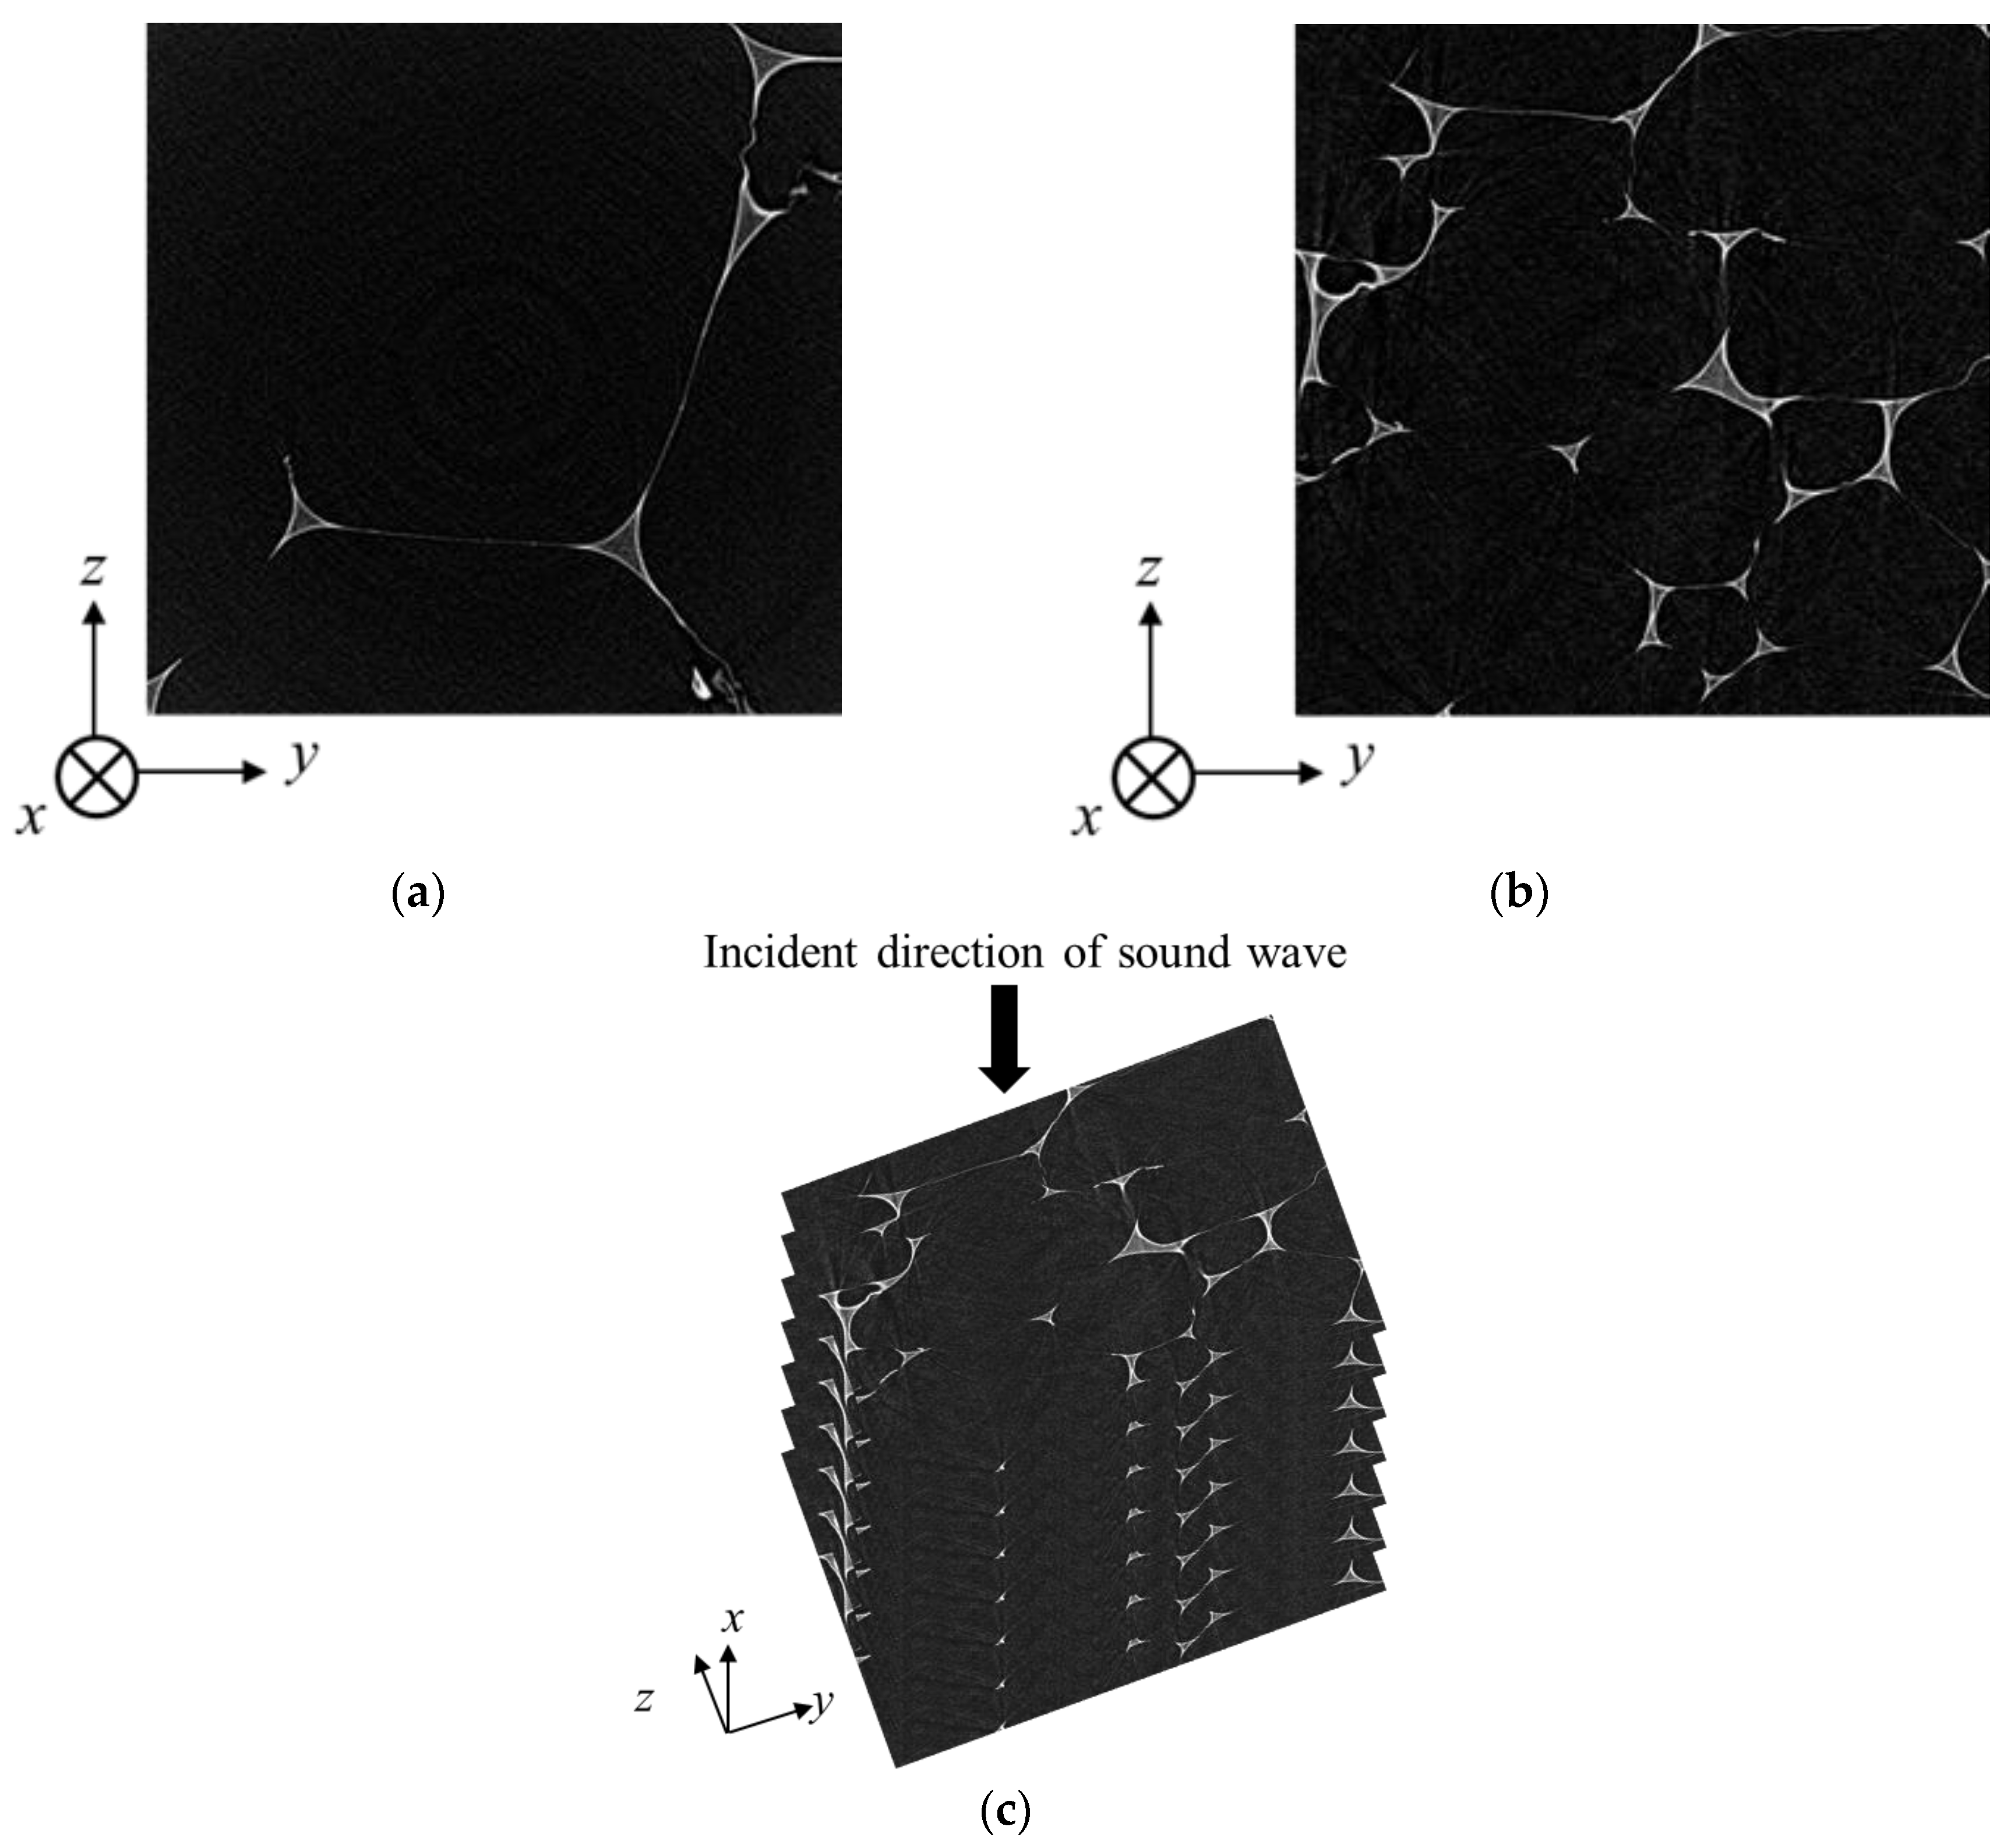
Examples of CT scan tomograms of the foam material with and without a membrane are shown in
Figure 2a,b, respectively. As illustrated in
Figure 2c, the tomograms were captured in the y–z plane, perpendicular to the direction of sound wave incidence (x-direction).
For the foam material with a membrane, the scanned area was a square of approximately 0.67 mm along the x-direction and similarly in the y–z direction. A total of 2536 images were used for the theoretical analysis, with an image pitch along the x-direction of approximately 0.25 µm.
For the foam material without a membrane, the scanned area was a square of approximately 1.2 mm along both the x- and y–z directions. The theoretical analysis included 2486 images, with an image pitch along the x-direction of approximately 0.40 µm.
In the following section, the dark original CT image shown in
Figure 2 was binarized to clearly separate the skeletal and hollow parts.
2.4.1. CT Images and Image Processing
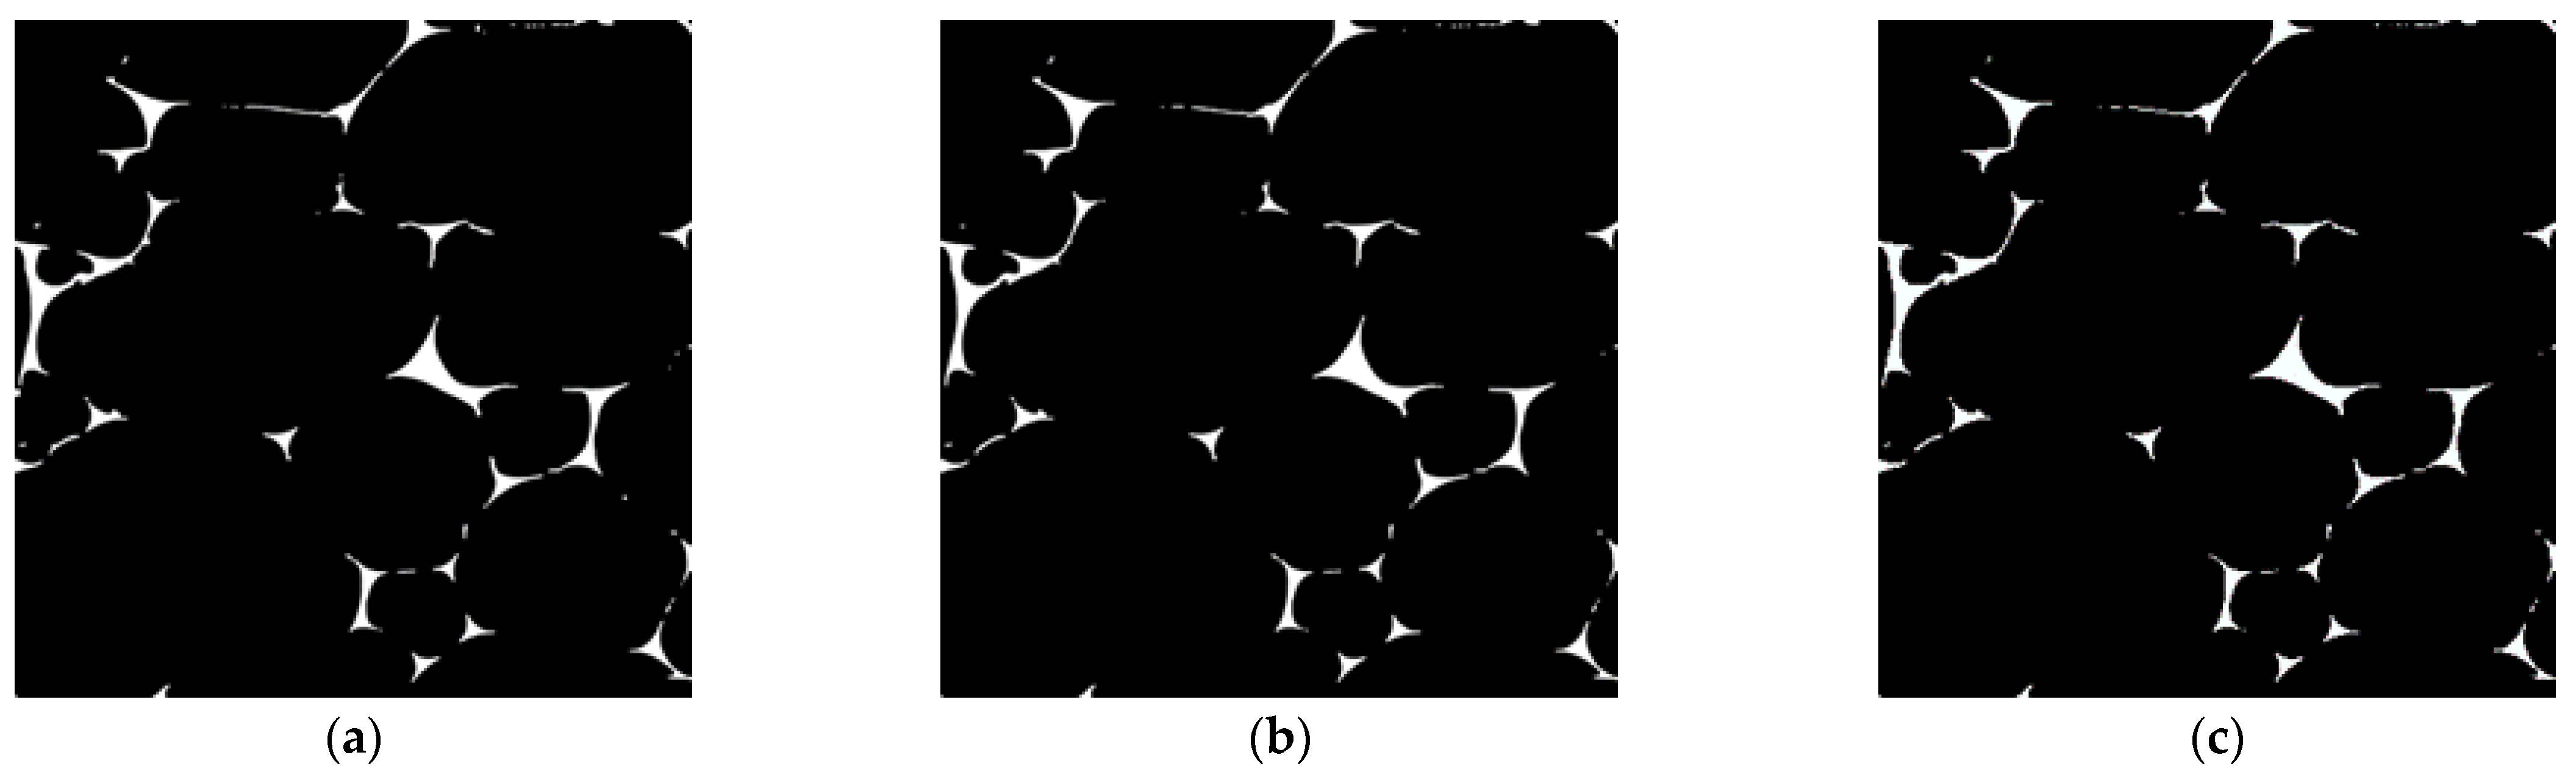
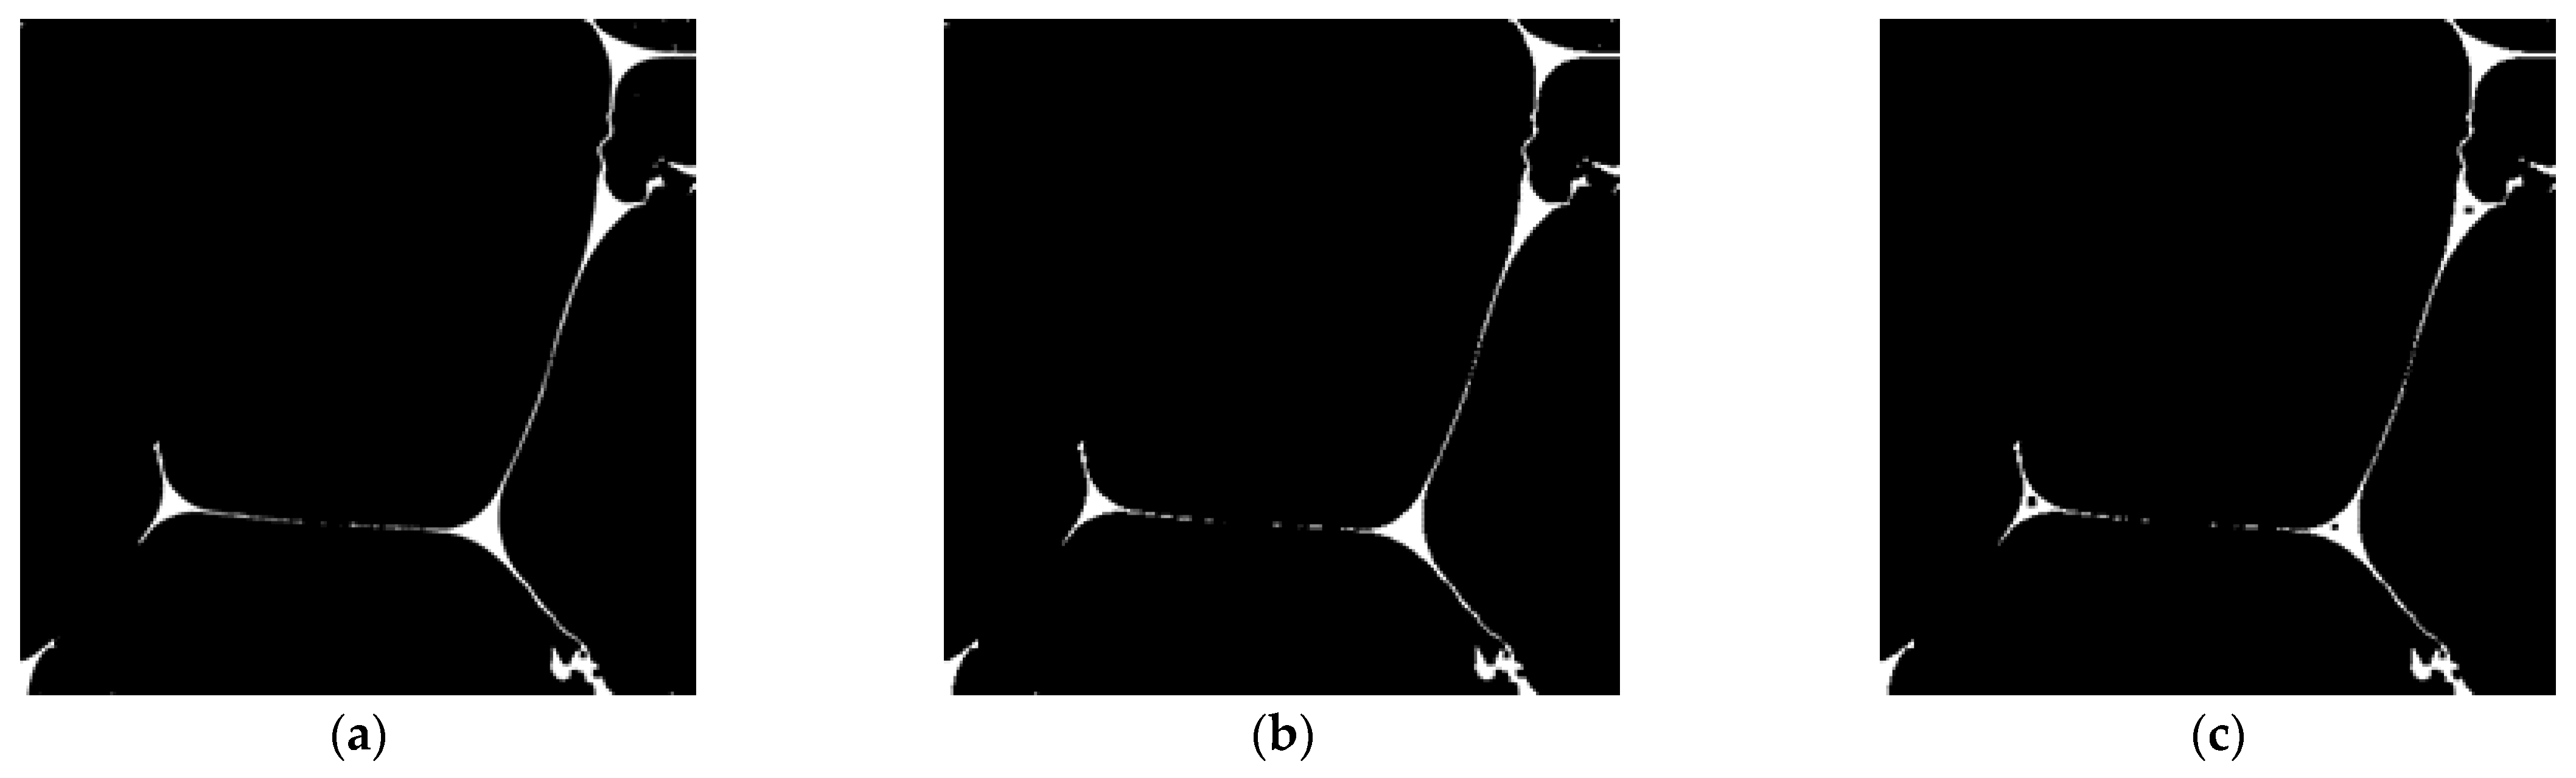
Image binarization was used to determine the cross-sectional area of voids from the CT images. The CT images were 8-bit (256-level) grayscale images, which were converted into black-and-white binarized images using a set threshold as the boundary. Variations in the threshold value could introduce noise into the binarized image or result in the loss of fine structural details visible in the original CT image. Thus, to mitigate these effects, the original and binarized images were compared, and threshold values were carefully selected to balance the retention of fine details with the reduction in noise.
As shown in
Figure 1, the foam material comprises a skeleton and voids. Observations of the skeleton’s cross-section confirm that it is solid. However, during binarization, thick-walled sections, such as joint portions of the foam material, were occasionally misprocessed as cavities. Consequently, a closing operation was applied to the binary images, followed by an opening operation to remove residual noise. The implemented image processing reduces fluctuations in the estimated sound absorption coefficient caused by threshold variation. The kernel sizes for these processes were set as follows. Closing: 26 and 24 for the foams with and without a membrane, respectively. Opening: 3 and 7 for the foams with and without a membrane, respectively.
Figure 3 and
Figure 4 present examples of binarized images following these processing steps for foam materials with and without membranes, respectively. The cross-sectional void area was calculated based on the number of black pixels in these images, following the method described in a previous study [
22].
To further refine the contours of the skeleton and obtain a more accurate circumference measurement, edge extraction [
25] was conducted employing the Canny edge detection method [
26].
This technique can be adapted by adjusting imaging conditions according to the foam material. For materials with smaller skeletal spacing or thicker membranes than those studied here, imaging conditions used for membrane-free structures can be applied. Conversely, materials with larger skeletal spacing or thinner membranes require a wider imaging range and higher CT spatial resolution to ensure accurate visualization.
2.4.2. Approximation of the Void to a Clearance Between Two Planes
The cross-sectional area of the void and the circumference of the skeleton cross-section were approximated as a clearance between two planes based on the binarized and edge-extracted images obtained in
Section 3.2.
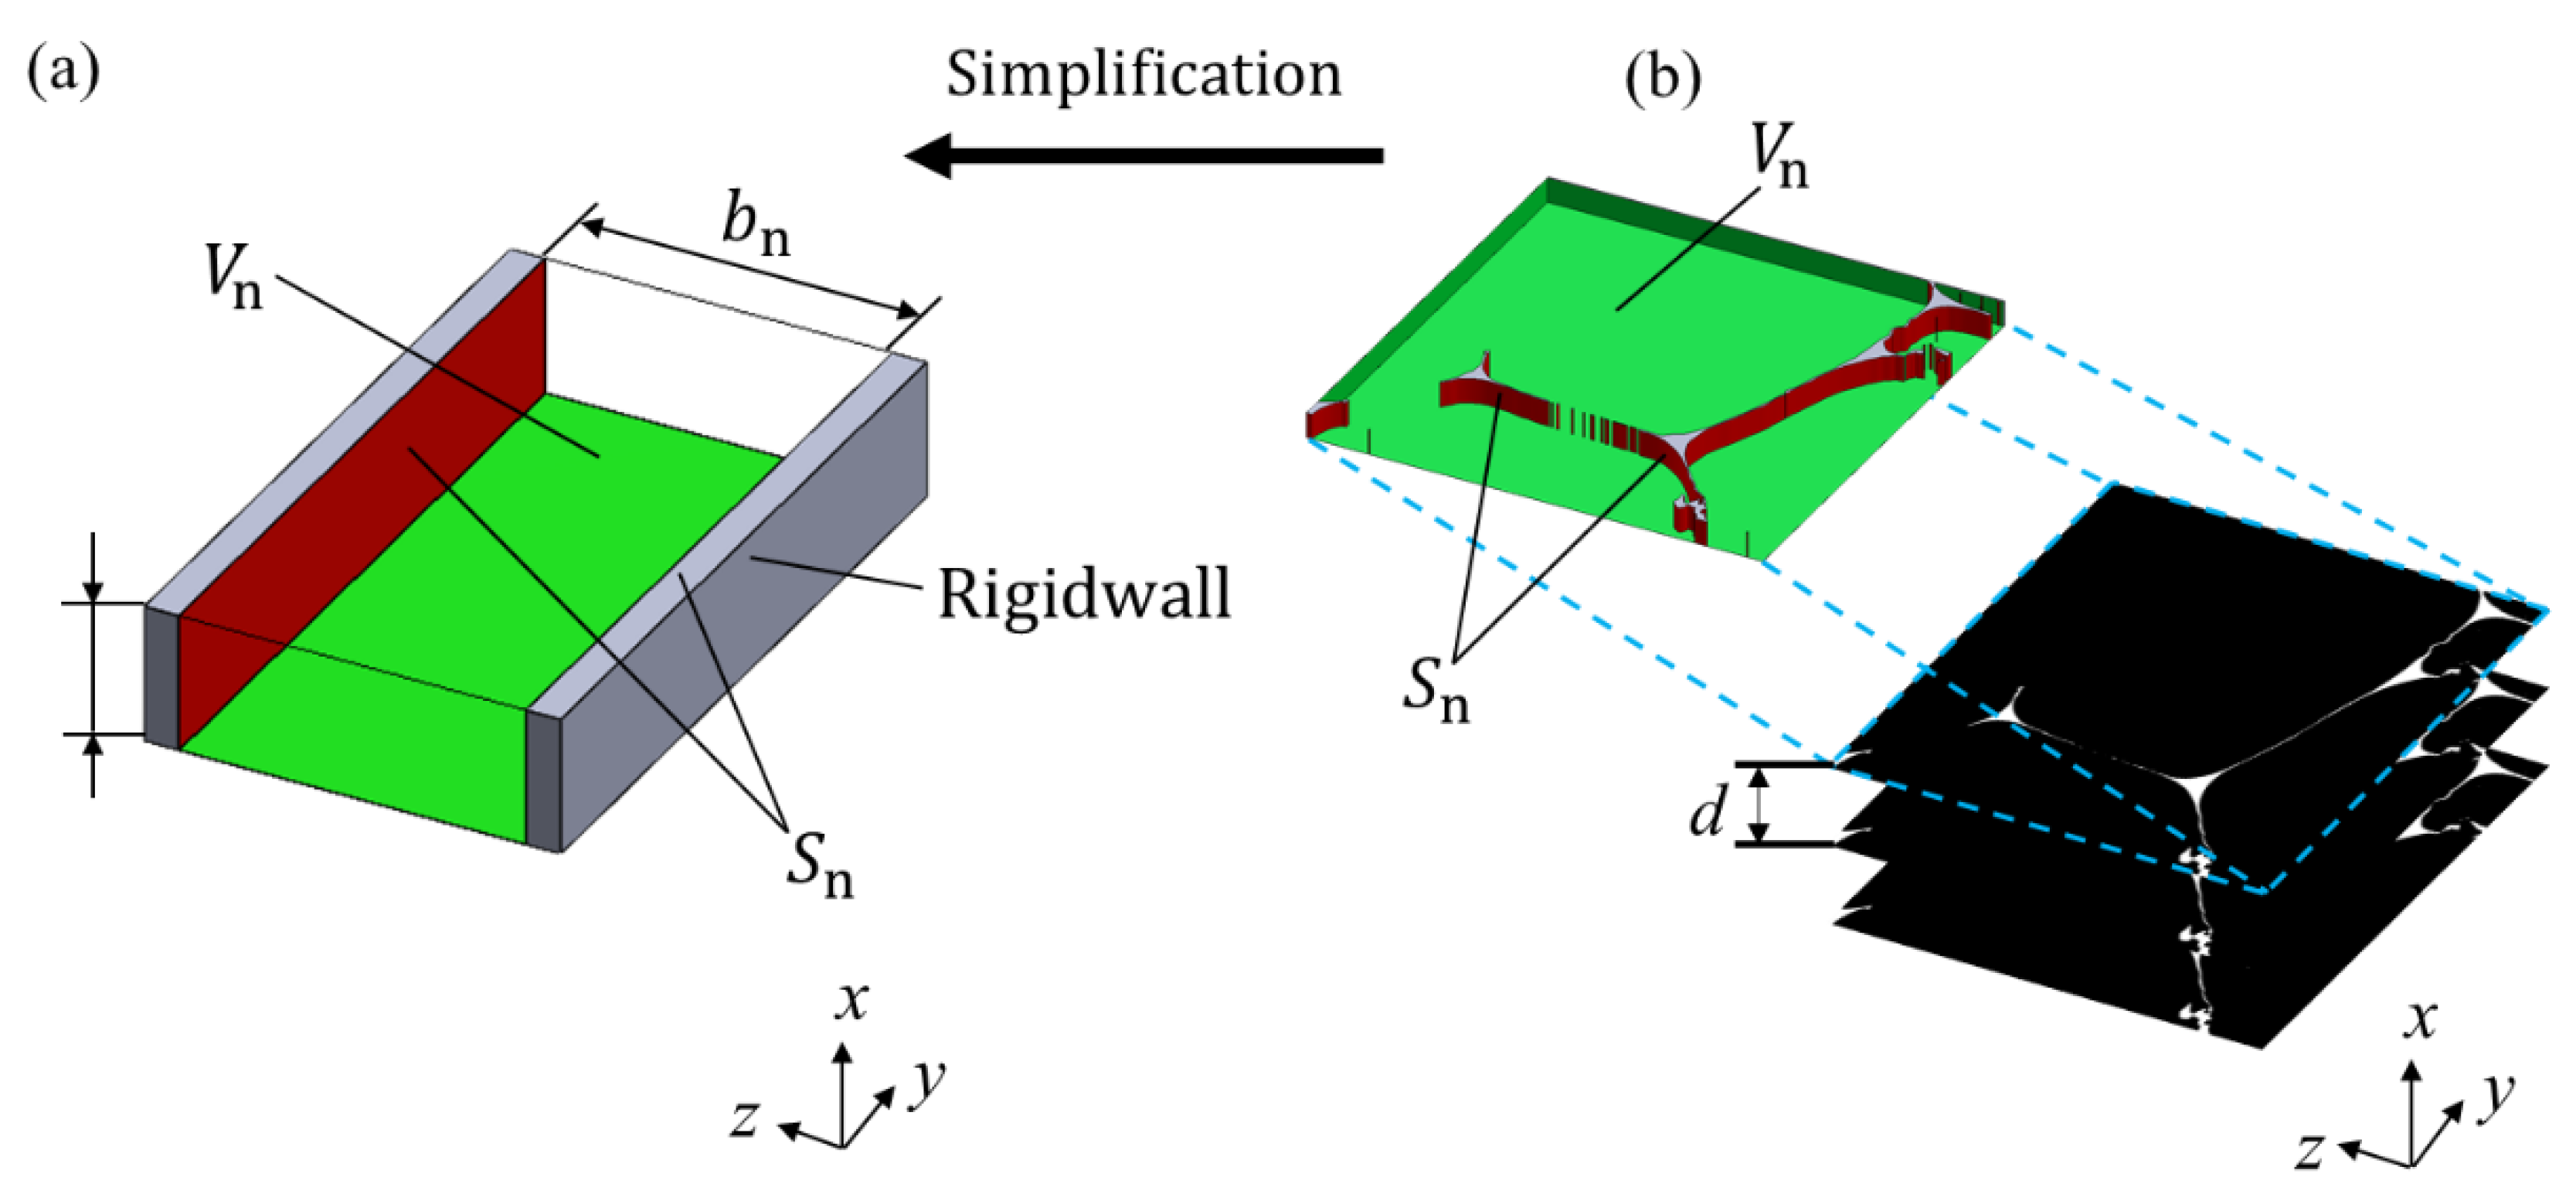
Figure 5a,b illustrate the shape of the foam structure before and after this approximation. The volume of the air gap,
Vn, was determined via the multiplication of the cross-sectional area of the gap by the image pitch
d, as shown in
Figure 5a,b. Similarly, the total surface area of the skeleton
Sn was obtained by multiplying the circumference of the skeleton cross-section by the pitch
d. Using the relationship between the volume
Vn, the surface area
Sn, and Equation (1), the gap thickness (
bn) for each image in
Figure 5a was calculated as follows:
where
F is a correction factor accounting for the true surface area, defined as the ratio of the actual surface area to
Sn. The correction factor
F was determined by employing a method described in a previous study [
23]. For example, if the skeletal cross-section of the foam material is assumed to be enclosed by three circumscribed circles, the correction factor is
F = π/2 ≅ 1.57. However, if the skeleton is approximated as a flat plate inclined at 45° to the x-direction, the correction factor is
F = √2 ≅ 1.414.
2.4.3. Propagation Constants and Characteristic Impedance
The propagation constants and characteristic impedance were obtained by considering the attenuation of sound waves in the air gap, modeled using a two-plane approximation. This study applied the methods developed by Stinson [
27] and Allard [
28], which accounts for tortuosity.
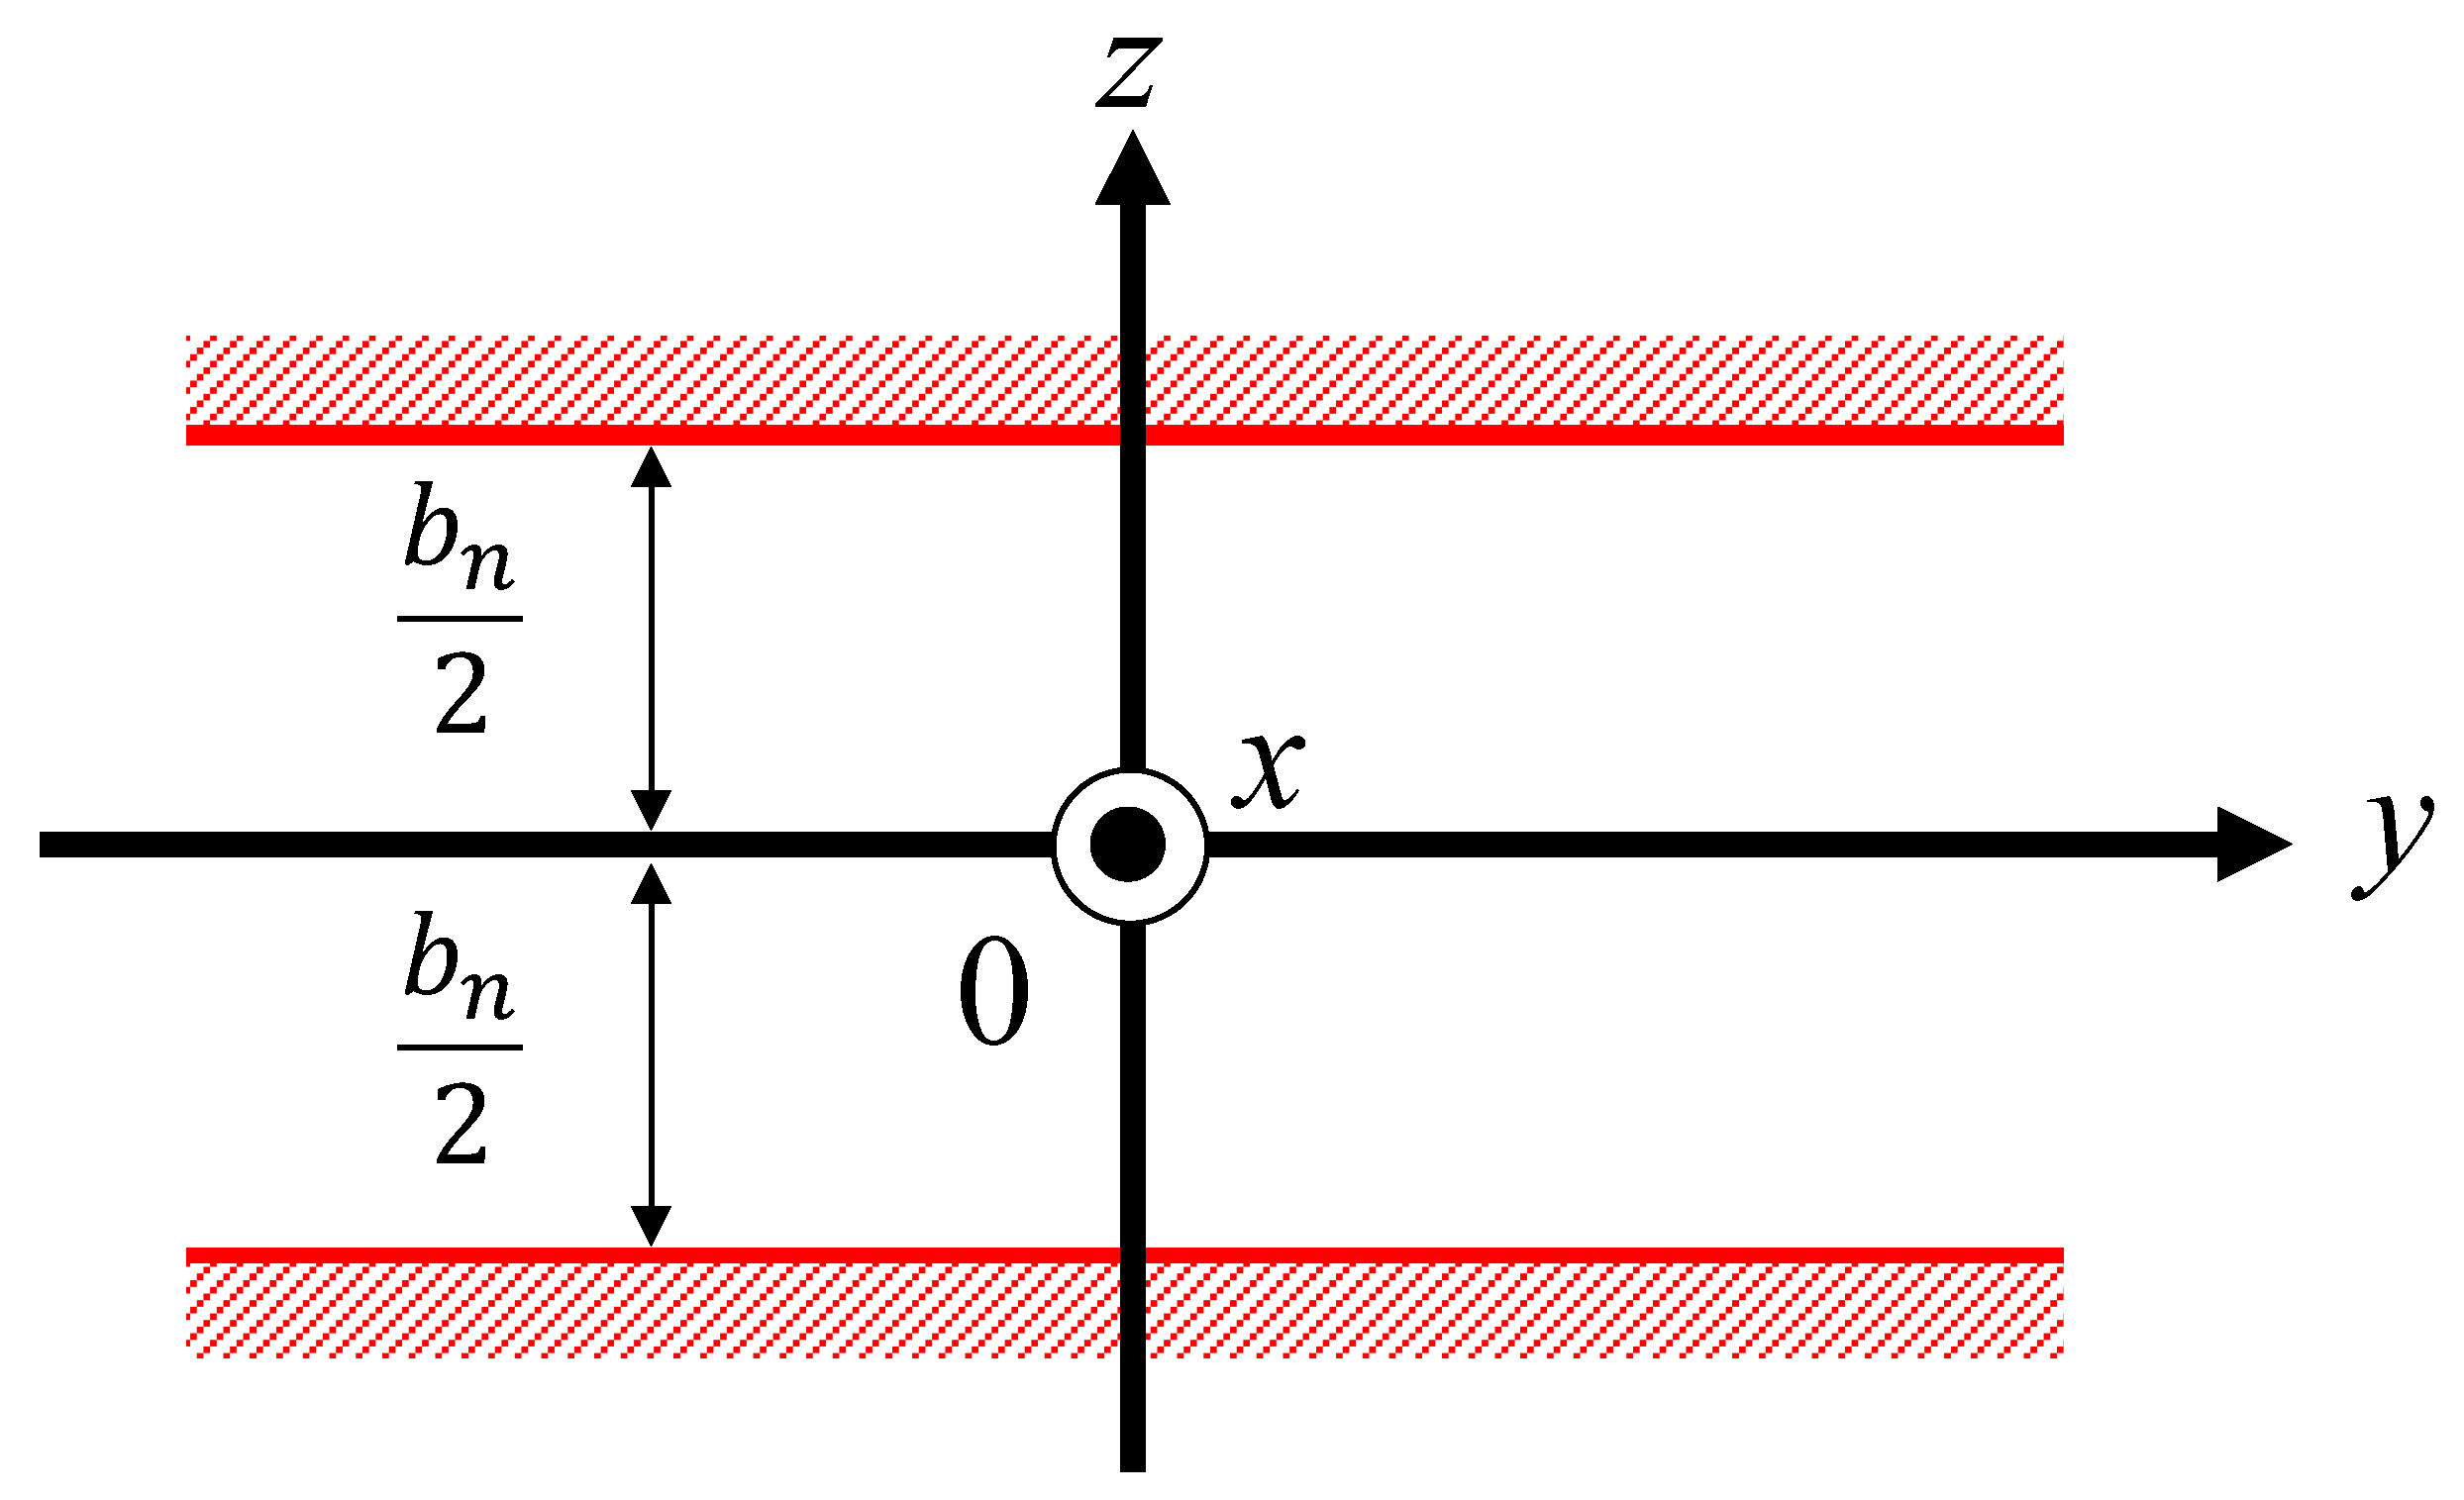
A Cartesian coordinate system was established, as shown in
Figure 6. A three-dimensional analysis was conducted using the Navier–Stokes equations, the equation of state for gasses, the continuity equation, the energy equation, and the dissipative function representing heat transfer. The effective density (
ρs) and compressibility (
Cs) were derived using Equations (2) and (3), respectively. In these equations,
ρ0 denotes the density of air,
λs is the parameter of mediation,
bn is the thickness of the air gap between two planes,
ω is the angular frequency,
η is the viscosity of air,
κ is the specific heat ratio of air,
P0 is the atmospheric pressure, and
Npr is the Prandtl number.
The propagation constant
γ and the characteristic impedance
Zc were then expressed as follows, using the effective density
ρs and compressibility
Cs:
By incorporating the effective density adjusted for tortuosity, the propagation constant and characteristic impedance accounting for tortuosity effects were obtained using the method described in [
28] as follows:
2.4.4. Transfer Matrix and Its Multiplication
The clearance between two planes was analyzed employing the transfer matrix method for sound pressure and volume velocity, based on the one-dimensional wave equation.
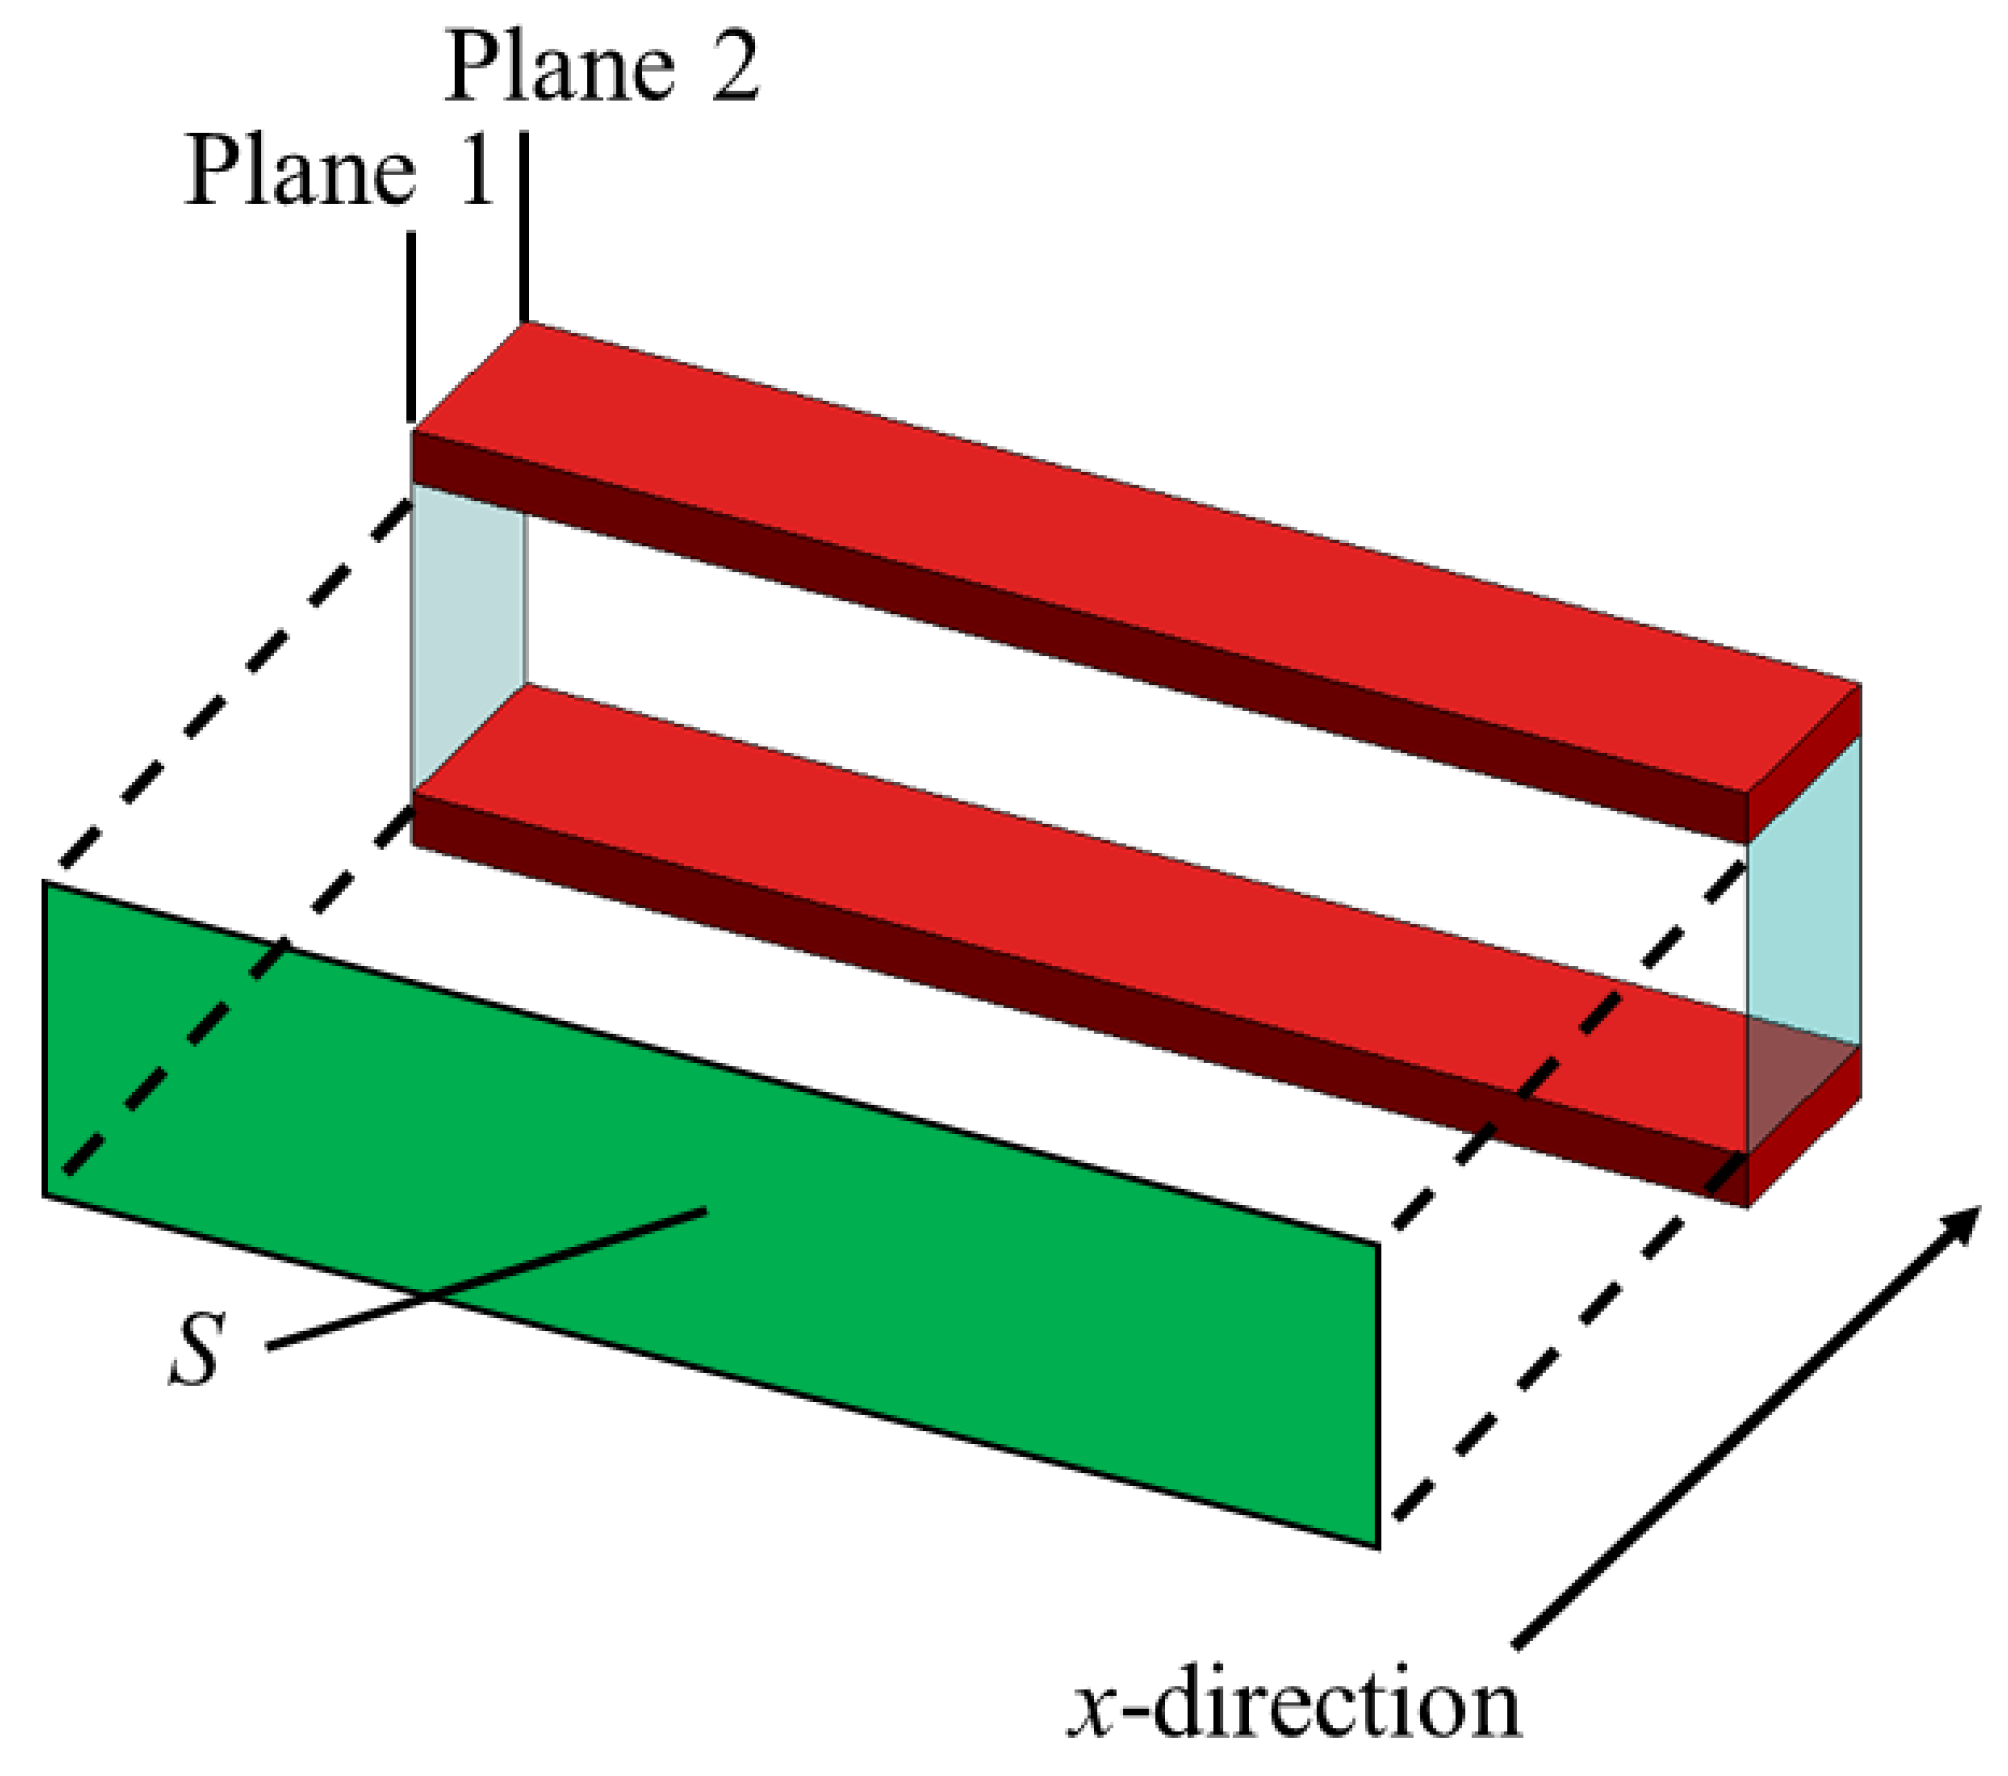
Figure 7 illustrates a schematic of an elemental section along the x-direction for the clearance between two planes, as depicted in
Figure 6.
Using the cross-sectional area
S of the gap, pitch
d per layer, characteristic impedance
Zc, and propagation constant
γ, the transfer matrix
T, and the four-terminal constants
A–D of the acoustic tube element are expressed as follows:
Plane 1 represents the sound wave incidence plane, while Plane 2 represents the transmission plane. If the sound pressure and particle velocity at Plane 1 are
p1 and
u1, respectively, and at Plane 2 are
p2 and
u2, respectively, then the transfer matrix relationship is expressed as follows:
By substituting the characteristic impedance Zc and propagation constant γ obtained for each image into Equation (9), the transfer matrix corresponding to each image can be derived.
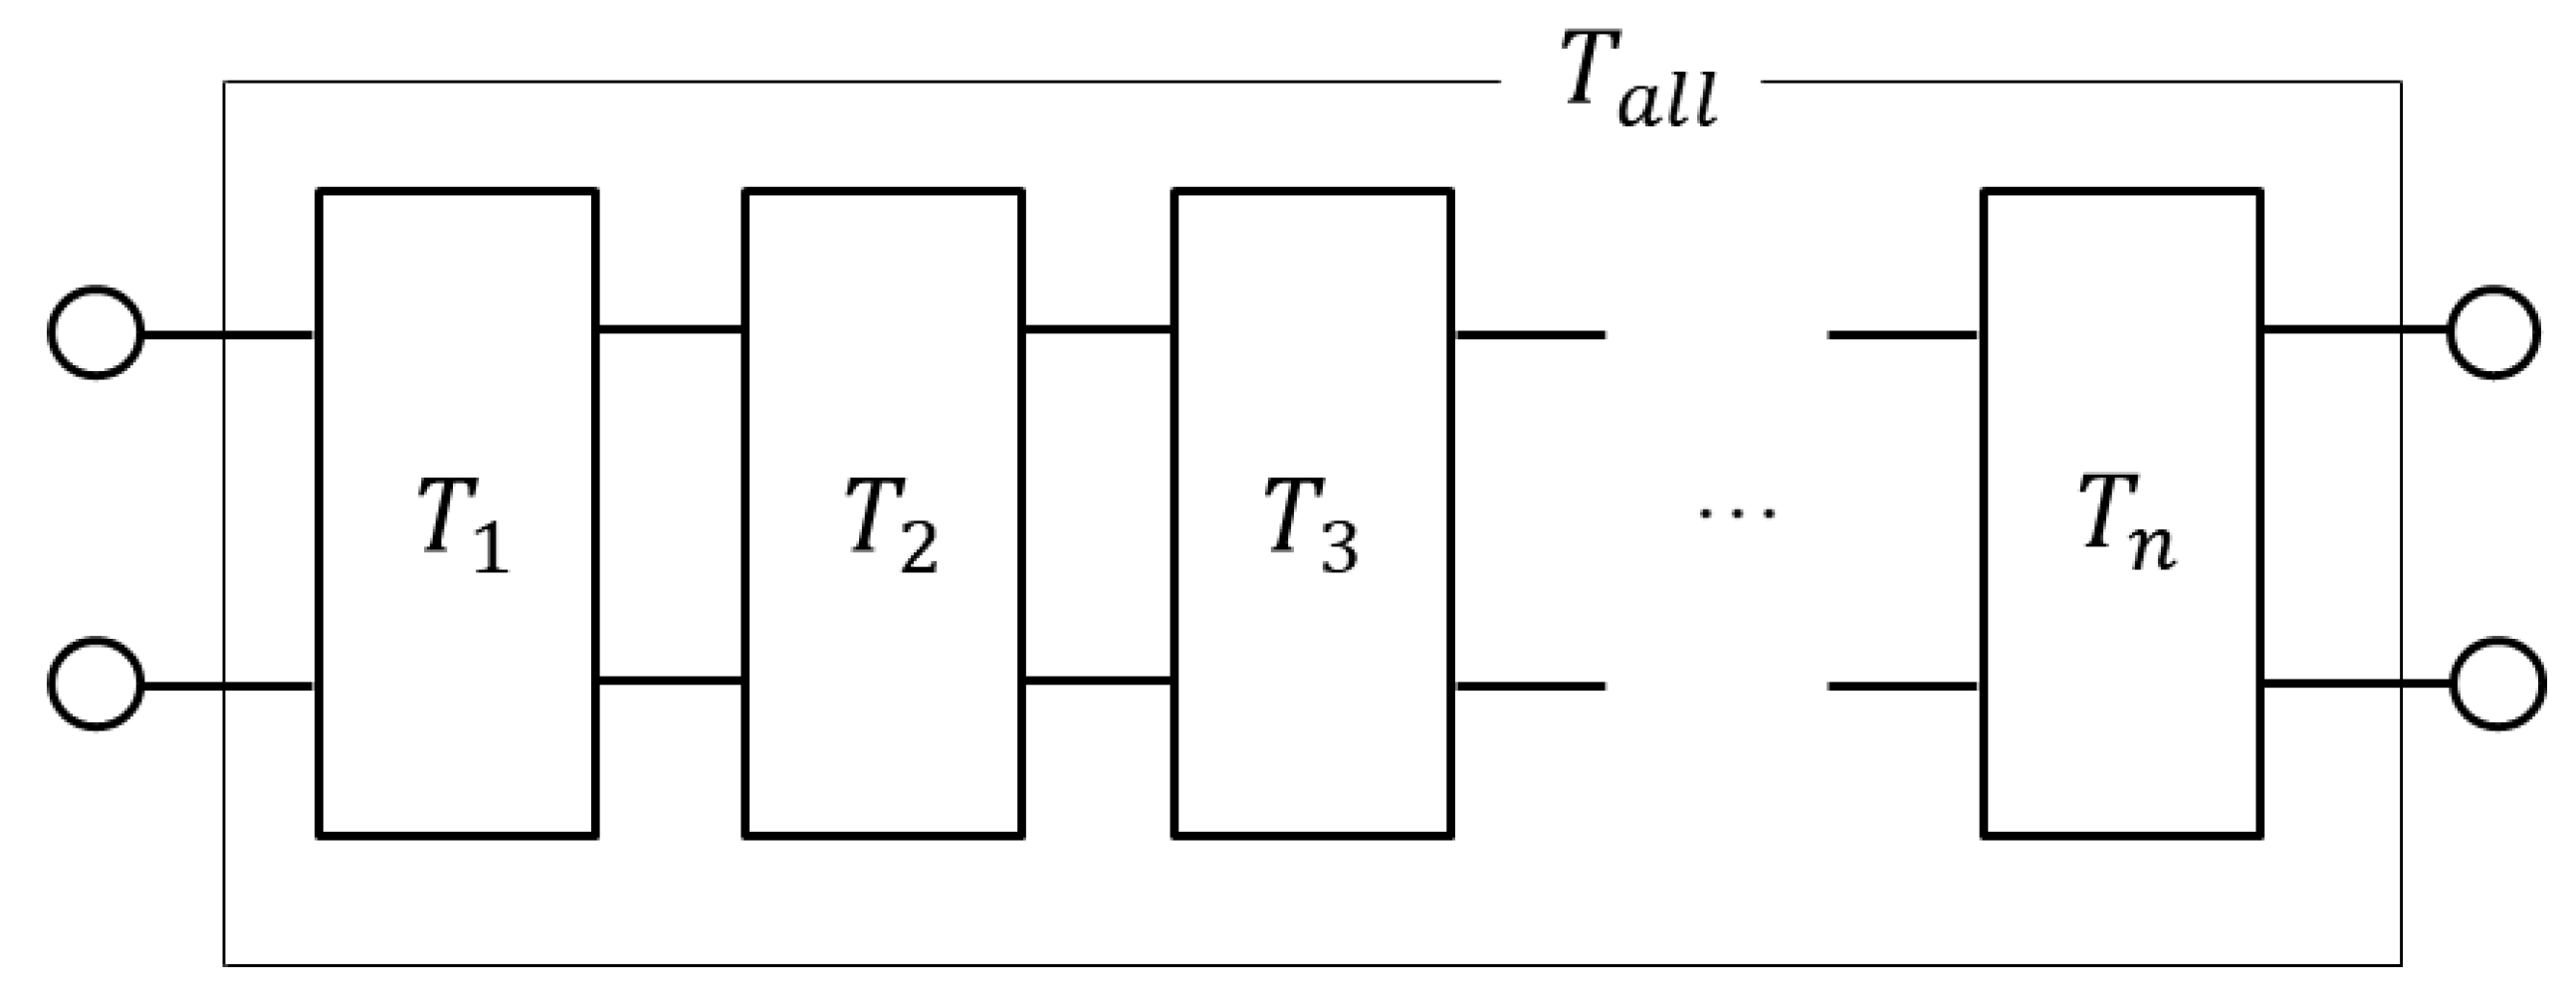
To account for the entire foam structure, the four terminal networks for each individual image are cascaded along the
x-axis, as represented by the equivalent circuit in
Figure 8. This yields the overall transfer matrix
Tall, which is an aggregation of the contributions from all images.
2.4.5. Derivation of the Normal-Incident Sound Absorption Coefficient
When considering the overall transfer matrix
Tall, the particle velocity
u2 = 0 at the rightmost boundary of
Figure 8 is zero, owing to the presence of a rigid wall. Under this boundary condition, Equation (9) can be simplified to
Consequently, the specific acoustic impedance
Z1 observed from the left side of
Figure 8 can be expressed as
The reflectance
R, which describes the relationship between the specific acoustic impedance
Z1 and the characteristic impedance of air
p0c0, is expressed as
Finally, using the relationship between the sound absorption coefficient (
), reflectance (
R), the normal-incidence sound absorption coefficient is obtained as
3. Comparison of Calculated and Measured Results
3.1. Variation in Theoretical Values with Threshold Value
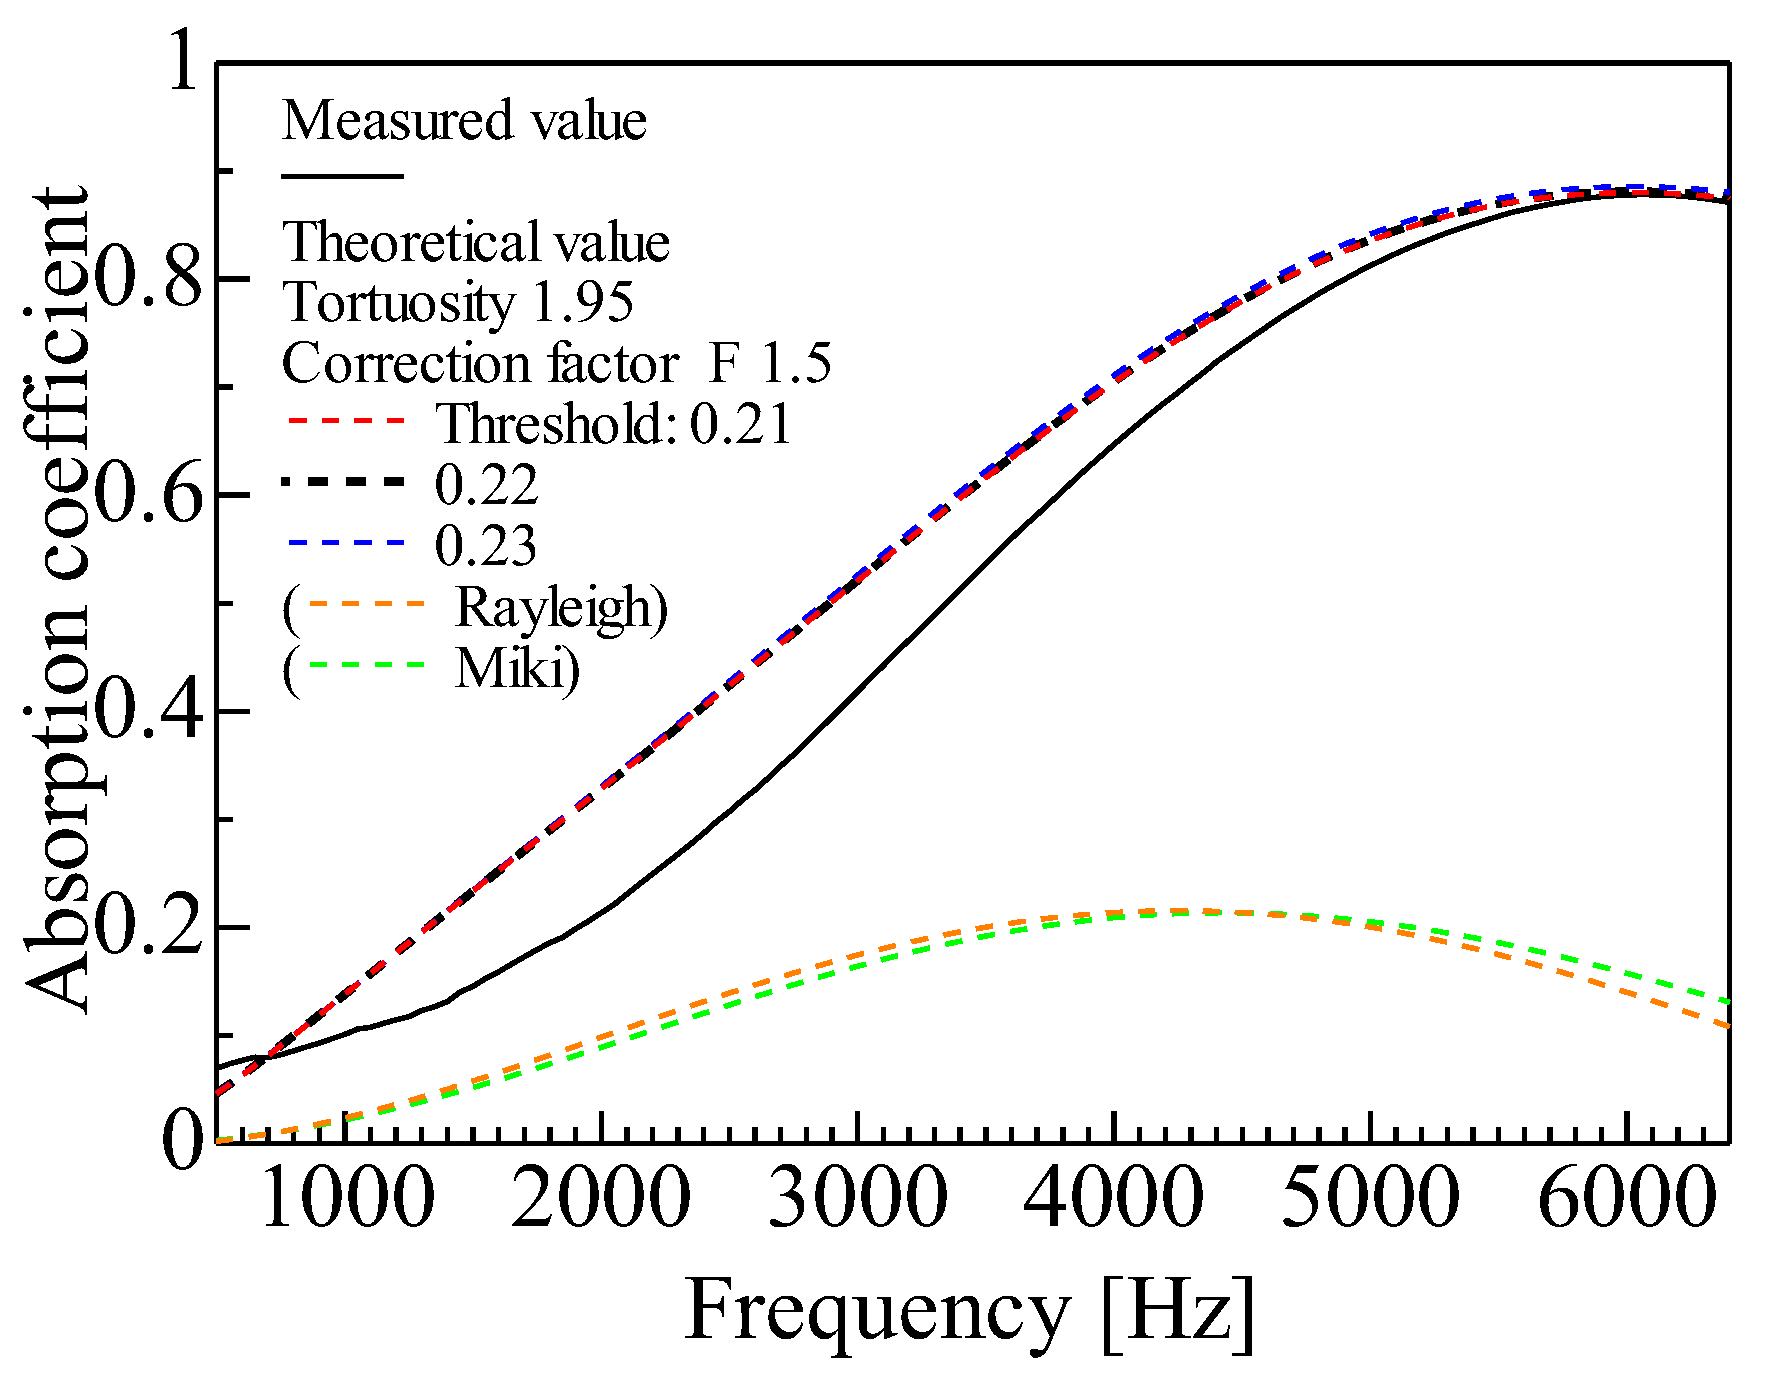
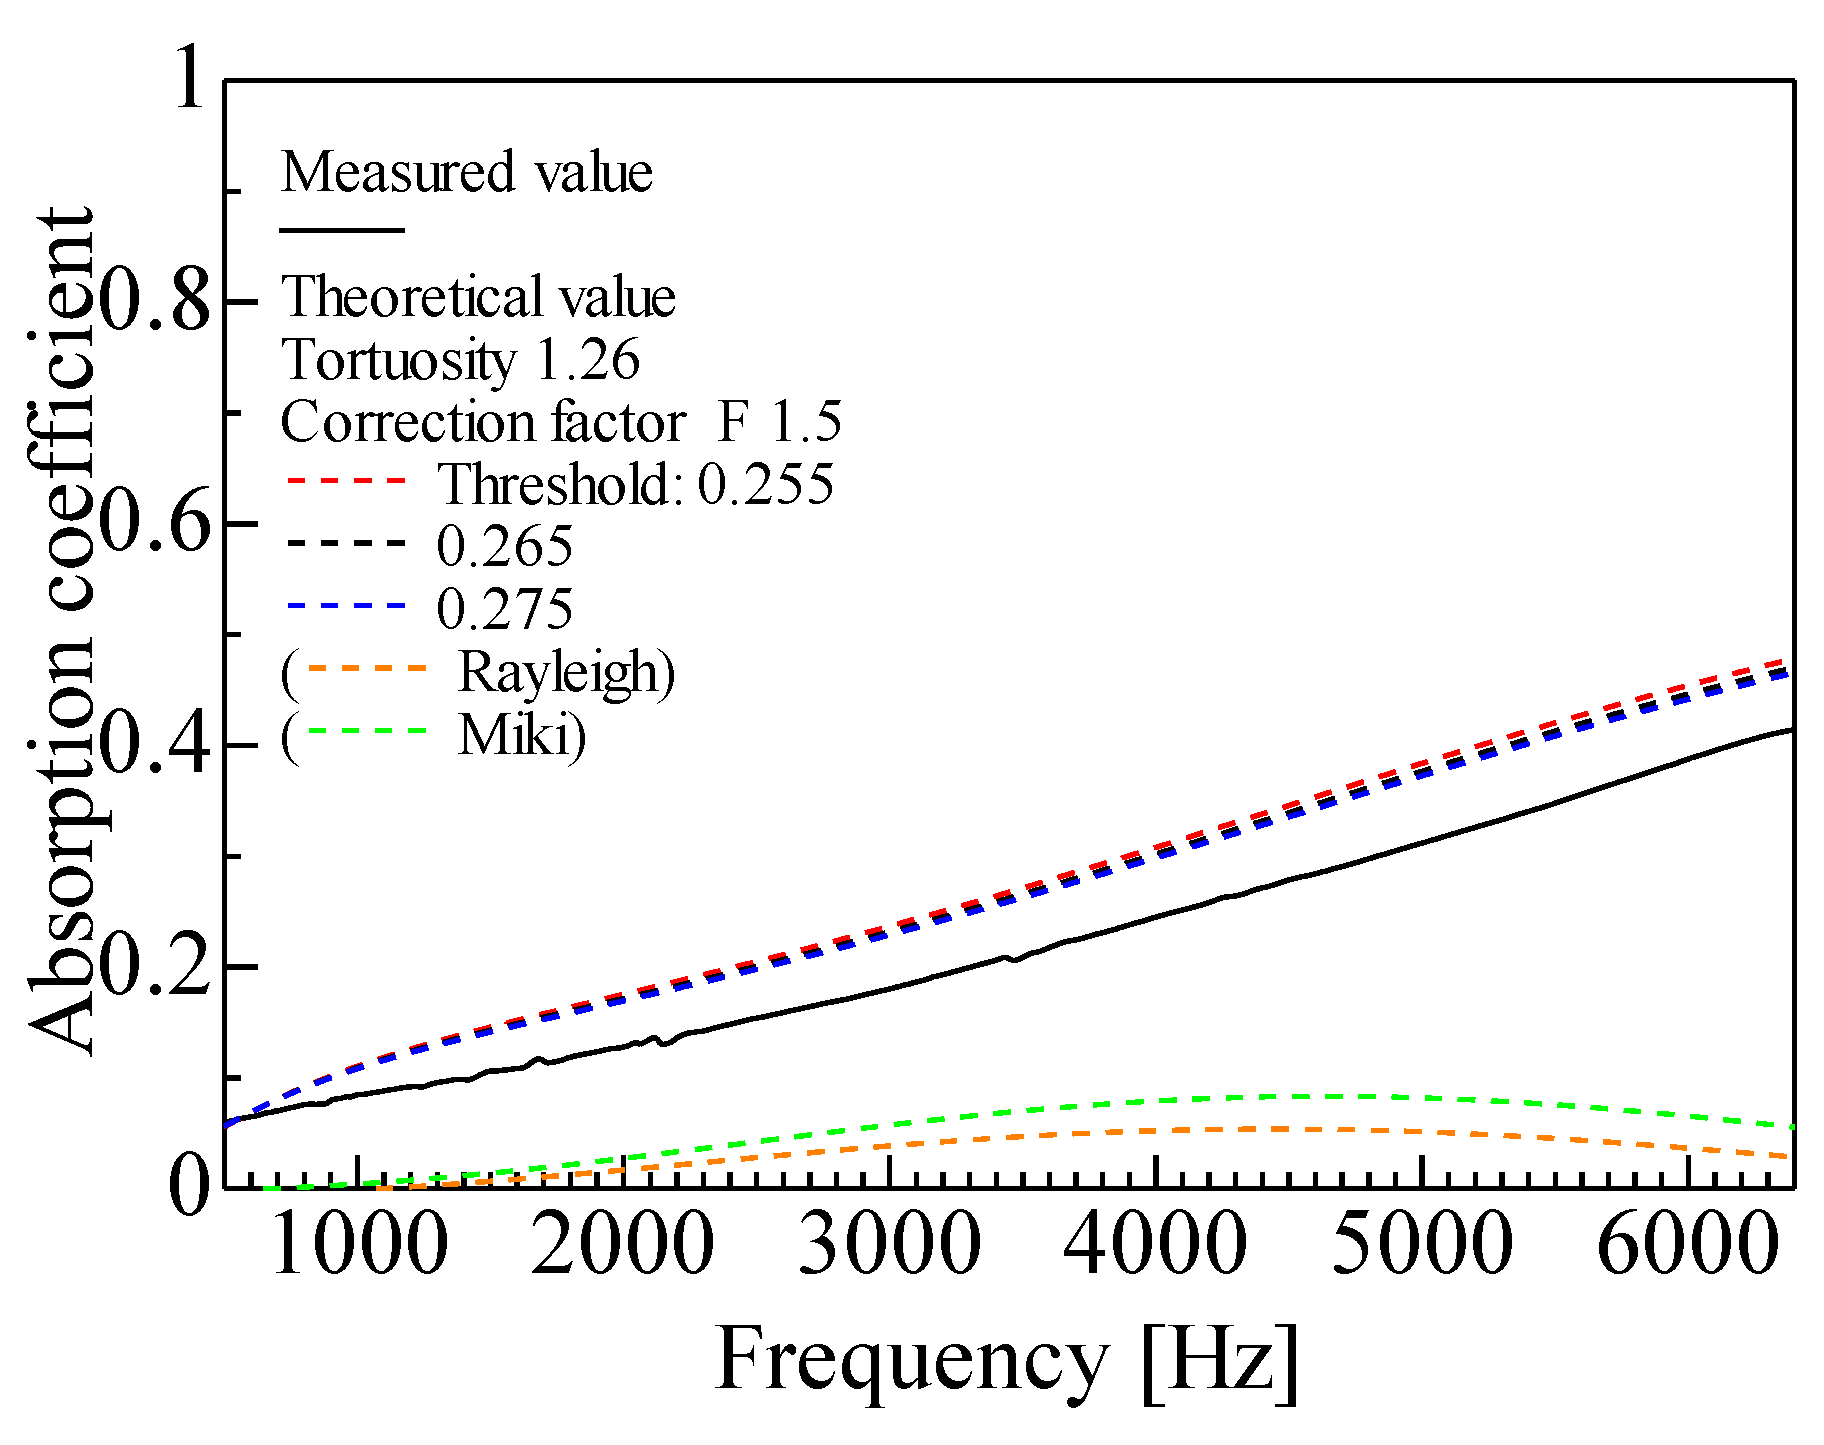
Figure 9 and
Figure 10 present a comparison of the measured sound absorption coefficients with the theoretical values obtained from nano-CT images for foam materials with and without membranes, respectively. These comparisons were conducted for different threshold values used in the binarization process. In both cases, the variation in the sound absorption coefficient owing to changes in the threshold value was minimal. This stability can be attributed to the application of image processing and noise reduction techniques described in
Section 3.2. In addition, the high resolution of the nano-CT equipment ensured that noise was effectively suppressed while preserving the fin portions of the skeleton structure, thereby leading to minimal impact from threshold variations. Consequently, this analytical approach is robust to changes in threshold and image noise, exhibiting higher reproducibility compared with conventional methods [
5].
Figure 9 and
Figure 10 also show calculated values obtained using conventional porous media models: the Rayleigh model [
29] and the Miki model [
30]. The measured flow resistivities for the with and without membrane foams, which were substituted into the calculations using both models, were 1.74 × 10
4 Ns/m
4 and 4.04 × 10
3 Ns/m
4, respectively. When the Rayleigh model is used to describe porous materials, it is referred to as Rayleigh’s capillary model. This model was then enhanced by Miki. Currently, the propagation constant and characteristic impedance of porous materials are obtained based on empirical equations derived experimentally using the Miki model. When a material is formed based on the Rayleigh model, the sound absorption coefficient can be directly predicted by only considering the flow resistivity [
31,
32]. The values calculated using both models are based on the capillary model; hence, they deviate from the experimental values of foam materials.
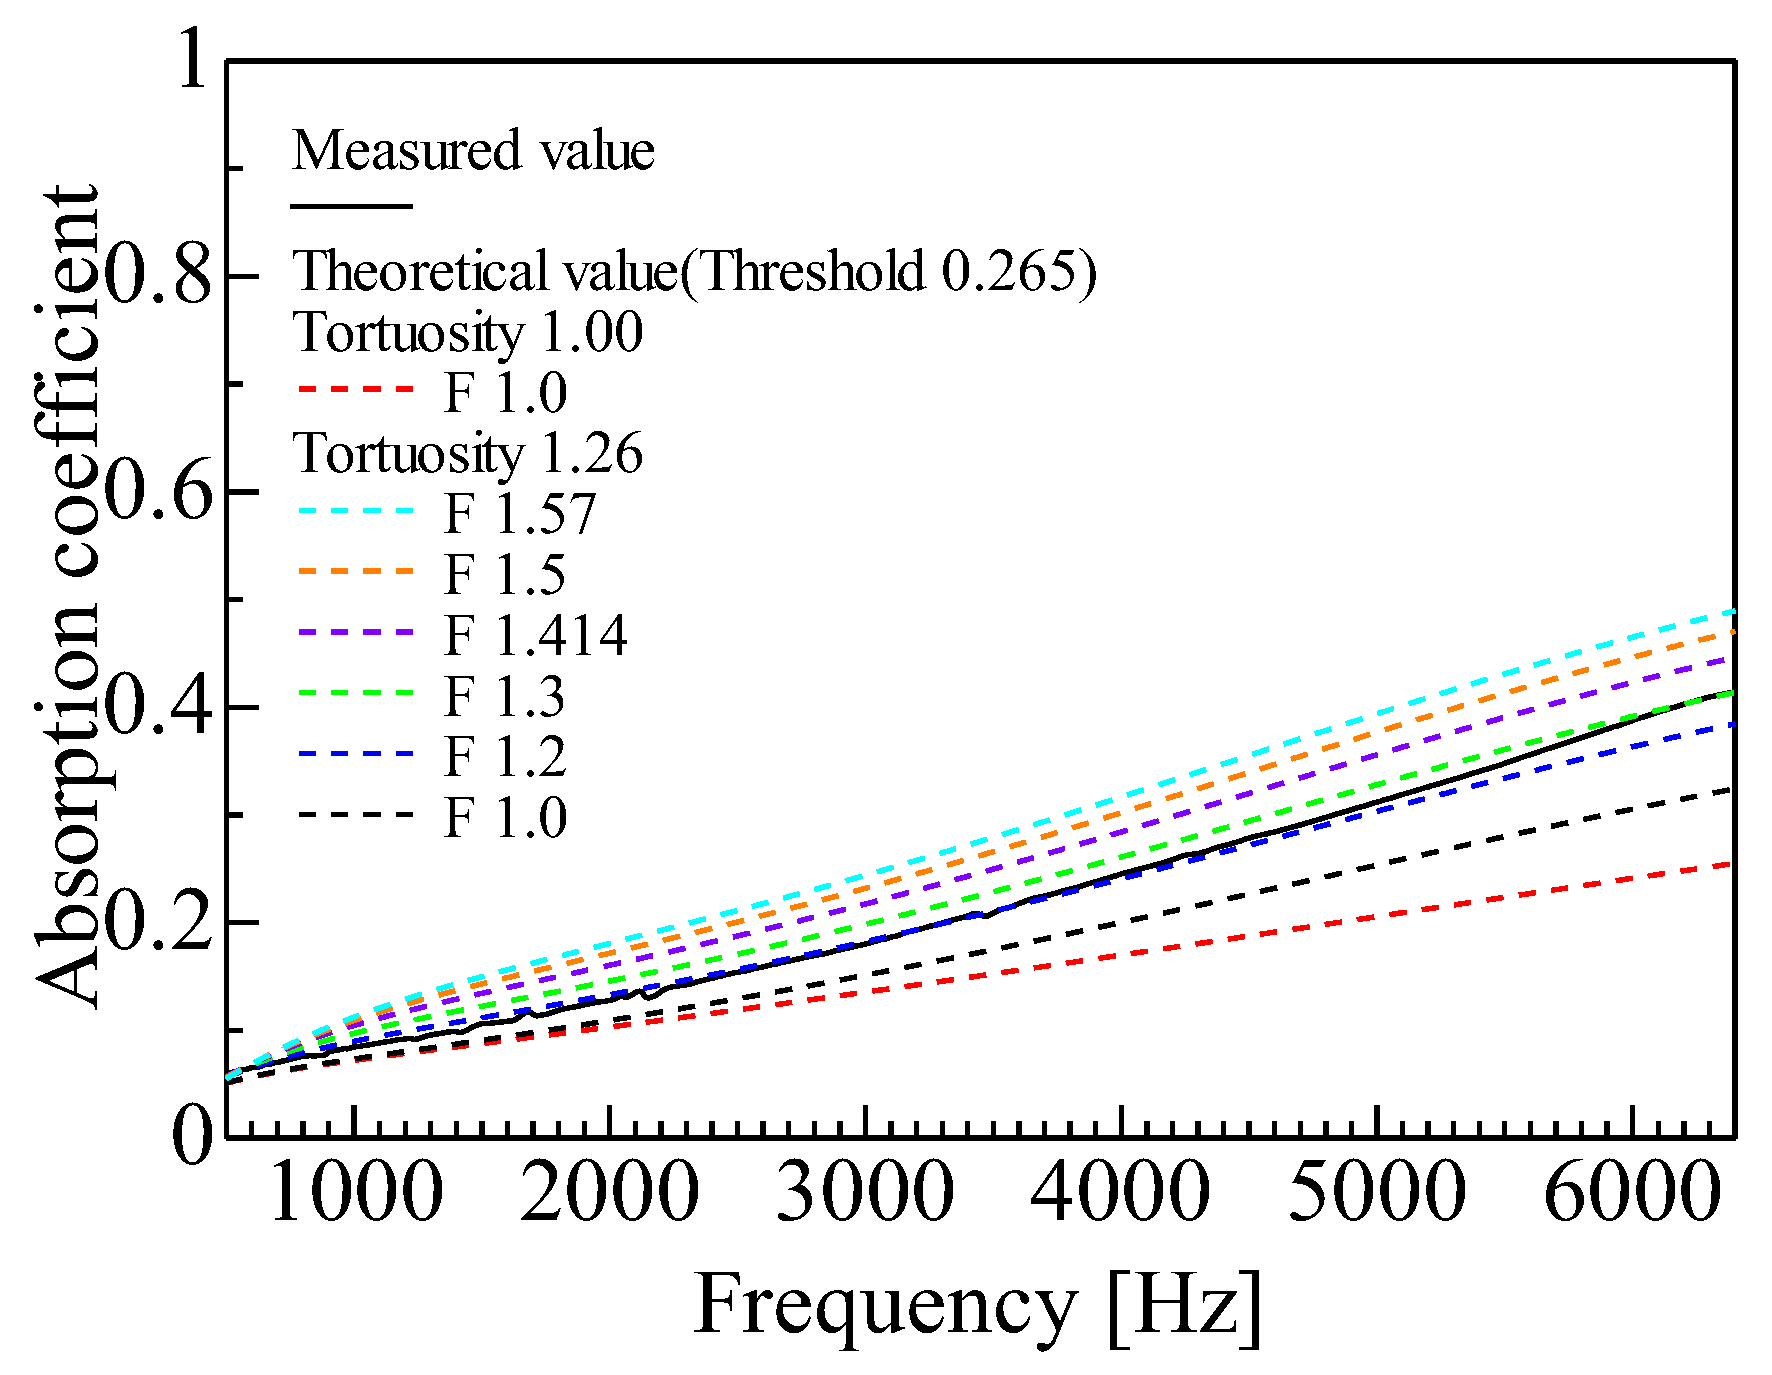
3.2. Variation in Theoretical Values with Correction Factor
Figure 11 and
Figure 12 present a sensitivity analysis of the correction factor
F, which incorporates the true surface area of the skeleton (
Section 3.3.). In this analysis, the binarization threshold was fixed at a representative value, and the theoretical sound absorption coefficients were compared with measured values for varying correction factors.
Figure 11 and
Figure 12 correspond to foam materials with and without membranes, respectively. In both cases, an increase in the correction factor
F resulted in a higher sound absorption coefficient. This trend occurs because an increasing
F results in a larger estimated surface area, which enhances the interaction between the sound waves and the foam structure in the theoretical model. To further enhance this work, we suggest utilizing software (Simpleware, Sunnyvale, CA, USA) that integrates tomographic images to recreate the three-dimensional shape, calculate the actual surface area, and determine the true correction factor [
22].
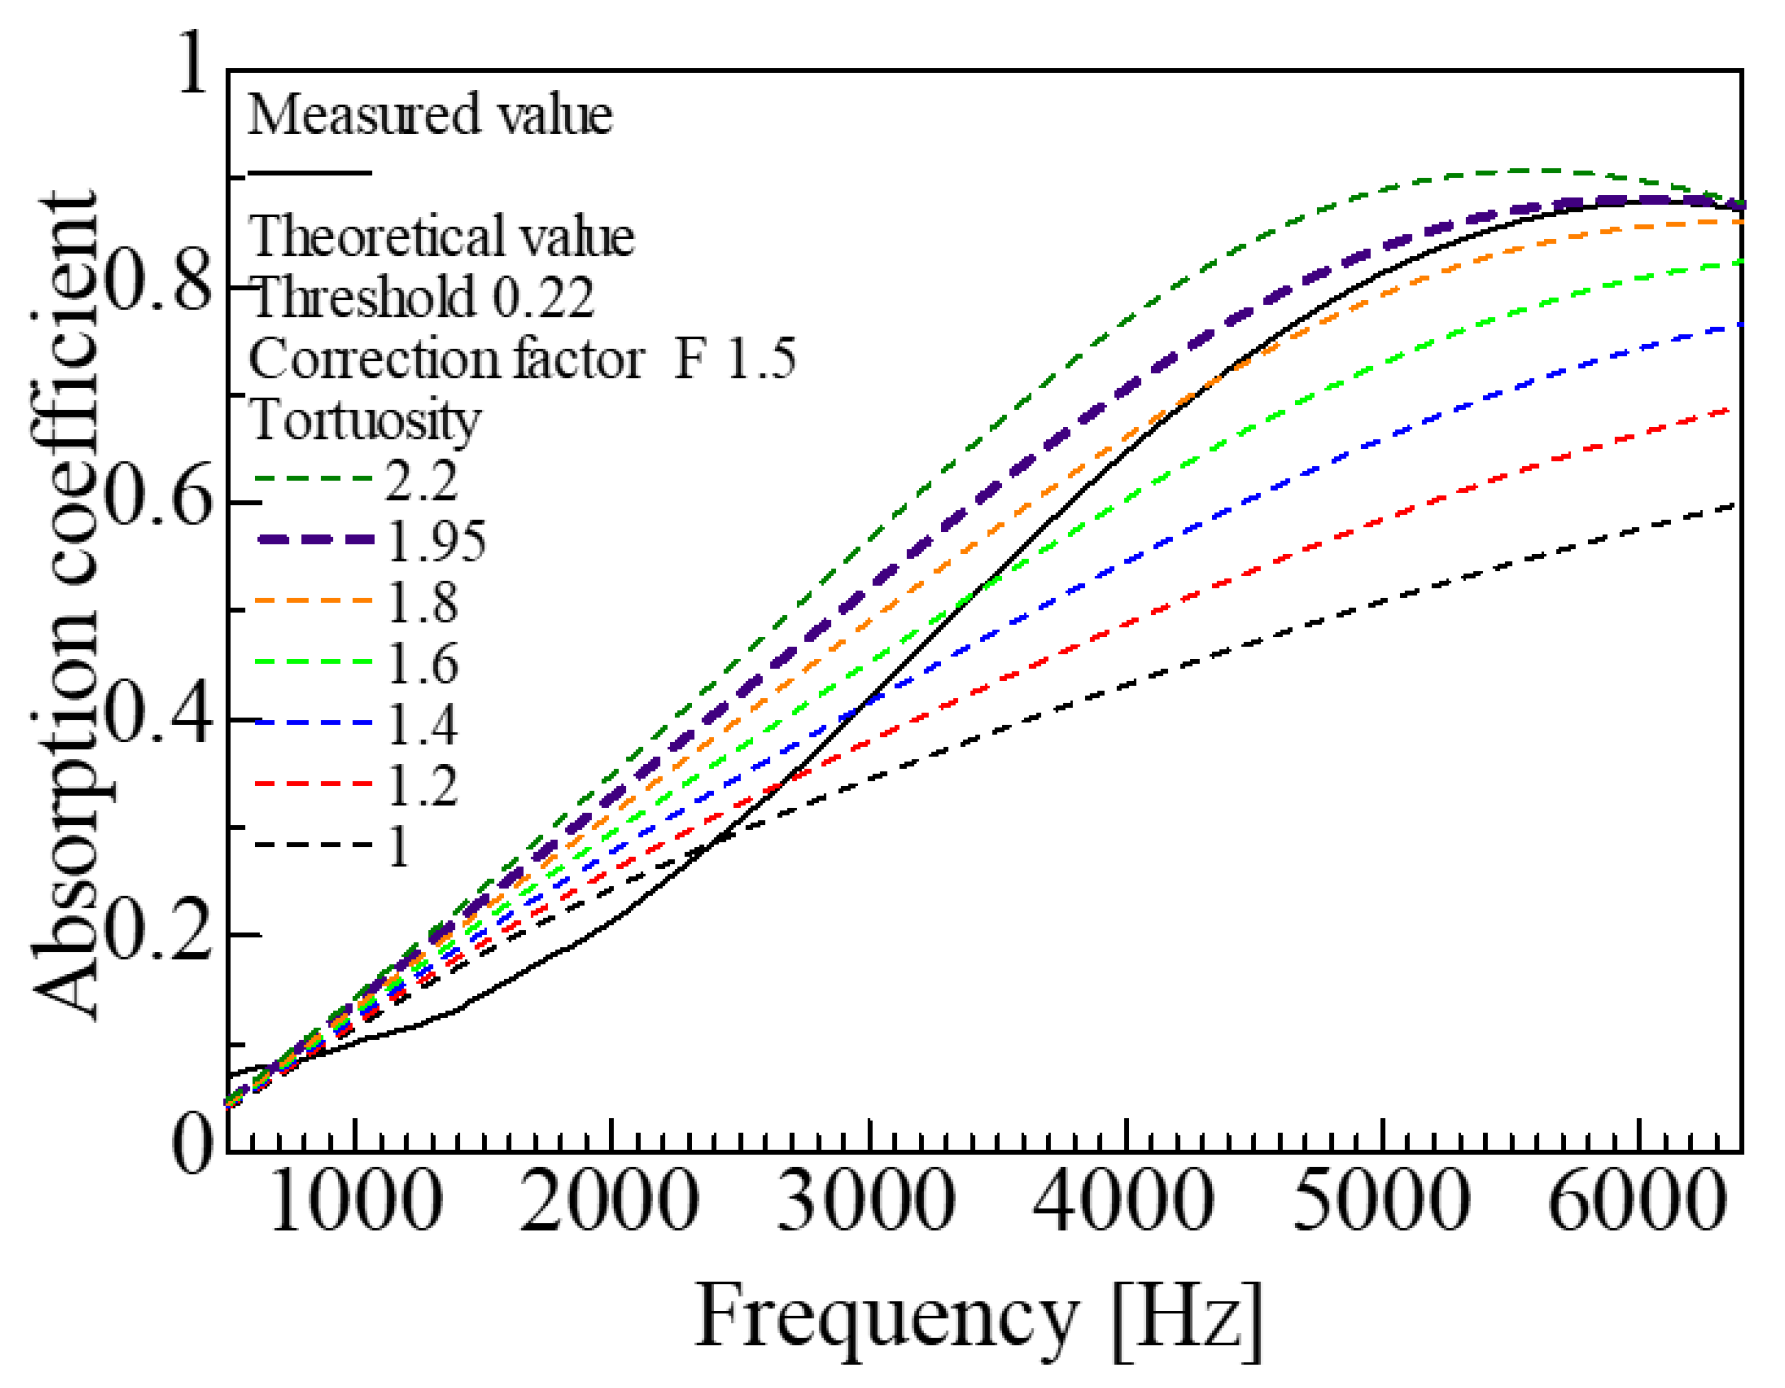
3.3. Variation in Theoretical Values with Tortuosity
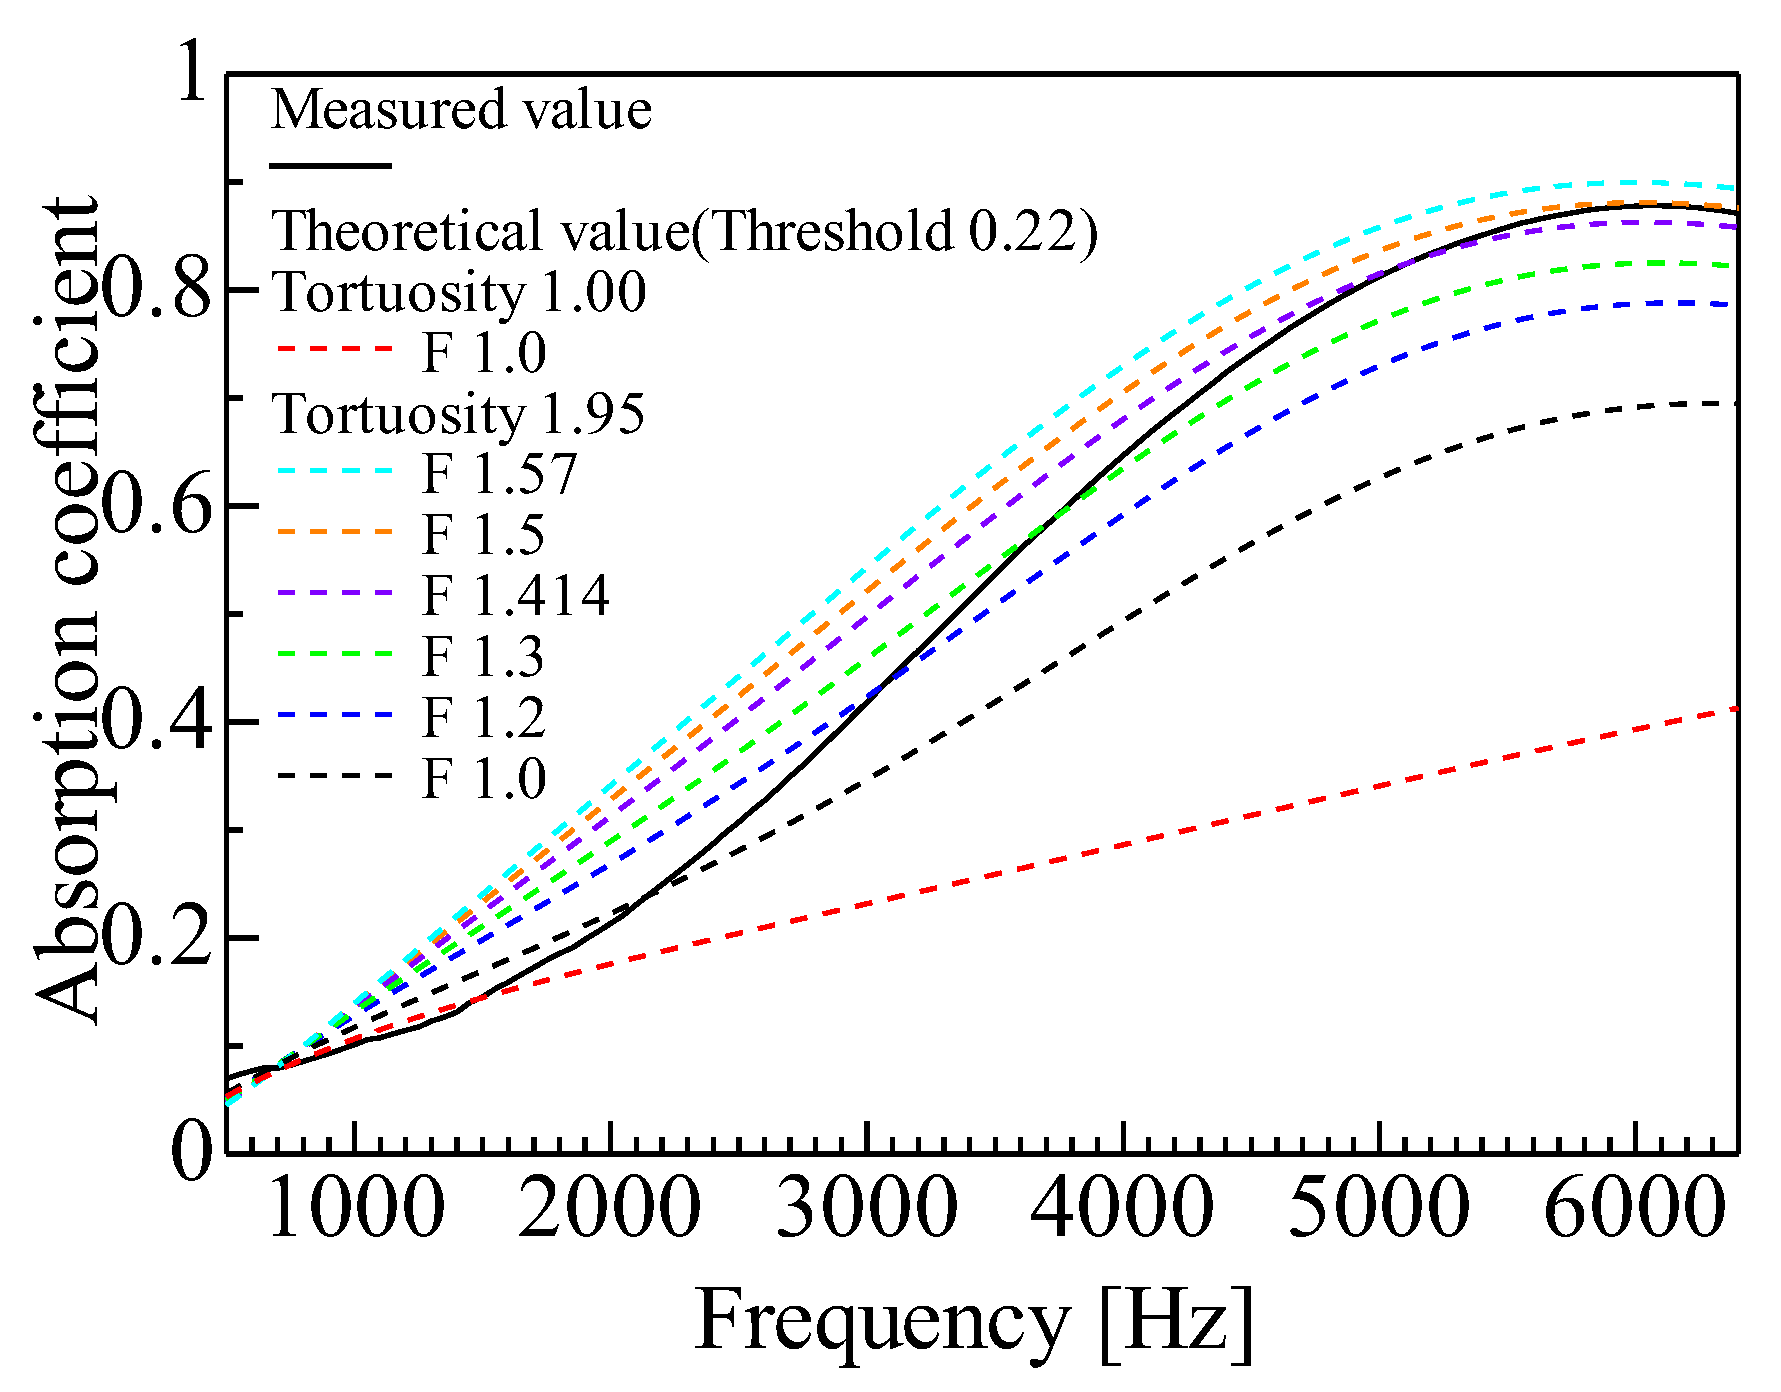
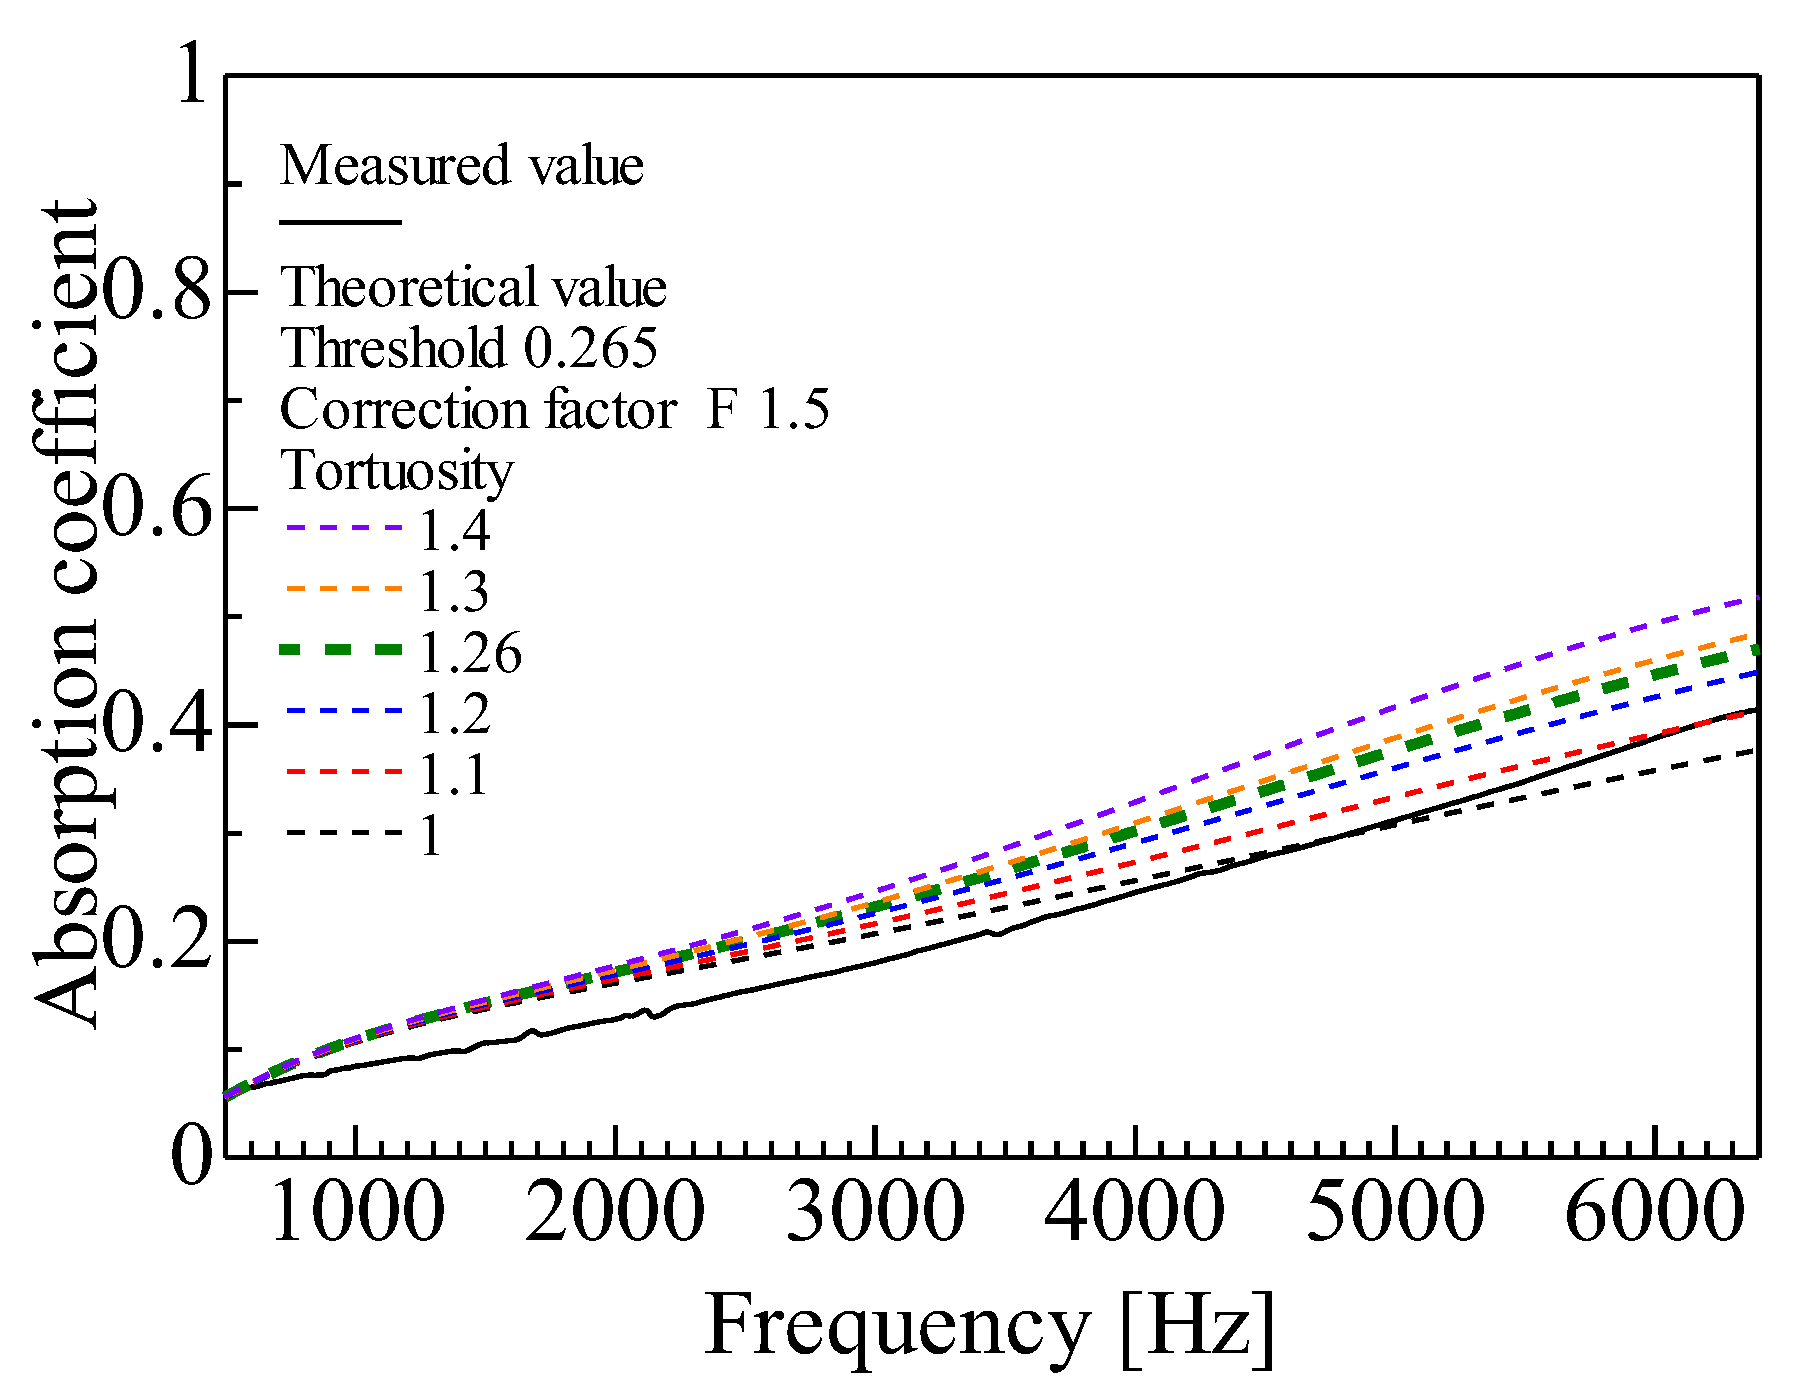
Figure 13 and
Figure 14 present the sensitivity analysis for tortuosity. The threshold and correction values are fixed to representative values, whereas theoretical sound absorption curves are plotted for varying tortuosity.
Figure 13 and
Figure 14 correspond to foam with and without a membrane, respectively. Measured values are also indicated. In both figures, the theoretical sound absorption increases with increasing tortuosity. In
Figure 13, the overall sound absorption curve shifts toward lower frequencies.
3.4. Discussion of Differences Between Measured and Theoretical Values
The differences between the measured and theoretical values can be attributed to several factors.
The first cause is the complexity of image processing for foam materials. When binarizing the CT scan image, Otsu’s binarization [
33], a commonly used method, misclassified sections of the rod and joint portions as hollow and removed finer skeletal details. Despite the application of post-processing filters, the misrecognized cavities could not be fully restored. Consequently, manual threshold adjustments were necessary to improve the identification of the skeleton structure. However, filling in the rod and joint portions during processing also filled actual voids. This resulted in an underestimation of the void volume and deviations in perimeter calculations. Consequently, the accuracy of the two-plane approximation was affected.
A second cause is that the CT scan sample and the sample used for measuring the sound absorption coefficient were captured from different sections of the same material lot. Variations in the microstructure across different regions may contribute to discrepancies. Estimating foam materials with membranes presents certain challenges. This is due to the membrane thickness, which is less than 0.001 mm (much smaller than the large cell size, which is approximately 0.05 mm). In other words, capturing the membrane requires a high resolution. However, when using high resolution, only a limited number of skeletons can be imaged within the available range. The trade-off between resolution and imaging range in current CT scan devices means that imaging the membrane often results in an inadequate imaging range. This issue may be addressed in the future with improvements in device performance.
A third cause is the imaging range of the nano-CT scan, which affects the statistical averaging of the foam structure [
34]. Higher spatial resolution provides greater detail but narrows the imaging area, rendering the capture of a statistically representative number of foam cells challenging. However, a wider imaging range facilitates statistical averaging but reduces resolution, thereby potentially missing fine structural details [
5]. With 2486 images without membranes and 2536 images with membranes in the thickness direction, the number of measurement repetitions is considered sufficient.
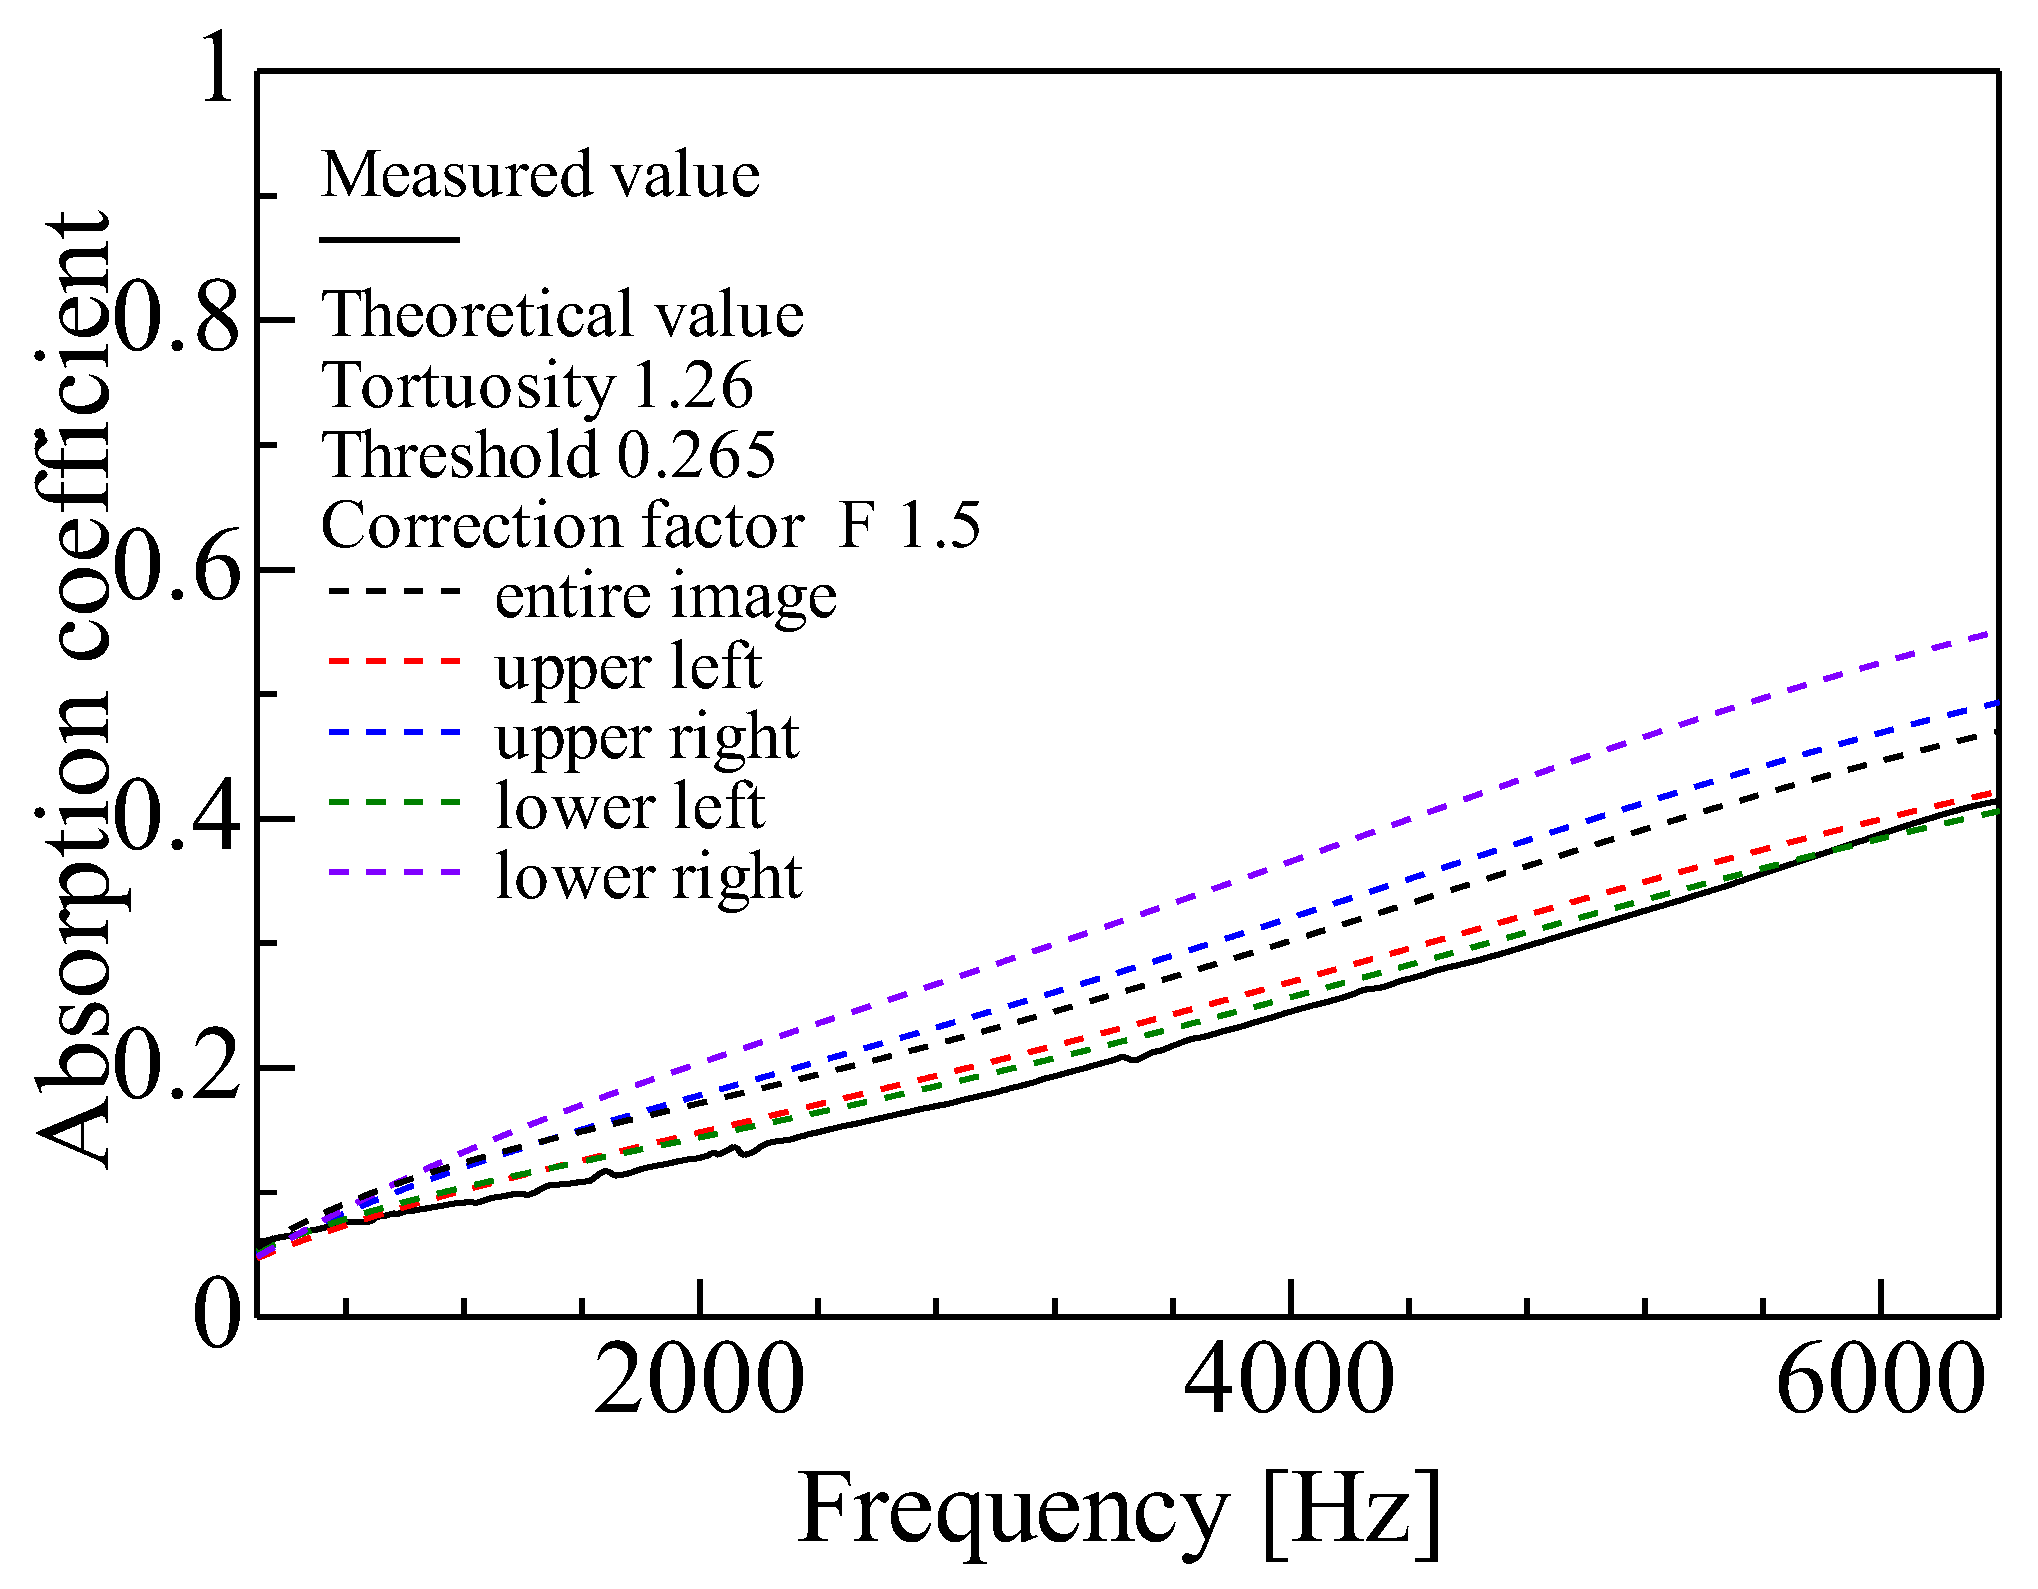
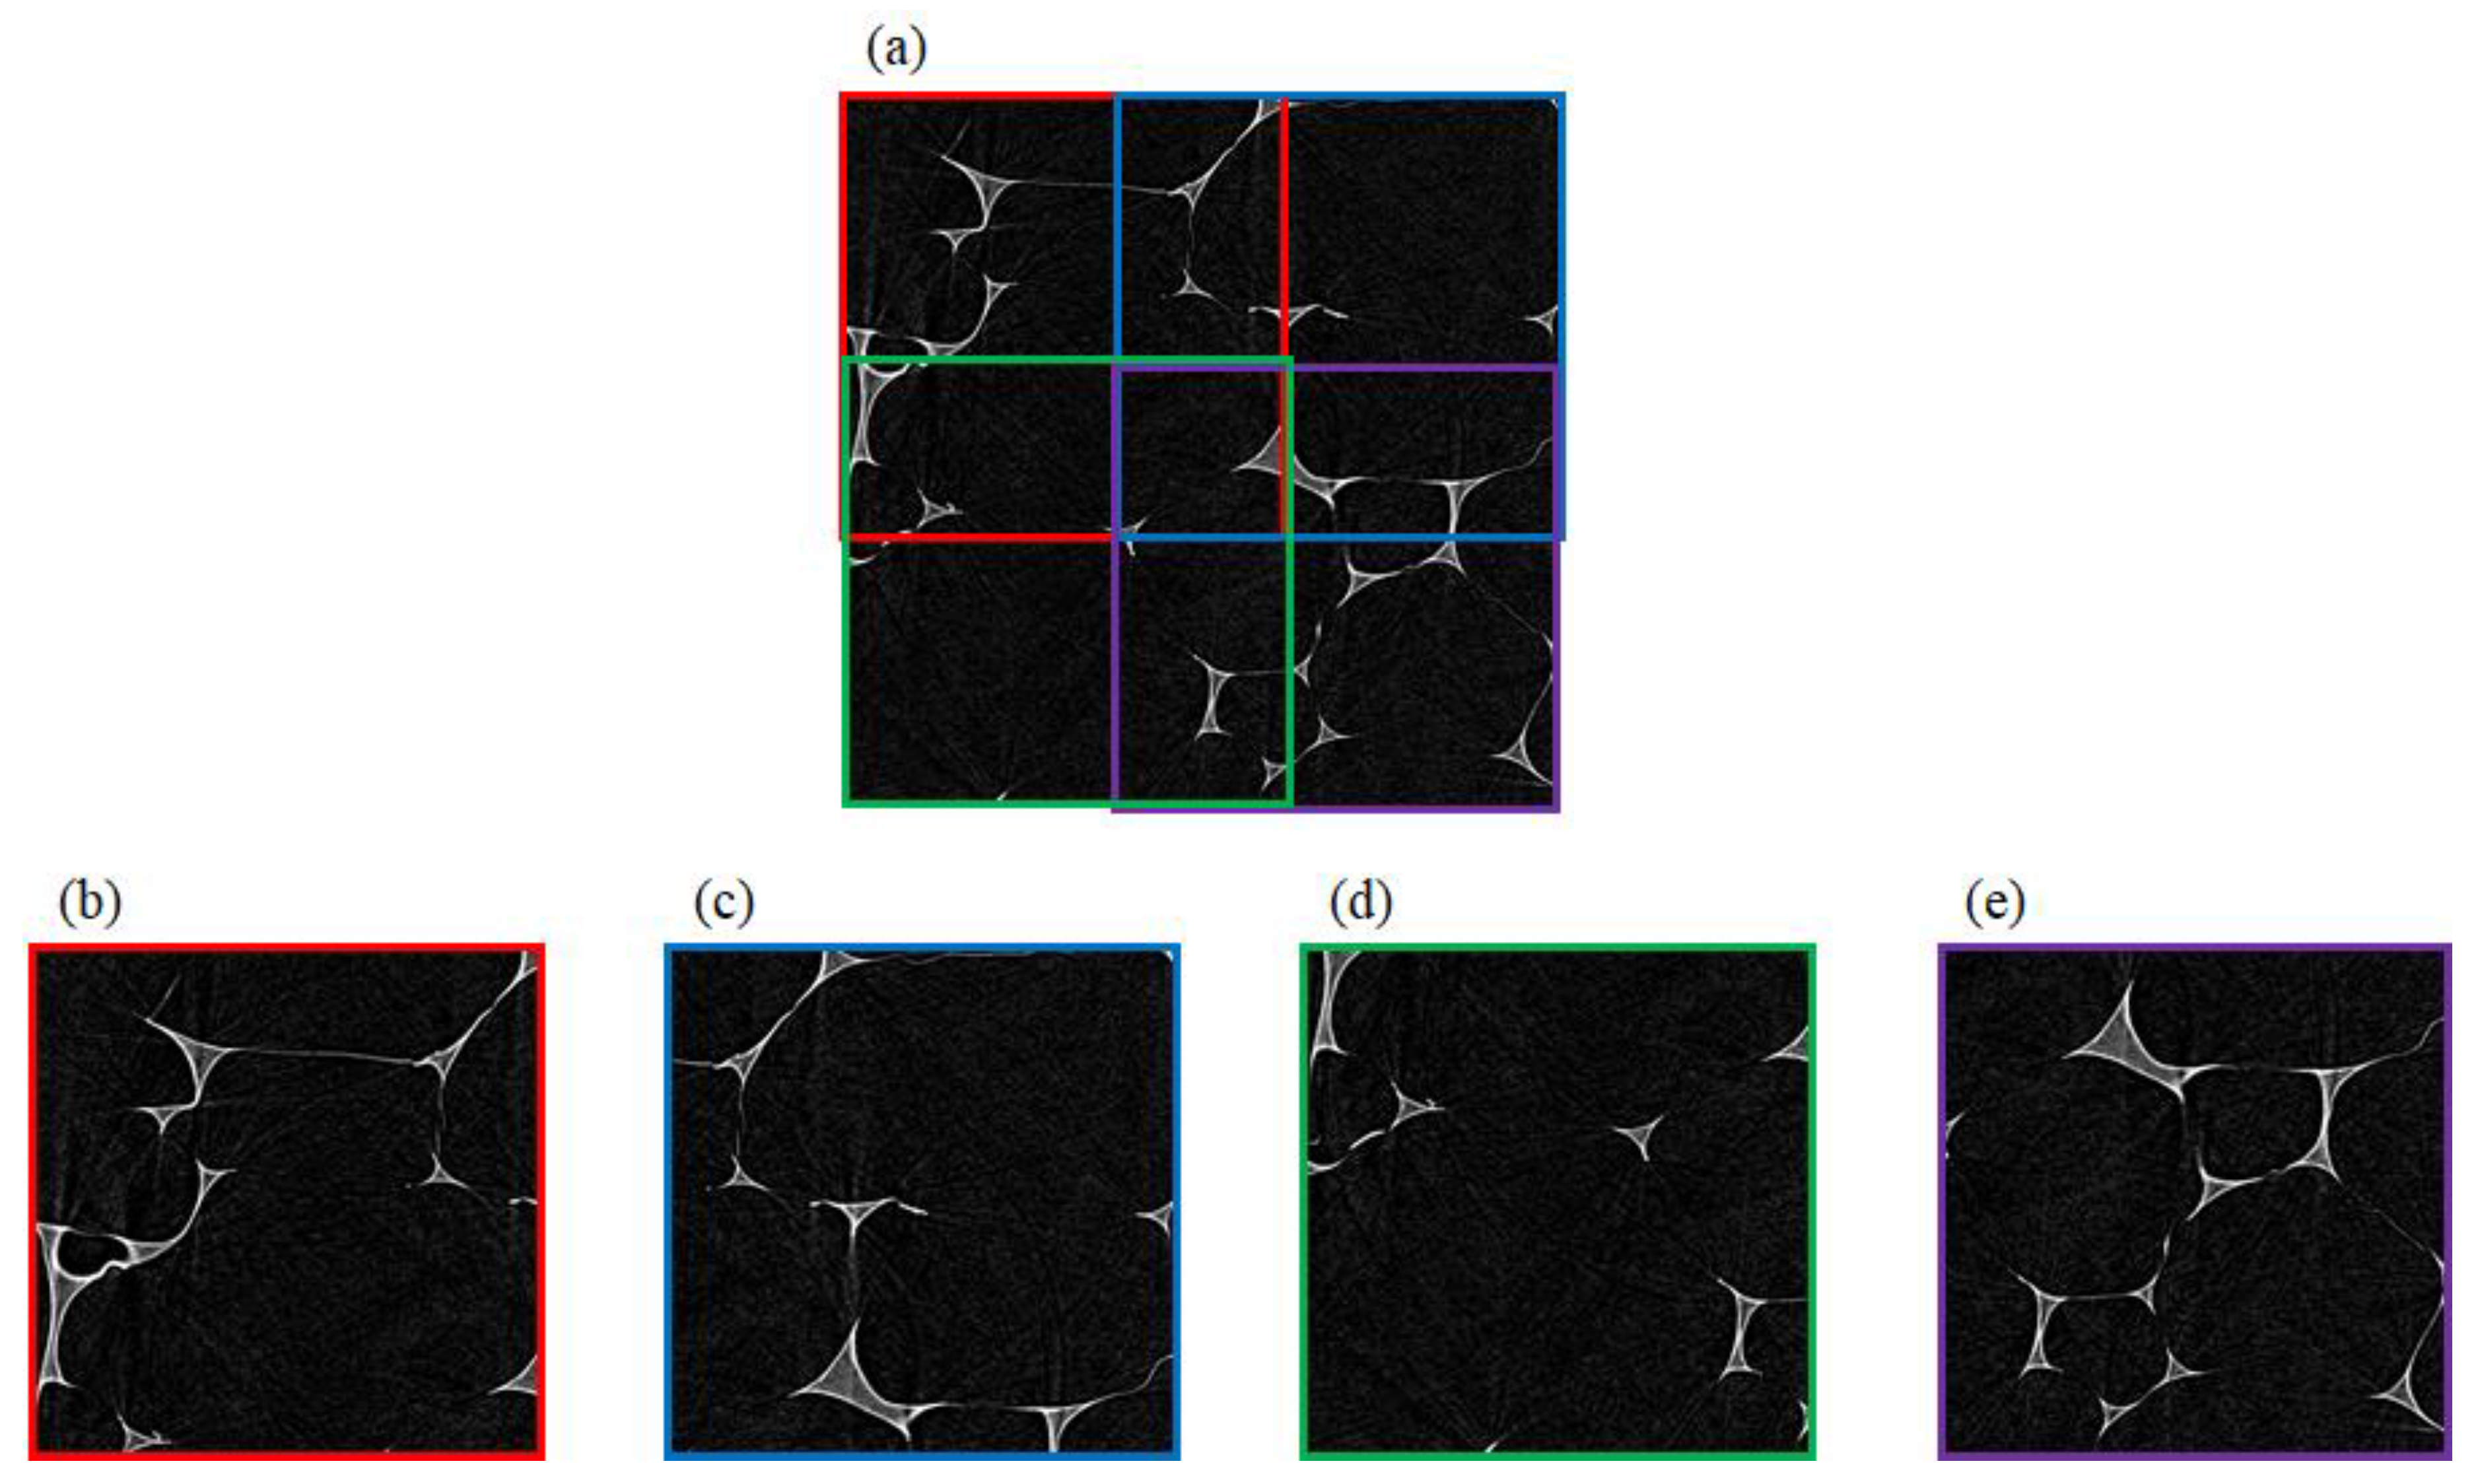
To investigate the third cause, the effect of the imaging range was examined using CT images of the foam material without a membrane. The original imaging area was approximately 1.2 mm × 1.2 mm, whereas the imaging area for the foam material with a membrane was narrower at 0.67 mm × 0.67 mm. A subset of the 1.2 mm × 1.2 mm images was cropped to match the 0.67 mm × 0.67 mm imaging range. Thereafter, theoretical calculations were conducted using both the full and cropped images.
Figure 15a shows the original, full imaging range.
Figure 15b–e display the four different cropped regions of 0.67 mm × 0.67 mm.
Figure 16 presents a comparison of the sound absorption coefficients calculated from these images. The results indicated that theoretical values differed depending on the cropping position. This suggests that the cropped images do not contain a sufficient number of foam cells to represent the randomness of the skeleton structure. Notably, the absorption coefficient derived from the full 1.2 mm × 1.2 mm image (
Figure 15a) was approximately the midpoint of the values obtained from the cropped images (
Figure 15b–e). This implies that, for the given foam material, an imaging range of at least 1.2 mm × 1.2 mm is required to ensure statistical reliability.
Thus, the discrepancies between the theoretical and measured absorption coefficients are largely attributable to image processing challenges, sample variation, and imaging range limitations. However, upon the use of an appropriate imaging range to capture a representative number of foam cells, the theoretical predictions from nano-CT images provide a reasonable estimation of the sound absorption coefficient. Furthermore, it was confirmed that an imaging range of at least ~1.2 mm × 1.2 mm is sufficient to ensure statistical validity for the cell size of the material investigated. This finding can serve as a reference when determining appropriate imaging ranges based on cell size.
To quantitively evaluate the difference between the experimental and theoretical SAC curves,
Table 1 presents the average SAC values of the calculated results alongside the experimental results shown in
Figure 9 and
Figure 10. Notably, for the theoretical values, calculations with a threshold of 0.22 were used for samples containing membranes, and a threshold of 0.265 was used for those without membranes. Given that the sound absorption peak frequency for this 10 mm-thick sample is relatively high, the highest frequency band listed in
Table 1 is particularly significant. In the frequency band centered around 4 kHz, the difference between the experimental and theoretical values for the membrane case, the focus of this study, was approximately 7%, which is relatively small.