Article

Theoretical Estimation of Wheat Straw Sound Absorption Coefficient Using Computed Tomography Images

by
Shuichi Sakamoto
1,*,
Kohta Hoshiyama
2,
Yoshiaki Kojima
2,
Kenta Saito
2 and
Zulhafiz Syazmi Bin Roslan
1
1
Department of Engineering, Niigata University, Ikarashi 2-no-cho 8050, Nishi-ku, Niigata City 950-2181, Japan
2
Graduate School of Science and Technology, Niigata University, Ikarashi 2-no-cho 8050, Nishi-ku, Niigata City 950-2181, Japan
*
Author to whom correspondence should be addressed.
Appl. Sci. 2025, 15(16), 8803; https://doi.org/10.3390/app15168803 (registering DOI)
Submission received: 13 June 2025 / Revised: 5 August 2025 / Accepted: 6 August 2025 / Published: 9 August 2025
(This article belongs to the Special Issue Advances in Architectural Acoustics and Vibration)

Abstract

Wheat straw, which is a by-product of wheat production and has a tubular structure, is typically used for animal feed and compost. This study estimated the sound absorption coefficient of wheat straw based on cross-sectional computed tomography (CT) images. After image processing, the surface area of the wheat straw skeletal outline and the volume of the void area were determined. The propagation constant and characteristic impedance of the void area were obtained by approximating the clearance between two parallel planes representing the void area walls. Each CT image was represented as a transfer matrix to calculate the sound pressure and particle velocity, and the transfer matrix method was used to derive the normal incidence sound absorption coefficients. The measured tortuosity was considered when calculating the normal incidence sound absorption coefficient. The CT images were corrected to reflect the lack of sound absorption by the porous part of the thick-walled portion by considering it as a solid structure. The theoretical sound absorption coefficients calculated from the corrected images were in good agreement with the measured sound absorption coefficients.

1. Introduction

The sound-absorbing structures of many plant-derived materials have been studied [1,2], including the fine tubular structure of rice straw [3], the fibrous structure of hemp [4,5], panels made of mixed materials (i.e., palm and coconut fiber) [6], mixed corn fiber [7], oil palm empty fruit bunch fiber [8], discarded tea leaves [9], granular cork [10], luffa fiber composites [11], and bamboo fiber composites [12]. Plant-derived materials exhibit varying sound absorption properties depending on their shape and arrangement [13,14].
When sound waves are incident in a continuous void, a boundary layer is created. Losses due to viscous friction in the boundary layer attenuate sound waves, resulting in sound absorption. Structures with continuous voids exhibit acoustic properties based on the same principle as porous materials, and their acoustic properties vary depending on the layer thickness and structure [15,16].
Wheat straw, which is a by-product of wheat production and has a tubular structure, is typically used for animal feed and compost. In Japan, between 560,000 and 1.2 million tons of wheat straw is produced annually; however, some of this is incinerated or disposed of without being utilized [17,18]. This waste of a resource challenges the realization of a sustainable society. Foam and glass wool, which are conventional sound-absorbing and insulating materials used in buildings, are highly effective at sound absorption but are not biodegradable, resulting in environmental and health concerns. Therefore, there is growing interest in using biomass materials to improve the sustainability of building materials [19]. Biomass materials are difficult to model due to their irregular shapes. Studies have been conducted to estimate the sound absorption coefficients of biomass materials such as rice straw [3] using CT images; however, no studies have been performed on wheat straw. Therefore, to facilitate further application to biomass materials with microtubular structures, this method was applied to wheat straw. Confirming the limitations of the CT image-based approach is valuable from an engineering perspective.
This study estimated the sound absorption coefficient of wheat straw based on cross-sectional computed tomography (CT) images. After image processing, the surface area of the wheat straw skeletal outline and the volume of the void area were determined. The propagation constant and characteristic impedance of the void area were obtained by approximating the clearance between two parallel planes representing the void area walls. Each CT image was represented as a transfer matrix to calculate the sound pressure and particle velocity, and the transfer matrix method was used to derive the normal incidence sound absorption coefficients. To reduce the cost of image processing, an attempt was made to reduce the number of images required for the theoretical calculations and to approach the two-dimensional problem. To compensate for the insufficient resolution of CT, SEM observations were utilized to determine whether specific structures contribute to sound absorption. Specifically, the contribution to the sound absorption coefficient of a group of tubules in the thick-walled portion of the straw was simulated based on scanning electron microscope (SEM) observations.
The theoretical approach proposed in this study offers the advantage of estimating the sound absorption coefficient with minimal computation based on geometric information, without requiring three-dimensional analysis software such as COMSOL, ANSYS, or ACTRAN.
Section 2 introduces the samples used in the experiment, describes the experimental methods for measuring sound absorption coefficients, tortuosity, and CT imaging, and presents the derivation of the sound absorption coefficient through theoretical analysis. Section 3 discusses the comparison between theoretical and experimental values of the sound absorption coefficient and the improvement in simulations using SEM images.

2. Materials and Methods

2.1. Wheat Straw Incident Sound Absorption Coefficient Testing

Wheat accounts for approximately 8% of global crop production, with an annual yield of 800 million tons [20]. In Japan, wheat is the second most produced crop after rice, accounting for approximately 11.8% of total crop production, with an annual yield of 1.09 million tons [21]. This study focused on typical varieties of Japanese wheat. Japanese wheat straw (Yumekaori variety) grown without pesticides in Nagano, Japan, in 2023, with a bulk density of 0.126 g/cm3, was used in this study. The bundled sample was prepared by packing the wheat straw into an aluminum alloy sample tube (inner diameter 29 mm; l = 20 mm) (Figure 1). The normal incident sound absorption coefficient was measured according to ISO 10534-2 [22] using a two-microphone impedance measurement tube (Type 4206; Brüel & Kjær, Nærum, Denmark). Table 1 shows the equipment used for sound absorption measurements. Table 2 shows PC specifications and software used for calculations.

2.2. Tortuosity

When sound waves pass through a porous material, tortuosity, α, accounts for the path length and complexity of the sound wave. The α of wheat straw, measured using an ultrasonic sensor, is expressed as Equation (1), where c0 is the sound velocity in air and c is the apparent sound velocity of the sample [23].
α = c 0 c 2
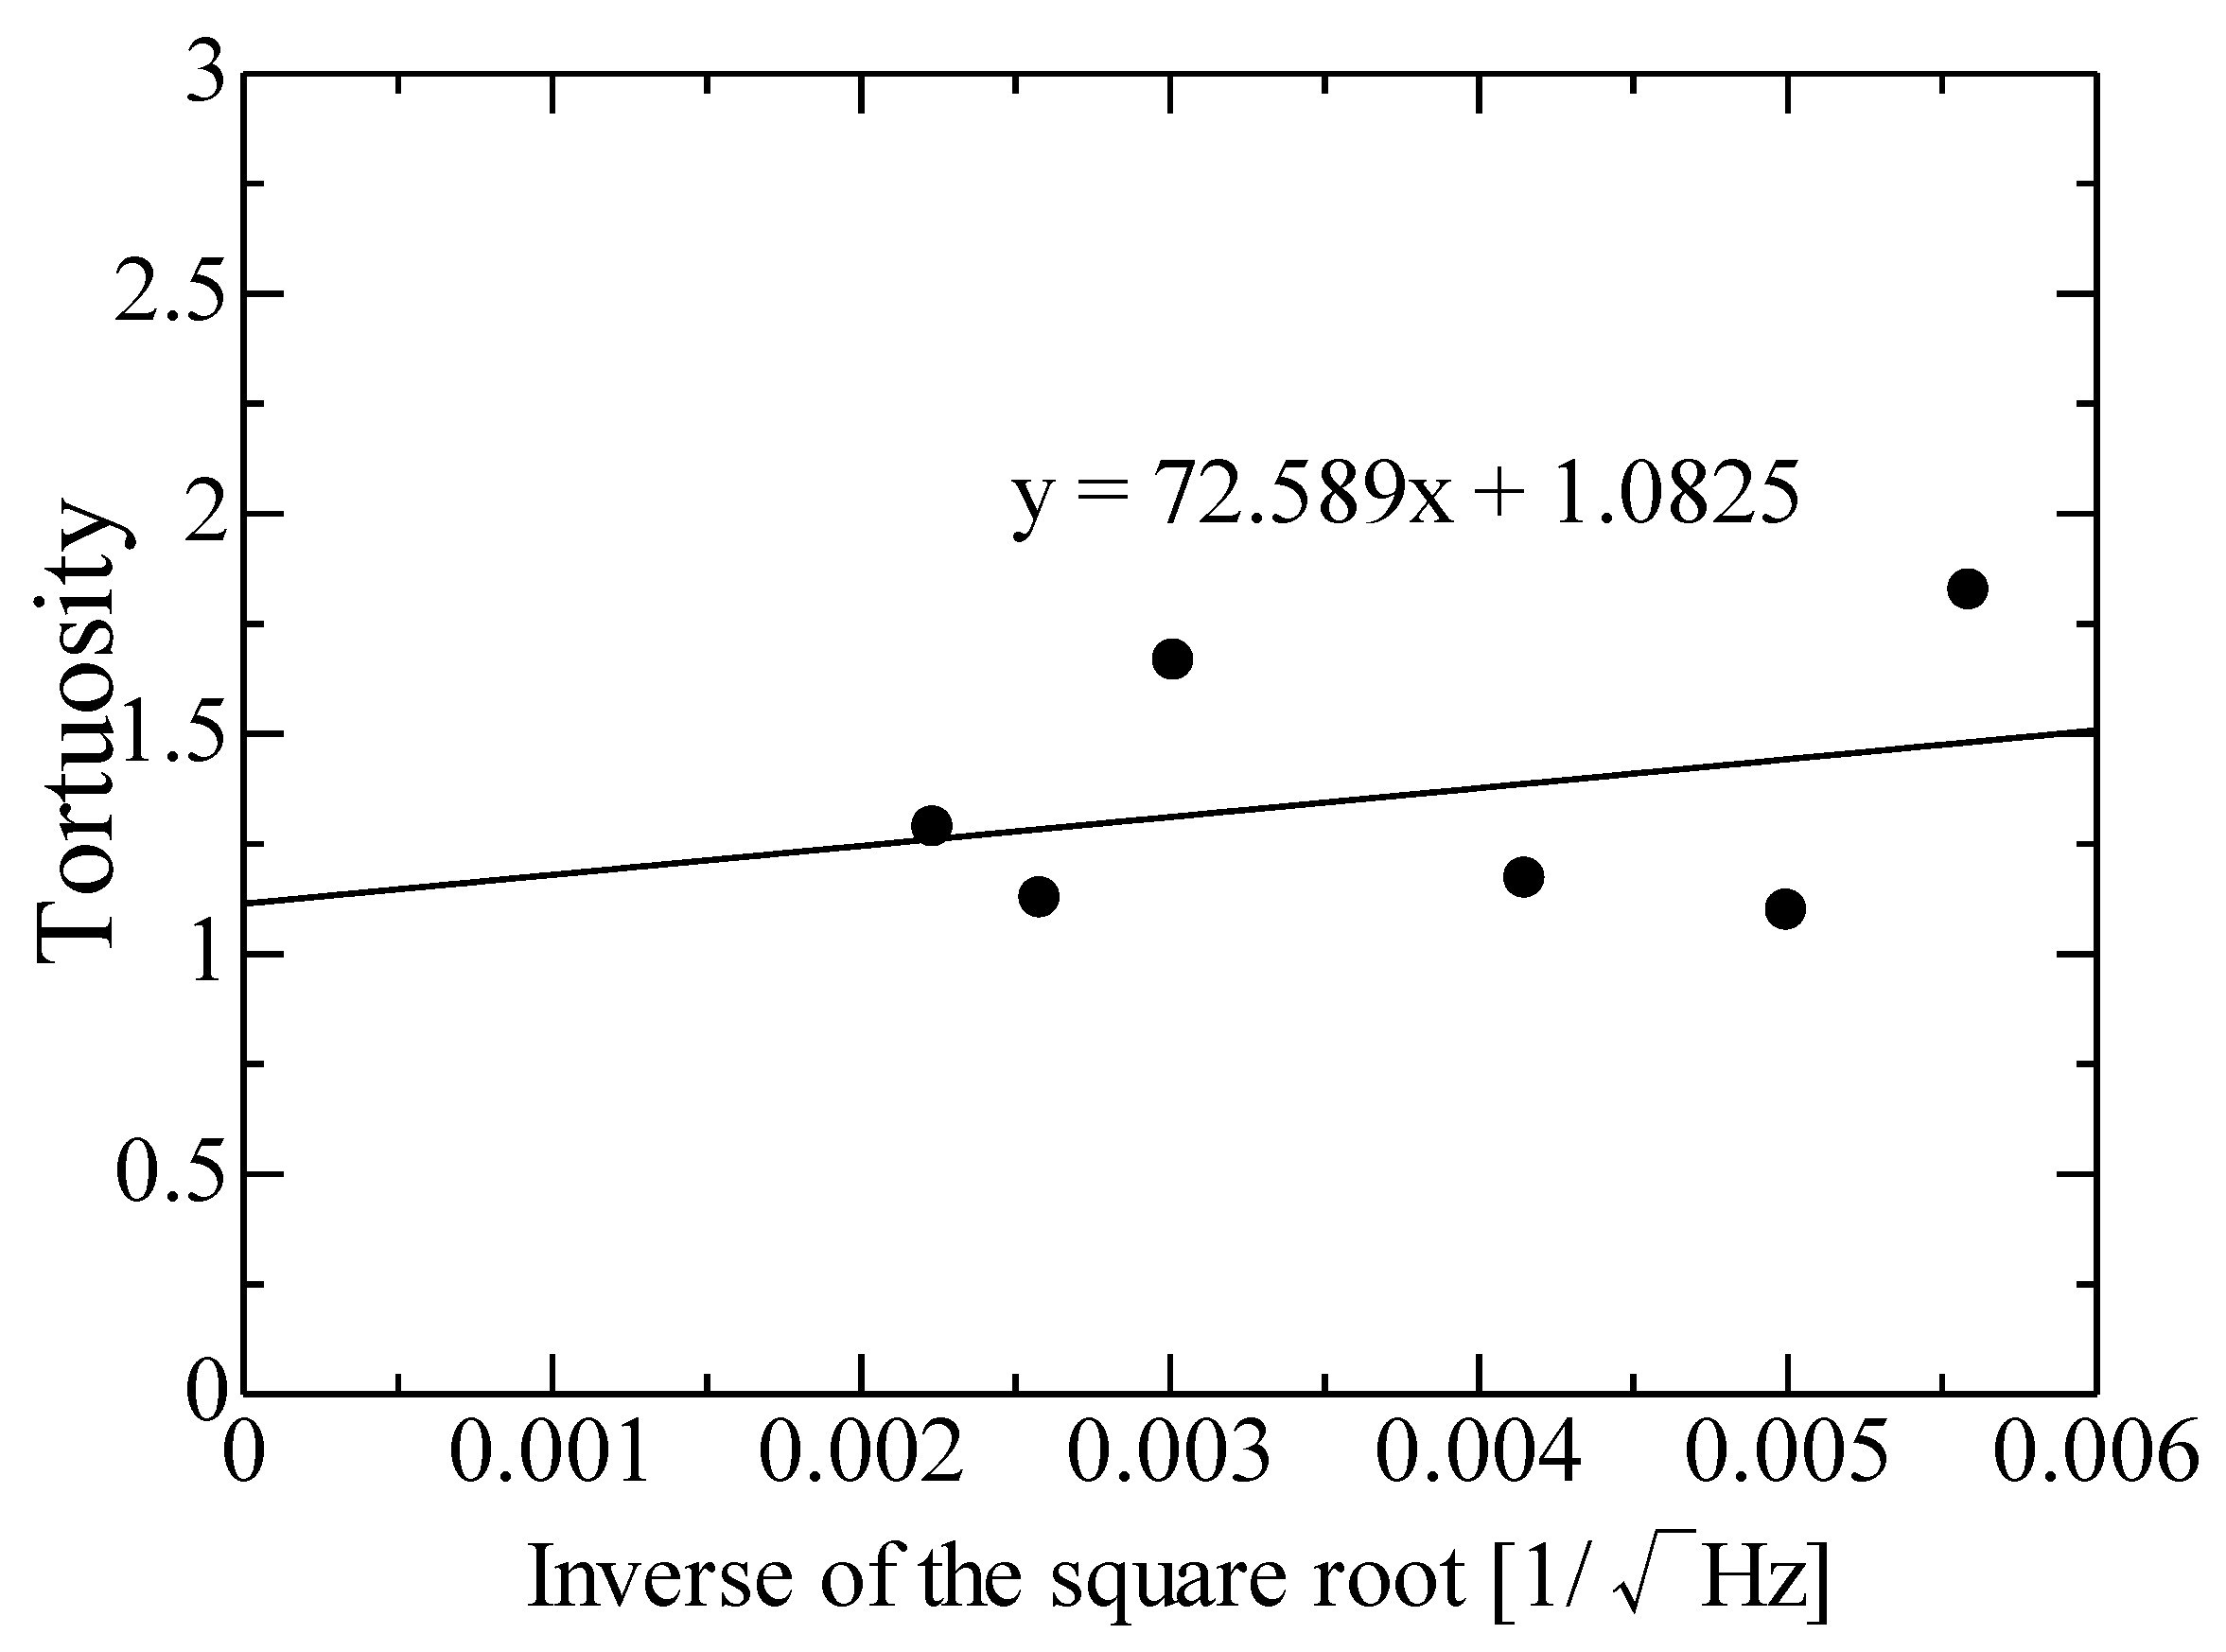
The measured α is shown in Figure 2, and the y-intercept of the fitted line indicates that the α of the wheat straw was 1.08.

2.3. CT Images

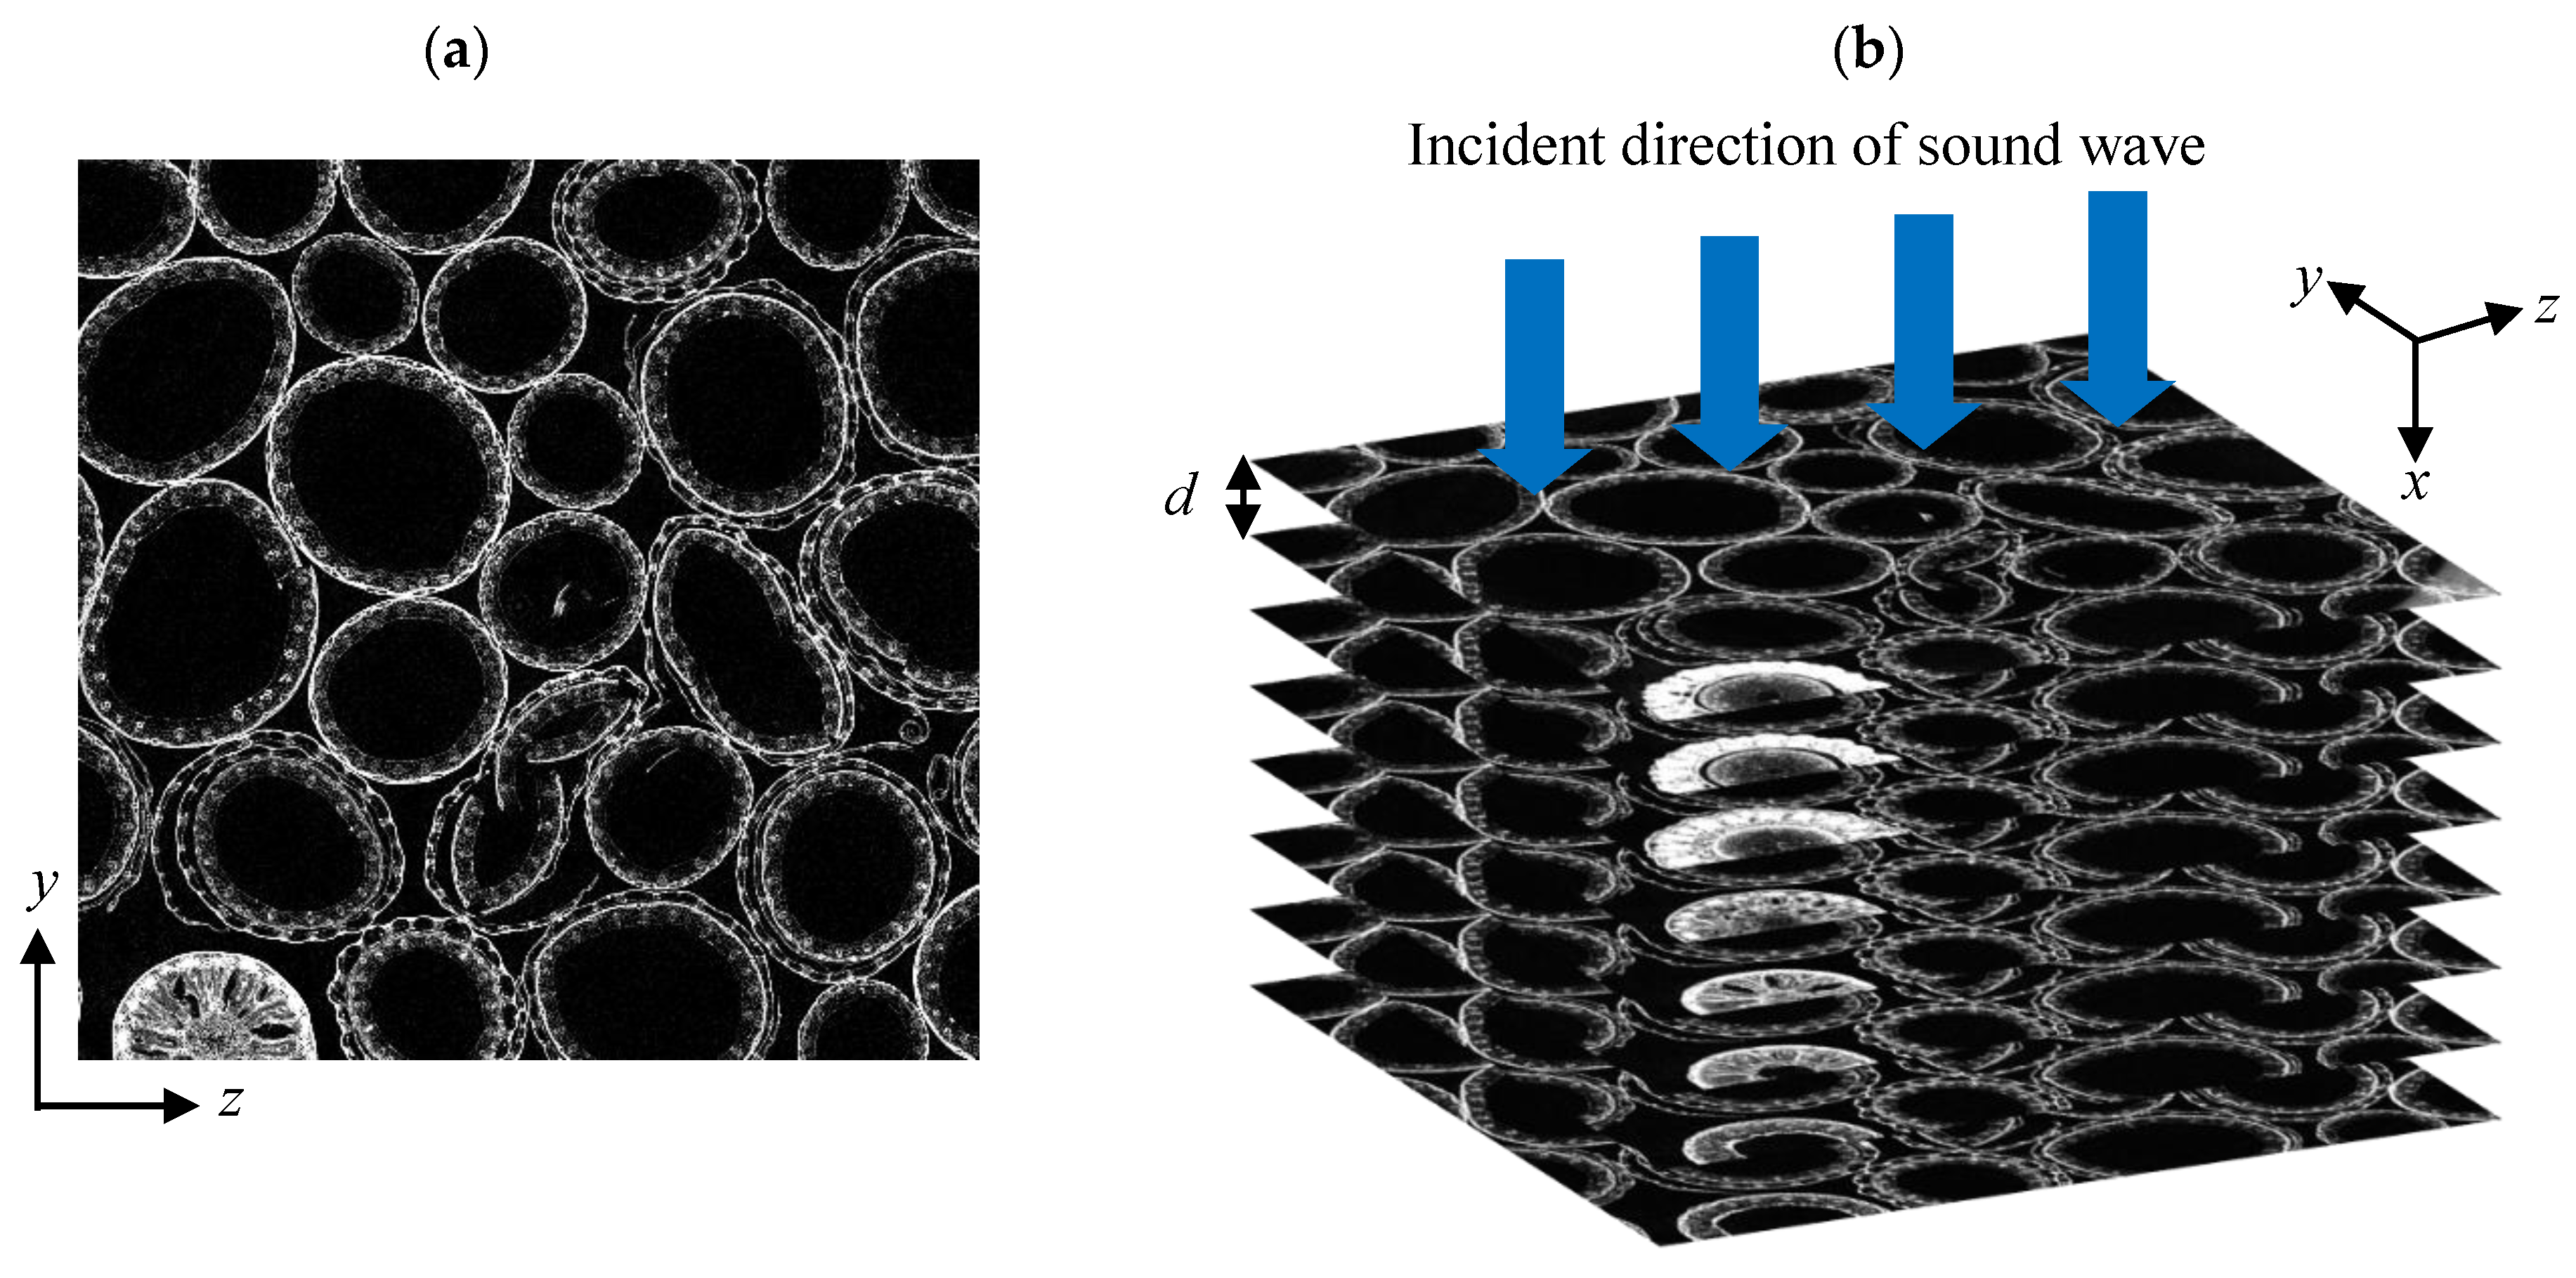
CT images can represent anisotropic and heterogeneous materials in a static state. Figure 3a shows a CT (SKYSCAN 2214; Bruker Corp., Karlsruhe, Germany) cross-sectional image of the wheat straw. As shown schematically in Figure 3b, the tomogram was sliced in the yz plane perpendicular to the direction of the sound wave incidence (x-direction). The image size was 6.67 mm in the x-direction and 13 mm per side in the y– and z–direction. The total number of images was 1026 and a voxel was a cube with an edge of 6.5 µm. The thickness d of the analysis element in Figure 3b corresponds to the pitch of the slices in the x-direction and is, therefore, approximately 6.5 µm. Three sets of 1026 images were stacked to achieve a total thickness of 20 mm. The SEM images used in Section 3 were taken using a JEOL (Tokyo, Japan) JSM-6010 PLUS/LA instrument. Sample groups with similar shapes were collected from the same batch of straw samples for CT scanning and scanning electron microscope (SEM) analysis.

2.4. Derivation of Sound Absorption Coefficient

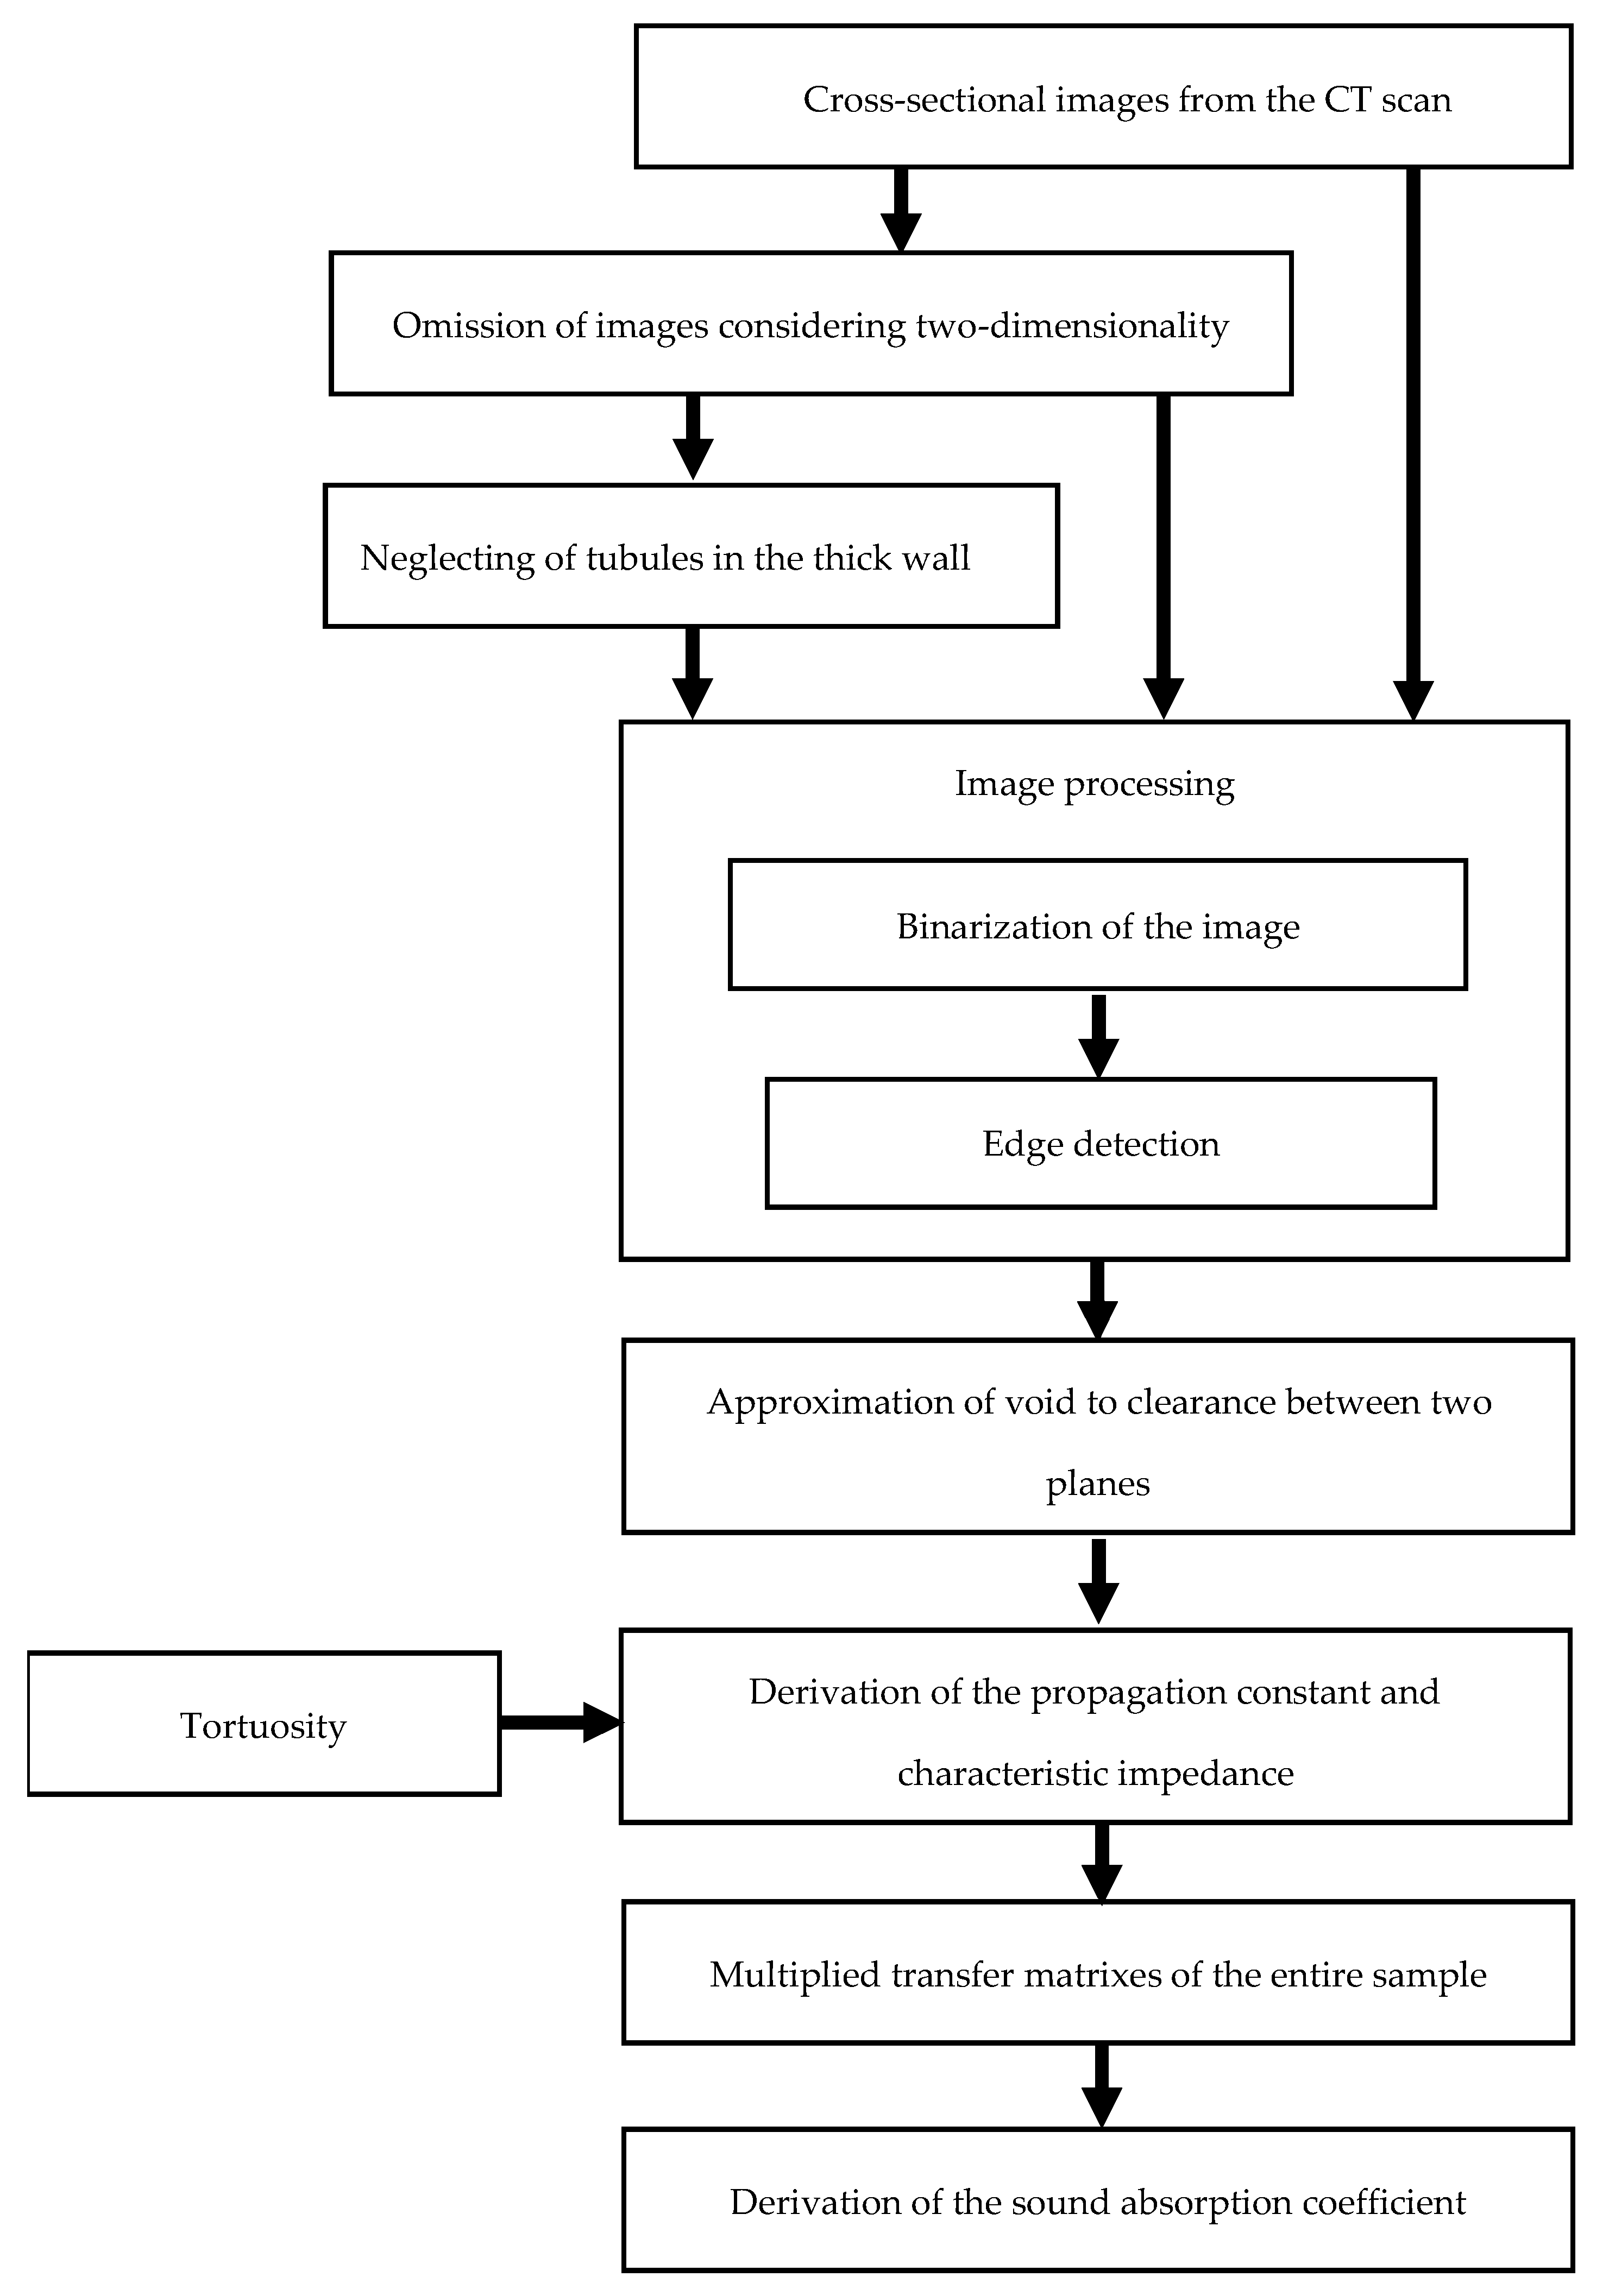
The schematic of the procedure used to derive the sound absorption coefficient of the bundled wheat straw is shown in Figure 4. Because the CT images were 8-bit greyscale images, the skeletal and void areas were not clearly visible. Therefore, binarization and edge detection were performed to clarify the boundary between the skeletal outlines and void areas. By using these processed images, the cross-sectional area of the void and the preference of the skeletal outline in the cross-sectional image plane were obtained. By approximating, based on the skeletal outlines and void areas, the clearance between two parallel planes representing the void area walls, the propagation constant and characteristic impedance were then obtained. Finally, the transfer matrix method was analyzed to obtain the transfer matrix for the entire sample and to derive the normal incident sound absorption coefficient.

2.4.1. Image Processing

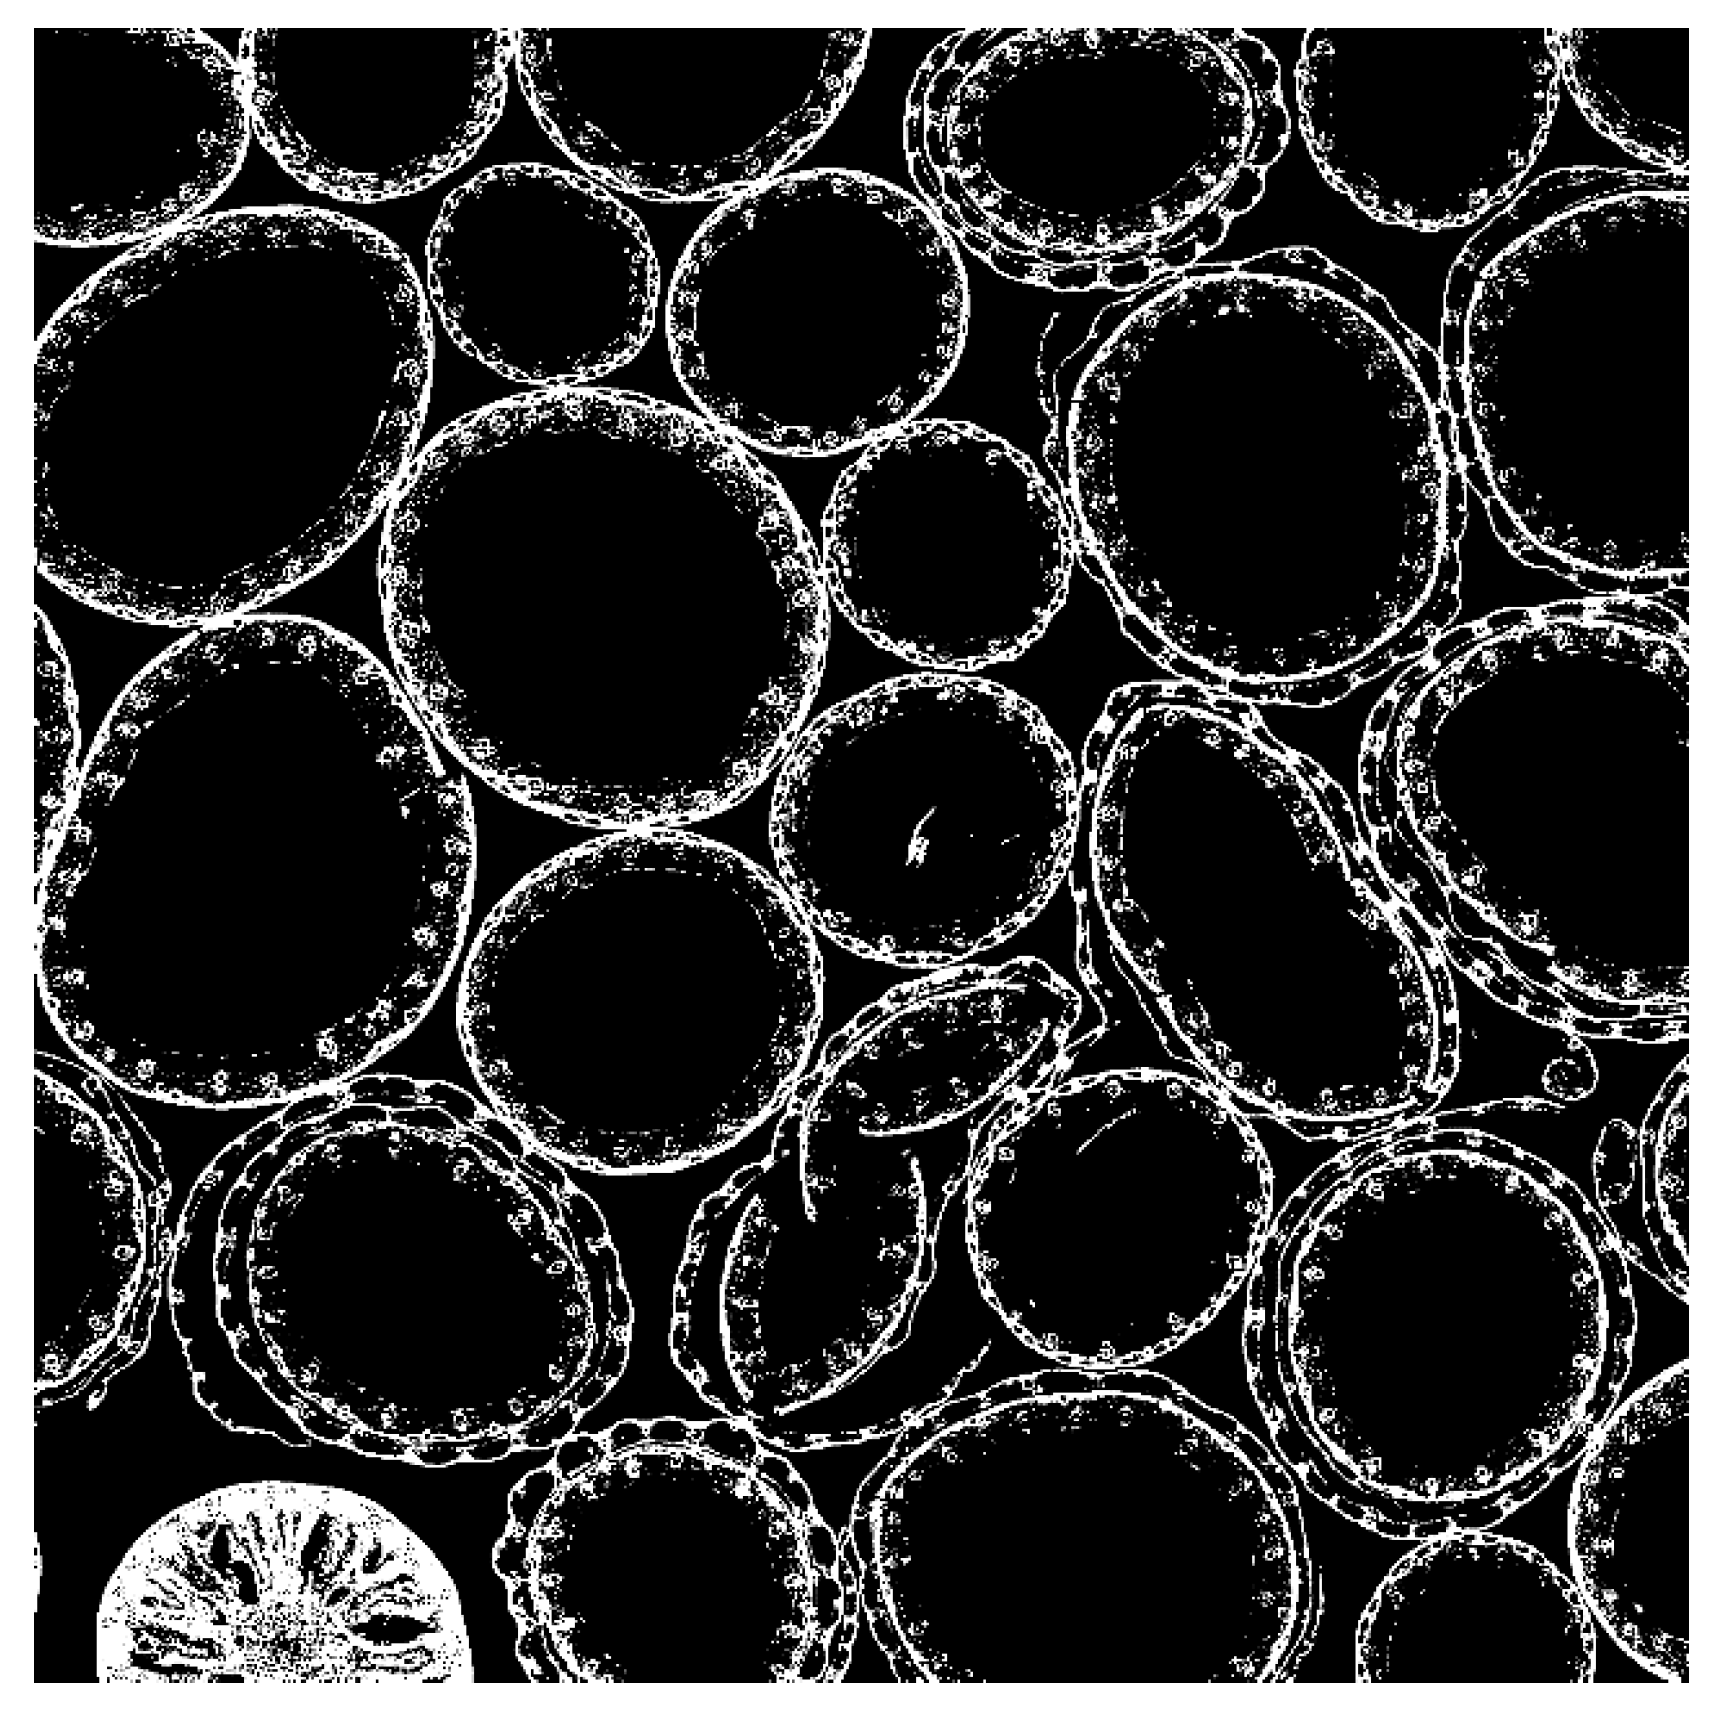
To determine the boundary between the skeletal outlines and the void areas, the original 8-bit greyscale CT images (i.e., each pixel was given a grayscale of 0–255) were binarized (Figure 5). The greyscale pixels were converted to black-and-white binarization based on set thresholds. The average threshold (0.376) was determined using Otsu’s binarization [24] for 11 images extracted at equal intervals from the 1026 CT tomograms.
The Canny edge detection method [25] was used to sharpen the contours of the skeletal outlines to obtain more accurate circumference measurements [26]. By setting an appropriate threshold, noise can be suppressed, and the shapes in the CT images can be accurately captured. This enables a more precise calculation of sound wave attenuation.
Multiple images were used in the derivation of the sound absorption coefficient.

2.4.2. Approximation of Clearance Between Two Planes

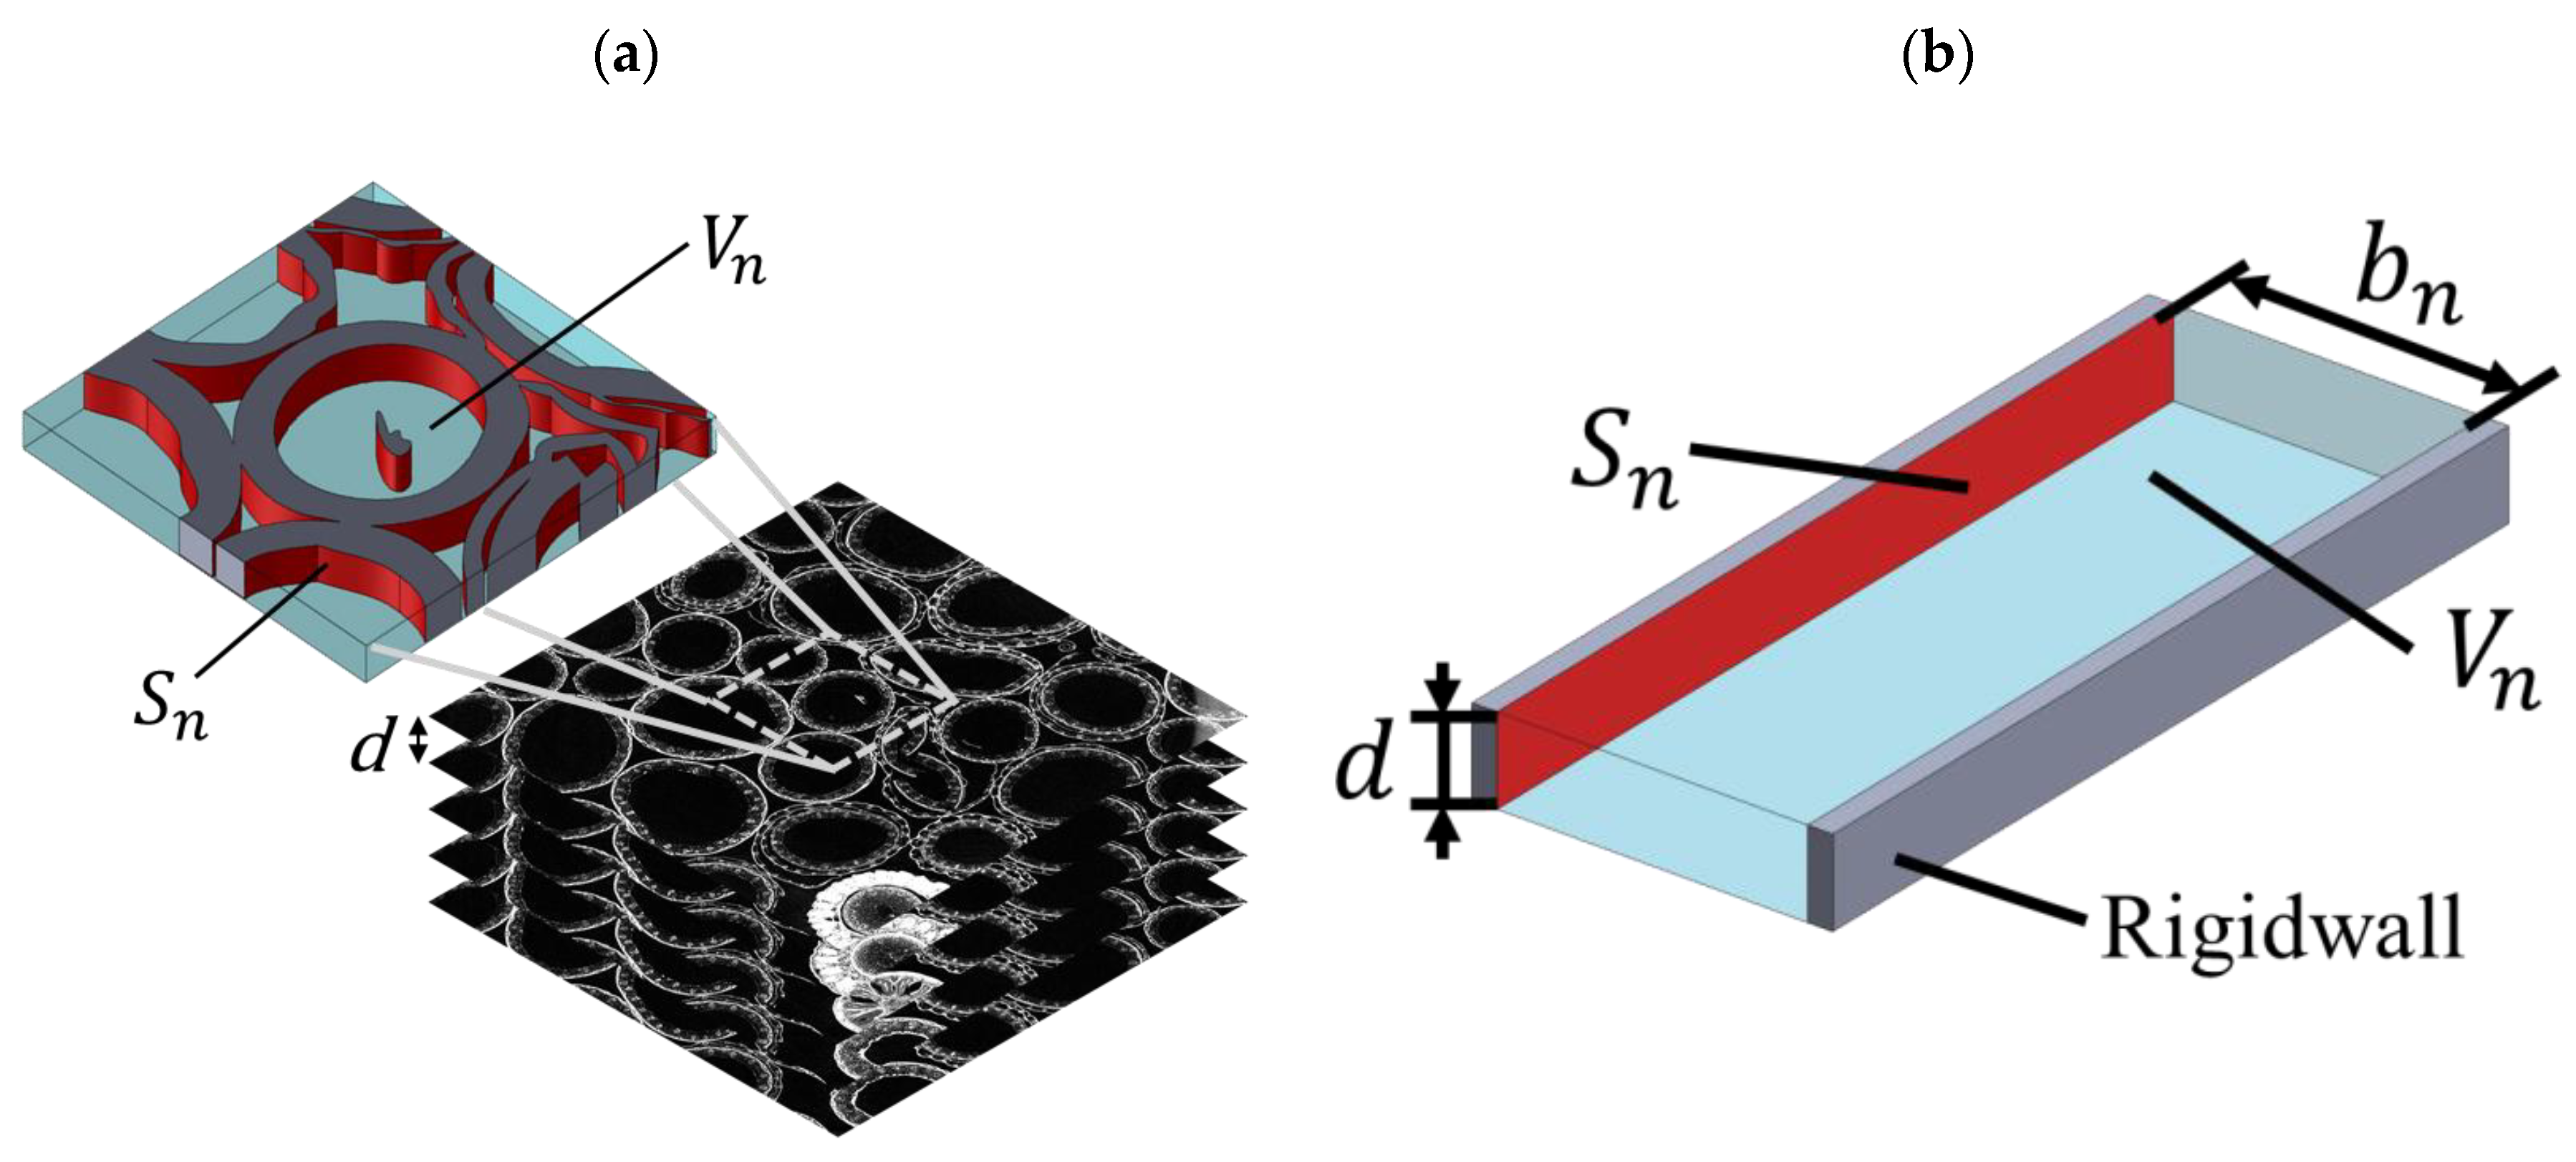
The thickness of the clearance between two planes, bn, was approximated based on the cross-sectional area of the void and the circumference of the skeletal outline, as shown in Figure 6 [23].
Multiplying the cross-sectional area of the void by the pitch, d, of the slice of the CT image, as shown in Figure 6a, obtained in Section 2.4.1, yielded the volume of the void, Vn. Similarly, multiplying the total circumference of the skeletal outline by d yielded the surface area, Sn, of the skeletal section. As shown in Figure 6b, bn for a single tomogram was calculated using Equation (2) using Vn and Sn.
b n = 2 V n S n
bn is the clearance between the two planes used for the derivation of the sound absorption coefficient.

2.4.3. Propagation Constant and Characteristic Impedance

The propagation constant and characteristic impedance, considering the viscosity of the air in a tube, have been studied by Tidgeman [27] and Stinson [28] for circular tubes, by Stinson [29] for equilateral triangle-shaped tubes, and by Beltman [30] for rectangular tubes. Allard’s [23] analysis also considered the degree of α. The methods of Stinson [29] and Allard [23] were applied in the current study. Taking the attenuation of the sound waves into account, the effective density (ρs) and the compression ratio (Cs) were derived, as shown in Equations (3) and (4), as follows:
ρ s = ρ 0 1 tanh j λ s j λ s 1 , λ s = b n 2 ω ρ 0 η
C s = 1 κ P 0 1 + κ 1 tanh j N p r λ s j N p r λ s
where ρ0 is the density of air, η is the viscosity of air, κ is the specific heat ratio of air, P0 is the atmospheric pressure, λs is the mediating variable, bn is the air gap thickness between the two planes, ω is the angular frequency of sound waves, and Npr is the Prandtl number.
Figure 7 shows the Cartesian coordinate system used to approximate the clearance between the two planes. The three-dimensional analysis used the Navier–Stokes equations, the gas equation of state, the continuity equation, the energy equation, and the dissipative function to represent heat transfer.
According to Equations (5) and (6), the propagation constant, γ, and characteristic impedance, Zc, can be expressed using ρs and the compressibility, Cs, as follows:
γ = j ω ρ s C s
  Z c = ρ s C s
According to Equations (5) and (6), γ and the Zc can be expressed by Equations (7) and (8), respectively.
By using ρs multiplied by α, γ, Equation (7), and Zc, Equation (8) considering α can be obtained [23].
γ = j ω α ρ s C s  
  Z c = α ρ s C s

2.4.4. Transfer Matrix

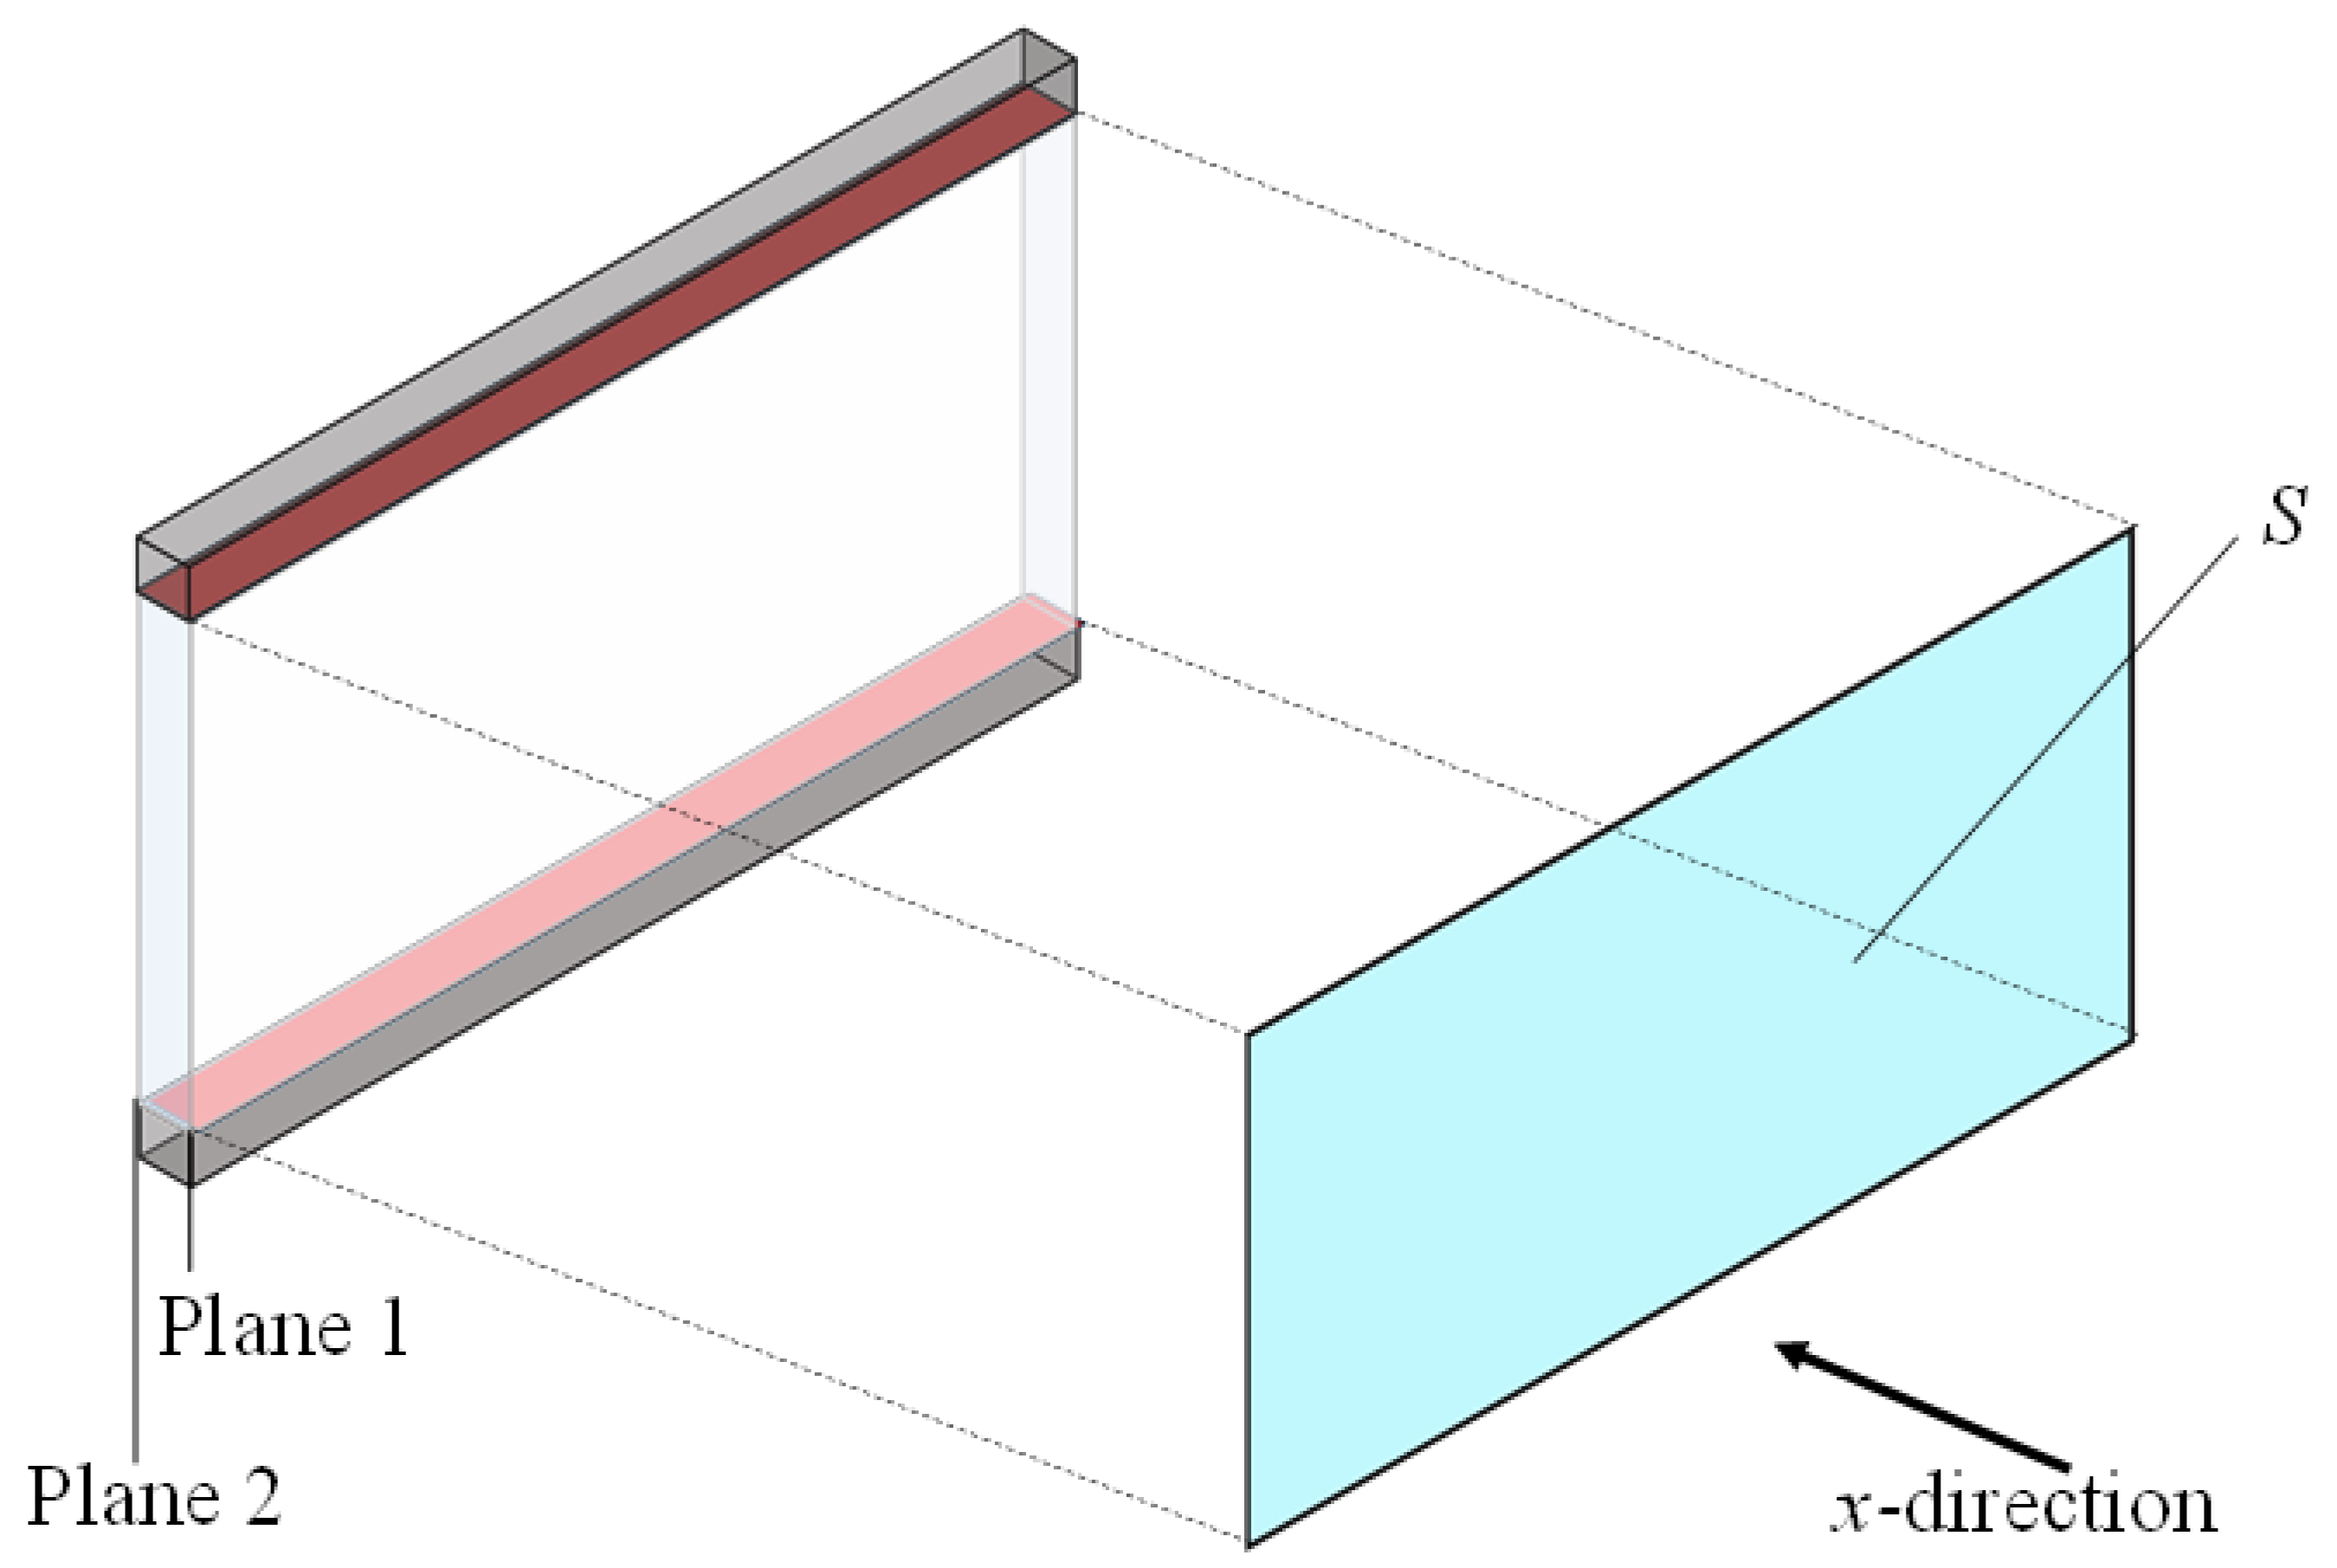
Figure 8 shows a schematic of one element in the x-direction of the clearance between the two planes shown in Figure 7. The clearance between the two planes was analyzed using the transfer matrix method for sound pressure and volume velocity.
As shown in Equation (9), the cross-sectional area S, length l, Zc, and γ of the clearance are used to represent the four-terminal constants AD of the acoustic tube element, and the one-dimensional wave equation is written as a transfer matrix T [23].
T = cosh γ l Z c S s i n h γ l S Z c s i n h γ l cosh γ l = A B C D
Plane 1 is the plane of incidence of the sound wave, and Plane 2 is the plane of transmission of the sound wave. If the sound pressure and particle velocity in Plane 1 are p1 and u1, respectively, and similarly, p2 and u2 in Plane 2, the transfer matrix can be expressed by Equation (10).
p 1 S u 1 = A B C D p 2 S u 2
The transfer matrix in each CT image was derived by applying Equation (10) to the clearance between the two planes.
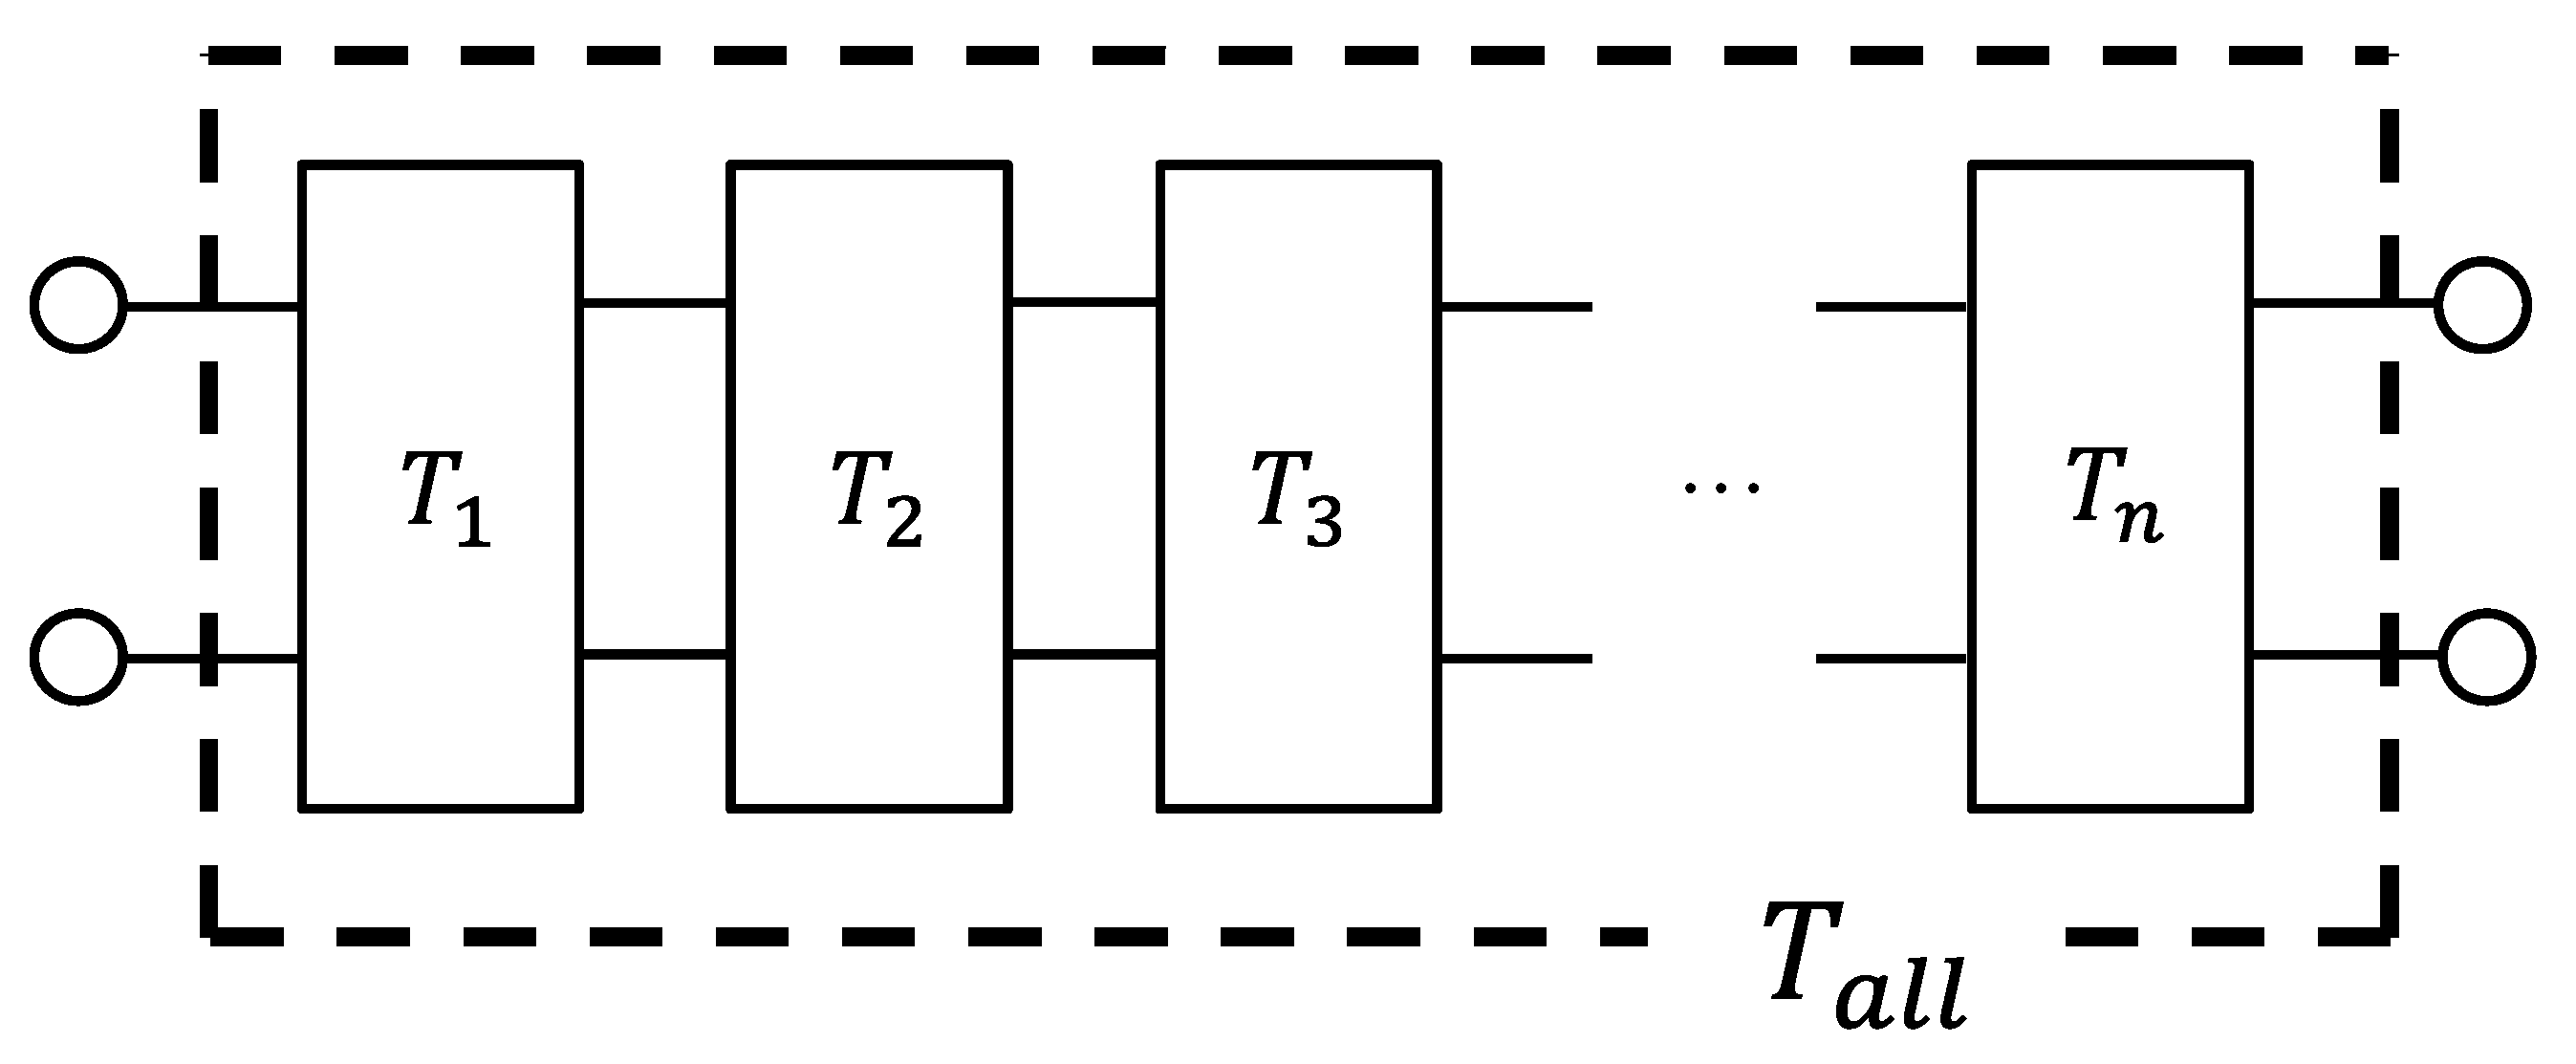
Based on the equivalent circuit shown in Figure 9, the transfer matrix for the entire sample, Tall, was calculated by cascading the transfer matrices of the successive CT images in the x-axis direction. The number of cascaded transfer matrices is equal to the number of CT images (n = 1026).

2.4.5. Normal Incident Sound Absorption Coefficient

The sound absorption coefficient was calculated from the transfer matrix Tall obtained in Section 2.4.4. With the sample mounted in the impedance measurement tube, Plane 2, as shown in Figure 8, was the rigid wall. Equation (10) can, therefore, be transformed by Equation (11) since the particle velocity u2 = 0, yielding Equation (12).
p 1 S u 1 = A B C D p 2 0
p 1 S u 1 = A p 2 C p 2
The specific acoustic impedance, Z0, of the sample can be expressed by Equation (13) as follows:
Z 0 = p 0 u 0
where p0 and u0 are the sound pressure and particle velocity, respectively, just outside and in front of Plane 1.
Therefore, by p0 = p1, S0u0 = Su1, and Equation (13), the Z0 of the sample can be expressed by Equation (14) as follows:
Z 0 = p 0 u 0 = p 0 u 0 S 0 S 0 = p 1 u 1 S S 0 = A C S 0
The relationship between the Z0 and the reflectance, R, is expressed by Equation (15) as follows:
R = Z 0 ρ 0 c 0 Z 0 + ρ 0 c 0
The relationship between R and the sound absorption coefficient, α, shown in Equations (15) and (16), respectively, gives the normal incident α of the sample.
α = 1 R 2

3. Comparison of Measured and Theoretical Incident Sound Absorption Coefficients

3.1. Theoretical Incident Sound Absorption Coefficient

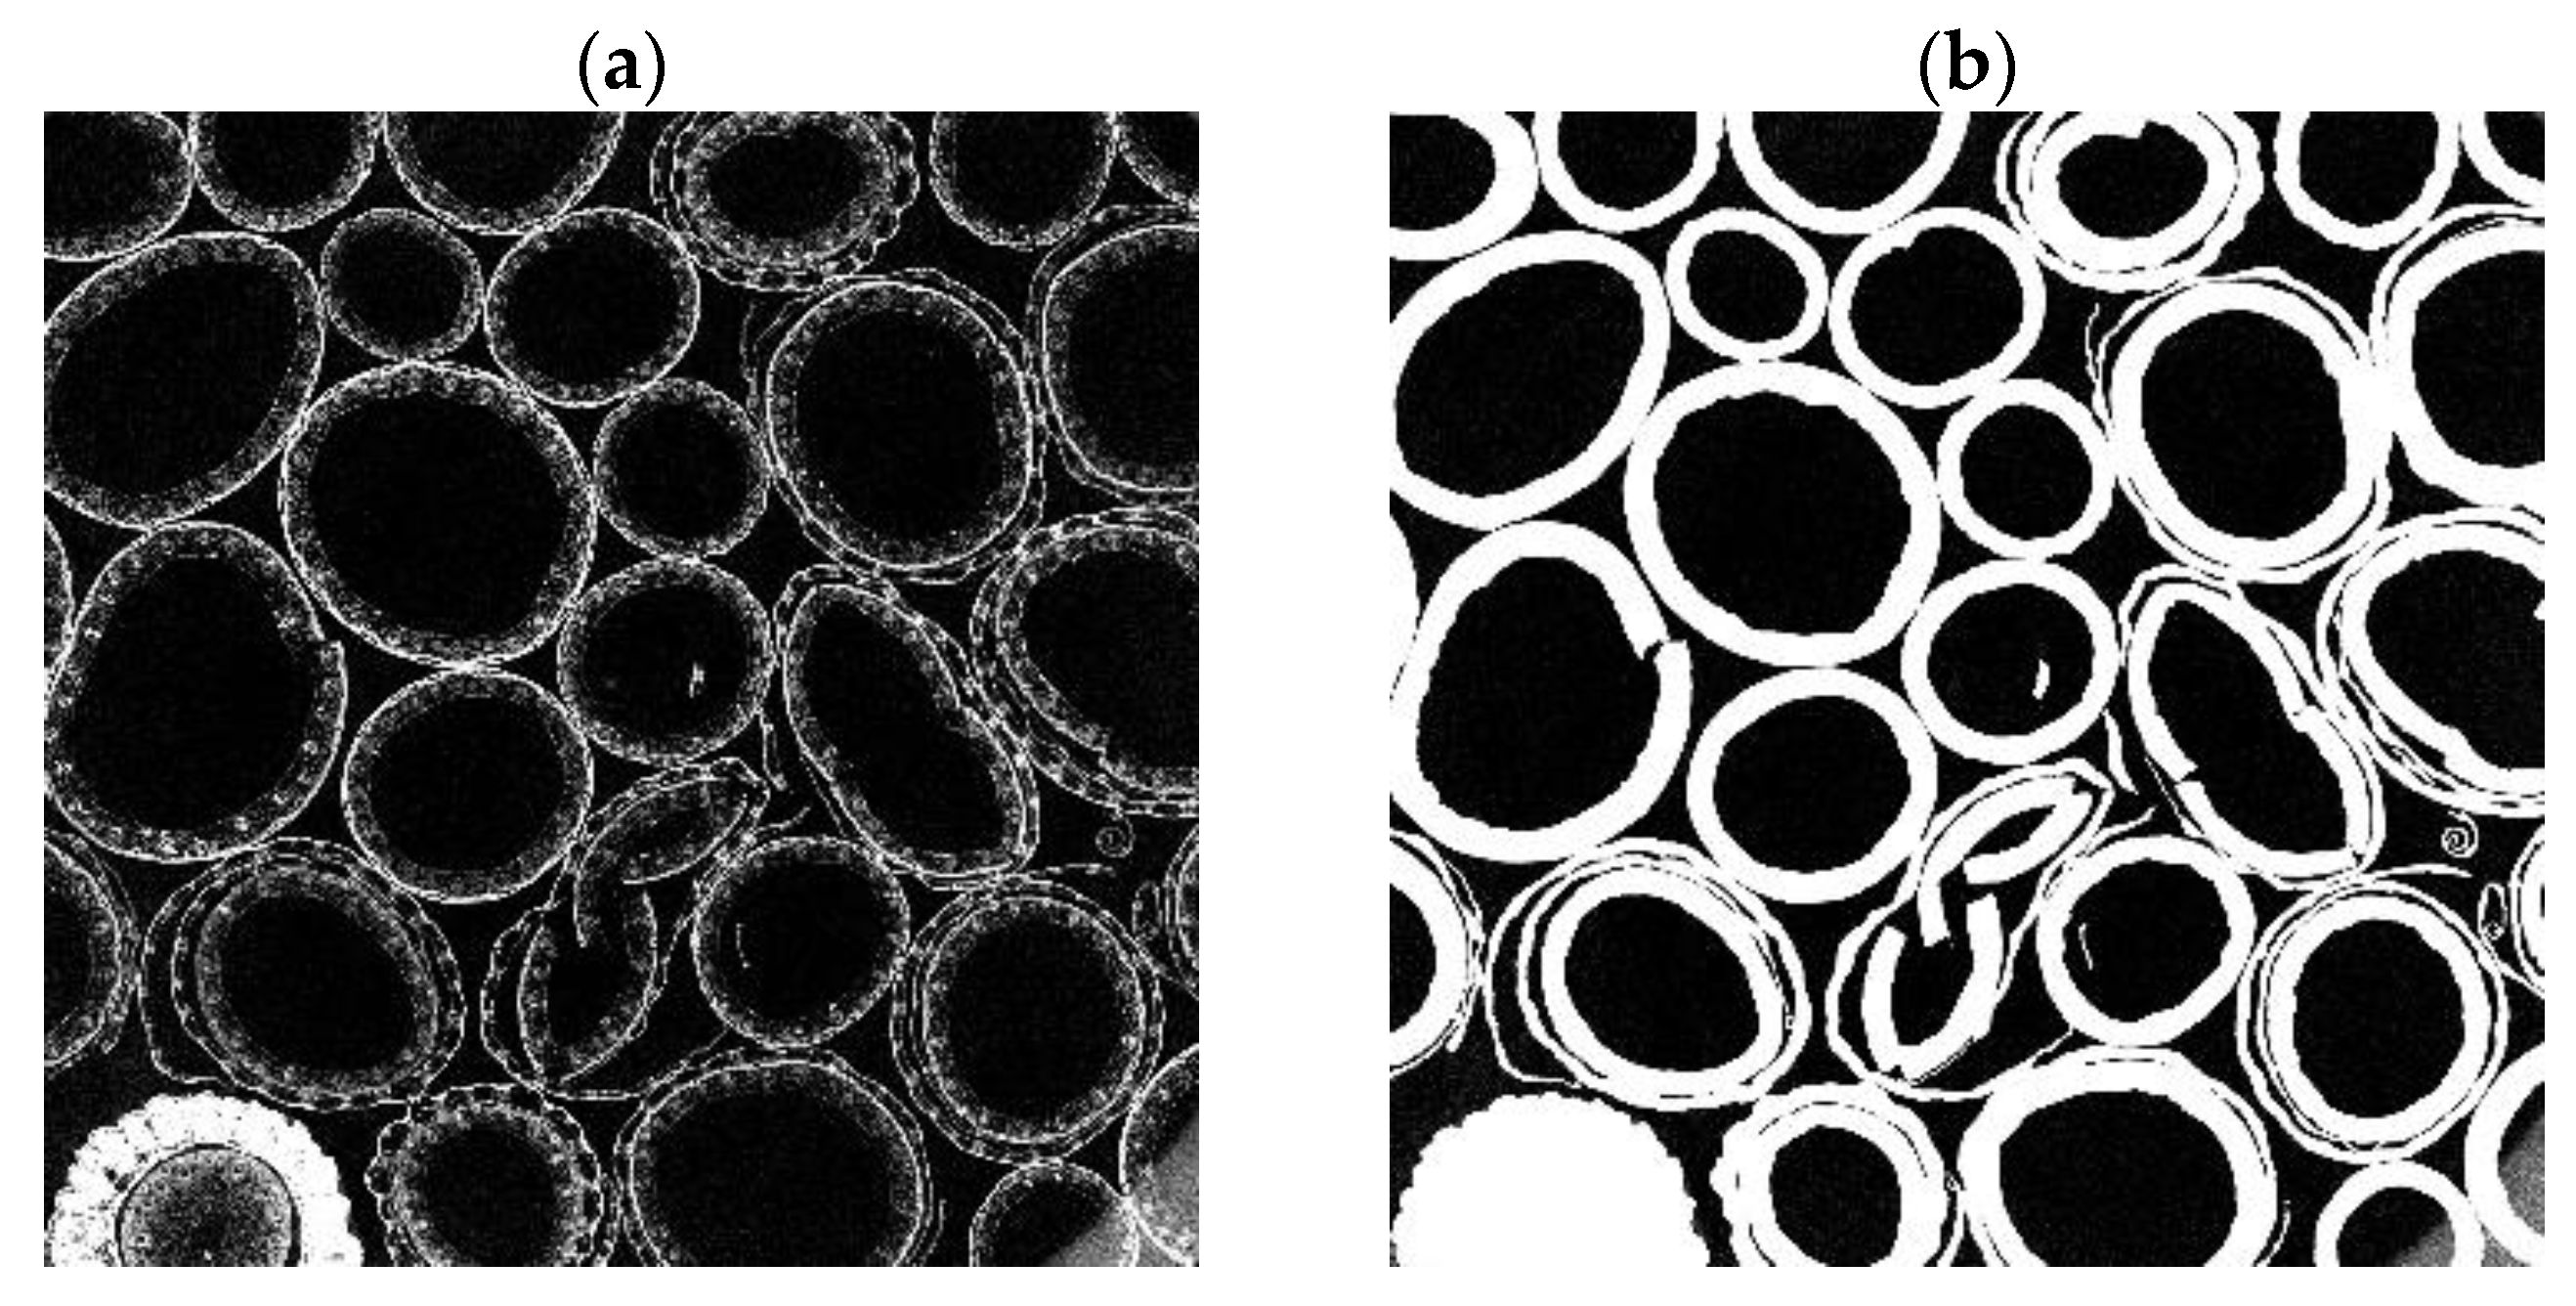
The theoretical incident sound absorption coefficients obtained from the CT images were compared with the measured coefficients (Figure 10). The theoretical values changed depending on the threshold value used in the binarization process. The percentage of black pixels among all pixels represents the porosity. In other words, the porosity is uniquely determined by the threshold value and is directly related to the sound absorption curve. The binarized CT images for each threshold value (i.e., 0.2, 0.376, and 0.6) are shown in Figure 11a–c, respectively. When the threshold value is 0.2, nonexistent structures and noise are apparent in the image (Figure 11a), and the surface area of the wheat straw skeleton is overestimated. This is thought to be why the sound absorption peak in Figure 10 is the highest.
When the threshold value is 0.376, the value obtained by Otsu’s binarization in Section 2.4.1, little noise is apparent in the image, and the structure is captured without excess or deficiency (Figure 11b). Therefore, the average value of 0.376 was appropriate for the binarization of the CT images used in this study. However, the theoretical values calculated using the 0.376 threshold value, shown in Figure 10, appear to be overestimated. The reason for this will be discussed in Section 3.4.
When the threshold value is 0.6, the wheat straw skeleton is excessively removed from the image (Figure 11c).

3.2. Theoretical Absorption Coefficient Considering Tortuosity

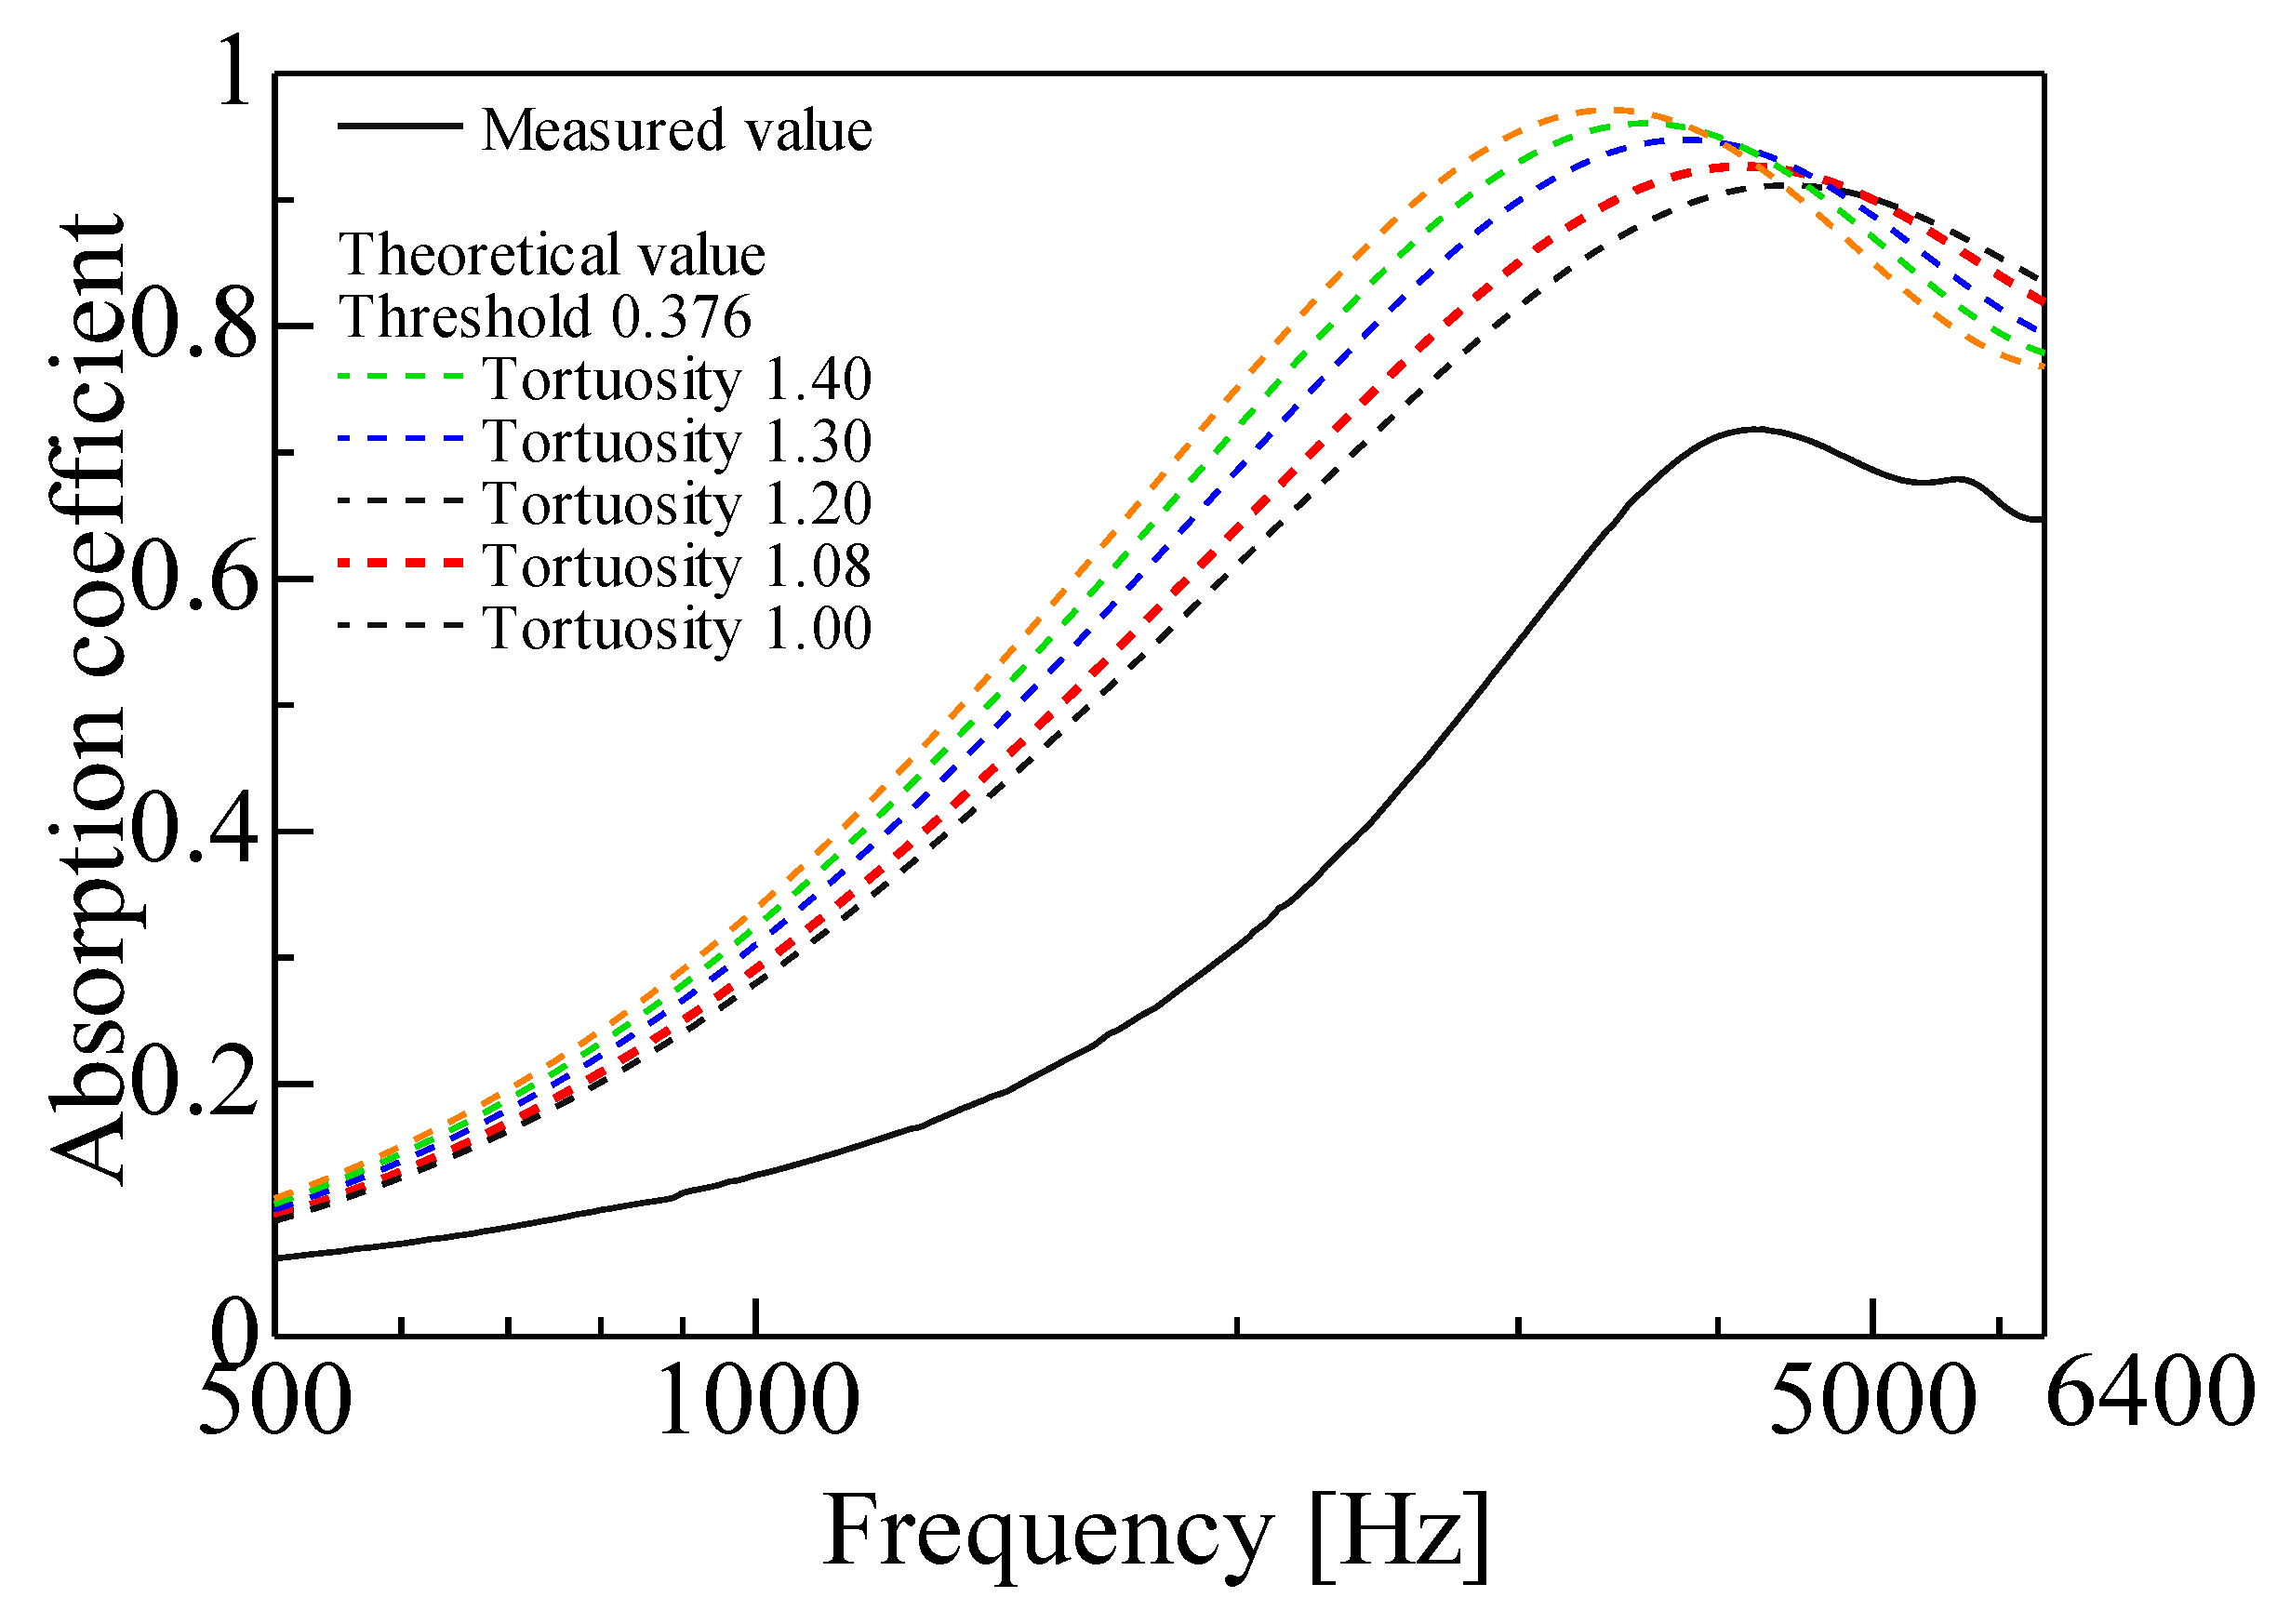
Figure 12 shows the theoretical absorption coefficient considering α (i.e., 1.00, 1.08, 1.20, 1.30, and 1.40). By considering α, the theoretical absorption coefficient values showed increased peak sound absorption and decreased peak frequency. In the following sections, the theoretical absorption coefficient considering α = 1.08 is presented.

3.3. Changes in Theoretical Absorption Coefficient When Approaching a Two-Dimensional Model

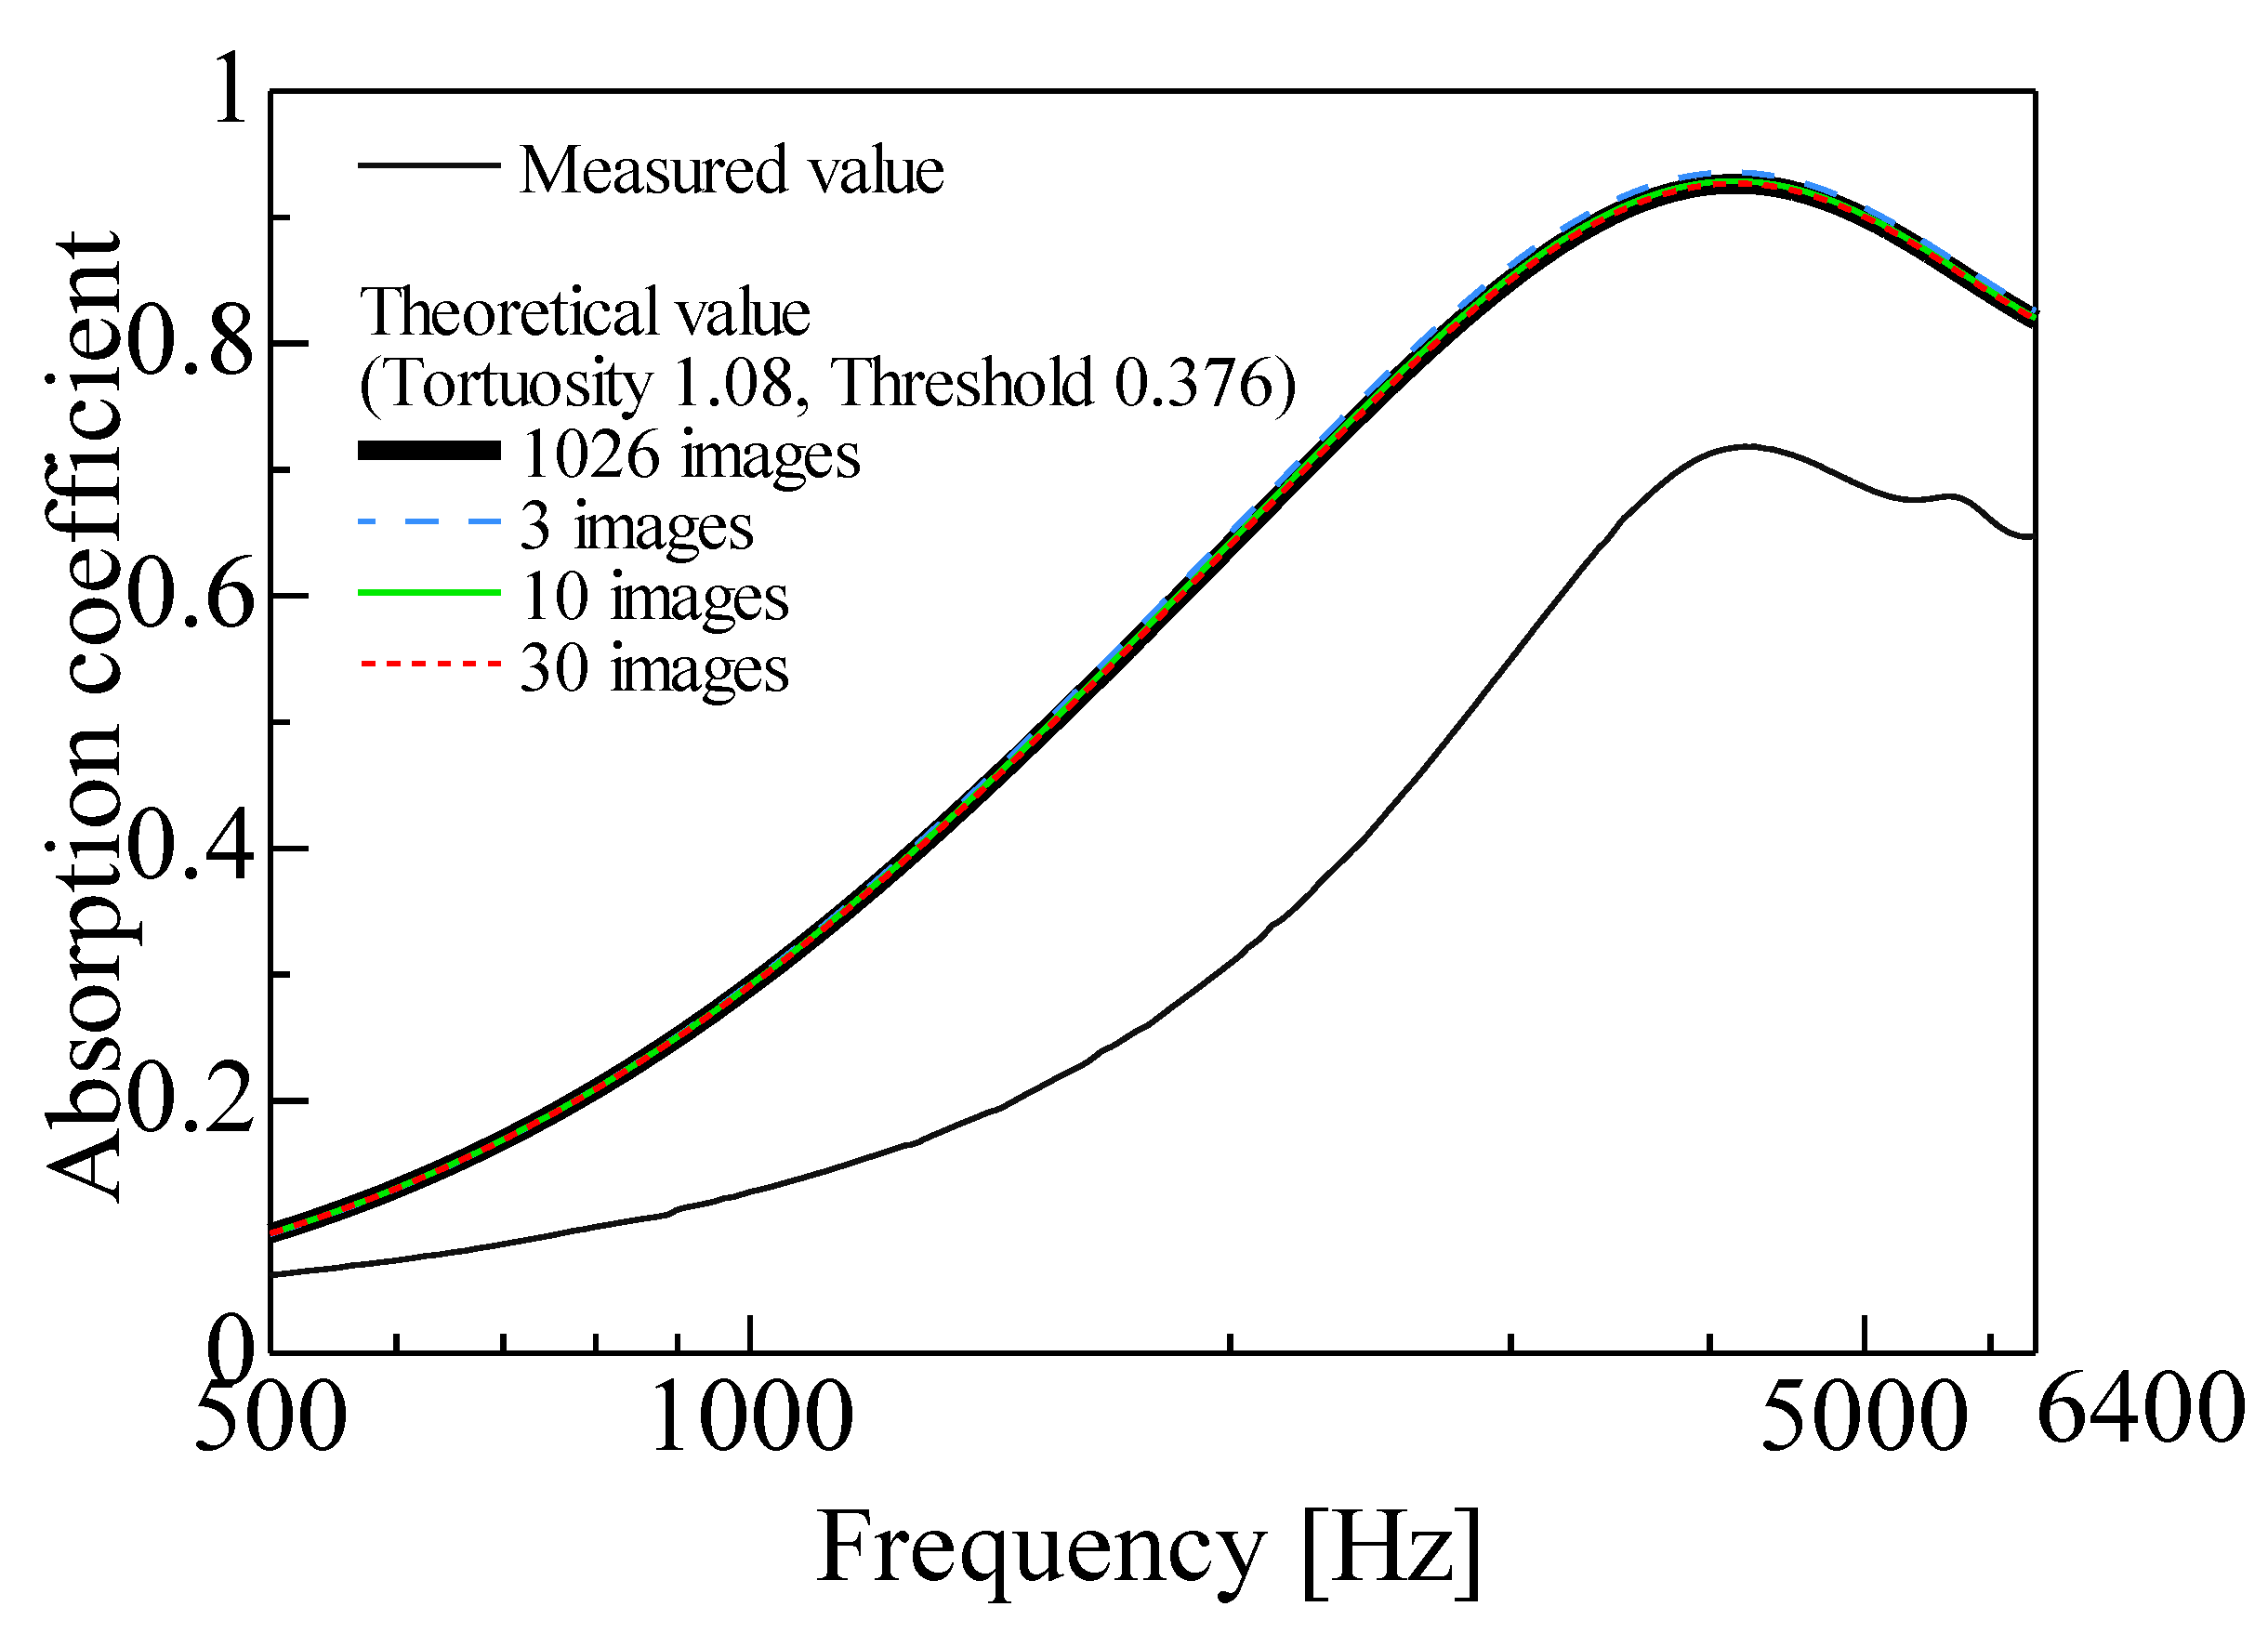
It is considered that the sound absorption structure of wheat straw has a certain degree of two-dimensionality in the longitudinal direction. Therefore, the effect of reducing the number of CT images used to calculate the theoretical absorption coefficient was investigated. Figure 13 shows that using either 10 or 30 CT images resulted in almost the same theoretical absorption coefficients as using all 1026 CT images. The sound absorption coefficient using 3 CT images was not as close as that of using all 1026 CT images. This shows that sufficient estimation accuracy can be obtained when calculating the theoretical sound absorption coefficient of bundled wheat straw by using 10 or more CT images per 20 mm sample thickness. In other words, applying the transmission matrix method to shapes that are close to a two-dimensional structure, such as straw, requires several transmission matrices per 20 mm of thickness.
Additionally, the pitch of the CT images was varied to fit the 20 mm sample thickness.

3.4. Observation of Wheat Straw Cut Surface Using SEM

In Section 3.1, it was suggested that the theoretical threshold value of 0.376 was overestimated. This issue is discussed here.
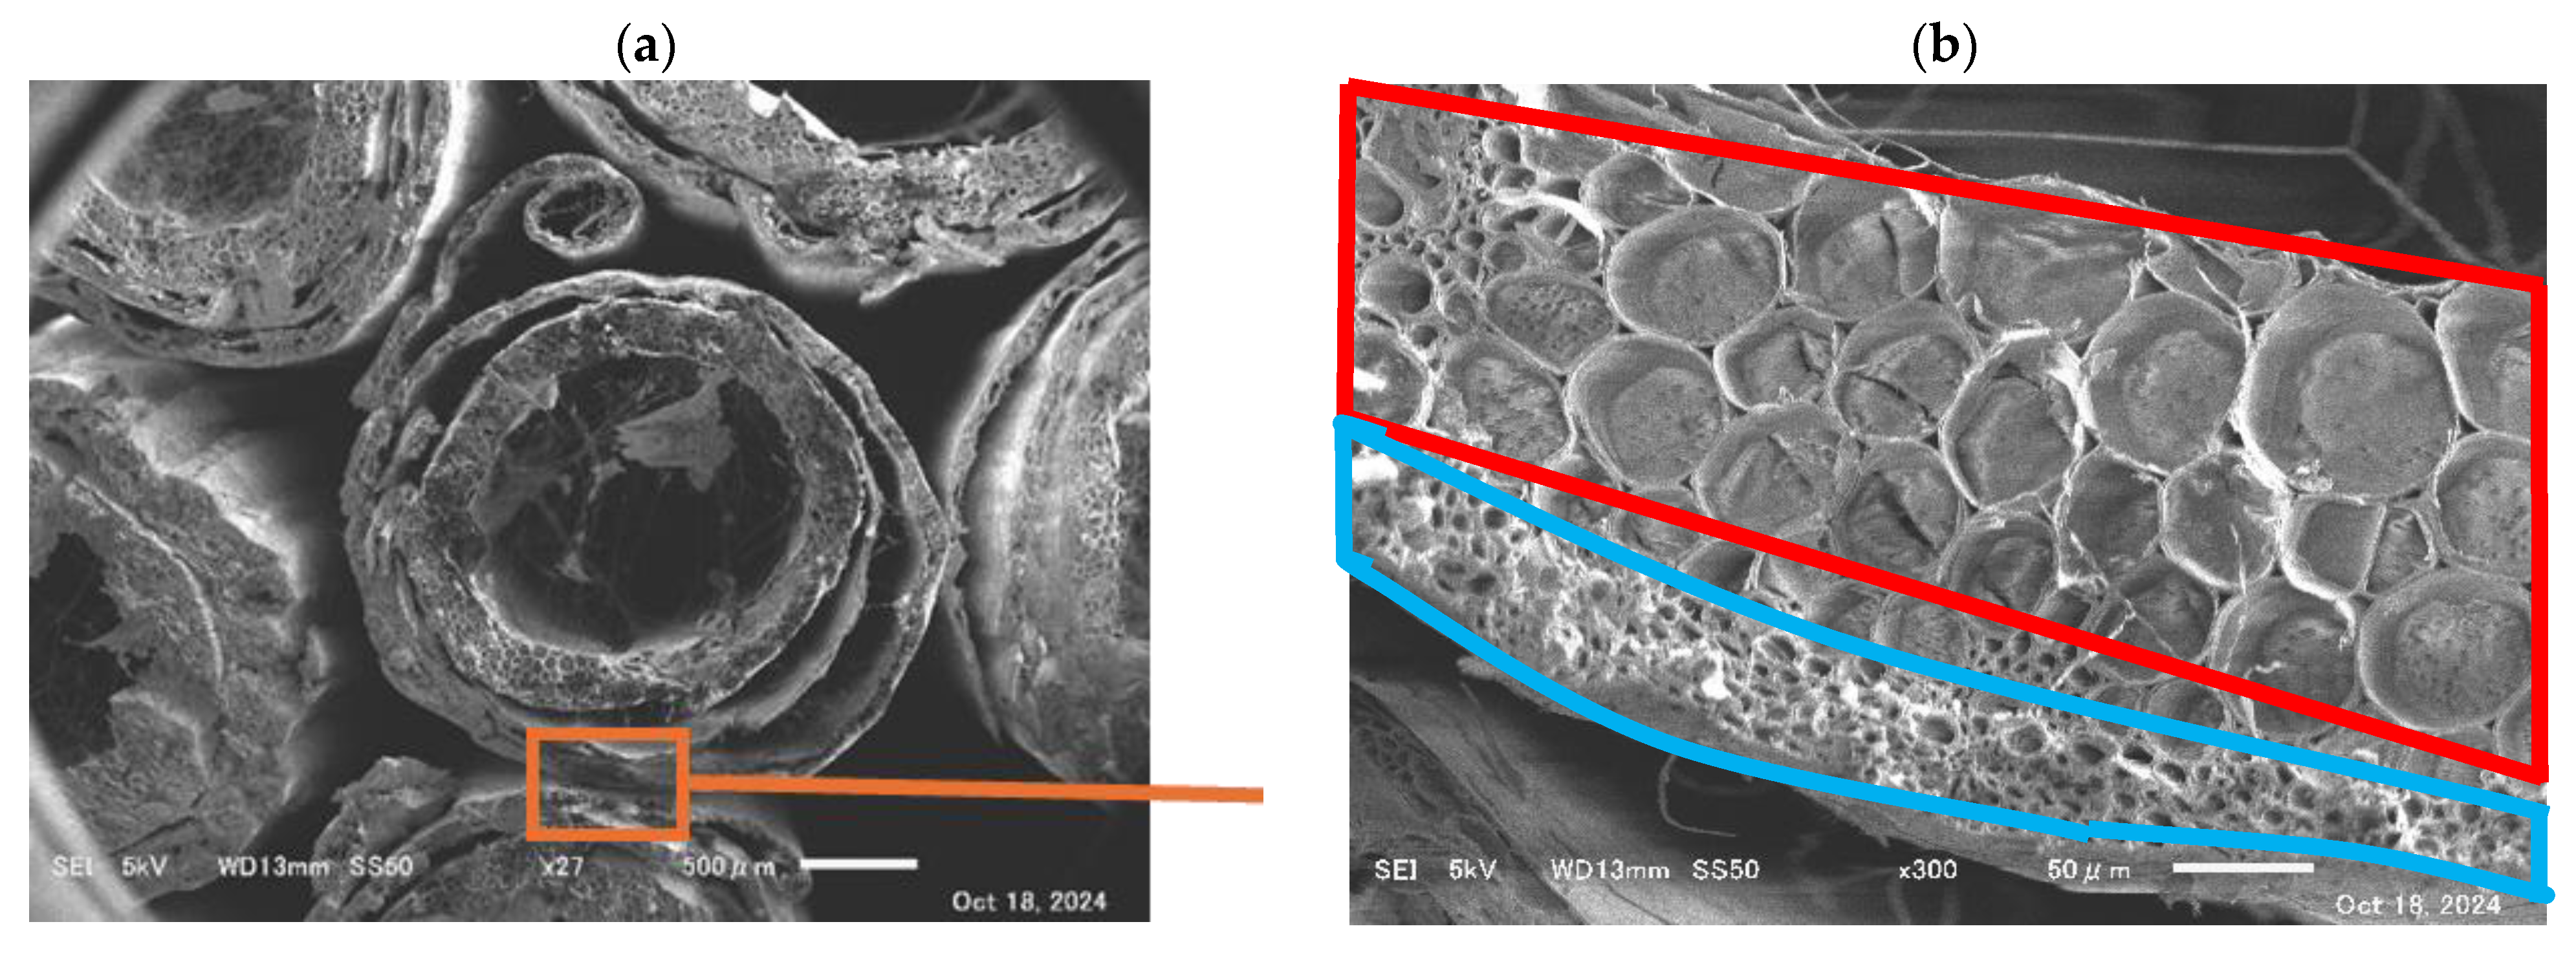
Figure 14a shows the SEM image of the cut surface of the wheat straw. This is a different sample to the one shown in the CT images; however, it was from the same harvest lot. The enlarged image of this surface (Figure 14b) shows a group of tubules with diameters of approximately 0.02–0.1 mm, which can also be observed in the CT image shown in Figure 5, and a group of microtubules with diameters of approximately 0.003–0.02 mm, which are difficult to observe in the CT image shown in Figure 5. The SEM image shows that the group of tubules is approximately 0.03 mm deep; however, they were compressed by a wire pressing against them. Therefore, it was not possible to determine from the SEM images whether the microtubules were continuous or closed.

3.5. Estimation of Sound Absorption Coefficient of Thick-Walled Portion of Wheat Straw

In Section 3.4, it was found that the thick-walled portion of the wheat straw was porous, consisting of a group of microtubules.
Because CT is a tomographic imaging technique, a cross-sectional image of the skeleton is captured, even if it is a sealed void. Therefore, it was considered that the thick-walled portion of the wheat straw (the porous part with discontinuous tubules) was imaged by CT as a fine skeleton.
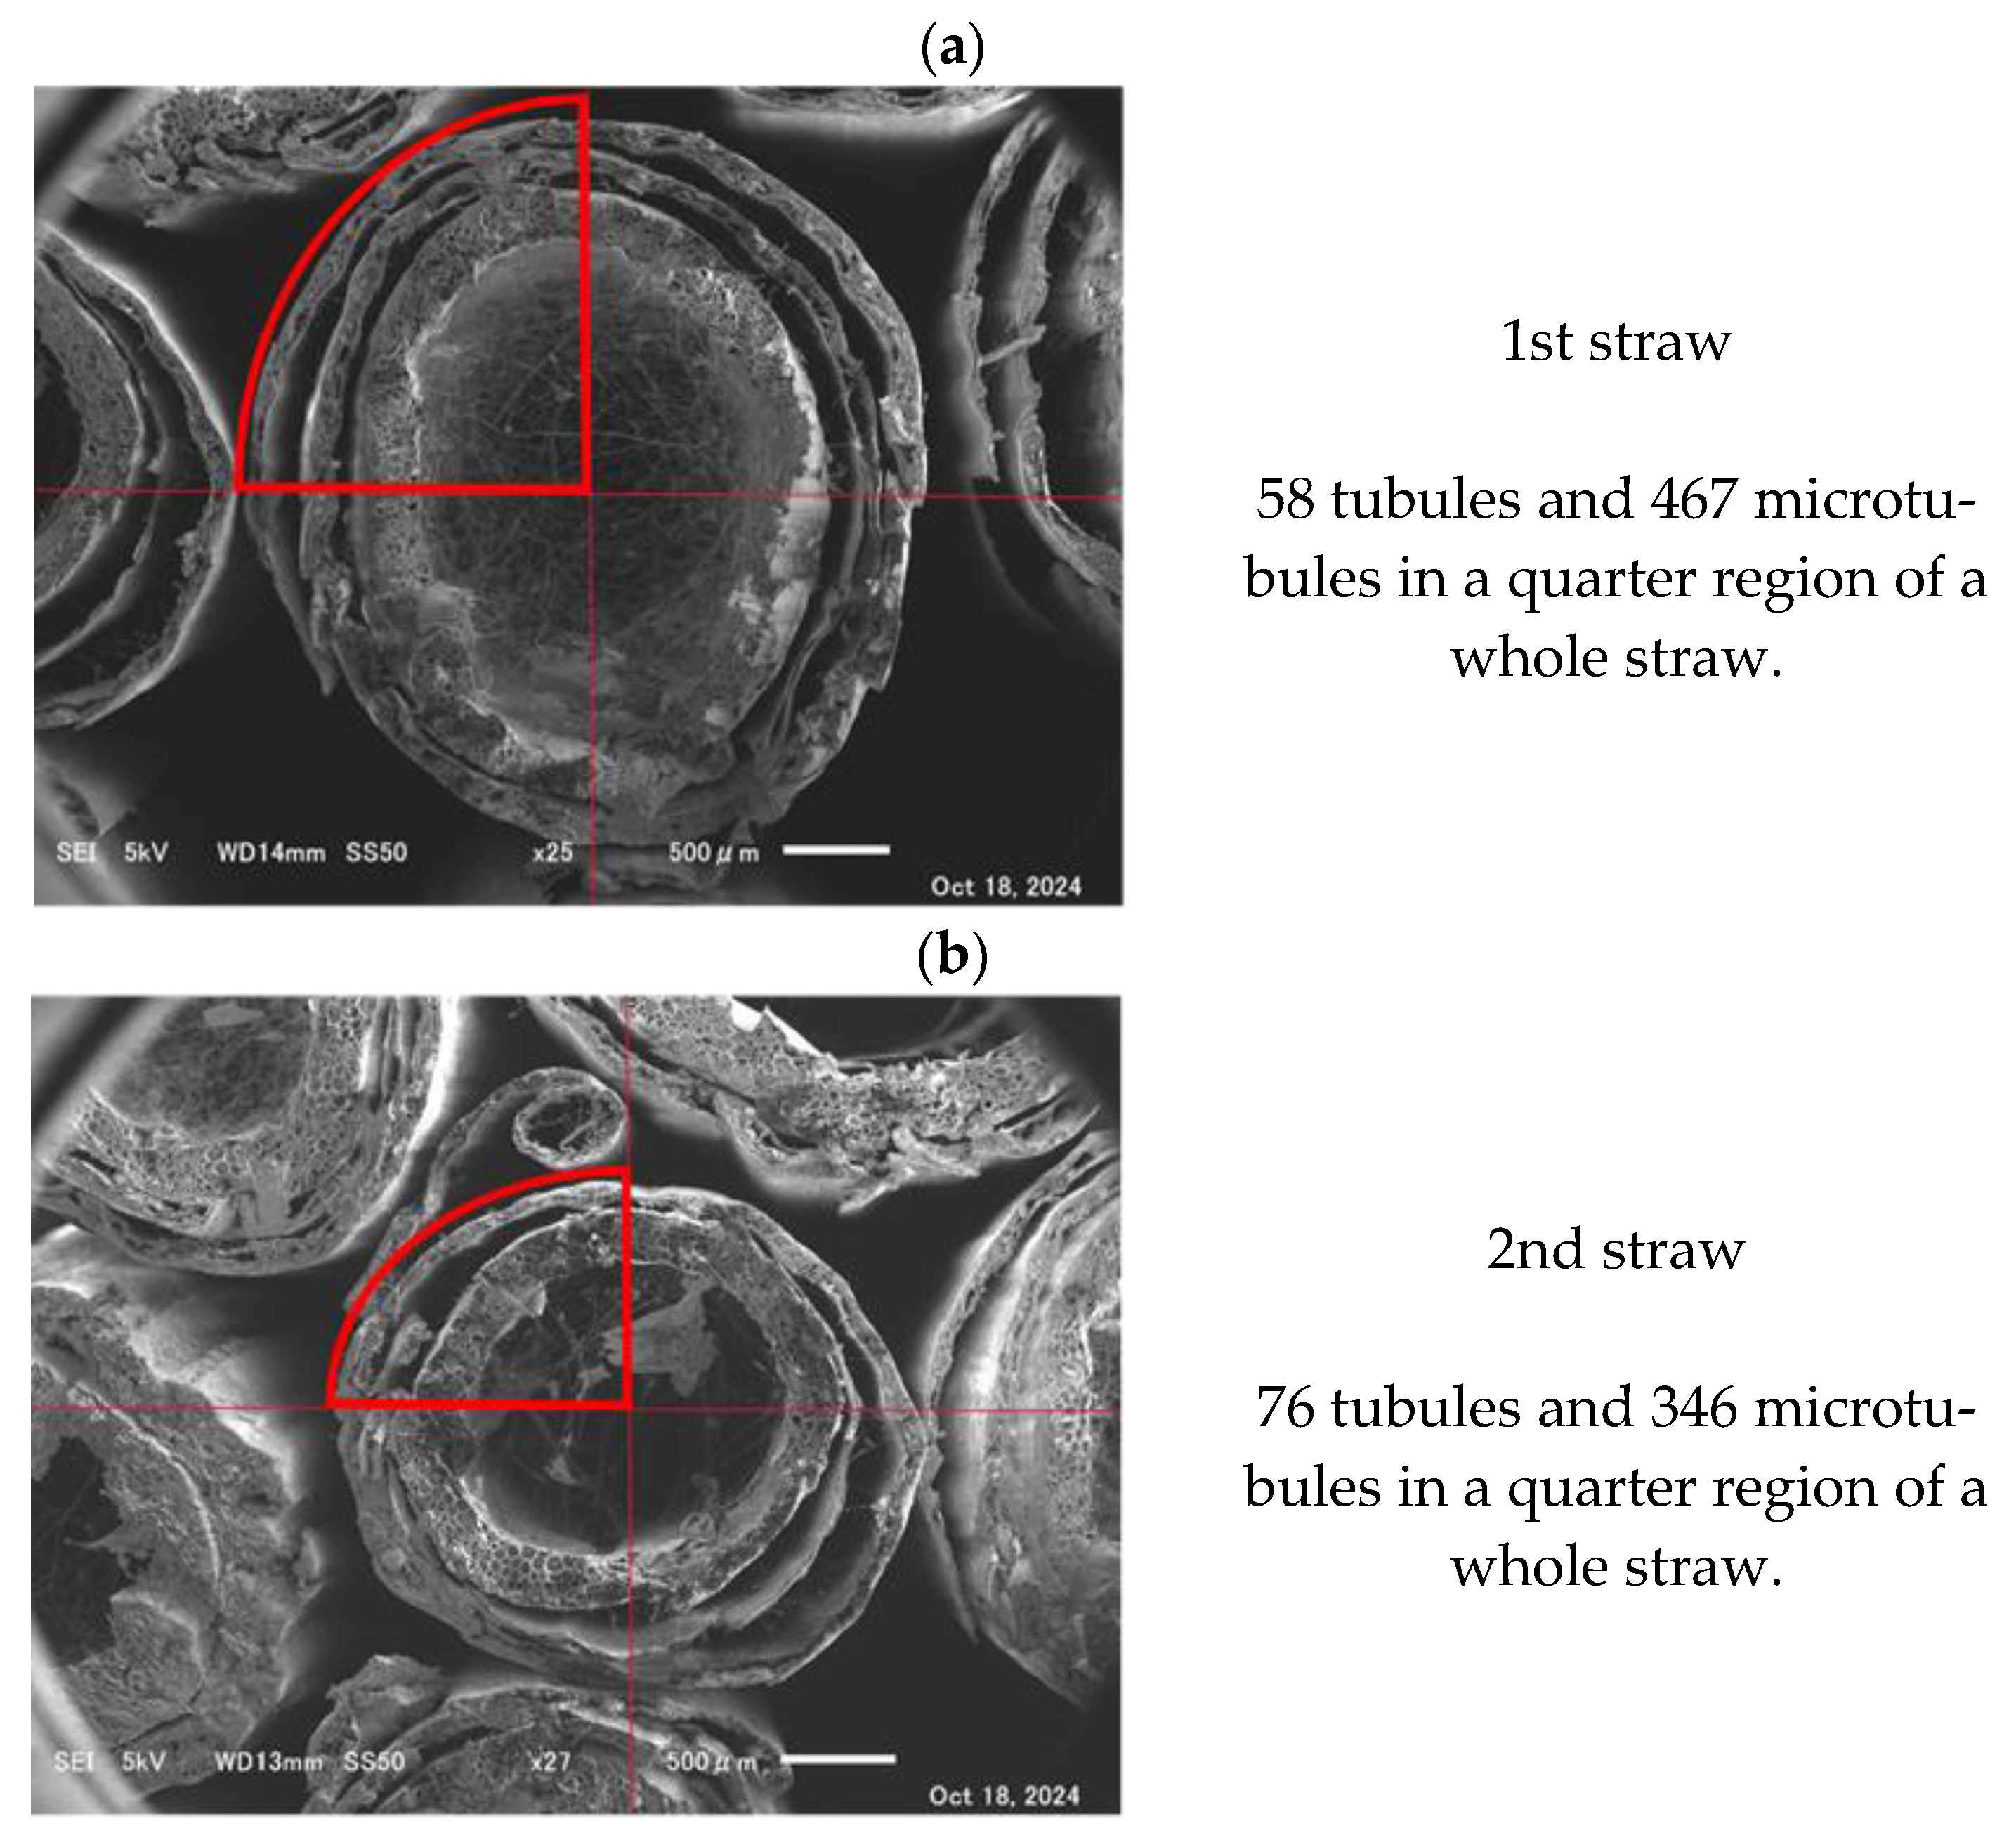
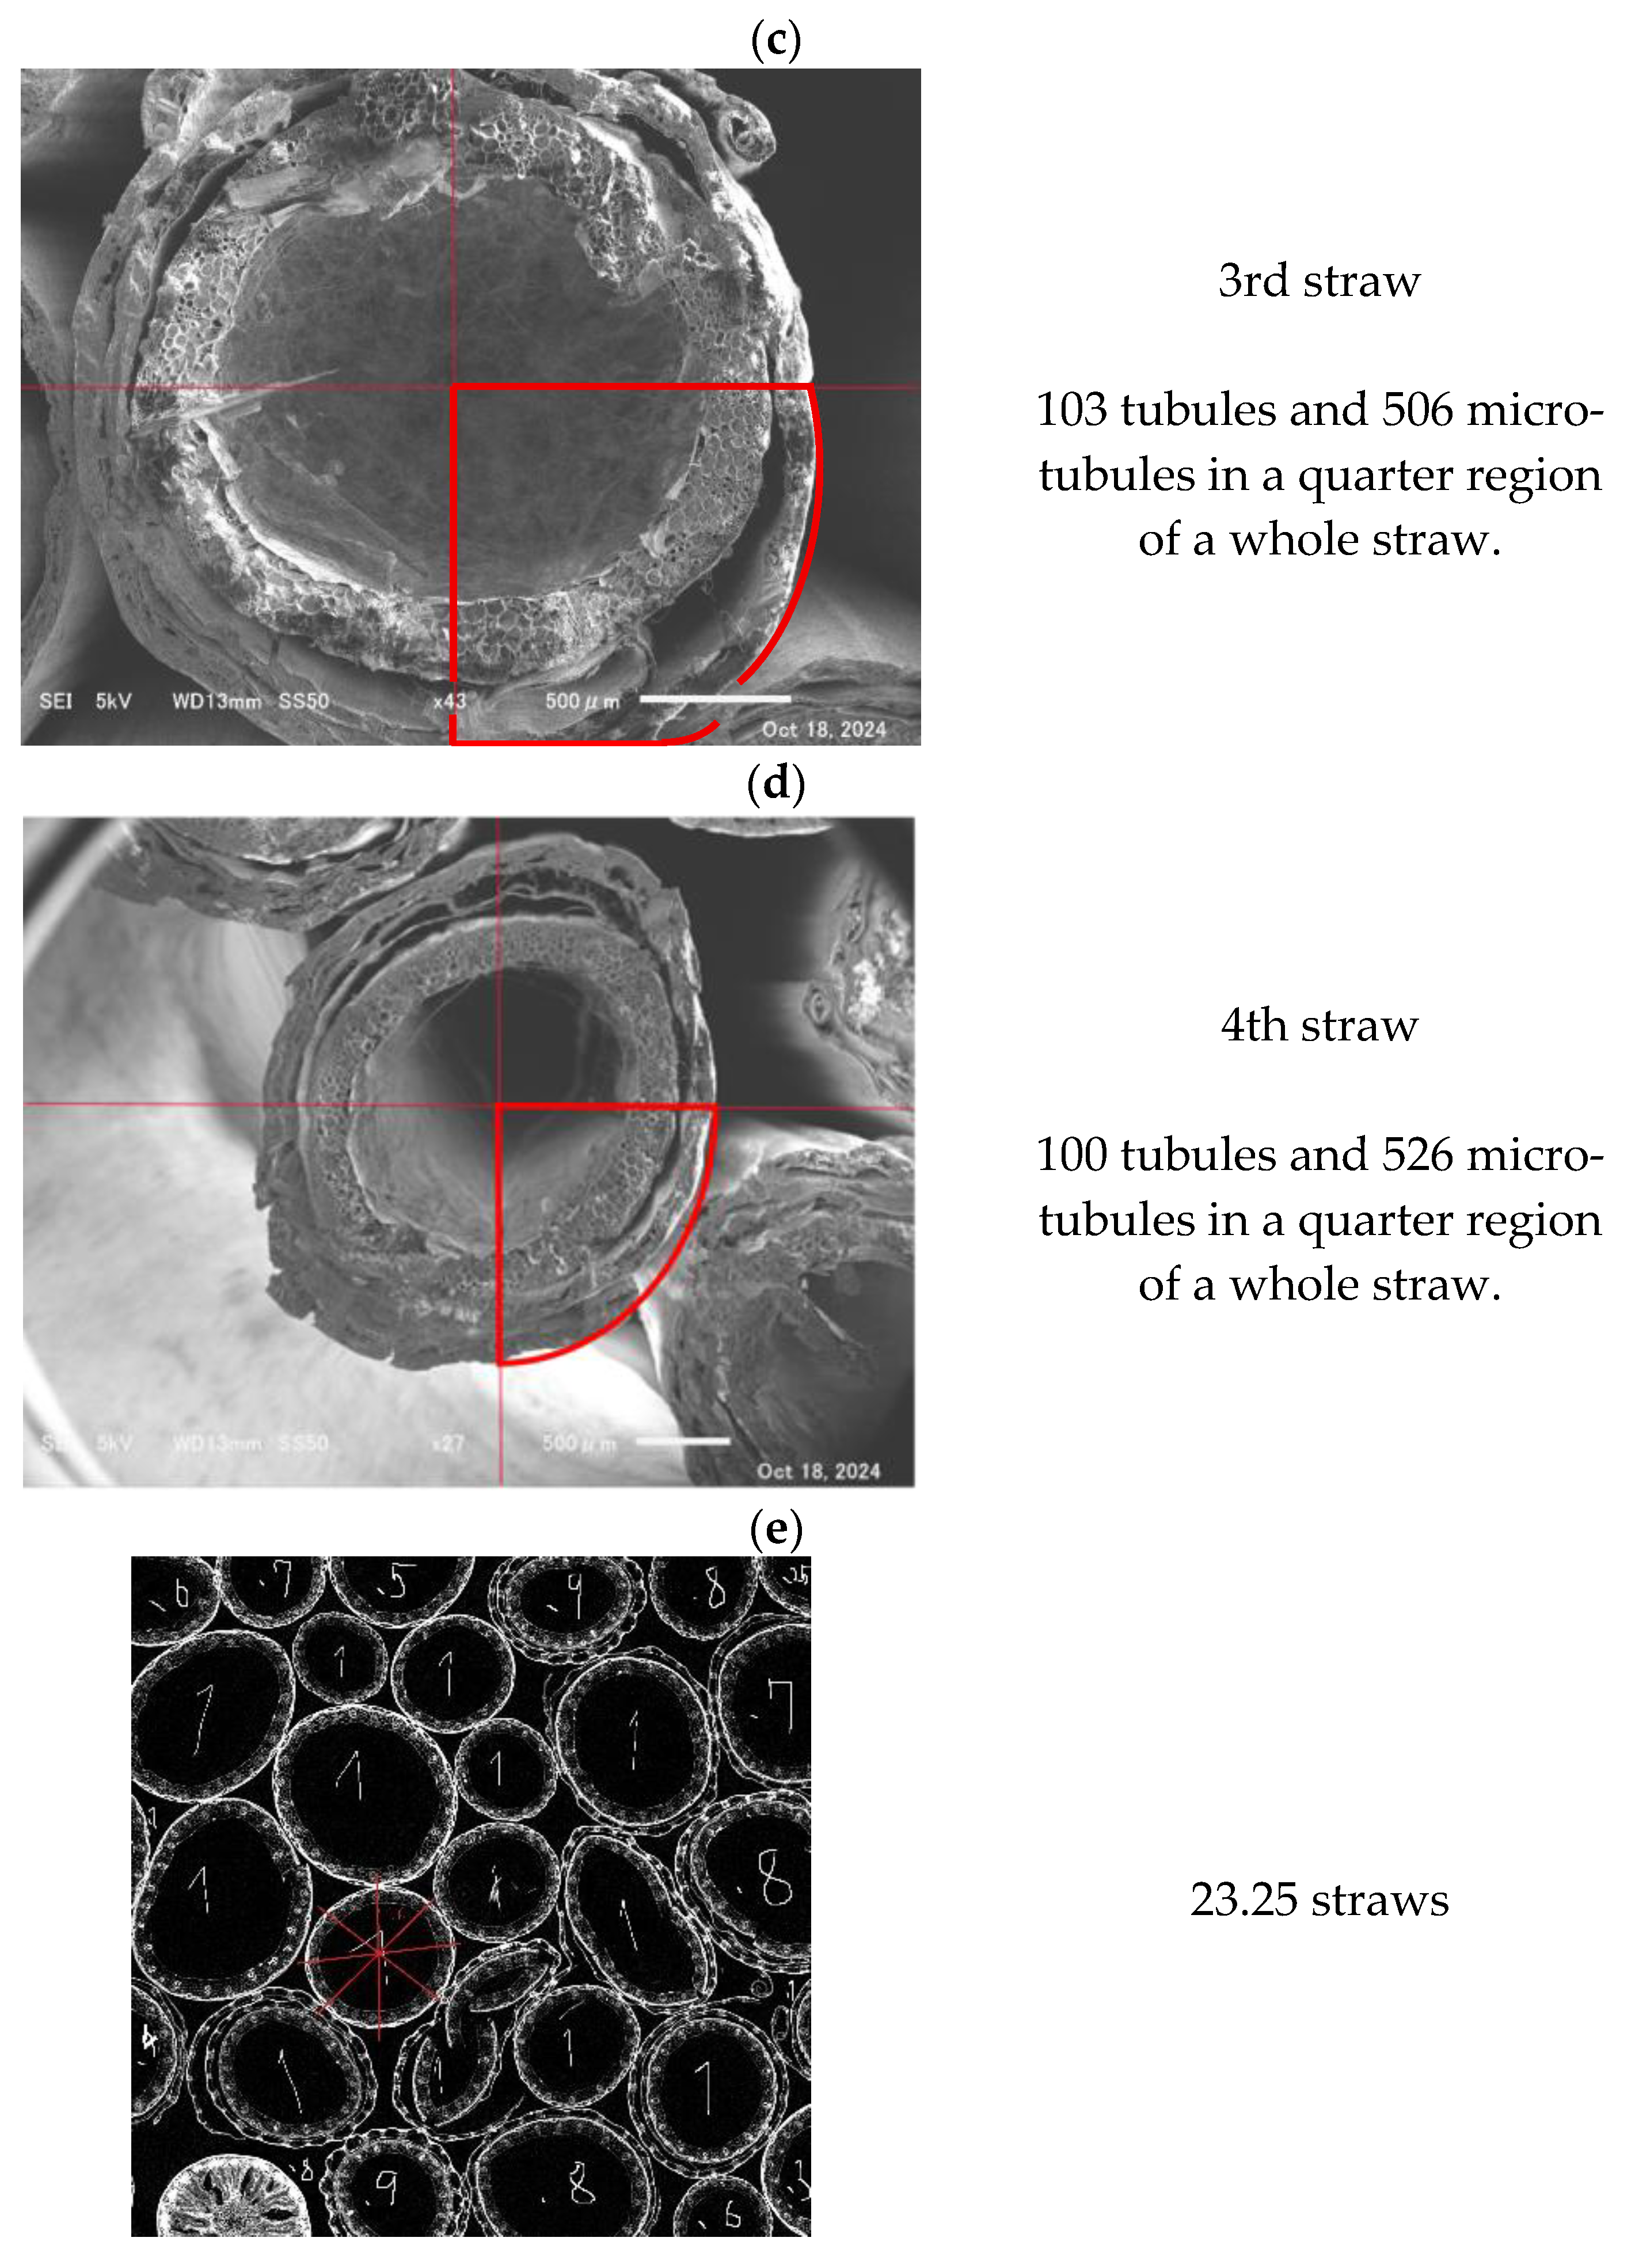
Examples of the SEM images used to estimate the numbers of the two types of tubules per straw are shown in Figure 15. An average of 337 tubules, with a diameter of 0.02–0.1 mm per straw, and an average of 1850 microtubules, with a diameter of 0.003–0.02 mm per straw, were counted. The number of straws in the 13 mm-square CT image was counted, as shown in Figure 15e, to estimate the number of tubules and microtubules in the image used to calculate the sound absorption coefficient. The results showed approximately 7800 tubules with diameters ranging from 0.02 to 0.1 mm and approximately 43,000 microtubules with diameters ranging from 0.003 to 0.02 mm.
The sound absorption coefficient of the tubule and microtubule groups was estimated using Tidgeman’s circular tube model [27]. The Tidgeman cylindrical model can be readily applied to discontinuous microtubes by treating the transmission end as a rigid wall, allowing it to be considered a closed-end tube. In this theoretical analysis, the propagation constant and characteristic impedance were obtained from a two-dimensional analysis of a cylindrical coordinate system and introduced into a one-dimensional transfer matrix, from which the sound absorption coefficient was derived [31].
Table 3 shows the dimensions and numbers related to the tubule and microtubule groups used to calculate the sound absorption coefficient of the tubule groups. The diameters of the tubules were given a distribution with reference to the SEM images.
Figure 16 shows the calculated sound absorption coefficient of the simulated microtubule and tubule groups shown in Table 3. The sound absorption of the tubule group was almost non-existent due to their short length (diameters of 0.02–0.1 mm). (Note that the maximum value on the vertical axis shown in Figure 16 is 0.02). The microtubule group (diameters of 0.003–0.02 mm) contributed little to the sound absorption, even though their length was increased to 20 mm, the thickness of the sample.

3.6. Treatment of Thick-Walled Portion of Wheat Straw as a Solid in CT Images

As demonstrated in Section 3.5, the thick-walled portion of the wheat straw is not involved in sound absorption. Therefore, examples of the CT images were manually corrected to approximate the thick-walled portion as a solid. Figure 17a shows an example of an uncorrected CT image (used up to Section 3.3), and Figure 17b shows an example of a corrected image, where the porous cross-section of the thick-walled portion is represented as a solid medium.
As it was not practical to manually correct all 1026 CT images, and as shown in Section 3.3, similar theoretical results can be obtained if more than 10 CT images are used, 10 CT images were sampled from the 1026 CT images at 100 image intervals and corrected. These 10 corrected images were then used to calculate the sound absorption coefficients presented in Section 3.3.
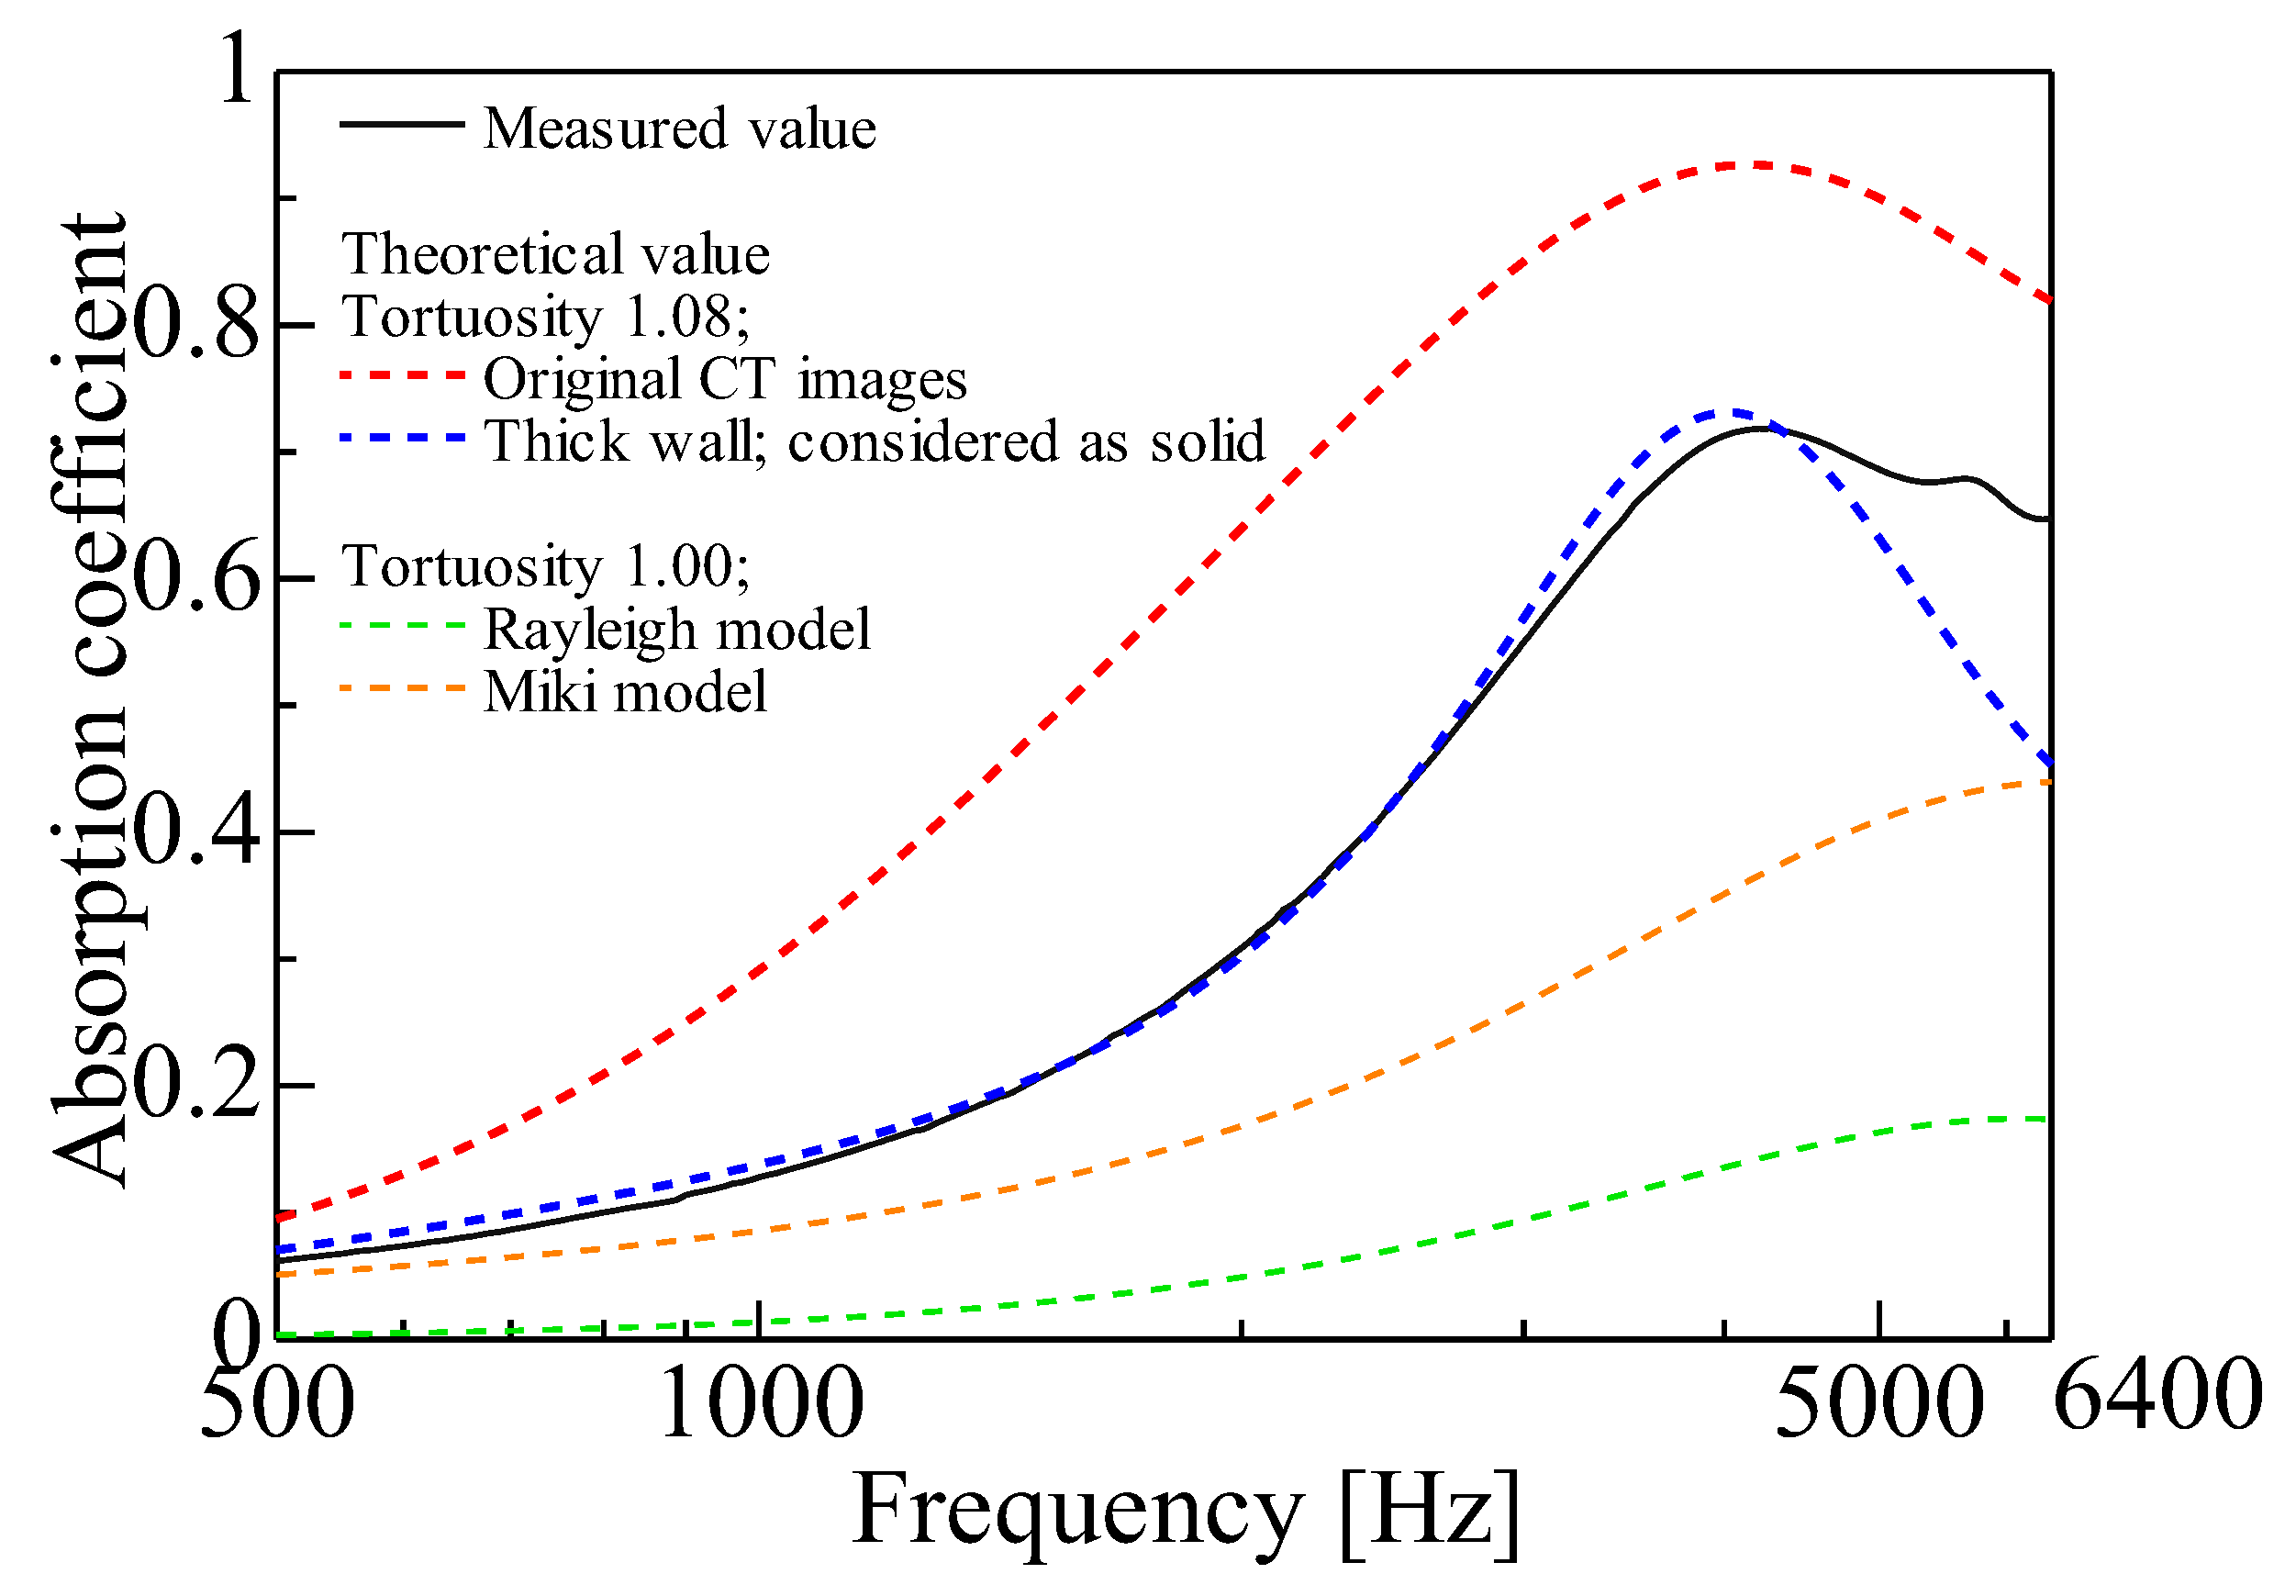
The results of the calculations are shown in Figure 18, and the average sound absorption coefficients at octave band frequencies are presented in Table 4. The calculated absorption coefficients for the case where the thick-walled portion of the wheat straw was regarded as a solid were in close agreement with the measured absorption coefficients. Therefore, it was confirmed that the sound absorption coefficient using the original CT image was overestimated.
Figure 18 also shows the calculated values obtained using conventional porous media models, namely the Rayleigh model [32] and the Miki model [33]. The measured flow resistivity for both models was 1.12 × 10³ Ns/m4. The Rayleigh model approximates porous materials as sets of cylindrical tubes with small cross-sectional areas, and has long been known as Rayleigh’s capillary model. Miki subsequently improved it, and the propagation constant and characteristic impedance of porous materials are currently obtained via empirical equations based on experiments in the Miki model. The characteristic impedance and propagation constant can be obtained by assuming the porosity and tortuosity to be 1 [34]. When the Rayleigh model is applied to wheat straw, only the flow resistivity needs to be considered, allowing for straightforward prediction of the sound absorption coefficient [35,36]. Among the theoretical values compared, the predictions derived in this study using ten CT images (with the thick-walled portions treated as solids) were found to be the closest to the experimental value.
Regarding the introduction of 3D models constructed from CT image sets to further improve estimation accuracy, attempts have already been made for materials such as rice husks and buckwheat husks [26]. However, in the case of the bundled straw structure studied here, the necessity of constructing a 3D model is considered low due to its highly two-dimensional nature. Indeed, similar structures such as rice straw have demonstrated nearly sufficient prediction accuracy using two-dimensional models [3].

4. Conclusions

The theoretically estimated sound absorption coefficients of a bundled wheat straw sample derived from cross-sectional CT images were compared with the measured absorption coefficients. The study concluded the following:
(1)
The circumference of the skeletal outlines and the cross-sectional area of the voids in the wheat straw CT images were calculated to obtain the propagation constant and characteristic acoustic impedance. The measured tortuosity was considered when calculating the normal incidence sound absorption coefficient.
(2)
The CT images were binarized to clarify the grayscale boundaries between the skeletal outlines and void areas of the wheat straw. Otsu’s binarization was used to determine the binarization threshold value. This threshold value uniquely determines the porosity, which is closely related to the sound absorption coefficient. Future research should include experiments using various porosities and straw diameters.
(3)
The two-dimensionality of the bundled wheat straw as a sound-absorbing structure was confirmed. As a result, when 10 or more CT scan images were used for a 20 mm-thick sample, the theoretical results were similar to those obtained when using the entire sample (1026 images).
(4)
Based on the cross-sectional SEM images, the sound absorption coefficient of the porous part of the thick-walled portion of the wheat straw was calculated using Tidgeman’s cylindrical model. It was found that the contribution of the porous part to the sound absorption of the entire sample was negligible.
(5)
The CT images were corrected to reflect the lack of sound absorption by the porous part of the thick-walled portion by considering it as a solid structure. The theoretical sound absorption coefficients calculated from the corrected images were in good agreement with the measured sound absorption coefficients.

Author Contributions

Conceptualization, S.S.; software, K.H., Y.K. and Z.S.B.R.; formal analysis, K.H., Y.K. and K.S.; data curation, K.S. and Z.S.B.R.; supervision, S.S.; project administration, S.S. All authors have read and agreed to the published version of the manuscript.

Funding

This work was supported by the Japan Society for the Promotion of Science (JSPS) KAKENHI Grant No. 24K07374.

Data Availability Statement

The original contributions presented in this study are included in the article. Further inquiries can be directed to the corresponding author.

Conflicts of Interest

The authors declare no conflicts of interest.

Nomenclature

A-DFour-terminal constants of transfer matrix
bnThickness of the clearance in two-plane approximation [m]
c0Speed of sound in air [m/s]
CSpeed of sound in sample [m/s]
CsCompression ratio
DThe pitch of the slice of the CT scan image [m]
JImaginary unit
LSample thickness [m]
NThe number of CT scan images
NprPrandtl number
P0Atmospheric pressure [Pa]
p0Sound pressure just outside and in front of Plane 1 [m/s]
p1, p2Sound pressure at each plane [Pa]
RReflection coefficient
SCross-sectional area [m2]
SnSurface area of the skeletal section [m2]
TTransfer matrix
TallTransfer matrix for the entire sample
u0Particle velocity just outside and in front of Plane 1 [Pa]
u1, u2Particle velocity at each plane [m/s]
VnVolume of the void [m3]
Xx coordinate [m]
Yy coordinate [m]
Zz coordinate [m]
ZcCharacteristic acoustic impedance [Ns/m3]
Z0Specific acoustic impedance [Ns/m3]
ASound absorption coefficient
αTortuosity
γPropagation constant [1/m]
κSpecific heat ratio of air
λsMediating variable
ρ0Density of air [kg/m3]
ρsEffective density [kg/m3]
η Viscosity of air [Pa·S]
ωAngular frequency [rad/s]

Abbreviations

The following abbreviations are used in this manuscript:
CTComputed tomography
SEMScanning electron microscope

References

  1. Yang, T.; Hu, L.; Xiong, X.; Petru, M.; Noman, M.T.; Mishra, R.; Militky, J. Sound Absorption Properties of Natural Fibers: A Review. Sustainability 2020, 12, 8477. [Google Scholar] [CrossRef]
  2. Berardi, U.; Iannace, G. Acoustic characterization of natural fibers for sound absorption applications. Build. Environ. 2015, 94, 840–852. [Google Scholar] [CrossRef]
  3. Sakamoto, S.; Seino, S.; Hoshiyama, K.; Kojima, Y. Estimation and experiment of acoustic properties of rice straw (estimation of sound absorption coefficient using CT images). Noise Control Eng. J. 2025, 73, 12. [Google Scholar] [CrossRef]
  4. Zhang, D.; Zhou, X.; Gao, Y.; Lyu, L. Structural Characteristics and Sound Absorption Properties of Waste Hemp Fiber. Coatings 2022, 12, 1907. [Google Scholar] [CrossRef]
  5. Liao, J.; Zhang, S.; Tang, X. Sound Absorption of Hemp Fibers (Cannabis Sativa L.) Based Nonwoven Fabrics and Composites: A Review. J. Nat. Fibers 2020, 19, 1297–1309. [Google Scholar] [CrossRef]
  6. Bastos, L.P.; de Melo, G.D.; Soeiro, N.S. Panels Manufactured from Vegetable Fibers: An Alternative Approach for Controlling Noises in Indoor Environments. Adv. Acoust. Vib. 2012, 2012, 698737. [Google Scholar] [CrossRef]
  7. Buot, P.G.C.; Cueto, R.M.; Esguerra, A.A.; Pascua, R.I.C.; Magon, E.S.S. Design and Development of Sound Absorbing Panels using Biomass Materials. In Proceedings of the 2nd African International Conference on Industrial Engineering and Operations Management Harare, Harare, Zimbabwe, 7–10 December 2020; Available online: https://www.ieomsociety.org/harare2020/papers/489.pdf (accessed on 12 June 2025).
  8. Or, K.H.; Putra, A.; Selamat, M.Z. Oil palm empty fruit bunch fibres as sustainable acoustic absorber. Appl. Acoust. 2017, 119, 9–16. [Google Scholar] [CrossRef]
  9. Ersoy, S.; Küçük, H. Investigation of industrial tea-leaf-fibre waste material for its sound absorption properties. Appl. Acoust. 2009, 70, 215–220. [Google Scholar] [CrossRef]
  10. Maderuelo-Sanz, R.; Morillas, J.M.B.; Escobar, V.G. Acoustical performance of loose cork granulates. Eur. J. Wood Wood Prod. 2012, 72, 321–330. [Google Scholar] [CrossRef]
  11. Alhijazi, M.; Safaei, B.; Zeeshan, Q.; Asmael, M.; Eyvazian, A.; Qin, Z. Recent Developments in Luffa Natural Fiber Composites: Review. Sustainability 2020, 12, 7683. [Google Scholar] [CrossRef]
  12. Thilagavathi, G.; Pradeep, E.; Kannaian, T.; Sasikala, L. Development of Natural Fiber Nonwovens for Application as Car Interiors for Noise Control. J. Ind. Text. 2010, 39, 267–278. [Google Scholar] [CrossRef]
  13. Sakamoto, S.; Tsurumaki, T.; Fujisawa, K.; Yamamiya, K. Study for sound-absorbing materials of biomass tubule (Oblique incident sound-absorption coefficient of oblique arrangement of rice straws). Trans. JSME 2016, 83, 16–00344. [Google Scholar] [CrossRef]
  14. Sakamoto, S.; Tanikawa, H.; Maruyama, Y.; Yamaguchi, K.; Ii, K. Estimation and experiment for sound absorption coefficient of three clearance types using a bundle of nested tubes. J. Acoust. Soc. Am. 2018, 144, 2281–2293. [Google Scholar] [CrossRef] [PubMed]
  15. Sakamoto, S.; Suzuki, K.; Toda, K.; Seino, S. Mathematical Models and Experiments on the Acoustic Properties of Granular Packing Structures (Measurement of Tortuosity in Hexagonal Close-Packed and Face-Centered Cubic Lattices). Materials 2022, 15, 7393. [Google Scholar] [CrossRef]
  16. Sakamoto, S.; Suzuki, K.; Toda, K.; Seino, S. Estimation of the Acoustic Properties of the Random Packing Structures of Granular Materials: Estimation of the Sound Absorption Coefficient Based on Micro-CT Scan Data. Materials 2023, 16, 337. [Google Scholar] [CrossRef]
  17. Hideshima, Y.; Arima, S.; Suzuki, A. Effects of the Method of Processing Wheat or Barly Straw in the Double Cropping System on Weed Incidence and Growth of Paddy Rice. Jpn. J. Crop Sci. 2016, 85, 122–129. [Google Scholar] [CrossRef]
  18. Ministry of the Environment (Waste & Recycling), Report for FY2021 Nationwide Survey Regarding Measures for Wide-Area Waste Transportation and the Actual Utilization of Recyclable Waste Materials (Survey on the Actual Utilization of Recyclable Waste Materials). 2022. Available online: https://www.env.go.jp/recycle/report/post_20.html (accessed on 5 August 2025).
  19. Ye, F.; Wei, H.; Xiao, Y.; Berardi, U.; Quaranta, G. Bio-based insulation materials in sustainable constructions: A review of environmental, thermal and acoustic insulation, durability, and mechanical performances. Renew. Sustain. Energy Rev. 2025, 223, 115872. [Google Scholar] [CrossRef]
  20. Food and Agriculture Organization. World Food and Agriculture—Statistical Yearbook 2023; Food and Agriculture Organization of the United Nations: Rome, Italy, 2023; p. 14. [CrossRef]
  21. Ministry of Agriculture, Forestry and Fisheries. FY2023 Food Supply and Demand Chart. 2025. Available online: https://www.e-stat.go.jp/stat-search/files?page=1&layout=datalist&toukei=00500300&tstat=000001017950&cycle=8&tclass1=000001032890&tclass2=000001226685&cycle_facet=tclass1%3Atclass2&tclass3val=0 (accessed on 5 August 2025).
  22. ISO 10534-2:2023; Acoustics—Determination of Acoustic Properties in Impedance Tubes—Part 2: Two-Microphone Technique for Normal Sound Absorption Coefficient and Normal Surface Impedance. ISO: Geneva, Switzerland, 2023. [CrossRef]
  23. Allard, J.F.; Atalla, N. Propagation of Sound in Porous Media: Modelling Sound Absorbing Materials, 2nd ed.; John Wiley & Sons, Ltd.: Hoboken, NJ, USA, 2009. [Google Scholar] [CrossRef]
  24. Otsu, N. A Threshold Selection Method from Gray-Level Histograms. IEEE Trans. Syst. Man Cybern 1979, 9, 62–66. [Google Scholar] [CrossRef]
  25. Canny, J. A Computational Approach to Edge Detection. IEEE Trans. Pattern Anal. Mach. Intell. 1986, 8, 679–698. [Google Scholar] [CrossRef] [PubMed]
  26. Sakamoto, S.; Toda, K.; Seino, S.; Hoshiyama, K.; Satoh, T. Theoretical and Experimental Analyses on the Acoustic Properties of Rice and Buckwheat Husks Based on Micro-CT Scan Data. Materials 2023, 16, 5671. [Google Scholar] [CrossRef]
  27. Tijdeman, H. On the propagation of sound waves in cylindrical tubes. J. Sound Vib. 1975, 39, 1–33. [Google Scholar] [CrossRef]
  28. Stinson, M.R. The propagation of plane sound waves in narrow and wide circular tubes and generalization to uniform tubes of arbitrary cross-sectional shape. J. Acoust. Soc. Am. 1991, 89, 550–558. [Google Scholar] [CrossRef]
  29. Stinson, M.R.; Champou, Y. Propagation of sound and the assignment of shape factors in model porous materials having simple pore geometries. J. Acoust. Soc. Am. 1992, 91, 685–695. [Google Scholar] [CrossRef]
  30. Beltman, W.M.; van der Hoogt, P.J.M.; Spiering, R.M.E.J.; Tijdeman, H. Implementation and experimental validation of a new viscothermal acoustic finite element for acousto-elastic problems. J. Sound Vib. 1998, 216, 159–185. [Google Scholar] [CrossRef]
  31. Sakamoto, S.; Hoshino, A.; Sutou, K.; Sato, T. Estimating Sound-Absorption Coefficient and Transmission Loss by the Dimensions of Bundle of Narrow Holes (Comparison between Theoretical Analysis and Experiments). Trans. Jpn. Soc. Mech. Eng Ser. C 2013, 79, 4164–4176. [Google Scholar] [CrossRef]
  32. Rayleigh, J.W.S. The Theory of Sound, 2nd ed.; Dover Publications: Garden City, NY, USA, 1945. [Google Scholar]
  33. Miki, Y. Acoustical properties of porous materials-modifications of Delany-Bazley models. J. Acoust. Soc. Jpn 1990, 11, 19–24. [Google Scholar] [CrossRef]
  34. Kuttruff, H. Room Acoustics, 5th ed.; Spon Press: New London, NY, USA, 2009. [Google Scholar]
  35. Suzuki, H.; Omoto, A.; Fujiwara, K. Treatment of boundary conditions by finite difference time domain method. J. Acoust. Soc. Jpn. 2007, 28, 16–26. [Google Scholar] [CrossRef]
  36. Ferreira, N.; Hopkins, C. Using finite-difference time-domain methods with a Rayleigh approach to model low-frequency sound fields in small spaces subdivided by porous materials. J. Acoust. Soc. Jpn. 2013, 34, 332–341. [Google Scholar] [CrossRef]
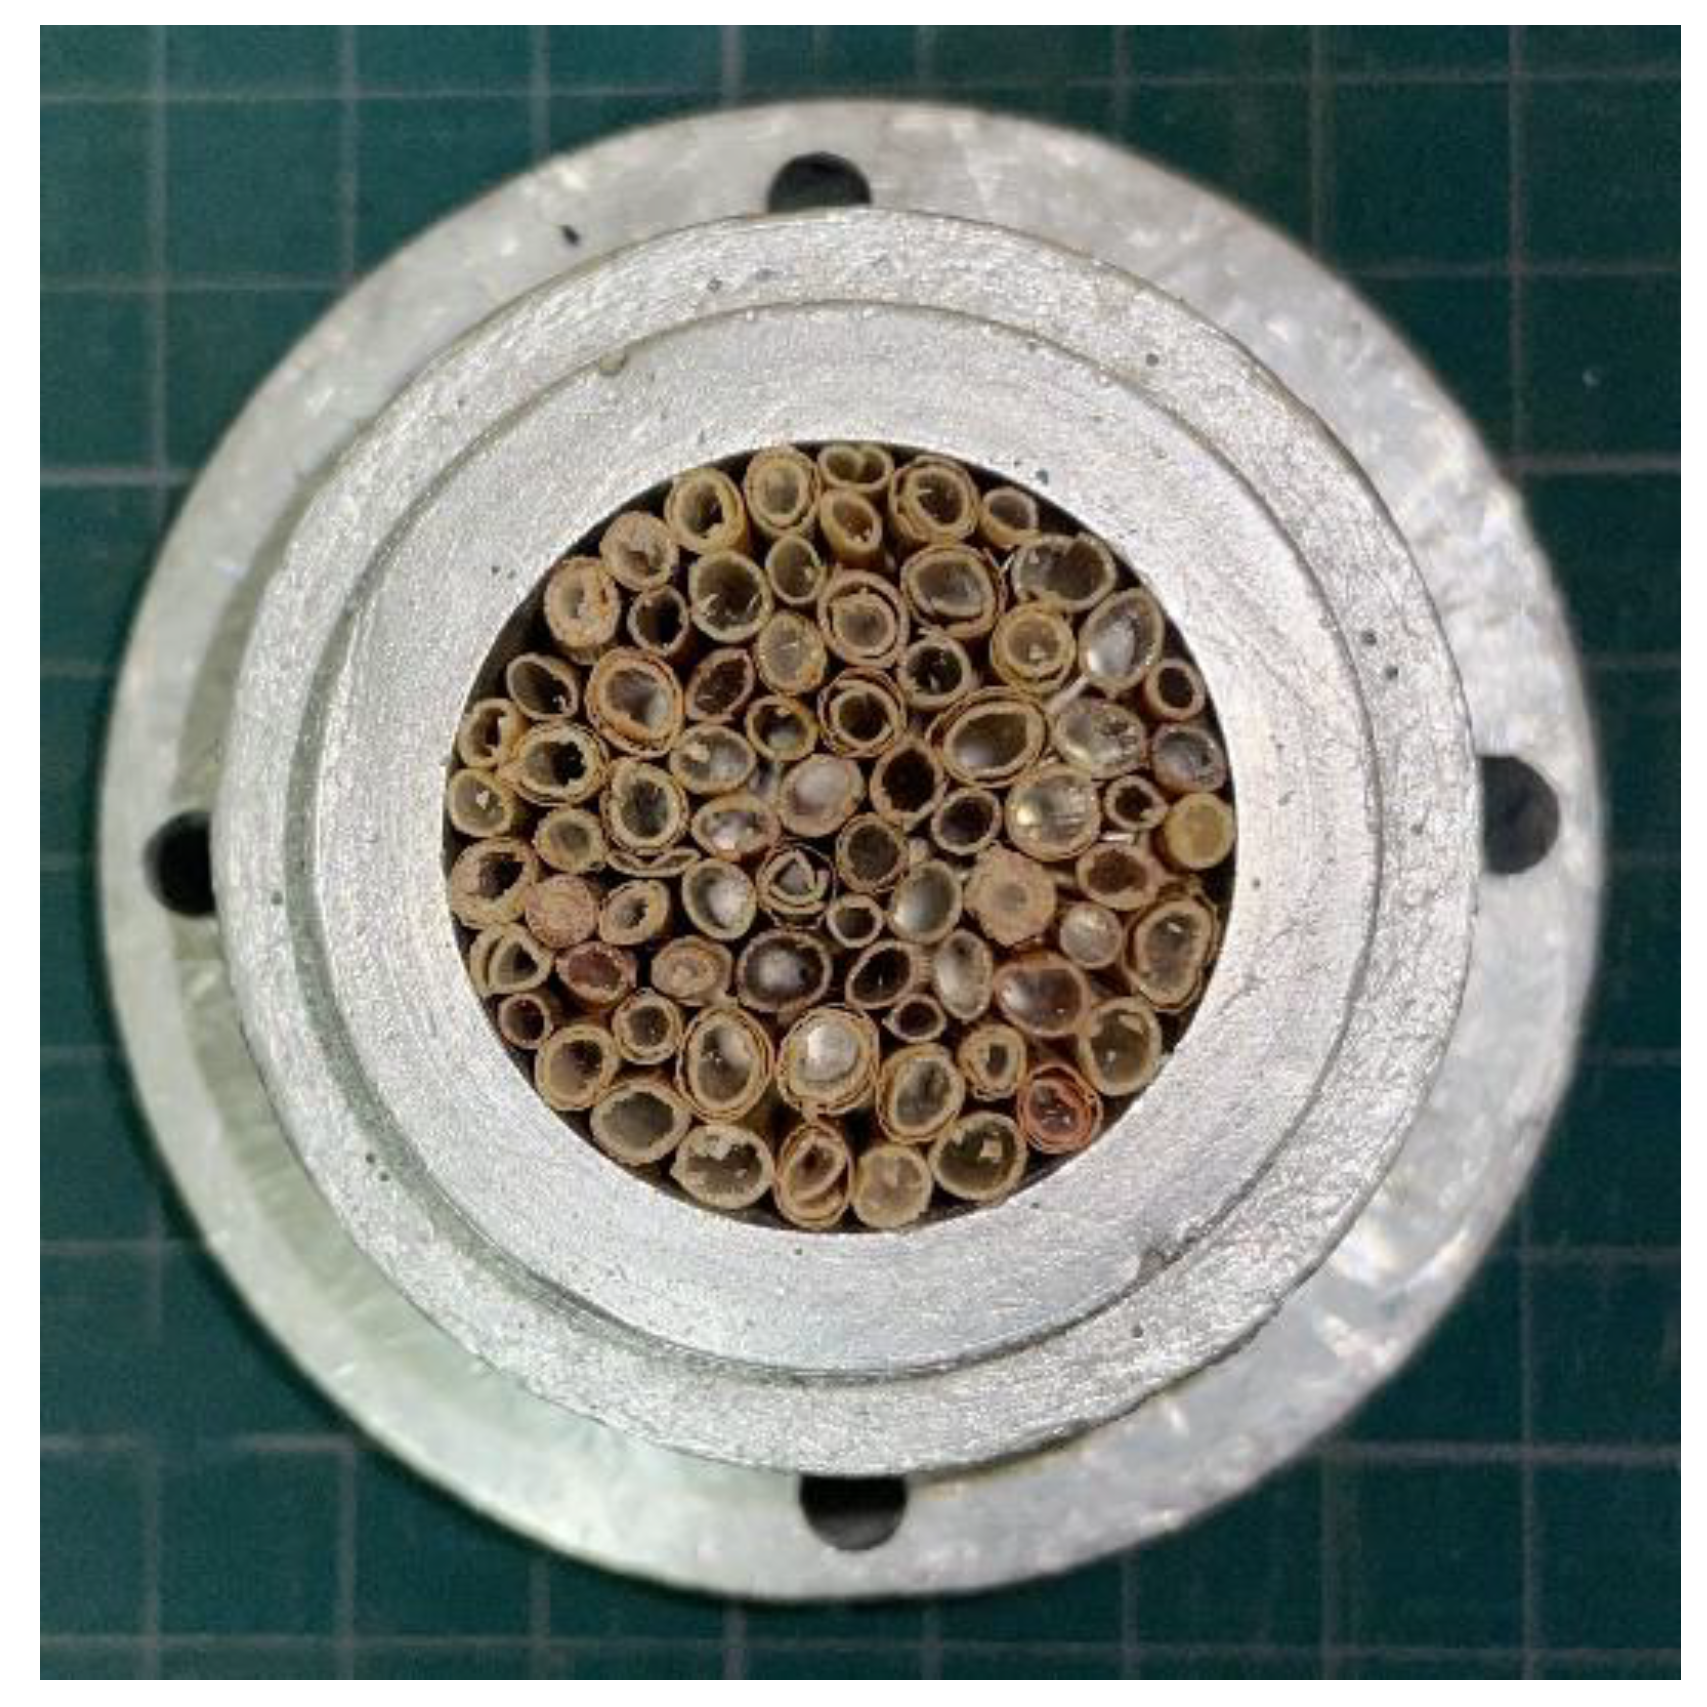
Figure 1. Sample of a bundled wheat straw for measuring the sound absorption coefficient (l = 20 mm).
Applsci 15 08803 g001
Figure 2. Measured tortuosity of the bundled wheat straw (l = 20 mm).
Applsci 15 08803 g002
Figure 3. (a) Typical computed tomography (CT) cross-sectional image of a bundled wheat straw sample at an arbitrary point in the x-direction. (b) Schematic of the 22.6 μm-pitch cross-sectional images used in the derivation of sound absorption coefficient.
Applsci 15 08803 g003
Figure 4. Procedure for deriving the sound absorption coefficient.
Applsci 15 08803 g004
Figure 5. Typical binarized image (threshold 0.376).
Applsci 15 08803 g005
Figure 6. (a) Representative surface area (Sn) and volume of the void (Vn) obtained from the cross-sectional CT image; (b) the two-plane approximation. bn is the clearance between the two planes.
Applsci 15 08803 g006
Figure 7. Cartesian coordinate system for the two planes and the clearance.
Applsci 15 08803 g007
Figure 8. Schematic of the analysis unit of the clearance between the two planes in the x-direction. S is the cross-sectional area.
Applsci 15 08803 g008
Figure 9. Equivalent circuit of the entire transfer matrix (Tall) for the CT images.
Applsci 15 08803 g009
Figure 10. Comparison between measured and theoretical absorption coefficients of the wheat straw sample, considering the threshold values that uniquely determine the porosity (wheat straw, l = 20 mm).
Applsci 15 08803 g010
Figure 11. Typical binarized CT images using threshold values of (a) 0.2; (b) 0.376; (c) 0.6.
Applsci 15 08803 g011
Figure 12. Comparison between measured and theoretical absorption coefficients of the wheat straw sample considering tortuosity, including the measured value of 1.08 (wheat straw, l = 20 mm).
Applsci 15 08803 g012
Figure 13. Comparison of the measured and theoretical absorption coefficients of the wheat straw according to the number of CT images used (wheat straw, l = 20 mm).
Applsci 15 08803 g013
Figure 14. SEM image of (a) a cut wheat straw surface; (b) an enlarged image of the surface outlined in orange, showing the tubule group (outlined in red) and the microtubule group (outlined in blue).
Applsci 15 08803 g014
Figure 15. (ad) SEM images of the four straws used to determine the average number of tubules and microtubules; (e) typical CT image of 23.25 counted straws.
Applsci 15 08803 g015aApplsci 15 08803 g015b
Figure 16. Sound absorption coefficients of the simulated microtubule and tubule groups in the thick-walled portion of wheat straw sample.
Applsci 15 08803 g016
Figure 17. Cross-sectional CT images of the wheat straw where the thick-walled portion is represented as (a) porous (original image); (b) solid (corrected image).
Applsci 15 08803 g017
Figure 18. Comparison of measured and theoretical absorption coefficients of the wheat straw using all 1026 CT images (thick-walled portion considered as porous), 10 CT images (thick-walled portion considered as a solid), and the Rayleigh and Miki models.
Applsci 15 08803 g018
Table 1. Equipment used for sound absorption measurements.
EquipmentManufacturerProduct Name
Impedance measurement tubeBrüel & KjærType 4206 two-microphone impedance measurement tube
MicrophoneBrüel & KjærType 4187
Pre-amplifierBrüel & KjærType 2670
Microphone amplifierBrüel & KjærType 2690
Power amplifierYamaha (Hamamatsu, Japan)Natural sound integrated amplifier A-S301
FFT analyzer
with signal generator
Ono Sokki (Yokohama, Japan)DS-3000
SoftwareOno SokkiDS-0320
Table 2. PC specifications and software used for calculations.
Components and SoftwareDetails
ProcessorIntel Core i5 8400
MotherboardASUS PRIME H370M-PLUS
RAM16 GB
GPUIntel UHD Graphics 630
Operating systemMicrosoft Windows 11
Numerical computation softwareDassault Systems Scilab 6.6.1
Table 3. Simulation conditions for the microtubule and tubule groups in the thick-walled portion of the wheat straw.
Microtubule Group (Depth = 20 mm)Tubule Group (Depth = 0.03 mm)
Diameter [mm]Number of microtubulesDiameter [mm]Number of tubules
0.00386000.021560
0.00686000.041560
0.01086000.061560
0.01586000.081560
0.02086000.101560
Total number of microtubules = 43,000Total number of tubules = 7800
Table 4. Average sound absorption coefficients at octave band frequencies of measured and theoretical values shown in Figure 18.
Frequency500 Hz
(304–707 Hz)
1 kHz
(707–1414 Hz)
2 kHz
(1414–2828 Hz)
4 kHz
(2828–5657 Hz)
Tortuosity
Average sound absorption coefficient at octave band frequenciesMeasured- - -0.0660.1380.3420.669
Theoretical
(blue line)
1.080.0750.1470.3410.652
Theoretical
(Rayleigh)
N/A (1.00)0.0150.0260.0670.139
Theoretical
(Miki)
N/A (1.00)0.0580.0910.1810.358
Disclaimer/Publisher’s Note: The statements, opinions and data contained in all publications are solely those of the individual author(s) and contributor(s) and not of MDPI and/or the editor(s). MDPI and/or the editor(s) disclaim responsibility for any injury to people or property resulting from any ideas, methods, instructions or products referred to in the content.