Article

Identification of Inequities in Green Visibility and Ways to Increase Greenery in Neighborhoods: A Case Study of Wuhan, China

1
College of Horticulture and Gardening, Yangtze University, Jingzhou 434025, China
2
School of Design Art & Media, Nanjing University of Science and Technology, Nanjing 210094, China
*
Author to whom correspondence should be addressed.
Appl. Sci. 2025, 15(2), 742; https://doi.org/10.3390/app15020742
Submission received: 13 December 2024 / Revised: 7 January 2025 / Accepted: 10 January 2025 / Published: 13 January 2025
(This article belongs to the Special Issue Urban Geospatial Analytics Based on Big Data)

Abstract

:
The rapid increase in urban population density driven by urban development has intensified inequity in urban green space distribution. Identifying the causes of changes in green equity and developing strategies to improve urban greening are crucial for optimizing resource allocation and alleviating social inequalities. However, the long-term spatio-temporal evolution of green visibility and equity remains underexplored. This study utilized the “Time Machine” feature to capture street view images from 2014, 2017, and 2021, analyzing changes in green visibility and its equity across residential communities in Wuhan. Deep learning techniques and statistical methods, including the Gini coefficient and location quotient (LQ), were employed to assess the distribution and spatial equity of street-level greenery. The results showed that overall green visibility in Wuhan increased by 4.18% between 2014 and 2021. However, this improvement did not translate into better spatial equity, as the Gini coefficient consistently ranged between 0.4 and 0.5. Among the seven municipal districts, only the Jiang’an District demonstrated relatively equitable green visibility in 2017 and 2021. Despite a gradual reduction in disparities in green visibility, a spatial mismatch persisted between UGS growth and population distribution, leading to uneven patterns in UGS equity. This study explores the factors driving inequities in green visibility and proposes strategies to enhance urban greening. Key recommendations include integrating the green visibility equity evaluation framework into urban planning to guide fair green space allocation, prioritizing greenery in low-income neighborhoods, and reducing hardscapes to support the planting and maintenance of tall canopy trees. These measures aim to enhance accessible and visible green resources and promote equitable access across communities.

1. Introduction

Urban greening is essential for improving the urban ecological environment, enhancing living conditions, and increasing the well-being of residents [1]. Previous studies have consistently confirmed the comprehensive benefits of urban green spaces [2]. One of their most significant values lies in their ability to alleviate environmental stressors, such as air pollution [3], noise [4], heat waves [5], and flooding [6]. Additionally, urban greening can increase property values, create employment opportunities, and play a crucial role in promoting economic development and social harmony [7]. Moreover, by providing spaces for exercise and gatherings, urban green spaces encourage more physical activity, strengthen community cohesion, and thus promote physical and mental health [8].
Despite the proven necessity of adequate urban greening for ensuring residential health, many regional studies have shown that residents often struggle to benefit equally from the surrounding greenery [9,10]. Due to urban population expansion and limited green space resources, residential differentiation in urban areas leads to spatial injustice in the distribution of green resources [11]. The geographical distribution of urban infrastructure is widely acknowledged as an environmental justice issue, with greening being a critical component [12]. Different types of urban greening provide varying benefits to residents [13], making it essential to quantify the characteristics of green spaces surrounding people.
In the literature on environmental inequality, various indicators have been developed to assess different types of green spaces around communities. Two of the most widely used are the availability of green spaces within a community and the visiting distance to public green spaces [13,14]. Availability refers to the amount of green space accessible within a community and is commonly used due to its ease of quantification [14]. Current quantitative assessments of green space availability have primarily utilized remote sensing data to examine the quantity and morphology of urban vegetation, employing indicators such as the normalized difference vegetation index (NDVI) [15], canopy coverage (CC) [16], and leaf area index (LAI) [17]. Remote sensing imagery provides a bird’s-eye view of green space data, which have been used to accurately capture large-scale green spaces, such as parks, revealing the distribution characteristics of urban green spaces [18]. As scholars have gained a deeper understanding of residents’ needs, the accessibility of park green spaces has gradually become an important indicator for evaluating the equitable distribution of urban green spaces [19,20]. Although two-dimensional remote sensing images effectively capture the horizontal distribution of green spaces, they often fail to accurately represent the three-dimensional distribution of greenery within urban areas, especially in regions with rich vertical greening [21]. Street view images, captured from the ground, provide direct observation at the street level from the perspective of human visual experience [22,23], which is crucial for understanding how pedestrians and residents perceive and interact with surrounding greenery. Moreover, compared to bird’s-eye remote sensing data, ground-level street greening assessments may more directly impact individual physical activity and mental health [24,25,26]. In compact urban planning, street-level greenery (e.g., street trees, grasslands, and vegetation) tends to be smaller in scale and more cost-effective. The aesthetic value and health benefits derived from green visibility in a community can play a crucial role in decisions to walk or cycle [27,28].
To assess the quality of green spaces perceived by humans, Aoki [29] first introduced the concept of green view index (GVI), which refers to the proportion of greenery visible within a person’s field of view. Unlike two-dimensional indicators, such as the greening coverage rate and the green space ratio, GVI represents a higher standard of urban greening. It is widely used to evaluate the walkability and greening level of streets [22,30]. Extracting feature information from street view images using deep learning models is a mainstream method for assessing general street environments [22,27,31]. However, differences in the equity of visible street greenery have received less attention. Several metrics have been applied to assess spatial equity and social justice in green space distribution. For instance, the Gini coefficient [20] and location entropy [32] are often combined to assess the overall and local characteristics of spatial equity. Methods like the share index [33] and supply-demand index [34] further highlight differences in access to green space resources among various social groups.
Researchers have found that disparities in green resource distribution are often directly linked to factors such as population density, age, income, race, and education level [19,34]. Li et al. [13] found that in Hartford, Connecticut, people with higher incomes and education levels tend to live in communities with more street greenery. Similarly, Sun et al. [31] also pointed out that in Los Angeles County, California, communities with higher proportions of low socioeconomic status and minority populations have significantly lower levels of street greenery. Studies in Chinese cities have also concluded that densely populated [35] and socioeconomically disadvantaged communities [36,37,38], as well as those with older adults [33], may suffer from street greening inequity. These studies often use the original regional divisions within their research scope, such as subdistricts [33,35], neighborhoods (juweihui) [36,38], or communities (xiaoqu) [37], However, these divisions may introduce significant computational errors due to their irregular shapes when simulating residents’ needs. Using regularly shaped scales, such as fishnet grids or hexagonal honeycomb grids, can largely reduce these errors [39]. Furthermore, most studies on street visibility are limited by data and remain single-time-point analyses, focusing on the evaluation of current conditions. Research on the long-term changes in green visibility and equity in communities under rapid urbanization is still rare [40], leading to a lack of guidance for urban planners and policymakers on how to reasonably plan for, and finely regulate, street greening.
To address these issues, this study employed a regular hexagonal grid as the evaluation unit and utilized the “Time Machine” feature introduced by Baidu Maps to obtain time-series street view images. By applying deep learning, the Gini coefficient, and location quotient methods, we investigated changes in green visibility and equity in residential communities. Wuhan’s central urban area, a rapidly urbanizing Chinese city, was selected as a case study. The novelty of our research lies in two key aspects: First, we provide valuable evidence for small-scale studies by using residential aggregation grids as the basic research unit, allowing for a more comprehensive and in-depth diagnosis of local supply and demand gaps caused by residential differentiation. More importantly, we innovatively incorporated a dynamic perspective into the evaluation of green visibility equity, monitoring spatio-temporal differences in visibility equity across residential areas. This allows for the timely identification of communities in need of improvement. This study served three main purposes:
  • To evaluate the level and spatio-temporal patterns of street-level greening around residential communities from 2014 to 2021;
  • To assess the spatial equity of green visibility in residential communities across different regions from 2014 to 2021, revealing the dynamic characteristics of equity changes;
  • To provide improvement strategies for mitigating inequities and building a green, equitable city based on an in-depth analysis of changes in visibility equity.

2. Materials and Method Methodology

2.1. Research Framework

Green visibility is an indicator used to measure the green spaces that residents observe during their daily physical and social activities. To effectively identify changes in visibility and their effects on the fairness of green distribution among residents, we developed an evaluation framework to visualize spatial equity. In the first step of this framework, we collected residential POI data and temporal street view images. A residential hexagonal grid was constructed, aggregating residential areas within each hexagon to its centroid as demand points. In the second step, we used deep learning to extract GVI from street view images and applied buffer analysis to calculate green visibility, which served as supply points. In the third step, we assessed the overall and local equity of green visibility using the Gini coefficient, Lorenz curve, and location quotient. Based on the results, we proposed recommendations for optimizing green space distribution and improving urban greenery planning (Figure 1).

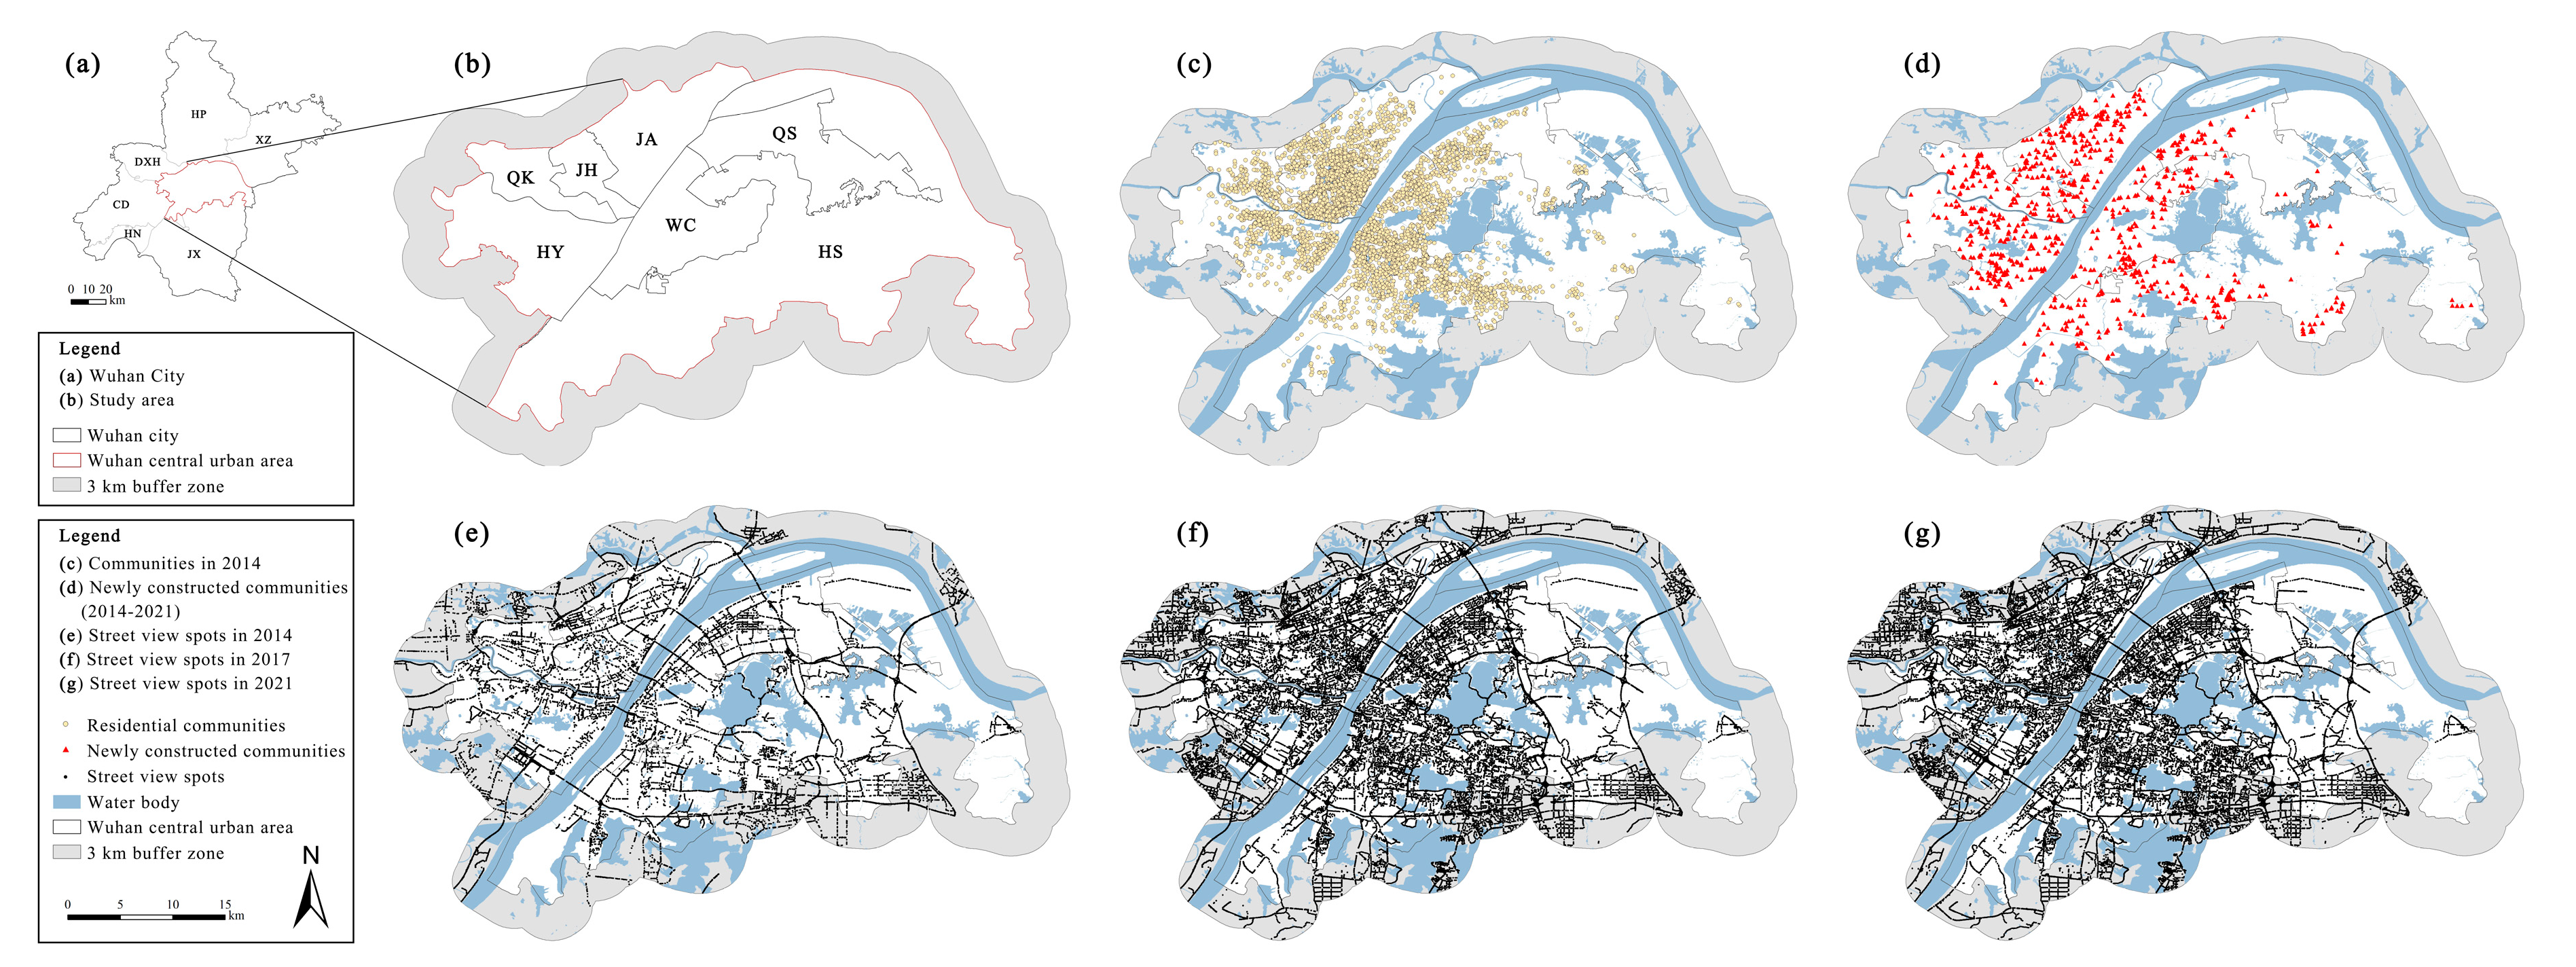
2.2. Case Study Area

Wuhan (29°58′~31°22′ N, 113°41′~115°05′ E) is a major central city in China. The city administers 13 districts, covering a total area of 8569.15 km2 (Figure 2a). As of the end of 2023, the permanent population of Wuhan was 13.77 million. The study area was the central urban area, including the Jianghan (JH), Qiaokou (QK), Jiang’an (JA), Hanyang (HY), Wuchang (WC), Hongshan (HS), and Qingshan (QS) districts. This study focused on the period from 2014 to 2021, as Wuhan released the “Wuhan New-Type Urbanization Plan (2014–2020)” in 2014 [41], setting new goals for urban greening development during this period. Additionally, 2014 marks the earliest year when street view images were captured in Wuhan. Considering that residents on the periphery of the central urban area can still benefit from street greening in nearby suburban areas, this study included a 3 km buffer zone around the central urban area, which effectively covers the daily activity range of surrounding residents (Figure 2b).

2.3. Data Sources and Processing

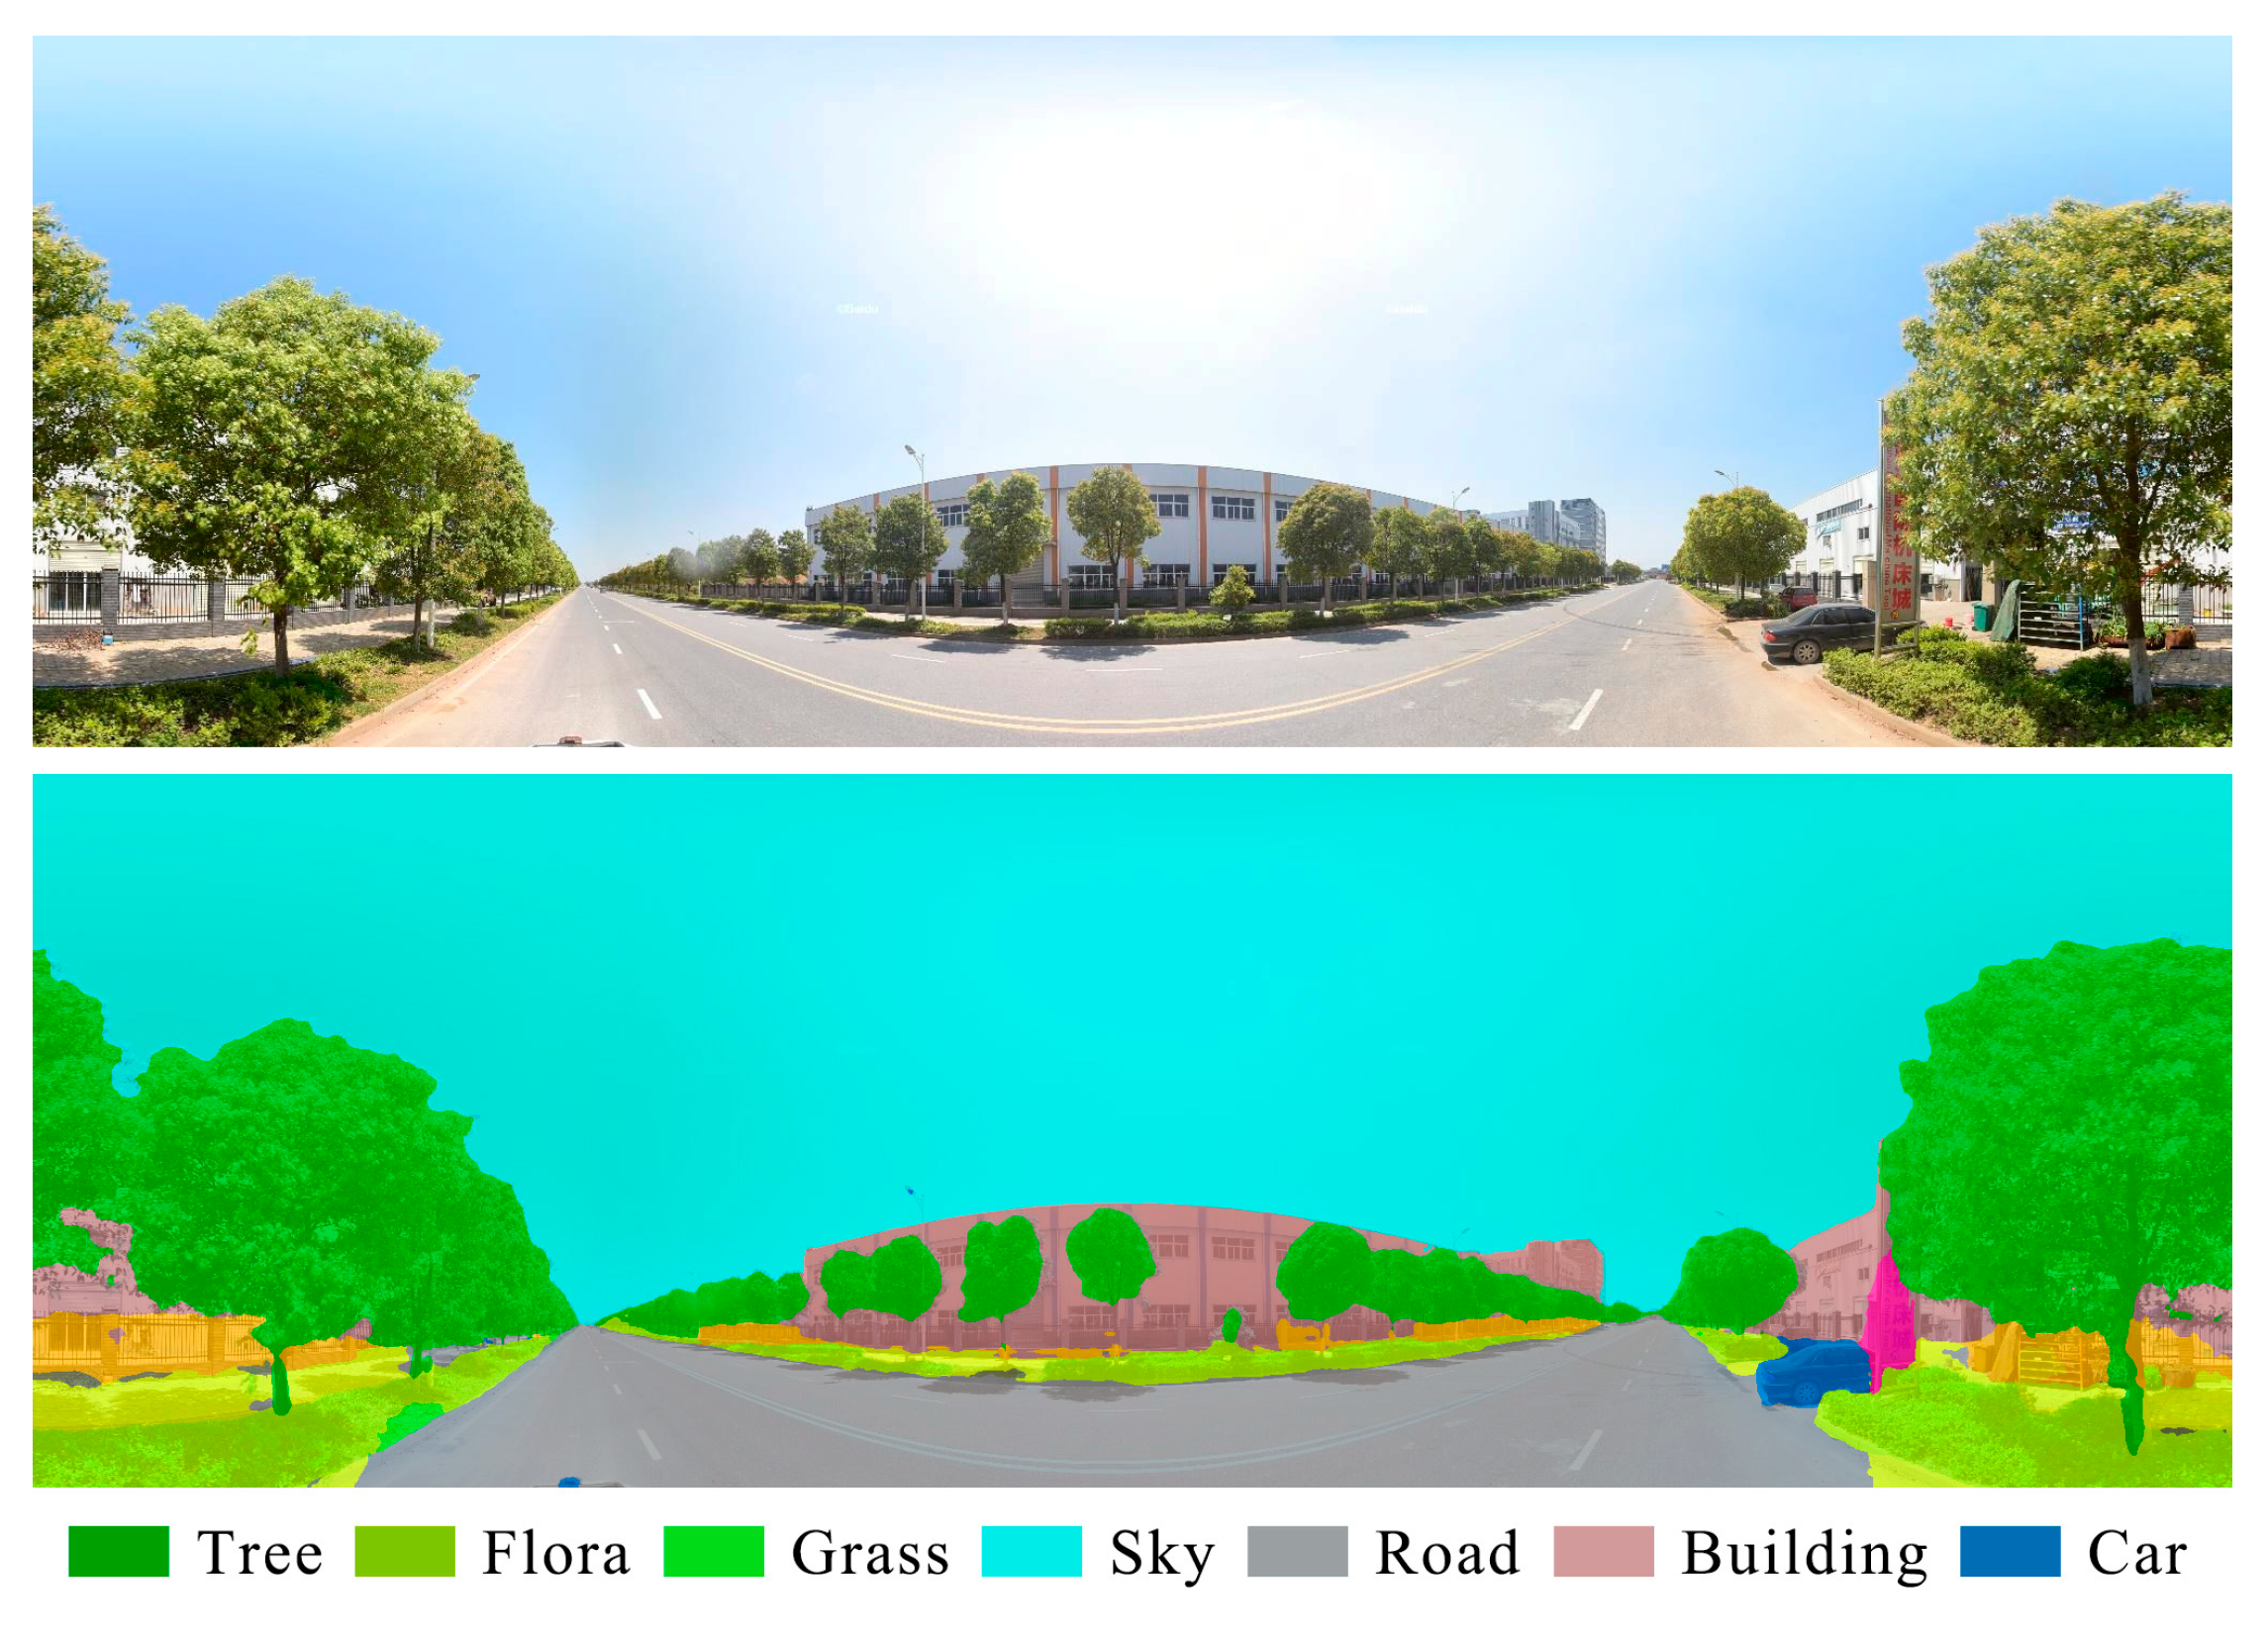
2.3.1. Street View Images

Street view image data were obtained from the Baidu Maps API, a leading internet map service provider in China offering services such as street view, route planning, intelligent navigation, and real-time traffic information [42]. Baidu Maps recently introduced the “Time Machine” feature, which allows users to access a series of time-sequenced street view images. For data collection, we first created sampling points along the road network (obtained from OpenStreetMap [43]) at 100 m intervals. Using the latitude and longitude coordinates of each sampling point, we sent HTTP requests to Baidu Maps’ panoramic static image service, enabling batch acquisition of panoramic static images with a resolution of 2048 × 664 pixels, a horizontal view of 0~360°, and a vertical view of 0~90°. These panoramas were captured by cameras mounted on car roofs at approximately 1.6 m in height, simulating an average adult’s line of sight. Next, we removed sampling points without available street view data to ensure the completeness of the dataset. We then filtered images taken before 2014 (up to 31 December 2014) and excluded images captured in non-green seasons (from October to February of the following year) through visual inspection. This process resulted in a dataset comprising 16,850 images for 2014 (Figure 2e). Similarly, we collected street view images for 2017 and 2021, obtaining 35,740 images (Figure 2f) and 37,706 images (Figure 2g), respectively.

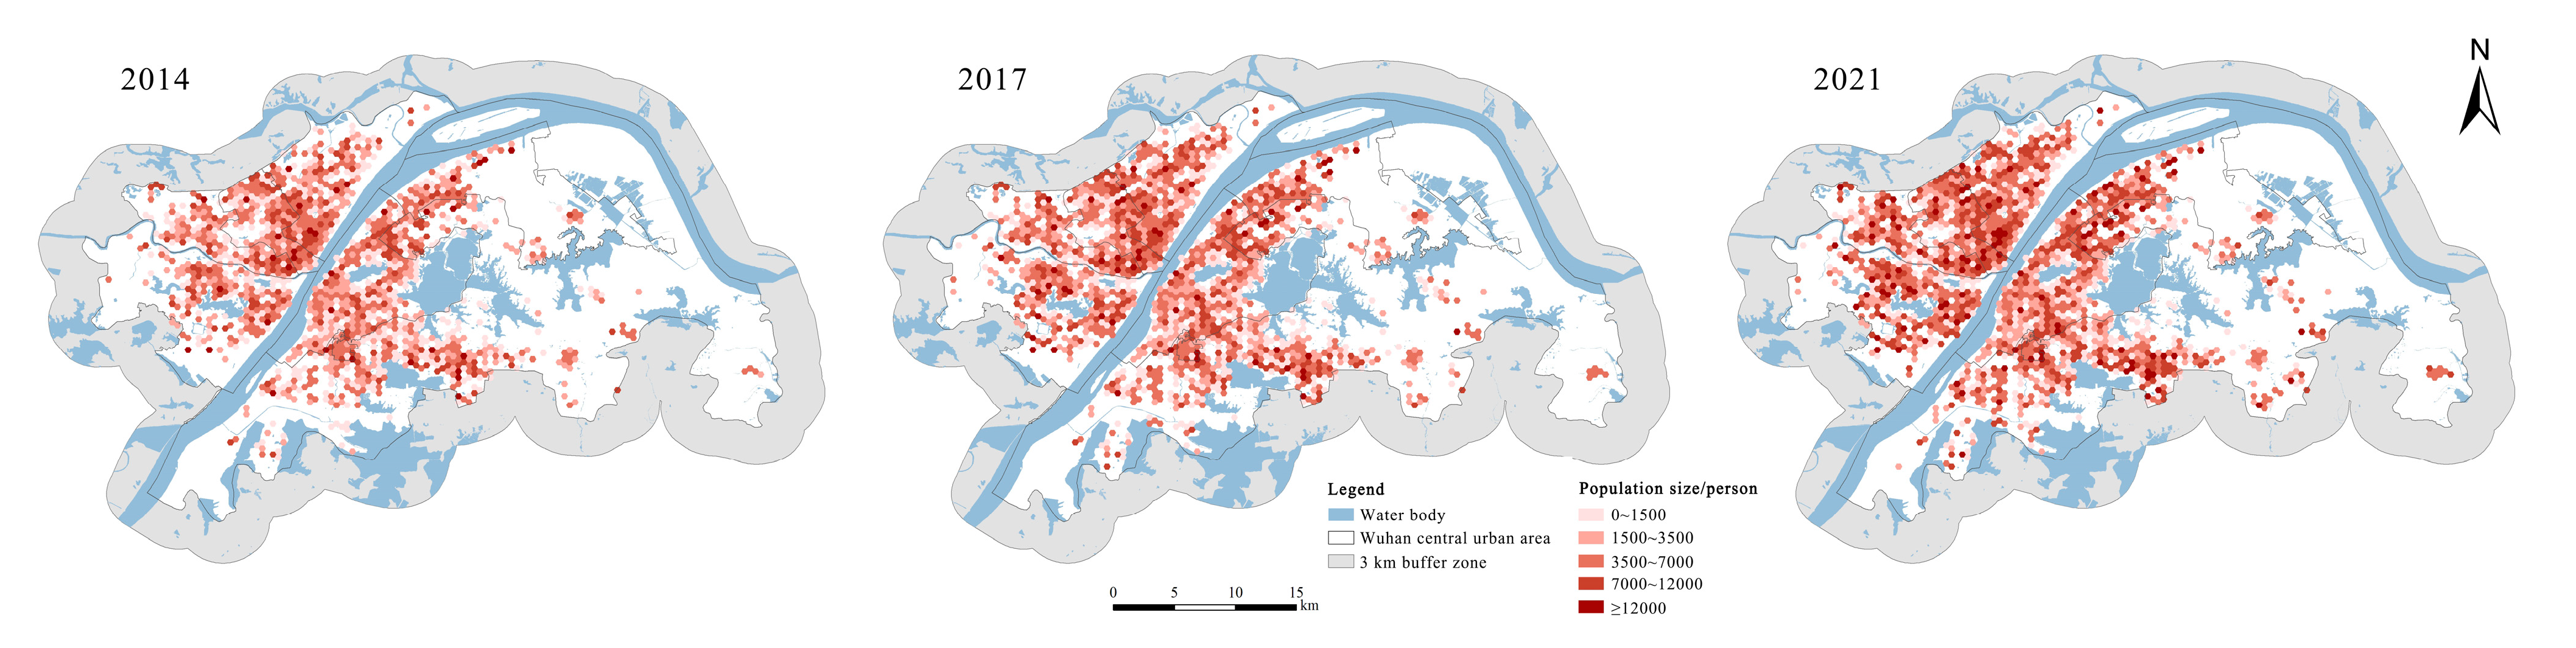
2.3.2. Residential Community Data

This study used fine-grained residential population aggregation points as the research units. The Points of Interest (POI) for residential communities in Wuhan’s central urban area as of the end of 2021 were collected from housing trading websites Anjuke (https://wuhan.anjuke.com/community/, accessed on 25 December 2021) and Lianjia (https://wh.lianjia.com/xiaoqu/, accessed on 25 December 2021). For communities lacking information on the number of households or year of construction, we supplemented this data by consulting real estate agents and observing street view maps. After data cleaning, a total of 5555 community records were obtained. We selected data for communities built before or during 2014, resulting in 4728 communities (Figure 2c), indicating an addition of 827 new communities during this period (Figure 2d). Following the same steps, we identified a total of 5247 communities built before 2017.
Previous research has found hexagonal grids to be advantageous compared to traditional square grids because they ensure equal distances from any point to the grid center in all six directions [44,45]. This characteristic not only maintains data accuracy but also reduces computational complexity and minimizes boundary effects that can introduce sample bias [46]. Consequently, this study implemented a hexagonal grid network with a side length of 250 m. Points representing residential areas within these hexagons were aggregated at the grid centroids, resulting in 1355 aggregated residential points for the year 2014 (Figure 3). By 2021, the number of aggregated residential clusters increased by 216. The clusters that persisted throughout this period were categorized as constant clusters to facilitate the subsequent quantitative analysis of changes. The total population at each aggregated point was calculated based on the total number of households after aggregation. The formulas are shown as follows:
P K = M ¯ × i A k R i
where P K represents the total population at point k, A k is the hexagon at point k, R i denotes the number of households at a specific residential point i within A k , and M ¯ is the average number of people per household.
According to the annual Wuhan Statistical Yearbook, the average number of people per household in Wuhan for the years 2014, 2017, and 2021 was 2.64, 2.66, and 2.93, respectively. The total population for 2021 calculated from this data was cross-checked with the population figures in the Wuhan Statistical Yearbook 2022, resulting in a margin of error of 3.84%. This confirmed the reliability of the population data used in this study.

2.4. Green Visibility Assessment with Green View Index (GVI)

The DeepLabv3+ model was used to identify images of street environments. This model’s effectiveness has been validated on PASCAL VOC 2012 and Cityscapes datasets, achieving performance levels of 89.0% and 82.1% on the test sets without any post-processing [47]. We employed a pre-trained model on the ADE20K dataset, which features over 20,000 images and 150 category annotations, recognized for its diverse scenes and high accuracy in image recognition [48]. Each image contains an average of 19.5 object instances and 10.5 object classes, making ADE20K superior to other datasets in diversity and annotation complexity. Moreover, ADE20K supports benchmarks such as SceneParse150, where leading models like UPerNet and PSPNet achieve state-of-the-art performance, with UPerNet-101 attaining a pixel accuracy of 81.01% and a mean IoU of 0.4266 [49]. Through image semantic segmentation, different object types were assigned distinct labels (Figure 4). The green elements visible to residents, including trees, grass, mountains, plants, vegetation clusters, flowers, and palm trees, were identified. By calculating the proportion of pixels occupied by these green elements relative to the total pixels in the image, we obtained the green view index (GVI). This entire process was completed using Python 3.8 code running on a PC (Windows 11, R5 5600, RTX 2080 Ti, 32 Gb RAM).
In 2018, Wuhan released the 15-Minute Community Life Circle Action Guide, which defined the daily basic living space for residents within an 800–1000 m radius. Accordingly, we used a 1000 m buffer radius in this study [50,51]. The average GVI of all sampling points within the buffer boundary of the residential aggregation points was used as the visibility indicator. Although recognizing that some streets lacked images in certain years due to the limited coverage when Baidu Street View was first launched in Wuhan in 2014, two factors mitigate the impact of missing images on the research results: First, the GVI for 2014 is largely consistent with the distribution of residential areas. Second, each buffer zone of residential aggregation points contained more than 20 GVI samples, and the average of all the sample points was sufficient to accurately reflect the visibility level of each residential unit [52].
With reference to previous studies [33,53], the calculated visibility results were classified into five categories based on ≤5%, 5~15%, 15~25%, 25~35%, and ≥35%, where the intervals denote low, below average, average, above average, and high, respectively.

2.5. Evaluation Methods for the Spatial Equity of Green Visibility

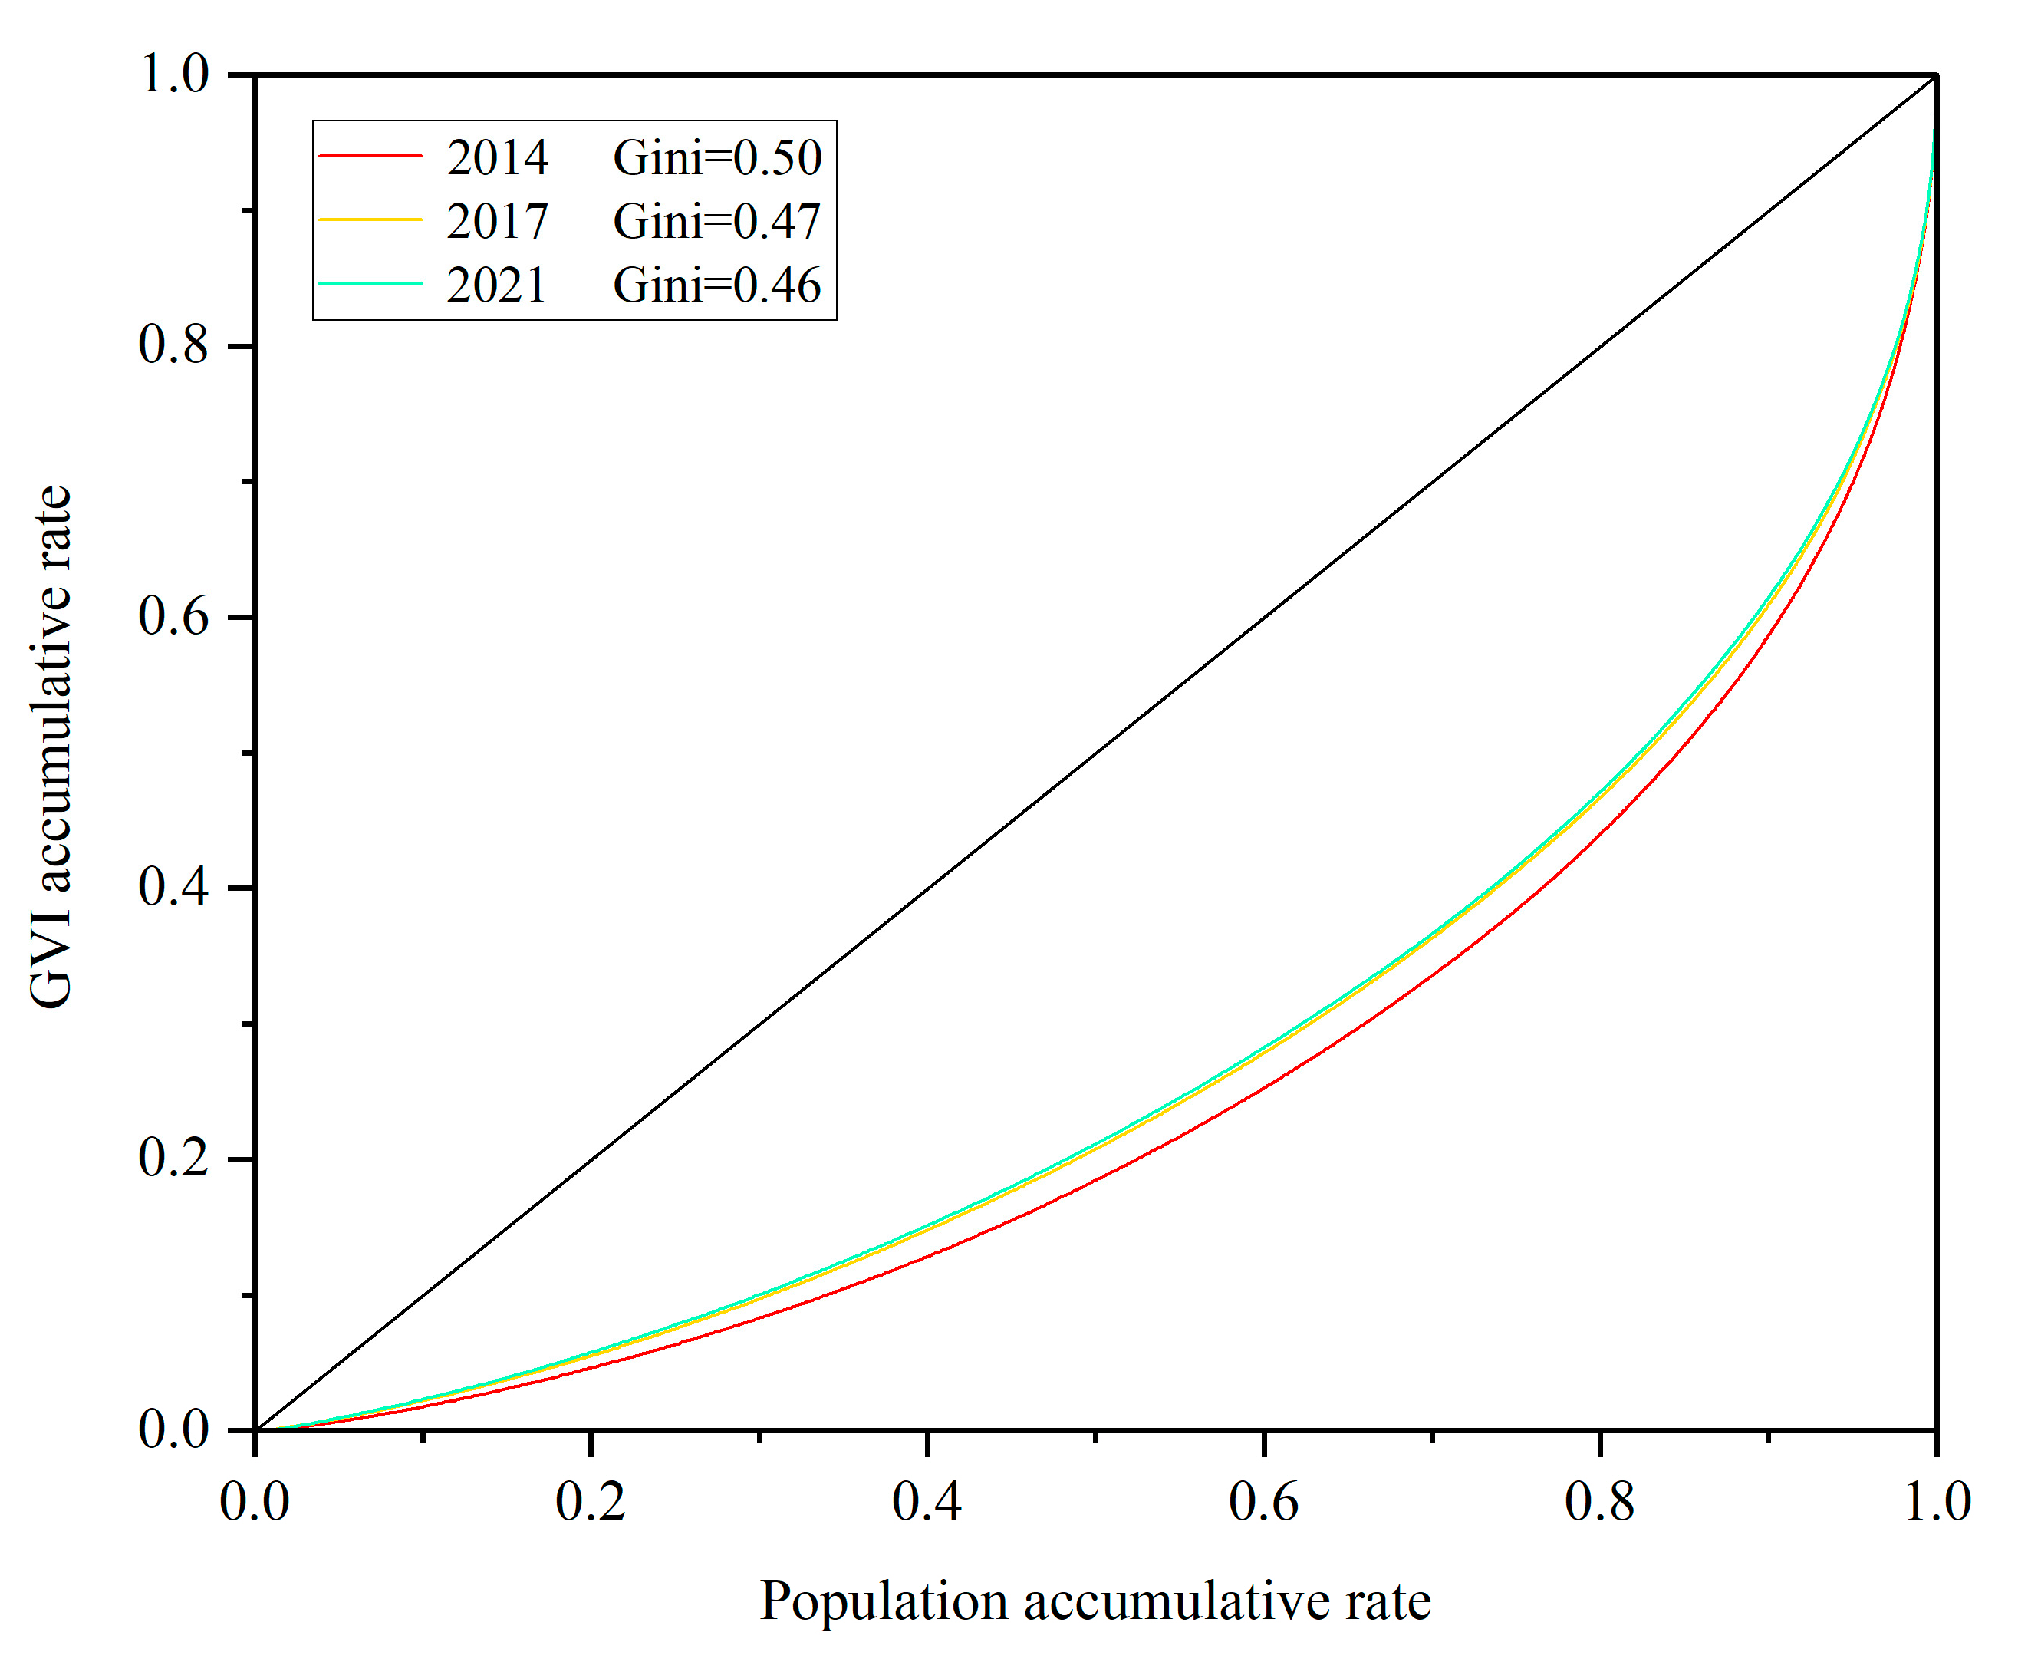
2.5.1. Gini Coefficient and Lorenz Curve

The Gini coefficient and the Lorenz curve, which were originally developed to measure the equity of income distribution [54,55], have since been adapted for use in environmental equity studies to evaluate the distribution of green resources [20,33]. In this study, the Lorenz curve represents the cumulative distribution of the GVI across the proportion of the residential population. The X-axis shows the cumulative proportion of the population, while the Y-axis shows the cumulative proportion of GVI. The Gini coefficient, derived from the Lorenz curve, quantifies inequality by measuring the area between the Lorenz curve and the line of equality, relative to the total area under the line of equality [54]. This study calculated the Gini coefficients for Wuhan’s central urban area and its districts for the years 2014, 2017, and 2021 to reveal long-term trends in the equity of residential visibility (Equation (2)). The formula used was as follows:
G = 1 K = 1 N ( P K P K 1 ) × ( G K + G K 1 )
where P K is the cumulative proportion of the population, and G K is the cumulative proportion of GVI.
The value of the Gini coefficient ranges between 0 and 1, with 0 indicating perfect equality and 1 indicating perfect inequality. Generally, a Gini coefficient below 0.2 indicates high equality, 0.2~0.3 indicates relative equality, 0.3~0.4 indicates reasonable equality, 0.4~0.5 indicates inequality, and values above 0.5 reflect substantial disparities [18].

2.5.2. Location Quotient

The location quotient (LQ) is an indicator used to study the spatial distribution of regional elements. Originally utilized in economic geography and regional economics [56], it has now been widely applied to assess the spatial equity of urban green space resources [32,33,36]. In this study, the LQ represents the ratio of the street green visibility resources (the visibility at grid scale) available to the population within a residential grid relative to the entire study area. This can reflect the spatial distribution of supply and demand levels within local regions. The LQ values are categorized into seven classes: ≤0.2, 0.2~0.5, 0.5~1.0, 1.0~1.5, 1.5~2.0, 2.0~5.0, and ≥5.0 [33,36]. An LQ greater than 1 indicates that the GVI supply and demand level in the grid is higher than the average level of the study area, with higher values indicating higher supply and demand levels (Equation (3)). The formula for this is as follows:
Q i = ( q i / p i ) / ( q / p )
where Q i is the location quotient of the GVI at point i, q i is the GVI at point i, p i is the population at point i, q is the total GVI within the study area, and p is the total population within the study area.

3. Results

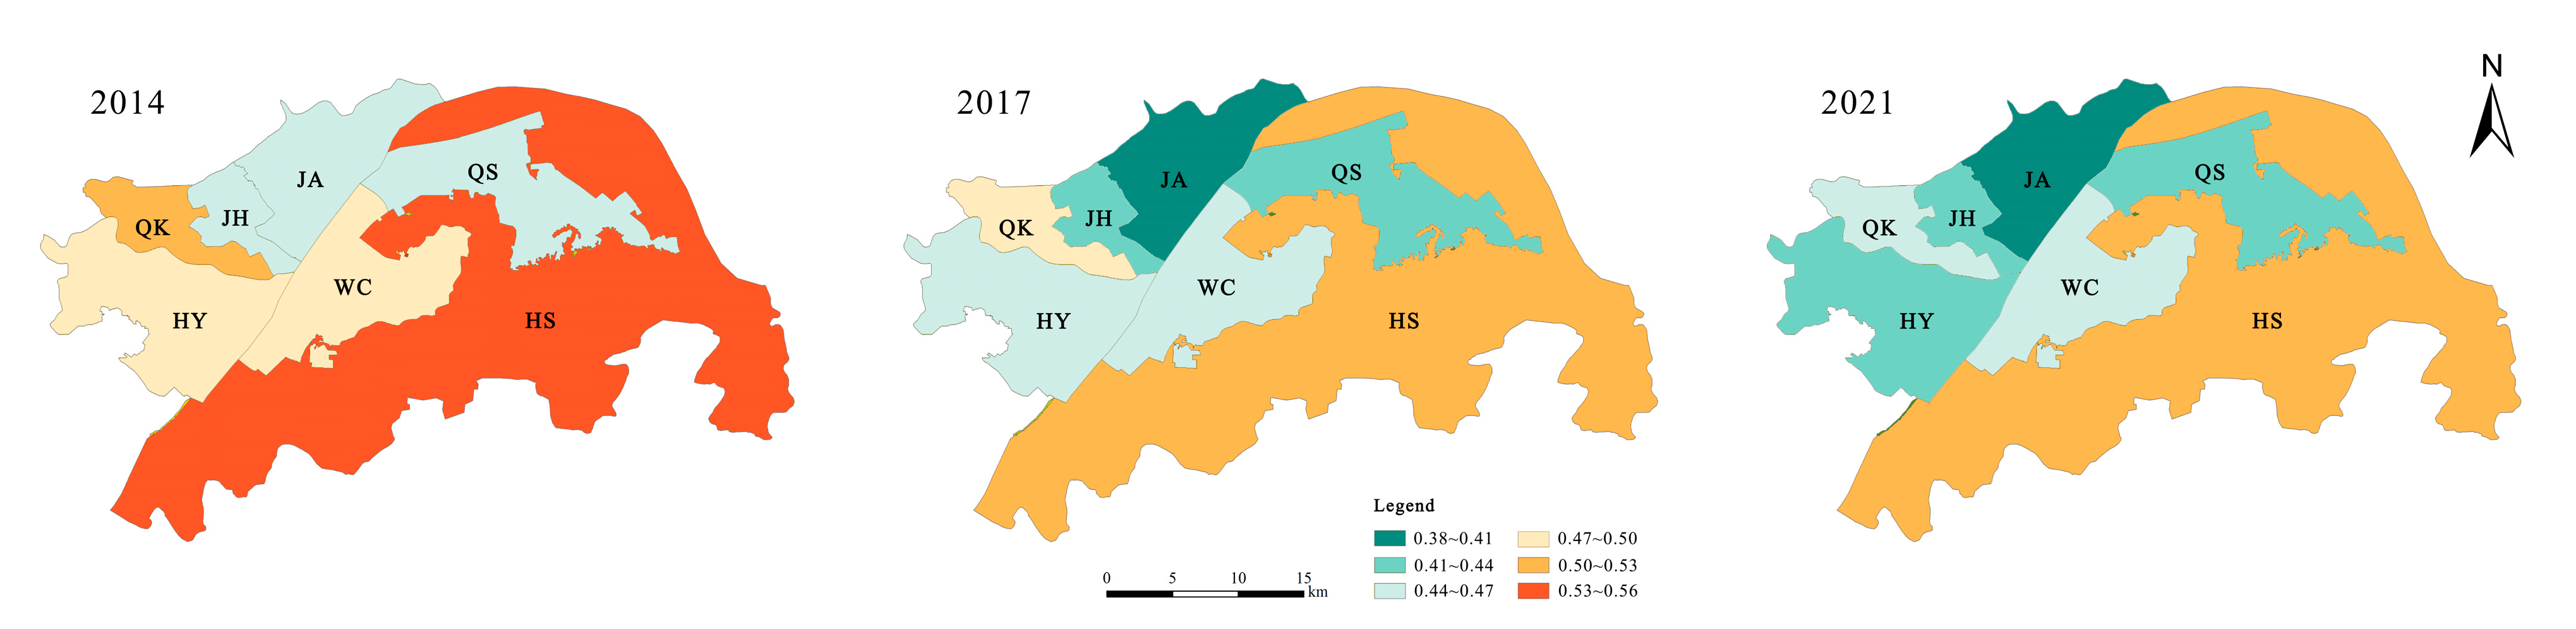
3.1. Changes in Residential Population and Green Visibility

Figure 5 shows that the population size and density of residential areas experienced significant growth from 2014 to 2021, with a consistent pattern of population clustering across the three time points. High population density areas are primarily concentrated along the banks of the Yangtze and Han rivers, particularly in the southern parts of the JH District and the JA District, the southeastern part of the QK District, and the northern part of the WC District.
Overall, from 2014 to 2021, green visibility in the central urban area of Wuhan showed an upward trend. Green visibility increased from 14.89% in 2014 to 18.03% in 2017 and further to 19.07% in 2021, representing a total increase of 4.18 percentage points. In 2014, areas with above average visibility were mainly located near Jiefang Park in the southern part of the JA District, near Heping Park in the northwestern part of the QS District, around the Hubei University of Technology in the HS District, and in the western and southern parts of the East Lake Scenic Area (Figure 6 and Table 1). However, these areas accounted for only a small fraction (7.18%) of the total, with most residential areas experiencing low or average levels of green visibility. By 2017, overall green visibility in residential areas improved, especially in the three districts east of the Yangtze River. Notable improvements were observed along the Yangtze River banks, the southern part of East Lake, and the western part of South Lake. The proportion of residential areas with below average visibility decreased by 28.61%, and about 70% of residential areas met the acceptable green visibility standard of 15% or higher. By 2021, the distribution of visibility levels stabilized, while low-visibility residential areas had dropped to zero, marking a comprehensive enhancement in urban green quality. Residential clusters with persistently low visibility were more widespread west of the Yangtze River, showing a clear trend of concentration along major roads. East of the Yangtze River, two main clusters were located north of the Qingling Flyover and west of Wuhan Railway Station.

3.2. Equity Changes Based on the Gini Coefficient and the Lorenz Curve

From 2014 to 2021, changes in the Gini coefficient for the central urban area of Wuhan are shown in Figure 7. During these three time points, the Gini coefficient remained within the 0.4–0.5 range, indicating a certain level of inequality in green visibility across the city. There are variations in the equity of green visibility among different districts (Figure 8). The JA District exhibited the highest level of equity, reaching relatively reasonable levels in 2017 and 2021. In contrast, the HS District had the lowest level of equity and was the only district among the seven to experience substantial disparities in resource allocation. The Gini coefficients for all districts showed a downward trend over the two phases, indicating a gradual improvement in equity. However, the rate of decline was relatively slow, suggesting that significant challenges remain in addressing the inequality of green visibility within the region.

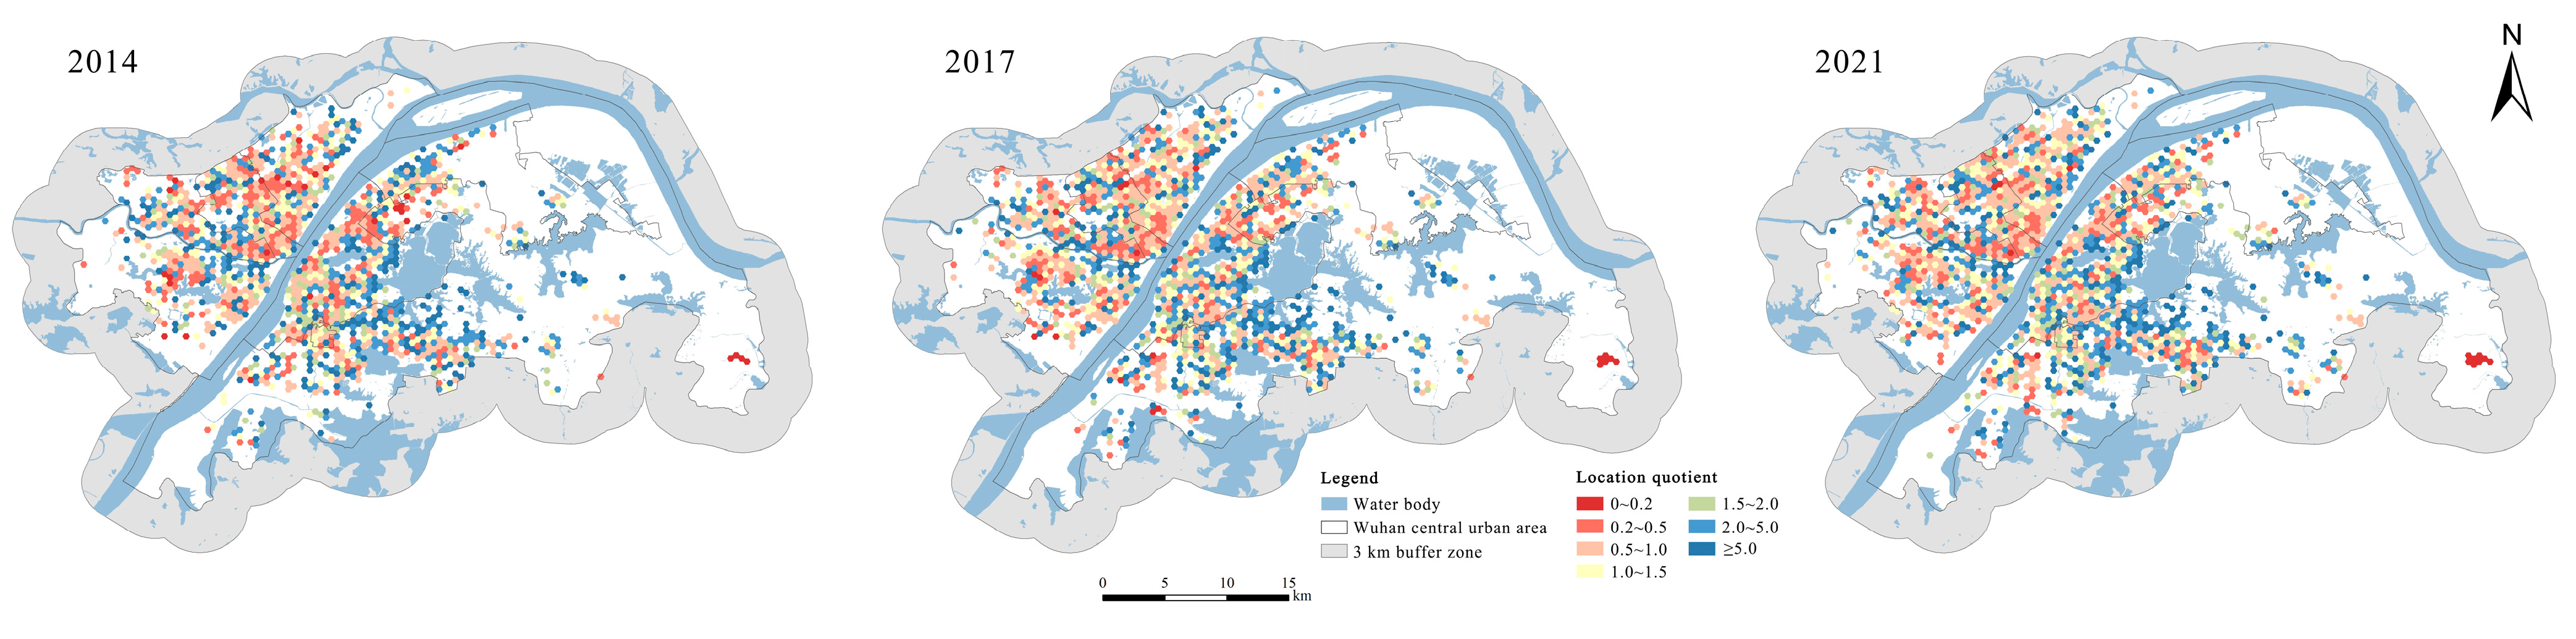
3.3. Equity Changes Based on the Location Quotient

3.3.1. Spatial Characteristics of the Location Quotient

The spatial distribution of the location quotient (LQ) in Wuhan’s central urban area from 2014 to 2021 is illustrated in Figure 9. To precisely analyze the spatial equity of urban green resources, we focused on residential clusters with LQ values less than 0.5 and greater than 2 (indicating that the street green visibility for residents in these areas is half and twice the average level, respectively). Overall, the distribution patterns across the three time points show consistency. Over time, the density of low LQ areas has decreased, while the density of high LQ areas has remained relatively stable. Specifically, the distribution of low LQ areas west of the Yangtze River is roughly the same as the visibility results of the corresponding years, indicating a significant impact of low visibility values on the LQ. In contrast, the distribution east of the Yangtze River is more dispersed, with a notable cluster only in the northwest of East Lake. These low LQ residential clusters generally have a higher population density. Interestingly, some areas with better visibility are also present within these low LQ clusters, suggesting that high population density can negatively impact visibility values, thus affecting green space equity.
On the other hand, high LQ areas typically have better visibility and less population. They are more widely distributed east of the Yangtze River, particularly around regions such as Shahu Lake, East Lake, and Nanhu Lake, where there are many grouped residential clusters. West of the Yangtze River, high LQ areas are mainly distributed along the Han River, forming smaller clusters along the Yangtze River in the JA District and around Changqing Talent Park and Houxianghe Park in the JH District.
Both extreme regions (LQ ≤ 0.2 and LQ ≥ 5.0) exhibited a gradual decrease in area and residential population over time (Table 2). Further analysis of regions with LQs between 0.2 and 0.5, as well as between 2.0 and 5.0, indicates that although there was a slight increase in the area and population proportions in some of these regions between 2017 and 2021, the overall decrease from the start to the end of the time series exceeded the observed increases. This indicates a narrowing gap in the distribution of green visibility resources around residents, suggesting a trend towards greater equity. However, it is noteworthy that in Wuhan’s central urban area, over 40% of the residential areas still have visibility supply and demand levels below the regional average (LQ less than 1), and these areas are home to more than 70% of the population. Conversely, over 30% of the residential areas have a high LQ (greater than 2), but only less than 10% of the population can enjoy this high level of supply and demand service. Despite the overall positive trend, addressing this issue of an unequal distribution in green resources remains a significant challenge for Wuhan. Ensuring that the majority of residents have access to basic green environmental benefits is crucial for the city’s future development.

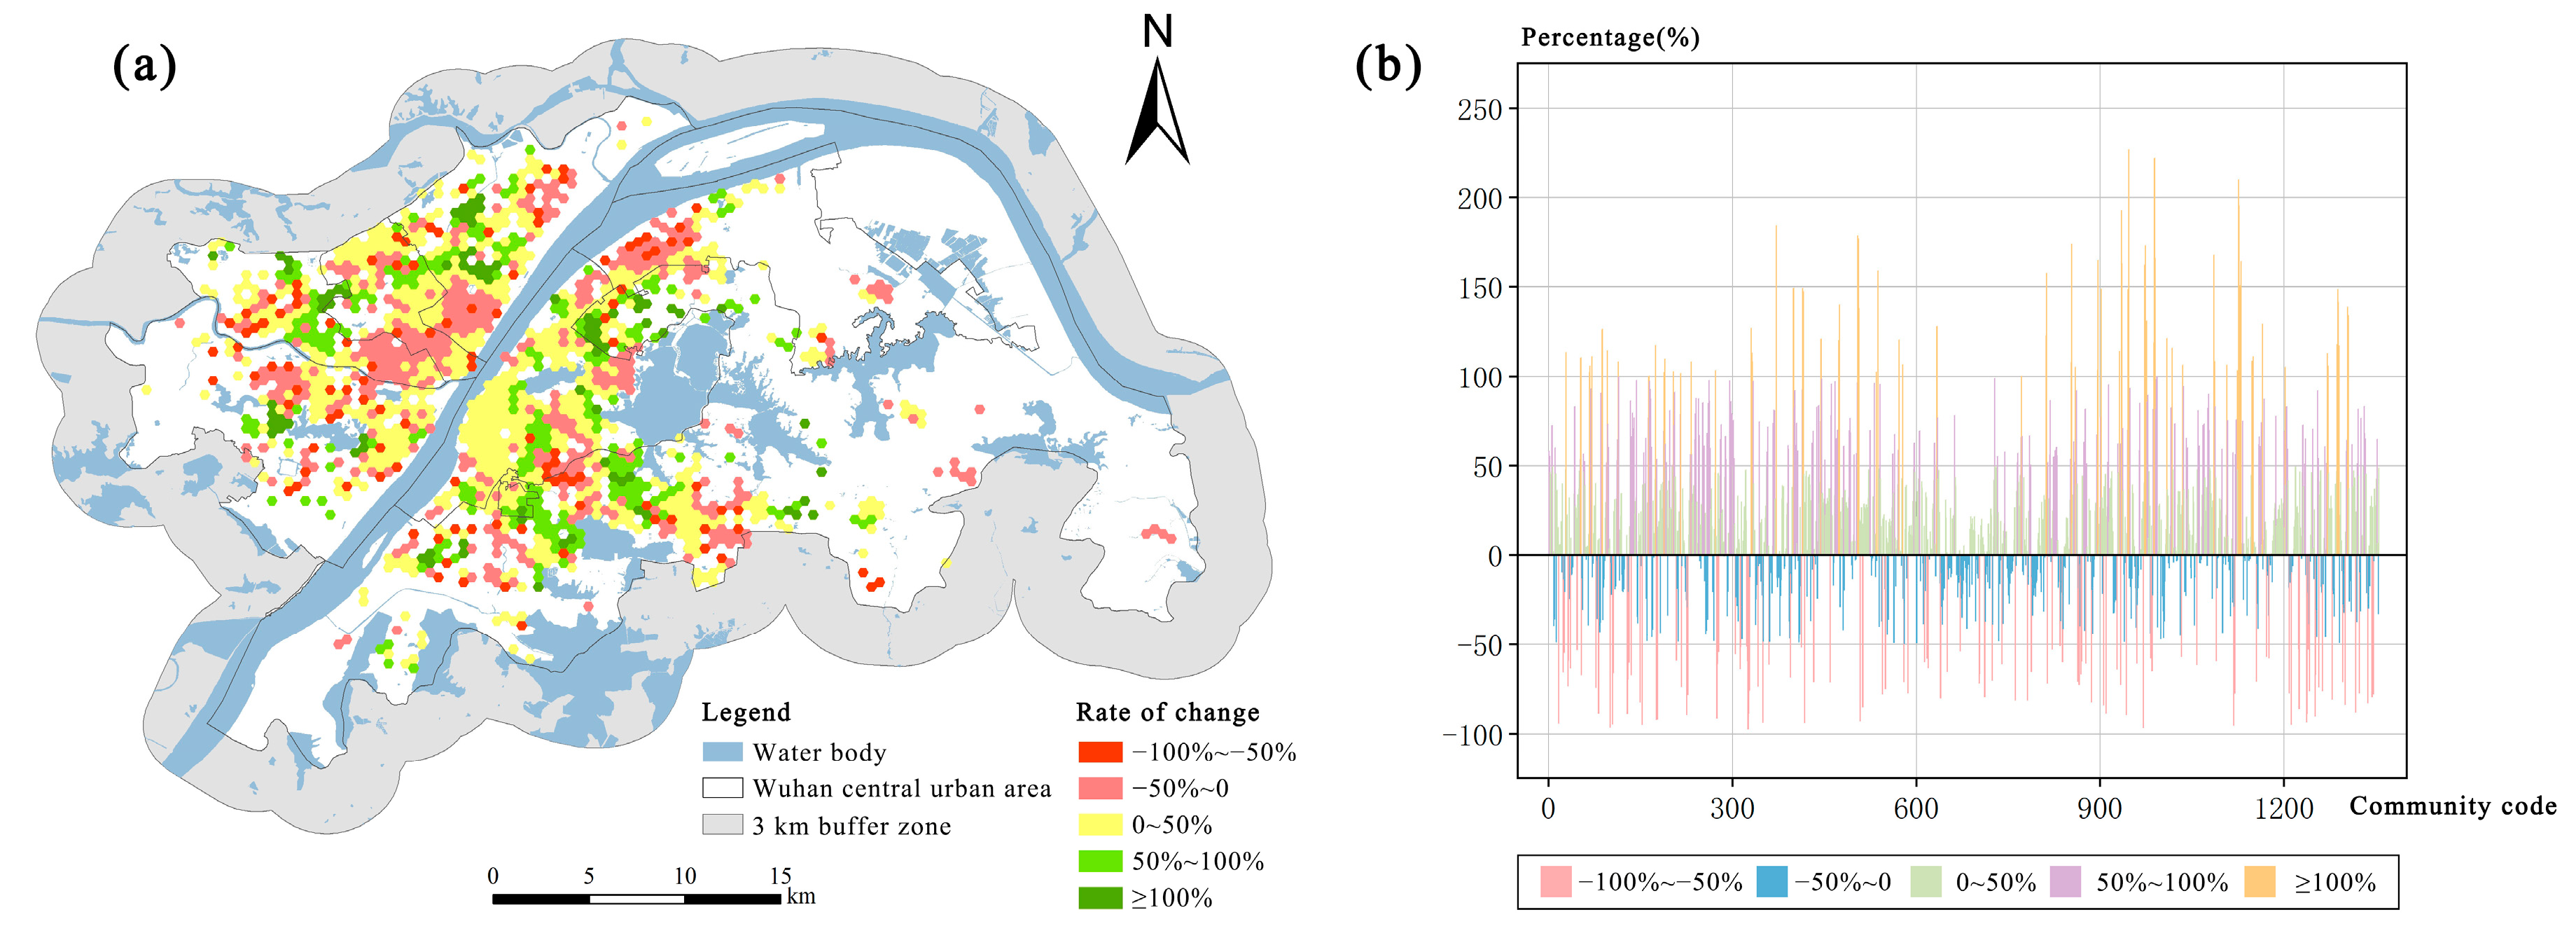
3.3.2. Changes in Location Quotient

Figure 10 illustrates the percentage change in the LQ for each residential aggregation unit from 2014 to 2021. The LQ improved in 64.8% of the residential communities, particularly in areas where green visibility significantly increased, such as the northern and southern parts of East Lake and the western part of South Lake. However, Figure 9 reveals that, despite positive growth trends, many residential communities near the Second Ring Road in Qiaokou, Jianghan and in Jiang’an districts still have an LQ below the average level (less than 1). This may reflect the initially poor green visibility in these areas. Although greening investments were made during the period, resource limitations have prevented their greening levels from reaching the equity standards matching those of the central urban area. On the other hand, the LQ decreased in 477 residential grids, accounting for 35.2% of the total. Among these, 111 grids experienced a reduction of more than 50%, primarily located in the southern parts of the JA, JH, and QK districts, the northwestern parts of the QS and HY districts, and the central–southern part of the WC district. In these regions, over 80% of the residential units saw significant population growth, with more than 3000 additional residents. Due to the high population density, the supply of green space could not meet the demand for residents. Even if green visibility improved within this range, the supply and demand level remained below average.

4. Discussion

4.1. Reasons for Changes in Green Visibility Equity

Our study reveals that population density and green visibility have both increased in Wuhan’s central urban areas, largely due to the effective implementation of urban policies. Since the introduction of the Wuhan New Urbanization Plan (2014–2020), the city has made significant progress in urbanization, including improvements in core urban services and the integration of urban and rural development. Between 2014 and 2021, Wuhan’s urbanization rate increased from 55.67% to 84.56%, reaching the average level of developed nations. During this period, a series of greening policies were enacted, which contributed to the increase in GVI. For instance, the city enhanced urban street greenery by planting trees along roads, forming continuous and dense tree-lined avenues. By the end of 2021, Wuhan had developed 2116 km of greenways and established over 350 pocket parks, bringing the total number of parks to more than 700. The 2022 Wuhan Greening Work Plan [57] aims to increase this number to 1000 by the end of the 14th Five-Year Plan period. Despite these achievements, our study indicates that green visibility equity has not significantly improved. This could be because traditional green space planning in China often relies on metrics like the green coverage rate and per capita green space, which emphasize increasing the total amount of green space and its equal distribution. However, these metrics may overlook the unequal distribution of green space, especially in densely populated areas where green space supply is limited [2]. Additionally, previous research has demonstrated that there is no significant correlation between GVI and indicators measuring the quantity of urban green space development [58]. Simply increasing green spaces along roads may not effectively address the inequality in green visibility; instead, priority should be given to low-income communities with insufficient green space supply [59]. Furthermore, limited public involvement in planning often leaves lower-income residents with little influence over green space quantity and location, leading to distribution imbalances. As many low-income residents lack time to participate in public meetings due to work and family responsibilities, relying solely on public participation is ineffective. Proactive government policies are necessary to mandate additional greenery in low-income neighborhoods, ensuring equitable access to green space benefits.
Our study has focused on the spatial equity of green visibility and draws conclusions that align with previous research. Surrounding environmental characteristics influence the distribution of GVI through two pathways, including the nature of land use and the physical attributes of streets [60]. High-visibility residential areas are often located along rivers and lakes, consistent with findings from a case study in Guangzhou [35]. Existing water systems, such as the Yangtze River, Han River, East Lake, and South Lake, provide a solid ecological foundation for Wuhan’s greenway construction. Numerous riverside and wetland parks have added rich green resources to the city. Conversely, low-visibility residential areas are typically concentrated around major urban roads (including expressways), aligning with Luo’s findings [36]. Although sections of Wuhan’s second ring road have improved green visibility by adding central green belts, the wide road width still limits canopy coverage, increasing the visible proportion of sky and road surfaces in street view images. Reducing road widths in lower-income neighborhoods could create space for tree canopies, mitigating heat islands and enhancing green visibility. Furthermore, the widespread use of elevated expressways restricts the planting of mature trees, further diminishing green visibility and exacerbating heat island effects [33]. Prioritizing ground-level roads with adequate greenery could address these issues.
In terms of overall equity, Gini coefficients vary significantly across different districts, likely due to differences in geographical location and resource allocation. The JA District had the lowest Gini coefficient and broke the pattern of inequality in 2017. Located on the northern bank of the Yangtze River, it is home to Hankou Riverside Park, the largest riverside green plaza in Asia. During the 13th Five-Year Plan period, driven by preparations for the Military World Games, the district saw a significant increase in green space, with a 5.28% rise in green coverage [61]. In contrast, the HS District, with its concentration of universities and rich educational resources, has seen an increase in population density, putting pressure on urban green spaces and public open areas [62]. This has made it the only district with a substantial disparity in resource distribution. To alleviate these pressures, reducing hardscape in walkways, plazas, and roads is essential to provide more space for tree roots and enable trees to develop full canopies, improving green coverage and environmental quality in high-density areas. In terms of local equity, the spatial distribution of the LQ is influenced by both population density and visibility levels, consistent with Huang’s findings Huang et al., 2024 [33]. Even in residential clusters with many high-visibility streets, the location entropy value may be diluted by a larger population.
Our study identifies a certain mismatch between the spatial growth of green spaces and population density, a pattern also observed in many other Chinese cities [63]. Previous researchers would attribute green inequities to the planning system and the market economy [64,65]. Here, we argue that similar market drivers may further exacerbate residential spatial differentiation in Wuhan, ultimately leading to visibility inequality. Although most urban green space in China is provided by the government, it is maintained through local public funding, which is closely tied to the economic conditions of the community [37]. Consequently, economically advantaged communities tend to have more street greenery due to their ability to cover maintenance costs, while lower-income areas with fewer green resources often lack adequate maintenance [33,38]. For instance, in the Jianghan Second Bridge Subdistrict of the HY District, early welfare housing allocated by work units has attracted migrant workers with low rental costs but suffers from poor green services and inadequate provision. To address this disparity, government-led maintenance should replace local community-based systems, ensuring equal access to quality greenery regardless of a community’s economic conditions. Additionally, green gentrification has emerged in low-income communities where greening measures were implemented [66]. For instance, the Yangtze River waterfront area launched the New Port Yangtze City project in 2013. Residential types transitioned from traditional villages and neighborhoods to integrated residential, commercial, and office spaces, enhancing green space services. However, this transformation led to a surge in housing prices, forcing many low-income residents affected by demolition to relocate to the urban periphery, further limiting their access to green space benefits [67]. To address this, urban planning should ensure equal green space allocation in both high- and low-income neighborhoods to prevent green gentrification. Additionally, reducing hardscape in dense areas, such as walkways and plazas, can create more opportunities for greenery without triggering surges in house prices.

4.2. Relevant Improvements for Urban Greening Strategies

Our study highlights the need for urban planners and policymakers to consider equity changes when developing green space and urban renewal strategies, as traditional green space indicators cannot effectively monitor these changes. The green visibility equity evaluation framework developed in this research should be integrated into future planning processes to ensure fairness while minimizing undue burdens on low-income communities. Based on the observed changes in visibility equity, we explored the underlying causes of inequities. Building on this, we propose the following improvement measures, considering both human and green space perspectives.
In the context of Big Data, GVI offers urban decision-makers a new metric to objectively assess the quality of “people-centered” urban green space development. However, the high cost and infrequent updates of street view data limit its application in dynamic evaluations [37]. To address this, the government could collaborate with commercial companies to establish a real-time updating dataset, enabling continuous monitoring of green visibility. Additionally, green space equity issues fundamentally involve the interplay between government, people, and capital. As McDermott et al. [68] have pointed out: “True justice is not achieved by focusing solely on distributive equity but is further promoted when people have the right to participate in related decision-making and implementation processes”. To address equity concerns practically, the government should lead green space development by establishing a “multi-stakeholder cooperation” framework that includes input mechanisms designed to accommodate the diverse time and resource constraints of residents, particularly those from low-income and migrant groups. Conducting targeted surveys and interviews can help identify community needs without requiring extensive unpaid participation, thus supporting fair benefit distribution strategies.
Differentiated and fine-tuned regulations can be applied to urban green spaces to meet higher GVI demands. Macroscopically, advancing the open block system and incorporating daily living circles into green corridor planning can be effective [69]. For instance, to address the issue of green space privatization, such as the reduced public accessibility to green resources in the villa district on the southern shore of Moshui Lake, dismantling walls and constructing new greenways to reopen access to the lakeshore is proposed. This initiative promotes the sharing of green spaces and supports the United Nations Sustainable Development Goals of “reducing inequalities” and “creating sustainable cities and communities” [70]. Additionally, in densely built areas, selecting street trees with larger leaf areas and canopies, increasing planting density and layers, and reducing hardscapes near buildings can provide extensive shade, mitigate urban heat islands, and address climate change. For example, these tall canopy trees enable reduced air conditioner usage, supporting energy conservation. Grass, maintained with slow-release fertilizers and electric lawn mowers, is preferable to wood chips, paver stones, or wide concrete or asphalt sidewalks.

4.3. Limitations

Some limitations of this study should be acknowledged. Firstly, data acquisition and processing faced challenges, such as difficulty in obtaining historical data and insufficient accuracy of single data sources. The limited number of observation points covered by panoramic static images means they cannot capture the greening of all urban areas, potentially affecting our results. Additionally, the growing season of plants directly impacts the proportion of visible green vegetation. Images taken early in the planting season and not updated will result in lower GVI values. Future studies could apply larger street-view datasets, such as Global Streetscapes [71], and integrate 2D remote sensing data to enrich these datasets. Additionally, other potential geospatial datasets, such as LiDAR and multispectral imagery [72], could provide valuable information on vegetation height, density, and health, thereby enhancing GVI assessments. Moreover, the population estimates for aggregated residential points, derived from total household counts based on POI data, may lack precision. Secondly, the impact of grid resolution on the study results was not discussed. Thirdly, this study primarily employed qualitative analysis to assess changes in equity, using specific examples for support. However, the lack of quantitative examination of influencing factors limits our understanding of the driving forces and their specific impacts. Future research should apply correlation analysis to gain deeper insights into the factors driving equity evolution and their interactions. Finally, this study only considered the spatial attributes of urban residents. Future research could extend equity studies to encompass cultural, economic, and other social dimensions. For instance, social surveys may help capture the diverse needs of different social groups, particularly vulnerable populations. Such insights would support scientifically grounded, targeted strategies for integrating equity considerations into urban spatial planning.

5. Conclusions

Understanding the long-term changes in green visibility and equity within communities during rapid urbanization is an emerging issue in China. This study innovatively utilized the “Time Machine” feature to access historical street view images, combined with deep learning to detect changes in green visibility. By employing Gini coefficients and location entropy as evaluation metrics, we focused on the spatio-temporal differentiation of the equity of residents’ green perceptions. We conducted an empirical study in the central urban area of Wuhan. The results indicate that from 2014 to 2021, the overall green visibility in Wuhan increased by 4.18%. High-visibility residential clusters were typically distributed along rivers and lakes, while low-visibility clusters were often concentrated around major urban roads. The Gini coefficient for Wuhan’s central urban area consistently indicated inequality, with only a slow decrease over time. The JA District had the highest level of equity, while the HS District had the lowest. The spatial distribution of the LQ was related to the population and visibility distribution of the same year. Although the disparity in the distribution of green visibility resources is gradually narrowing, there remains a spatial mismatch between population growth and green space expansion. Based on the analysis of equity changes, corresponding greening improvement strategies were proposed, aimed at balancing the impact of residential differentiation on the distribution of green resources within urban spaces.
This study highlights the disparities and lack of greenery caused by residential spatial differentiation in Wuhan’s central urban areas and provides an action plan to improve green equity: (1) integrating the green visibility equity evaluation framework to guide fair planning and optimize benefit distribution; (2) reducing hardscapes and elevating roads in densely populated areas to facilitate the planting and maintenance of tall canopy trees; (3) ensuring equal green space allocation in low-income and high-income communities to curb house price surges and narrow road widths, and to promote open-block layouts. The use of time-series street view images in this study advances spatio-temporal research on visibility equity, enabling more effective planning and management of street-level urban green spaces. This approach offers actionable insights and serves as a model for rapidly urbanizing Chinese cities facing similar green space equity challenges, contributing to sustainable urban development.

Author Contributions

Conceptualization, X.G. and C.L.; methodology, C.L.; software, C.L. and Y.T.; validation, C.L. and S.B.; formal analysis, C.L. and S.B.; investigation, C.L. and Y.T.; resources, S.B.; data curation, C.L. and Y.T.; writing—original draft preparation, C.L.; writing—review and editing, X.G. and S.B.; visualization, C.L. and Y.T.; supervision, X.G. and S.B.; project administration, X.G. and S.B.; funding acquisition, X.G. All authors have read and agreed to the published version of the manuscript.

Funding

This research was funded by the National Natural Science Foundation of China (51908063) and Philosophy and Social Science Foundation of Hubei Province (21Q049).

Institutional Review Board Statement

Not applicable.

Informed Consent Statement

Not applicable.

Data Availability Statement

The original contributions presented in this study are included in the article. Further inquiries can be directed to the corresponding author.

Conflicts of Interest

The authors declare no conflicts of interest.

References

  1. Jabbar, M.; Yusoff, M.M.; Shafie, A. Assessing the Role of Urban Green Spaces for Human Well-Being: A Systematic Review. GeoJournal 2022, 87, 4405–4423. [Google Scholar] [CrossRef] [PubMed]
  2. Kabisch, N.; Haase, D. Green Justice or Just Green? Provision of Urban Green Spaces in Berlin, Germany. Landsc. Urban Plan. 2014, 122, 129–139. [Google Scholar] [CrossRef]
  3. Jim, C.Y.; Chen, W.Y. Assessing the Ecosystem Service of Air Pollutant Removal by Urban Trees in Guangzhou (China). J. Environ. Manag. 2008, 88, 665–676. [Google Scholar] [CrossRef] [PubMed]
  4. Margaritis, E.; Kang, J. Relationship between Green Space-Related Morphology and Noise Pollution. Ecol. Indic. 2017, 72, 921–933. [Google Scholar] [CrossRef]
  5. Yao, L.; Li, T.; Xu, M.; Xu, Y. How the Landscape Features of Urban Green Space Impact Seasonal Land Surface Temperatures at a City-Block-Scale: An Urban Heat Island Study in Beijing, China. Urban For. Urban Green. 2020, 52, 126704. [Google Scholar] [CrossRef]
  6. Zhou, S.; Diao, H.; Wang, J.; Jia, W.; Xu, H.; Xu, X.; Wang, M.; Sun, C.; Qiao, R.; Wu, Z. Multi-Stage Optimization Framework for Synergetic Grey-Green Infrastructure in Response to Long-Term Climate Variability Based on Shared Socio-Economic Pathways. Water Res. 2025, 274, 123091. [Google Scholar] [CrossRef]
  7. Kong, F.; Yin, H.; Nakagoshi, N. Using GIS and Landscape Metrics in the Hedonic Price Modeling of the Amenity Value of Urban Green Space: A Case Study in Jinan City, China. Landsc. Urban Plan. 2007, 79, 240–252. [Google Scholar] [CrossRef]
  8. Liu, Y.; Wang, R.; Lu, Y.; Li, Z.; Chen, H.; Cao, M.; Zhang, Y.; Song, Y. Natural Outdoor Environment, Neighbourhood Social Cohesion and Mental Health: Using Multilevel Structural Equation Modelling, Streetscape and Remote-Sensing Metrics. Urban For. Urban Green. 2020, 48, 126576. [Google Scholar] [CrossRef]
  9. Nesbitt, L.; Meitner, M.J.; Girling, C.; Sheppard, S.R.J.; Lu, Y. Who Has Access to Urban Vegetation? A Spatial Analysis of Distributional Green Equity in 10 US Cities. Landsc. Urban Plan. 2019, 181, 51–79. [Google Scholar] [CrossRef]
  10. Zhang, J.; Cheng, Y.; Li, H.; Wan, Y.; Zhao, B. Deciphering the Changes in Residential Exposure to Green Spaces: The Case of a Rapidly Urbanizing Metropolitan Region. Build. Environ. 2021, 188, 107508. [Google Scholar] [CrossRef]
  11. Robinson, J.M.; Mavoa, S.; Robinson, K.; Brindley, P. Urban Centre Green Metrics in Great Britain: A Geospatial and Socioecological Study. PLoS ONE 2022, 17, e0276962. [Google Scholar] [CrossRef] [PubMed]
  12. Rutt, R.L.; Gulsrud, N.M. Green Justice in the City: A New Agenda for Urban Green Space Research in Europe. Urban For. Urban Green. 2016, 19, 123–127. [Google Scholar] [CrossRef]
  13. Li, X.; Zhang, C.; Li, W.; Kuzovkina, Y.A. Environmental Inequities in Terms of Different Types of Urban Greenery in Hartford, Connecticut. Urban For. Urban Green. 2016, 18, 163–172. [Google Scholar] [CrossRef]
  14. Zhang, Y.; Wu, Q.; Wu, L.; Li, Y. Measuring Community Green Inequity: A Fine-Scale Assessment of Beijing Urban Area. Land 2021, 10, 1197. [Google Scholar] [CrossRef]
  15. Gascon, M.; Cirach, M.; Martínez, D.; Dadvand, P.; Valentín, A.; Plasència, A.; Nieuwenhuijsen, M.J. Normalized Difference Vegetation Index (NDVI) as a Marker of Surrounding Greenness in Epidemiological Studies: The Case of Barcelona City. Urban For. Urban Green. 2016, 19, 88–94. [Google Scholar] [CrossRef]
  16. Leng, S.; Sun, R.; Yang, X.; Chen, L. Global Inequities in Population Exposure to Urban Greenspaces Increased amidst Tree and Nontree Vegetation Cover Expansion. Commun. Earth Environ. 2023, 4, 464. [Google Scholar] [CrossRef]
  17. Hong, Z.; Xu, W.; Liu, Y.; Wang, L.; Ou, G.; Lu, N.; Dai, Q. Retrieval of Three-Dimensional Green Volume in Urban Green Space from Multi-Source Remote Sensing Data. Remote Sens. 2023, 15, 5364. [Google Scholar] [CrossRef]
  18. Wang, X.; Meng, Q.; Liu, X.; Allam, M.; Zhang, L.; Hu, X.; Bi, Y.; Jancsó, T. Evaluation of Fairness of Urban Park Green Space Based on an Improved Supply Model of Green Space: A Case Study of Beijing Central City. Remote Sens. 2022, 15, 244. [Google Scholar] [CrossRef]
  19. Williams, T.G.; Logan, T.M.; Zuo, C.T.; Liberman, K.D.; Guikema, S.D. Parks and Safety: A Comparative Study of Green Space Access and Inequity in Five US Cities. Landsc. Urban Plan. 2020, 201, 103841. [Google Scholar] [CrossRef]
  20. Zhang, S.; Yu, P.; Chen, Y.; Jing, Y.; Zeng, F. Accessibility of Park Green Space in Wuhan, China: Implications for Spatial Equity in the Post-COVID-19 Era. Int. J. Environ. Res. Public Health 2022, 19, 5440. [Google Scholar] [CrossRef]
  21. Jiang, B.; Deal, B.; Pan, H.; Larsen, L.; Hsieh, C.-H.; Chang, C.-Y.; Sullivan, W.C. Remotely-Sensed Imagery vs. Eye-Level Photography: Evaluating Associations among Measurements of Tree Cover Density. Landsc. Urban Plan. 2017, 157, 270–281. [Google Scholar] [CrossRef]
  22. Sánchez, I.A.V.; Labib, S.M. Accessing Eye-Level Greenness Visibility from Open-Source Street View Images: A Methodological Development and Implementation in Multi-City and Multi-Country Contexts. Sustain. Cities Soc. 2024, 103, 105262. [Google Scholar] [CrossRef]
  23. Biljecki, F.; Ito, K. Street View Imagery in Urban Analytics and GIS: A Review. Landsc. Urban Plan. 2021, 215, 104217. [Google Scholar] [CrossRef]
  24. Helbich, M.; Yao, Y.; Liu, Y.; Zhang, J.; Liu, P.; Wang, R. Using Deep Learning to Examine Street View Green and Blue Spaces and Their Associations with Geriatric Depression in Beijing, China. Environ. Int. 2019, 126, 107–117. [Google Scholar] [CrossRef]
  25. Lu, Y. The Association of Urban Greenness and Walking Behavior: Using Google Street View and Deep Learning Techniques to Estimate Residents’ Exposure to Urban Greenness. Int. J. Environ. Res. Public Health 2018, 15, 1576. [Google Scholar] [CrossRef]
  26. Wang, R.; Browning, M.H.E.M.; Qin, X.; He, J.; Wu, W.; Yao, Y.; Liu, Y. Visible Green Space Predicts Emotion: Evidence from Social Media and Street View Data. Appl. Geogr. 2022, 148, 102803. [Google Scholar] [CrossRef]
  27. Yang, L.; Yang, H.; Yu, B.; Lu, Y.; Cui, J.; Lin, D. Exploring Non-Linear and Synergistic Effects of Green Spaces on Active Travel Using Crowdsourced Data and Interpretable Machine Learning. Travel Behav. Soc. 2024, 34, 100673. [Google Scholar] [CrossRef]
  28. Lusk, A.C.; Da Silva Filho, D.F.; Dobbert, L. Pedestrian and Cyclist Preferences for Tree Locations by Sidewalks and Cycle Tracks and Associated Benefits: Worldwide Implications from a Study in Boston, MA. Cities 2020, 106, 102111. [Google Scholar] [CrossRef]
  29. Aoki, Y. Relationship between percieved greenery and width of visual fields. J. Jpn. Inst. Landsc. Archit. 1987, 51, 1–10. [Google Scholar] [CrossRef]
  30. Ki, D.; Lee, S. Analyzing the Effects of Green View Index of Neighborhood Streets on Walking Time Using Google Street View and Deep Learning. Landsc. Urban Plan. 2021, 205, 103920. [Google Scholar] [CrossRef]
  31. Sun, Y.; Wang, X.; Zhu, J.; Chen, L.; Jia, Y.; Lawrence, J.M.; Jiang, L.; Xie, X.; Wu, J. Using Machine Learning to Examine Street Green Space Types at a High Spatial Resolution: Application in Los Angeles County on Socioeconomic Disparities in Exposure. Sci. Total Environ. 2021, 787, 147653. [Google Scholar] [CrossRef] [PubMed]
  32. Peng, L.; Zhang, L.; Li, X.; Wang, P.; Zhao, W.; Wang, Z.; Jiao, L.; Wang, H. Spatio-Temporal Patterns of Ecosystem Services Provided by Urban Green Spaces and Their Equity along Urban–Rural Gradients in the Xi’an Metropolitan Area, China. Remote Sens. 2022, 14, 4299. [Google Scholar] [CrossRef]
  33. Huang, Z.; Tang, L.; Qiao, P.; He, J.; Su, H. Socioecological Justice in Urban Street Greenery Based on Green View Index-A Case Study within the Fuzhou Third Ring Road. Urban For. Urban Green. 2024, 95, 128313. [Google Scholar] [CrossRef]
  34. Csomós, G.; Farkas, Z.J.; Kolcsár, R.A.; Szilassi, P.; Kovács, Z. Measuring Socio-Economic Disparities in Green Space Availability in Post-Socialist Cities. Habitat Int. 2021, 117, 102434. [Google Scholar] [CrossRef]
  35. Xue, C.; Jin, C.; Xu, J. Inequality in Urban Green Space Benefits: Combining Street Greenery and Park Greenery. PLoS ONE 2022, 17, e0273191. [Google Scholar] [CrossRef]
  36. Luo, J.; Zhai, S.; Song, G.; He, X.; Song, H.; Chen, J.; Liu, H.; Feng, Y. Assessing Inequity in Green Space Exposure toward a “15-Minute City” in Zhengzhou, China: Using Deep Learning and Urban Big Data. Int. J. Environ. Res. Public Health 2022, 19, 5798. [Google Scholar] [CrossRef]
  37. Wang, R.; Cao, M.; Yao, Y.; Wu, W. The Inequalities of Different Dimensions of Visible Street Urban Green Space Provision: A Machine Learning Approach. Land Use Policy 2022, 123, 106410. [Google Scholar] [CrossRef]
  38. Wang, R.; Feng, Z.; Pearce, J.; Yao, Y.; Li, X.; Liu, Y. The Distribution of Greenspace Quantity and Quality and Their Association with Neighbourhood Socioeconomic Conditions in Guangzhou, China: A New Approach Using Deep Learning Method and Street View Images. Sustain. Cities Soc. 2021, 66, 102664. [Google Scholar] [CrossRef]
  39. Ren, J.; Wang, Y. School of Design, Shanghai Jiao Tong University, Shanghai 200240, China Spatial Accessibility of Park Green Space in Huangpu District of Shanghai Based on Modified Two-Step Floating Catchment Area Method. Prog. Geogr. 2021, 40, 774–783. [Google Scholar] [CrossRef]
  40. Zhu, C.; Zheng, S.; Yang, S.; Dong, J.; Ma, M.; Zhang, S.; Liu, S.; Liu, X.; Yao, Y.; Han, B. Towards a Green Equal City: Measuring and Matching the Supply-Demand of Green Exposure in Urban Center. J. Environ. Manag. 2024, 365, 121510. [Google Scholar] [CrossRef]
  41. Wuhan Government. Wuhan New-Type Urbanisation Plan (2014–2020) Announced. Available online: https://zrzyhgh.wuhan.gov.cn/zwgk_18/fdzdgk/ghjh/zzqgh/202001/t20200107_602779.shtml (accessed on 20 July 2024).
  42. Baidu Baidu Map Api Sdk. Available online: https://lbsyun.baidu.com/ (accessed on 20 July 2024).
  43. Haklay, M.; Weber, P. OpenStreetMap: User-Generated Street Maps. IEEE Pervasive Comput. 2008, 7, 12–18. [Google Scholar] [CrossRef]
  44. Debnath, R.; Amin, A.N. A Geographic Information System-Based Logical Urban Growth Model for Predicting Spatial Growth of an Urban Area. Environ. Plan. B Plan. Des. 2016, 43, 580–597. [Google Scholar] [CrossRef]
  45. Langton, S.H.; Solymosi, R. Cartograms, Hexograms and Regular Grids: Minimising Misrepresentation in Spatial Data Visualisations. Environ. Plan. B Urban Anal. City Sci. 2021, 48, 348–357. [Google Scholar] [CrossRef]
  46. Wang, J.; Kwan, M.-P. Hexagon-Based Adaptive Crystal Growth Voronoi Diagrams Based on Weighted Planes for Service Area Delimitation. ISPRS Int. J. Geo-Inf. 2018, 7, 257. [Google Scholar] [CrossRef]
  47. Chen, L.-C.; Zhu, Y.; Papandreou, G.; Schroff, F.; Adam, H. Encoder-Decoder with Atrous Separable Convolution for Semantic Image Segmentation. In Computer Vision—ECCV 2018; Ferrari, V., Hebert, M., Sminchisescu, C., Weiss, Y., Eds.; Lecture Notes in Computer Science; Springer International Publishing: Cham, Switzerland, 2018; Volume 11211, pp. 833–851. ISBN 978-3-030-01233-5. [Google Scholar]
  48. Zhou, B.; Zhao, H.; Puig, X.; Fidler, S.; Barriuso, A.; Torralba, A. Scene Parsing through ADE20K Dataset. In Proceedings of the 2017 IEEE Conference on Computer Vision and Pattern Recognition (CVPR), Honolulu, HI, USA, 21–26 July 2017; pp. 5122–5130. [Google Scholar]
  49. Zhou, B.; Zhao, H.; Puig, X.; Xiao, T.; Fidler, S.; Barriuso, A.; Torralba, A. Semantic Understanding of Scenes Through the ADE20K Dataset. Int. J. Comput. Vis. 2019, 127, 302–321. [Google Scholar] [CrossRef]
  50. Wang, R.; Feng, Z.; Pearce, J.; Zhou, S.; Zhang, L.; Liu, Y. Dynamic Greenspace Exposure and Residents’ Mental Health in Guangzhou, China: From over-Head to Eye-Level Perspective, from Quantity to Quality. Landsc. Urban Plan. 2021, 215, 104230. [Google Scholar] [CrossRef]
  51. Zhang, J.; Liu, Y.; Zhou, S.; Cheng, Y.; Zhao, B. Do Various Dimensions of Exposure Metrics Affect Biopsychosocial Pathways Linking Green Spaces to Mental Health? A Cross-Sectional Study in Nanjing, China. Landsc. Urban Plan. 2022, 226, 104494. [Google Scholar] [CrossRef]
  52. Cui, Q.; Huang, Y.; Yang, G.; Chen, Y. Measuring Green Exposure Levels in Communities of Different Economic Levels at Different Completion Periods: Through the Lens of Social Equity. Int. J. Environ. Res. Public Health 2022, 19, 9611. [Google Scholar] [CrossRef]
  53. Orihara Research on green landscape evaluation--Considerations on green evaluation methods for creating good landscapes. IBEC 2006, 27, 32–35.
  54. Gini, C. On the Measure of Concentration with Special Reference to Income and Statistics, Colorado College Publication. Gen. Ser. 1936, 208, 73–79. [Google Scholar]
  55. Lorenz, M.O. Methods of Measuring the Concentration of Wealth. Publ. Am. Stat. Assoc. 1905, 9, 209–219. [Google Scholar] [CrossRef]
  56. Miller, M.M.; Gibson, L.J.; Wright, N.G. Location Quotient: A Basic Tool for Economic Development Analysis. Econ. Dev. Rev. 1991, 9, 65–68. [Google Scholar]
  57. Gardening and Forestry Bureau of Wuhan City Wuhan City Greening Work Plan in 2022. Available online: https://www.wuhan.gov.cn/zwgk/xxgk/zfwj/bgtwj/202203/t20220331_1948390.shtml (accessed on 15 September 2024).
  58. Chen, J.; Zhou, C.; Li, F. Quantifying the Green View Indicator for Assessing Urban Greening Quality: An Analysis Based on Internet-Crawling Street View Data. Ecol. Indic. 2020, 113, 106192. [Google Scholar] [CrossRef]
  59. Zhang, J. Inequalities in the Quality and Proximity of Green Space Exposure Are More Pronounced than in Quantity Aspect: Evidence from a Rapidly Urbanizing Chinese City. Urban For. Urban Green. 2023, 79, 127811. [Google Scholar] [CrossRef]
  60. Zhu, J.; Qiu, L.; Su, Y.; Guo, Q.; Hu, T.; Bao, H.; Luo, J.; Wu, S.; Xu, Q.; Wang, Z.; et al. Disentangling the Effects of the Surrounding Environment on Street-Side Greenery: Evidence from Hangzhou. Ecol. Indic. 2022, 143, 109153. [Google Scholar] [CrossRef]
  61. Wuhan Jiang’an District People’s Government Jiangan District Garden Development “14th Five-Year Plan”. Available online: https://www.jiangan.gov.cn/ (accessed on 15 September 2024).
  62. Tan, C.; Tang, Y.; Wu, X. Evaluation of the Equity of Urban Park Green Space Based on Population Data Spatialization: A Case Study of a Central Area of Wuhan, China. Sensors 2019, 19, 2929. [Google Scholar] [CrossRef]
  63. Li, X.; Ma, X.; Hu, Z.; Li, S. Investigation of Urban Green Space Equity at the City Level and Relevant Strategies for Improving the Provisioning in China. Land Use Policy 2021, 101, 105144. [Google Scholar] [CrossRef]
  64. Cao, Y.; Li, Y.; Shen, S.; Wang, W.; Peng, X.; Chen, J.; Liao, J.; Lv, X.; Liu, Y.; Ma, L.; et al. Mapping Urban Green Equity and Analysing Its Impacted Mechanisms: A Novel Approach. Sustain. Cities Soc. 2024, 101, 105071. [Google Scholar] [CrossRef]
  65. Li, X.; Huang, Y.; Ma, X. Evaluation of the Accessible Urban Public Green Space at the Community-Scale with the Consideration of Temporal Accessibility and Quality. Ecol. Indic. 2021, 131, 108231. [Google Scholar] [CrossRef]
  66. Chen, Y.; Xu, Z.; Byrne, J.; Xu, T.; Wang, S.; Wu, J. Can Smaller Parks Limit Green Gentrification? Insights from Hangzhou, China. Urban For. Urban Green. 2021, 59, 127009. [Google Scholar] [CrossRef]
  67. Li, Y.; Qiu, J.; Gao, Z. Understanding the Spatially Heterogeneous Relationships between Urban Green Amenities and Residential Dynamics: Evidence from Wuhan, China. Appl. Geogr. 2024, 171, 103396. [Google Scholar] [CrossRef]
  68. McDermott, M.; Mahanty, S.; Schreckenberg, K. Examining Equity: A Multidimensional Framework for Assessing Equity in Payments for Ecosystem Services. Environ. Sci. Policy 2013, 33, 416–427. [Google Scholar] [CrossRef]
  69. Zhang, M.; He, J.; Liu, D.; Huang, J.; Yue, Q.; Li, Y. Urban Green Corridor Construction Considering Daily Life Circles: A Case Study of Wuhan City, China. Ecol. Eng. 2022, 184, 106786. [Google Scholar] [CrossRef]
  70. UN THE 17 GOALS|Sustainable Development. Available online: https://sdgs.un.org/goals (accessed on 15 August 2024).
  71. Hou, Y.; Quintana, M.; Khomiakov, M.; Yap, W.; Ouyang, J.; Ito, K.; Wang, Z.; Zhao, T.; Biljecki, F. Global Streetscapes—A Comprehensive Dataset of 10 Million Street-Level Images across 688 Cities for Urban Science and Analytics. ISPRS J. Photogramm. Remote Sens. 2024, 215, 216–238. [Google Scholar] [CrossRef]
  72. Balawejder, M.; Warchoł, A.; Konttinen, K. Energy Efficiency in Agricultural Production—Experience from Land Consolidation in Poland and Finland. Energies 2023, 16, 7598. [Google Scholar] [CrossRef]
Figure 1. Framework for assessing changes in green visibility and equity.
Applsci 15 00742 g001
Figure 2. Location of the study area (a,b), distribution of residential communities (c,d), and street view sampling points (eg).
Applsci 15 00742 g002
Figure 3. Hexagonal grids with 250 m edge lengths (a) and aggregated residential points (b) for Wuhan’s central urban area in 2014.
Applsci 15 00742 g003
Figure 4. Example of the semantic segmentation result.
Applsci 15 00742 g004
Figure 5. Spatial distribution of residential population from 2014 to 2021.
Applsci 15 00742 g005
Figure 6. Spatial distribution of green visibility from 2014 to 2021.
Applsci 15 00742 g006
Figure 7. Gini coefficient and the Lorenz curve of Wuhan’s central urban area from 2014 to 2021.
Applsci 15 00742 g007
Figure 8. Gini coefficients of various districts from 2014 to 2021.
Applsci 15 00742 g008
Figure 9. Spatial distribution of location quotient from 2014 to 2021.
Applsci 15 00742 g009
Figure 10. Spatial distribution (a) and change values (b) of location quotient change rates for constant residential units from 2014 to 2021.
Applsci 15 00742 g010
Table 1. Statistics of area proportion with different levels of GVI.
GVILevel of Green VisibilityPercentage of Area (%)
201420172021
≤5Low1.260.200
5~15Below average57.3628.7520.78
15~25Average34.2060.6667.65
25~35Above average6.229.8510.87
≥35High0.960.540.70
Table 2. Statistics of area and population proportion with different levels of location quotient.
LQPercentage of Area (%)Percentage of Population (%)
201420172021201420172021
≤0.21.780.870.325.292.551.11
0.2~0.516.3613.7414.2034.2731.4532.88
0.5~1.026.7228.8228.6734.9839.0339.07
1.0~1.513.9116.2215.8011.5913.8113.40
1.5~2.08.228.119.215.054.865.54
2.0~5.017.6917.7617.856.916.726.50
≥5.015.3214.4813.951.911.581.50
Disclaimer/Publisher’s Note: The statements, opinions and data contained in all publications are solely those of the individual author(s) and contributor(s) and not of MDPI and/or the editor(s). MDPI and/or the editor(s) disclaim responsibility for any injury to people or property resulting from any ideas, methods, instructions or products referred to in the content.

