Article

Concurrent Validity of the Optojump Infrared Photocell System in Lower Limb Peak Power Assessment: Comparative Analysis with the Wingate Anaerobic Test and Sprint Performance

1
Research Laboratory (LR23JS01) “Sport Performance, Health & Society”, Higher Institute of Sport and Physical Education of Ksar-Saïd, University of Manouba, Tunis 2037, Tunisia
2
Faculty of Sports Sciences, Atatürk University, Erzurum 25100, Türkiye
3
Regional Youth and Sports Commissariat, Sousse—Ministry of Youth and Sports, Sousse 4000, Tunisia
4
Coaching Sciences, Faculty of Sports Sciences, Mugla Sitki Kocman University, Mugla 48000, Türkiye
5
Faculty of Sports Sciences, Gümüşhane University, Gumushane 29100, Türkiye
6
Faculty of Law and Social Sciences, University “1 Decembrie 1918” of Alba Iulia, 510009 Alba Iulia, Romania
*
Authors to whom correspondence should be addressed.
Appl. Sci. 2025, 15(19), 10741; https://doi.org/10.3390/app151910741
Submission received: 26 August 2025 / Revised: 29 September 2025 / Accepted: 3 October 2025 / Published: 6 October 2025
(This article belongs to the Special Issue Advances in Sports Science and Biomechanics)

Abstract

Aim: This study analyzed the concurrent validity of the Optojump infrared photocell system for estimating lower limb peak power by comparing it with the 15 s Wingate anaerobic test (WAnT) and examining relationships with sprint performance indicators. Methods: Twelve physically active university students (ten males, two females; age: 23.39 ± 1.47 years; body mass: 73.08 ± 9.19 kg; height: 173.67 ± 6.97 cm; BMI: 24.17 ± 1.48 kg·m−2) completed a cross-sectional validation protocol. Participants performed WAnT on a calibrated Monark ergometer (7.5% body weight for males, 5.5% for females), 30 s continuous jump tests using the Optojump system (Microgate, Italy), and 30 m sprint assessments with 10 m and 20 m split times. Peak power was expressed in absolute (W), relative (W·kg−1), and allometric (W·kg−0.67) terms. Results: Thirty-second continuous jump testing produced systematically higher peak power values across all metrics (p < 0.001). Mean differences indicated large effect sizes: relative power (Cohen’s d = 0.99; 18.263 ± 4.243 vs. 10.99 ± 1.58 W·kg−1), absolute power (d = 0.86; 1381.71 ± 393.44 vs. 807.28 ± 175.45 W), and allometric power (d = 0.79). Strong correlations emerged between protocols, with absolute power showing the strongest association (r = 0.842, p < 0.001). Linear regression analysis revealed that 30 s continuous jump-derived measurements explained 71% of the variance in Wingate outcomes (R2 = 0.710, p < 0.001). Sprint performance showed equivalent predictive capacity for both tests (Wingate: R2 = 0.66; 30 s continuous jump: R2 = 0.67). Conclusions: The Optojump infrared photocell system provides a valid and practical alternative to laboratory-based ergometry for assessing lower limb anaerobic power. While it systematically overestimates absolute values compared with the Wingate anaerobic test, its strong concurrent validity (r > 0.80), large effect sizes, and equivalent predictive ability for sprint performance (R2 = 0.66–0.71) confirm its reliability as a field-based assessment tool. These findings underscore the importance of sport-specific, weight-bearing assessment technologies in modern sports biomechanics, providing coaches, practitioners, and clinicians with a feasible method for monitoring performance, talent identification, and training optimization. The results further suggest that Optojump-based protocols can bridge the gap between laboratory precision and ecological validity, supporting both athletic performance enhancement and injury prevention strategies.

1. Introduction

Anaerobic performance assessment represents a fundamental component of athletic evaluation, serving as a key element for determining an athlete’s physiological profile, designing accurate training programs, and controlling training loads effectively. The relationship between muscle strength, anaerobic performance, and sport-specific movements has been extensively documented across various athletic populations [1], establishing these assessments as essential tools for performance monitoring, talent identification, and training optimization. The capacity for explosive force production during high-intensity, short-duration activities directly influences competitive success in numerous sports, making valid and reliable anaerobic assessment protocols indispensable for contemporary sport science practice [2,3].
The landscape of anaerobic power assessment encompasses diverse methodological approaches that can be broadly categorized into laboratory-based and field-based protocols, each offering distinct advantages and limitations. Laboratory assessments include sophisticated isokinetic testing systems that evaluate the peak power output of specific muscle groups, such as the quadriceps, providing detailed biomechanical insights into force production capabilities. The Wingate anaerobic test, developed in the 1970s, has gained recognition as the gold standard for assessing anaerobic power due to its proven reliability and validity across diverse populations [4,5]. This protocol involves pedaling at maximum speed for 30 s on a cycle ergometer against a braking force equivalent to the subject’s weight, with resistance adjusted according to the experimental protocol. Additional laboratory assessments include the Margaria staircase test, the force–velocity test designed by Vandewalle et al. [6], and vertical jump tests performed on force platforms.
Field-based alternatives have emerged to address the practical limitations of laboratory protocols while maintaining the validity of assessments. These tests depend on the same bioenergetic limiting factors as laboratory assessments but offer enhanced ecological validity and practical implementation advantages [7]. Examples include the 5-jump test, the 30 m sprint test proposed by Cometti et al. [8] for assessing lower limb muscular power, and the 30 s continuous jumping test. The Bosco test requires participants to jump as high as possible for 60 consecutive seconds while maintaining knee flexion at 90° and hands positioned on their hips throughout the effort [9]. Of these laboratory and field tests, the Wingate and Bosco protocols are considered gold standards by sport scientists and coaches due to their established validity and widespread acceptance [10].
Recognizing the demanding nature of traditional protocols, shortened versions have been developed to optimize assessment efficiency while maintaining measurement validity. Research examining variations in Wingate test protocols has confirmed that abbreviated versions, ranging from 10 to 15 s, can effectively assess peak power output. In contrast, Bosco test modifications, spanning 10 to 30 s, reduce the contribution of oxidative metabolism to ATP resynthesis [4,11]. These protocol adaptations address the challenge that longer test durations may compromise the specificity of anaerobic assessment by incorporating contributions from the aerobic energy system.
The technological evolution of measurement systems has revolutionized anaerobic assessment capabilities, particularly through the development of optical measurement devices. The Optojump system (Microgate, SRL, Italy) has demonstrated excellent concurrent validity (ICC = 0.997–0.998) and test–retest reliability (ICC = 0.982–0.989) for vertical jump height estimation [12]. This optical system enables measurement of multiple parameters, including ground contact time, flight time, speed, acceleration, and stride characteristics during jumping and running protocols. The system offers significant advantages by accommodating protocols that closely replicate sporting movements, allowing assessment on sport-specific surfaces using competition footwear [13]. The practical benefits of optical measurement systems extend beyond technical reliability to encompass enhanced ecological validity and implementation flexibility. Research examining the interchangeability of cycling and vertical jump tests has revealed that, despite strong cross-sectional correlations, these assessment modalities measure distinct aspects of anaerobic power with essential implications for sport-specific applications [1]. Contemporary metabolic profiling studies have revealed that continuous jumping protocols primarily engage the phosphocreatine system (45.6% of total energy contribution). In comparison, cycling assessments rely more heavily on glycolytic pathways (49.5% of total energy contribution) [14]. These metabolic distinctions highlight the importance of understanding system-specific characteristics when selecting assessment protocols.
Recent investigations in elite sprinters have demonstrated significant correlations between vertical jump metrics and sprint acceleration performance, particularly during the initial acceleration phases, where explosive power production is critical [15]. Research examining relationships between vertical jump performance and sprint times across various distances has revealed associations that vary based on sprint phase and population characteristics [16]. These performance relationships provide valuable convergent validity evidence while highlighting the sport-specific relevance of vertical power assessment protocols.
Despite the promising characteristics of optical measurement technologies and their growing implementation in applied settings, comprehensive validation research comparing these systems to established criterion standards remains limited. Comparative studies examining Bosco and Wingate protocols have revealed systematic differences in power output measurements, with jumping tests consistently producing higher values than cycling assessments [10]. However, the extent to which these differences reflect methodological artifacts versus genuine physiological distinctions requires systematic investigation. Previous research has identified potential measurement errors when estimating vertical jump parameters using photocell devices, emphasizing the importance of validation studies that account for system-specific characteristics [13].
Given that research has shown cycling sprint and vertical jump tests are not interchangeable for making qualitative assessments of anaerobic power development over time [1], it becomes essential to validate each testing modality within its specific context. This distinction highlights the importance of evaluating whether optical systems, such as Optojump, can reliably capture sport-relevant anaerobic performance characteristics that differ from those obtained through traditional laboratory-based protocols. These insights are critical for practitioners seeking to implement ecologically valid, context-specific assessment strategies that align with the movement patterns and energy system demands of their respective sports. Therefore, this study aimed to analyze the validity of the Optojump system as a tool for assessing lower limb peak power by comparing it with the established Wingate anaerobic test criterion standard and examining the relationships with sprint performance indicators.

2. Methods

2.1. Study Design

This investigation employed a cross-sectional validation study design to examine the concurrent validity of the Optojump infrared photocell system for estimating lower limb peak power. The study utilized a within-subjects design, where all participants completed three distinct testing protocols: the 15 s Wingate anaerobic test (WAnT), the 30 s jump test using the Optojump system, and a 30 m sprint test with intermediate timing splits.

2.2. Participants

Sample Characteristics and Recruitment: Twelve physically active university students (ten males, two females) from the Higher Institute of Physical Education of Ksar-Saïd volunteered for this investigation. Participants were recruited through convenience sampling from the same academic cohort to ensure homogeneity in training background and fitness level. They were involved in soccer, volleyball, and basketball.
Participants were required to be (1) aged 18–30 years, (2) physically active with regular participation in sports activities (minimum three sessions per week), (3) free from musculoskeletal injuries in the six months preceding testing, (4) not taking any medications that could affect physical performance, and (5) able to provide written informed consent. Individuals were excluded if they presented (1) current or recent musculoskeletal injuries, (2) cardiovascular or metabolic disorders, (3) inability to perform maximal efforts due to pain or discomfort, or (4) pregnancy (for female participants).
The study protocol received approval from the Institutional Review Board of the Higher Institute of Sport and Physical Education, Ksar-Saïd, Tunisia. It adhered strictly to the principles outlined in the Declaration of Helsinki. All participants received comprehensive information regarding study procedures, potential risks, and benefits before providing written informed consent. Participants retained the right to withdraw from the study at any time without consequence.

2.3. Experimental Procedures

2.3.1. Pre-Testing Preparation

All testing sessions were conducted in a controlled laboratory environment (temperature: 20–22 °C, humidity: 45–55%) at the same time of day (14:00–17:00) to minimize the effects of circadian rhythm. Participants were instructed to avoid strenuous exercise for 48 h, caffeine for 4 h, and alcohol for 24 h before testing. A standardized light meal was permitted at least 2 h before testing.

2.3.2. Anthropometric Measurements

Comprehensive anthropometric assessments were conducted by a single, trained investigator, following the protocols of the International Society for the Advancement of Kinanthropometry [17]. Height and body mass were measured using calibrated stadiometry (Seca 213, Hamburg, Germany) and digital weighing scales (Seca 877, Hamburg, Germany) to the nearest 0.1 cm and 0.1 kg, respectively. Body composition was estimated using the four-site skinfold equation of Durnin and Womersley [18], with measurements taken at triceps, biceps, subscapular, and suprailiac sites using Harpenden calipers (Harpenden Instruments, Cambridge, UK). All measurements were performed in duplicate, with a third measurement taken if the difference exceeded 5%.

2.3.3. Physical Performance Testing

Wingate Anaerobic Test Protocol: The 15 s WAnT was performed on a calibrated Monark ergometer (Monark Exercise AB, Vansbro, Sweden) to assess lower limb anaerobic power. Following a standardized warm-up protocol consisting of 5 min of low-intensity pedaling (50 W at 40 rpm) and 5 min of passive recovery, participants performed the test against a braking force equivalent to 7.5% of their body weight for males and 5.5% for females. These gender-specific loads were selected based on established protocols optimizing peak power output [19]. Strong verbal encouragement was provided throughout the test to ensure maximal effort.
Jump Test Protocol: The 30 s Bosco test was conducted using the Optojump photocell system (Microgate SRL, Bolzano, Italy), which has demonstrated excellent reliability (CV = 2.2%) in previous validation studies [20]. The system consists of two parallel bars placed on the floor, one functioning as an emitter and the other as a receiver, spaced 1 m apart. The bars contain arrays of infrared LEDs and sensors that detect interruptions in the light beam caused by foot contact. The Optojump system operates at a sampling frequency of 1000 Hz, achieving a measurement accuracy of 0.001 s, which enables the precise detection of flight time and contact time. Participants performed continuous vertical jumps, maintaining knee flexion at 90° and hands positioned on their hips throughout the test duration. Emphasis was placed on minimizing ground contact time while maximizing jump height. Peak power was calculated using the validated formula incorporating flight time, contact time, and number of jumps:
PP = g2·(Σft)(Σft + Σct)/(4·Njumps·Σct)
where g represents gravitational acceleration, ft denotes flight time, ct represents contact time, and Njumps indicates total jump number [12].
This methodological setup is consistent with prior Optojump validation studies [20,21], which also employed bilateral jump protocols under controlled arm conditions and used similar sampling parameters. However, the current study extends the application of the Optojump system by validating its peak power output estimates, specifically from the Bosco repeated jump test, against anaerobic power values from the Wingate test.
Sprint Performance Assessment: Linear sprint performance was evaluated over 30 m on artificial turf using infrared photocells (Microgate Racetime 2, Bolzano, Italy), positioned 0.75 m above ground level [22]. Intermediate times were recorded at 10 m and 20 m intervals. Participants initiated sprints from a standardized starting position 20 cm behind the initial timing gate to ensure full acceleration through the first measurement point. Three trials were performed with 5 min inter-trial recovery periods, and the fastest performance was used for subsequent analysis.
Test Sequence and Recovery: All participants completed testing over two sessions separated by 48–72 h to prevent fatigue interference. Session 1 included anthropometric measurements and familiarization trials, while Session 2 comprised the formal testing battery (Figure 1). The order of physical tests was randomized to minimize potential ordering effects, with 15 min passive recovery periods between each assessment. The test order was randomized individually for each participant using a simple randomization method.

2.4. Statistical Analysis

Statistical analyses were conducted using SPSS version 26.0 (IBM Corporation, Armonk, NY, USA) with significance set a priori at α = 0.05. Descriptive statistics are presented as mean ± standard deviation with minimum and maximum values. Normality of data distribution was assessed using the Shapiro–Wilk test. Paired samples t-tests examined mean differences between Optojump and Wingate peak power values, with effect sizes calculated using Cohen’s d. Pearson product–moment correlations were used to assess relationships between variables, with correlation strength interpreted according to Hopkins et al. [23]: weak (r < 0.35), moderate (r = 0.36–0.67), strong (r = 0.68–0.90), and very strong (r > 0.90). Linear regression analysis quantified the proportion of variance in Wingate peak power explained by Optojump-derived measurements.

3. Results

3.1. Participant Characteristics

All twelve participants successfully completed the comprehensive testing protocol without adverse events or early termination. The sample demonstrated homogeneous characteristics with standard distribution patterns for all anthropometric variables (Shapiro–Wilk test, p > 0.05), exhibiting healthy body composition profiles within expected ranges for physically active young adults (who typically engage in 150 to 300 min of moderate to vigorous physical activity per week, consistent with World Health Organization guidelines) [24] (Table 1).

3.2. Performance Outcomes and Between-Method Comparisons

Performance assessments revealed systematic differences between testing modalities, with the Optojump-derived Bosco test consistently producing higher peak power values than the Wingate criterion standard across all expression formats. The Bosco test yielded relative peak power values of 18.263 ± 4.243 W·kg−1 compared to 10.99 ± 1.58 W·kg−1 from the Wingate protocol, representing a 66% difference between methods. This pattern was consistent across absolute power measurements, where Bosco testing produced 1381.71 ± 393.44 W, compared to 807.28 ± 175.45 W from Wingate testing, indicating a 71% systematic elevation in Optojump-derived values (Table 2).
Paired samples t-tests confirmed statistically significant differences between measurement systems across all power expression formats, with effect sizes indicating substantial practical significance. The relative peak power comparison demonstrated the largest standardized mean difference (t = 7.334, p < 0.001, Cohen’s d = 0.99), approaching a very large effect size threshold. Absolute peak power differences yielded similarly robust findings (t = 6.732, p < 0.001, Cohen’s d = 0.86), while allometric expressions showed the most pronounced distinction (t = 7.77, p < 0.001, Cohen’s d = 0.79). These consistent findings across expression formats reinforce the systematic nature of between-test differences while supporting the reliability of observed patterns (Table 3).

3.3. Correlation Analysis and Construct Validity

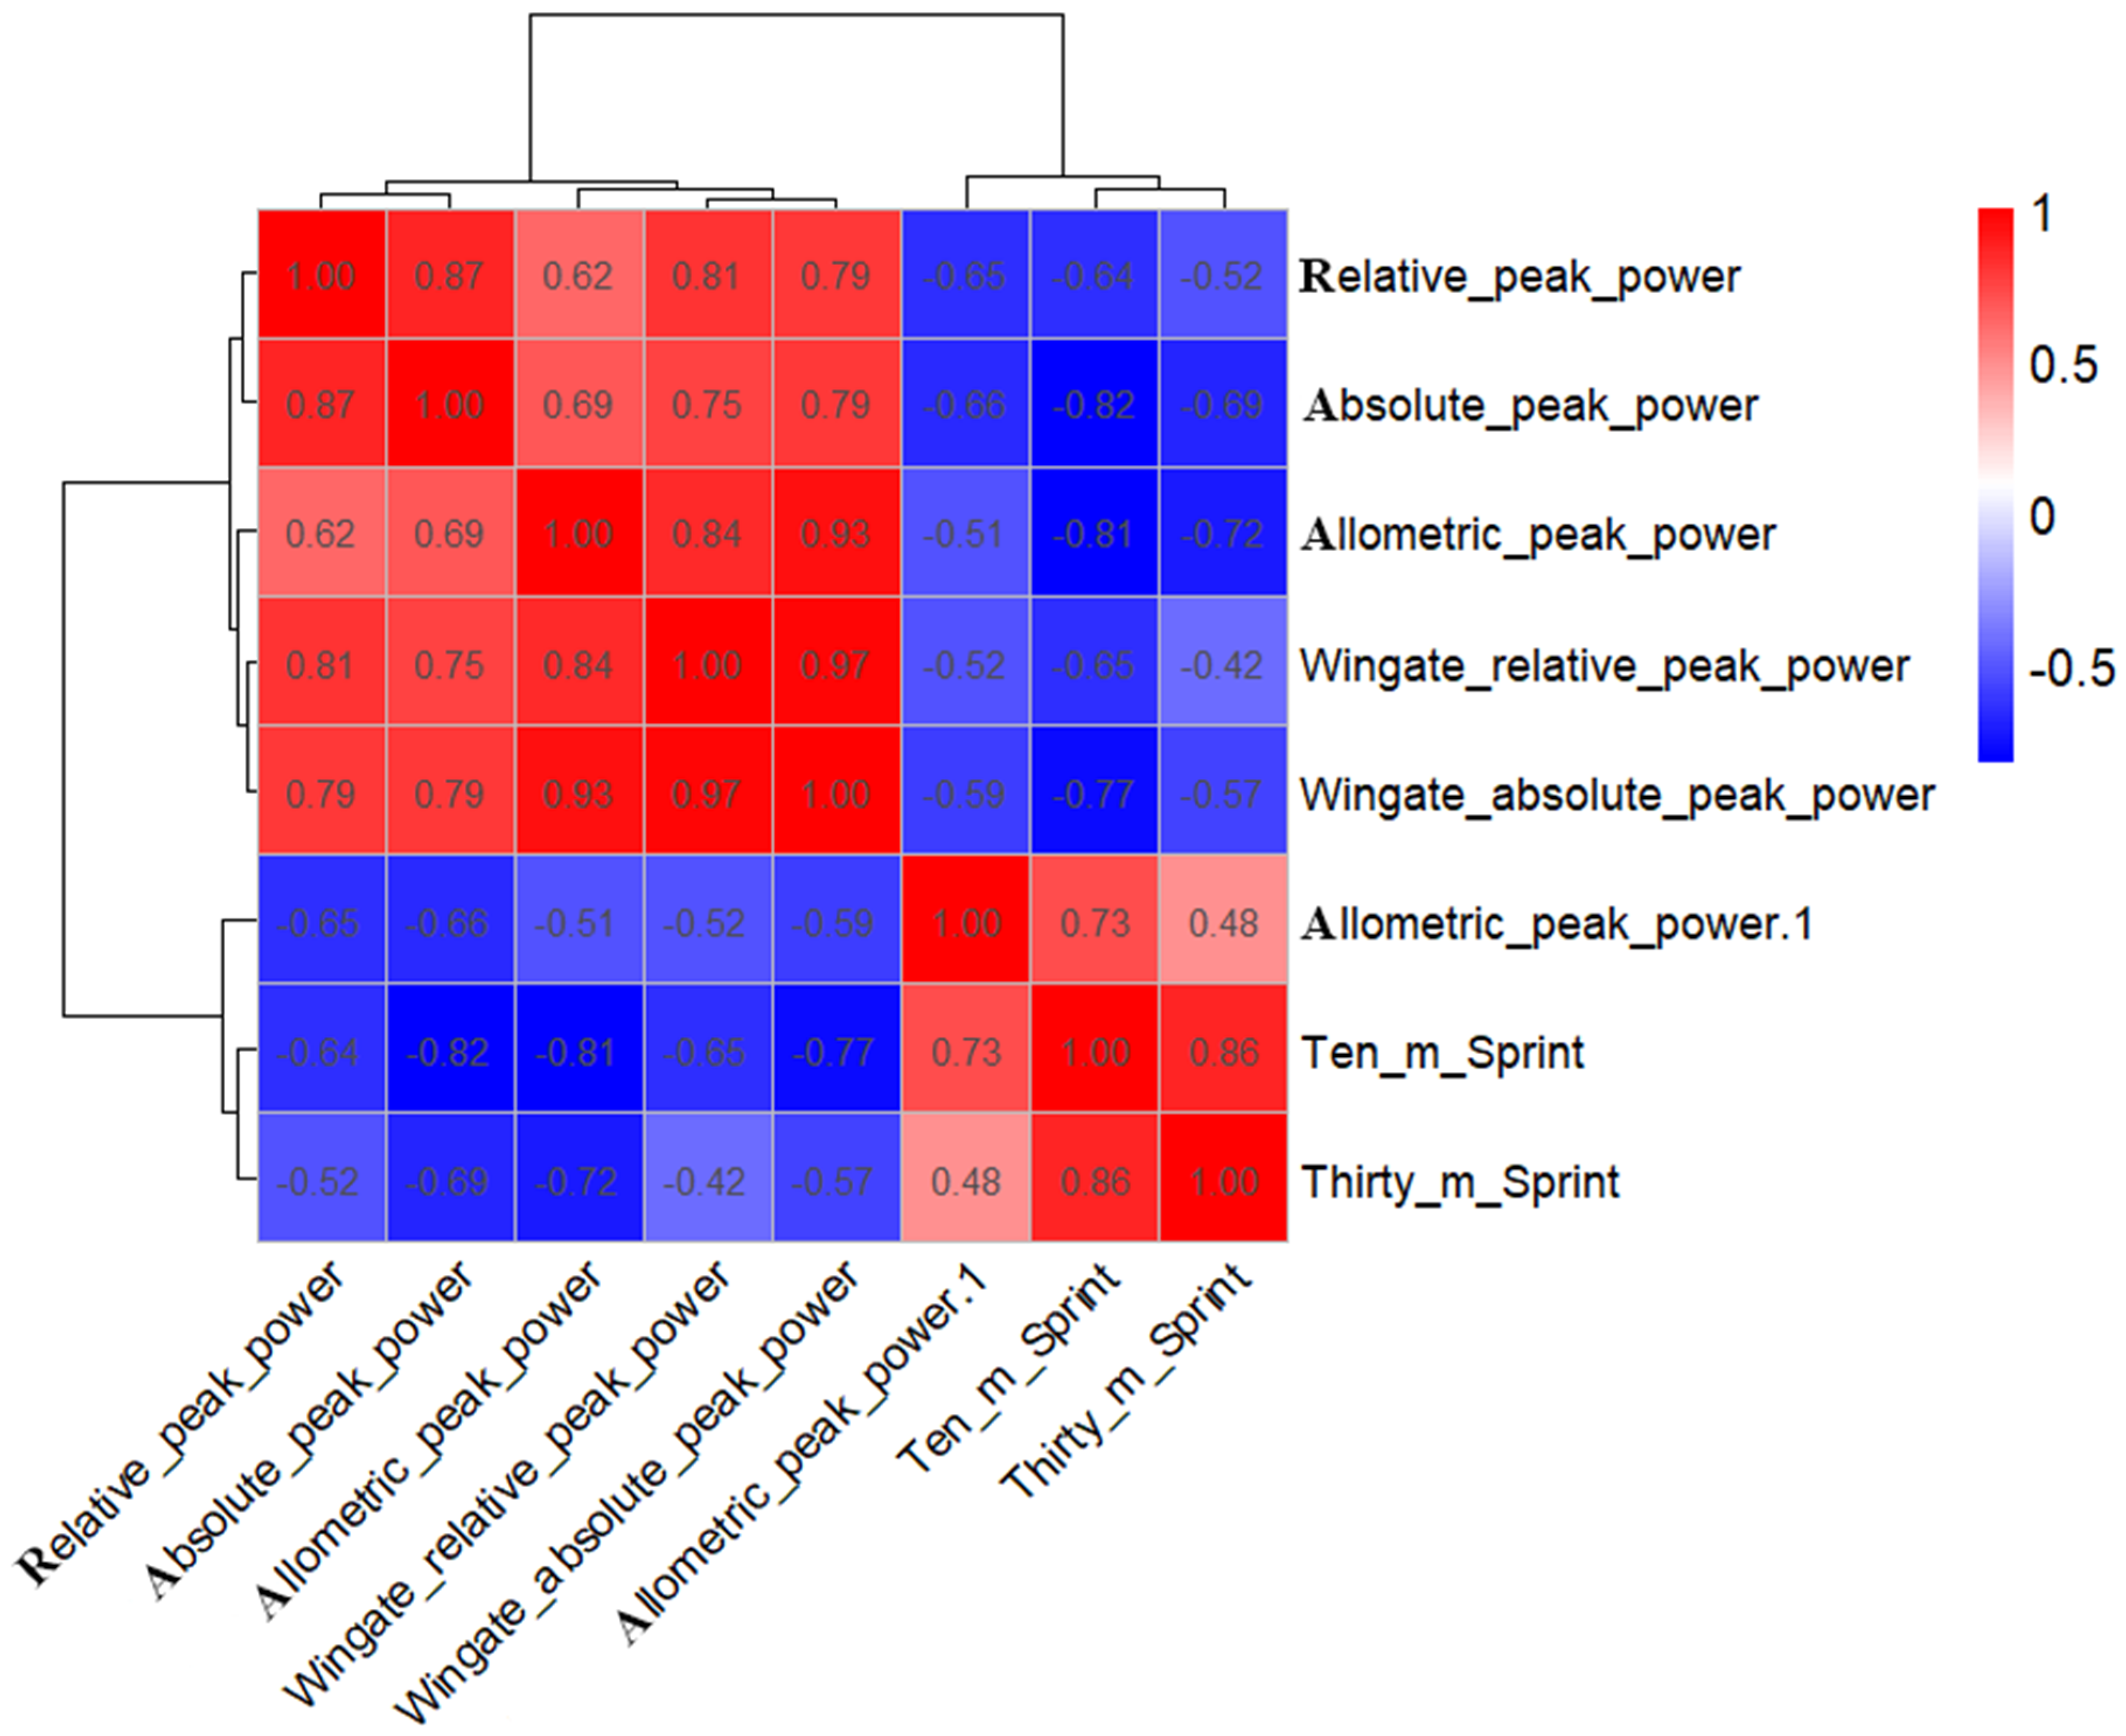
Correlation analysis revealed complex relationships between performance measures, with the strength of these relationships varying according to specific assessments and expression formats. The strongest associations emerged between 30 s continuous jumping and Wingate peak power measurements when expressed in absolute terms (r = 0.842, p < 0.001), indicating substantial shared variance despite systematic mean differences. Relative power expressions demonstrated moderate correlations (r = 0.650, p < 0.05), while allometric scaling yielded intermediate associations (r = 0.754, p < 0.001), suggesting that expression format influences the apparent relationship strength between measurement systems (Figure 2).
Sprint performance demonstrated differential relationships with anaerobic power assessments, revealing important specificity patterns. The 30 m sprint correlated strongly with both 30 s continuous jumping (r = −0.820, p < 0.001) and Wingate (r = −0.810, p < 0.001) relative peak power values, indicating equivalent predictive validity for horizontal locomotion performance. However, 10 m sprint performance correlated significantly only with 30 s continuous jumping-derived measures (r = −0.657, p < 0.05), while showing non-significant associations with Wingate outcomes (r = −0.514, p > 0.05). This pattern suggests that weight-bearing vertical jumping protocols may better capture the neuromuscular demands specific to the initial phases of sprint acceleration.

3.4. Predictive Relationships and Variance Explanation

Linear regression analysis quantified the predictive capacity of the Optojump system relative to criterion measures. The relationship between 30 s continuous jumping-derived and Wingate-derived absolute peak power demonstrated that Optojump measurements explained 71% of the variance in the criterion test (R2 = 0.710, p < 0.001), supporting strong concurrent validity despite systematic mean differences (Figure 3).
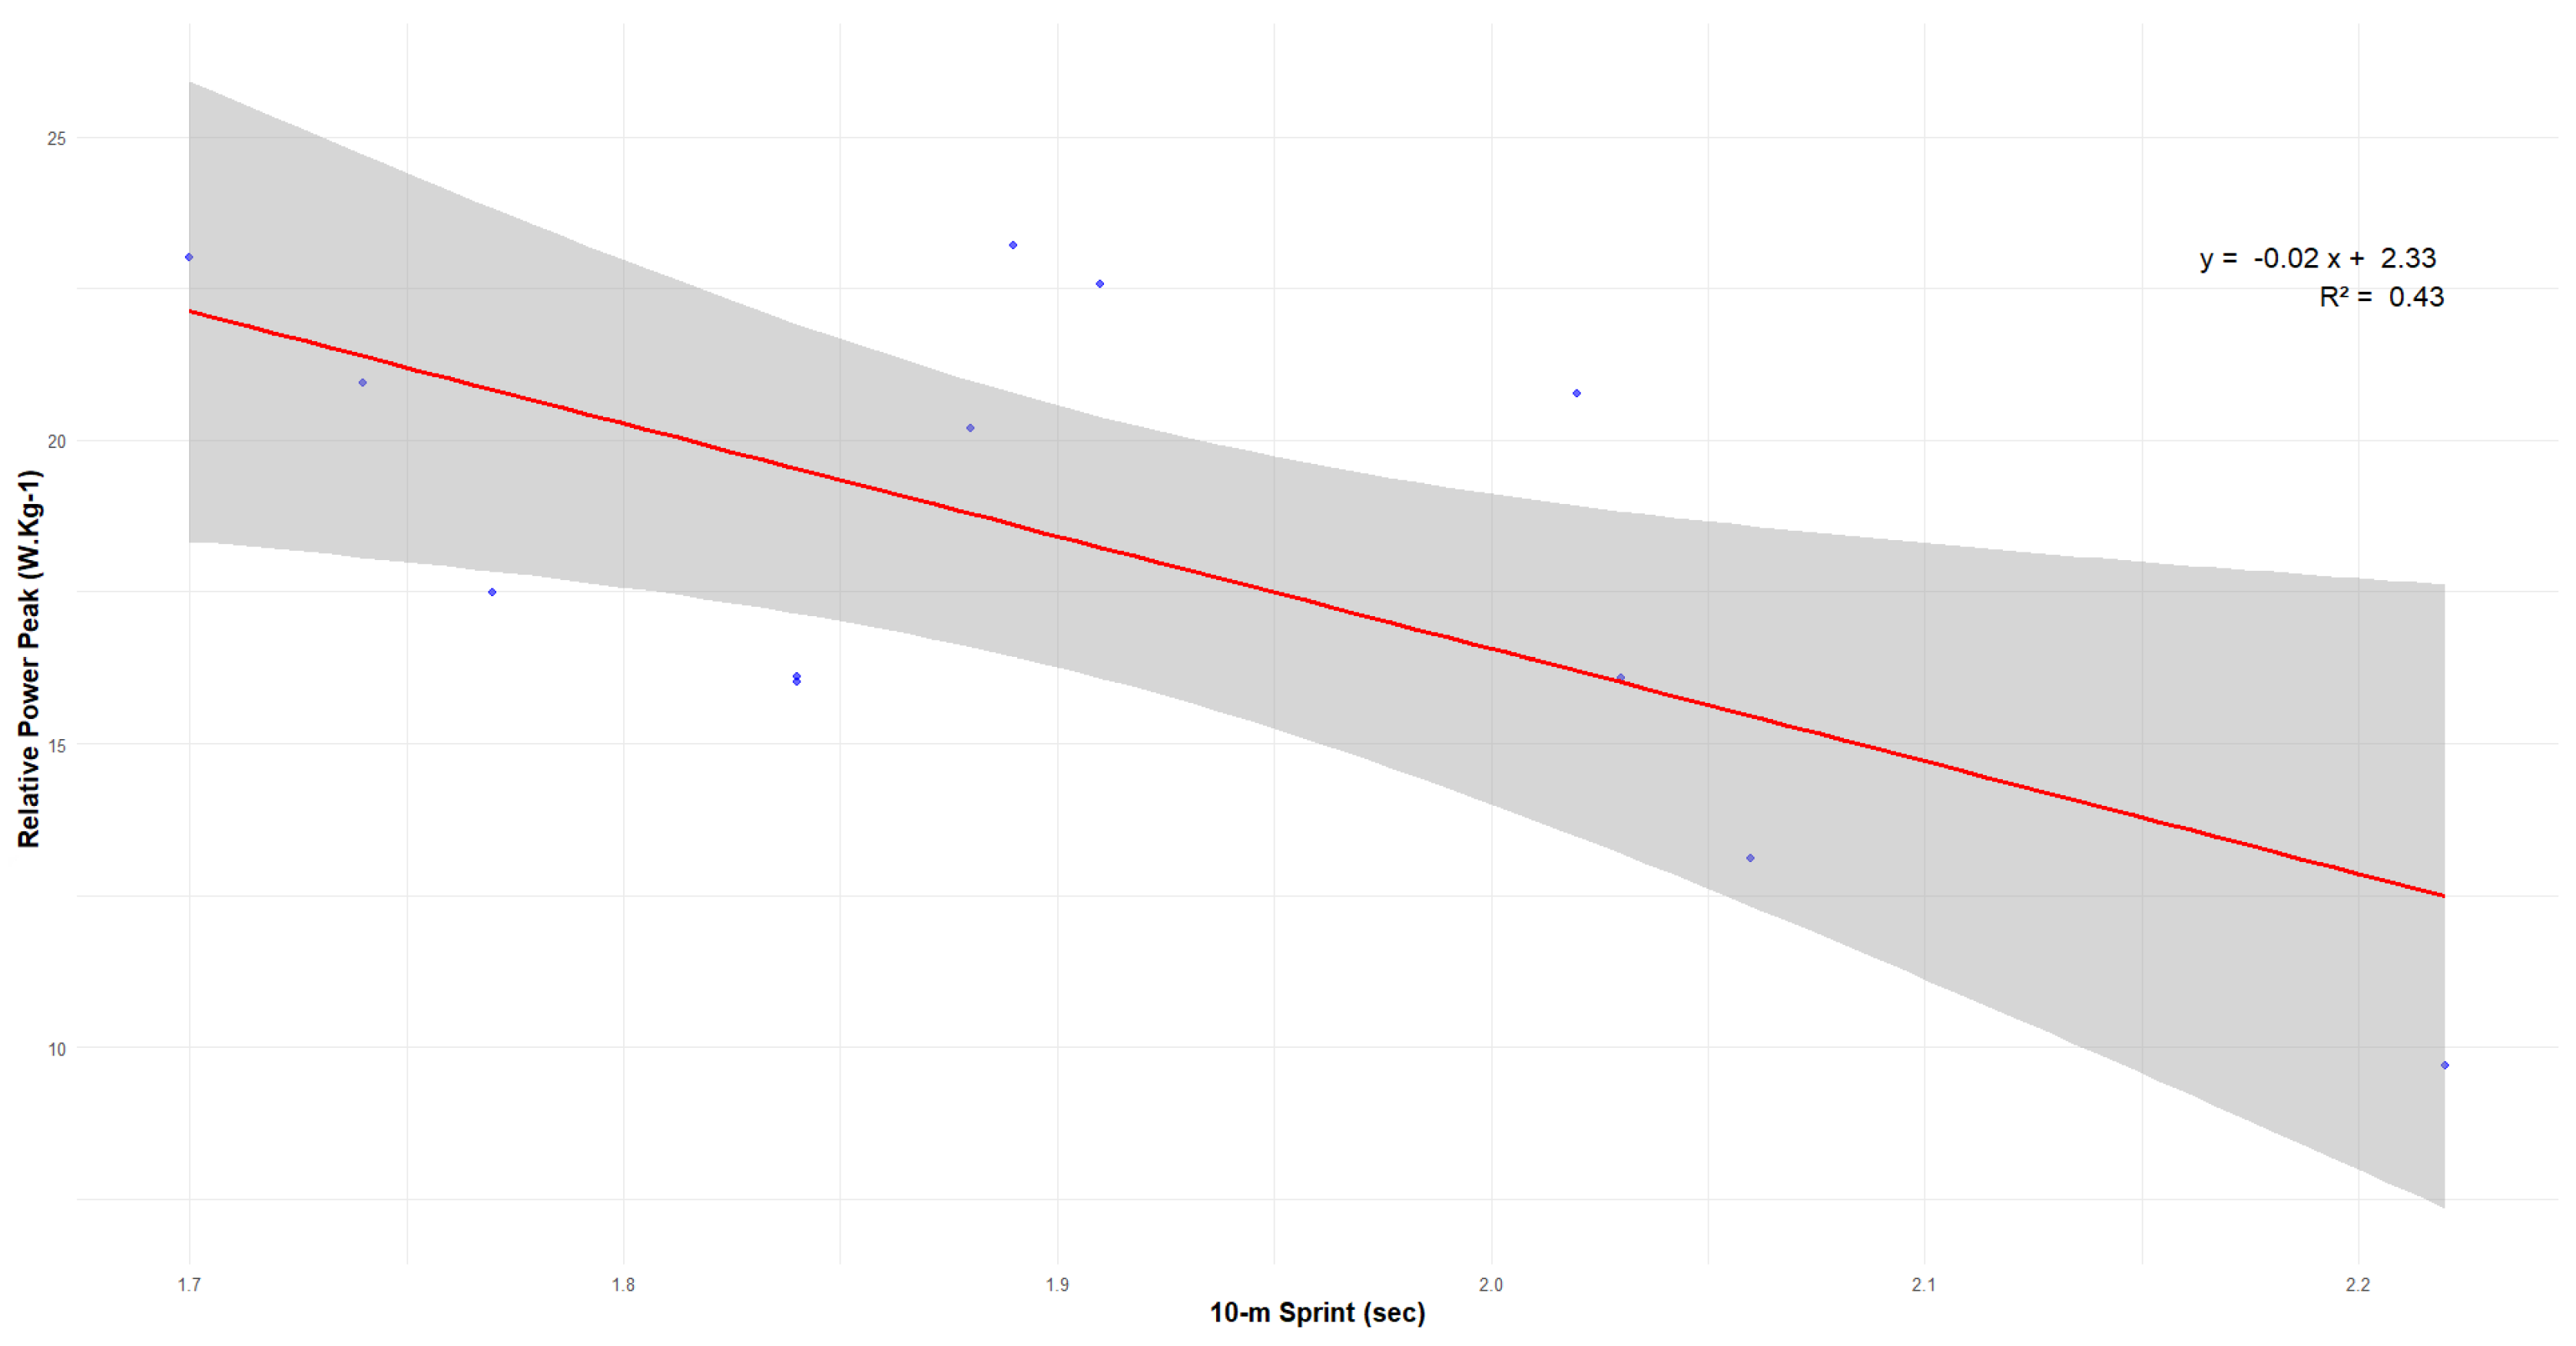
The association between Relative peak power and 10 m sprint performance explained 43% of variance in acceleration capability (R2 = 0.432, p < 0.05), indicating meaningful but incomplete overlap between vertical power expression and horizontal sprint initiation (Figure 3).
Comparative analysis revealed equivalent predictive relationships between sprint performance and both anaerobic power assessment methods. Specifically, the 30 m sprint performance explained 66% of the variance in Wingate peak power and 67% of the variance when expressed allometrically (W·kg−0.67), demonstrating near-identical construct validity for both vertical jumping and cycle ergometry protocols in relation to horizontal locomotion capacity (Figure 4).
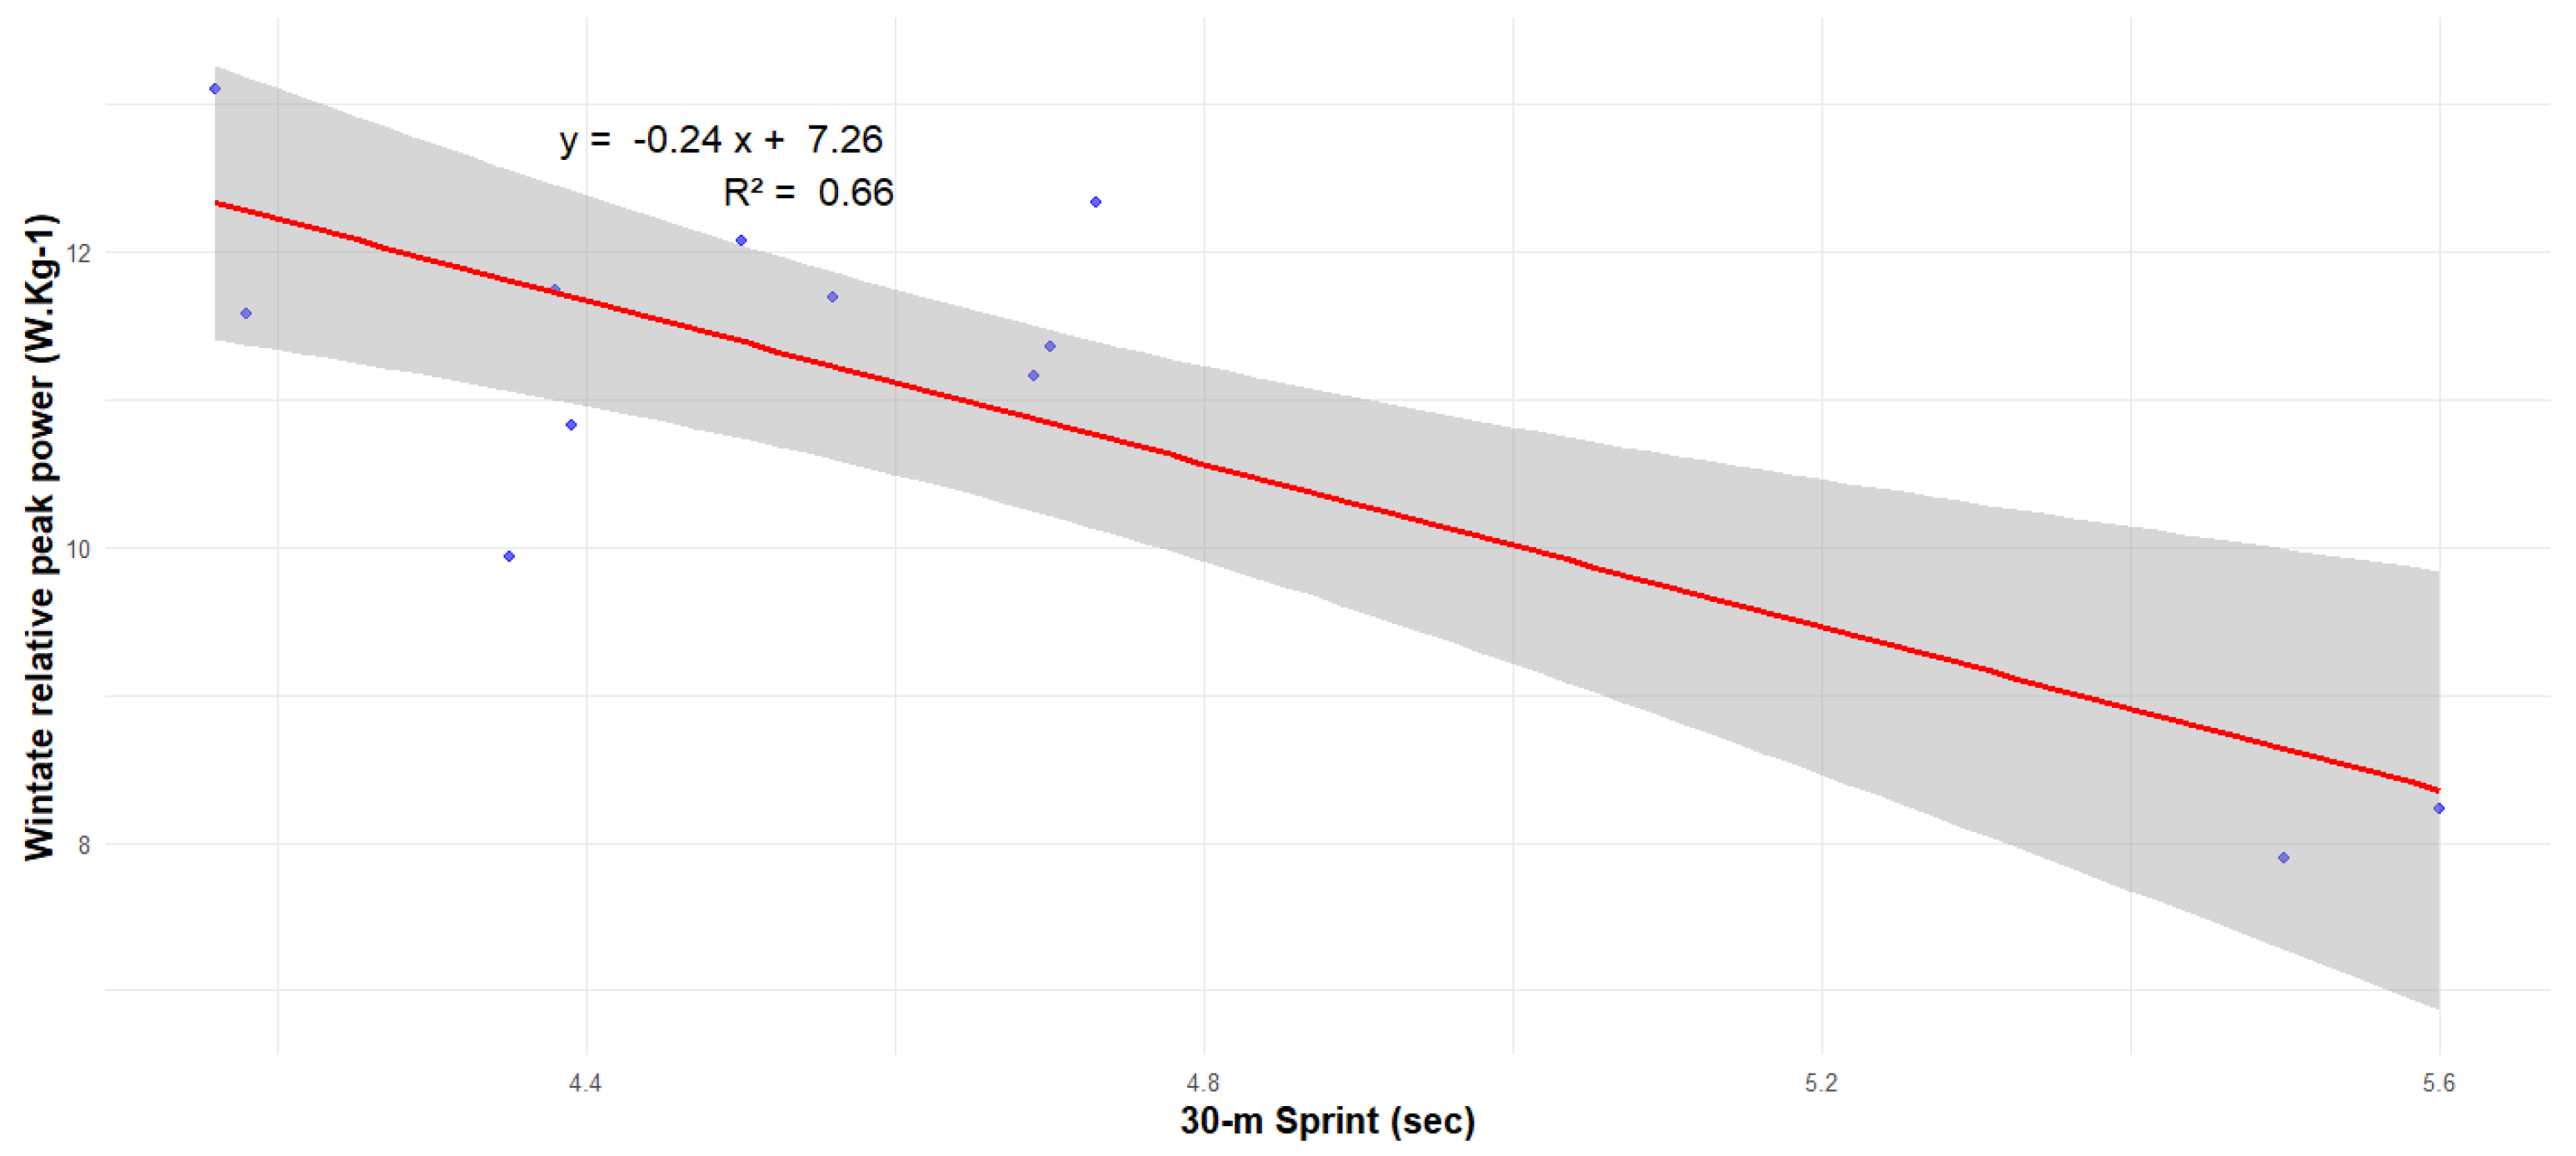
The association between Wingate relative peak power and 30 m sprint performance explained 66% of the variance in sprint ability (R2 = 0.66, p < 0.05), indicating a strong but not complete overlap between maximal anaerobic power output and horizontal sprint performance (Figure 5).

4. Discussion

The present investigation reveals significant statistical differences between Optojump-derived and Wingate-derived peak power measurements across all expression formats, with the 30 s continuous jumping test consistently producing higher values, regardless of whether power is expressed in absolute, relative, or allometric terms. This finding aligns directly with established research patterns. Sands et al. [5] confirmed that estimated peak power values from vertical jumping protocols are systematically higher than those obtained from the 30 s Wingate test [5,10], while Kaufmann et al. [24] reported that peak power from the 30 s continuous jumping test significantly exceeded Wingate values when expressed in relative terms (24.8 ± 4.4 vs. 11.8 ± 0.5 W·kg−1, p < 0.001). Our observed differences of 66% for relative power and 71% for absolute power demonstrate remarkable consistency with these previous investigations.
The theoretical foundation for these systematic differences lies in fundamental distinctions between the neuromuscular demands of weight-bearing versus non-weight-bearing protocols. Sands et al. [5] provided the most compelling explanation, suggesting that the Wingate test primarily measures chemo-mechanical components of muscular contraction. In contrast, vertical jumping protocols assess the muscular capacity to absorb, store, and restore energy through the stretch-shortening cycle [5,10]. The extensive muscle stretching inherent in jumping movements facilitates the utilization of elastic energy, which is absent in cycling protocols, explaining why participants develop superior reactive power during the Bosco test compared to the Wingate assessment. Contemporary metabolic profiling research by Kaufmann et al. [25] revealed that the 30 s continuous jump test primarily engages the phosphocreatine system (45.6% of total energy contribution). In comparison, the Wingate test relies more heavily on glycolytic pathways (49.5% of total energy contribution). These metabolic distinctions, combined with the mechanical advantages of the stretch-shortening cycle, provide a comprehensive explanation for the systematic differences in power output observed in our investigation.
Despite the systematic mean differences, our correlation analysis revealed statistically significant relationships between Bosco and Wingate peak power measurements across all expression formats, with the strongest association emerging when power was expressed in absolute terms (r = 0.842, p < 0.001). This finding confirms previous observations by Sands et al. [5] and Chelly et al. [26] that the method of power expression significantly influences the apparent strength of the relationship between different assessment protocols [5,10]. The simple regression analysis demonstrated that peak power estimated from the Bosco test explained 71% of the variance in Wingate-derived peak power, providing compelling evidence for the concurrent validity of the Optojump system. This substantial shared variance indicates that while the absolute values differ systematically, both assessment methods capture similar underlying physiological constructs related to anaerobic power production [27]. Recent research examining the interchangeability of cycling and vertical jump tests in professional athletes demonstrated extremely large cross-sectional correlations (r = 0.92) between peak power measures [1], supporting our findings while acknowledging that these relationships may vary across different populations and sporting contexts. The observed correlation strength endorses the use of Optojump-derived measurements as valid indicators of anaerobic power capacity, particularly when practitioners understand the systematic measurement characteristics and establish appropriate normative databases. Previous studies have validated the Optojump system for assessing vertical jumps. Glatthorn et al. [21] demonstrated excellent concurrent validity (r = 0.99) and test–retest reliability when compared with force plate measurements, supporting the use of Optojump in field settings. Similarly, Attia et al. [12] confirmed the reliability of Optojump but noted slight overestimations of jump height due to calculations based on flight time. These findings establish a solid foundation for our study, which extends the use of Optojump to power-oriented assessments beyond vertical jump testing. Despite known measurement biases, our results show consistent output and acceptable agreement with standard anaerobic protocols, reinforcing the device’s utility in applied sport science contexts. The relationship between anaerobic power assessments and sprint performance revealed important movement-specific patterns that enhance our understanding of construct validity. The 30 m sprint test with 10 m split intervals, as proposed by Cometti et al. [8] for assessing lower limb muscular power, demonstrated significant correlations with both Bosco and Wingate peak power estimates. However, the pattern of relationships differed meaningfully between assessment protocols. The 10 m sprint performance correlated significantly only with Bosco-derived peak power measurements across all expression formats, with the strongest relationships observed in relative and allometric expressions. This specificity can be explained by the biomechanical similarity between vertical jumping and sprint acceleration, where participants must support and propel their body weight against gravity. Contemporary research confirms significant negative correlations between vertical jump metrics and sprint acceleration performance, particularly during initial acceleration phases [15]. The weight-bearing nature of both vertical jumping and sprint acceleration creates shared neuromuscular demands that are absent in seated cycling protocols. Our regression analysis revealed that 10 m sprint performance explained 43% of the variance in Bosco-derived relative peak power, indicating a meaningful but incomplete overlap between vertical power expression and horizontal acceleration capabilities. This moderate predictive capacity suggests that while vertical jumping assessments capture essential aspects of sprint performance, additional factors contribute to acceleration ability. In contrast, 30 m sprint performance demonstrated significant correlations with both Bosco and Wingate peak power measurements, with relative and allometric expressions showing the strongest relationships. The correlation analysis revealed that 30 m sprint performance explained 66% of the variance in Wingate peak power and 67% of the variance in Bosco peak power when expressed allometrically (W·kg−0.67). This near-equivalent predictive capacity suggests that both assessment modalities capture fundamental power production capabilities relevant to sustained sprint performance, despite their distinct movement patterns and metabolic demands.
The system’s ability to conduct assessments under ecologically valid conditions represents a substantial advantage over laboratory-constrained protocols. Testing can be performed on sport-specific surfaces using competition footwear, enhancing the transfer of assessment results to actual performance contexts [9]. This ecological validity becomes particularly important when considering the movement-specific relationships observed between vertical jumping and sprint acceleration performance. Recent validation research continues to confirm the reliability of Optojump measurements, with coefficient of variation values consistently below 5% for vertical jump assessments [14,28]. The combination of measurement reliability, practical advantages, and demonstrated validity supports the implementation of Optojump systems in applied settings where traditional laboratory assessments may be impractical or unavailable.

4.1. Study Limitations

Several methodological limitations warrant acknowledgment when interpreting these validation findings. The modest sample size of twelve participants, combined with an uneven gender distribution, limits the generalizability of results across diverse athletic populations. Contemporary validation research typically employs larger samples with formal power analyses to ensure adequate statistical power for detecting meaningful differences [4]. Additionally, the use of a homogeneous sample—physically active university students—may not fully represent the broader spectrum of athletic populations for which these assessment tools are intended. While the sample size of 12 participants represents a limitation of this pilot validation study, it aligns with established precedent in similar validation research examining optical measurement systems [18]. The observed effect sizes (Cohen’s d > 0.80) suggest adequate power for detecting meaningful differences between measurement methods, though future investigations should employ larger, more diverse samples with formal power analysis calculations.
The use of different test durations (15 s Wingate versus 30 s Bosco) introduces potential confounding related to metabolic system contributions and fatigue accumulation patterns. Research examining variations in Wingate test protocols emphasizes the importance of matching test durations when comparing different assessment modalities [4]. Future investigations should examine validity relationships using matched test durations to isolate the effects of movement patterns from temporal factors. As highlighted by Kaufmann et al. [25], aligning test durations is essential to minimize confounding effects related to energy system contributions and to ensure more valid comparisons across assessment modalities. The absence of force platform criterion measurements represents another limitation, as our validation relied entirely on established Wingate protocols rather than gold-standard mechanical power assessments. Future studies should consider integrating force plate data or other gold-standard mechanical references to enhance methodological rigor. However, previous research has established strong validity relationships between force plates and Optojump systems [5,12], supporting our methodological approach while acknowledging this limitation.

4.2. Future Research Directions and Clinical Applications

These validation findings establish a foundation for several important research directions. Larger-scale investigations incorporating diverse populations, formal power analyses, and matched test protocols would strengthen the evidence base supporting the implementation of Optojump. Research examining the sensitivity of optical measurement systems to training-induced adaptations would provide valuable insights for longitudinal monitoring applications [29]. The movement-specific relationships observed between assessment protocols and sprint performance suggest essential implications for test selection in applied settings. Research demonstrating that cycling sprint and vertical jump tests are not interchangeable for making qualitative assessments about anaerobic power development over time [1] supports the recommendation for context-specific test selection based on movement demands and training objectives.

5. Conclusions

The convergent evidence from correlation analysis, regression modeling, and sprint performance relationships supports the conclusion that peak power calculated from the 30 s continuous jumping test represents a valid estimate of maximum anaerobic power when interpreted within appropriate normative frameworks. Suppose we accept that peak power derived from the 15 s Wingate test provides a reliable estimate of maximum anaerobic power, and that 30 m sprint performance serves as a valid indicator of lower limb power. In that case, the peak power values obtained through the Optojump system demonstrate comparable construct validity. To our knowledge, this is the first study to compare Optojump-derived peak power from the Bosco repeated jump test with Wingate anaerobic power in university-aged populations, thereby establishing the necessary groundwork for broader implementation in applied sport science settings. The systematic differences between protocols necessitate method-specific interpretation approaches rather than direct value conversion. At the same time, the strong correlational relationships support the utility of optical measurement systems for assessing anaerobic power when they are appropriately implemented and interpreted.

Author Contributions

Conceptualization, A.K., Y.N. and H.İ.C.; methodology, A.K., Y.N. and H.İ.C.; software, M.H. and A.N.; formal analysis, A.K., Y.N. and H.İ.C.; investigation, M.Y., S.B. and R.I.M.; resources, M.H., A.N. and A.A.; data curation, M.H., A.N. and A.A.; writing—original draft preparation, A.K., Y.N., H.İ.C., M.H., A.N., Y.H., M.Y., S.B., R.I.M. and A.A.; writing—review and editing, A.K., Y.N., H.İ.C. and A.A.; visualization, Y.N. and A.K.; supervision, H.İ.C.; project administration, A.K., Y.N., H.İ.C. and A.A.; funding acquisition, R.I.M. All authors have read and agreed to the published version of the manuscript.

Funding

This research received no external funding.

Institutional Review Board Statement

The study was conducted in accordance with the Declaration of Helsinki and approved by the Institutional Review Board of Research Unit (LR23JS01), Sport Performance, Health & Society, Higher Institute of Sport and Physical Education, Ksar-Saîd University.

Data Availability Statement

The datasets generated and analyzed during the current study are not publicly available due to participant privacy and ethical restrictions; however, they are available from the corresponding author upon reasonable request.

Acknowledgments

The authors would like to thank all the subjects for their active participation in this study.

Conflicts of Interest

The authors declare no conflicts of interest.

References

  1. He, J.; Li, M.; Zhang, Q.; Zhang, Z. Associations between the performance of vertical jump and accelerative sprint in elite sprinters. Front. Bioeng. Biotechnol. 2025, 13, 1539197. [Google Scholar] [CrossRef]
  2. Dhahbi, W. Advancing biomechanics: Enhancing sports performance, mitigating injury risks, and optimizing athlete rehabilitation. Front. Sports Act. Living 2025, 7, 1556024. [Google Scholar] [CrossRef]
  3. Söyler, M.; Zileli, R.; Çingöz, Y.E.; Kılınçarslan, G.; Kayantaş, İ.; Altuğ, T.; Asan, S.; Şahin, M.; Gürkan, A.C. The effect of high-intensity plyometric training on anaerobic performance parameters: A pilot study in U17 elite A league. PeerJ 2024, 12, e16648. [Google Scholar] [CrossRef] [PubMed]
  4. Johnson, P.C. Comparison of a Four 40-Yard Sprint Test for Anaerobic Capacity in Males vs. the Wingate Anaerobic Test. Master’s Thesis, Georgia Southern University, Statesboro, GA, USA, 2007. Available online: https://digitalcommons.georgiasouthern.edu/etd/77 (accessed on 26 August 2025).
  5. Sands, W.A.; McNeal, J.R.; Ochi, M.T.; Urbanek, T.L.; Jemni, M.; Stone, M.H. Comparison of the Wingate and Bosco anaerobic tests. J. Strength Cond. Res. 2004, 18, 810–815. [Google Scholar] [PubMed]
  6. Vandewalle, H.; Peres, G.; Heller, J.; Panel, J.; Monod, H. Force-velocity relationship and maximal power on a cycle ergometer: Correlation with the height of a vertical jump. Eur. J. Appl. Physiol. Occup. Physiol. 1987, 56, 650–656. [Google Scholar] [CrossRef]
  7. Dhahbi, W.; Chaabene, H.; Pyne, D.B.; Chamari, K. Standardizing the quantification of external load across different training modalities: A critical need in sport-science research. Int. J. Sports Physiol. Perform. 2024, 19, 1173–1175. [Google Scholar] [CrossRef]
  8. Cometti, G.; Maffiuletti, N.; Pousson, M.; Chatard, J.-C.; Maffulli, N. Isokinetic strength and anaerobic power of elite, subelite and amateur French soccer players. Int. J. Sports Med. 2001, 22, 45–51. [Google Scholar] [CrossRef]
  9. Carlock, J.M.; Smith, S.L.; Hartman, M.J.; Morris, R.T.; Ciroslan, D.A.; Pierce, K.C.; Newton, R.U.; Harman, E.A.; Sands, W.A.; Stone, M.H. The relationship between vertical jump power estimates and weightlifting ability: A field-test approach. J. Strength Cond. Res. 2004, 18, 534–539. [Google Scholar] [PubMed]
  10. Liu, Y.; Yan, J.; Gong, Z.; Liu, Q. The impact of the Wingate test on anaerobic power in the lower limbs of athletes with varied duration and load. Front. Physiol. 2025, 16, 1582875. [Google Scholar] [CrossRef]
  11. Zupan, M.F.; Arata, A.W.; Dawson, L.H.; Wile, A.L.; Payn, T.L.; Hannon, M.E. Wingate anaerobic test peak power and anaerobic capacity classifications for men and women intercollegiate athletes. J. Strength Cond. Res. 2009, 23, 2598–2604. [Google Scholar] [CrossRef]
  12. Attia, A.; Dhahbi, W.; Chaouachi, A.; Padulo, J.; Wong, D.; Chamari, K. Measurement errors when estimating the vertical jump height with flight time using photocell devices: The example of Optojump. Biol. Sport 2017, 34, 63–70. [Google Scholar] [CrossRef]
  13. Atik, B.; Badilli, F.S. Is there any correlation between anaerobic performance and vertical jump height in female volleyball athletes? J. Bodyw. Mov. Ther. 2024, 40, 11–15. [Google Scholar] [CrossRef]
  14. Çetin, O.; Kaya, S.; Atasever, G.; Akyildiz, Z. The validity and reliability of the jump power app for measuring vertical jump actions in professional soccer players. Sci. Rep. 2024, 14, 28801. [Google Scholar] [CrossRef]
  15. Gross, M.; Lüthy, F. Anaerobic power assessment in athletes: Are cycling and vertical jump tests interchangeable? Sports 2020, 8, 60. [Google Scholar] [CrossRef]
  16. Küçükkubaş, N.; Günay, A.; Löklüoğlu, B.; Kakil, B. Relationship between body composition, vertical jump, 30 M sprint, static strength and anaerobic power for athletes. Int. J. Sport Exerc. Train. Sci.-IJSETS 2019, 5, 68–78. [Google Scholar] [CrossRef]
  17. Stewart, A.; Marfell-Jones, M.; Olds, T.; De Ridder, H. International Standards for Anthropometric Assessment; International Society for Advancement of Kinanthropometry (ISAK): Lower Hutt, New Zealand, 2011; Volume 125. [Google Scholar]
  18. Durnin, J.V.; Womersley, J. Body fat assessed from total body density and its estimation from skinfold thickness: Measurements on 481 men and women aged from 16 to 72 years. Br. J. Nutr. 1974, 32, 77–97. [Google Scholar] [CrossRef] [PubMed]
  19. Dotan, R.; Bar-Or, O. Load optimization for the Wingate anaerobic test. Eur. J. Appl. Physiol. Occup. Physiol. 1983, 51, 409–417. [Google Scholar] [CrossRef]
  20. Glatthorn, J.F.; Gouge, S.; Nussbaumer, S.; Stauffacher, S.; Impellizzeri, F.M.; Maffiuletti, N.A. Validity and reliability of Optojump photoelectric cells for estimating vertical jump height. J. Strength Cond. Res. 2011, 25, 556–560. [Google Scholar] [CrossRef] [PubMed]
  21. Castagna, C.; Castellini, E. Vertical jump performance in Italian male and female national team soccer players. J. Strength Cond. Res. 2013, 27, 1156–1161. [Google Scholar] [CrossRef]
  22. Negra, Y.; Chaabene, H.; Sammoud, S.; Prieske, O.; Moran, J.; Ramirez-Campillo, R.; Nejmaoui, A.; Granacher, U. The increased effectiveness of loaded versus unloaded plyometric jump training in improving muscle power, speed, change of direction, and kicking-distance performance in prepubertal male soccer players. Int. J. Sports Physiol. Perform. 2020, 15, 189–195. [Google Scholar] [CrossRef]
  23. Hopkins, W.; Marshall, S.; Batterham, A.; Hanin, J. Progressive statistics for studies in sports medicine and exercise science. Med.+ Sci. Sports+ Exerc. 2009, 41, 3. [Google Scholar] [CrossRef]
  24. Bull, F.C.; Al-Ansari, S.S.; Biddle, S.; Borodulin, K.; Buman, M.P.; Cardon, G.; Carty, C.; Chaput, J.-P.; Chastin, S.; Chou, R. World Health Organization 2020 guidelines on physical activity and sedentary behaviour. Br. J. Sports Med. 2020, 54, 1451–1462. [Google Scholar] [CrossRef] [PubMed]
  25. Kaufmann, S.; Hoos, O.; Beck, A.; Fueller, F.; Latzel, R.; Beneke, R. The metabolic relevance of type of locomotion in anaerobic testing: Bosco continuous jumping test versus Wingate anaerobic test of the same duration. Int. J. Sports Physiol. Perform. 2021, 16, 1663–1669. [Google Scholar] [CrossRef]
  26. Chelly, M.S.; Hermassi, S.; Shephard, R.J. Relationships between power and strength of the upper and lower limb muscles and throwing velocity in male handball players. J. Strength Cond. Res. 2010, 24, 1480–1487. [Google Scholar] [CrossRef] [PubMed]
  27. Dhahbi, W.; Hachana, Y.; Souaifi, M.; Souidi, S.; Attia, A. Tennis-specific incremental aerobic test (TSIAT): Construct validity, inter session reliability and sensitivity. Tunis. J. Sports Sci. Med. 2024, 2, 25–32. [Google Scholar] [CrossRef]
  28. Čular, D.; Dhahbi, W.; Kolak, I.; Iacono, A.D.; Bešlija, T.; Laffaye, G.; Padulo, J. Reliability, sensitivity, and minimal detectable change of a new specific climbing test for assessing asymmetry in reach technique. J. Strength Cond. Res. 2021, 35, 527–534. [Google Scholar] [CrossRef]
  29. Čular, D.; Ivančev, V.; Zagatto, A.M.; Milić, M.; Beslija, T.; Sellami, M.; Padulo, J. Validity and reliability of the 30-s continuous jump for anaerobic power and capacity assessment in combat sport. Front. Physiol. 2018, 9, 543. [Google Scholar] [CrossRef] [PubMed]
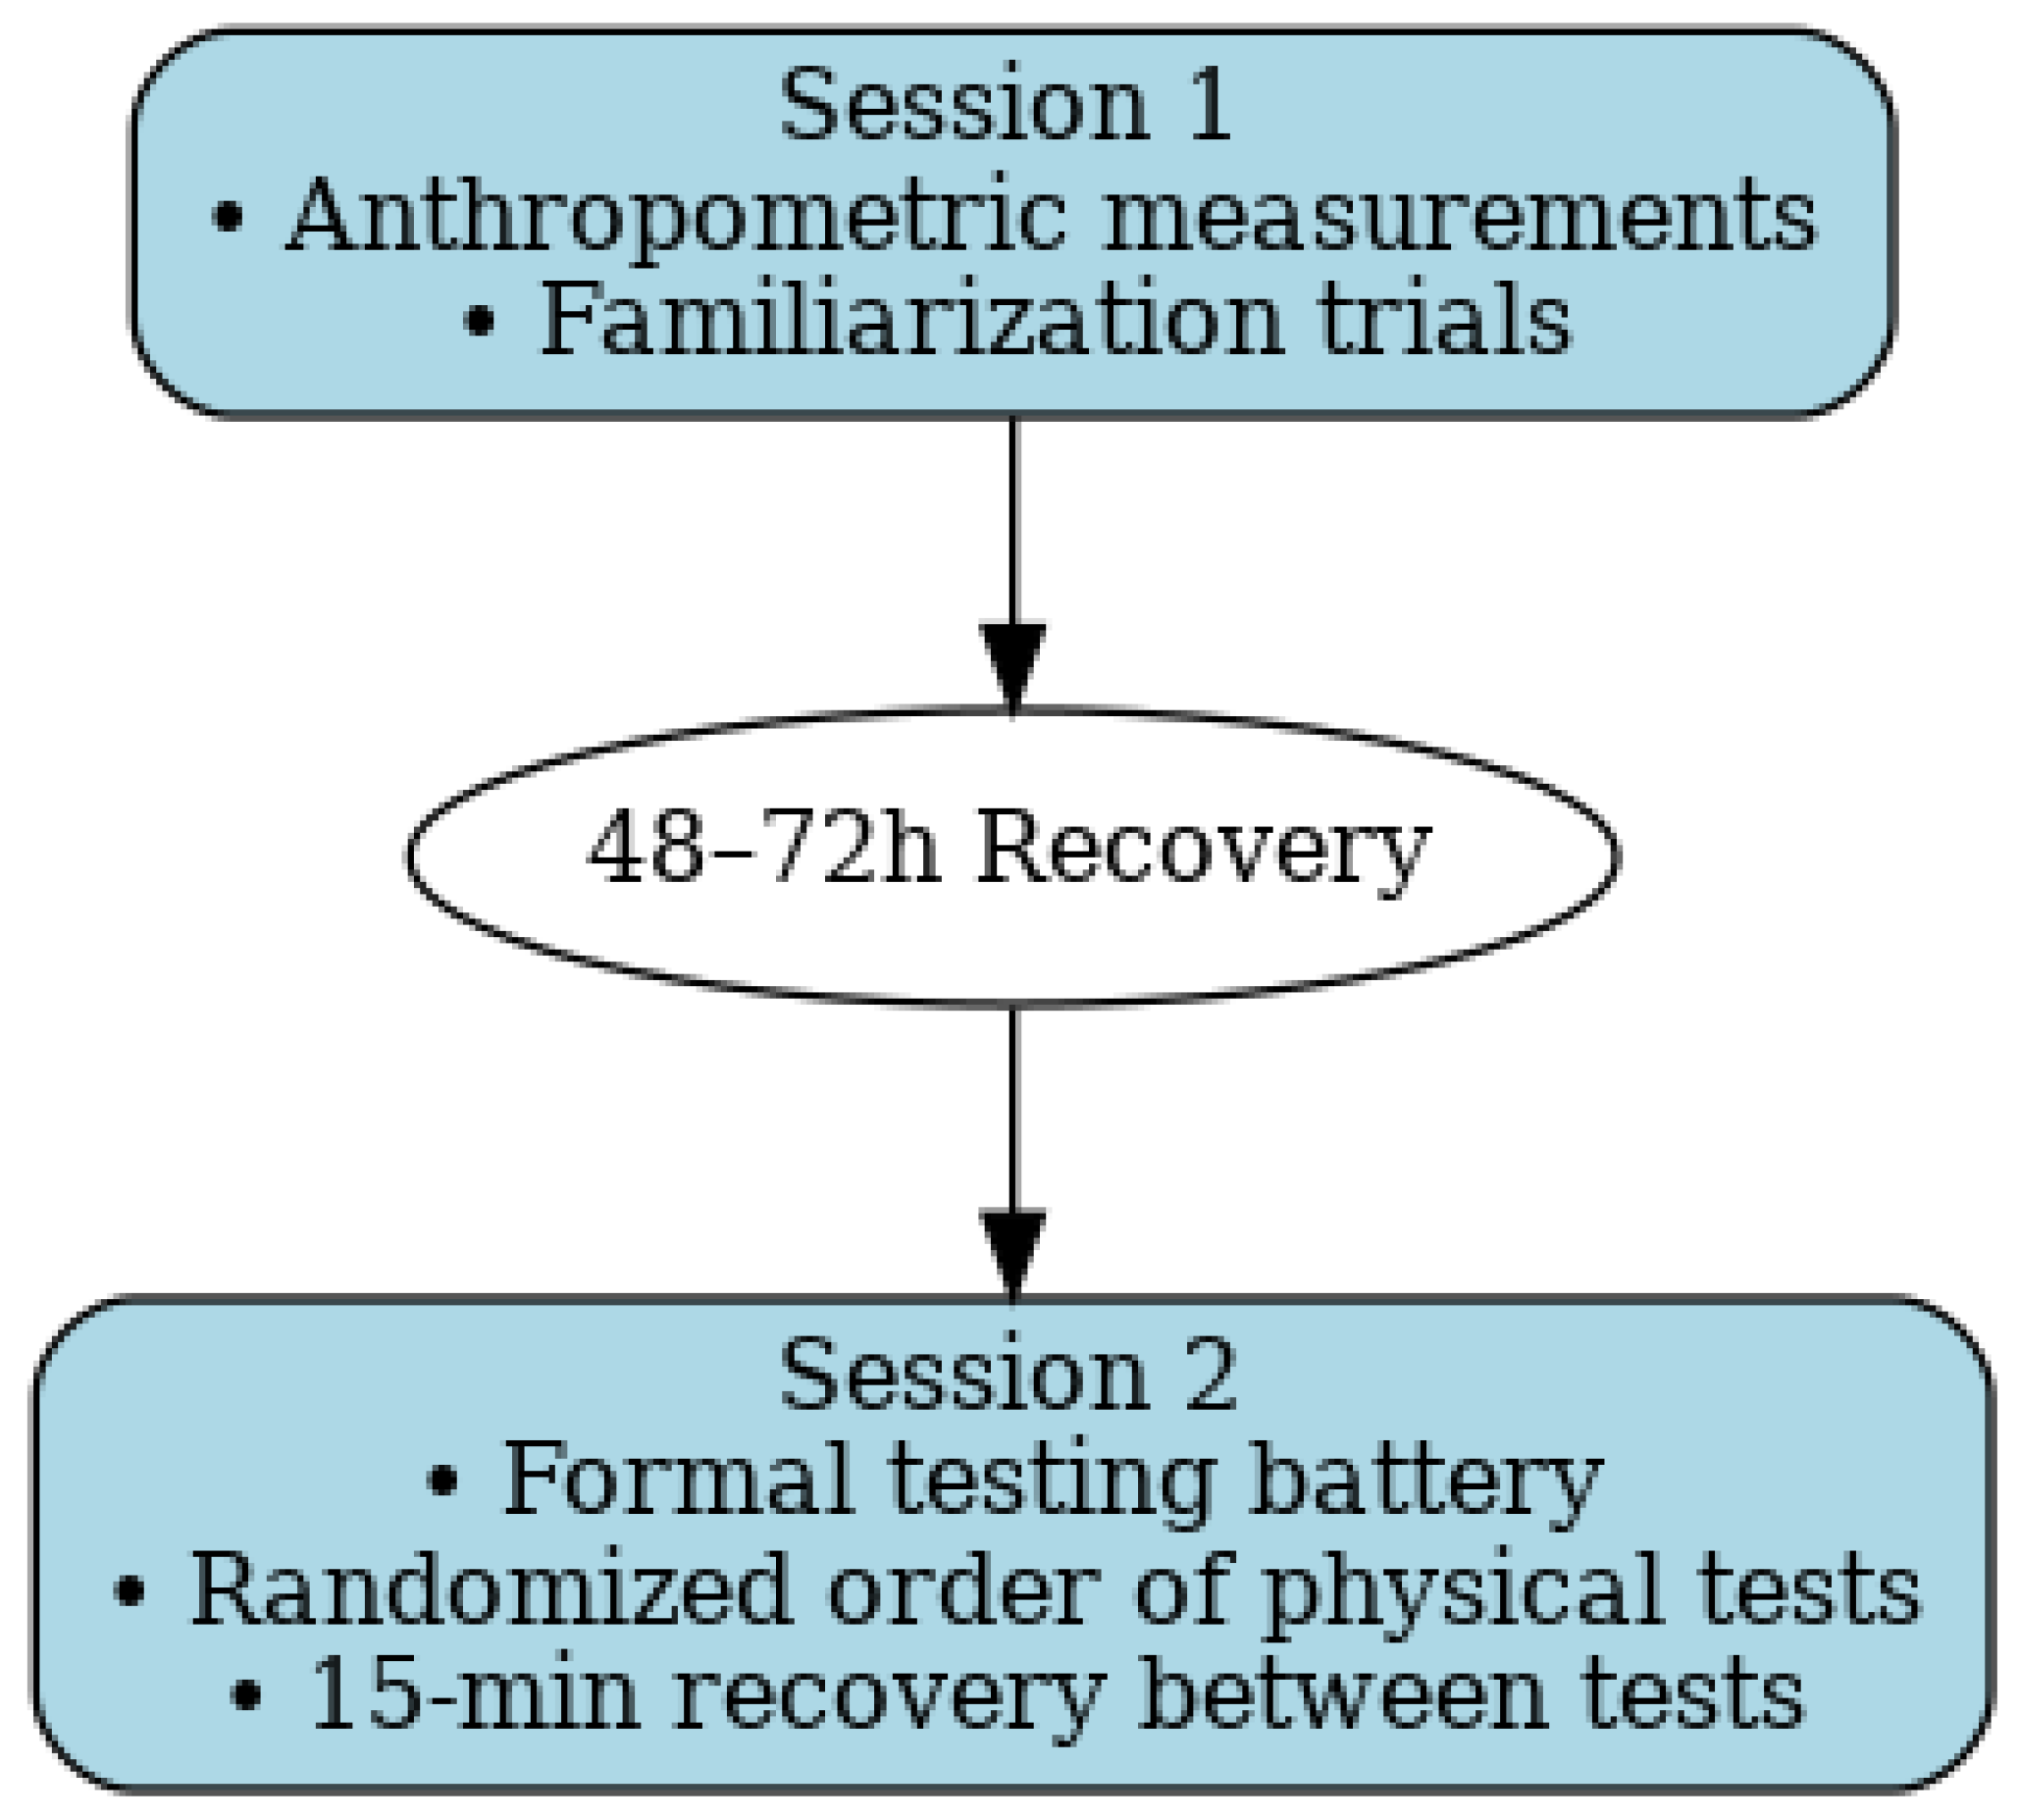
Figure 1. Test sequence and recovery.
Applsci 15 10741 g001
Figure 2. Pearson correlation matrix between anaerobic power assessment methods and sprint performance measures.
Applsci 15 10741 g002
Figure 3. Relationship between 10 m sprint time and relative power peak. (R2 = 0.432). The red line represents the linear regression line between 10-m sprint time and relative power peak, while the grey shaded area indicates the 95% confidence interval.
Applsci 15 10741 g003
Figure 4. Relationship between 30 m sprint time and allometric power peak expression (R2 = 0.672). The red line represents the linear regression line between 30 m sprint time and allometric power peak expression, while the grey shaded area indicates the 95% confidence interval.
Applsci 15 10741 g004
Figure 5. Relationship between 30 m sprint time and Wingate relative power peak (R2 = 0.656). The red line represents the linear regression line between 30 m sprint time and Wingate relative power peak, while the grey shaded area indicates the 95% confidence interval.
Applsci 15 10741 g005
Table 1. Descriptive data of the participants.
MeanSDMinMax
Age (years)23.391.4722.1527.00
Height (cm)173.676.97160.00184.00
Body mass (kg)73.089.1959.8091.20
%Body Fat (%)17.803.9013.1824.53
BMI (kg·m−2)24.171.4821.7426.94
SD: Standard deviation; BMI: body mass index.
Table 2. Results of the sprint test, 15 s anaerobic Wingate test, and 30 s continuous jumping test.
Components of Physical FitnessParticipants (n = 12)
Sprint test
10 m (s)1.91 ± 0.15
30 m (s)4.65 ± 0.46
15 s anaerobic Wingate test
Relative peak power (W·kg−1)10.99 ± 1.58
Absolute peak power (W)807.28 ± 175.45
Allometric peak power (W·kg−0.67)93.26 ± 15.94
30 s continuous jumping
Relative peak power (W·kg−1)18.263 ± 4.24
Absolute peak power (W)1387.15 ± 422.23
Allometric peak power (W·kg−0.67)155.131 ± 38.35
Table 3. Statistical comparison between Optojump-derived and Wingate test peak power measurements.
Mean Difference ± SDEffect SizeCI95tp
Relative peak power—Wingate relative peak power W·kg−17.27 ± 3.432.121.06 to 3.147.33<0.001
Absolute peak power—Wingate absolute peak power W579.87 ± 298.401.940.95 to 2.906.73<0.001
Allometric expression—Wingate allometric expression W·kg−0.6761.87 ± 27.582.241.15 to 3.317.77<0.001
Notes: SD: standard deviation; statistical significance determined by paired samples t-test; all power measurements expressed as W·kg−1 (relative), W (absolute), and W·kg−0.67 (allometric); CI: confidence intervals.
Disclaimer/Publisher’s Note: The statements, opinions and data contained in all publications are solely those of the individual author(s) and contributor(s) and not of MDPI and/or the editor(s). MDPI and/or the editor(s) disclaim responsibility for any injury to people or property resulting from any ideas, methods, instructions or products referred to in the content.