Abstract
To date, the grinding behavior of saprolite and lateritic overburden mixtures remains poorly understood. The Bond Work Index (BWI) is the principal indicator used to determine the specific energy consumption during the grinding process. To establish the F80 and P80 values, granulometric distribution models—Rosin–Rammler (RR), Gates–Gaudin–Schuhmann (GGS), and the Swebrec function (SWEF)—were evaluated. The mineral phases of the feed samples were analyzed by X-ray powder diffraction. This study provides evidence that the RR function is the most suitable for simulating the particle size distribution of the feed material, with residual errors below 6.30% and a coefficient of determination (R2) exceeding 97%. After the grinding equilibrium cycle is reached, the SWEF model proves to be the most appropriate, exhibiting residual errors under 3.50% and R2 values above 98%. BWI reveals that saprolite is the most difficult ore to grind, with specific energy consumption increasing from 16.38 kWh/t to 25.50 kWh/t as the proportion of saprolite in the mixture rises. This reflects a clear upward trend, as confirmed by a fitted model with an R2 of 98.54%. In contrast, the grindability index (Gbp) decreases, indicating that the material becomes increasingly resistant to grinding as the saprolite content increases. This may be attributed to inherent material properties, such as hardness, or to physical phenomena related to fragmentation. The declining Gbp further suggests that greater energy input is required to achieve additional particle size reduction. Overall, the findings demonstrate that saprolite is inherently difficult to grind and behaves according to its own grinding characteristics, regardless of whether it is processed alone or in combination with lateritic overburden.
1. Introduction
One of the main technologies used for the extraction of nickel (Ni) and cobalt (Co) from the processing of lateritic ores is the Caron process. Generally, mixtures of limonites (FeO(OH)·nH2O) and saprolites (the mixture does not have a unique chemical formula, as its composition varies depending on the parent rock and the degree of weathering) are fed into the process in which the iron (Fe) and Ni contents exceed the percentages of 25 and 0.9%, respectively [1,2,3].
In the technological context of the Caron process, grinding plays a critical role, as it ensures an adequate mineral surface area to enable the reduction of Ni and Co to their metallic phases, thereby facilitating their subsequent dissolution during the leaching process [4]. When grinding multicomponent ores, two main theories are commonly discussed. The first proposes the existence of a positive interaction between the different minerals within the mixture. The second theory asserts that each mineral is ground according to its own inherent characteristics—an observation reported by Coello-Velázquez et al. [5] in the case of limonite–saprolite mixtures. In recent years, owing to the depletion of the limonitic zone, one of the technological alternatives currently under evaluation is the use of mixtures of saprolites and lateritic overburden as feed for the Caron process [6]. This approach is based on the potential synergy achieved by formulating mixtures that ensure stable Ni and Fe contents—key parameters influencing extraction efficiency, as recommended by Caron [7,8]. However, the variability in the mineral composition of saprolite and overburden presents challenges in achieving a consistent grinding performance, as their significant chemical–physical differences and particle size distributions (PSD) demand rigorous control and monitoring [9,10].
The grinding operation requires a substantial amount of energy [11,12]. According to Laborde-Brown [13], the grinding stage in the Caron process accounts for the highest energy consumption—representing 21% of the total energy used in the process. Due to the high energy demands of ball mills in this context, careful operational control is essential to reduce costs without compromising the quality of the ground product [14]. In engineering practice, the most widely used method for determining the specific energy consumption in grinding is the Bond grindability test [15], which yields the Bond Work Index (BWI) [16,17]. The BWI is defined as the energy required to reduce a unit mass of material from an initial to a final particle size, and it is typically determined using a standard laboratory ball mill [18]. This theory allows the specific energy required for a grinding process to be calculated using Equation (1) [19].
where
- BWI is the Bond Work Index, kWh/t;
- P is the size of the opening of the control sieve, μm;
- Gbp is the mass of the newly created screen of the control sieve per revolution of the mill, g/rev;
- F80 is the size of the opening of the sieve through which 80% of the feed passes before grinding, μm;
- P80 is the size of the sieve opening through which 80% of the comparative sieve from the last grinding cycle passes, μm.
Considering the importance of PSD in the output material from any milling operation [20,21], different models have been evaluated for the determination of F80 and P80 [22]. Different studies [4,23,24] have recommended the use of the Rosin–Rammler (RR) and Gates–Gaudin–Schumann (GGS) models and the Swebrec function (SWEF) to simulate the particle size distribution in minerals before and after the grinding process.
PSD models play a crucial role in optimizing grinding operations by predicting the size distribution of mill products. Such predictions are essential for adjusting operational parameters to achieve desired outcomes, including minimizing over-grinding and reducing energy consumption [24,25]. Accurate PSD models are also key to predicting mineral liberation, a critical step in linking comminution with separation processes. This predictive capability enables metallurgists to adapt and optimize grinding strategies in response to variations in ore characteristics [26].
PSD models provide a fundamental basis for the simulation and control of mineral processing operations. For example, distribution parameter simulation systems for ball mills assist in characterizing the particle flow and support control loops to manage mineral particle-size distribution [27]. The representation of multimineral particle distributions is becoming increasingly important, as it offers a more comprehensive understanding of particle behavior within mineral processing plants [28].
While PSD models offer considerable value in the field of mineral processing, it is important to recognize the limitations and challenges associated with their application. For instance, the accuracy of these models may be affected by the complex nature of ore textures and the stochastic behavior of fragmentation mechanisms. Furthermore, the development of more advanced models that account for multi-mineral compositions, alongside the integration of technologies such as X-ray tomography, can significantly improve the predictive power of PSD models [26,28]. These advances underscore the ongoing need for research and innovation to address the evolving challenges of mineral processing.
Given that the grinding behavior of saprolite and overburden mixtures remains poorly understood, this study proposes the use of the Bond Work Index (BWI) to determine specific energy consumption and presents evidence supporting the effectiveness of the Swebrec function in accurately determining the F80 and P80 parameters.
2. Materials and Methods
2.1. Materials
The experimental study employed samples of saprolite and overburden representative of the typical lateritic oxide profile from the Moa Bay lateritic mining district in Cuba. Their main average chemical characteristics are presented in Table 1. The overburden was characterized by a nickel content below the cut-off grade required for the Caron process (0.9%) [1], iron content exceeding 40%, and low concentrations of SiO2 and MgO. The saprolite exhibited the typical chemical composition described by Oxley and Barcza [29]. For the mixtures, the results reflected the proportional contribution of each base sample. Overall, the standard deviation (σ) for all samples was below 0.64. Prior to conducting the experiments, all samples were dried, with a maximum particle size below 3.15 mm and a homogenization degree exceeding 95%. Average values were determined by performing the analyses on triplicate samples.

Table 1.
Chemical composition of the samples.
2.2. Equipment and Methodology
The experiments were conducted using a standard Bond mill, measuring 305 mm in length and 305 mm in diameter (12 × 12 inches), operating at 70 rpm and loaded with 20.125 kg of steel balls of appropriate size distribution. The constant sample mass introduced into the mill corresponded to 700 cm3 of initial feed. Grinding was performed in cycles simulating equilibrium conditions under continuous operation, with a recirculation load of 250%. Tests for determining the Bond Work Index were carried out at a target product size of 200 µm, with each test repeated three times [30].
A Tyler Standard Sieve Series was used to determine the F80 and P80 by evaluating the granulometric distribution models recommended by Coello-Velázquez et al. [4] and Angulo-Palma et al. [23] during the feeding and grinding of lateritic ores in the Caron process. Table 2 presents a summary of the adjustment models evaluated and their characteristics, where the models for RR, GSS, and SWEF distributions are defined in Equations (2), (3), and (4), respectively.
Table 2.
Granulometric distribution models used to determine the F80 and P80.
2.3. Chemical Analysis and Mineralogical Characteristics of the Samples
To determine the chemical elements of the ores fed to the mill, the atomic absorption spectrometry method was used (AAS, model SOLAR 929, Solar System ATI, Unicam Analytical Technology Inc., Cambridge, UK).
The crystal structure and mineralogical composition of the feed minerals were analyzed by powder X-ray diffraction (XRD) by a Panalytical X’PERT3 diffractometer (Malvern Panalytical, Malvern, UK) with Gonio scanning at 2 angular log from 4.0042 to 79.9962° and a distance step in 2θ = 0.0080°, potential difference of 40 kV, current of 30 mA and a calibration checked with an external silicon standard.
3. Results and Discussions
3.1. Mineralogical Characterization of the Samples Fed to the Mill
Figure 1 shows the XRD patterns of overburden, saprolite ores, and their mixtures as fed to the Bond mill. The overburden is characterized by a predominance of iron and aluminum oxides and oxyhydroxides, with goethite, maghemite, hematite, and gibbsite being the most prominent phases. Silicon and magnesium were present as secondary phases in the form of lizardite, talc, and quartz.
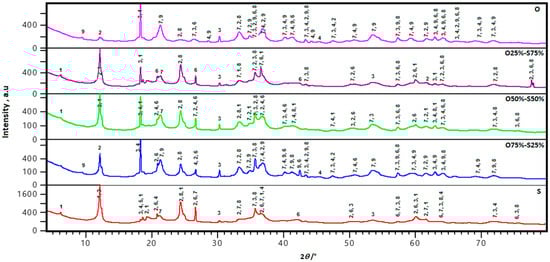
Figure 1.
XRD patterns of samples fed to the Bond mill. 1—clinochlore: [(MgFeAl)6(SiCr)4O10(OH)8]; 2—lizardite: Mg3Si2O5(OH)4; 3—maghemite: Fe21.16O31.92; 4 and 5—gibbsite: Al(OH)3; 6—quartz: SiO2; 7—goethite: FeOOH; 8—hematite: Fe2O3; 9—talc: [Mg3(Si2O5)2(OH)2].
In the saprolite sample, clinochlore, lizardite, and quartz were the dominant silicate phases, while iron and aluminum oxides and oxyhydroxides appeared as secondary components. The mineralogical phases identified in all mixtures reflected the respective proportions of overburden and saprolite in each blend. Several studies [2,23,34,35,36,37] have reported the presence of these mineralogical phases in Cuban oxide-type Ni-laterite profiles.
3.2. Determination of F80, P80 and Gbp
Figure 2 presents the evaluation of the Rosin–Rammler, Gates–Gaudin–Schuhmann, and Swebrec granulometric models for all feed and ground samples, using the experimental particle size distribution curves as a reference. The shape of the experimental curves indicates a predominance of fine fractions, consistent with the behavior reported by Coello-Velázquez et al. [4,5]. The initial sampling data are provided in Appendix A, Table A1, Table A2, Table A3, Table A4, Table A5, Table A6, Table A7, Table A8, Table A9 and Table A10. Furthermore, Table 3 shows the fitted distributions obtained using the least squares method for all configurations (feed and product). For the feed samples, the RR model proved to be the most accurate, with coefficients of determination (R2) exceeding 97.70%, mean absolute percentage errors (MAPE) below 6.30%, and the lowest values for both mean square error and mean absolute error. For the samples ground in the final cycle of the Bond Work Index test, the SWEF model delivered the best performance, with residual errors below 3.50% and R2 values greater than 98.0%. In all cases, except for the overburden feed sample, the GGS model exhibited low accuracy, limiting its applicability. These findings are consistent with those of Álvarez Rodríguez et al. [38], who recommended the RR model for determining F80. However, the present results demonstrate that the SWEF model is more effective for modelling the particle size distributions of grinding products.
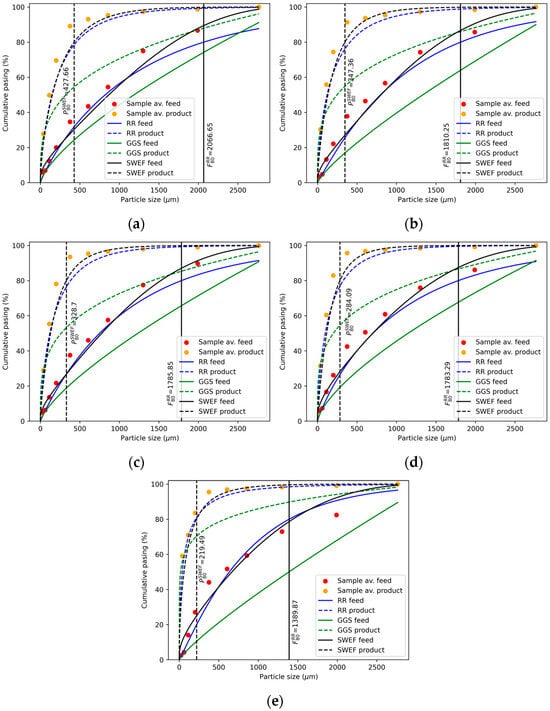
Figure 2.
Evaluation of granulometric models for the mineral fed and product to the ball mill for the following configurations: overburden [100%] (a); overburden [75%] and saprolite [25%] (b); overburden [50%] and saprolite [50%] (c); overburden [25%] and saprolite [75%] (d); saprolite [100%] (e).
Table 3.
Fitted particle size distributions and goodness-of-fit statistics for the RR, GGS, and SWEF distributions, and different overburden and saprolite configurations.
Using the granulometric models that demonstrated the best fit, as shown in Figure 2 and Table 3, the values of F80, P80, and the F80/P80 ratio were determined (see Table 4). The F80 and P80 values ranged from 2067.39 μm to 1390.29 μm, and from 427.60 μm to 190.00 μm, respectively, which represent figures comparable to those reported by Álvarez et al. [22] for various mineral types. Notably, both the F80 and P80 values decreased as the proportion of saprolite in the mixtures increased, suggesting that overburden and saprolite grind according to their own inherent characteristics, regardless of the formulation of the mixture. The average F80/P80 ratio across all samples was 5.62, which is indicative of an efficient comminution process.
Table 4.
F80 and P80 values.
Figure 3a illustrates the behavior of the grams of fines produced in the mill for each revolution (Gbp) as the saprolite content in the mixtures increases. A clear trend is observed: the net grams produced a decrease as the proportion of saprolite rises, with an average reduction of 0.84 units for every 25% increase in saprolite content. These findings demonstrate that saprolite is more difficult to grind than overburden, consistent with the behavior reported for saprolite/limonite mixtures by Coello-Velázquez et al. [5]. Figure 3b, meanwhile, presents the Bond Work Index results as a function of increasing saprolite content in the mixtures. Specific energy consumption during grinding ranged from 16.38 to 25.50 kWh/t. A general upward trend is evident, with an average increase of 2.28 kWh/t for every 25% increment in saprolite. Notably, the first quartile (0–25% saprolite) exhibited a sharper rise of 5.15 kWh/t, while subsequent quartiles showed an average increase of 1.33 kWh/t. The data fit a potential model with a coefficient of determination exceeding 98.50%. These results confirm that saprolite is the most difficult material to grind. Furthermore, they reinforce the observation that overburden and saprolite exhibit distinct grinding behaviors, each following its own regularities regardless of whether they are milled individually or in combination.
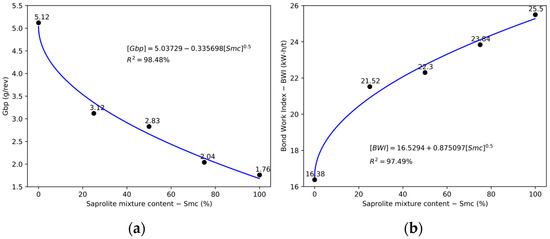
Figure 3.
Gbp (a) and Bond Work Index (b) as a function of serpentine content in the mixture.
4. Conclusions and Future Perspectives
Theoretical frameworks for particle size distribution are fundamental in the field of mineral processing, as they provide a detailed understanding of the spatial arrangement of particles of varying sizes within a given material. The findings of this study are essential for optimizing the comminution process of lateritic ores, with potential application to Caron technology. The results suggest that overburden and saprolite are ground according to their own intrinsic characteristics, regardless of whether they are processed separately or as a mixture. This study confirms that the Rosin–Rammler model is appropriate for modelling the PSD of feed materials, while the Swebrec function proves to be the most accurate for ground samples, showing residual errors below 3.15%. The average F80/P80 ratio of 5.62 indicates that the comminution process was efficient and within expected operational standards.
The Bond Work Index analysis reveals that saprolite is the most challenging ore to grind, with specific energy consumption increasing from 16.38 kWh/t to 25.50 kWh/t as saprolite content in the mixtures rises. This reflects a monotonic increasing trend, well represented by a fitted model with a coefficient of determination of 98.54%. Conversely, the Gbp exhibits a monotonic decrease, confirming that the grinding process becomes more difficult as the proportion of saprolite increases. This behavior is likely attributed to the inherent hardness of the material and physical phenomena associated with fragmentation. A declining Gbp also implies that a higher energy input is required to achieve further particle size reduction.
Looking ahead, the prospects for PSD modelling in the Caron process—used for the reduction of nickel laterite ores—are promising, driven by advances in computational tools and modelling techniques. These developments enable more accurate prediction and control of PSD, which is critical for optimizing the efficiency and product quality of the Caron process. Key future directions include the application of advanced modelling methods, improvements in computational frameworks for non-linear systems, and the integration of practical case studies to validate model performance in real-world conditions.
Author Contributions
Conceptualization, Y.C.-C. and Y.O.S.; methodology, Y.C.-C., Y.O.S. and C.H.P.; software, M.S.; validation, Y.C.-C., H.J.A.-P., R.S.A.R., I.S., S.G., F.M.G.-M. and N.T.; formal analysis, Y.O.S., A.S. and A.D.R.; investigation, Y.C.-C., Y.O.S., H.J.A.-P., R.S.A.R., A.D.R., C.H.P., I.S., S.G., F.M.G.-M., M.S. and N.T.; data curation, A.D.R.; writing—original draft preparation, Y.C.-C., H.J.A.-P., R.S.A.R. and M.S.; writing—review and editing, H.J.A.-P., A.S. and M.S.; visualization, M.S.; supervision, Y.C.-C., H.J.A.-P., R.S.A.R. and N.T.; project administration, H.J.A.-P. All authors have read and agreed to the published version of the manuscript.
Funding
This research received no external funding.
Institutional Review Board Statement
Not applicable.
Informed Consent Statement
Not applicable.
Data Availability Statement
All data generated or analyzed during this study are included in this published article.
Acknowledgments
Manuel Saldana acknowledges the infrastructure and support from Doctorado en Ingeniería de Procesos de Minerales at the Universidad de Antofagasta. The authors acknowledges to ANID/FONDAP 1523A0006.
Conflicts of Interest
The authors declare no conflicts of interest.
Appendix A
Table A1.
Experimental granulometric distribution of the overburden sample fed to the mill.
Table A1.
Experimental granulometric distribution of the overburden sample fed to the mill.
| Size Interval, μm | Weight, % | |||
|---|---|---|---|---|
| 1 | 2 | 3 | Average | |
| 3150/2380 | 13.49 | 13.20 | 13.30 | 13.33 |
| 2380/1600 | 12.03 | 11.75 | 11.25 | 11.68 |
| 1600/1000 | 20.24 | 20.87 | 20.48 | 20.53 |
| 1000/710 | 10.38 | 11.63 | 10.99 | 11.00 |
| 710/500 | 8.94 | 8.79 | 8.71 | 8.81 |
| 500/250 | 14.04 | 15.22 | 14.59 | 14.62 |
| 250/150 | 7.67 | 7.61 | 7.61 | 7.63 |
| 150/75 | 5.57 | 5.54 | 5.53 | 5.55 |
| 75/45 | 0.95 | 0.86 | 0.93 | 0.91 |
| <45 | 6.69 | 4.53 | 6.61 | 5.94 |
Table A2.
Experimental granulometric distribution of the O75%-S25% mixture fed to the mill.
Table A2.
Experimental granulometric distribution of the O75%-S25% mixture fed to the mill.
| Size Interval, μm | Weight, % | |||
|---|---|---|---|---|
| 1 | 2 | 3 | Average | |
| 3150/2380 | 14.53 | 14.67 | 13.58 | 14.26 |
| 2380/1600 | 11.49 | 11.47 | 11.33 | 11.43 |
| 1600/1000 | 17.81 | 17.52 | 17.53 | 17.62 |
| 1000/710 | 9.67 | 10.71 | 10.34 | 10.24 |
| 710/500 | 8.49 | 8.78 | 8.59 | 8.62 |
| 500/250 | 15.54 | 15.78 | 15.80 | 15.71 |
| 250/150 | 9.35 | 8.53 | 8.79 | 8.89 |
| 150/75 | 8.18 | 8.86 | 8.41 | 8.48 |
| 75/45 | 1.44 | 1.35 | 1.15 | 1.31 |
| <45 | 3.50 | 2.33 | 4.48 | 3.44 |
Table A3.
Experimental granulometric distribution of the O50%-S50% mixture fed to the mill.
Table A3.
Experimental granulometric distribution of the O50%-S50% mixture fed to the mill.
| Size Interval, μm | Weight, % | |||
|---|---|---|---|---|
| 1 | 2 | 3 | Average | |
| 3150/2380 | 10.32 | 10.49 | 9.98 | 10.26 |
| 2380/1600 | 12.07 | 12.55 | 12.19 | 12.27 |
| 1600/1000 | 20.38 | 19.41 | 20.01 | 19.93 |
| 1000/710 | 10.89 | 12.10 | 11.60 | 11.53 |
| 710/500 | 8.84 | 8.16 | 8.41 | 8.47 |
| 500/250 | 15.12 | 16.44 | 15.94 | 15.83 |
| 250/150 | 8.65 | 7.80 | 7.91 | 8.12 |
| 150/75 | 7.23 | 7.43 | 7.25 | 7.30 |
| 75/45 | 1.31 | 1.30 | 1.30 | 1.30 |
| <45 | 5.19 | 4.32 | 5.41 | 4.97 |
Table A4.
Experimental granulometric distribution of the O25%-S75% mixture fed to the mill.
Table A4.
Experimental granulometric distribution of the O25%-S75% mixture fed to the mill.
| Size Interval, μm | Weight, % | |||
|---|---|---|---|---|
| 1 | 2 | 3 | Average | |
| 3150/2380 | 13.96 | 13.85 | 13.88 | 13.90 |
| 2380/1600 | 10.46 | 9.84 | 10.12 | 10.14 |
| 1600/1000 | 15.10 | 15.08 | 15.06 | 15.08 |
| 1000/710 | 10.08 | 10.40 | 10.31 | 10.26 |
| 710/500 | 8.20 | 8.10 | 8.16 | 8.15 |
| 500/250 | 16.57 | 15.98 | 16.42 | 16.32 |
| 250/150 | 9.83 | 9.22 | 9.50 | 9.52 |
| 150/75 | 9.70 | 8.87 | 9.27 | 9.28 |
| 75/45 | 1.29 | 1.67 | 1.49 | 1.48 |
| <45 | 4.81 | 6.99 | 5.79 | 5.86 |
Table A5.
Experimental granulometric distribution of the saprolite sample fed to the mill.
Table A5.
Experimental granulometric distribution of the saprolite sample fed to the mill.
| Size Interval, μm | Weight, % | |||
|---|---|---|---|---|
| 1 | 2 | 3 | Average | |
| 3150/2380 | 17.62 | 17.51 | 17.49 | 17.54 |
| 2380/1600 | 9.01 | 9.71 | 9.74 | 9.49 |
| 1600/1000 | 13.77 | 13.57 | 13.66 | 13.67 |
| 1000/710 | 7.39 | 7.69 | 7.72 | 7.60 |
| 710/500 | 7.74 | 7.53 | 7.63 | 7.63 |
| 500/250 | 17.03 | 17.02 | 17.04 | 17.03 |
| 250/150 | 12.92 | 12.98 | 13.03 | 12.98 |
| 150/75 | 9.80 | 9.92 | 9.71 | 9.81 |
| 75/45 | 1.71 | 1.82 | 1.74 | 1.76 |
| <45 | 3.01 | 2.25 | 2.24 | 2.50 |
Table A6.
Experimental granulometric distribution of the overburden sample product of the last cycle in the Bond test.
Table A6.
Experimental granulometric distribution of the overburden sample product of the last cycle in the Bond test.
| Size Interval, μm | Weight, % | |||
|---|---|---|---|---|
| 1 | 2 | 3 | Average | |
| 3150/2380 | 1.21 | 1.44 | 1.20 | 1.28 |
| 2380/1600 | 1.28 | 1.34 | 1.53 | 1.38 |
| 1600/1000 | 2.21 | 1.99 | 1.84 | 2.01 |
| 1000/710 | 2.20 | 2.27 | 2.19 | 2.22 |
| 710/500 | 4.14 | 3.93 | 3.71 | 3.93 |
| 500/250 | 19.17 | 19.83 | 19.66 | 19.55 |
| 250/150 | 20.07 | 19.70 | 19.56 | 19.78 |
| 150/75 | 22.02 | 21.97 | 22.30 | 22.10 |
| 75/45 | 27.70 | 27.53 | 28.01 | 27.75 |
Table A7.
Experimental granulometric distribution of the O75%-S25% mixture product of the last cycle in the Bond test.
Table A7.
Experimental granulometric distribution of the O75%-S25% mixture product of the last cycle in the Bond test.
| Size Interval, μm | Weight, % | |||
|---|---|---|---|---|
| 1 | 2 | 3 | Average | |
| 3150/2380 | 1.27 | 1.80 | 1.39 | 1.49 |
| 2380/1600 | 1.02 | 1.48 | 1.13 | 1.21 |
| 1600/1000 | 1.91 | 1.89 | 1.70 | 1.83 |
| 1000/710 | 1.99 | 1.86 | 1.64 | 1.83 |
| 710/500 | 1.93 | 2.53 | 2.33 | 2.26 |
| 500/250 | 16.57 | 17.45 | 16.85 | 16.96 |
| 250/150 | 18.23 | 18.36 | 19.05 | 18.55 |
| 150/75 | 25.85 | 25.10 | 25.69 | 25.55 |
| 75/45 | 31.23 | 29.53 | 30.22 | 30.32 |
Table A8.
Experimental granulometric distribution of the O50%-S50% mixture product of the last cycle in the Bond test.
Table A8.
Experimental granulometric distribution of the O50%-S50% mixture product of the last cycle in the Bond test.
| Size Interval, μm | Weight, % | |||
|---|---|---|---|---|
| 1 | 2 | 3 | Average | |
| 3150/2380 | 0.96 | 1.11 | 1.06 | 1.04 |
| 2380/1600 | 0.88 | 1.04 | 1.10 | 1.01 |
| 1600/1000 | 1.17 | 1.52 | 1.29 | 1.33 |
| 1000/710 | 1.00 | 1.46 | 1.38 | 1.28 |
| 710/500 | 1.45 | 2.03 | 2.00 | 1.83 |
| 500/250 | 13.88 | 16.74 | 15.60 | 15.41 |
| 250/150 | 22.93 | 22.53 | 23.03 | 22.83 |
| 150/75 | 27.19 | 25.59 | 26.19 | 26.32 |
| 75/45 | 30.54 | 27.98 | 28.35 | 28.95 |
Table A9.
Experimental granulometric distribution of the O25%-S75% mixture product of the last cycle in the Bond test.
Table A9.
Experimental granulometric distribution of the O25%-S75% mixture product of the last cycle in the Bond test.
| Size Interval, μm | Weight, % | |||
|---|---|---|---|---|
| 1 | 2 | 3 | Average | |
| 3150/2380 | 0.87 | 0.78 | 0.80 | 0.82 |
| 2380/1600 | 0.68 | 0.83 | 0.77 | 0.76 |
| 1600/1000 | 0.83 | 0.85 | 0.96 | 0.88 |
| 1000/710 | 0.72 | 0.67 | 0.83 | 0.74 |
| 710/500 | 1.07 | 1.14 | 1.15 | 1.12 |
| 500/250 | 14.10 | 13.25 | 10.81 | 12.72 |
| 250/150 | 23.02 | 21.48 | 22.97 | 22.49 |
| 150/75 | 28.07 | 28.75 | 29.88 | 28.90 |
| 75/45 | 30.64 | 32.25 | 31.83 | 31.57 |
Table A10.
Experimental granulometric distribution of the saprolite sample product of the last cycle in the Bond test.
Table A10.
Experimental granulometric distribution of the saprolite sample product of the last cycle in the Bond test.
| Size Interval, μm | Weight, % | |||
|---|---|---|---|---|
| 1 | 2 | 3 | Average | |
| 3150/2380 | 0.91 | 0.89 | 0.96 | 0.92 |
| 2380/1600 | 0.85 | 0.77 | 0.67 | 0.76 |
| 1600/1000 | 0.79 | 0.89 | 0.80 | 0.83 |
| 1000/710 | 0.66 | 0.55 | 0.58 | 0.60 |
| 710/500 | 1.46 | 1.36 | 1.35 | 1.39 |
| 500/250 | 11.75 | 12.06 | 12.07 | 11.96 |
| 250/150 | 12.21 | 12.70 | 12.62 | 12.51 |
| 150/75 | 11.82 | 11.98 | 12.06 | 11.95 |
| 75/45 | 59.55 | 58.80 | 58.89 | 59.08 |
References
- Angulo-Palma, H.J.; Legrá, A.L.; Urgellés, A.L.; Gálvez, E.; Castillo, J. Post-Combustion Effect on Nickel and Cobalt Extractions from the Caron Process. In Proceedings of the Fourth International Conference on Inventive Material Science Applications; Advances in Sustainability Science and Technology. Bindhu, V.R.S., Tavares, J.M., Ţălu, Ş., Eds.; Springer: Singapore, 2022; pp. 515–527. [Google Scholar] [CrossRef]
- Angulo-Palma, H.; Legrá, Á.; Urgellés, A.; Pedrera, C.; Gallegos, S.; Galleguillos, M.; Toro, N. Use of a Mixture of Coal and Oil as an Additive for Selective Reduction of Lateritic Ore by the Caron Process. Hem. Ind. 2024, 78, 17–27. [Google Scholar] [CrossRef]
- Chen, J.; Jak, E.; Hayes, P.C. Investigation of the Reduction Roasting of Saprolite Ores in the Caron Process: Microstructure Evolution and Phase Transformations. Miner. Process. Extr. Metall. 2021, 130, 148–159. [Google Scholar] [CrossRef]
- Coello-Velázquez, A.L.; Arteaga, V.Q.; Menéndez-Aguado, J.M.; Pole, F.M.; Llorente, L. Use of the Swebrec Function to Model Particle Size Distribution in an Industrial-Scale Ni-Co Ore Grinding Circuit. Metals 2019, 9, 882. [Google Scholar] [CrossRef]
- Coello-Velázquez, A.L.; Menéndez-Aguado, J.M.; Brown, R.L. Grindability of Lateritic Nickel Ores in Cuba. Powder Technol. 2008, 182, 113–115. [Google Scholar] [CrossRef]
- Véliz Jardines, A.; Miranda López, J. Desarrollo de investigaciones sobre la tecnología Caron durante el procesamiento de las lateritas de baja ley de níquel y de los escombros lateríticos, clasificados como: Menas o minerales no industriales. Tecnol. Química 2022, 42, 361–383. [Google Scholar]
- Caron, M.H. Fundamental and Practical Factors in Ammonia Leaching of Nickel and Cobalt Ores. JOM 1950, 2, 67–90. [Google Scholar] [CrossRef]
- Caron, M.H. Separation of Nickel and Cobalt. JOM 1950, 2, 91–103. [Google Scholar] [CrossRef]
- Eso, R.; Safiuddin, L.; Agusu, L.; Hamimu, L.; Safani, J.; Arman, A.; Tahir, T.; Tufaila, T.; Syah, H.; Leomo, S.; et al. Using Soil Magnetic Susceptibility Proxies to Estimate Overburden Thickness Overlying Ore of Lateritic Soils in Sulawesi Island Indonesia. Iraqi Geol. J. 2024, 57, 17–32. [Google Scholar] [CrossRef]
- Souisa, M.; Madonna-Sapulete, S.; Soplanit, M. Interpretation of the potential of laterite nickel deposits using resistivity data in Amahusu Village, Ambon City, Maluku. In AIP Conference Proceedings. AIP Publ. 2021, 2360, 030008. [Google Scholar] [CrossRef]
- Umucu, Y.; Deniz, V.; Gürsoy, Y.H. Investigation of Energy—Technology Development in Ultra Fine Grinding. J. Eng. Archit. Fac. Eskiseh. Osman. Univ. 2023, 31, 1060–1076. [Google Scholar] [CrossRef]
- Zhang, W.; Zhou, Q.; Pan, J.; Zhu, D.; Yang, C. Grinding of Australian and Brazilian Iron Ore Fines for Low-Carbon Production of High-Quality Oxidised Pellets. Minerals 2024, 14, 236. [Google Scholar] [CrossRef]
- Laborde-Brown, R. Diagnóstico energético en el proceso de molienda de la laterita [Energetic diagnostic in the milling process of the latheritic ore]. Minería Y Geol. 2004, 20, 107–113. [Google Scholar]
- Angulo-Palma, H.J.; Legrá Legrá, A.; Coello Velázquez, A.L. Efecto de La Sustitución Del Petróleo Aditivo Por El Carbón Bituminoso En El Proceso de Molienda de Los Minerales Lateríticos. Sinerg. Acad. 2020, 3, 22–31. [Google Scholar] [CrossRef]
- Bond, F.C. Crushing and Grinding Calculations, Part I. Br. Chem. Eng. 1961, 6, 378–385. [Google Scholar]
- Menéndez-Aguado, J.M.; Dzioba, B.R.; Coello-Valazquez, A.L. Determination of Work Index in a Common Laboratory Mill. Miner. Metall. Process. 2005, 22, 173–176. [Google Scholar] [CrossRef]
- Nzeh, N.S.; Adeleke, A.A.; Popoola, P.A. Grindability Characterization and Work Index Determination of Alluvial Ferro-Columbite Deposits for Efficient Mineral Processing. Physicochem. Probl. Miner. Process. 2023, 59, 170297. [Google Scholar] [CrossRef]
- Kohitlhetse, I.; Rutto, H.; Motsetse, K.; Manono, M. Grindability, Energy Requirements and Gravity Separation of Quartz from Blast Furnace Ironmaking Slag by Shaking Table and Falcon Concentrator. Eng. Proc. 2023, 37, 123. [Google Scholar] [CrossRef]
- Menéndez-Aguado, J.M.; Coello-Velázquez, A.L.; Dzioba, B.R.; Rodriguez Diaz, M.A. Process Models for Simulation of Bond Tests. Miner. Process. Extr. Metall. 2006, 115, 85–90. [Google Scholar] [CrossRef]
- Bojanić, N.; Fišteš, A.; Došenović, T.; Takači, A.; Brdar, M.; Yoneda, K.; Rakić, D. Control of the Size and Compositional Distributions in a Milling Process by Using a Reverse Breakage Matrix Approach. Hem. Ind. 2021, 75, 1–14. [Google Scholar] [CrossRef]
- Chapuis, R.P. Fitting Models for a Grain Size Distribution: A Review. Bull. Eng. Geol. Environ. 2023, 82, 427. [Google Scholar] [CrossRef]
- Álvarez Rodríguez, B. Análisis de la Influencia de los Modelos de Distribución de Tamaños de Partículas en la Determinación de Consumos Energéticos en Molienda Mediante el Método Bond. Ph.D. Thesis, Universidad de Oviedo, Oviedo, Spain, 2010. [Google Scholar]
- Angulo-Palma, H.; Guilarte Rodríguez, N.; Legrá, A.; Navarro Consuegra, M.; Hernández-Pedrera, C. Modelación de la distribución de tamaño de menas saprolíticas alimentadas al proceso Caron [Modeling the size distribution of saprolitic ores fed to Caron process]. Tecnol. Química 2024, 44, 91–106. [Google Scholar]
- Zhou, W.; Han, Y.; Li, Y.; Yang, J.; Ma, S.; Sun, Y. Research on Prediction Model of Ore Grinding Particle Size Distribution. J. Dispers. Sci. Technol. 2020, 41, 537–546. [Google Scholar] [CrossRef]
- Otsuki, A.; Jang, H. Prediction of Particle Size Distribution of Mill Products Using Artificial Neural Networks. ChemEngineering 2022, 6, 92. [Google Scholar] [CrossRef]
- Mariano, R.A. Measurement and Modelling of the Liberation and Distribution of Minerals in Comminuted Ores. Ph.D. Thesis, The University of Queensland, Brisbane, Australia, 2016. [Google Scholar]
- Muanpaopong, N.; Davé, R.; Bilgili, E. Impact of Ball Size Distribution, Compartment Configuration, and Classifying Liner on Cement Particle Size in a Continuous Ball Mill. Miner. Eng. 2022, 189, 107912. [Google Scholar] [CrossRef]
- Hilden, M. Simulating the Effect of Mineral Association Using a Multi-Mineral Rock Texture and Liberation Model. In Proceedings of the IMPC 2014—27th International Mineral Processing Congress, Santiago, Chile, 20–24 October 2014; Volume 2, pp. 210–218. [Google Scholar]
- Oxley, A.; Barcza, N. Hydro–Pyro Integration in the Processing of Nickel Laterites. Miner. Eng. 2013, 54, 2–13. [Google Scholar] [CrossRef]
- García, G.G.; Oliva, J.; Guasch, E.; Anticoi, H.; Coello-Velázquez, A.L.; Menéndez-Aguado, J.M. Variability Study of Bond Work Index and Grindability Index on Various Critical Metal Ores. Metals 2021, 11, 970. [Google Scholar] [CrossRef]
- Rosin, P.; Rammler, E. The Law Governing the Fineness of Powdered Coal. J. Inst. Fuel 1933, 7, 29–36. [Google Scholar]
- Schuhmann, J.R. Principles of comminution, I-size distribution and surface calculations. Mining Technol. 1940, 4, l–11. [Google Scholar]
- Ouchterlony, F. The Swebrec© Function: Linking Fragmentation by Blasting and Crushing. Inst. Min. Metallurgy. Trans. Sect. A Min. Technol. 2005, 114, 29–44. [Google Scholar] [CrossRef]
- Domènech, C.; Galí, S.; Villanova-de-Benavent, C.; Soler, J.M.; Proenza, J.A. Reactive Transport Model of the Formation of Oxide-Type Ni-Laterite Profiles (Punta Gorda, Moa Bay, Cuba). Miner. Depos. 2017, 52, 993–1010. [Google Scholar] [CrossRef]
- Tauler, E.; Galí, S.; Villanova-de-Benavent, C.; Chang-Rodríguez, A.; Núñez-Cambra, K.; Khazaradze, G.; Proenza, J.A. Geochemistry and Mineralogy of the Clay-Type Ni-Laterite Deposit of San Felipe (Camagüey, Cuba). Minerals 2023, 13, 1281. [Google Scholar] [CrossRef]
- Mweene, L.; Gomez-Flores, A.; Jeong, H.E.; Ilyas, S.; Kim, H. Challenges and future in Ni laterite ore enrichment: A critical review. Min. Proc. Ext. Met. Rev. 2024, 45, 539–563. [Google Scholar] [CrossRef]
- Farrokhpay, S.; Filippov, L.; Fornasiero, D. Pre-concentration of nickel in laterite ores using physical separation methods. Miner. Eng. 2019, 141, 105892. [Google Scholar] [CrossRef]
- Álvarez Rodríguez, B.; García, G.G.; Coello-Velázquez, A.L.; Menéndez-Aguado, J.M. Product Size Distribution Function Influence on Interpolation Calculations in the Bond Ball Mill Grindability Test. Int. J. Miner. Process 2016, 157, 16–20. [Google Scholar] [CrossRef]


Disclaimer/Publisher’s Note: The statements, opinions and data contained in all publications are solely those of the individual author(s) and contributor(s) and not of MDPI and/or the editor(s). MDPI and/or the editor(s) disclaim responsibility for any injury to people or property resulting from any ideas, methods, instructions or products referred to in the content. |
© 2025 by the authors. Licensee MDPI, Basel, Switzerland. This article is an open access article distributed under the terms and conditions of the Creative Commons Attribution (CC BY) license (https://creativecommons.org/licenses/by/4.0/).