Article

Morphological and Structural Analysis of Pyrolytic Carbon from Simple Thermal Methane Pyrolysis

by
Michał Wojtasik
1,*,
Wojciech Krasodomski
1,
Grażyna Żak
1,
Katarzyna Wojtasik
2 and
Wojciech Pakieła
3
1
Oil and Gas Institute—National Research Institute, Lubicz 25A, 31-503 Cracow, Poland
2
Department of Physics, Cracow University of Technology, ul. Podchorążych 1, 30-084 Cracow, Poland
3
Materials Research Laboratory, Faculty of Mechanical Engineering, Silesian University of Technology, Konarskiego 18A, 44-100 Gliwice, Poland
*
Author to whom correspondence should be addressed.
Appl. Sci. 2025, 15(19), 10742; https://doi.org/10.3390/app151910742
Submission received: 12 September 2025 / Revised: 30 September 2025 / Accepted: 2 October 2025 / Published: 6 October 2025

Abstract

This study presents a comprehensive morphological and structural analysis of carbon materials produced via simple thermal methane pyrolysis conducted under laboratory conditions in a quartz reactor without the use of catalysts. The process, carried out at 1000 °C, achieved moderate methane conversion (36.5%), process efficiency (36.1%), and very high selectivity (98.9%) towards hydrogen production, highlighting its potential as a CO2-free hydrogen generation method. Distinct carbon morphologies were observed depending on the formation areas within the reactor: a predominant flake-like silver carbon formed on reactor walls at temperatures between 600 and 980 °C (accounting for 91% of the solid product) and a minor powdery carbon formed near 980–1000 °C (9% of the solids). The powdery carbon exhibited a high specific surface area (125.3 m2/g), substantial mesoporosity (60%), and porous spherical aggregates, indicating an amorphous structure. In contrast, flake-like carbon demonstrated a low surface area (1.99 m2/g), high structural order confirmed by Raman spectroscopy, and superior thermal stability, making it suitable for advanced applications requiring mechanical robustness. Additionally, polycyclic aromatic hydrocarbons were detected in cooler zones of the reactor, suggesting side reactions in low-temperature areas. The study underscores the impact of temperature zones on carbon structure and properties, emphasizing the importance of precise thermal control to tailor carbon materials for diverse industrial applications while producing clean hydrogen.

1. Introduction

The transition to a hydrogen economy is expected to take place in the coming decades, resulting in a strong increase in demand for this gas. Some sources report that demand for H2 will increase as much as tenfold by 2050 [1], and the structure of its use will also change, so it is necessary to change the current energy system, which involves developing a new alternative source of this gas. Although electrolysis appears to be an excellent method for hydrogen production, its high energy consumption [2] and the use of pure water resources [3,4] mean that new approaches to hydrogen generation are still being sought. Another promising source for hydrogen production is biomass [5,6,7], the fermentation of which leads to bioethanol, which can then be reformed to produce hydrogen, but the main drawback of this method is the rapid deactivation of the catalysts used in it and the presence of other competing reactions that reduce the selectivity of hydrogen, which impose serious limitations on this technology [8]. Currently, among the possible hydrogen production technologies, methane decomposition (pyrolysis) seems to be one of the more promising directions [9,10,11].
The biggest advantage of methane pyrolysis method is that there is no need for CO2 capture and storage (sequestration), which greatly simplifies the process and brings the economic cost of producing hydrogen by this method closer to the cost of producing it from steam reforming [12,13].
The decomposition of methane follows Equation (1).
C H 4 C + 2 H 2 h 0 = 74.85   k J m o l
The reaction is initiated by the formation of the free radicals CH4 → CH3* + H*, which dominates the kinetics of the C-H bond cleavage reaction (dissociation energy: 434.72 kJ/mol), which requires, as already mentioned, high temperatures [14]. It can be noted that above 1273 K (1000 °C) it is theoretically possible to almost completely convert methane to hydrogen, despite the fact that thermal decomposition of methane begins at 527 °C [15].
Methane pyrolysis is typically carried out using metallic [16,17,18] or carbon-based catalysts [19]; however, catalysis in this process remains the greatest challenge. This is primarily due to the rapid deactivation of catalysts, which occurs as carbon deposits accumulate on their surfaces. The regeneration of catalysts leads to CO2 emissions—consequently, the pyrolysis method loses its main advantages in the context of climate change mitigation. One partial compromise involves the use of liquid catalysts as liquid alloys or metals [20,21]. Nevertheless, their application requires advanced materials that are resistant to liquid metals, which presents a significant technological challenge [22]. Another approach is plasma heating [23,24], yet this technique is characterized by very high capital expenditures (CAPEX) [24], which reduces the attractiveness of the method for investors.
Also, Kim et al. [25] carried out a comprehensive analysis of the thermal plasma-assisted pyrolysis of methane, including thermodynamic calculations and experimental studies of hydrogen and soot formation. Other reports have also addressed the application of the thermal method of methane pyrolysis [26,27,28,29]. A rather interesting method of methane pyrolysis involves the use of microwave plasma operating at atmospheric pressure [30,31,32,33,34]. Atmospheric pressure microwave plasma is one of the plasma techniques that provide electron temperatures in the range of 4000–10,000 K, and heavy particle temperatures in the range of 2000–6000 K [32,34]. Most authors conclude that the main advantage of using thermal plasma for methane pyrolysis is the production of carbon black, carbon nanotubes, graphene and other carbon structures of high quality, with the possibility of changing their parameters. On the other hand, using it to produce hydrogen, due to the presence of acetylene as a by-product, may not be cost-effective.
If hydrogen is obtained by this process on an industrial scale in the future, large quantities of carbon will be produced, so the development of new applications for carbon is a key factor in the implementation of this technology as a viable method for hydrogen production. The possible applications of carbon will depend on its nature and properties [35,36].
Carbon exhibits diverse polymorphic forms (allotropes), each with distinct structural, physical, and chemical properties. The most well-known allotropes include graphite and diamond, which differ significantly in their atomic arrangement, hardness, electrical conductivity, and thermal stability. Graphite is composed of hexagonal layers of strongly bonded carbon atoms arranged in a planar structure with weak van der Waals forces between layers, making it soft and electrically conductive. Diamond, on the other hand, features a tetrahedral lattice with strong sp3 covalent bonds, leading to exceptional hardness and thermal conductivity.
Beyond these classical forms, other important carbon structures have been extensively studied, particularly in materials science and nanotechnology. Turbostratic carbon is a disordered variant of graphite characterized by rotational misalignment and random stacking of graphene layers. This results in increased surface defects and reactivity compared to well-ordered graphite, making turbostratic carbon useful in catalysis and adsorption applications [37,38]. Carbon fullerenes, including spherical C60 molecules, carbon nanotubes, and graphene sheets, form distinct nanostructures with extraordinary electrical, mechanical, and chemical properties [39]. Amorphous carbon materials, lacking a long-range ordered structure, also constitute a broad class of carbons with varying degrees of graphitic character and porosity, often formed under rapid cooling or non-equilibrium synthesis conditions [40].
The synthesis method and conditions, such as temperature, pressure, and catalysts, critically influence which form of carbon is produced, along with its morphology and physicochemical properties. For example, pyrolysis of methane at high temperatures can yield amorphous carbons, turbostratic carbons, or graphitic structures depending on precise reactor conditions [41,42,43]. Thermal stability also varies accordingly, with materials like turbostratic carbon exhibiting lower thermal stability relative to crystalline graphite due to their disordered stacking and higher defect density [44].
The formation of carbonaceous materials during methane pyrolysis is a complex mechanism. The structure of the carbon formed depends on the temperature of the process and the presence of the catalyst. Table 1 shows the dependence of the carbon structure on the process temperature and used catalysts [45].
Nickel-based catalysts have attracted the attention of most researchers in the field due to their high catalytic activity and ability to produce carbon fibers (CFs) or carbon nanotubes (CNTs) at moderate temperatures (500–700 °C) [38]. Fe-based catalysts are effective in a slightly higher temperature range, and are also capable of catalyzing the formation of CNTs [46,47,48]. The main feature of the catalytic action is that the metal catalyst molecules are located on top of the growing CNTs and are mostly removed from the support (this can result in unwanted consumption of expensive metals, such as Ni). Catalyst deactivation occurs when the metallic particles are surrounded by unreactive graphite layers. Metal-catalyzed decomposition of methane can also lead to the formation of other forms of carbon, including graphitic, turbostratic and carbide carbon, which usually occurs at elevated temperatures and is accompanied by rapid catalyst deactivation due to blocking of its active centers by carbon deposits. At temperatures above 1000–1100 °C, non-catalytic (homogeneous) decomposition of methane is the predominant reaction pathway leading to the formation of various forms of amorphous carbon, e.g., soot, thermal soot.
Despite the above information, the fact that different types of carbon can form during a single process, which obviously depends on the temperature, is often overlooked in the literature. This is related to the inability to instantly heat the feedstock stream in flow-through techniques and the wide range of methane decomposition.
Despite the existence of many different methods, the classical thermal technique appears to be the simplest, requiring the lowest CAPEX and having a low impact on the climate. Another advantage of this solution is the possibility of obtaining pure carbon, free from catalyst contamination, with many potential applications.
So far, the authors are not aware of any comprehensive studies on the structure of carbons obtained through a simple thermal process. This article focuses on the assessment of such carbons produced in the laboratory. Several different types of carbons were identified, and these were characterized both qualitatively and quantitatively.

2. Materials and Methods

2.1. Pyrolysis Process

Methane pyrolysis (Air Product, Cracow, Poland methane purity: 99.99%) was performed in a quartz reactor with a cylindrical shape of 1200 mm in length, an inner diameter of 85 mm and a wall thickness of 4 mm. The tube was placed in a glass furnace model PRW 120 × 600/110 MR with a power of 3.6 kW (Czylok, Jastrębie-Zdrój, Poland). The reactor was closed on two sides with sealed and cooled heads (Figure 1). The flow rate of the reaction and process gas was set at 200 NmL/min for nitrogen and 200 NmL/min for methane. The addition of nitrogen to the methane feedstock serves primarily as an inert diluent to control reaction to prevent process instability or unwanted side reactions. According to Le Chatêlieŕs Principle, use of nitrogen as a diluent improves overall process efficiency by reducing the partial pressure of the reactive feedstock (methane), which helps moderate reaction rates and limits undesired phenomena such as hotspot formation. The concentration of nitrogen in the feed was selected experimentally to optimize these effects and process performance.
Details of the feed composition phenomena are described comprehensively in [49].
The process was carried out at 1000 °C for 2 h. Gas was periodically sampled into Tedlar bags and analyzed with regard to its methane, hydrogen, nitrogen and oxygen concentration using a 7890B gas chromatograph (Agilent Technologies, Santa Clara, CA, USA), equipped with a 1 mL loop valve-type dispenser and a TCD thermal-conductivity detector. A 25 m × 0.53 mm PLOT Fused Silica Molsieve 5A chromatography column was used (Agilent Technologies). The chromatograph thermostat was operated under isothermal conditions at 180 °C, with a carrier gas (helium) flow rate of 10 NmL/min. Calibration of the system was performed using gas standard mixtures (Multax s.c., Stare Babice, Poland) and single gas standards. The response coefficients of the TCD thermal-conductivity detector for individual gases were determined.
The concentrations of individual gases are obtained from the chromatogram by integrating the area under the peaks corresponding to each gas component. These peaks are first identified by their characteristic retention times based on calibration with standard gases. The detector signal (in this case from the TCD detector) is proportional to the amount (mole or volume fraction) of each gas. Thus, by comparing the integrated peak areas of the sample with those of known standards or calibration curves, the concentration of each gas in the mixture can be quantitatively determined.

2.2. SEM

Imaging of the structures of the carbons formed in the process of methane decomposition was performed by SEM. They used a Supra 35 microscope (Zeiss, Oberkochen, Germany) at accelerating voltages in the range of 2 to 10 kV. The microscope was equipped with an EDS detector.

2.3. Raman Spectroscopy

Raman spectroscopy was used using a Renishaw InVia instrument (Renishaw, Gloucestershire, UK) equipped with a laser with a wavelength of 514 nm.

2.4. NMR

Nuclear magnetic resonance spectra were performed on an Avance III 600 MHz NMR spectrometer (Bruker, Karlsruhe, Germany). Proton 1HNMR (16 scans) and carbon 13CNMR (1024 scans) nuclear resonance spectra were performed at 25 °C. Samples for the study were dissolved in deuterated chloroform (~30 mg sample per 1 mL of solvent). The spectra were prepared (phase determination, integration) using standard Bruker software (Mnova NMR version 16.0.0).

2.5. IR

IR spectra were recorded using a Nicolet iS 10 FTIR spectrometer (Thermo Fisher Scientific, Waltham, MA, USA). The apparatus was equipped with an ATR attachment. Measurements were performed without sample preconditioning for wavenumbers in the range of 500 cm−1 to 4000 cm−1. The spectra were prepared (baseline, correction) using standard software from Thermo Fisher (OMNIC Software Suite version 8.2).

2.6. Textural Studies

For textural studies, Anton Paar’s NOVA 800 gas sorption apparatus was used (Anton Paar, Graz, Austria). The characteristics of the porous texture were determined on the basis of isotherms of low-temperature adsorption and desorption of nitrogen at a temperature of −196 °C. The analysis was carried out in a wide range of relative pressures from approx. 1.03 to 0.99.
The following porous texture parameters were calculated for the tested samples:
  • Specific surface area according to the Brunauer–Emmet–Teller (BET) methodology.
  • Total pore volume Vt for a relative pressure of 0.99.
  • Volume of Vmez mesopores (pores with a width greater than 2 nm and less than 50 nm) by DFT.
Before the measurement, the sample was heated under vacuum at 105 °C for 12 h.

2.7. TGA

The method for evaluating the thermodynamic stability of the resulting carbons by TGA was carried out in a Mettler Toledo TGA/DSC1 gravimetric analyzer (Mettler-Toledo International Inc., Greifensee, Switzerland). Carbon samples were placed in a 150 μL ceramic crucible so that the filling comprised about 2/3 of the volume. The samples were then heated in an air flow at a total flow rate of 60 mL/min until the temperature reached 900 °C with a temperature build-up rate of 10 °C/min.

3. Results

3.1. Methane Pyrolysis

The typical composition of the post-process gas is shown in Table 2.
The presence of hydrocarbons with three or more carbon atoms has not been identified in the gas. The methane pyrolysis process using an simple installation made by us was carried out with medium conversion and efficiency, as well as with very high selectivity
Table 3 contains the results of methane conversion and the efficiency and selectivity of the process calculated according to Formulas (2)–(4).
C o n v e r s i o n ,   % = p r o d u c t s   c o n c . s u b s t r a t e   c o n c . · 100 %
E f f i c i e n c y ,   % = h y d r o g e n   c o n c . s u b s t r a t e   c o n c . · 100 %
S e l e c t i v i t y ,   % = E f f i c i e n c y C o n v e r s i o n · 100 %
As expected, the efficiency and efficiency of the thermal process is relatively low—these parameters amounted to about 36%. However, the selectivity of the process was very high, which is due to the presence of only small amounts of other products such as acetylene and others in the gas.
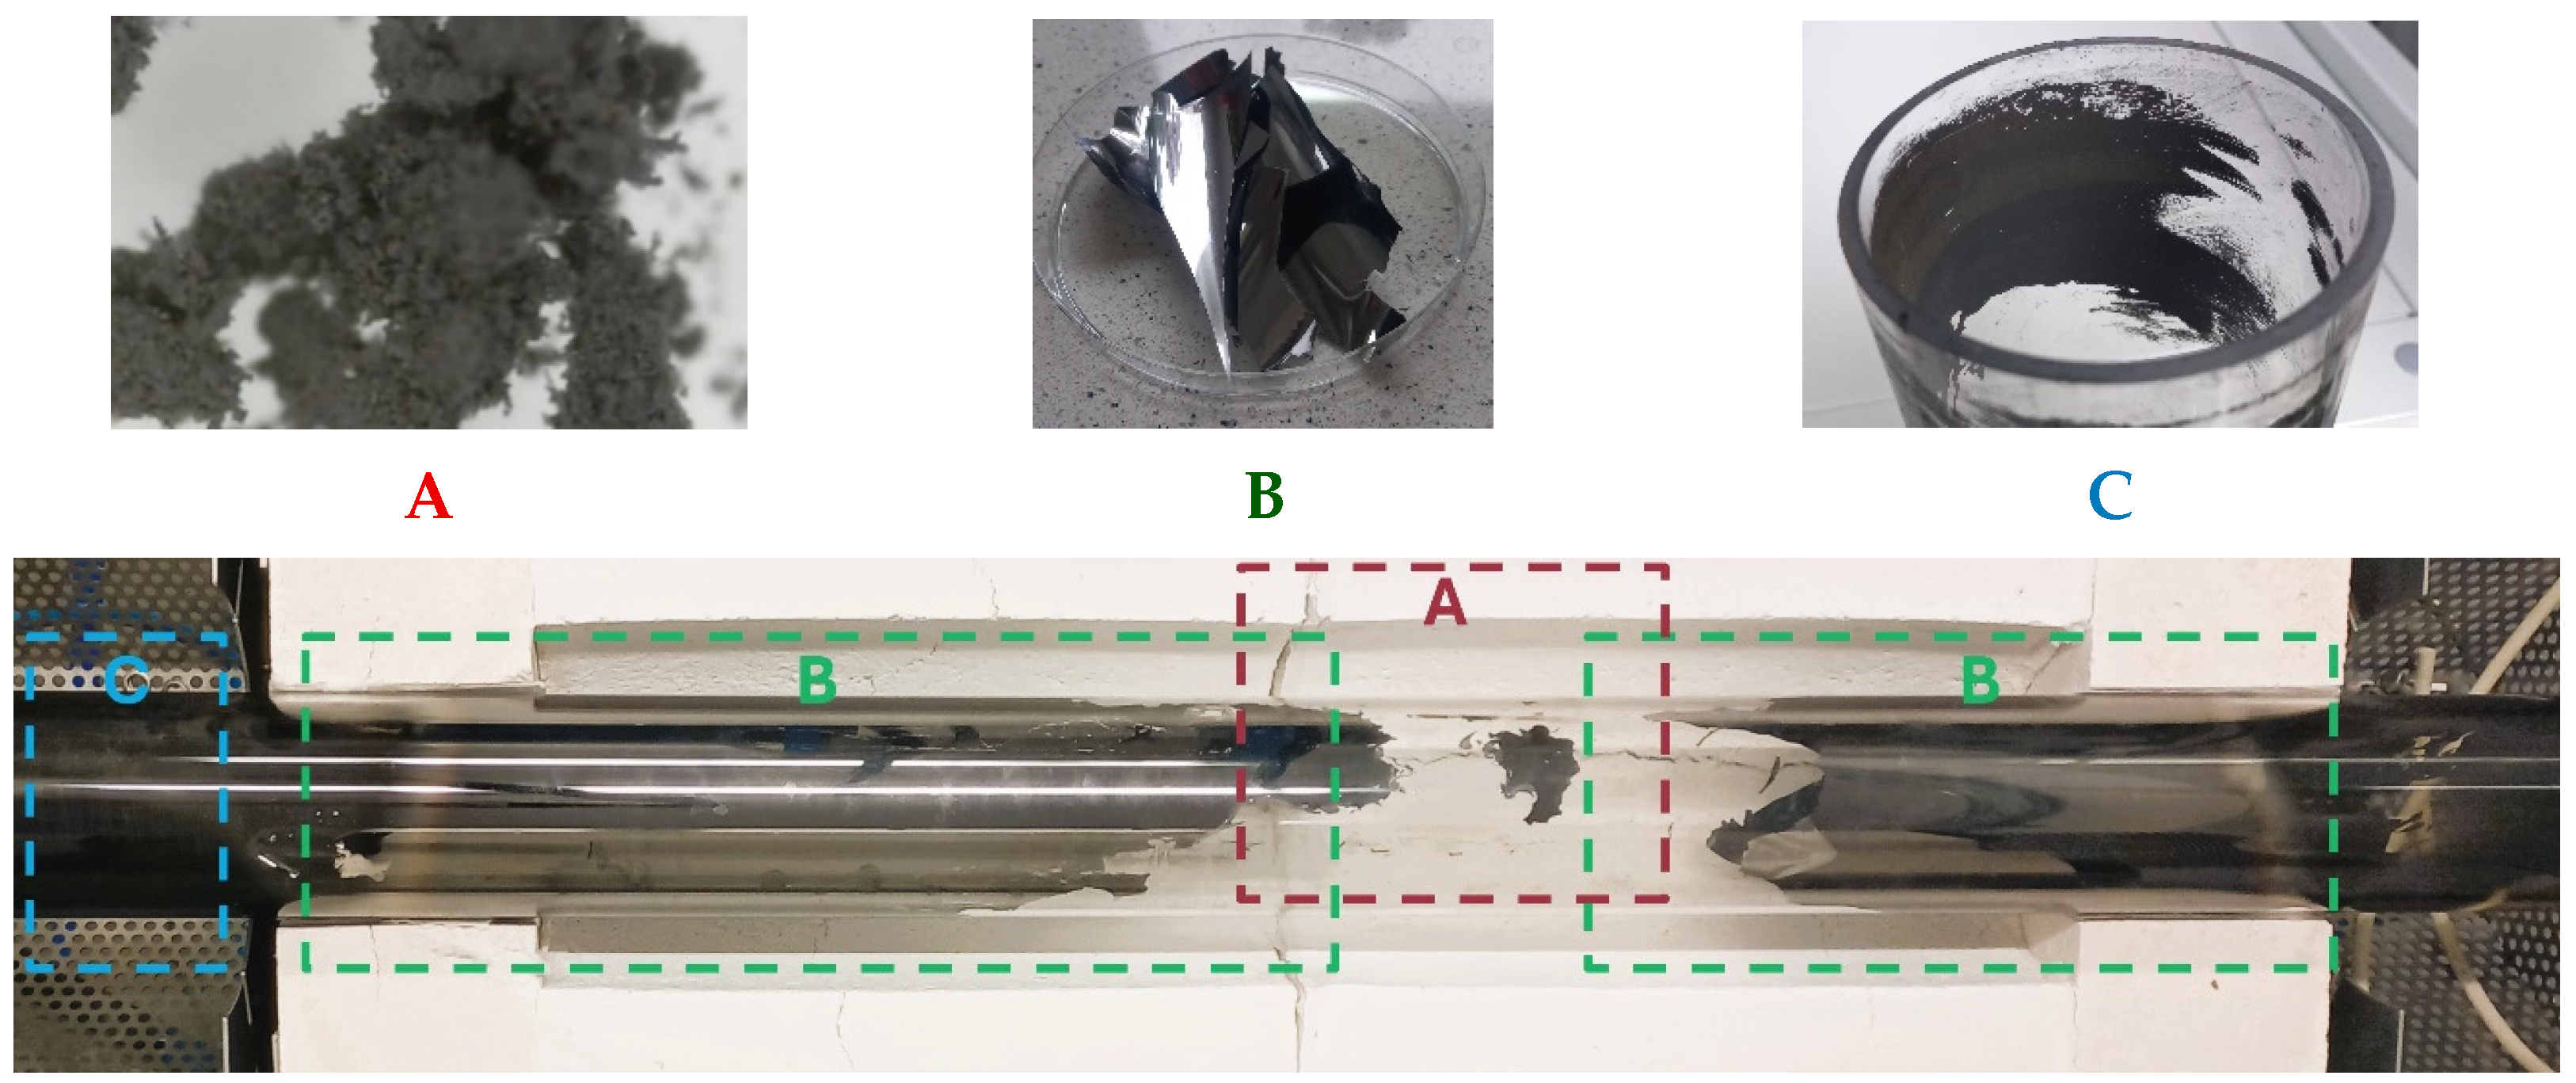
In addition to the gaseous products, carbon with a varied structure was formed in the process, depending on the place of its formation. Figure 2 shows the areas where carbon is deposited.
The main solid product was carbon with a characteristic flake structure and silver color (Figure 2—area B). It was mainly formed on the reactor walls, and its mass fraction in the solid products was about 91%. Small amounts (about 9% mas.) of carbon in the form of black powder were formed almost in the middle area of the reactor (Figure 2—area A). Additionally, small amounts of black greasy deposit settled at the entry of the reactor (not included in the balance) (Figure 2—area C). However, this carbon mass balance should be treated as an estimated because some carbon adhered strongly to the reactor walls, and the smallest fractions likely also migrated out with the post-reaction gases. Additionally, carbon from area C was not included in the balance due to difficulties in recovery.
Regarding the boundary between the carbon fractions, it is not sharp. We found both carbon A in zone B and carbon B in zone A, but their concentrations were low.
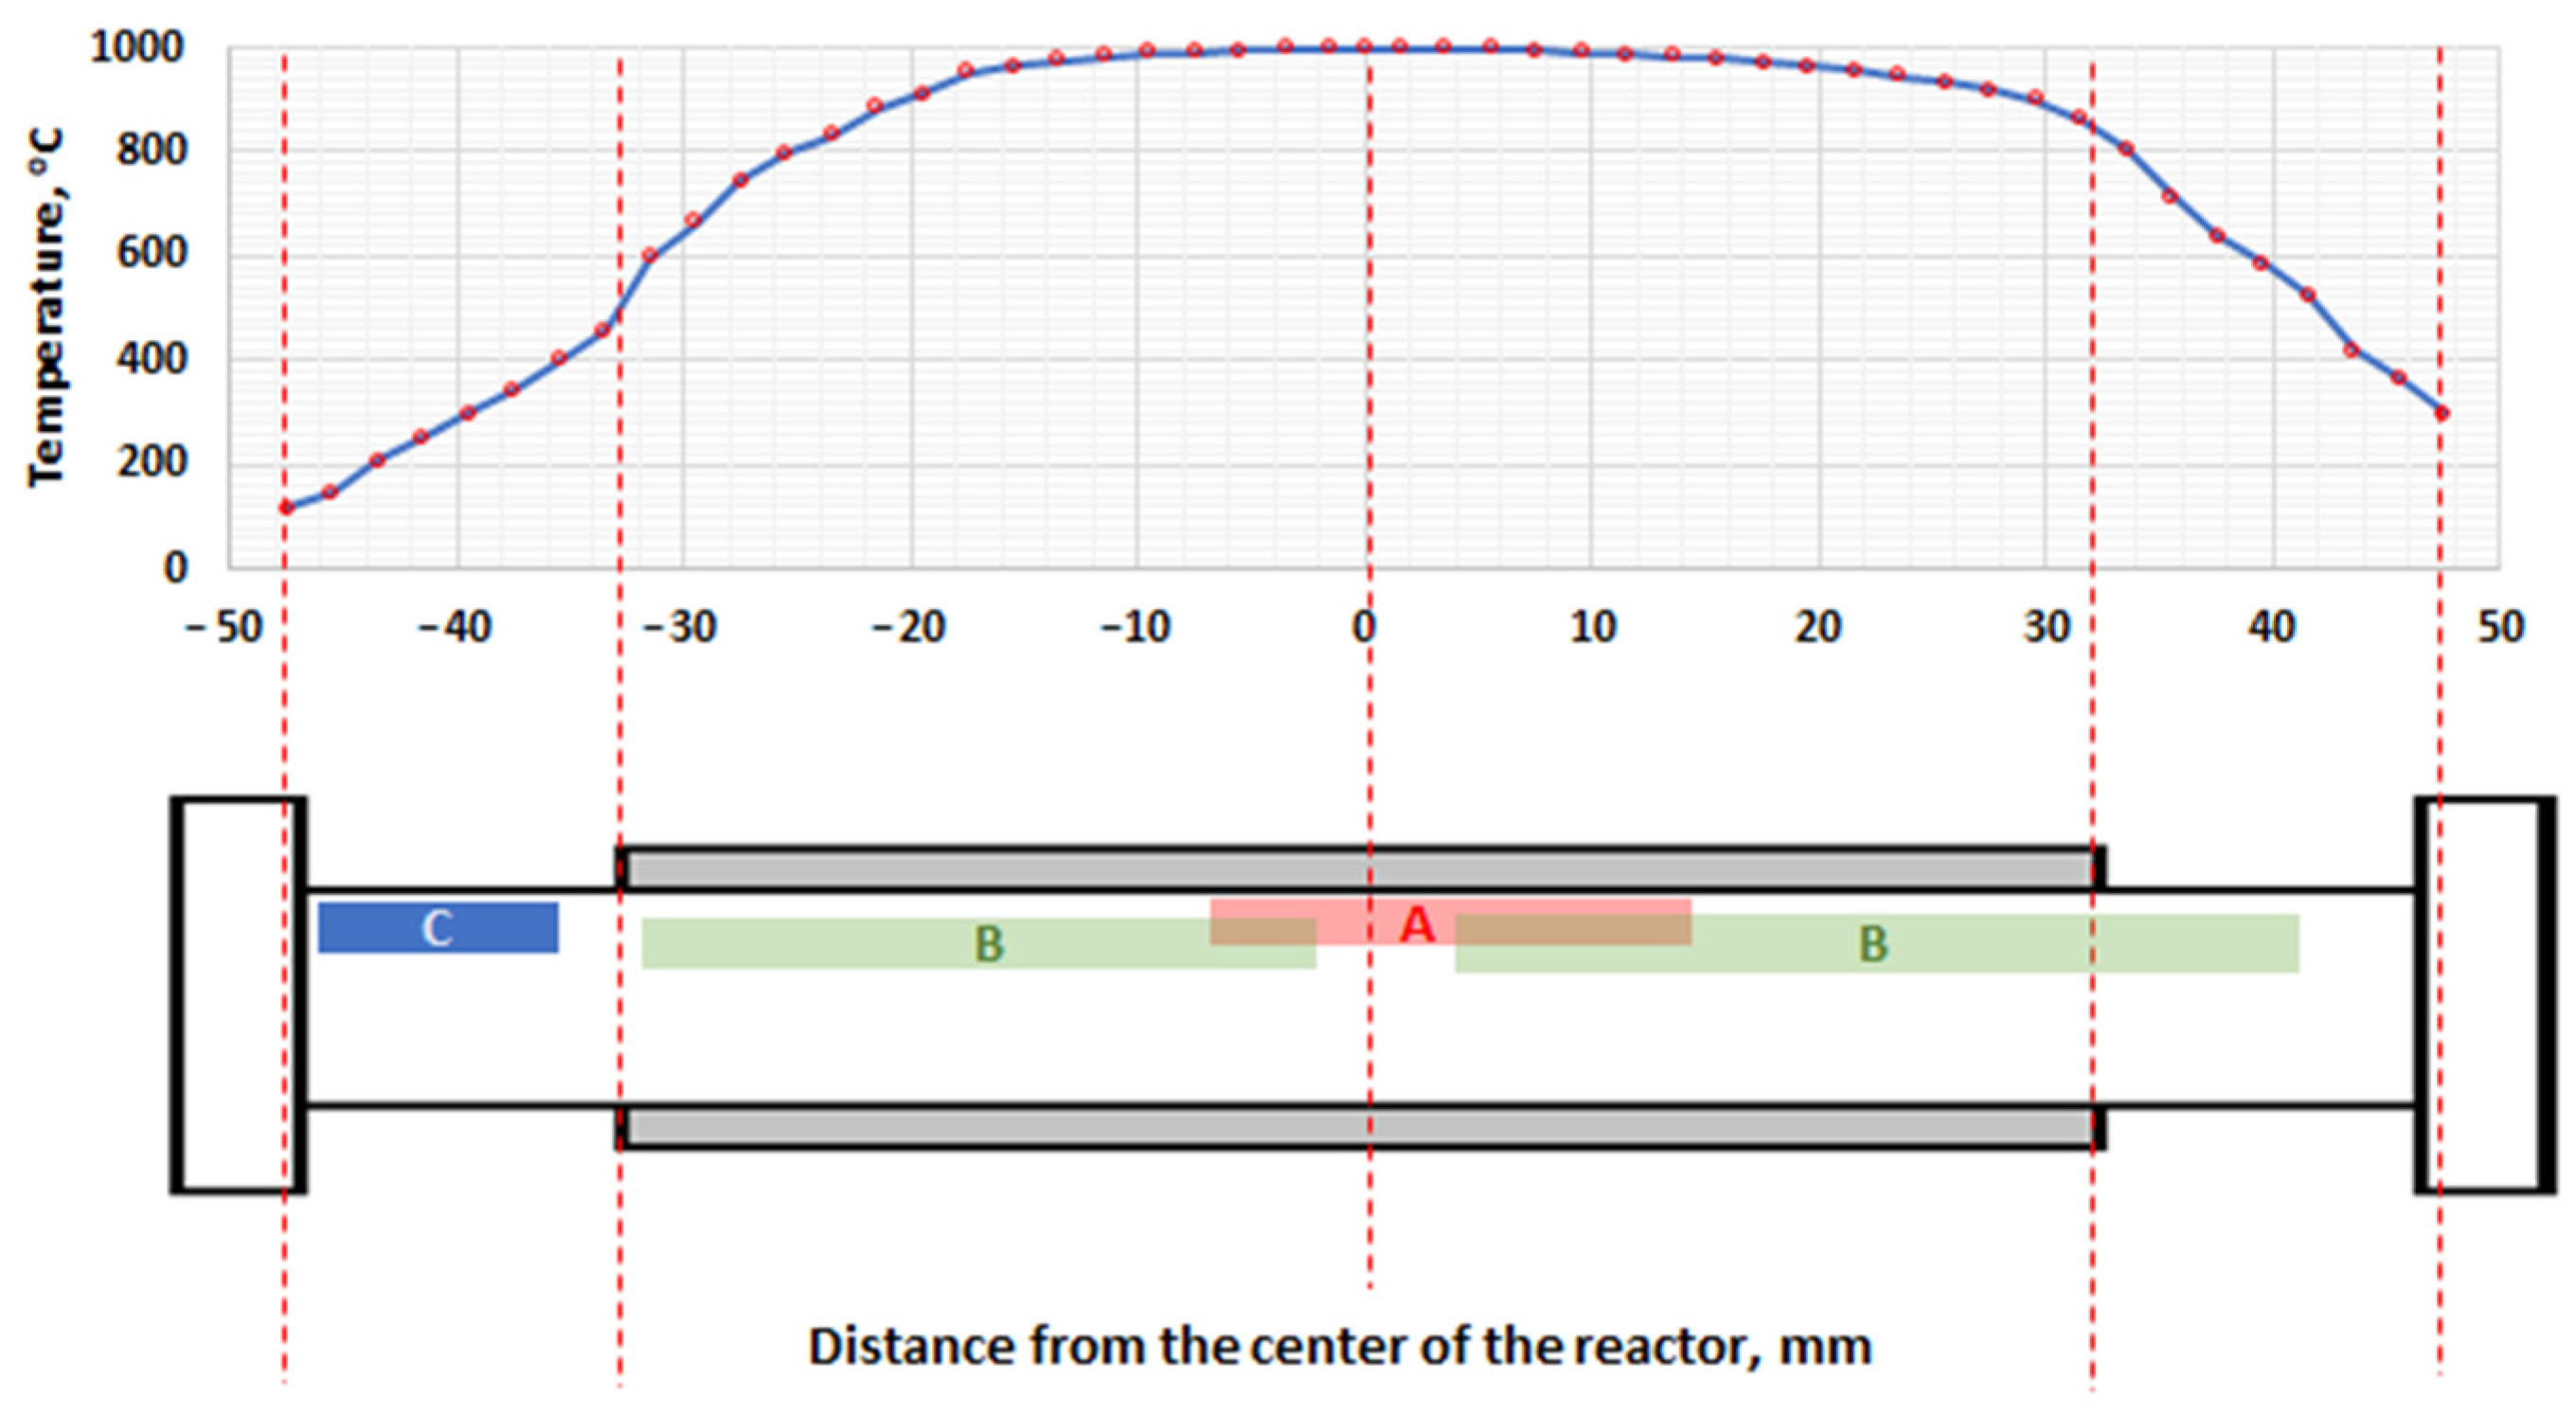
The occurrence of particular forms of carbon is strictly related to the temperature prevailing in specific areas. In Figure 3, the identified areas A, B, and C have been marked on the reactor’s temperature profile.
Carbon in the form of powder (area A) was mainly formed in the zone where the temperature was within the narrow range of 980–1000 °C. Flake-like carbon developed in areas (B) where the temperature ranged between 600 and 980 °C, while area C (carbon deposit) was formed in the unheated regions of the reactor, near the gas inlet, where the temperature was below 400 °C.
The material from area C appeared as a greasy deposit that strongly adhered to the reactor walls. Due to the small amount of this deposit and the technical difficulties related to its strong adhesion to the reactor surface, it was not possible to perform more extensive analyses such as SEM, BET, or TGA.
Because of suspicions regarding the nature of the material from area C, it was decided to analyze it using other methods, namely infrared spectroscopy (IR) and nuclear magnetic resonance (NMR). These analyses fully confirmed the distinctly different nature of carbons A and B compared to material C.

3.2. SEM

Carbon from area A forms spherical structures with diameters of up to 1 µm. These spheres agglomerate into larger assemblies, giving rise to doughnut-shaped structures. At high magnification, inclusions with sizes of several nanometers can be observed (Figure 4).
B-zone carbon forms flat lamellar quasi two-dimensional structures that are difficult to image. At high magnifications, it was observed that the lamellae do not have a uniform structure and are covered with irregular holes ranging in size from a few to several hundred nm across the surface. (Figure 5).
EDS analysis showed that the structures are composed of carbon only, while the admixtures and inclusions consist of carbon, silicon, oxygen, aluminum, sodium and small amounts of magnesium, calcium and potassium. Images of admixtures can be characteristic of glass particles, which can come from the quartz reaction chamber.

3.3. Raman Spectroscopy

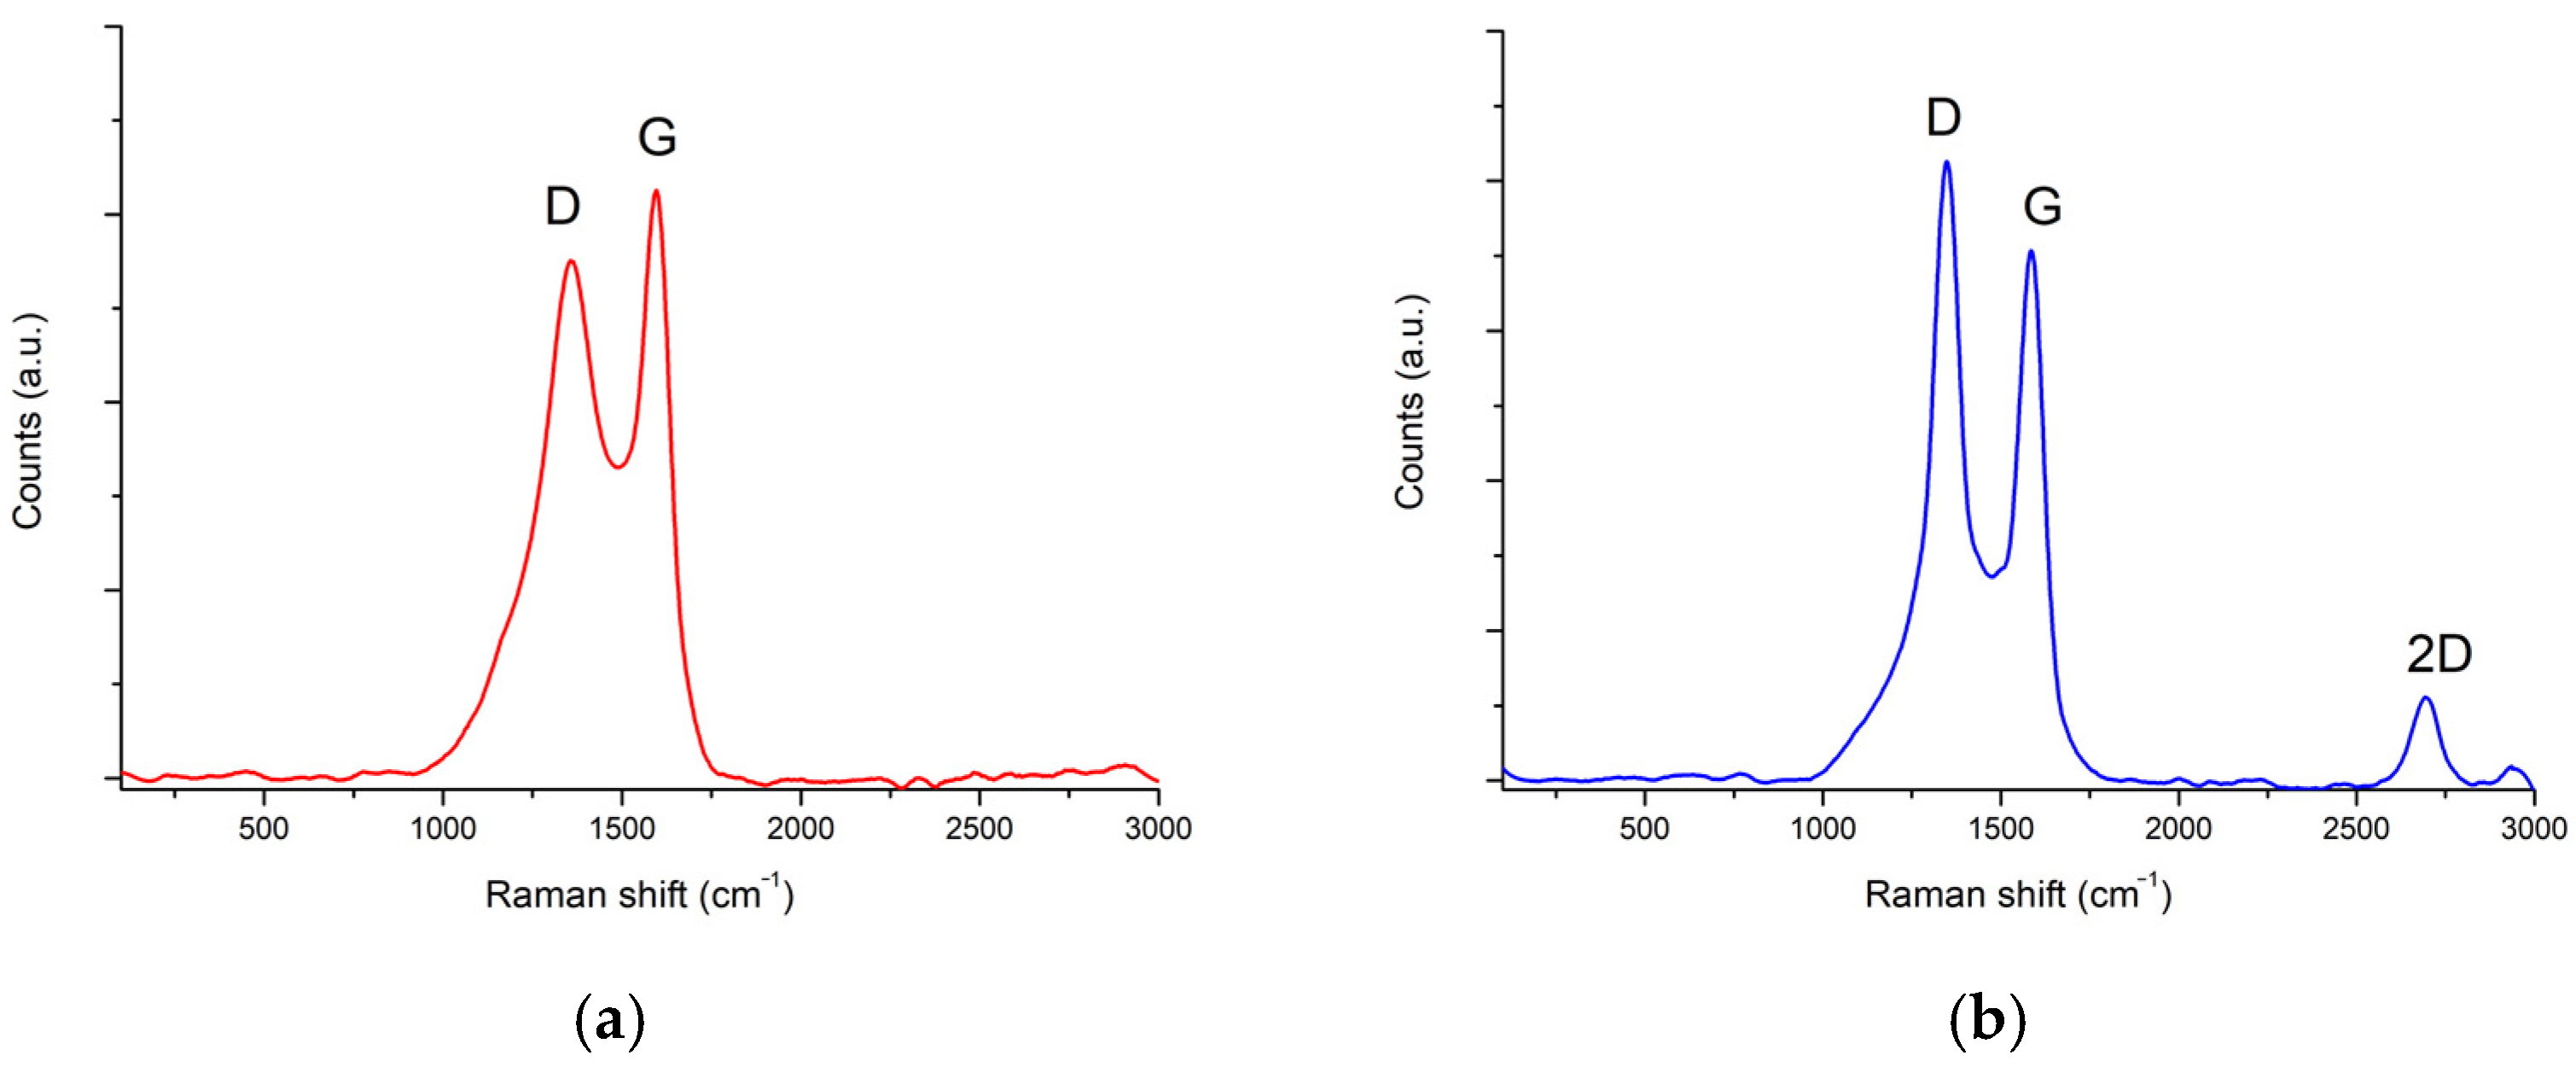
In order to approximate the morphology of the carbons produced in the process, Raman spectra were performed. Spectra were recorded at three different measurement points for each sample. Figure 6 presents the obtained spectra.
The Raman spectra recorded for the two carbon samples show key differences related to crystallinity, defect density, and graphitic structure. Both spectra exhibit pronounced D and G bands, characteristic of carbon materials (D ~1350 cm−1, G ~1580 cm−1), but their relative intensities and the presence of the 2D band reflect distinct structural characteristics.
For Sample from area A (Figure 6a), the spectrum reveals strong D and G bands, while the 2D band is absent or negligible. This feature indicates that the material is primarily amorphous carbon or poorly ordered graphite, with a high degree of structural disorder and numerous defects, as evidenced by the significant intensity of the D band. The moderate IG/ID ratio points to the presence of some ordered graphitic domains but that disorder and amorphous regions dominate the sample’s structure.
Sample from area B (Figure 6b) displays strong D and G bands alongside a distinct, sharp 2D band positioned around 2700 cm−1. The presence and shape of the 2D band are indicative of more ordered graphitic or graphene-like structures, potentially involving multilayer graphene domains. This feature, in conjunction with comparable D and G band intensities, confirms the coexistence of structural defects with an increased degree of graphitization, relative to Sample A. The measurable 2D band suggests improved crystalline ordering and a transition toward multilayer graphitic stacking.
In summary, carbon from area A corresponds to amorphous or highly defective graphite, lacking crystalline graphitic signatures, while carbon from area B demonstrates enhanced graphitization and layer ordering, evident by the emergence and development of the 2D band.

3.4. IR Study

Figure 7 shows the FTIR-ATR spectra of the carbon from area A (blue line) and sediment sample collecting from area C—red line. The FTIR spectrum of carbon from area A lacks characteristic bands for organic groups, which indicates the structural purity of obtained carbon. Carbon from area B presents the same spectrum as carbon from area A.
The FTIR-ATR spectrum from area C shows the presence of bands in the range of 3000–2850 cm−1, bands ca. 1455 cm−1 and ca. 1377 cm−1 and ca. 750 cm−1, while the absence of band ca. 722 cm−1 which indicates the presence of hydrocarbon structures with short carbon chains, and bands ca. 3040, 1915, 1785, 1732 (supertones), 1596, 1491, 878, 841, 750 cm−1 indicating the presence of a significant amount of aromatic structures present in the sample. Two bands around 3360 and 3190 cm−1 are difficult to assign. After a search of the spectral data, it was found that such a band pattern is observed for 9-fluorenol, for example.
This confirms the hypothesis of the presence of polycyclic aromatic structures in the sample, and at the same time it indicates the possibility of the appearance of small amounts of oxygen structures, suggesting the presence of trace amounts of oxygen in the gas introduced for pyrolysis.

3.5. NMR Study

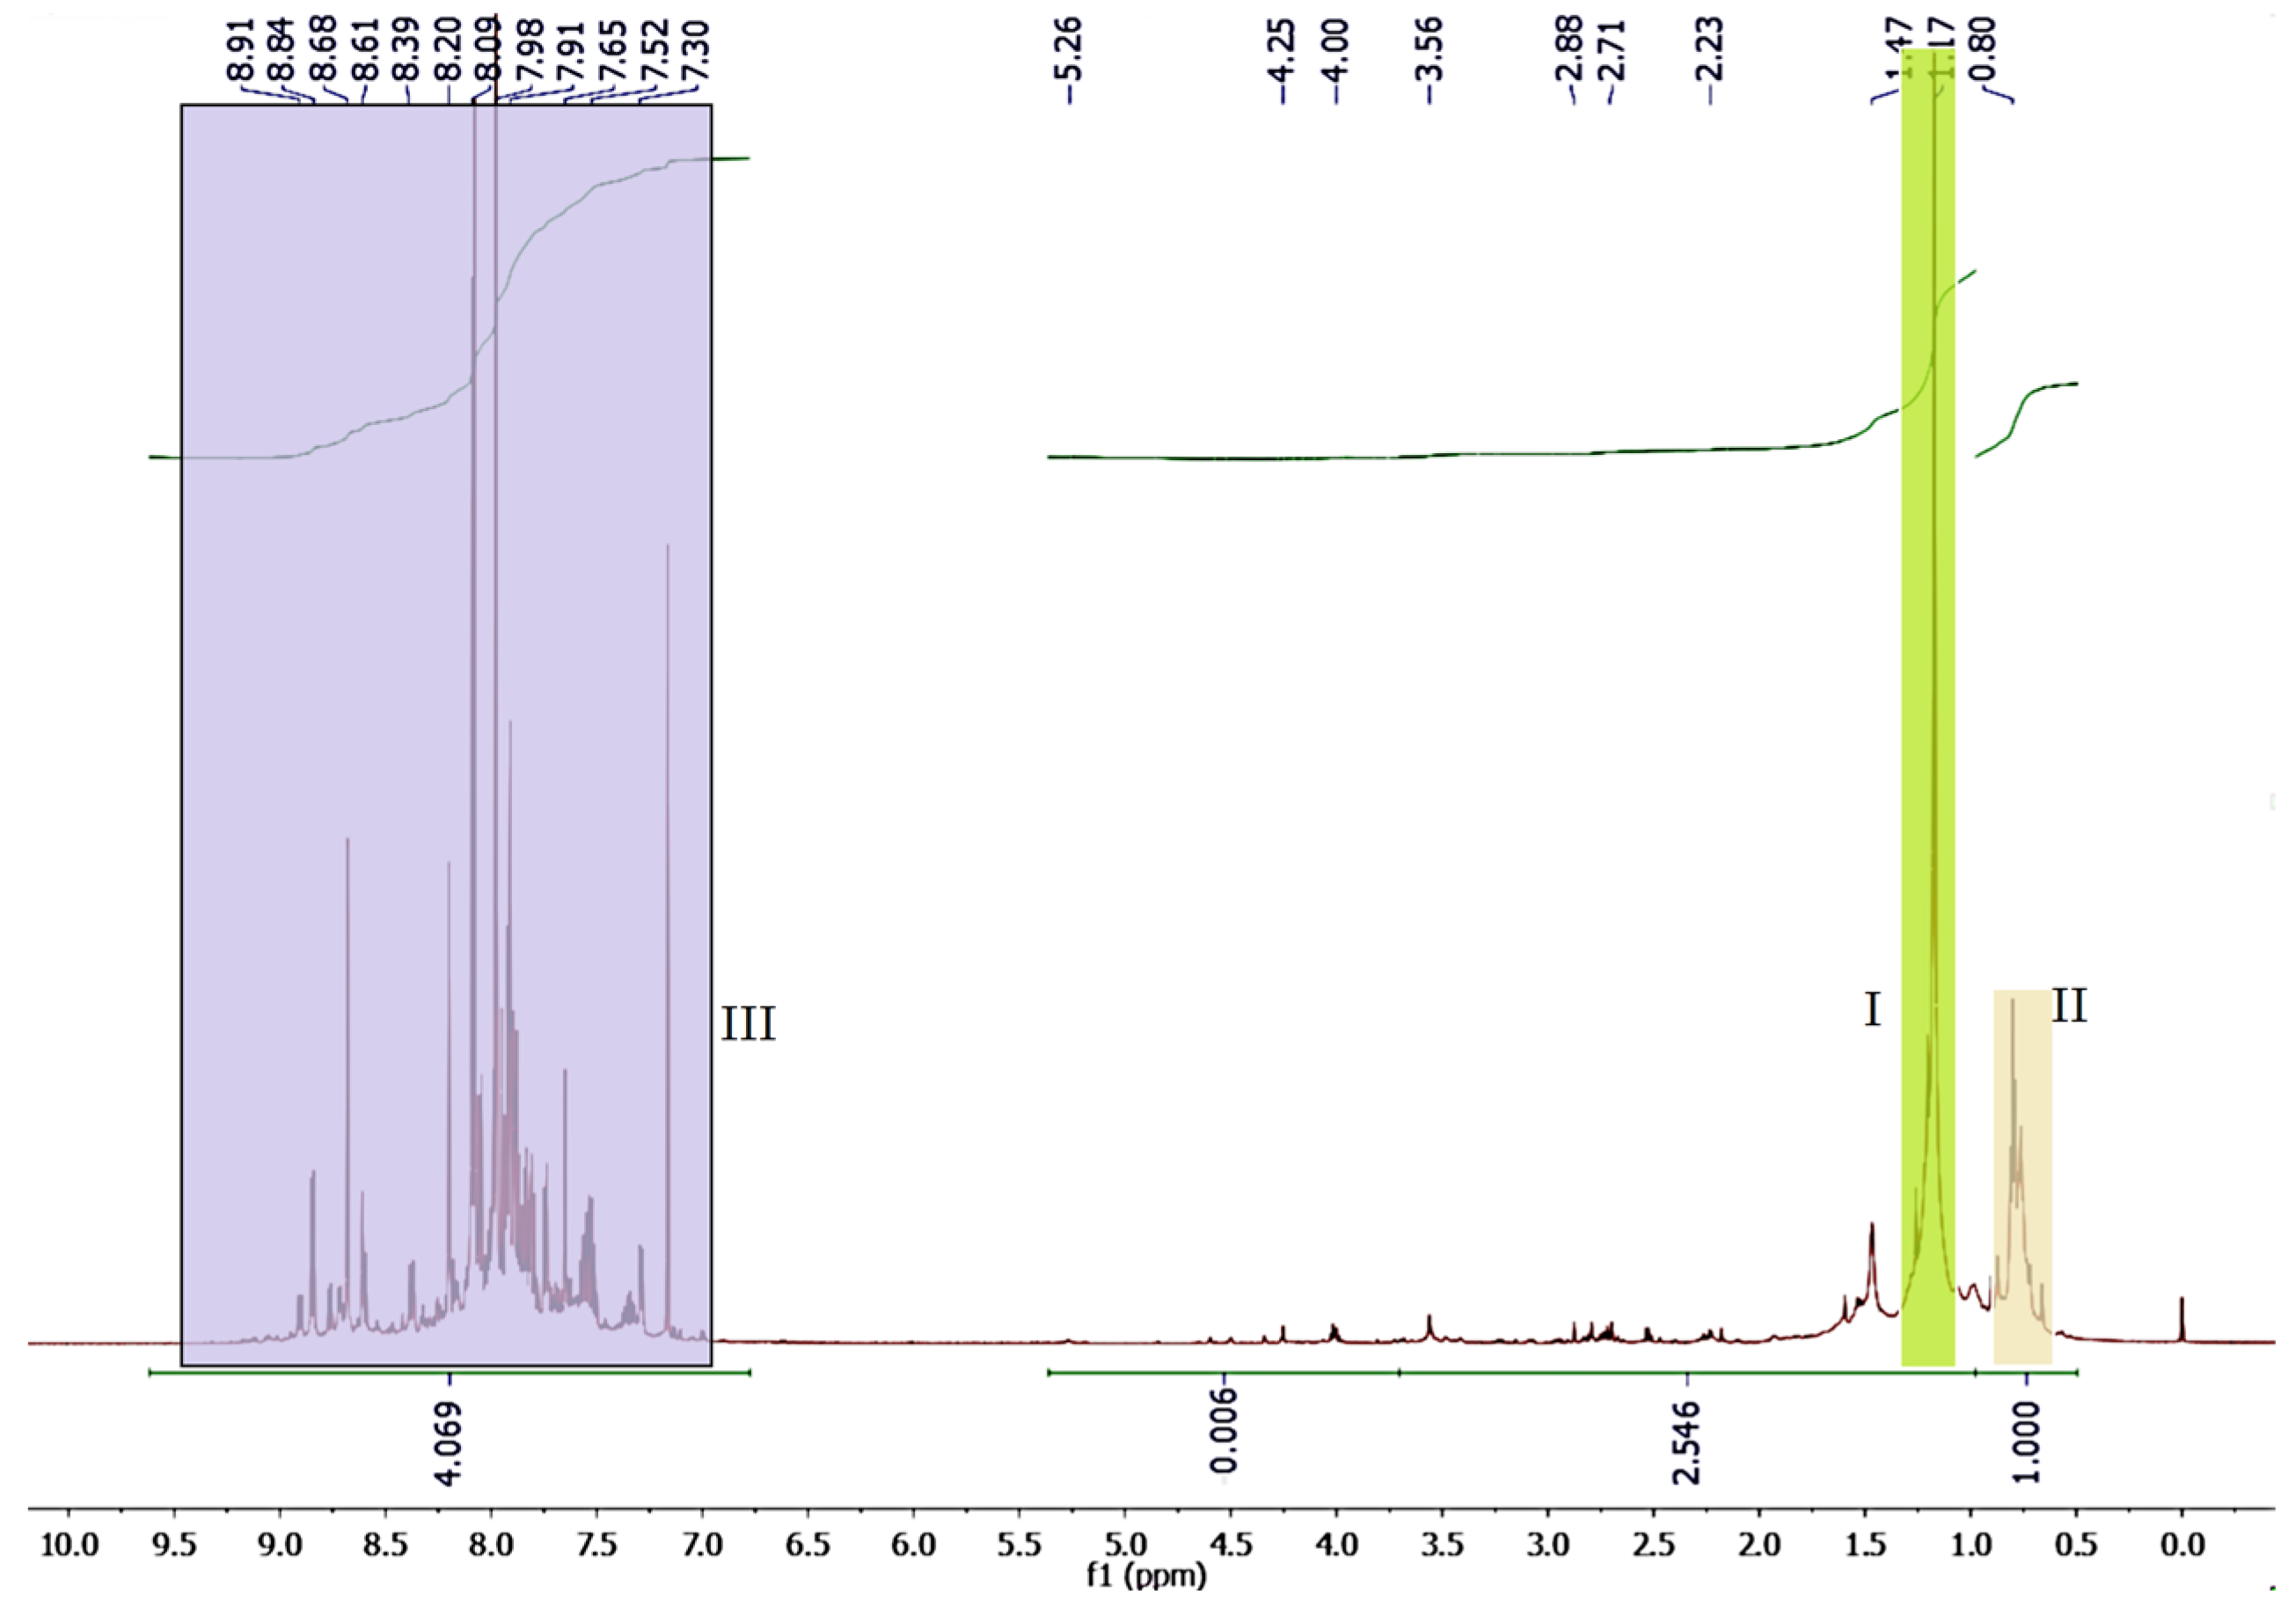
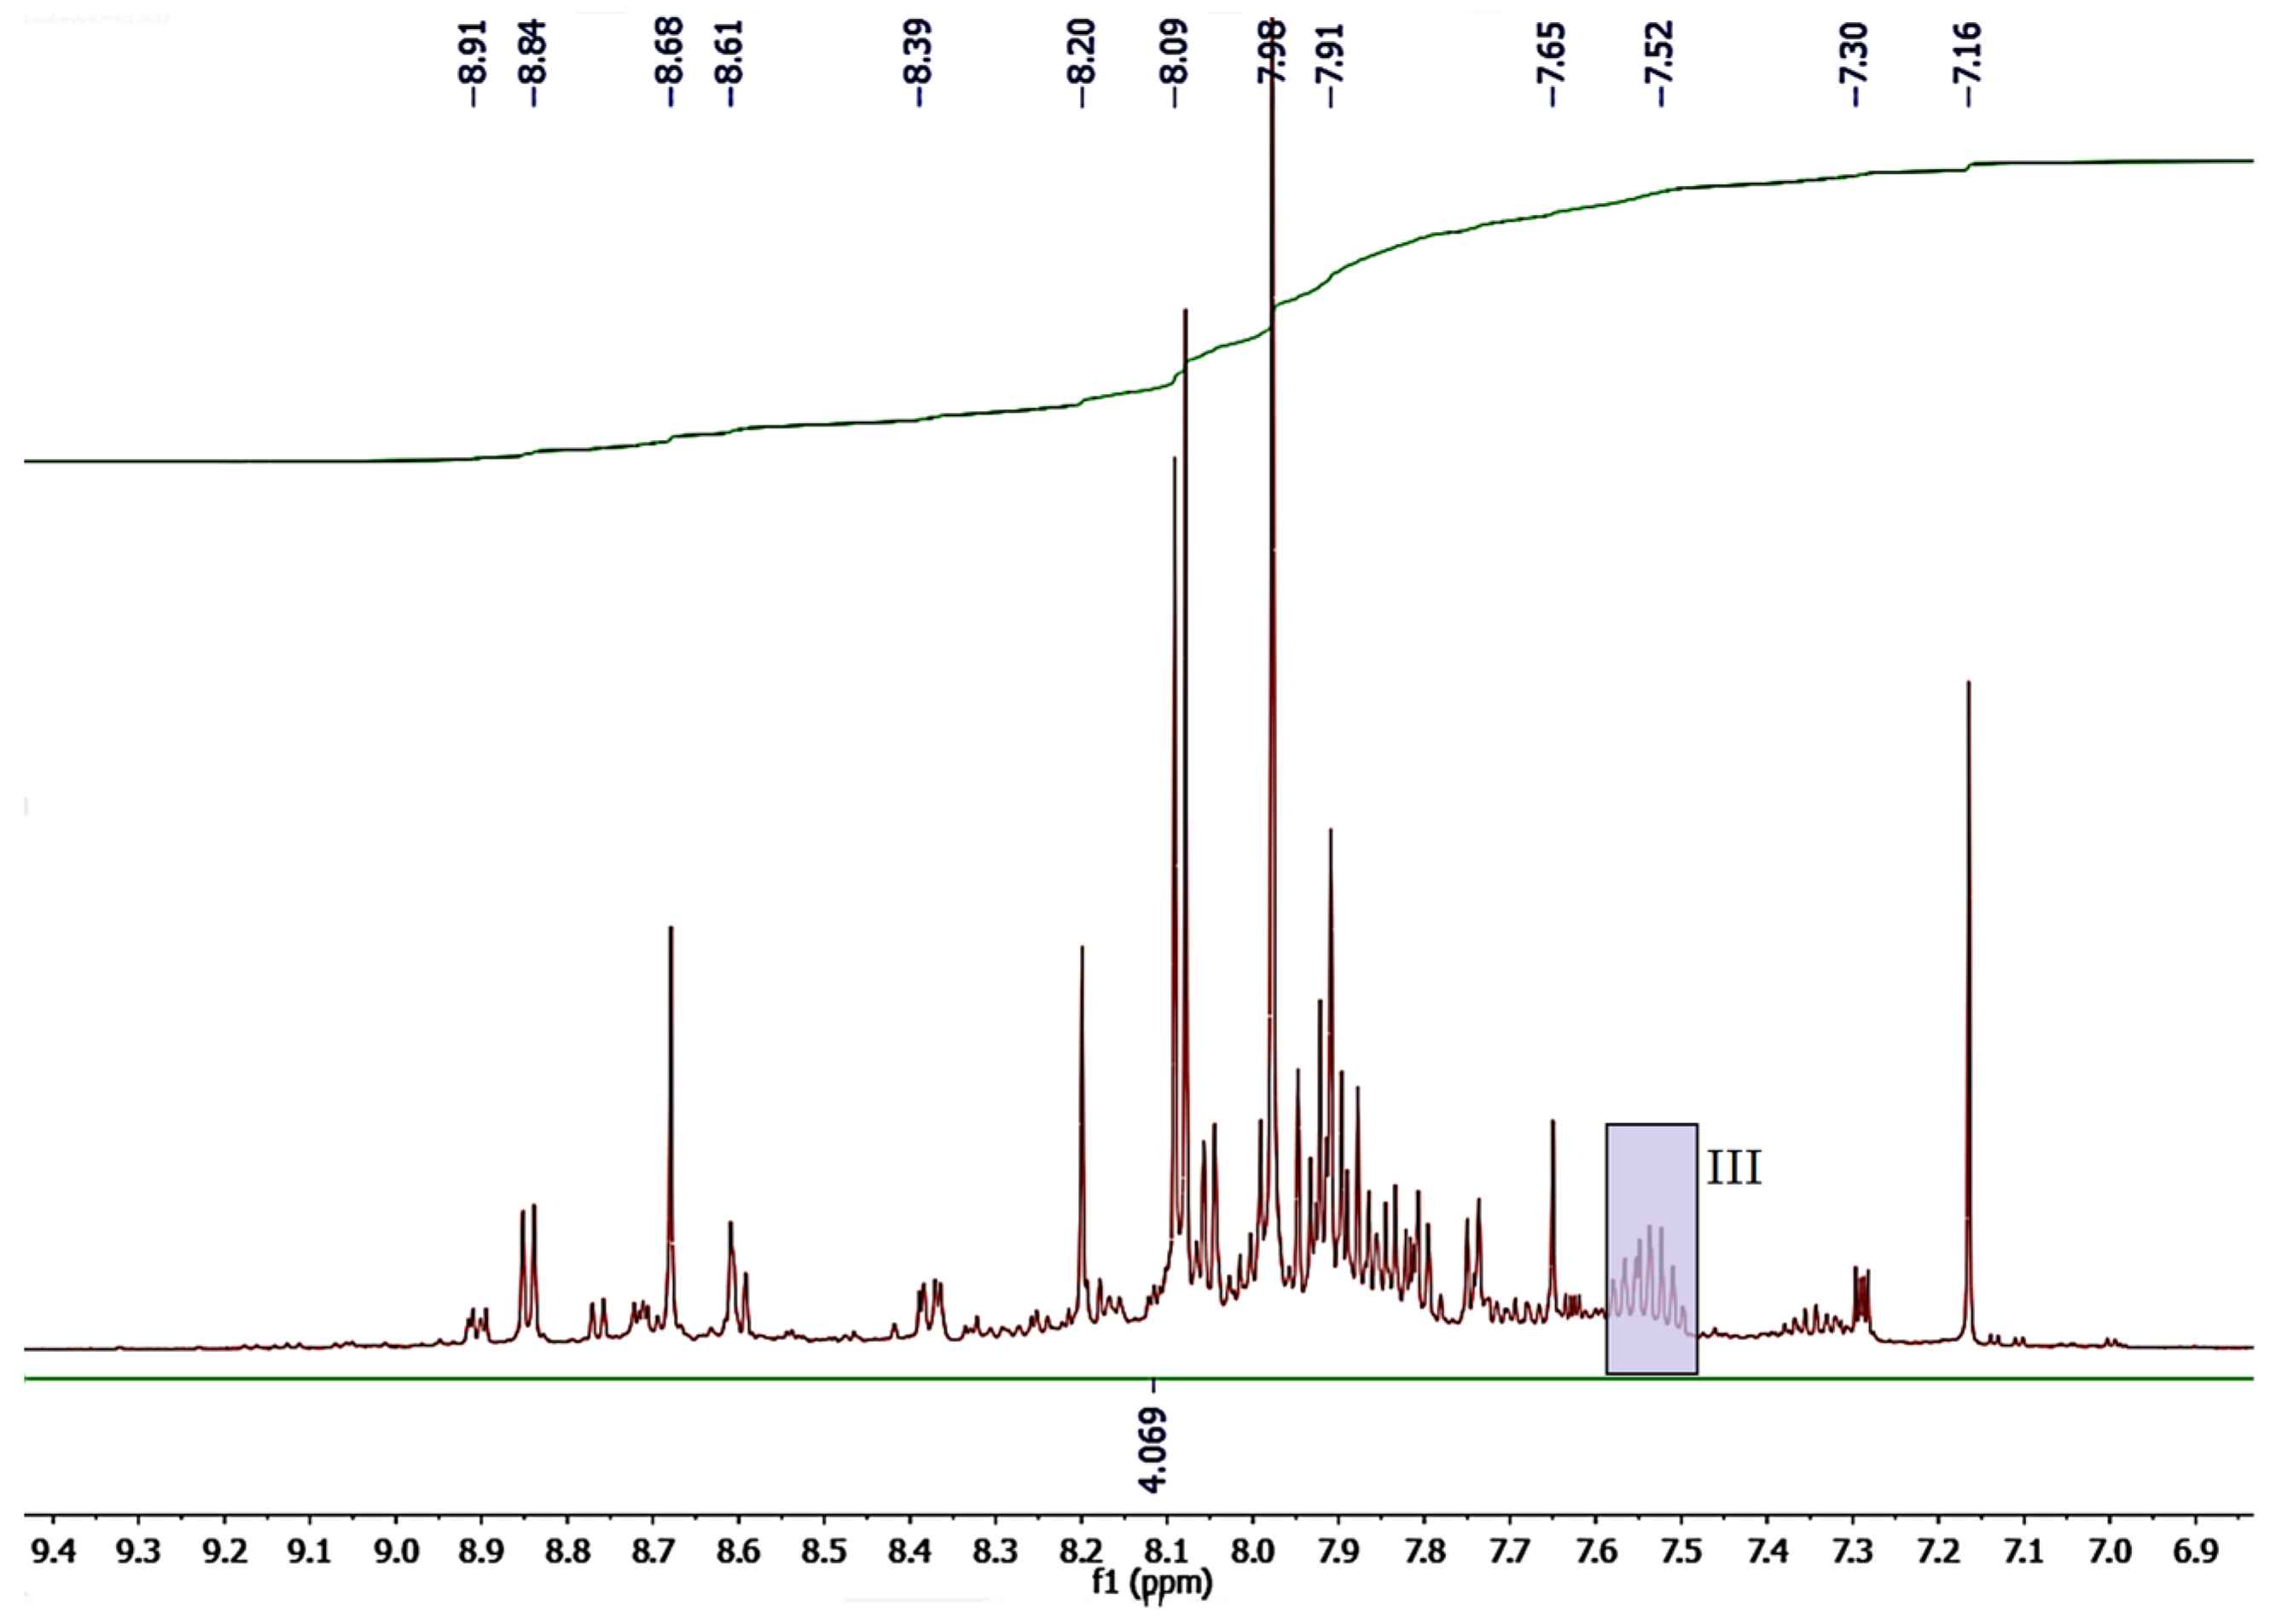
Analysis of the 1HNMR and 13CNMR spectra (Figure 8, Figure 9 and Figure 10) of the solids condensing on the surface of the quartz reactor in area C confirms the observations made by infrared spectroscopy, at the same time indicating the presence of aromatic hydrocarbons containing two (naphthalene) and more rings (PAHs).
In the 1HNMR spectrum (Figure 8), multiple signals were observed in the signal range of aliphatic protons (saturated and unsaturated structures), i.e., 0.5–6.7 ppm, including clear signals (I) around 1.2 ppm (CH2) and (II) around 0.8 ppm (CH3), which can be attributed to longer chain structures at least two carbon atoms away from the aromatic rings. The total integration of alkyl proton signals is about 43%. In the 1HNMR spectrum in the range (III) of signals of aromatic protons (6.7–9.5 ppm), a complex structure of signals is observed (Figure 9), indicating a small contribution of mono-ring structures. The total integration of aromatic proton signals is about 57%.
In the 13CNMR spectrum (Figure 10), a complex array of signals of aromatic carbon atoms (at least 6 signals), and three signals of aliphatic carbon atoms are observed. Note that the sensitivity of the method allows only carbon atoms present in the sample in significant amounts to be observed.

3.6. Textural Studies

Based on experimental low-temperature (−196 °C) nitrogen adsorption/desorption isotherms for carbons from areas A and B, the fundamental parameters characterizing the mesostructure of these materials were determined. The results are presented in Table 4.
The investigated carbons exhibited extremely different specific surface areas. Carbon from area A showed a relatively high surface development (125.3 m2/g) and can be classified as a porous material, whereas carbon from area B was characterized by an extremely low specific surface area (1.99 m2/g). The proportion of mesopores in the amorphous carbon sample (area A) was about 60%, while for carbon from area B it was exceptionally high—above 99%. According to the applied methodology, the pore widths of the studied carbons were in the range of 6–10 nm. It is noteworthy that the total pore volume of carbon from area A was as much as 57 times greater than that of carbon from area B.

3.7. TGA Study

The TGA study of the carbon samples was performed to determine the thermal stability of the materials obtained. Thermal stability is a test that can be used to indirectly determine the ordering of the structure and, in special cases, can be evidence to confirm or reject the postulated structure of carbon materials. Figure 11 shows the results of the thermal stability test for the sample from area A and from area B.
Based on the temperature at which the change in mass is observed, associated with the exothermic effect, it can be concluded that the carbon sample obtained in area B burns at higher temperatures than the sample obtained in area A—tmax = about 720 °C and tmax = about 890 °C, respectively. This shows that the carbon from area B is more thermally stable, which may mean that the structure of this carbon is characterized by higher ordering. The course of the curves for both materials, especially the absence of other exo- or endothermic effects, testifies to the high purity of the materials—the absence of the presence of substances that burn or decompose at lower temperatures.

4. Discussion and Conclusions

The study presented a comprehensive morphological and structural analysis of carbon materials obtained from simple thermal methane pyrolysis under laboratory conditions. The process, carried out in a quartz reactor without the use of a catalyst, demonstrated moderate methane conversion (36.5%), process efficiency (36.1%), and very high selectivity (98.9%). The obtained conversion level of the thermal pyrolysis process is moderate, but literature studies indicate that the thermal (non-catalytic) methane pyrolysis generally requires very high temperatures (above 1200 °C) to achieve significant methane conversion. According to the studies referenced in the article, non-catalytic pyrolysis can reach methane conversion levels close to 90–99% under very high-temperature conditions or plasma-assisted processes. For example, Fulcheri et al. [23] reported methane conversions of around 99.5% with hydrogen yields of 96–99% in a plasma process operating at around 1700 °C, with relatively low energy consumption of 25 kWh per kg of hydrogen produced. The objective of our research, however, was a cheap and simple thermal process conducted at a relatively low temperature, which translates into lower costs and reduced GHG emissions. Despite this, these operating parameters (especially selectivity) confirm the promising potential of this method for selective hydrogen production with minimal formation of unwanted hydrocarbons.
The scientific community agrees that one of the biggest challenges in the methane pyrolysis process is the carbon produced [42,43,50,51]. On one hand, it causes rapid degradation of catalysts, necessitates its separation from the catalyst, or disrupts heat flow in the process [41,52,53]. However, its presence also has significant advantages; it is an additional asset of this method and can be utilized in many sectors of the economy [52]. The literature describes attempts to control its structure, showing the influence of factors such as the method, type of catalyst, temperature, etc. A special case is the appearance of two types of carbon in the process. This phenomenon was observed by Zhao [54], who noted that two types of carbon species were produced at different locations: carbon black particles tend to form inside CH4 gas bubbles, while defective graphene layers grow at the liquid (molten salt) and gas interface. A similar phenomenon during pyrolysis in a ceramic porous reactor was observed by Lott [55]. However, his research did not focus on evaluating the morphology of the resulting carbon mixture. Our findings highlight the significant impact of temperature zones on both carbon yield and morphology. The main product, a flake-like, silver carbon (area B), was predominantly formed on reactor walls within the 600–980 °C range and accounted for about 91% of the total solids. In contrast, the powder carbon (area A) originated primarily in the narrow 980–1000 °C region and accounted for about 9% of the material. Carbon from area A exhibited a much higher specific surface area (125.3 m2/g), considerable mesoporosity (60%), and a pore width of approximately 10 nm, classifying it as a porous, amorphous material suited for advanced applications. Meanwhile, the flake carbon from area B had an extremely low specific surface area (1.99 m2/g), exceptionally high mesoporosity (>99%), and narrow pores, indicating structural compactness and increased stability. The obtained value of porosity of B area carbon is comparable to the results reported for graphite in the literature [56].
SEM imaging confirmed the marked morphological differences between the two carbon types. Carbon from area A took the form of spherical, highly porous aggregates which is a typical image for amorphous carbons [52], while material from area B formed distinct, dense flakes, which was also reported by scientists [52]. These differences directly translated into the textural properties observed, such as specific surface area and pore volume.
Raman spectroscopy enabled assessment of the graphitization degree of the obtained carbons. The spectra of carbon from area B showed a higher G/D band intensity ratio, indicating a greater degree of structural order and an increased presence of graphitic domains compared to the amorphous carbon from area A. Such properties are favorable for applications requiring higher electrical conductivity or mechanical stability.
Thermogravimetric (TGA) analysis provided important conclusions about the thermal stability of the obtained carbon forms. Samples from area B showed a narrower oxidation range and a higher onset decomposition temperature compared to the carbon from area A. This clearly indicates higher thermal stability and lower reactivity of the flake-like carbon from area B, which makes it more resistant to degradation during potential high-temperature applications. The stability values for carbon from area B are close to graphite, while for carbons from area A they are close to amorphous forms [50].
The divergences in structure, porosity, and surface properties between the carbons produced in specific temperature zones directly impact their possible industrial applications. High-surface-area, amorphous carbon (area A) may be advantageous for uses requiring adsorptive or catalytic functionalities, while the dense, flake-like carbon (area B) could be more suitable for high-tech or structural roles.
It is of concern that analysis of the residue from area C revealed the presence of polycyclic aromatic hydrocarbons (PAHs), which are natural intermediates in the synthesis of graphitic carbon. The detection of PAHs in this region indicates that undesired side reactions may occur in the low temperature area of the reactor. Fortunately, further studies confirmed that PAHs were not present on the surface of the final, well-formed carbon structures, which significantly limits potential application risks.
In summary, the classic thermal methane pyrolysis process, while characterized by moderate conversion, enables the production of CO2-free hydrogen and high-quality, uncontaminated carbons of diverse morphology and structure. The clear influence of temperature on the properties of the final carbon underscores the need to precisely control process conditions in order to obtain materials with required characteristics. These findings justify further work into scale-up and application development for both hydrogen and carbon by-products, positioning this method as an attractive option for sustainable energy and materials production.

Author Contributions

Conceptualization, M.W. and G.Ż.; methodology, M.W. and W.K.; validation, M.W., G.Ż. and K.W.; formal analysis, M.W., W.K. and W.P.; investigation, M.W. and M.W.; writing—original draft preparation, M.W. and G.Ż.; writing—review and editing, M.W.; visualization, M.W.; supervision, M.W. All authors have read and agreed to the published version of the manuscript.

Funding

This research was funded by Republic of Poland Ministry of Education and Science; grant numbers Project INiG-PIB no. 0046/TC/2022 and 0059/2024, and was funded in part by National Science Centre, Poland, Grant number: 2025/09/X/ST5/00196. For the purpose of Open Access, the author has applied a CC-BY public copyright license to any Author Accepted Manuscript (AAM) version arising from this submission.

Institutional Review Board Statement

Not applicable.

Informed Consent Statement

Not applicable.

Data Availability Statement

All data is contained within the article.

Conflicts of Interest

The authors declare no conflicts of interest.

References

  1. Marbán, G.; Valdés-Solís, T. Towards the hydrogen economy? Int. J. Hydrogen Energy 2007, 32, 1625–1637. [Google Scholar] [CrossRef]
  2. El-Shafie, M. Hydrogen production by water electrolysis technologies: A review. Results Eng. 2023, 20, 101426. [Google Scholar] [CrossRef]
  3. Grubert, E. Water consumption from electrolytic hydrogen in a carbon-neutral US energy system. Clean. Prod. Lett. 2023, 4, 100037. [Google Scholar] [CrossRef]
  4. Simoes, S.G.; Catarino, J.; Picado, A.; Lopes, T.F.; di Berardino, S.; Amorim, F.; Gírio, F.; Rangel, C.; de Leão, T.P. Water availability and water usage solutions for electrolysis in hydrogen production. J. Clean. Prod. 2021, 315, 128124. [Google Scholar] [CrossRef]
  5. Postels, S.; Abánades, A.; von der Assen, N.; Rathnam, R.K.; Stückrad, S.; Bardow, A. Life cycle assessment of hydrogen production by thermal cracking of methane based on liquid-metal technology. Int. J. Hydrogen Energy 2016, 41, 23204–23212. [Google Scholar] [CrossRef]
  6. Muradov, N.Z.; Veziroǧlu, T.N. “Green” path from fossil-based to hydrogen economy: An overview of carbon-neutral technologies. Int. J. Hydrogen Energy 2008, 33, 6804–6839. [Google Scholar] [CrossRef]
  7. Bui, M.; Adjiman, C.S.; Bardow, A.; Anthony, E.J.; Boston, A.; Brown, S.; Fennell, P.S.; Fuss, S.; Galindo, A.; Hackett, L.A.; et al. Carbon capture and storage (CCS): The way forward. Energy Environ. Sci. 2018, 11, 1062–1176. [Google Scholar] [CrossRef]
  8. Steinberg, M. Fossil fuel decarbonization technology for mitigating global warming. Int. J. Hydrogen Energy 1999, 24, 771–777. [Google Scholar] [CrossRef]
  9. Parkinson, B.; Matthews, J.W.; McConnaughy, T.B.; Upham, D.C.; McFarland, E.W. Techno-Economic Analysis of Methane Pyrolysis in Molten Metals: Decarbonizing Natural Gas. Chem. Eng. Technol. 2017, 40, 1022–1030. [Google Scholar] [CrossRef]
  10. Holmen, A.; Olsvik, O.; Rokstad, O.A. Pyrolysis of natural gas: Chemistry and process concepts. Fuel Process Technol. 1995, 42, 249–267. [Google Scholar] [CrossRef]
  11. Abánades, A.; Ruiz, E.; Ferruelo, E.M.; Hernández, F.; Cabanillas, A.; Martínez-Val, J.M.; Rubio, J.A.; López, C.; Gavela, R.; Barrera, G.; et al. Experimental analysis of direct thermal methane cracking. Int. J. Hydrogen Energy 2011, 36, 12877–12886. [Google Scholar] [CrossRef]
  12. Poirier, M.G.; Sapundzhiev, C. Catalytic decomposition of natural gas to hydrogen for fuel cell applications. Int. J. Hydrogen Energy 1997, 22, 429–433. [Google Scholar] [CrossRef]
  13. Steinberg, M. Production of hydrogen and methanol from natural gas with reduced CO2 emission. Int. J. Hydrogen Energy 1998, 23, 419–425. [Google Scholar] [CrossRef]
  14. Billaud, F.; Gueret, C.; Weill, J. Thermal decomposition of pure methane at 1263 K. Experiments and mechanistic modelling. Thermochim. Acta 1992, 211, 303–322. [Google Scholar] [CrossRef]
  15. Guéret, C.; Daroux, M.; Billaud, F. Methane pyrolysis: Thermodynamics. Chem. Eng. Sci. 1997, 52, 815–827. [Google Scholar] [CrossRef]
  16. Wojtasik, M.; Burnus, Z.; Markowski, J.; Żak, G.; Lubowicz, J. Methane pyrolysis—Influence of selected parameters on the course of the process. Naft-Gaz 2023, 79, 484–489. [Google Scholar] [CrossRef]
  17. Wojtasik, M. Katalityczna dekompozycja metanu jako źródło cennego wodoru. Przem. Chem. 2022, 1, 33–37. [Google Scholar] [CrossRef]
  18. Vedele, P.; Sartoretti, E.; Torretti, G.; Novara, C.; Salomone, F.; Giorgis, F.; Antonini, M.; Bensaid, S. Thermocatalytic methane pyrolysis over iron-based catalysts for turquoise hydrogen production: Activity and kinetic studies. Chem. Eng. J. 2025, 514, 163392. [Google Scholar] [CrossRef]
  19. Zhou, N.; Zhao, D.; Su, Q.; Li, Q.; Zha, W.; Feng, S. Catalytic performance of modified carbon black on methane decomposition for hydrogen production. RSC Adv. 2024, 14, 15656–15663. [Google Scholar] [CrossRef]
  20. Shivtsov, D.M.; Veselov, G.B.; Afonnikova, S.D.; Ayupov, A.B.; Shubin, Y.V.; Bauman, Y.I.; Mishakov, I.V.; Shelepova, E.V.; Vedyagin, A.A. Production of hydrogen from methane over nickel-copper oxide catalysts prepared via mechanochemical activation under varied conditions. Int. J. Hydrogen Energy 2025, 149, 150082. [Google Scholar] [CrossRef]
  21. Chen, L.; Song, Z.; Zhang, S.; Chang, C.-K.; Chuang, Y.-C.; Peng, X.; Dun, C.; Urban, J.J.; Guo, J.; Chen, J.-L.; et al. Ternary NiMo-Bi liquid alloy catalyst for efficient hydrogen production from methane pyrolysis. Science 2023, 381, 857–861. [Google Scholar] [CrossRef] [PubMed]
  22. Hofberger, C.; Dietrich, B.; Krumholz, R.; Noglik, A.P.; Olbricht, M.; Schatzmann, S.; Stoppel, L.; Richter, M.; Uhlenbruck, N.; Wetzel, T. Technical Aspects of Natural Gas Pyrolysis in Liquid Metal Bubble Column Reactors. Energy Technol. 2024, 12, 2400183. [Google Scholar] [CrossRef]
  23. Fulcheri, L.; Rohani, V.J.; Wyse, E.; Hardman, N.; Dames, E. An energy-efficient plasma methane pyrolysis process for high yields of carbon black and hydrogen. Int. J. Hydrogen Energy 2023, 48, 2920–2928. [Google Scholar] [CrossRef]
  24. Moghaddam, A.L.; Hejazi, S.; Fattahi, M.; Kibria, G.; Thomson, M.J.; AlEisa, R.; Khan, M.A. Methane pyrolysis for hydrogen production: Navigating the path to a net zero future. Energy Environ. Sci. 2025, 18, 2747–2790. [Google Scholar] [CrossRef]
  25. Kim, S.C.; Lim, M.S.; Chun, Y.N. Hydrogen-rich gas production from a biomass pyrolysis gas by using a plasmatron. Int. J. Hydrogen Energy 2013, 38, 14458–14466. [Google Scholar] [CrossRef]
  26. Fulcheri, L.; Schwob, Y. From methane to hydrogen, carbon black and water. Int. J. Hydrogen Energy 1995, 20, 197–202. [Google Scholar] [CrossRef]
  27. Fabry, F.; Flamant, G.; Fulcheri, L. Carbon black processing by thermal plasma. Analysis of the particle formation mechanism. Chem. Eng. Sci. 2001, 56, 2123–2132. [Google Scholar] [CrossRef]
  28. Bromberg, L.; Cohn, D.R.; Rabinovich, A.; Alexeev, N. Plasma catalytic reforming of methane. Int. J. Hydrogen Energy 1999, 24, 1131–1137. [Google Scholar] [CrossRef]
  29. Li, L.; Chen, J.; Yan, K.; Qin, X.; Feng, T.; Wang, J.; Wang, F.; Song, Z. Methane dry reforming with microwave heating over carbon-based catalyst obtained by agriculture residues pyrolysis. J. CO2 Util. 2018, 28, 41–49. [Google Scholar] [CrossRef]
  30. Sikarwar, V.S.; Hrabovský, M.; Van Oost, G.; Pohořelý, M.; Jeremiáš, M. Progress in waste utilization via thermal plasma. Prog. Energy Combust. Sci. 2020, 81, 100873. [Google Scholar] [CrossRef]
  31. Sekiguchi, H.; Mori, Y. Steam plasma reforming using microwave discharge. Thin Solid Films 2003, 435, 44–48. [Google Scholar] [CrossRef]
  32. Deminsky, M.; Jivotov, V.; Potapkin, B.; Rusanov, V. Plasma-assisted production of hydrogen from hydrocarbons. Pure Appl. Chem. 2002, 74, 413–418. [Google Scholar] [CrossRef]
  33. Jasiński, M.; Dors, M.; Mizeraczyk, J. Production of hydrogen via methane reforming using atmospheric pressure microwave plasma. J. Power Sources 2008, 181, 41–45. [Google Scholar] [CrossRef]
  34. Moisan, M.; Zakrzewski, Z.; Rostaing, J.C. Waveguide-based single and multiple nozzle plasma torches: The TIAGO concept. Plasma Sources Sci. Technol. 2001, 10, 387–394. [Google Scholar] [CrossRef]
  35. Otsuka, K.; Takenaka, S.; Ohtsuki, H. Production of pure hydrogen by cyclic decomposition of methane and oxidative elimination of carbon nanofibers on supported-Ni-based catalysts. Appl. Catal. A Gen. 2004, 273, 113–124. [Google Scholar] [CrossRef]
  36. Wojtasik, K.; Wojtasik, M.; Suchanek, K.; Zięba, M.; Karasiński, P.; Pakieła, W.; Żak, G.; Krasodomski, W. Effect of pyrolytic carbon addition on the structural and optical properties of TiO2 composite thin films. Sci. Rep. 2025, 15, 8078. [Google Scholar] [CrossRef]
  37. Potylitsyna, A.R.; Bauman, Y.I.; Ayupov, A.B.; Plyusnin, P.E.; Shubin, Y.V.; Stoyanovskii, V.O.; Vedyagin, A.A.; Mel’GUnov, M.S.; Korenev, S.V.; Mishakov, I.V. Turbostratic carbon nanofibers produced from C2HCl3 over self-dispersing Ni-catalyst doped with W and Mo. Diam. Relat. Mater. 2024, 148, 111416. [Google Scholar] [CrossRef]
  38. Zhang, J.; Zou, J.; Li, Q.; Wang, Y.; Cui, S.; Yang, J.; Li, J. Nano-turbostratic carbon-decorated SiOC ceramic aerogels with ultra-broadband electromagnetic wave absorption properties. J. Non Cryst. Solids 2024, 624, 122725. [Google Scholar] [CrossRef]
  39. Granieri, S.F.; Rovera, E.; Cecchetti, M.; Pagano, G.M.; Prato, M.; Pasquale, L.; Brescia, R.; Ivanov, Y.P.; Divitini, G.; Casalegno, A.; et al. High-power density turbostratic carbon nano-onion functionalized carbon paper electrodes for vanadium flow batteries. J. Energy Storage 2025, 121, 116567. [Google Scholar] [CrossRef]
  40. Yeh, I.C.; Tran, N.T.; Knorr, D.B. Effects of high-temperature annealing on structural and mechanical properties of amorphous carbon materials investigated by molecular dynamics simulations. Carbon 2025, 234, 120006. [Google Scholar] [CrossRef]
  41. Wang, S.; Lee, W.J.; Li, C.; Kuan, B.; Burke, N.; Patel, J. The pyrolysis of natural gas: A study of carbon deposition and the suitability of reactor materials. AIChE J. 2019, 65, 1035–1046. [Google Scholar] [CrossRef]
  42. Prabowo, J.; Lai, L.; Chivers, B.; Burke, D.; Dinh, A.H.; Ye, L.; Wang, Y.; Wang, Y.; Wei, L.; Chen, Y. Solid carbon co-products from hydrogen production by methane pyrolysis: Current understandings and recent progress. Carbon 2024, 216, 118507. [Google Scholar] [CrossRef]
  43. Xu, H.; Abuseada, M.; Ju, Y.S.; Spearrin, R.M.; Fisher, T.S. Local Thermochemical Mechanisms in Direct Solar Graphite Synthesis from Methane. Energy Fuels 2024, 38, 18087–18089. [Google Scholar] [CrossRef] [PubMed]
  44. Yuan, F.; Hu, J.; Lei, Y.; Zhao, R.; Gao, C.; Wang, H.; Li, B.; Kang, F.; Zhai, D. Key Factor Determining the Cyclic Stability of the Graphite Anode in Potassium-Ion Batteries. ACS Nano 2022, 16, 12511–12519. [Google Scholar] [CrossRef] [PubMed]
  45. Moisan, M.; Grenier, R.; Zakrzewski, Z. The electromagnetic performance of a surfatron-based coaxial microwave plasma torch. Spectrochim. Acta Part B Spectrosc. 1995, 50, 781–789. [Google Scholar] [CrossRef]
  46. Srisuma, P.; Suwattanapongtada, N.; Opasanon, N.; Charoensuppanimit, P.; Kerdnawee, K.; Termvidchakorn, C.; Tanthapanichakoon, W.; Charinpanitku, T. A fundamental exploration on carbon nanotube formation via pyrolysis of ferrocene and glycerol: Experimental and theoretical viewpoints. Eng. Sci. Technol. Int. J. 2021, 24, 1373–1382. [Google Scholar] [CrossRef]
  47. Ziemiaski, P.P.; van Bokhoven, J.; Pan, Z.; Krumeich, F.; Ziemiański, P.P.; van Bokhoven, J.A. Tunable Synthesis of Carbon Nanotubes via Methane Catalytic Pyrolysis by Adjusting Mo Incorporation in Fe/MgO. Phys. Chem. Chem. Phys. 2025, 27, 18302–18308. [Google Scholar] [CrossRef]
  48. Wang, I.W.; Kutteri, D.A.; Gao, B.; Tian, H.; Hu, J. Methane Pyrolysis for Carbon Nanotubes and COx-Free H2 over Transition-Metal Catalysts. Energy Fuels 2019, 33, 197–205. [Google Scholar] [CrossRef]
  49. Sánchez-Bastardo, N.; Schlögl, R.; Ruland, H. Methane Pyrolysis for Zero-Emission Hydrogen Production: A Potential Bridge Technology from Fossil Fuels to a Renewable and Sustainable Hydrogen Economy. Ind. Eng. Chem. Res. 2021, 60, 11855–11881. [Google Scholar] [CrossRef]
  50. Patlolla, S.R.; Sharafian, A.; Katsu, K.; Mérida, W. Temperature effects on the properties of solid carbon from natural gas pyrolysis in molten tin. Carbon Lett. 2024, 34, 1899–1913. [Google Scholar] [CrossRef]
  51. Krasodomski, W.; Wojtasik, M.; Markowski, J.; Żak, G. Dekarbonizacja metanu—Kierunki zagospodarowania węgla popirolitycznego. Naft-Gaz 2022, 78, 56–63. [Google Scholar] [CrossRef]
  52. Dadsetan, M.; Latham, K.G.; Khan, M.F.; Zaher, M.H.; Manzoor, S.; Bobicki, E.R.; Titirici, M.; Thomson, M.J. Characterization of carbon products from microwave-driven methane pyrolysis. Carbon Trends 2023, 12, 100277. [Google Scholar] [CrossRef]
  53. He, Y.; Jing, X.; Qin, L.; Wang, D.; Wu, C.; Liu, M.; Yang, M.; Huang, Z. Insights into carbon formation over molten salt-promoted NiO/Al2O3 during methane pyrolysis. Carbon Lett. 2024, 34, 1471–1480. [Google Scholar] [CrossRef]
  54. Zhao, Y.; Shi, Z.; Zhu, Y.; Liu, J.; Yang, B.; Yu, Q.; Xie, X. Mechanism for One-Pot Synthesis of 0D-2D Carbon Materials in the Bubbles Inside Molten Salts. Adv. Funct. Mater. 2022, 32, 2202381. [Google Scholar] [CrossRef]
  55. Lott, P.; Mokashi, M.B.; Müller, H.; Heitlinger, D.J.; Lichtenberg, S.; Shirsath, A.B.; Janzer, C.; Tischer, S.; Maier, L.; Deutschmann, O. Hydrogen Production and Carbon Capture by Gas-Phase Methane Pyrolysis: A Feasibility Study. ChemSusChem 2023, 16, e202201720. [Google Scholar] [CrossRef] [PubMed]
  56. Broadbent, K.A.; Dollimore, D.; Dollimore, J. The surface area of graphite calculated from adsorption isotherms and heats of wetting experiments. Carbon 1966, 4, 281–287. [Google Scholar] [CrossRef]
Figure 1. Methane Pyrolysis Process Scheme.
Applsci 15 10742 g001
Figure 2. Areas of carbon deposition in the process.
Applsci 15 10742 g002
Figure 3. Comparison of the areas of occurrence of different forms of carbon (A, B, and C) with the furnace temperature profile.
Applsci 15 10742 g003
Figure 4. SEM photograph of sphere-structured carbon from zone A of the reactor.
Applsci 15 10742 g004
Figure 5. SEM photograph of plate-like carbon from the B zone of the reactor.
Applsci 15 10742 g005
Figure 6. Raman spectra of carbons formed in the studied process—(a) carbon from area A; (b) carbon from area B.
Applsci 15 10742 g006
Figure 7. FTIR-ATR spectra of samples of the carbon from area A/B—blue line, and sample collecting from area C—red line.
Applsci 15 10742 g007
Figure 8. 1H NMR spectrum of samples of solids condensing on the surface of the quartz reactor in the C area.
Applsci 15 10742 g008
Figure 9. 1H NMR spectrum in the aromatic range of samples of solids condensing on the surface of a quartz reactor in the C area.
Applsci 15 10742 g009
Figure 10. 13C NMR spectrum of samples of solids condensing on the surface of a quartz reactor in the C area.
Applsci 15 10742 g010
Figure 11. Thermal stability curves for area A carbon—red line and for area B carbon—blue line.
Applsci 15 10742 g011
Table 1. Dependence of the carbon structure on the process temperature and used catalysts.
Temperatures, °CCatalyst TypeCarbon Morphology
500–700Ni-basedFiber structure
650–950Fe-basedFiber structure
850–950carbonaceousFiber structure or turbostratic carbon
650–1050other metal catalystgraphitic carbon or turbostratic carbon
Above 1100without catalystamorphous carbon
Table 2. The typical composition of the post-process gas.
CH4H2C2 + C3 *N2O2
Content, % (m/m)34.019.30.146.60.1
Normalized content (without nitrogen), % (m/m)63.6736.140.19-0.19
* total content of hydrocarbons with two and three carbon atoms.
Table 3. Methane conversion. the efficiency and selectivity of the process.
ParametersValue
Methane conversion, %36.5
Process efficiency, %36.1
Process selectivity, %98.9
Table 4. Textural parameters of carbons from areas A and B.
CarbonArea AArea B
Specific surface area SBET, m2/g125.2701.990
Pore width (KJS), nm10.496.56
Total pore volume, cm3/g0.34200.0060
Mesopore volume, cm3/g0.33900.0048
Mesoporosity, %99.1260.00
Disclaimer/Publisher’s Note: The statements, opinions and data contained in all publications are solely those of the individual author(s) and contributor(s) and not of MDPI and/or the editor(s). MDPI and/or the editor(s) disclaim responsibility for any injury to people or property resulting from any ideas, methods, instructions or products referred to in the content.