Article

Photoacoustic Tomography in Forward-Detection Mode for Monitoring Structural Changes in an Extracted Wisdom Tooth

by
Marco P. Colín-García
1,
Misael Ruiz-Veloz
2,
Gerardo Gutiérrez-Juárez
2,
Gonzalo Montoya-Ayala
3,
Roberto G. Ramírez-Chavarría
4,
Rosalba Castañeda-Guzmán
1 and
Argelia Pérez-Pacheco
5,*
1
Instituto de Ciencias Aplicadas y Tecnología, Universidad Nacional Autónoma de México, Mexico City 04510, Mexico
2
División de Ciencias e Ingenierías, Universidad de Guanajuato, Guanajuato 37150, Mexico
3
División de Estudios de Posgrado e Investigación de la Facultad de Odontología, Universidad Nacional Autónoma de México, Mexico City 04510, Mexico
4
Instituto de Ingeniería, Universidad Nacional Autónoma de México, Mexico City 04510, Mexico
5
Unidad de Investigación y Desarrollo Tecnológico (UIDT), Hospital General de México “Dr. Eduardo Liceaga”, Mexico City 06726, Mexico
*
Author to whom correspondence should be addressed.
Appl. Sci. 2025, 15(16), 9146; https://doi.org/10.3390/app15169146
Submission received: 18 July 2025 / Revised: 11 August 2025 / Accepted: 12 August 2025 / Published: 20 August 2025
(This article belongs to the Special Issue Technological Innovations and Tools in Dental Practice)

Abstract

Photoacoustic tomography (PAT), which combines optical absorption and ultrasonic detection, enables the monitoring of dehydration-driven structural changes in extracted teeth over time. In this proof-of-concept study, 2D photoacoustic images of a wisdom tooth were generated on the same scanning plane at days 0, 1, 3, 6, 10, 15, 21, and 28 post-extraction, using day 0 as the reference. Measurements were performed in forward-detection mode with a single ultrasound transducer and a 532 nm pulsed laser. For the comparative analysis of variations between images, four metrics were used: Pearson correlation coefficient, Structural Similarity Index (SSIM), Mean Squared Error (MSE), and Peak Signal-to-Noise Ratio (PSNR). Structural changes were also examined through radial intensity profiles extracted from each image. The results revealed marked differences in the central region, evidencing progressive structural and acoustic modifications within the tooth. The most significant change occurred on day 1, followed by small but consistent variations on subsequent days. These differences are associated with dehydration-induced changes in tissue density, which affect sound propagation. This study highlights the value of PAT for noninvasive monitoring of post-extraction dental changes, with implications for diagnosis, treatment guidance, and biomaterials research in dentistry.

1. Introduction

Photoacoustic tomography (PAT) is a noninvasive biomedical imaging modality that employs short laser pulses to induce acoustic waves within biological tissues [1,2]. When light is absorbed, the optical energy is converted into heat, causing a rapid local temperature rise. This rise causes thermoelastic expansion of the tissue and generates pressure waves, a phenomenon known as the photoacoustic effect [3,4]. The resulting ultrasound waves are detected by sensors, and by applying reconstruction algorithms, it is possible to generate photoacoustic images (PAIs) with high spatial resolution and high optical contrast [5,6,7].
The propagation of acoustic waves is fundamentally influenced by various physical properties of biological tissues; therefore, the analysis of the wave dynamics offers valuable insights into tissue composition and structural characteristics [4]. In dental imaging, the tooth presents a complex structure composed of mineralized layers that shield the underlying soft tissue known as the dental pulp. At the coronal level, the enamel is the outermost mineralized layer, consisting of approximately 95–96 wt% carbonated hydroxyapatite, 1–4 wt% organic substances, and 2–4 wt% water [8,9]. Beneath the enamel lies the dentin, a less mineralized tissue composed of approximately 70 wt% hydroxyapatite, 20 wt% organic substances, and 10 wt% water [10,11]. In the root region, the dentin is covered by a thin layer called cementum, whose composition closely resembles that of bone. Dental tissue exhibits an optically heterogeneous structure with a high content of carbonated apatite, which plays an important role in photoacoustic signal generation [12,13]. The efficient production of ultrasound in PAT strongly depends on the optical absorption characteristics of the tissue at the laser excitation wavelength [11,14]. However, although carbonated apatite is the principal mineral component, it has relatively low intrinsic absorption in the visible range [15,16,17]. Even so, signals with a good signal-to-noise ratio can be obtained at 532 nm, the wavelength used in this study, where the signal can also be significantly influenced by organic components and structural defects within the tooth [15,18]. Moreover, once a tooth is removed from its physiological environment, it continues to undergo physicochemical changes; rapid dehydration alters its physical properties such as density [19], its optical properties such as color and translucency [20,21], and its mechanical properties, including hardness and tensile strength produced during drying [22,23].
PAT can provide both structural and functional information about tissues [6,24,25]. Structural images depict the physical organization of tissue, highlighting its characteristics such as density and composition. In structural PAIs, this capability visualizes anatomical details, for example, blood vessels or tissue boundaries. When applied to dental tissues, structural PAIs can reveal the shape of enamel and dentin [12,26,27], assist in detecting hidden and open caries [28], incipient and advanced caries, identify cracks, and show variations in mineral content [29,30]. They have also been used to assess the depth of periodontal pockets, the contours of teeth and gums, and to detect inflammation in the periodontal tissue [31,32]. By contrast, functional images capture dynamic or intrinsic changes in tissue properties, such as oxygenation, hydration, stiffness, or metabolic activity, that often reflect physiological or pathological processes. In functional PAIs, this capability enables real-time monitoring of angiogenesis, melanoma, blood oxygen saturation, vessel morphology, lipid and water content, thermal-therapy response, brain activity, and cancer detection [33,34,35,36]. Specifically in dental tissue studies, combining PAT with ultrasound techniques allows the acquisition of functional data [37], potentially enabling early detection of mineral loss associated with caries and monitoring tissue dehydration. Furthermore, dual-contrast PAT has been successfully used to map the microstructural and mechanical properties of enamel and dentin, providing functional contrast that is independent of conventional optical absorption [26].
Beyond natural dental tissues, PAT can also be applied to obtain images of restored teeth and dental materials based on differences in their optical and acoustic properties. By optimizing the laser wavelength and reconstruction algorithms for each material type, image contrast can be enhanced, enabling the monitoring of restoration integrity and the detection of defects over time. Overall, PAT supports both clinical and research applications through its non-ionizing, absorption-based contrast, which complements traditional imaging modalities [7]. Clinically, hybrid PA/ultrasound probes have demonstrated accurate and ergonomic imaging of periodontal tissues. In research settings, PAT has been used to detect early caries, microcracks, and fine tooth structures in ex vivo samples [29]. Unlike reflectance-based methods or conventional computed tomography (CT) and cone-beam computed tomography (CBCT), PAT improves soft-tissue evaluation and near-surface lesion detection, reinforcing its promise for practical intraoral use. A summary of some photoacoustic imaging studies focused on dental samples, including their imaging modalities, configurations, and key findings, is provided in Table A1 of Appendix A.
In this study, we applied PAT to monitor structural changes in a freshly extracted human wisdom tooth over a 28-day period. To enable consistent imaging over time, a single ultrasound transducer operating in forward-detection mode was combined with a pulsed laser and a motorized system that rotated the sample within a fixed scanning plane. Signals acquired at each angle were used to reconstruct 2D images through an algorithm specifically designed for circular scanning with a single detector. All acquisition and reconstruction parameters remained constant throughout the study, allowing direct comparison across different measurement days. This sequence of images formed the basis for analyzing the structural evolution of the tooth due to post-extraction dehydration.
We hypothesize that dentin density undergoes continuous changes during the monitoring period, influencing acoustic wave propagation. Since image reconstruction depends on the propagation speed, the resulting images should reflect these regional variations. Thus, this study addresses the following research question: is it possible to detect and quantify structural changes in an ex vivo human molar over a 28-day monitoring period using metrics extracted from PAT images? Answering this question will offer valuable insights into tissue behavior after extraction and further establish PAT as a reliable, noninvasive modality for temporal monitoring. Showing that these metrics can track and quantify structural changes over 28 days supports their use for early assessment of structural alterations and informed treatment planning, and provides a rapid, quantitative framework for advancing diagnostic tools and developing dental biomaterials that more closely mimic natural tissue.

2. Materials and Methods

The experimental setup used in this study is illustrated in Figure 1 and consisted of: (1) a Quantel Brilliant B pulsed Nd:YAG laser (532 nm, 5 ns pulse width, 10 Hz repetition rate); (2) a Tektronix DPO5204B oscilloscope (2 GHz bandwidth, 10 GS/s sampling rate); (3) an Olympus A326S-SU immersion transducer (5 MHz center frequency, 9.52 mm element diameter); (4) a Thorlabs PDA10A photodetector; (5) a Nema 17 stepper motor (1.8° step angle); (6) a laptop; (7) a beam splitter; (8) a plano-convex lens (40 cm focal length); (9) an acrylic container (20 × 10 × 15 cm) filled with distilled water; and (10) a dental sample (1.2 cm crown diameter). The study used only one complete, recently extracted wisdom tooth that was free of visible damage, and no additional samples were included due to equipment availability and measurement time.

2.1. Signal Acquisition

The experimental setup for photoacoustic signal acquisition used a single sensor in forward-detection mode, with the tooth submerged in water inside a container and secured to the stepper motor’s rotational axis (see Figure 1). Tomographic measurements were obtained in the same scanning plane on days 0, 1, 3, 6, 10, 15, 21, and 28 post-extraction. Both the transducer and laser path remained fixed, and the experimental conditions, including laser pulse energy (9.5 mJ) and exposure time (8 s), were kept constant. The water temperature in the container was maintained at 20 °C throughout the study.
Signal acquisition was automated via a MATLAB R2021a script controlling the equipment. A train of laser pulses (532 nm) was focused on the tooth’s crown at mid-height. Each signal (averaged over 30 pulses) was displayed on the oscilloscope and then transferred to a laptop. The stepper motor rotated the sample in 1.8° increments, performing 200 steps for a full 360° scan. Data were stored with 10,000 samples in a 50 μs time window (200 MS/s sampling rate). By rotating the sample in the same plane with a single transducer, this setup effectively simulated a circular array of 200 sensors. The entire acquisition process took about 35 min.
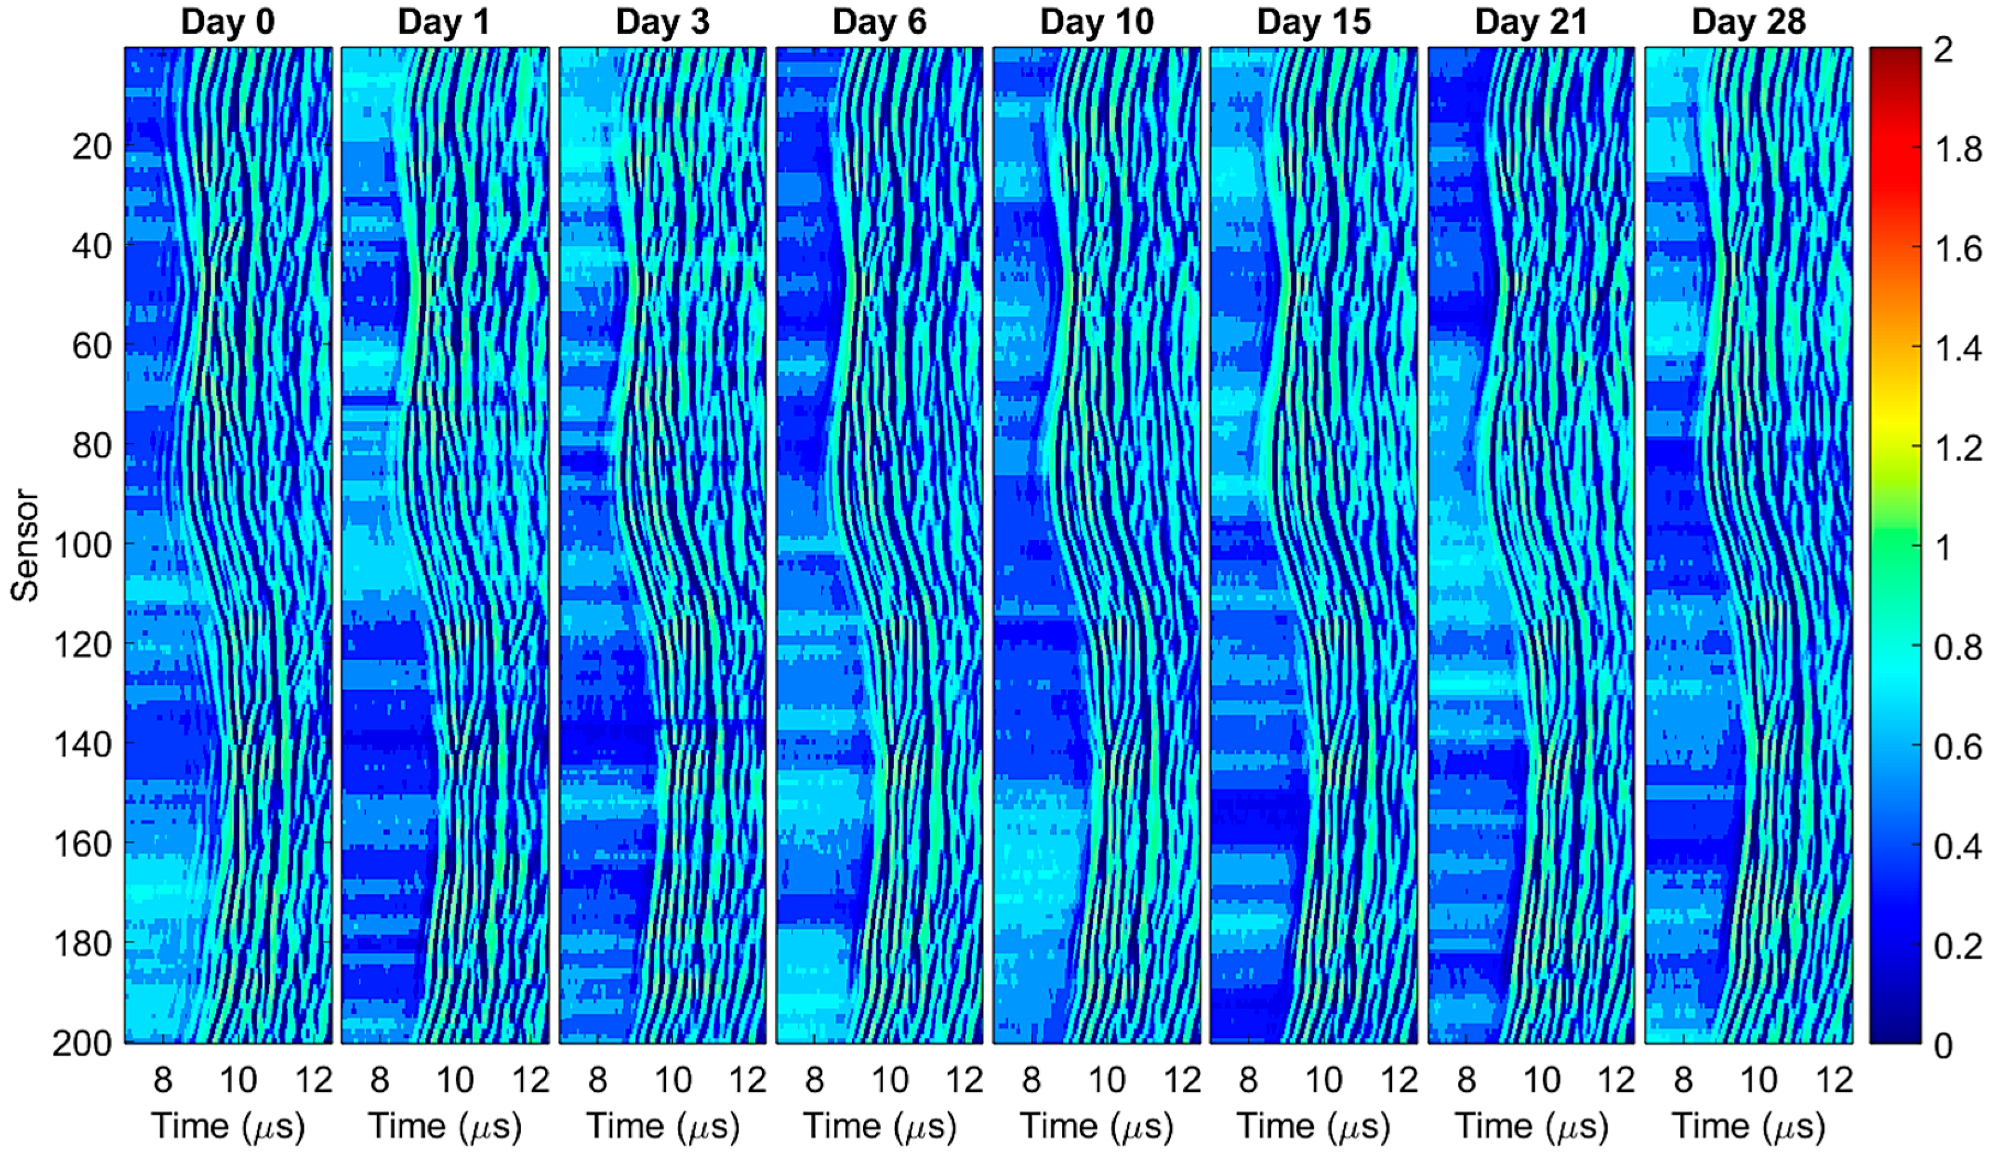
Figure 2 displays the photoacoustic time-series as sinograms, acquired from day 0 to day 28 post-extraction. Each sinogram depicts the PA signals (filtered, temporally cropped, globally normalized, and histogram-equalized) using a color map, where blue corresponds to the lowest amplitudes and red to the highest, as a function of time-of-flight (horizontal axis) and sensor position or rotation angle around the sample (vertical axis). These sinograms serve solely to illustrate the measurement data used for structural image reconstruction. Since each time series recorded by the sensor followed the same pre-processing workflow, amplitude and arrival-time shifts can be compared directly across days. Over the monitoring period, the band patterns exhibit subtle phase shifts and amplitude variations (mainly at longer time of flight intervals), indicating that corresponding changes will appear in the reconstructed PAIs. Noise-like artifacts also appear on the left side of the time window, but these are unrelated to the coherent band patterns and do not affect the structural features of interest.

2.2. Image Reconstruction Algorithm

The experimental signals acquired were used to generate 2D photoacoustic images with the Single Sensor Scanning Synthetic Aperture Focusing Technique (SSC-SAFT) implemented in MATLAB R2021a [12,38].
SSC-SAFT reconstructs each image from signals captured by a single fixed transducer while the sample rotates in front of it. For every rotation angle, the algorithm back-projects the recorded signal onto a straight pixel line that runs from the sensor, through the grid center, to the diametrically opposite pixel on the detection circle, time-shifting the signal by the average speed of sound to focus each pixel. This delay-and-sum step is repeated for neighboring pixels within the transducer’s effective detection zone, whose width equals the element diameter. By coherently adding the focused contributions from all angles, SSC-SAFT produces images with high lateral resolution and fewer artefacts because it models the true sensor size [38]. Skipping the full wave-equation solution also makes the method fast, which is ideal for single-sensor, forward-detection scans that emulate a circular array.
The parameters for image reconstruction were a computational grid size of 4096 × 4096, a circular sensor array radius of 0.0158 m, a sensor length of 0.00952 m, and an estimated average speed of sound of 1350 m/s in the different media. The total computation time, from data loading to the final image, was approximately 45 s.

2.3. Image Analysis and Comparison

The reconstructed image from day 0 (the first acquisition) represents the initial state of the freshly extracted wisdom tooth, with its structural integrity and natural hydration intact and unaffected by time or environmental exposure. This image served as the reference for assessing changes over time.
For the comparative analysis, four quantitative metrics were employed (see Table 1). The Pearson correlation coefficient provides a global assessment of the linear relationship between corresponding pixel intensities; values close to 1 indicate strong similarity, whereas values near 0 denote decorrelation [39]. The Structural Similarity Index (SSIM) evaluates local luminance, contrast, and structural patterns within small windows, returning a score between 0 and 1, where 1 represents identical images from a perceptual standpoint [39,40,41]. The Mean Squared Error (MSE) quantifies the average squared difference between matched pixels; an MSE of 0 indicates a perfect match, while larger values signify greater dissimilarity [39,40]. The Peak Signal-to-Noise Ratio (PSNR) expresses that error on a logarithmic scale relative to the maximum possible pixel intensity; higher PSNR values indicate better fidelity [39,41].
Together, these metrics deliver complementary insights into changes in intensity, contrast, and structure, enabling a robust and objective evaluation of image alterations over time. Additionally, intensity profiles were extracted along horizontal, vertical, and diagonal lines passing through the center of each image, and these profiles were compared to assess spatial variations in brightness and contrast along those key orientations.

3. Results

3.1. Photoacoustic Imaging

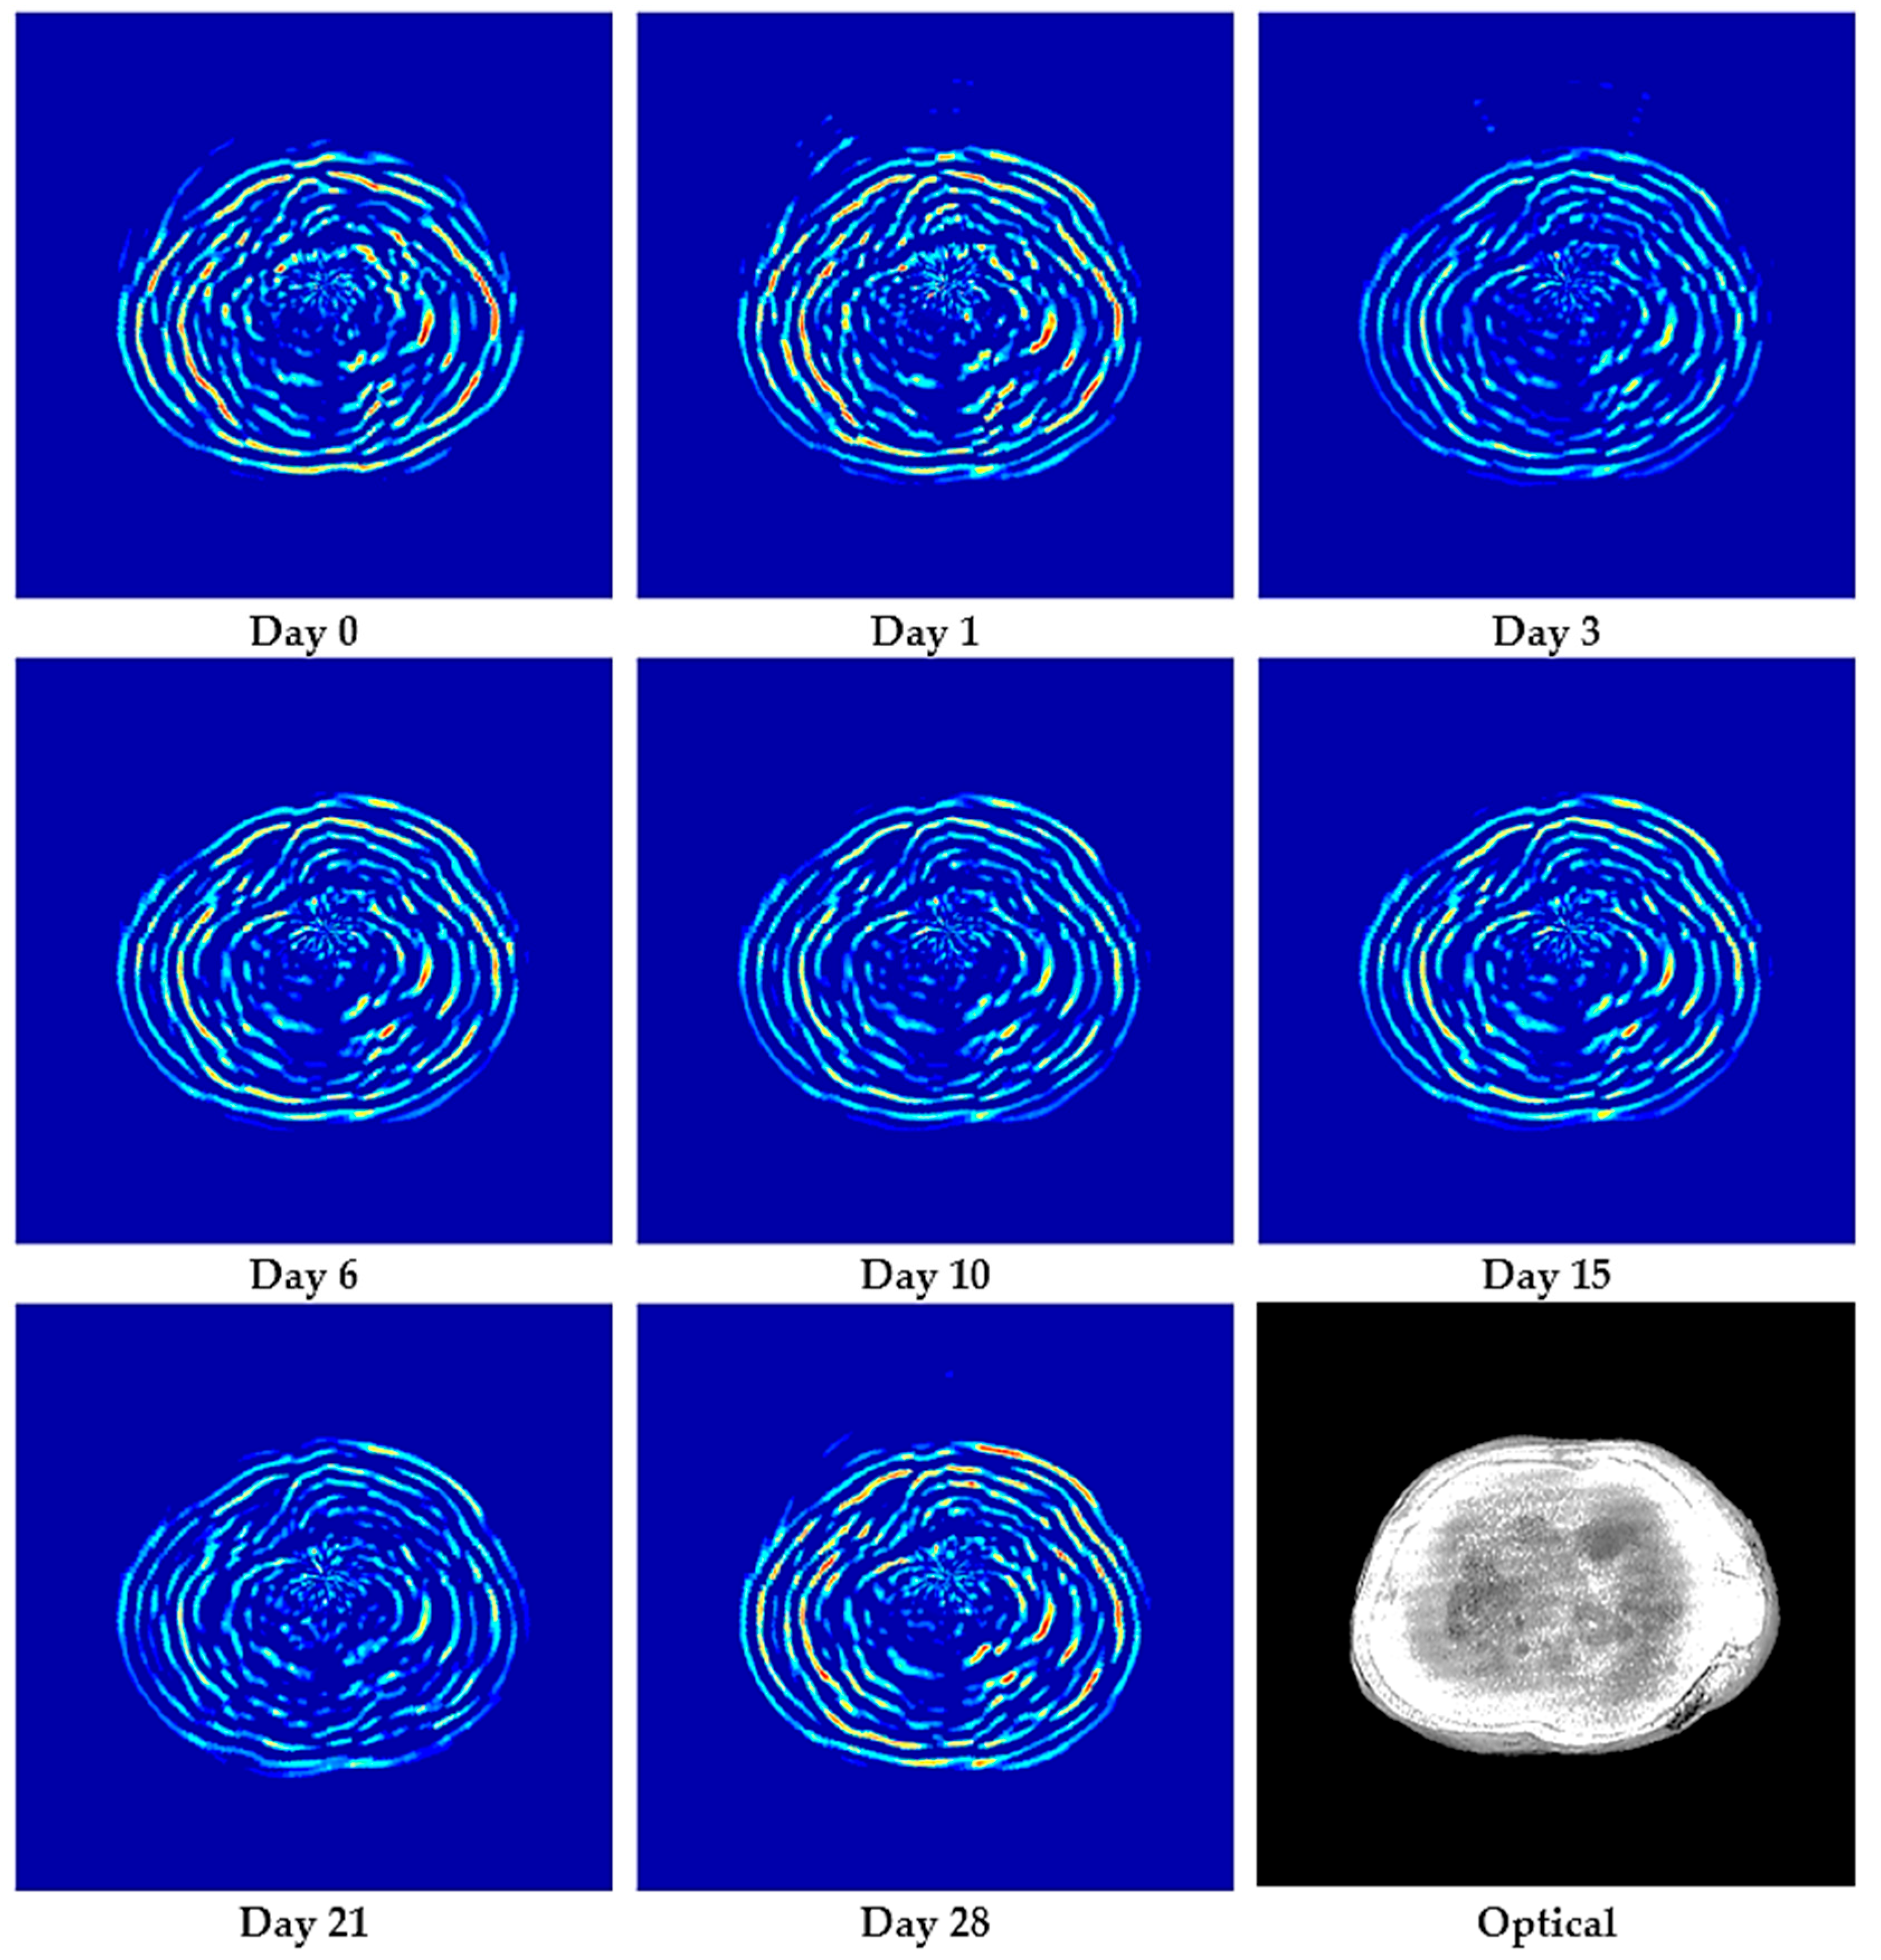
Figure 3 shows photoacoustic images of the entire wisdom tooth in the same scan plane on days 0, 1, 3, 6, 10, 15, 21, and 28 post-extraction. Also shown is an optical photograph of the corresponding cross-section, obtained by cutting the tooth after the last measurement (bottom right image). All PAIs were reconstructed using the SSC-SAFT algorithm. As can be seen, concentric rings appear throughout the tooth section. Over time, the outer rings remained relatively stable, showing only slight shape changes, while the inner rings exhibited more pronounced variations in both shape and intensity, especially in the central regions. These differences become increasingly evident as the days progress, indicating greater structural change inside the tooth than at its periphery.

3.2. Image Comparison Metrics

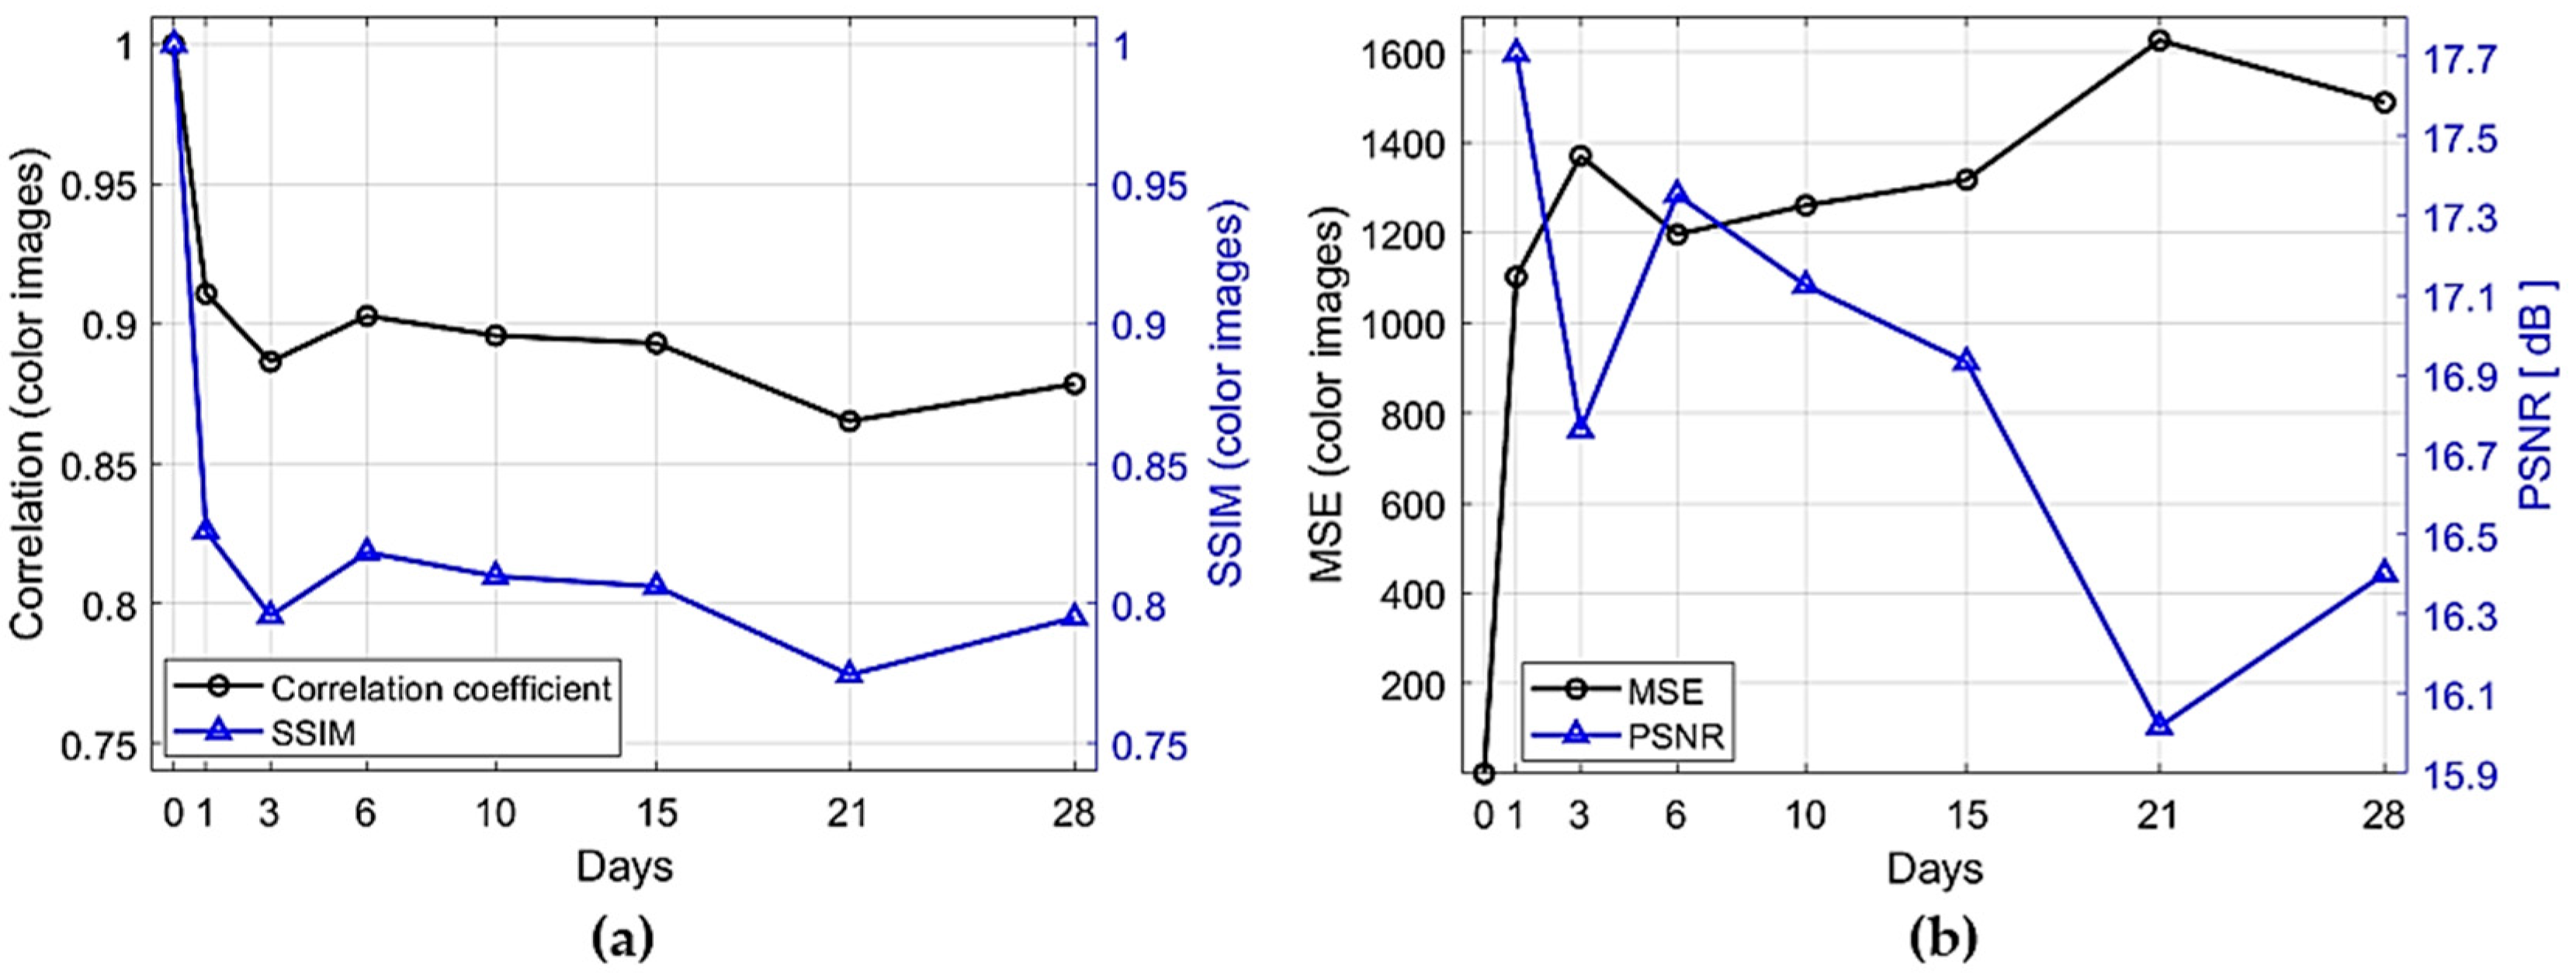
Figure 4 depicts the metrics used to assess the similarity of the PAIs (from Figure 3), showing a clear divergence relative to the day 0 reference over 28 days. In Figure 4a, the Pearson correlation falls sharply from 1.00 on day 0 to about 0.91 on day 1 (a ~9% drop), gradually decreasing to roughly 0.88 by day 28. This reduction from a perfect 1 toward lower values reflects a decrease in global linear correlation between pixel intensities. SSIM follows a similar trend but with a steeper decline, dropping from 1.00 to 0.83 on day 1 (a ~17% drop) and down to around 0.79 by day 28. Because SSIM combines local luminance, contrast, and structural comparisons within small windows, its decrease highlights a progressive perceptual degradation of texture and fine structural detail over time. In Figure 4b, MSE increases from 0 to approximately 1100 on the first day, reaching a maximum of 1600 on day 21, and then decreases slightly, reflecting the accumulating pixel-wise squared differences from the reference image. PSNR mirrors this behavior inversely, falling from infinity on day 0 to about 16.8 dB on day 1, reaching a minimum of 16.0 dB on day 21, and recovering modestly by day 28. Since PSNR expresses these errors on a logarithmic scale relative to the maximum pixel intensity, its decline corresponds directly to the growing pixel-level dissimilarity captured by the rising MSE.
These results confirm that the tooth’s internal structure undergoes measurable and progressive changes after extraction. The most pronounced alterations occur during the first 24 h (from day 0 to day 1) and then continue at a slower rate.

3.3. Image Intensity Profiles

Figure 5a shows the reference photoacoustic image (day 0), in which three dotted lines indicate the locations from which intensity profiles were extracted: horizontal (red), vertical (yellow), and diagonal (white). Figure 5b–d display the corresponding intensity profiles along these lines—horizontal, vertical, and diagonal, respectively—for days 0, 1, 3, 6, 10, 15, 21, and 28. Pixel intensity is plotted from the first sampled pixel at the image edge to the center. Although each image covers 330 × 350 pixels, the horizontal axis in the plots is limited to the region where the most relevant peaks appear, in order to display them more clearly. In Figure 5b, within the outer rings region from 1 to 100 pixels, all eight curves overlap closely, indicating consistent peak intensities at the same locations. However, from 100 to 175 pixels, the profiles diverge in both amplitude and position, reflecting progressive changes in the internal structure of the sample over time. In Figure 5c, the curves coincide from 1 to 105 pixels and then begin to spread out from 105 to 165 pixels, as they approach the center. Small spikes visible at the start of some vertical and diagonal profiles are residual artifacts that could not be completely removed during image processing. In Figure 5d, the outer region from 1 to 115 pixels again shows tight clustering of the curves, whereas in the inner region from 115 to 170 pixels, the profiles exhibit greater variability in both amplitude and peak location.

4. Discussion

In this proof-of-concept study, we investigated whether forward-detection PAT could noninvasively monitor structural changes in a cross-section of a wisdom tooth for 28 days post-extraction. By keeping all acquisition and reconstruction parameters constant during the measurement period, and using the day 0 image as our reference, we ensured that any observed variations in images from days 1, 3, 6, 10, 15, 21, and 28 were due solely to changes within the tooth. This is because, once removed from its physiological environment, the tooth begins to lose fluid, leading to alterations in density and, in turn, changes both the speed of sound propagation and its acoustic impedance. These shifts then affect the amplitudes of the recorded photoacoustic signals in the time window (see Figure 2) and manifest as variations in the reconstructed images. Below, we discuss three complementary sets of findings: qualitative structural PAIs (Figure 3), quantitative image similarity metrics (Figure 4), and qualitative intensity profiles along three directions (Figure 5), recognizing the inherent limitations of an ex vivo approach.
The PAIs in Figure 3 show that over time, the concentric patterns become less uniform, the rings grow progressively less defined, and the contrast decreases in the central regions. This evolution may be associated with a progressive reduction in the sample’s water content. Indeed, the observed concentric rings suggest differential dehydration between the tooth’s inner and outer areas. Specifically, in the superficial zone corresponding to the mineralized enamel, the outer rings show only very subtle changes, whereas in the internal zone corresponding to the dentin, where the content of water and organic components is higher [10,11], the inner rings undergo more pronounced structural variations as the days pass. These observations agree with previous studies reporting that dentin loses about 6.6% of its weight after one hour and 7.7% after 24 h of dehydration, and that this water loss greatly increases dentin’s mechanical properties, such as hardness, elastic modulus, and tensile strength [22]. Moreover, it has been reported that although dehydration seems to make enamel harder, it actually becomes more prone to wear and fracture [23]. Beyond these mechanical changes, water content has also been shown to alter tooth translucency and color during the first few minutes of drying [20,21]. In addition, dentin has been documented to undergo a much greater volume reduction than enamel when losing water; after one hour of dehydration, dentin lost 6% of its weight and showed a shrinkage of about 0.5%, whereas enamel lost only 1% and showed a shrinkage of just 0.03% [19]. Based on these reported findings, from the moment of extraction, the tooth suffers a sustained loss of water, primarily in the dentin. Because mass decreases far more than volume, density falls progressively, which in turn lowers the internal acoustic impedance. Overall, these findings support the idea that inner dentin experiences more significant structural and acoustic changes during drying.
The image similarity metrics in Figure 4 help to quantify these qualitative observations. The Pearson correlation coefficient and SSIM both show notable drops of about 9% and 17% on day 1, respectively, indicating a perceptible loss of similarity in the images, which continues gradually through day 28. Meanwhile, MSE and PSNR directly quantify pixel-level differences: MSE rises to around 1600 u.a. and PSNR falls to about 16.0 dB at the point of greatest change, with a slight recovery in PSNR between days 21–28, suggesting the onset of stabilization. Together, these metrics provide a robust evaluation of the dehydration dynamics, since both structural alterations and numerical discrepancies become more pronounced over time.
The intensity profiles in Figure 5 provide a spatially localized perspective on how dehydration affects different radial zones of the tooth, offering insights beyond those given by the similarity metrics. Along each of the three trajectories (horizontal, vertical, and diagonal), the peaks corresponding to the outer concentric rings remain closely clustered from day 0 to day 28, confirming that the mineralized enamel and superficial dentin layers undergo minimal structural change over time. In contrast, the inner ring peaks begin to diverge in both amplitude and position almost immediately after extraction. In the horizontal profile, this divergence appears between pixels 100–175; in the vertical profile, between pixels 105–165; and in the diagonal profile, between pixels 115–170. This behavior may indicate that the deeper dentin layers are losing fluid and becoming acoustically less efficient at transmitting pressure waves, and that the tooth’s anisotropic microstructure could further accentuate dehydration effects along certain axes. These observations support the idea that dentin, having a higher water content, experiences more significant dehydration and more noticeable acoustic changes than enamel. Although our profiles are limited to a single cross-section under ex vivo conditions, they suggest that intensity sampling in different directions can reveal not only whether structural changes occur in the tooth but also precisely where, a capability that could prove invaluable when extending PAT to in vivo 3D monitoring of dental tissues.
These observations support our initial hypothesis that continuous density changes in dentin affect acoustic propagation and drive the temporal and regional variations observed in the reconstructed PAIs. Our qualitative and quantitative findings indicate that dehydration-related density decreases, most pronounced in dentin, underlie the internal changes captured in the images. Optically, hydrated dentin exhibits a higher absorption coefficient than enamel due to its greater organic and water content [15,16]. As dehydration progresses, the translucency of both tissues diminishes [21,42]. Acoustically, the impedance of hydrated enamel and dentin is approximately 13–17.5 MRayl and 8–9.5 MRayl, respectively [10,43]. With dehydration, enamel shows minimal change, while dentin, being more sensitive to water loss, experiences a moderate decrease in acoustic impedance due to reduced density [22], supporting the photoacoustic signal variations described.
The consistency between the evolution of intensity profiles and image similarity metrics reinforces the reliability of PAT for monitoring dental dehydration. However, because ex vivo conditions differ from those in vivo, future studies under physiological conditions and with volumetric reconstructions will be necessary to validate and extend this methodology. Moreover, while this study focused on structural image reconstruction, combining it with functional imaging could provide a deeper understanding of dental properties.
Our results provide a clear answer to the research question: PAT-derived metrics successfully detect and quantify structural changes in an ex vivo human molar over a 28-day period. The marked drop in Pearson correlation and SSIM from day 0 to day 1, the steady rise in MSE and decrease in PSNR from day 1 to day 28, and the progressive shifts in radial intensity profiles together confirm that PAT offers a quantitative measure of dehydration-driven alterations in tooth structure. To our knowledge, there are no universally accepted metric thresholds for dental tissues in PAT. Based on our results from a single scan, we can consider that changes exceeding twice the typical standard deviation, or approximately ∆Pearson ≥ 5%, ∆SSIM ≥ 10%, ∆MSE ≥ 50%, and ∆PSNR ≥ 5% relative to the baseline, suggest a meaningful structural alteration. These criteria should be validated in future multi-sample studies.
Despite the promising findings, the current approach presents certain limitations. One key limitation is the use of a pulsed laser module, which could be replaced with more compact, cost-effective, and safer alternatives. Semiconductor-based light sources, such as pulsed laser diodes (PLDs), vertical-cavity surface-emitting lasers (VCSELs), and light-emitting diodes (LEDs) [44], can be integrated into ultrasound probes to form portable systems suited for dental applications [45]. These light sources deliver sufficient energy for high-contrast surface imaging, making them ideal for chairside evaluations [28,46]. Also, several challenges must be addressed for clinical translation, including limited intraoral space, complex probe positioning, patient movement, anatomical variability, and the need for effective light delivery without causing tissue overheating.
Finally, as a future validation step, photoacoustic findings could be compared with micro-computed tomography (micro-CT), which offers non-destructive, 3D density maps of the entire tooth at micron-scale resolution [27]. Micro-CT can detect changes in dentin porosity, internal cracks, and density variations caused by dehydration [47], and is also sensitive to the opening and visibility of microcracks under different moisture conditions [48]. By co-registering micro-CT volumetric slices with PAT cross-sections, one could directly confirm that variations in photoacoustic signals correspond to real internal structural changes, thus reinforcing the technical robustness of the dehydration measurements.

5. Conclusions

In this study, we show that PAT in forward-detection mode can noninvasively capture structural changes in the cross-section of a wisdom tooth over a 28-day post-extraction period. By maintaining all acquisition and reconstruction parameters constant, we were able to associate the observed changes in the images with progressive alterations in tissue structure. Qualitative analysis revealed that enamel and superficial dentin maintain their integrity, while deeper dentin regions at the center of the images exhibit a gradual loss of definition and contrast. These changes were most pronounced during the first 24 h after extraction, followed by slower progression in the subsequent days, consistent with a rapid loss of water and continued drying of the inner layers. Quantitative metrics reinforced these observations. The Pearson correlation coefficient fell by approximately 9% and SSIM by 17% on day 1, then continued to decline more gradually through day 28. Meanwhile, MSE rose to about 1600 u.a. and PSNR dropped to around 16 dB at the point of greatest change, indicating measurable global and local shifts in image quality. Complementing these metrics, intensity profiles sampled along the horizontal, vertical, and diagonal axes (over pixel ranges of 100–175, 105–165, and 115–170, respectively) provided precise spatial localizations of these alterations. There, peaks corresponding to outer rings remained tightly grouped, whereas inner rings’ peaks diverge in both amplitude and position, supporting the idea that dentin, with its higher water content and anisotropic microstructure, undergoes more significant dehydration and acoustic changes than enamel. Although this is a proof-of-concept study, our findings show the feasibility of using PAT to monitor dehydration-related changes in dental tissue. While ex vivo conditions may introduce artifacts, the method’s sensitivity to internal variations, particularly those associated with water loss in dentin, positions it as a promising tool for future clinical applications. Advancing toward implementation will require in vivo validation, the development of volumetric reconstruction techniques, and the integration of functional imaging to enable a detailed assessment of the structural and biophysical properties of dental tissues.

Author Contributions

Conceptualization, M.P.C.-G. and A.P.-P.; methodology, M.P.C.-G.; software, M.P.C.-G. and M.R.-V.; validation, R.C.-G., G.G.-J. and G.M.-A.; formal analysis, M.P.C.-G.; investigation, M.P.C.-G.; resources, A.P.-P. and R.G.R.-C.; writing—original draft preparation, M.P.C.-G.; writing—review and editing, M.P.C.-G.; supervision, A.P.-P. and R.C.-G.; funding acquisition, A.P.-P. All authors have read and agreed to the published version of the manuscript.

Funding

The APC was funded by the Research Department of the General Hospital of Mexico “Dr. Eduardo Liceaga” and by the grant UNAM-DGAPA-PAPIIT IT101525.

Institutional Review Board Statement

Not applicable.

Informed Consent Statement

Not applicable.

Data Availability Statement

Data is available if required.

Acknowledgments

This paper was supported by the General Hospital of Mexico “Dr. Eduardo Liceaga” (DI/22/301/03/40). Marco P. Colín-García acknowledges SECIHTI for the PhD studies grant (CVU: 1085013).

Conflicts of Interest

The authors declare no conflicts of interest.

Abbreviations

The following abbreviations are used in this manuscript:
MSEMean Squared Error
PAIsPhotoacoustic Images
PATPhotoacoustic Tomography
PSNRPeak Signal-to-Noise Ratio
SSC-SAFTSingle Sensor Scanning Synthetic Aperture Focusing Technique
SSIMStructural Similarity Index

Appendix A

Table A1. Summary of some photoacoustic imaging studies focused on dental samples.
Reference
(Year)
Imaging
Modality
Experimental
Configuration
Application
Focus
Key
Findings
Detection
Mode
In Vivo
Ex Vivo
Cheng et al.
(2016) [26]
Dual-contrast PAT
(B-mode +
S-mode)
Nd:YAG (532 nm, 10 Hz, 80 mJ); single-element transducer (4.39 MHz), circular mechanical scan (120 steps); reconstruction: B-mode (delay and sum) and S-mode (spectral-slope)Early dental lesion
detection
Dual-contrast improves early caries visualization (higher lesion contrast)Backwardex vivo
Moore et al.
(2018) [31]
Clinical
PA-US
Nd:YAG (680 nm, 20 Hz, 5ns); linear array transducer (16, 21, 40 MHz); axial scanning; cuttlefish-ink contrast; image J analysisPeriodontal pocket monitoring ~ 0.01 mm depth precision; full pocket coverage, measurements matched manual probingBackwardin vivo
da Silva et al.
(2021) [30]
Visible
and NIR
PAM
Nd:YAG (532/1064 nm, 10 Hz, 17 mJ/cm2); transducer (5 MHz); scanning X-Y (0.5 mm); color-map amplitudeIncipient
occlusal caries detection
1064 nm gives stronger PA signal than 532 nmBackwardex vivo
Schneider et al.
(2022) [27]
Multispectral optoacoustic tomographyMSOT inVision-256 (680–960 nm); teeth embedded in agarose/intralipid; back projection reconstruction3D
reconstruction
of teeth vs
micro-CT
/CBCT
Best PAT contrast at 680 nm; PAT 3D reconstructions comparable to CBCT vs. micro-CT referenceRing arrayex vivo
Periyasamy et al.
(2024) [29]
Circular
and linear
PAT
Circular PAT: Nd:YAG (532/1064 nm, 3.18 mJ/cm2), transducer (2.25 MHz); delay and sum reconstruction
Linear PAT: LED (850 nm, 0.4 mJ); transducer (7 MHz), 128 channels; delay and sum reconstruction
Teeth with caries/pigmentation; comparison to X-ray CTCircular PAT at 1064 nm better captured surface than 532 nm; Linear PAT detected dentin cavities and strong signals from pigmented cariesForwardex vivo
This work (2025)Single-sensor
PAT
Nd:YAG (532 nm, 10 Hz, 9.5 mJ); single-element transducer (5 MHz), sample rotation (1.8° × 200 steps) to emulate circular array; SSC-SAFT reconstructionMonitoring dehydration-driven structural changes over 28 daysLargest structural change on day 1; progressive inner-region alterations; radial profiles localize inner changes.Forwardex vivo

References

  1. Zhou, Y.; Yao, J.; Wang, L.V. Tutorial on Photoacoustic Tomography. J. Biomed. Opt. 2016, 21, 061007. [Google Scholar] [CrossRef] [PubMed]
  2. Xia, J.; Yao, J.; Wang, L.V. Photoacoustic Tomography: Principles and Advances. Electromagn. Waves 2014, 147, 1–22. [Google Scholar] [CrossRef] [PubMed]
  3. Manohar, S.; Daniel, R. Photoacoustics: A Historical Review. Adv. Opt. Photonics 2016, 8, 586–617. [Google Scholar] [CrossRef]
  4. Gutiérrez-Juárez, G.; Sims, M.J.; Gupta, S.K.; Viator, J.A. Application of the Pulsed Photoacoustic Spectroscopy in Biomedicine. AIP Conf. Proc. 2008, 1032, 70–78. [Google Scholar] [CrossRef]
  5. Neprokin, A.; Broadway, C.; Myllylä, T.; Bykov, A.; Meglinski, I. Photoacoustic Imaging in Biomedicine and Life Sciences. Life 2022, 12, 588. [Google Scholar] [CrossRef]
  6. Beard, P. Biomedical Photoacoustic Imaging. Interface Focus 2011, 1, 602–631. [Google Scholar] [CrossRef]
  7. Windra Sari, A.; Widyaningrum, R.; Setiawan, A. Mitrayana Recent Development of Photoacoustic Imaging in Dentistry: A Review on Studies over the Last Decade. Saudi Dent. J. 2023, 35, 423–436. [Google Scholar] [CrossRef]
  8. Lacruz, R.S.; Habelitz, S.; Wright, J.T.; Paine, M.L. Dental Enamel Formation and Implications for Oral Health and Disease. Physiol. Rev. 2017, 97, 939–993. [Google Scholar] [CrossRef]
  9. Gutiérrez-Salazar, M.d.P.; Reyes-Gasga, J. Microhardness and Chemical Composition of Human Tooth. Mater. Res. 2003, 6, 367–373. [Google Scholar] [CrossRef]
  10. Raum, K.; Kempf, K.; Hein, H.J.; Schubert, J.; Maurer, P. Preservation of Microelastic Properties of Dentin and Tooth Enamel in Vitro-A Scanning Acoustic Microscopy Study. Dent. Mater. 2007, 23, 1221–1228. [Google Scholar] [CrossRef]
  11. Featherstone, J.D.B.; Fried, D. Fundamental Interactions of Lasers with Dental Hard Tissues. Med. Laser Appl. 2001, 16, 181–194. [Google Scholar] [CrossRef]
  12. Colín-García, M.P.; Ruiz-Veloz, M.; Polo-Parada, L.; Castañeda-Guzmán, R.; Gutiérrez-Juárez, G.; Pérez-Pacheco, A.; Ramírez-Chavarría, R.G. Photoacoustic Image Analysis of Dental Tissue Using Two Wavelengths: A Comparative Study. Photonics 2024, 11, 678. [Google Scholar] [CrossRef]
  13. Kang, J.; Kim, E.K.; Young Kwak, J.; Yoo, Y.; Song, T.K.; Ho Chang, J. Optimal Laser Wavelength for Photoacoustic Imaging of Breast Microcalcifications. Appl. Phys. Lett. 2011, 99, 153702. [Google Scholar] [CrossRef]
  14. Blodgett, D.W. Ultrasonic Assessment of Tooth Structure. In Laser Tissue Interaction XIII: Photochemical, Photothermal, and Photomechanical; SPIE: Bellingham, WA, USA, 2002; Volume 4617, pp. 284–288. [Google Scholar] [CrossRef]
  15. Fried, D.; Glena, R.E.; Featherstone, J.D.B.; Seka, W. Nature of Light Scattering in Dental Enamel and Dentin at Visible and Near-Infrared Wavelengths. Appl. Opt. 1995, 34, 1278–1285. [Google Scholar] [CrossRef]
  16. Da Silva, T.M.; De Oliveira, H.P.M.; Severino, D.; Balducci, I.; Huhtala, M.F.R.L.; Gonçalves, S.E.P. Direct Spectrometry: A New Alternative for Measuring the Fluorescence of Composite Resins and Dental Tissues. Oper. Dent. 2014, 39, 407–415. [Google Scholar] [CrossRef]
  17. Luk, K.; Zhao, I.S.; Gutknecht, N.; Chu, C.H. Use of Carbon Dioxide Lasers in Dentistry. Lasers Dent. Sci. 2019, 3, 1–9. [Google Scholar] [CrossRef]
  18. Dogandzhiyska, V.; Angelov, I.; Dimitrov, S.; Uzunov, T. In Vitro Study of Light Radiation Penetration through Dentin, According to the Wavelength. Acta Medica Bulg. 2015, 42, 16–22. [Google Scholar] [CrossRef]
  19. Zhang, D.; Mao, S.; Lu, C.; Romberg, E.; Arola, D. Dehydration and the Dynamic Dimensional Changes within Dentin and Enamel. Dent. Mater. 2009, 25, 937–945. [Google Scholar] [CrossRef]
  20. Suliman, S.; Sulaiman, T.A.; Olafsson, V.G.; Delgado, A.J.; Donovan, T.E.; Heymann, H.O. Effect of Time on Tooth Dehydration and Rehydration. J. Esthet. Restor. Dent. 2019, 31, 118–123. [Google Scholar] [CrossRef]
  21. Alamé, C.; Mehanna Zogheib, C. The Effect of Dehydration on Tooth Color: A Prospective In Vivo Study. Cureus 2023, 15, e48140. [Google Scholar] [CrossRef]
  22. Almas Chowdhury, A.F.; Alam, A.; Islam, R.R.; Yamauti, M.; Alam, S.; Rahman, M.; Álvarez, P.; Sano, H. The Influences of Dehydration on the Mechanical Properties of Human Dentin. Minerals 2021, 11, 336. [Google Scholar] [CrossRef]
  23. Hua, L.C.; Wang, W.Y.; Swain, M.V.; Zhu, C.L.; Huang, H.B.; Du, J.K.; Zhou, Z.R. The Dehydration Effect on Mechanical Properties of Tooth Enamel. J. Mech. Behav. Biomed. Mater. 2019, 95, 210–214. [Google Scholar] [CrossRef]
  24. Xu, M.; Wang, L.V. Photoacoustic Imaging in Biomedicine. Rev. Sci. Instrum. 2006, 77, 041101. [Google Scholar] [CrossRef]
  25. Wang, L.V.; Hu, S. Photoacoustic Tomography: In Vivo Imaging from Organelles to Organs. Science 2012, 335, 1458–1462. [Google Scholar] [CrossRef]
  26. Cheng, R.; Shao, J.; Gao, X.; Tao, C.; Ge, J.; Liu, X. Noninvasive Assessment of Early Dental Lesion Using a Dual-Contrast Photoacoustic Tomography. Sci. Rep. 2016, 6, 21798. [Google Scholar] [CrossRef]
  27. Schneider, S.J.M.; Höhne, C.; Schneider, M.; Schmitter, M. Photoacoustic Tomography versus Cone-Beam Computed Tomography versus Microcomputed Tomography: Accuracy of 3D Reconstructions of Human Teeth. PLoS ONE 2022, 17, e0274818. [Google Scholar] [CrossRef]
  28. Tasmara, F.A.; Widyaningrum, R.; Setiawan, A.; Mitrayana, M. Photoacoustic Imaging of Hidden Dental Caries Using Visible–Light Diode Laser. J. Appl. Clin. Med. Phys. 2023, 24, e13935. [Google Scholar] [CrossRef]
  29. Periyasamy, V.; Gisi, K.; Pramanik, M. Ex Vivo Human Teeth Imaging with Various Photoacoustic Imaging Systems. Biomed. Opt. Express 2024, 15, 5479–5490. [Google Scholar] [CrossRef]
  30. da Silva, E.J.; de Miranda, E.M.; de Oliveira Mota, C.C.B.; Das, A.; Gomes, A.S.L. Photoacoustic Imaging of Occlusal Incipient Caries in the Visible and Near-Infrared Range. Imaging Sci. Dent. 2021, 51, 107–115. [Google Scholar] [CrossRef]
  31. Moore, C.; Bai, Y.; Hariri, A.; Sanchez, J.B.; Lin, C.Y.; Koka, S.; Sedghizadeh, P.; Chen, C.; Jokerst, J.V. Photoacoustic Imaging for Monitoring Periodontal Health: A First Human Study. Photoacoustics 2018, 12, 67–74. [Google Scholar] [CrossRef]
  32. Sari, A.W.; Widyaningrum, R.; Mitrayana, M. Photoacoustic Imaging for Periodontal Disease Examination. J. Lasers Med. Sci. 2022, 13, e37. [Google Scholar] [CrossRef]
  33. Park, B.; Oh, D.; Kim, J.; Kim, C. Functional Photoacoustic Imaging: From Nano- and Micro- to Macro-Scale. Nano Converg. 2023, 10, 29. [Google Scholar] [CrossRef]
  34. Zhang, H.F.; Maslov, K.; Stoica, G.; Wang, L.V. Functional Photoacoustic Microscopy for High-Resolution and Noninvasive in Vivo Imaging. Nat. Biotechnol. 2006, 24, 848–851. [Google Scholar] [CrossRef]
  35. Tarvainen, T.; Cox, B. Quantitative Photoacoustic Tomography: Modeling and Inverse Problems. J. Biomed. Opt. 2023, 29, S11509. [Google Scholar] [CrossRef]
  36. Mallidi, S.; Luke, G.P.; Emelianov, S. Photoacoustic Imaging in Cancer Detection, Diagnosis, and Treatment Guidance. Trends Biotechnol. 2011, 29, 213–221. [Google Scholar] [CrossRef]
  37. Stan, A.T.; Idorași, L.; Stan, V.F.; Rogobete, A.F.; Sinescu, C.; Negruțiu, M.L.; Romînu, M. Photoacoustic Microscopy in Dental Medicine. J. Interdiscip. Med. 2017, 2, 53–56. [Google Scholar] [CrossRef]
  38. Ruiz-Veloz, M.; Gutiérrez-Juárez, G.; Polo-Parada, L.; Cortalezzi, F.; Kline, D.D.; Dantzler, H.A.; Cruz-Alvarez, L.; Castro-Beltrán, R.; Hidalgo-Valadez, C. Image Reconstruction Algorithm for Laser-Induced Ultrasonic Imaging: The Single Sensor Scanning Synthetic Aperture Focusing Technique. J. Acoust. Soc. Am. 2023, 153, 560–572. [Google Scholar] [CrossRef]
  39. Dohmen, M.; Klemens, M.A.; Baltruschat, I.M.; Truong, T.; Lenga, M. Similarity and Quality Metrics for MR Image-to-Image Translation. Sci. Rep. 2025, 15, 3853. [Google Scholar] [CrossRef]
  40. Al Najjar, Y. Comparative Analysis of Image Quality Assessment Metrics: MSE, PSNR, SSIM and FSIM. Int. J. Sci. Res. 2024, 13, 110–114. [Google Scholar] [CrossRef]
  41. Wang, Z.; Bovik, A.C.; Sheikh, H.R.; Simoncelli, E.P. Image Quality Assessment: From Error Visibility to Structural Similarity. IEEE Trans. Image Process. 2004, 13, 600–612. [Google Scholar] [CrossRef]
  42. Brodbelt, R.H.W.; O’brien, W.J.; Fan, P.L.; Frazer-Dib, J.G.; Yu, R. Translucency of Human Dental Enamel. J. Dent. Res. 1981, 60, 1749–1753. [Google Scholar] [CrossRef]
  43. Demirkan, I.; Yaprak, G.; Ceylan, C.; Algul, E.; Tomruk, C.O.; Bilen, B.; Unlu, M.B. Acoustic Diagnosis of Elastic Properties of Human Tooth by 320 MHz Scanning Acoustic Microscopy after Radiotherapy Treatment for Head and Neck Cancer. Radiat. Oncol. 2020, 15, 38. [Google Scholar] [CrossRef]
  44. Ajith Singh, M.K. LED-Based Photoacoustic Imaging; Progress in Optical Science and Photonics; Springer: Singapore, 2020; Volume 7, p. 393. [Google Scholar] [CrossRef]
  45. Francis, K.J.; Boink, Y.E.; Dantuma, M.; Kuniyil Ajith Singh, M.; Manohar, S.; Steenbergen, W. Light Emitting Diodes Based Photoacoustic and Ultrasound Tomography: Imaging Aspects and Applications; Springer: Singapore, 2020; Volume 7, ISBN 9789811539848. [Google Scholar]
  46. Allen, T.J.; Beard, P.C. High Power Visible Light Emitting Diodes as Pulsed Excitation Sources for Biomedical Photoacoustics. Biomed. Opt. Express 2016, 7, 1260–1270. [Google Scholar] [CrossRef]
  47. Shemesh, H.; Lindtner, T.; Portoles, C.A.; Zaslansky, P. Dehydration Induces Cracking in Root Dentin Irrespective of Instrumentation: A Two-Dimensional and Three-Dimensional Study. J. Endod. 2018, 44, 120–125. [Google Scholar] [CrossRef]
  48. Tatchev, D.; Tsenova-Ilieva, I.; Vassilev, T.; Karova, E. The Effect of Experimental Conditions in Root Dentin Microcracks Detection by Micro-Computed Tomography. J. Mech. Behav. Biomed. Mater. 2022, 128, 105108. [Google Scholar] [CrossRef]
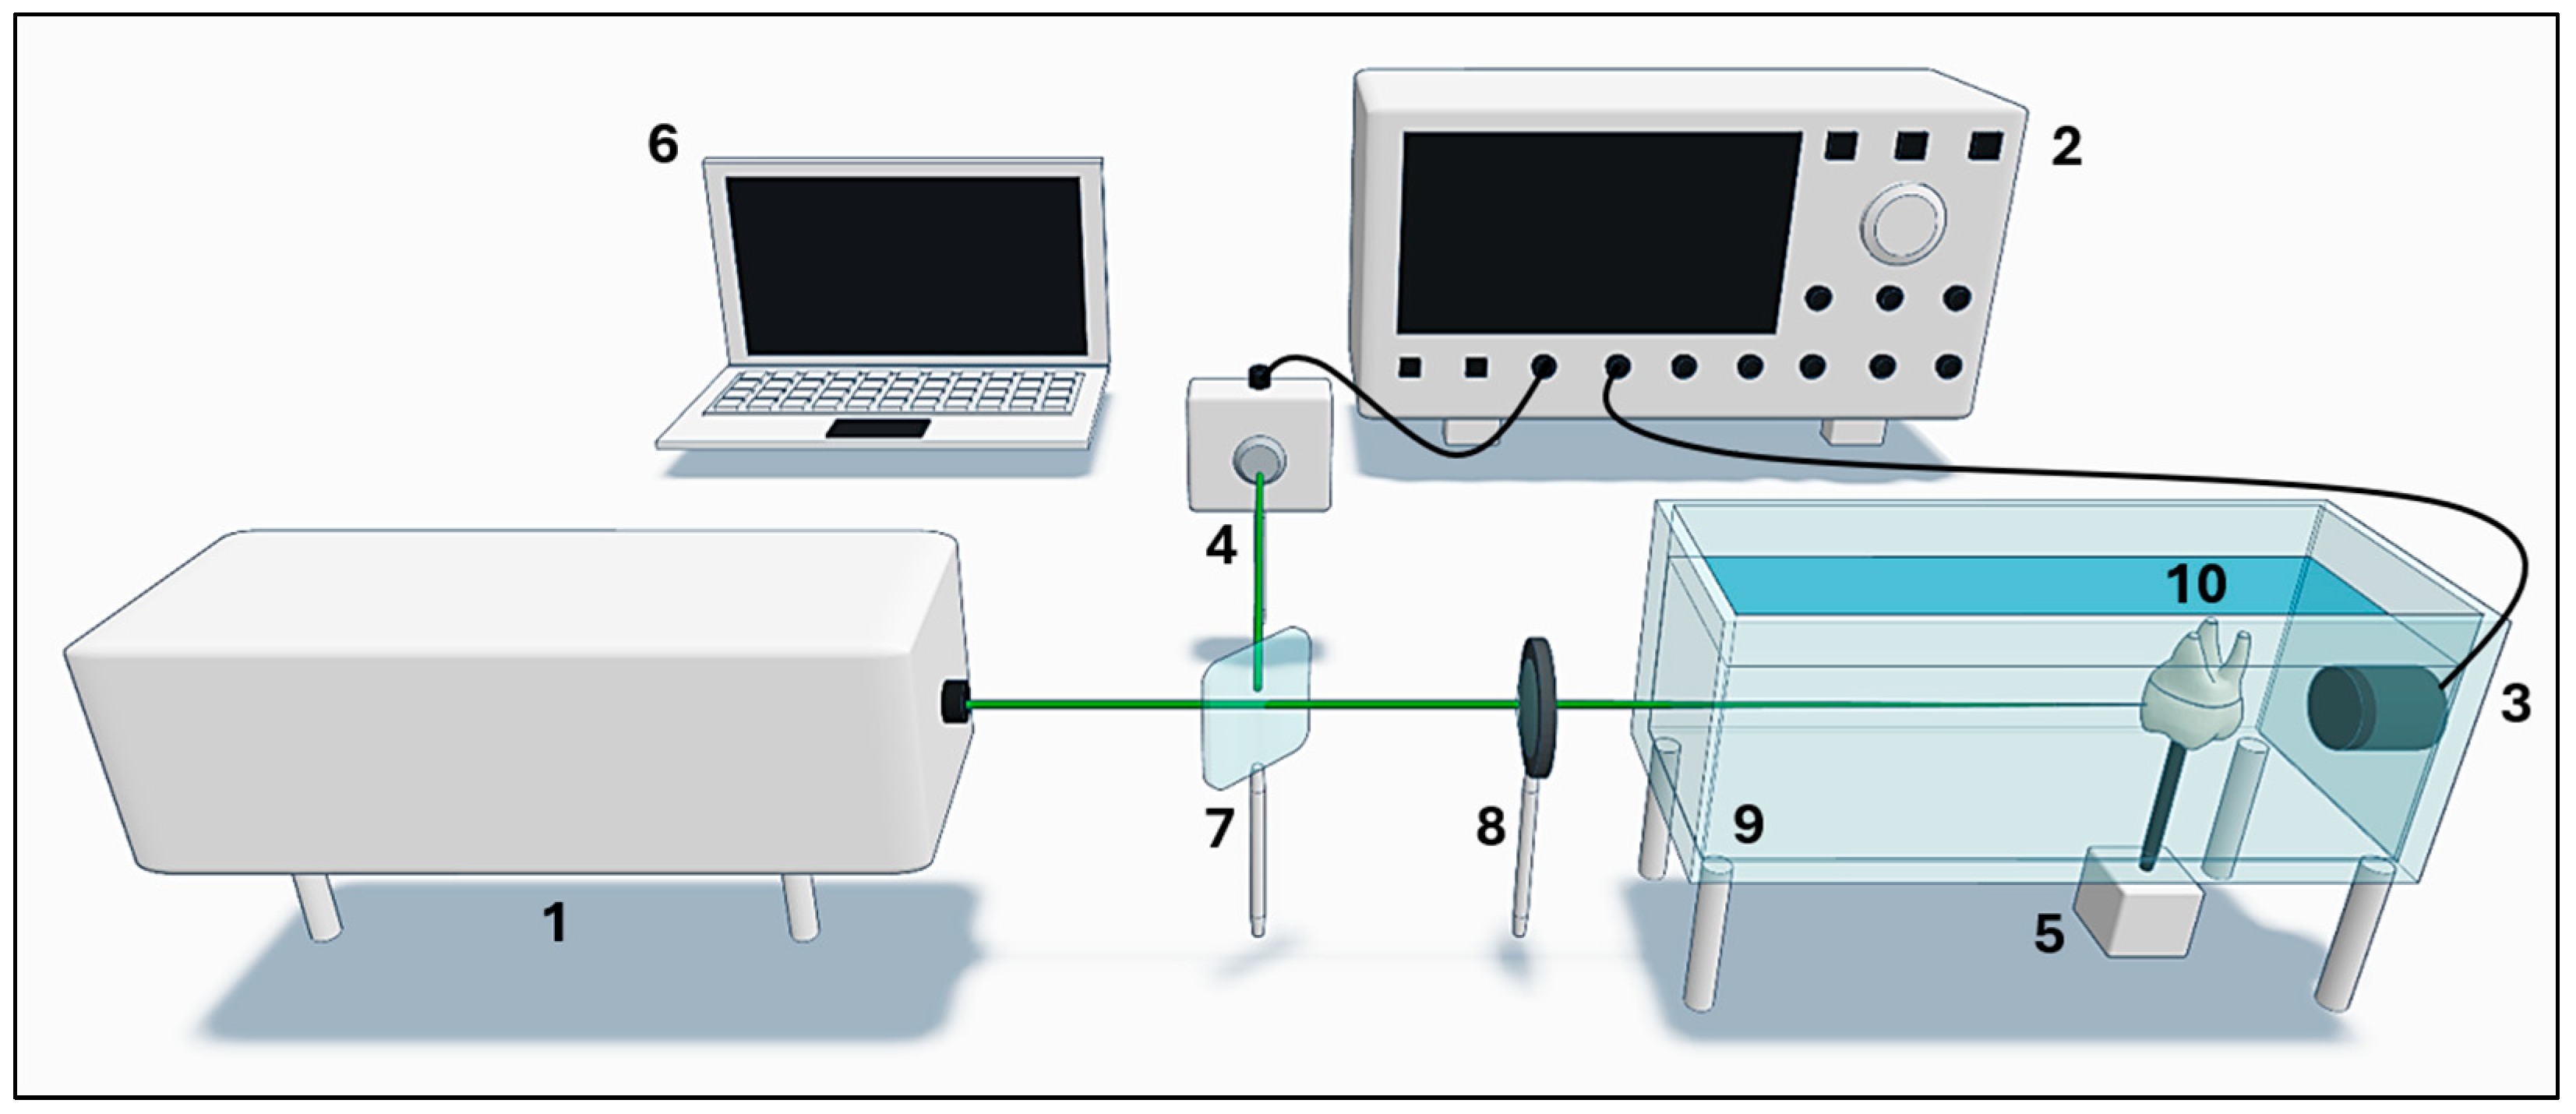
Figure 1. Schematic of the experimental setup. The laser beam was focused onto the sample surface to induce acoustic waves, which were detected in forward mode by the transducer and recorded on a laptop. The stepper motor rotated the sample at 1.8° increments until completing a full revolution. The system components were: (1) pulsed laser, (2) oscilloscope, (3) ultrasound transducer, (4) photodetector, (5) stepper motor, (6) laptop, (7) beam splitter, (8) lens, (9) container, and (10) sample.
Applsci 15 09146 g001
Figure 2. Photoacoustic sinograms of an extracted wisdom tooth, recorded on days 0, 1, 3, 6, 10, 15, 21, and 28 post-extraction. Each subplot displays signal amplitude (color scale) versus time-of-flight (horizontal axis) and sensor rotation angle around the sample (vertical axis).
Applsci 15 09146 g002
Figure 3. Photoacoustic images (PAIs) of the wisdom tooth reconstructed on the same scanning plane at days 0, 1, 3, 6, 10, 15, 21, and 28 post-extraction, shown together with an optical photograph of the corresponding cross-section, taken after the day 28 acquisition.
Applsci 15 09146 g003
Figure 4. Quantitative evaluation of the similarity between the PAIs (day 1, 3, 6, 10, 15, 21, and 28) and the reference image (day 0): (a) Pearson correlation measures the global linear relationship between pixel intensities, while SSIM compares local patterns of luminance, contrast, and structure; (b) MSE computes the average squared difference between images, and PSNR expresses this error relative to the maximum pixel intensity on a logarithmic scale.
Applsci 15 09146 g004
Figure 5. Intensity profiles along horizontal, vertical, and diagonal lines were extracted from photoacoustic images acquired on days 0, 1, 3, 6, 10, 15, 21, and 28: (a) reference image (day 0) with dashed lines indicating the horizontal (red), vertical (yellow), and diagonal (white) profiles; (bd) pixel intensity plots from the first sampled pixel at the image boundary to the center: (b) horizontal profile; (c) vertical profile; (d) diagonal profile.
Applsci 15 09146 g005
Table 1. Summary of quantitative image similarity metrics.
MetricCategoryComparison
Basis
MATLAB
Function
FormulaScale
Interpretation
CorrelationStatisticalPixel
by pixel
corr2(A, B) r = i ( A i A ¯ ) ( B i B ¯ ) i ( A i A ¯ ) 2 i ( B i B ¯ ) 2 Range: [−1, 1]
1 = perfect linear correlation
0 = nonlinear correlation
SSIMStructuralLocal
window
ssim(A, B) S S I M = ( 2 μ A μ B + C 1 ) ( 2 σ A B + C 2 ) μ A 2 + μ B 2 + C 1 σ A 2 + σ B 2 + C 2 Range: [0, 1]
1 = identical
<1 = local degradation
MSEErrorPixel
by pixel
immse(A, B) M S E = 1 N i = 1 N ( A i B i ) 2 Range: [0, ∞)
0 = identical
>0 = more error
PSNRErrorPixel
by pixel
psnr(A, B) P S N R = 10 l o g 10 M A X 2 M S E Range: [0, ∞) dB
∞ = identical
<∞ = more error
Note: A and B denote the two images being compared; subscript i refers to the i-th pixel in each image; A ¯ and B ¯ are the mean intensities of A and B; μ A and μ B are local mean intensities in each sliding window; σ A 2 and σ B 2 are local variances; σ A B is the local covariance; C1 and C2 are stability constants; N is the total number of pixels; and MAX is the maximum possible pixel value.
Disclaimer/Publisher’s Note: The statements, opinions and data contained in all publications are solely those of the individual author(s) and contributor(s) and not of MDPI and/or the editor(s). MDPI and/or the editor(s) disclaim responsibility for any injury to people or property resulting from any ideas, methods, instructions or products referred to in the content.