Abstract
The strawberry is the most widely consumed berry in Europe, with a high content of minerals and bioactive compounds. During drying, the bioactive compounds are concentrated, but also partially degraded due to the interaction of high temperature and oxygen, among other factors. In this study, the effect of ultrasound support during the drying of strawberry slices of two cultivars, ‘Florence’ and ‘Alba’, was investigated. The effect of ultrasound application on the rate of drying, the retention of phenolic compounds and ascorbic acid, as well as the total colour difference, was measured. The time of ultrasonic-assisted drying was shorter than unassisted drying for the ‘Florence’ and ‘Alba’ cultivars, respectively, 35.7% and 34.6%. In addition, the dried product obtained with ultrasound had comparable antioxidant activity and polyphenol content. It was also shown that ultrasound can be successfully used in convective dryers without major equipment modifications.
1. Introduction
Drying, as one of the oldest methods of food preservation, has seen many modifications to make the process more efficient. Nevertheless, the drying process is still expensive due to the amount of energy needed to evaporate the water and the long time it takes. Moreover, drying of food brings adverse quality changes concerning: the decrease of bioactive compounds content, deterioration of colour, structural collapse and volume shrinkage, which affect sensory properties [1]. Ultrasound-assisted convective drying is one of the techniques by which the drying process can be accelerated and the dried material can have better quality compared to conventional drying techniques [2]. According to the literature, ultrasound-assisted drying was beneficial in reducing drying time, while positively influencing physicochemical properties, colour retention and rehydration ability, as well as carotenoids, ascorbic acid content and antioxidant capacity [3]. However, like any technique, it is subject to numerous limitations, which hinder its application industrially. One of the main issues concerns drying conditions, the optimization of which may be crucial to obtain a beneficial ultrasound (US) effect. In addition to humidity, temperature and air velocity, the impact of US in the drying process is also affected by the way it is applied and the properties of the dried material itself. For example, the impact of US in convection drying decreases as temperature increases. The same observations were made in the case of airflow, where the beneficial impact of US decreases with increasing airflow [4]. This is a serious limitation, since the lowering of air temperature and flow, further compromises the speed of this process. It is also postulated that there is a relationship between the effectiveness of US application and the structure of the material being dried. It has been shown that materials of high volumetric density do not respond significantly in terms of drying kinetics to US assistance during drying [5]. This limitation may be explained by a low depth of penetration and propagation of US waves in materials of high density. It has been shown that in a porous material such as potato tissue, ultrasound does not transmit to a depth greater than 1 mm [6]. Therefore, the use of ultrasound in the drying process is justified only in limited cases. In order to maximize the potential of ultrasound in the drying of foodstuffs, further experimental data are required.
Strawberries are an important crop worldwide, with production exceeding 7.7 million tonnes in 2013 and have been constantly increasing [7] up to 10.5 million tonnes in 2023 [8]. China is the largest producer of strawberries in the world with nearly 3 million tons of production per year [9]. In our experiments, strawberry slices were used and they were dried in a chamber dryer. The aim of this study was to compare the drying rate and quality of dried strawberry slices obtained by convective drying (CD) and ultrasonic-assisted convective drying (UACD). An ultrasonic generator was installed inside the chamber of dryer, thus avoiding major modification of the dryer’s construction. Such an experimental design was intended to test the possibility of easy application of ultrasonic energy in a chamber dryer in order to overcome another limitation of this technology, which is the high cost of the specialized equipment. The methodology used in this study allowed to compare the effect of US on drying kinetics, colour, polyphenol compounds, ascorbic acid content and antioxidant activity in dried strawberry slices. The low thickness (5 mm) of the samples and the soft texture of the strawberry tissue selected for this study was intended to exploit the potential of the US to accelerate the drying rate.
2. Materials and Methods
2.1. Plant Material
The strawberries (Fragaria × ananasa cv. ‘Florence’ and ‘Alba’) used in the study were purchased from producer in central Poland. Immediately after transport, the fruits were washed, sorted and the stalks were removed. The fruits, after surface drying, were frozen and stored at −25 °C until the day of experiment.
2.2. Drying Experiment
Fruits for drying were selected to obtain a homogeneous batch in terms of maturity and fruits size. 30 min before drying, the fruits were moved from the freezer and thawed at room temperature. Immediately before drying, the fruit was cut manually into slices (5 mm thick). The sample size was 250 g ± 10%. The drying experiments were conducted in a laboratory chamber dryer with air recirculation (Figure 1), according to the diagram below (Figure 2). The equipment allows constant control of air velocity and temperature. Ultrasound-assisted convective drying (UACD) was performed by installing an airborne ultrasonic system (Pusonics, Madrid, Spain) inside the drying chamber, which is capable of generating a 22 kHz sound field with a maximum power of 200 W. The ultrasound transducer was placed 10 cm above the drying sample, with the sample spread out to completely occupy the ultrasound impacted area. The transducer was equipped with a cooling system isolated from the air flowing in the chamber, protecting it from overheating. Convective drying (CD), which in this study was the control to which the results were compared, was carried out when the ultrasound generator was switched off. As the impact of US is greater at mild drying conditions [4], the lowest possible temperature and airflow at which drying occurs at a reasonable rate was used. The experiments were carried out at one temperature level, 50 °C, and at a constant air velocity (2.5 m/s). The average relative humidity of the air during drying was 15 ± 2%. Each drying experiment was conducted in triplicate and the drying lasted until the sample lost 88% of its initial weight. Drying kinetics were determined by the initial moisture content of the fruit sample and by automatically weighing the samples at fixed intervals of 1 min. The initial moisture content was measured by drying to a constant weight in a laboratory vacuum dryer at 70 °C and 30 mBar pressure.
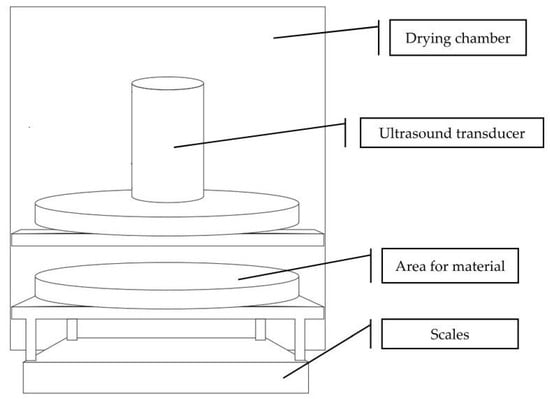
Figure 1.
The drying experimental set-up.
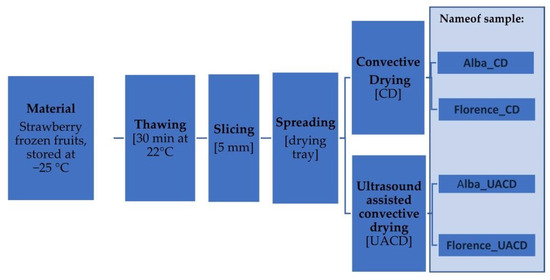
Figure 2.
Scheme of the drying experiment conducted for ‘Florence’ and ‘Alba’ cultivars.
Prior to the main experiment, a preliminary evaluation was conducted using convective drying of fruit slices from four strawberry cultivars commercially cultivated in Poland: ‘Alba’, ‘Rumba’, ‘Grandarosa’ and ‘Florence’. The drying rate, total colour difference and content of anthocyanins were taken into consideration during cultivar selection. One of the selection criteria was also the colour of the fruit cross-section, which is important from the perspective of visual appeal of dried slices. Based on these assessments, two cultivars, ‘Alba’ and ‘Florence’, were selected for the main experiment. The final dried mass of dried products obtained from the ‘Alba’ cultivar was 88.42% and 89.23% for Alba_CD and Alba_UACD, respectively. In the case of the ‘Florence’ cultivar, the final dried mass of dried products was lower, 80.19% and 77.05% for Florence_CD and Florence_UACD, respectively.
2.3. Colour Measurement
The values of the colour parameters of the raw material and dried strawberry slices were determined using a Konica Minolta CM-2500c spectrophotometer (Chiyoda, Tokyo, Japan). The instrument was calibrated before the measurements using a white standard. Measurements were made using CIE D65 illuminant. The parameter ‘L’ denotes brightness from 0 (dark) to 100 (bright), ‘a’ denotes green when negative (−) or red when positive (+) and ‘b’ denotes blue when negative (−) or yellow for positive (+) values. Measurements were made in 30 repetitions. Based on the determined values, the total colour difference (∆E) was calculated using Equation (1):
2.4. Analysis of Phenolic Compounds
Analysis of the phenolic compound content was carried out by the high-performance liquid chromatography method described by Nielsen et al. [10] using an Agilent 1200 series HPLC (Agilent Technologies, Waldbronn, Germany) with a system equipped with a DAD detector. Separation was performed using a Phenomenex®Fusion RP column (250 mm × 4.6 mm; particle size 4 µm). The elution conditions were as follows: 1 mL min−1, temperature 25 °C, wavelength: 280 nm (flavan-3-ols), 320 nm (phenolic acids), 360 nm (flavonol) and 520 nm (anthocyanins); mobile phase consisting of water: formic acid (95:5 (v/v)) (A) and acetonitrile (B) in gradient flow. The calculations of polyphenols were quantified by calibration with the standards of individual polyphenols. The polyphenol content was expressed in mg·100 g−1 d.m.
2.5. Analysis of L-Ascorbic Acid
The L-ascorbic acid contents were determined by high-performance liquid chromatography method using an Agilent 1200 series HPLC system (Agilent Technologies, Waldbronn, Germany) equipped with a DAD detector. Separation was performed using a Supelcosil LC-18 column (250 mm × 4.6 mm; 5 µm) with a pre-column. A 1% phosphate-buffered aqueous solution of KH2PO4, pH 2.5 was used as the mobile phase with isocratic flow 0.8 mL min−1, at a temperature of 30 °C. The detection of L-ascorbic acid was performed by absorbance at 244 nm. The samples were homogenized in 6% metaphosphoric acid, and filtered through filter paper. The calculations of acid content were quantified by calibration curve obtained with the standards of L-ascorbic acid and expressed in mg·100 g−1 d.m.
2.6. Antioxidant Activity
The antioxidant activity was determined according to Re et al. [11]. Free-radical scavenging activity was determined using the ABTS•+ radical cation. The reaction was carried out for 6 min and the mixture was kept at room temperature in a dark place. Absorbance was measured at 734 nm using a spectrophotometer Cary 300 Bio UV-Visible (Varian, Belrose, Australia). At least four measurements were made for each sample at different concentrations to reduce the initial ABTS•+ solution absorbance from 20% to 80%. The linear regression method was applied to calculate the content of the sample, leading to a 50% decrease in the ABTS•+ solution absorbance, and recalculated to Trolox equivalents as mg per g of dried matter of the sample. The extract was prepared as follows: 2 g of sample was mixed with 50 mL of 70% methanol and was then extracted for 10 min. The suspension was filtered through a Whatman No. 3 filter paper (Global Life Sciences Solutions, Wilmington, NC, USA).
2.7. Water Activity
Water activity was determined using a computer-controlled HC2-AW (Rotronic AG, Bassersdorf, Switzerland). The sample was placed in a container under the measuring probe and the exchange of sample moisture with air inside the container is recorded until equilibrium is reached.
2.8. Dry Mass
The dry matter content was determined by a gravimetric method. This involved drying the sample to a constant weight under low pressure (3 kPa) at 70 °C.
2.9. Determination of Dry Basis Moisture Content and Drying Rate
The dry basis moisture and drying rate were determined using Equations (2) and (3):
where Mt is the weight of sample at a given time [g] and Md is the dry mass of sample [g],
where M0 is the initial moisture content [g of water/g dry matter], Mt is the moisture content at a given time [g of water/g dry matter] and Δt is the time interval [s].
2.10. Statistical Analysis
The statistical analysis was performed by using STATISTICA 13 (Dell Inc., Tulsa, OK, USA). The analysis ran as a completely randomized design and was conducted with one-way ANOVA. The HSD Tukey’s test was selected for the comparison of the quality parameters of dried samples. The comparison of means was performed at a significance level of p < 0.05.
3. Results and Discussion
3.1. Drying Rate
The initial moisture content of strawberry was 90.7% for ‘Florence’ cultivar and 91.4% for ‘Alba’. Figure 3 and Figure 4 present the changes in moisture content of dried strawberry slices during the drying process for both cultivars. At least three replicates were performed for each combination; the graphs show the averaged moisture changes (with bars of standard deviation). The use of ultrasonic assistance reduced the drying time for both cultivars. The duration of CD process was 280 min (16,800 s) for the ‘Florence’ cv. and 260 min (15,600 s) for the ‘Alba’ cv. For the ‘Florence’ cv., the process duration for UACD was 35.7% shorter than unassisted drying and lasted 180 min (10,800 s). For the ‘Alba’ cv. UACD lasted 170 min (10,200 s), thus was 34.6% shorter than unassisted drying. Similar results have been reported in the literature on other berries, for example ultrasonic assistance (100 or 200 W) in drying raspberries reduced drying time by 54% and 64%, respectively [12]. As described by the authors, the contribution of ultrasound was mainly due to the ‘vibration effect’, as the most dominant factor in increasing mass transfer during drying. Enhanced drying rates have been observed by other authors in apple drying experiments. In the case of apple slices, it was found that the use of ultrasonic energy significantly reduces drying time. For example, when US power levels of 90 W were used, a 57% reduction in drying time was observed for 5-mm-thick apple slices [13]. Other authors used cylinders of 0.035 m in diameter and 0.005 m in height. In this case, the use of 200 W ultrasound intensified the heat and mass exchange to achieve a 48% reduction in drying time [14]. It was observed that the lower the process temperature and the lower the air flow in the dryer, the greater the observed impact of the US application. An even more effective example of apple drying was the use of low air temperature (−10 °C), where an 80% reduction in process time was observed. In this case, a cube with a face surface area of 8.8 mm2 was used [15].
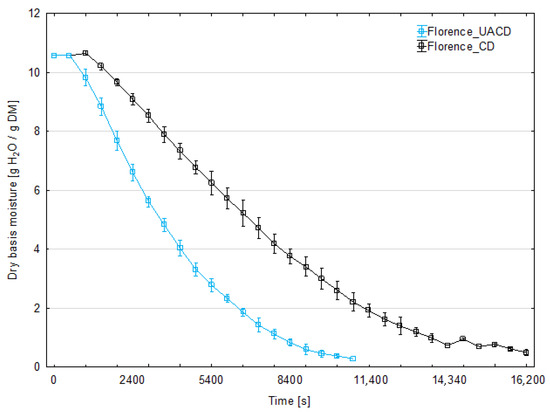
Figure 3.
Changes in the moisture content of strawberry slices of the ‘Florence’ cultivar during drying with (UACD) and without (CD) ultrasound assistance.
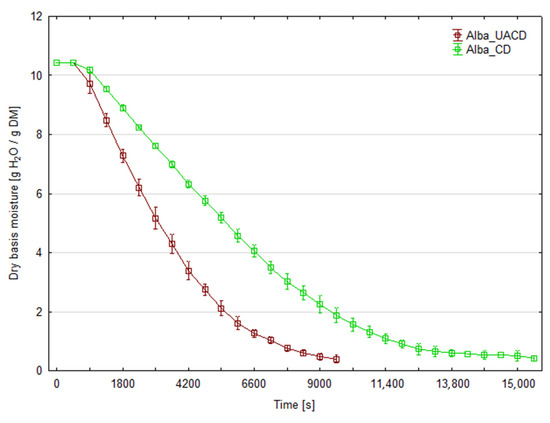
Figure 4.
Changes in the moisture content of strawberry slices of the ‘Alba’ cultivar during drying with (UACD) and without (CD) ultrasound assistance.
Figure 5 and Figure 6 show that the water removal rate for CD remains relatively constant for about 3600 s for the ‘Florence’ cultivar and 7200 s for the ‘Alba’ cultivar, until critical moisture content was achieved. This corresponds to a drying period in which the water evaporates from the surface of the product or only from the larger capillaries. During the subsequent drying stages, the first and second falling rate periods can be distinguished on the curves. This is the typical shape of the convective drying curve. In the case of UACD, constant rate drying period is absent and the drying started from the falling-rate period. In this case, the rate of water removal decreases from the very beginning, almost until the end of the drying process at the same slope in the case of ‘Alba’. UACD of ‘Florence’ drying curve is similar but it is possible to distinguish slope changes between the first and second part of the falling rate period. Typically, during the falling drying period, the rate at which water is removed decreases and the slope of the curve also gently decreases. This shows that the application of ultrasound has partially eliminated the resistance to the diffusion of moisture to the surface of the slices, which, in contrast, became increasingly significant during convective drying, perhaps due to an increasing viscosity of the aqueous phase. The high efficiency of the effect of ultrasound may be related to the small thickness of the slices, which in the final stage of drying was no more than 1 mm. As has been shown, ultrasound does not transmit to a greater depth in the material then 1 mm [6] and therefore should affect the entire cross-section of the slices used in this experiment. However, in the case of ‘Florence’ it was observed that on the final stage of drying, the drying rate of material dried with ultrasound assistance was slower than ‘Alba’. Thus, the equilibrium moisture content value for these UACD drying conditions were higher (Figure 5). This may be due to the rapid evaporation of surface water and the formation of a layer of dried material, which hindered water removal during the falling rate drying period. Figure 5 and Figure 6 show the drying rate during the drying process time. In these graphs, at the initial stage of drying, in case of UACD the process is very intensive, until it reached 4800 s and 6000 s for ‘Florence’ and ‘Alba’, respectively. It can be seen here that drying of ‘Florence’ was slower compared to the ‘Alba’ cultivar and in the early stages of the drying process this is clearly visible. The intersection of the CD and UACD graph lines is a very important point for comparing these drying processes. Based on this point, it is possible to infer at which point the ultrasound waves ceased to be important in shaping the drying dynamics. This corresponds strongly with other authors’ consideration of the significance of using ultrasound as a rate enhancer for the first stage or the second stage of drying. Scientific reports are not consistent in the influence of ultrasound on food drying kinetics. There are both reports indicating that the impact of ultrasound is greatest in the first phase of drying [16] and those that indicate its greater impact in the falling rate period of the process. For example, in the case of carrots, the improvement in drying dynamics occurred mainly at the beginning of the process, when external transfer was the controlling factor for the drying rate; in this case, ultrasound was responsible for a significant increase in heat and mass transfer coefficients [17]. An inverse trend was noted in a paper in which apple slices were dried, which generally shows a more significant effect during the falling rate period for samples dried with ultrasound compared to samples dried without ultrasound [13]. Following this reasoning, drying schemes have been proposed to optimize energy consumption more effectively, where ultrasound is applied after the completion of the first drying stage [18]. These discrepancies may be explained by the differing matrix properties of the materials conferring different internal diffusion resistance, or different equipment and/or experiment set-up.
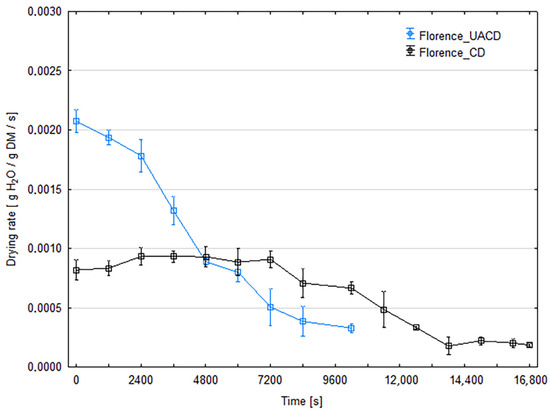
Figure 5.
Drying rates of strawberry slices of the ‘Florence’ cultivar dried with (UACD) and without (CD) ultrasound assistance.
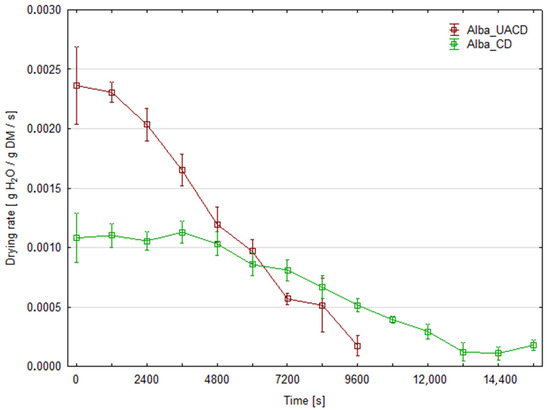
Figure 6.
Drying rates of strawberry slices of the ‘Alba’ cultivar dried with (UACD) and without (CD) ultrasound assistance.
3.2. Colour
Colour, as one of the basic characteristics of processed food, is one of indicators of quality deterioration of raw material subjected to drying processes. As shown in Table 1 and Table 2, drying strongly affected the colour of the strawberry slices. For both cultivars, the dried material was characterized by being darker, with more intensive red and yellow colours. In the case of the ‘Florence’, brightness (‘L’) decreased from an initial 41.92 for the raw material, to 34.29 and 33.16 after drying (Florence_CD and Florence_UACD, respectively). For the ‘Alba’ cultivar, brightness decreased from an initial 42.43 for the raw material, to 34.92 and 34.73 after drying (Alba_CD and Alba_UACD, respectively). The direction and degree of changes in the brightness parameter is similar for both drying methods and both cultivars, indicating that factors like cultivar and drying method have no effect on the brightness of strawberry slices. The lower brightness of samples may be explained by the increased concentration of red and yellow coloured chemicals in the samples and/or due to the formation of dark pigments in the Maillard reaction [19]. As shown in Table 1 and Table 2, it was observed that the values of redness (‘a’) and yellowness (‘b’), for all dried samples were significantly higher compared to the values for the raw material samples. The initial values of the ‘a’ parameter for Florence_Raw, 27.69 increased to 34.00 and 34.07 for Florence_CD and Florence_UACD, respectively. Similarly, the initial values of the ‘a’ parameter for Alba_Raw, 27.72 increased to 34.94 and 34.14 for Alba_CD and Alba_UACD, respectively. Such observations have also been made in other experiments on dried strawberries [20]. The reason for observing such changes may be the higher impact of increasing the concentration of anthocyanin pigments after drying than the induced degradation of these compounds, as strawberries are a material with an initial high water content. Although the degradation process of anthocyanins exposed to elevated temperature and oxygen during drying is strongly documented [21], in this case the effect of increasing the density of the material was more significant on the final level of ‘a’ and ‘b’ parameters of colour. The values of ΔE, which indicate total colour change, were 10.65 and 10.37 for Florence_CD and Florence_UACD, respectively. For ‘Alba’, the values of this parameter were similar and were 11.14 and 10.55 for Alba_CD and Alba_UACD, respectively. Similar results of ΔE measurement were obtained when the effect of drying temperature on strawberries was investigated, which was 9.53 at 50 °C [22]. Similar levels of colour difference after drying were observed for other berries. In experiments on raspberry, similar results of total colour difference (ΔE = 12.41) were obtained after convective drying with 200 W of ultrasound power [12]. It is worth noting that these values are relatively low compared to the changes observed in experiments involving the drying of plant material. In an experiment comparing different methods of drying sweet peppers, the ΔE parameter took much higher values, ranging from 6.66 to 33.13, depending on the drying method [23]. However, in our results, ΔE for both cultivars is over 10. Such a result indicates a significant change in colour, which is perceived by the human eye as different colours [24].

Table 1.
The colour parameters (L, lightness; a, red; b, yellow; ΔE, total colour difference) of strawberry slices of the ‘Florence’ cultivar under the influence of CD or UACD drying.
Table 2.
The colour parameters (L, lightness; a, red; b, yellow; ΔE, total colour difference) of strawberry slices of the ‘Alba’ cultivar under the influence of CD or UACD drying.
The photographs below (Figure 7) show strawberry slices after drying. ‘Alba’ and ‘Florence’ retained their round shape and did not crumble when removed from the drying tray. The material was intensely red for both cultivars. As mentioned earlier, the drying process significantly affected the colour of the slices (ΔE > 10); however, since the colour of the slices became more red as a result of the concentration of dyes, it can be assumed that this change can be seen as a positive in terms of visual evaluation.
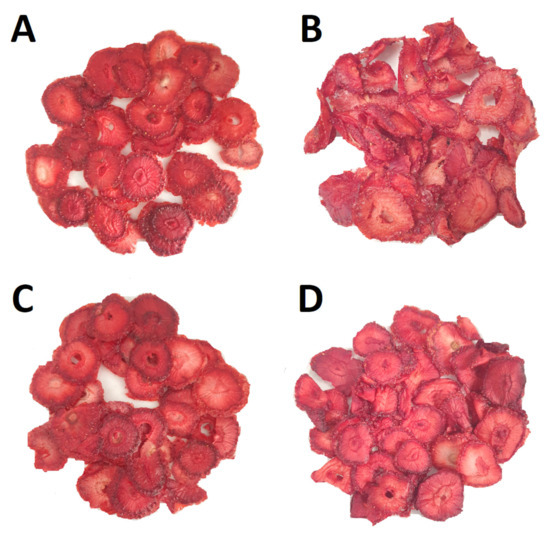
Figure 7.
Dried strawberry slices: (A) Alba_CD, (B) Alba_UACD, (C) Florence_CD and (D) Florence_UACD.
3.3. Phenolic Compounds
In general, the drying process resulted in a decrease in phenolic compounds for both cultivars and for both drying methods. However, there have been deviations from this general observation and trends have not been consistent for different cultivars. Analysis of phenolic compounds content in Florence_CD and Florence_UACD samples (Table 3) indicates relatively low losses of these compounds in comparison to the raw material (Florence_Raw). Among flavanols, higher retention of polyphenols was observed in Florence_CD than in Florence_UACD, with the exception of procyanidin B1 where no significant differences were observed between samples. For phenolic acids, the highest concentration of the chlorogenic acid derivative is found in the Florence_CD sample [181.69 mg/100 g DM], followed by Florence_UACD [173.47 mg/100 g DM]. This is higher than in the Florence_Raw [161.48 mg/100 g DM]. No significant differences were observed for ellagic acid. In the flavonol section, where only quercetin-3-rutinoside was detected, the highest concentration of compound was found in the Florence_CD sample than in Florence_UACD. Among the anthocyanins, the most strongly represented group of polyphenols, Florence_CD and Florence_UACD samples show similar concentrations of most anthocyanins. However, in Florence_UACD, pelargonidin-3-(6″-malonylglucoside) and pelargonidin-3-glucoside content is higher than in Florence_CD. The drying process, regardless of the method, caused a decrease in the content of polyphenols, especially flavanols and anthocyanins, but in the case of the ‘Florence’ cultivar the method of drying did not have a significant impact.
Table 3.
Contents of phenolic compounds (mg/100 g DM) in raw and dried strawberry slices of the ‘Florence’ cultivar.
Slightly different changes in polyphenol composition after drying were observed in the case of the ‘Alba’ cultivar. Analysis of the content of phenolic compounds in Alba_CD, Alba_UACD and Alba_Raw showed significant differences, the direction of which varied from compound to compound (Table 4). Among flavanols, unidentified flavanol A and procyanidin B1 had similar values in all samples. Catechin and unidentified flavanol B had the highest content in Alba_UACD samples (280.92 mg/100 g DM), due to this, total flavanols were highest in Alba_UACD. For phenolic acids, the chlorogenic acid derivative reached the higher content in Alba_UACD samples (65.77 mg/100 g DM), than Alba_CD (60.98 mg/100 g DM). Anthocyanins, among other polyphenols, were the most susceptible group of compounds to drying-induced degradation. Cyanidin-3-glucoside, pelargonidin-3-glucoside, pelargonidin-3-(6″-malonylglucoside) showed the significant higher content in the raw material (10.95, 312.1, 65.51 mg/100 g DM, respectively) than in samples after drying. The drying process significantly reduced levels of those compounds, with the UACD method being less destructive than CD. For example, content of pelargonidin-3-glucoside (whose level among the anthocyanins was the highest in all the samples tested) in the Alba_UACD is about 14.34% higher compared to the Alba_CD. Pelargonidin-3-rutinoside content was also significantly lower in dried samples but no differences were observed between drying method. Cyanidin-3-malonylglucoside, of which content was below 1 mg/100 DM in all of samples, has a higher content in Alba_UACD sample. Total anthocyanin content was higher in UACD samples than CD (315.88 and 276.03 mg/100 g DM, respectively). In the case of ‘Alba’ cv., the drying process (regardless of method) had a significant effect on the content of phenolic compounds. However, it is worth emphasising that the UACD method generally allowed better preservation of these compounds compared to CD.
Table 4.
Contents of phenolic compounds (mg/100 g DM) in raw and dried strawberry slices of ‘Alba’ cultivar.
3.4. L-Ascorbic Acid, Antioxidant Activity and Water Activity
The results of L-ascorbic acid content and antioxidant activity analyses in raw and dried slices of ‘Florence’ cultivar (Florence_Raw, Florence_CD, Florence_UACD) is shown in Table 5 and of the ‘Alba’ cultivar (Alba_Raw, Alba_CD, Alba_UACD) is shown in Table 6. The recorded levels of L-ascorbic acid in the raw material are similar to levels showed by other authors for other cultivars of ripe strawberry fruit [9,25]. L-ascorbic acid content decreases significantly during drying regardless of drying method, with slightly higher losses in the UACD compared to CD. Florence_Raw was the sample of the highest L-ascorbic acid content (933.74 mg/100 g DM). In Florence_CD, L-ascorbic acid content (678.27 mg/100 g DM) was significantly lower (of about 27.4%) compared to the raw material. Florence_UACD has the lowest content between compared samples, 632.65 mg/100 g DM, a decrease of about 32.3% from the raw sample and 6.7% from Florence_CD. As for antioxidant activity, Florence_Raw has the lowest antioxidant activity (41.74 mg Trolox/g DM) when compared to dried material. The antioxidant activity of Florence_CD increased by 4.4% and Florence_UACD increased by 12% over Florence_Raw. So, despite some polyphenol and L-ascorbic acid degradation during the drying process, the antioxidant activity of the dried samples increased, with the UACD method achieving 7.3% higher values than CD method.
Table 5.
L-ascorbic acid (mg/100 g DM), antioxidant activity (mg Trolox/g DM) and water activity in raw and dried strawberry slices of ‘Florence’ cultivar.
Table 6.
L-ascorbic acid (mg/100 g DM), antioxidant activity (mg Trolox/g DM) and water activity in raw and dried strawberry slices of the ‘Alba’ cultivar.
As in the case of ‘Florence’, in ‘Alba’ cultivar L-ascorbic acid has highest content (989.2 mg/100 g DM) in Alba_Raw sample, significantly higher than in dried samples. A similar decrease after drying (about 58%), compared to the raw material was observed for both drying method (CD and UACD). Differences in the antioxidant activity of dried samples compared to the raw material vary depending on the drying method. In the case of Alba_CD antioxidant activity, a decrease of 9.1% (29.92 mg Trolox/g DM) compared to the raw sample was observed. Alba_UACD antioxidant activity is 32.16 mg Trolox/g DM (a decrease of about 2.3% compared to raw sample), which was determined to be statistically insignificant.
The level of L-ascorbic acid degradation during convective drying depends on many factors, among others: air temperature, air humidity, drying time, material moisture and other material properties [1]. Therefore, the level of degradation of L-ascorbic acid in the material described in this experiment may vary depending on the cultivar and the drying method. In an experiment conducted at the same temperature as in our work (50 °C), on strawberry fruit, significantly lower levels of L-ascorbic acid retention were recorded, with dried samples containing six times less of the vitamin than the raw material [22]. Water activity in dried food is an important characteristic affecting safety and stability of the product during storage. A cut-off value of 0.61 is usually taken to ensure the overall microbiological stability of the product [26]. In this context all dried strawberry samples fall within these limits (Table 5 and Table 6). Although water activity also affects organoleptic properties and it should be noted that fruit snacks with a water activity higher than 0.55 lack crunchiness and may therefore be perceived as having less sensory appeal [27].
4. Conclusions
In this study, the use of ultrasound reduced drying time by 35%, on average, for both cultivars. This is a significant difference, enabling energy and time savings during the drying process. However, from our perspective, equal, if not more important, is the quality of the obtained material. Since a shorter drying time typically favours the preservation of bioactive compounds, it might be expected that a higher retention of L-ascorbic acid in material dried by the UACD method would be observed; however, this was not the case. The drying process led to significant losses of L-ascorbic acid in both cultivars tested, with the ‘Alba’ cultivar showing significantly higher losses. In the ‘Alba’ cultivar, L-ascorbic acid losses exceeded 57% regardless of whether CD or UACD was applied. In contrast, the ‘Florence’ cultivar showed higher retention rates, with 68% retention for UACD and 73% for CD. In terms of antioxidant activity, the UACD method resulted in smaller decreases compared to CD. Interestingly, samples dried using UACD retained higher levels of antioxidant activity equivalent to those of raw fruit, suggesting that UACD better preserves the bioactive compounds responsible for this property. In the ‘Florence’ cultivar, antioxidant activity even exceeded the levels observed in the raw material, suggesting increased availability of some compounds during extraction. Thus, the UACD method seems to be more favourable for producing materials with high antioxidant activity, although it is less effective in preserving L-ascorbic acid in dried strawberry slices. No statistically significant differences in colour parameters were observed between drying methods for both cultivars. However, higher retention of anthocyanins, a key contributor to strawberry redness, was noted in Alba_UACD samples, but differences were too small to be detected by colour measurements. We acknowledge that a one of limitations of our study is the lack of detailed chemical profiling using the LC-MS method, which restricts the comprehensive characterization of polyphenolic compounds. Future research should address this issue by using advanced analytical techniques to enable a more thorough understanding of the effects of ultrasound on the structural properties of polyphenols. Such knowledge can, among other things, explain the effect of ultrasound treatment on the stability of these compounds.
In technological experiments, it is relatively uncommon to compare the effects of treatments or processes on different cultivars of the same fruit species in the same study, as is the case here. It is usually assumed that the fruit of a given cultivar represents the species. Such an approach ignores the conclusions of many research papers in which differences in the impact of cultivar have been demonstrated, of which this paper is also an example. This study challenges this assumption by highlighting significant differences in the quality of dried materials obtained using CD or UACD methods. Explaining the cause of these differences is an important issue that needs to be clarified. A separate issue is the degree of fruit maturity which, from a research perspective, should also be taken into account. Thus, the potential reason for these differences may be the degree of maturity of the fruit taken for drying experiment. Strawberry ripening is a complex process that involves significant changes in the physical and chemical properties of the fruit. The degree of ripeness, which in this study was assessed visually during sample preparation, can affect, among other things, fruit structure. For example, differences in drying dynamics between cultivars may be explained by material characteristics such as fruit firmness. A porous microstructure facilitates mass transfer processes and enhances ultrasound wave propagation through the material. Conversely, structural damage to the fruit tissue can hinder water migration toward the surface of the drying product, thereby limiting the efficiency of moisture removal. In addition to the structure, the effectiveness of ultrasound-assisted drying is significantly influenced by the water content of the material. During the initial phase of drying, the presence of high moisture content and a more open cellular structure promote effective ultrasound energy absorption. However, in the later stages, the formation of a dense, compact structure impedes further propagation of ultrasonic waves, leading to an increased reflection of ultrasound wave from the material’s surface. Experimental observations indicated that the ‘Florence’ cultivar exhibited a longer drying time compared to ‘Alba’, resulting in prolonged exposure of high-moisture tissue to elevated temperatures (during drying). Under such conditions, thermally induced chemical and enzymatic reactions are intensified, which may account for the lower retention of anthocyanins in the ‘Florence’ samples. In contrast, the shorter exposure time of the ‘Alba’ cultivar likely contributed to higher preservation of thermolabile bioactive compounds. It should also be noted that in this experiment, during the drying process, only the temperature of the drying air was monitored, whereas the temperature of the material itself was not measured. From an engineering standpoint, monitoring of the product temperature would provide valuable insights; however, its measurement poses technical challenges due to the requirement for non-contact methods, such as infrared pyrometry, which may yield limited accuracy depending on surface emissivity, which can change during drying. The observed differences in both drying dynamics and material quality across cultivars underscore the need for further research. In conclusion, the use of ultrasonic assistance in the drying process of strawberry slices significantly reduces the drying time and the dried material has quality parameters comparable to those achieved in convection drying. This finding underscores the prospect of integrating ultrasonic generators into chamber dryers without the need for major design modifications, thus reducing investment costs and facilitating the industrial application of this technology.
Author Contributions
Conceptualization: J.P., M.M.-F. and K.C.; methodology: J.P., K.C., M.M.-F. and J.S.-G.; validation: M.M.-F. and N.D.; investigation: N.D.; resources: J.P.; data curation: M.M.-F.; writing—original draft preparation: J.P.; writing—review and editing: K.C. and N.D.; visualization: J.P.; supervision: M.M.-F. All authors have read and agreed to the published version of the manuscript.
Funding
This research was funded by Norwegian Financial Mechanism. Project title: Improving plant quality and economy for a more sustainable and efficient berry production. Contract number: NOR/POLNOR/QualityBerry/0014/2019-00.
Institutional Review Board Statement
Not applicable.
Informed Consent Statement
Not applicable.
Data Availability Statement
The original contributions presented in this study are included in the article. Further inquiries can be directed to the corresponding author.
Acknowledgments
The authors thank the staff of the Fruit and Vegetable Storage and Processing Department for their assistance.
Conflicts of Interest
The authors declare no conflicts of interest.
References
- Omolola, A.O.; Jideani, A.I.O.; Kapila, P.F. Quality Properties of Fruits as Affected by Drying Operation. Crit. Rev. Food Sci. Nutr. 2017, 57, 95–108. [Google Scholar] [CrossRef]
- Zhang, Y.; Abatzoglou, N. Review: Fundamentals, Applications and Potentials of Ultrasound-Assisted Drying. Chem. Eng. Res. Des. 2020, 154, 21–46. [Google Scholar] [CrossRef]
- Wu, J.; Zhang, L.; Fan, K. Recent Advances in Ultrasound-Coupled Drying for Improving the Quality of Fruits and Vegetables: A Review. Int. J. Food Sci. Technol. 2022, 57, 5722–5731. [Google Scholar] [CrossRef]
- Musielak, G.; Mierzwa, D.; Kroehnke, J. Food Drying Enhancement by Ultrasound—A Review. Trends Food Sci. Technol. 2016, 56, 126–141. [Google Scholar] [CrossRef]
- Clemente, G.; Sanjuán, N.; Cárcel, J.A.; Mulet, A. Influence of Temperature, Air Velocity, and Ultrasound Application on Drying Kinetics of Grape Seeds. Dry. Technol. 2014, 32, 68–76. [Google Scholar] [CrossRef]
- Schössler, K.; Thomas, T.; Knorr, D. Modification of Cell Structure and Mass Transfer in Potato Tissue by Contact Ultrasound. Food Res. Int. 2012, 49, 425–431. [Google Scholar] [CrossRef]
- Simpson, D. The Economic Importance of Strawberry Crops. In The Genomes of Rosaceous Berries and Their Wild Relatives; Hytönen, T., Graham, J., Harrison, R., Eds.; Compendium of Plant Genomes; Springer International Publishing: Cham, Switzerland, 2018; pp. 1–7. ISBN 978-3-319-76019-3. [Google Scholar]
- FAOSTAT 2023. Available online: https://www.fao.org/Faostat/En/#data/QCL (accessed on 1 May 2025).
- Newerli-Guz, J.; Śmiechowska, M.; Drzewiecka, A.; Tylingo, R. Bioactive Ingredients with Health-Promoting Properties of Strawberry Fruit (Fragaria x Ananassa Duchesne). Molecules 2023, 28, 2711. [Google Scholar] [CrossRef]
- Nielsen, I.L.F.; Haren, G.R.; Magnussen, E.L.; Dragsted, L.O.; Rasmussen, S.E. Quantification of Anthocyanins in Commercial Black Currant Juices by Simple High-Performance Liquid Chromatography. Investigation of Their pH Stability and Antioxidative Potency. J. Agric. Food Chem. 2003, 51, 5861–5866. [Google Scholar] [CrossRef]
- Re, R.; Pellegrini, N.; Proteggente, A.; Pannala, A.; Yang, M.; Rice-Evans, C. Antioxidant Activity Applying an Improved ABTS Radical Cation Decolorization Assay. Free Radic. Biol. Med. 1999, 26, 1231–1237. [Google Scholar] [CrossRef]
- Kowalski, S.J.; Pawłowski, A.; Szadzińska, J.; Łechtańska, J.; Stasiak, M. High Power Airborne Ultrasound Assist in Combined Drying of Raspberries. Innov. Food Sci. Emerg. Technol. 2016, 34, 225–233. [Google Scholar] [CrossRef]
- Sabarez, H.T.; Gallego-Juarez, J.A.; Riera, E. Ultrasonic-Assisted Convective Drying of Apple Slices. Dry. Technol. 2012, 30, 989–997. [Google Scholar] [CrossRef]
- Kowalski, S.J.; Mierzwa, D.; Stasiak, M. Ultrasound-Assisted Convective Drying of Apples at Different Process Conditions. Dry. Technol. 2017, 35, 939–947. [Google Scholar] [CrossRef]
- Santacatalina, J.V.; Contreras, M.; Simal, S.; Cárcel, J.A.; Garcia-Perez, J.V. Impact of Applied Ultrasonic Power on the Low Temperature Drying of Apple. Ultrason. Sonochem. 2016, 28, 100–109. [Google Scholar] [CrossRef] [PubMed]
- Bantle, M.; Hanssler, J. Ultrasonic Convective Drying Kinetics of Clipfish During the Initial Drying Period. Dry. Technol. 2013, 31, 1307–1316. [Google Scholar] [CrossRef]
- Aversa, M.; Van Der Voort, A.-J.; De Heij, W.; Tournois, B.; Curcio, S. An Experimental Analysis of Acoustic Drying of Carrots: Evaluation of Heat Transfer Coefficients in Different Drying Conditions. Dry. Technol. 2011, 29, 239–244. [Google Scholar] [CrossRef]
- Beck, S.M.; Sabarez, H.; Gaukel, V.; Knoerzer, K. Enhancement of Convective Drying by Application of Airborne Ultrasound—A Response Surface Approach. Ultrason. Sonochem. 2014, 21, 2144–2150. [Google Scholar] [CrossRef]
- Murata, M. Browning and Pigmentation in Food through the Maillard Reaction. Glycoconj. J. 2021, 38, 283–292. [Google Scholar] [CrossRef]
- Biernacka, B.; Dziki, D.; Rudy, S.; Krzykowski, A.; Polak, R.; Dziki, L. Influence of Pretreatments and Freeze-Drying Conditions of Strawberries on Drying Kinetics and Physicochemical Properties. Processes 2022, 10, 1588. [Google Scholar] [CrossRef]
- Enaru, B.; Drețcanu, G.; Pop, T.D.; Stǎnilǎ, A.; Diaconeasa, Z. Anthocyanins: Factors Affecting Their Stability and Degradation. Antioxidants 2021, 10, 1967. [Google Scholar] [CrossRef]
- Tekgül, Y.; Erten, E.S. Quality Properties and Headspace Volatiles of Hot Air-Dried Strawberries. An. Acad. Bras. Ciênc. 2022, 94, e20201277. [Google Scholar] [CrossRef]
- Deng, L.-Z.; Yang, X.-H.; Mujumdar, A.S.; Zhao, J.-H.; Wang, D.; Zhang, Q.; Wang, J.; Gao, Z.-J.; Xiao, H.-W. Red Pepper (Capsicum Annuum L.) Drying: Effects of Different Drying Methods on Drying Kinetics, Physicochemical Properties, Antioxidant Capacity, and Microstructure. Dry. Technol. 2018, 36, 893–907. [Google Scholar] [CrossRef]
- Mokrzycki, W.S.; Tatol, M. Colour Difference ∆E—A Survey. Mach. Graph. Vis. 2011, 4, 383–411. [Google Scholar]
- Olsson, M.E.; Ekvall, J.; Gustavsson, K.-E.; Nilsson, J.; Pillai, D.; Sjöholm, I.; Svensson, U.; Åkesson, B.; Nyman, M.G.L. Antioxidants, Low Molecular Weight Carbohydrates, and Total Antioxidant Capacity in Strawberries (Fragaria × Ananassa): Effects of Cultivar, Ripening, and Storage. J. Agric. Food Chem. 2004, 52, 2490–2498. [Google Scholar] [CrossRef]
- Tapia, M.S.; Alzamora, S.M.; Chirife, J. Effects of Water Activity (aw) on Microbial Stability as a Hurdle in Food Preservation. In Water Activity in Foods; Barbosa-Cánovas, G.V., Fontana, A.J., Schmidt, S.J., Labuza, T.P., Eds.; Wiley: Hoboken, NJ, USA, 2020; pp. 323–355. ISBN 978-1-118-76831-0. [Google Scholar]
- Roudaut, G. Water Activity and Physical Stability. In Water Activity in Foods; Barbosa-Cánovas, G.V., Fontana, A.J., Schmidt, S.J., Labuza, T.P., Eds.; Wiley: Hoboken, NJ, USA, 2020; pp. 255–269. ISBN 978-1-118-76831-0. [Google Scholar]
Disclaimer/Publisher’s Note: The statements, opinions and data contained in all publications are solely those of the individual author(s) and contributor(s) and not of MDPI and/or the editor(s). MDPI and/or the editor(s) disclaim responsibility for any injury to people or property resulting from any ideas, methods, instructions or products referred to in the content. |
© 2025 by the authors. Licensee MDPI, Basel, Switzerland. This article is an open access article distributed under the terms and conditions of the Creative Commons Attribution (CC BY) license (https://creativecommons.org/licenses/by/4.0/).