

Duck Egg Crack Detection Using an Adaptive CNN Ensemble with Multi-Light Channels and Image Processing


Abstract
1. Introduction
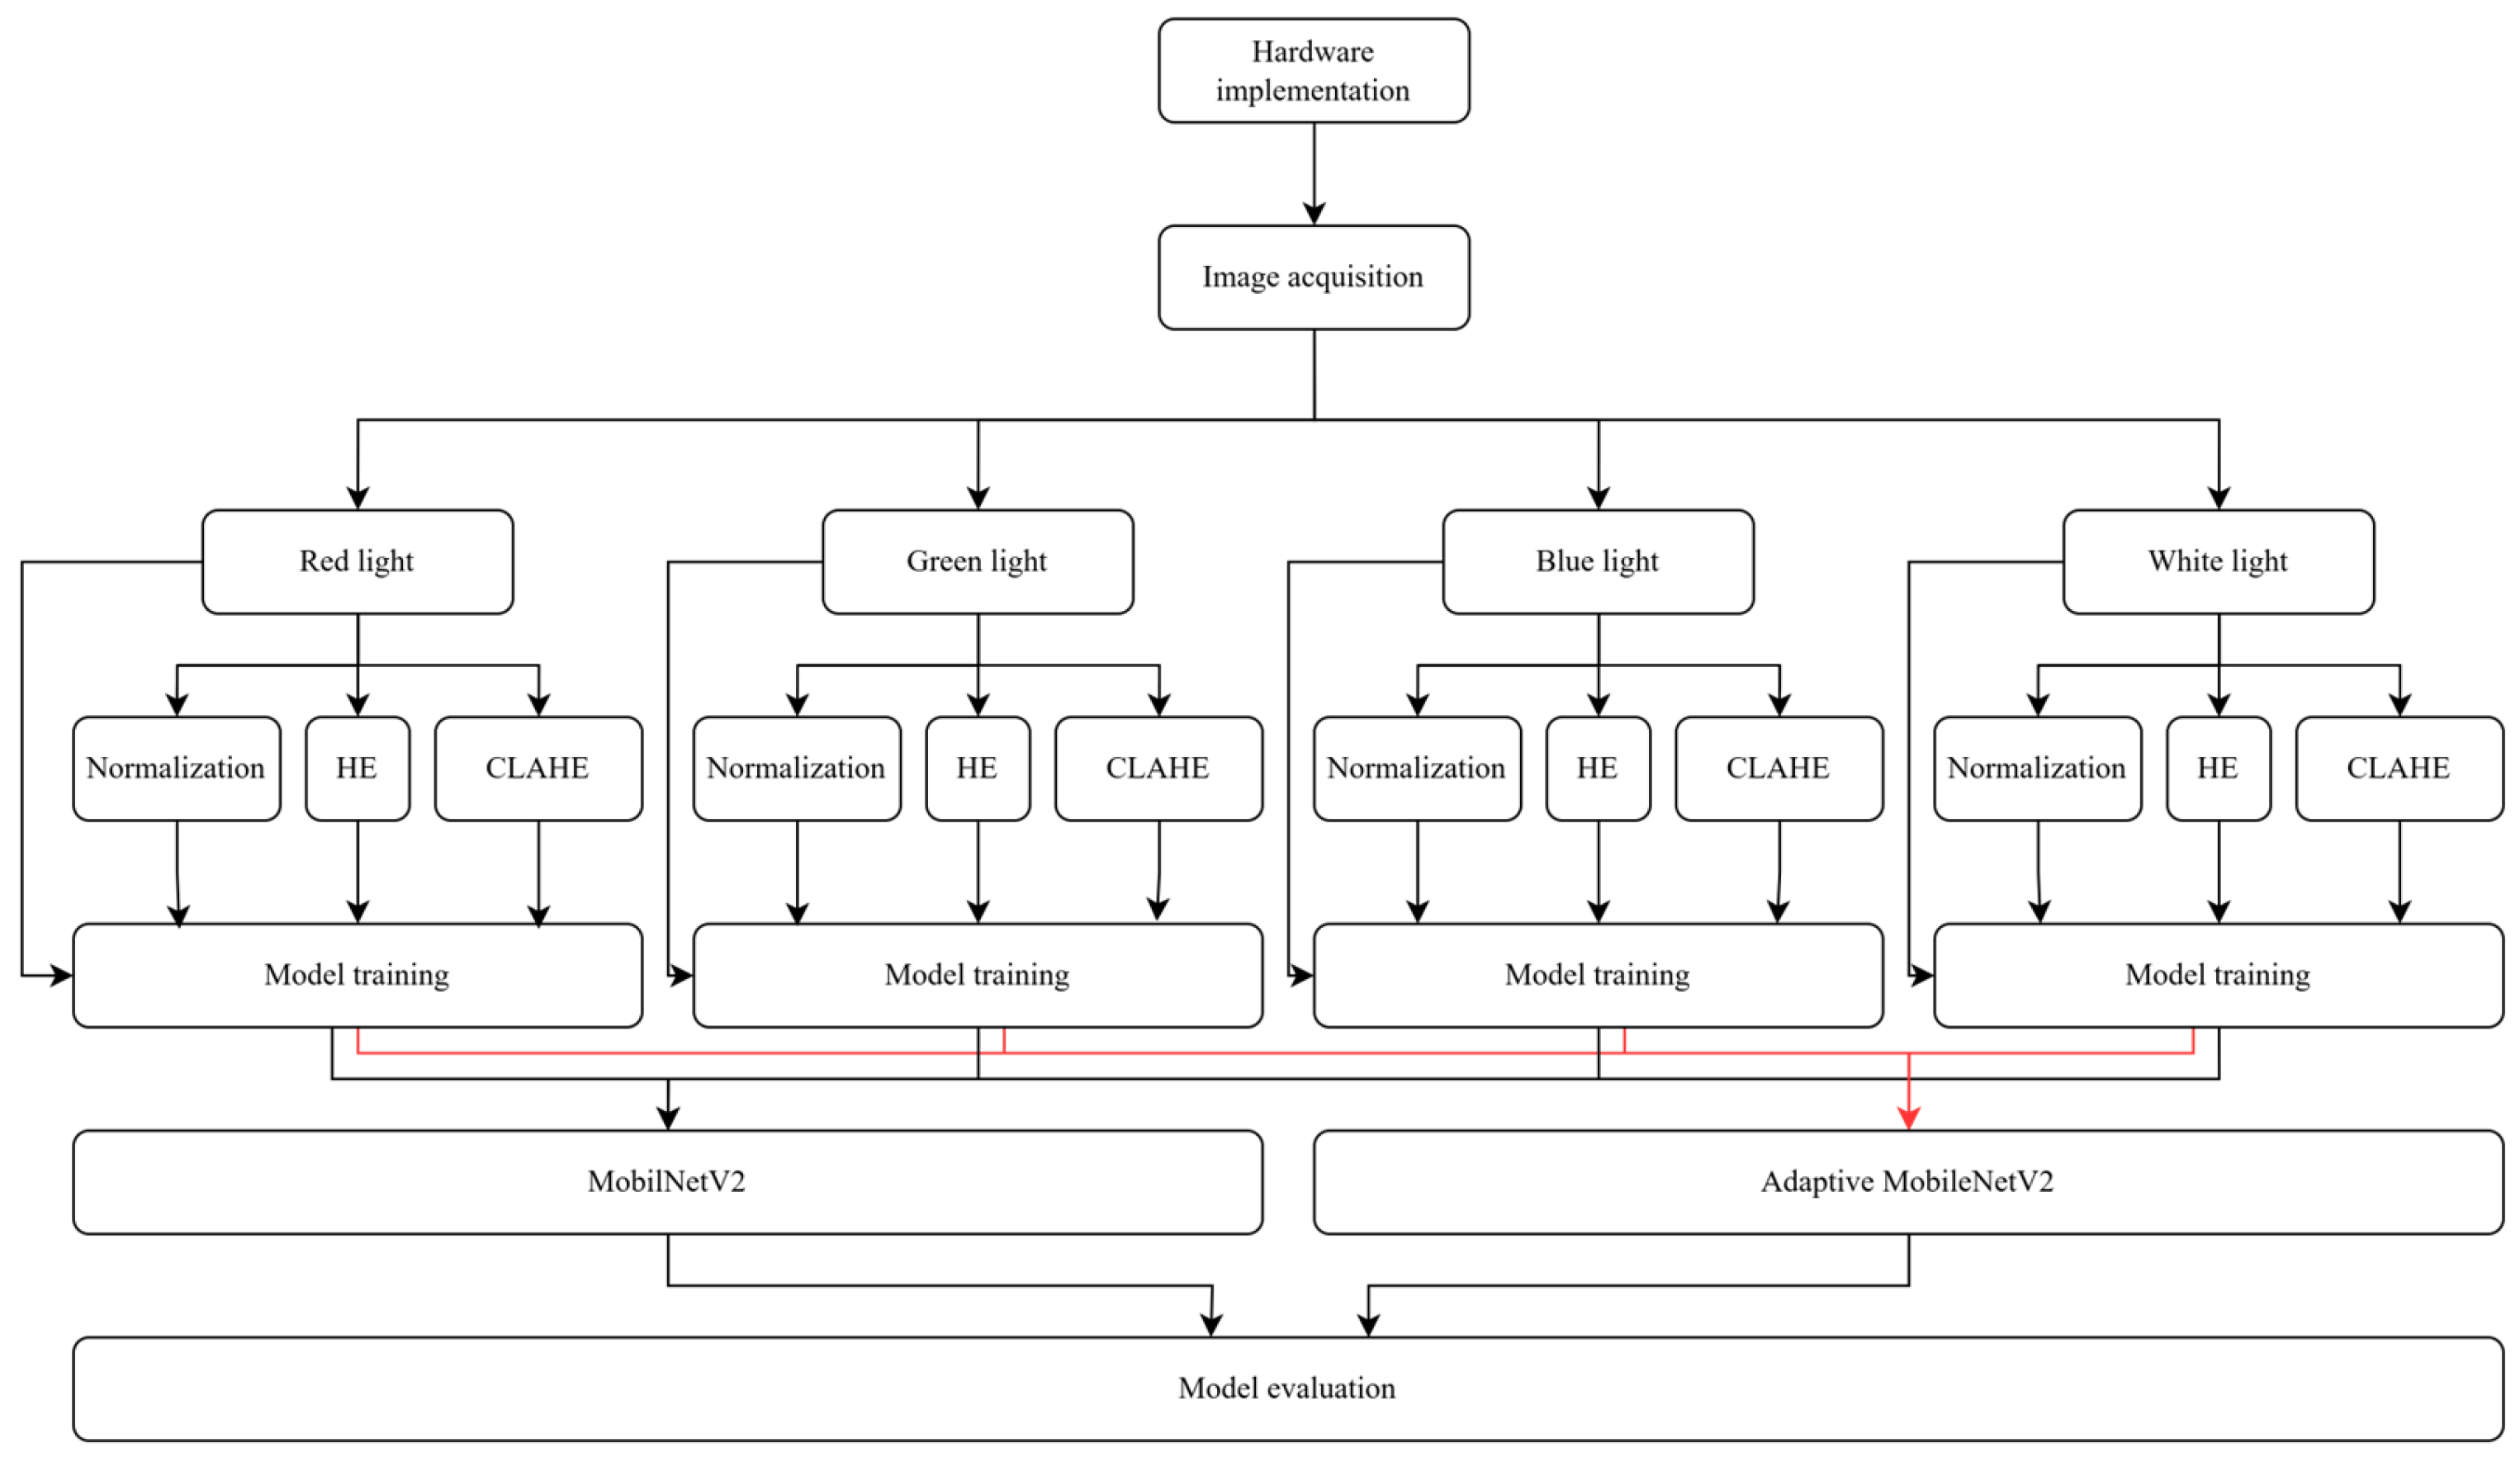
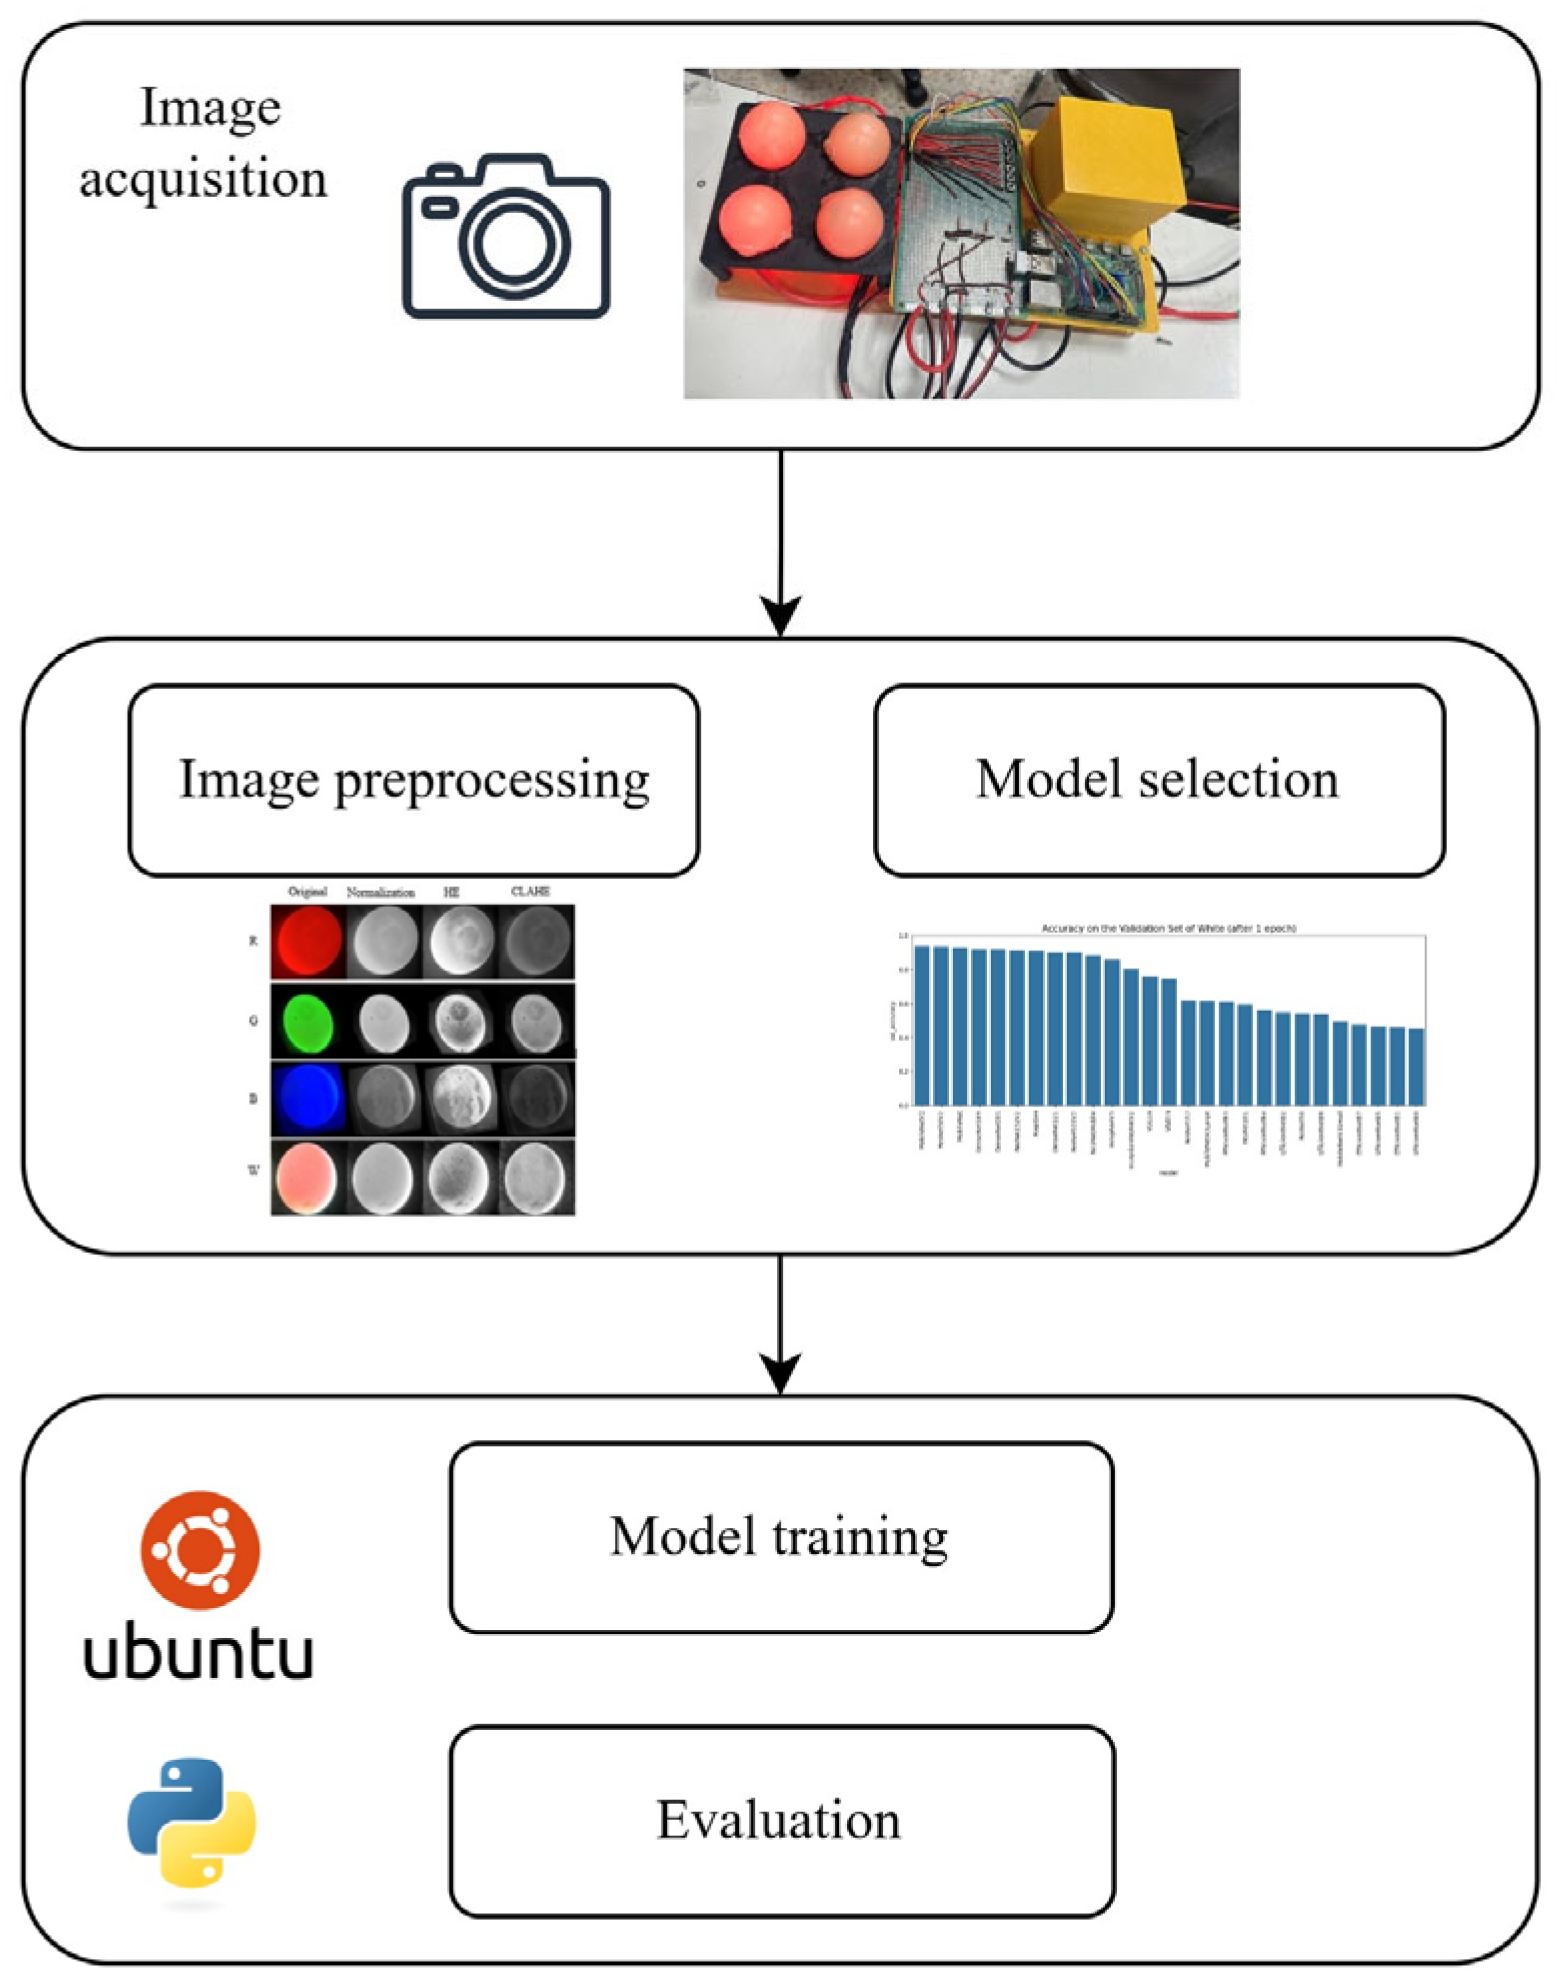
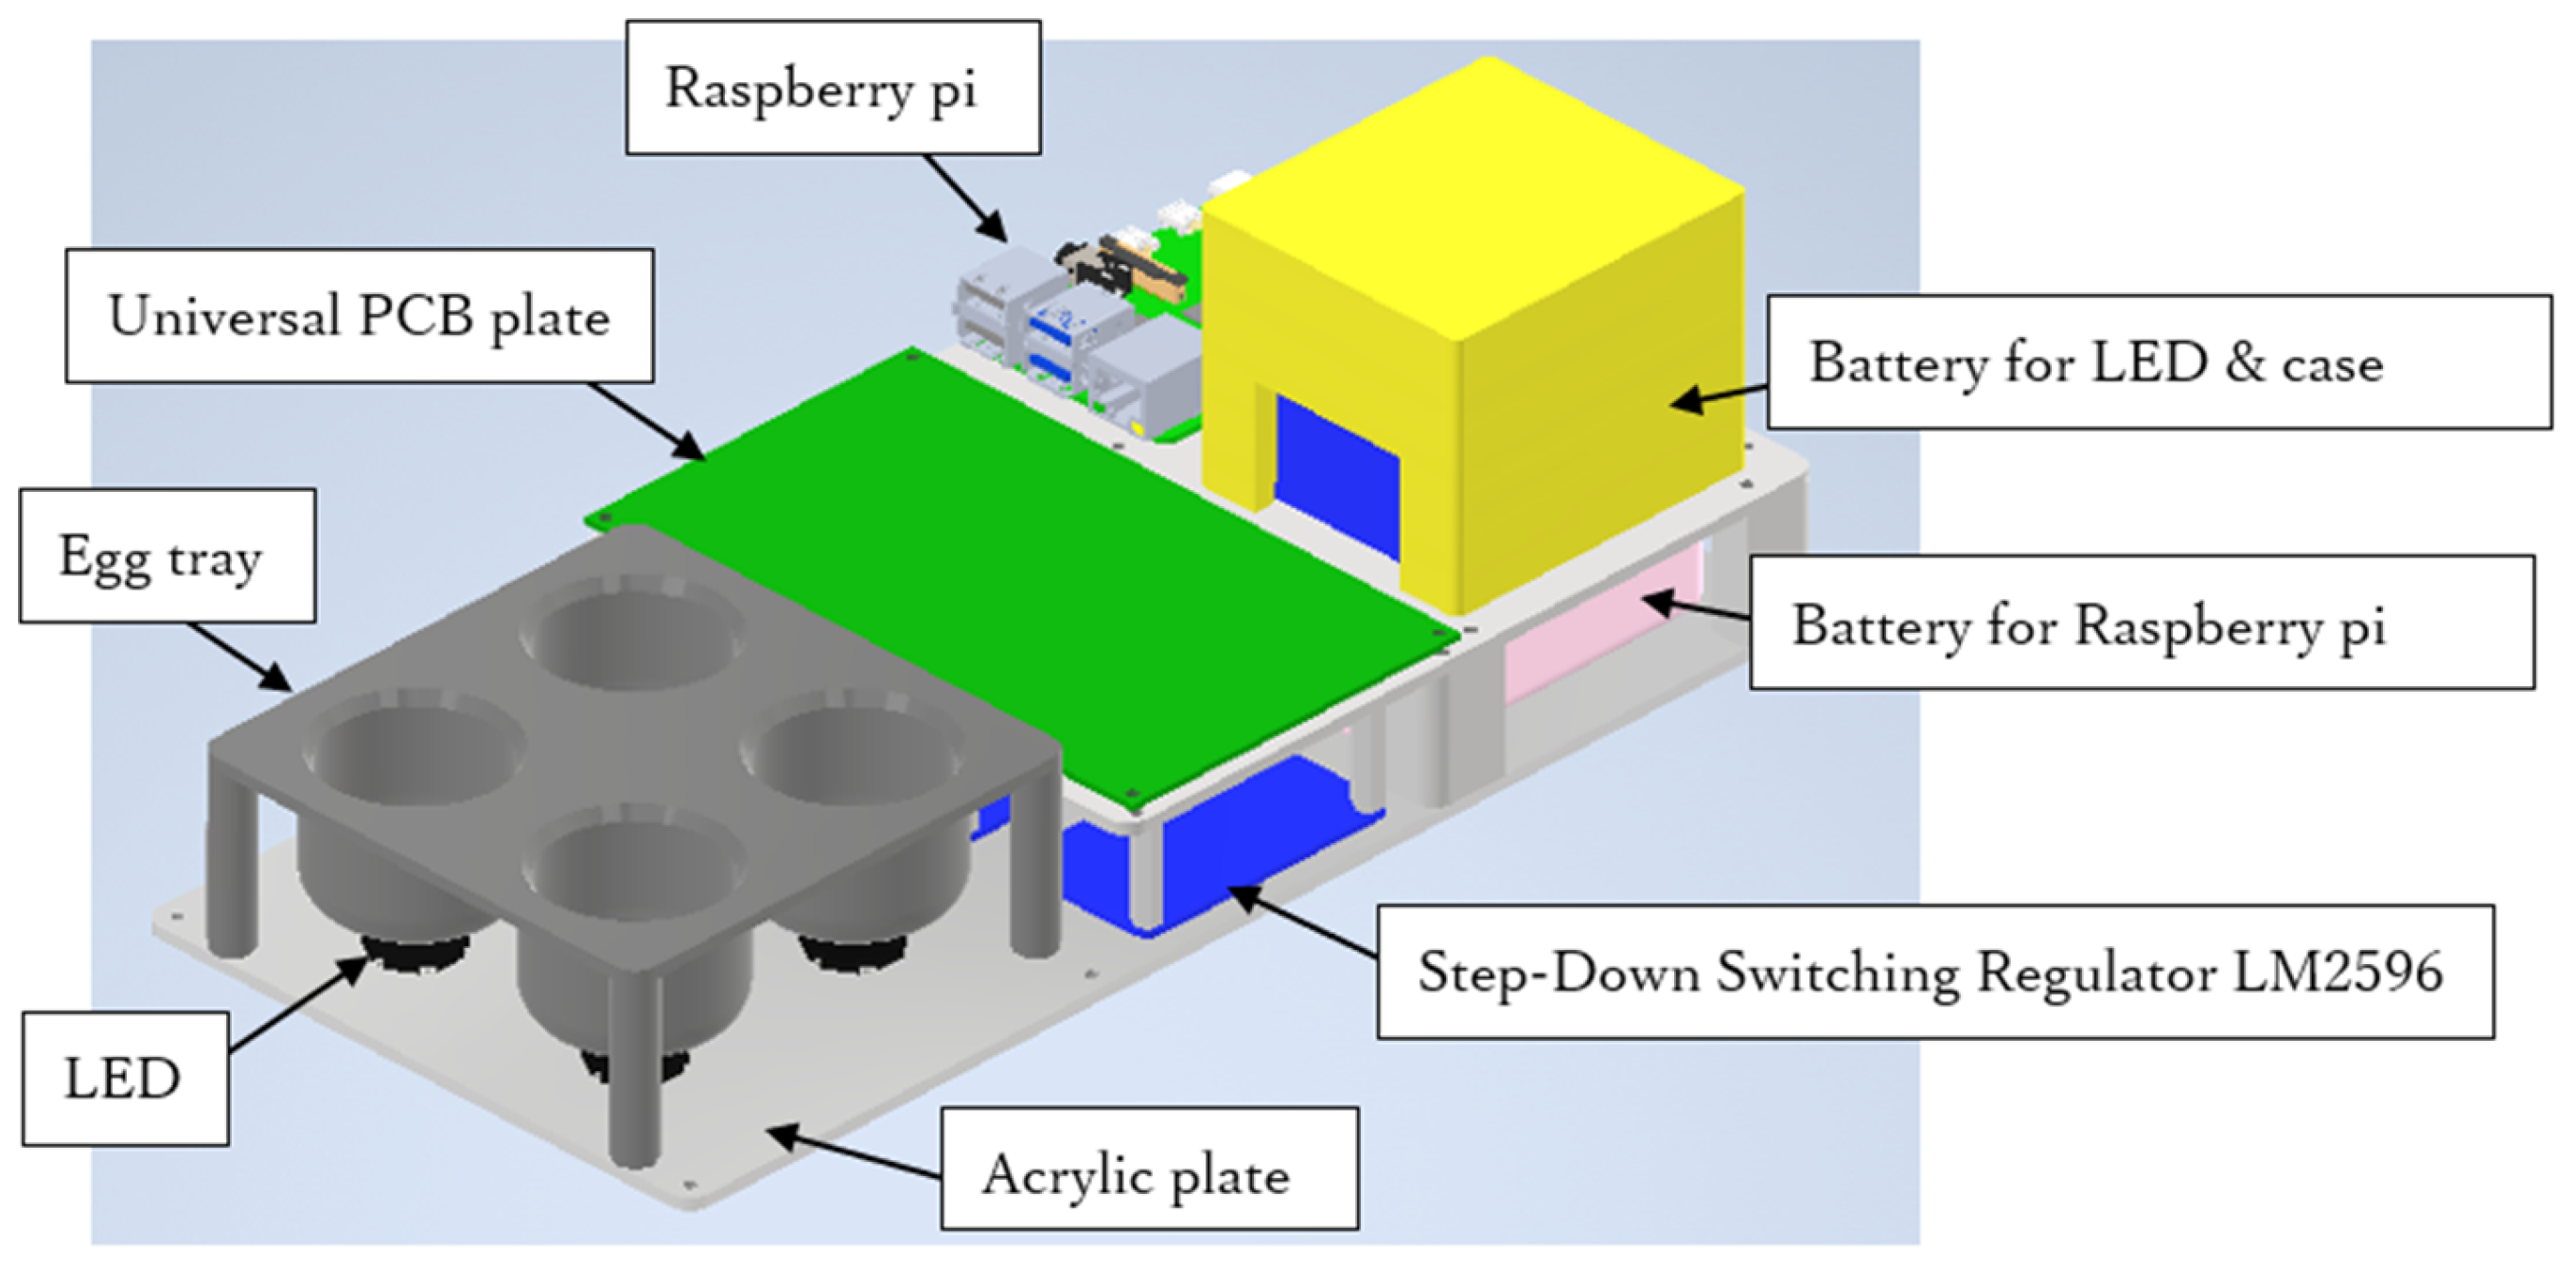
2. Materials and Methods
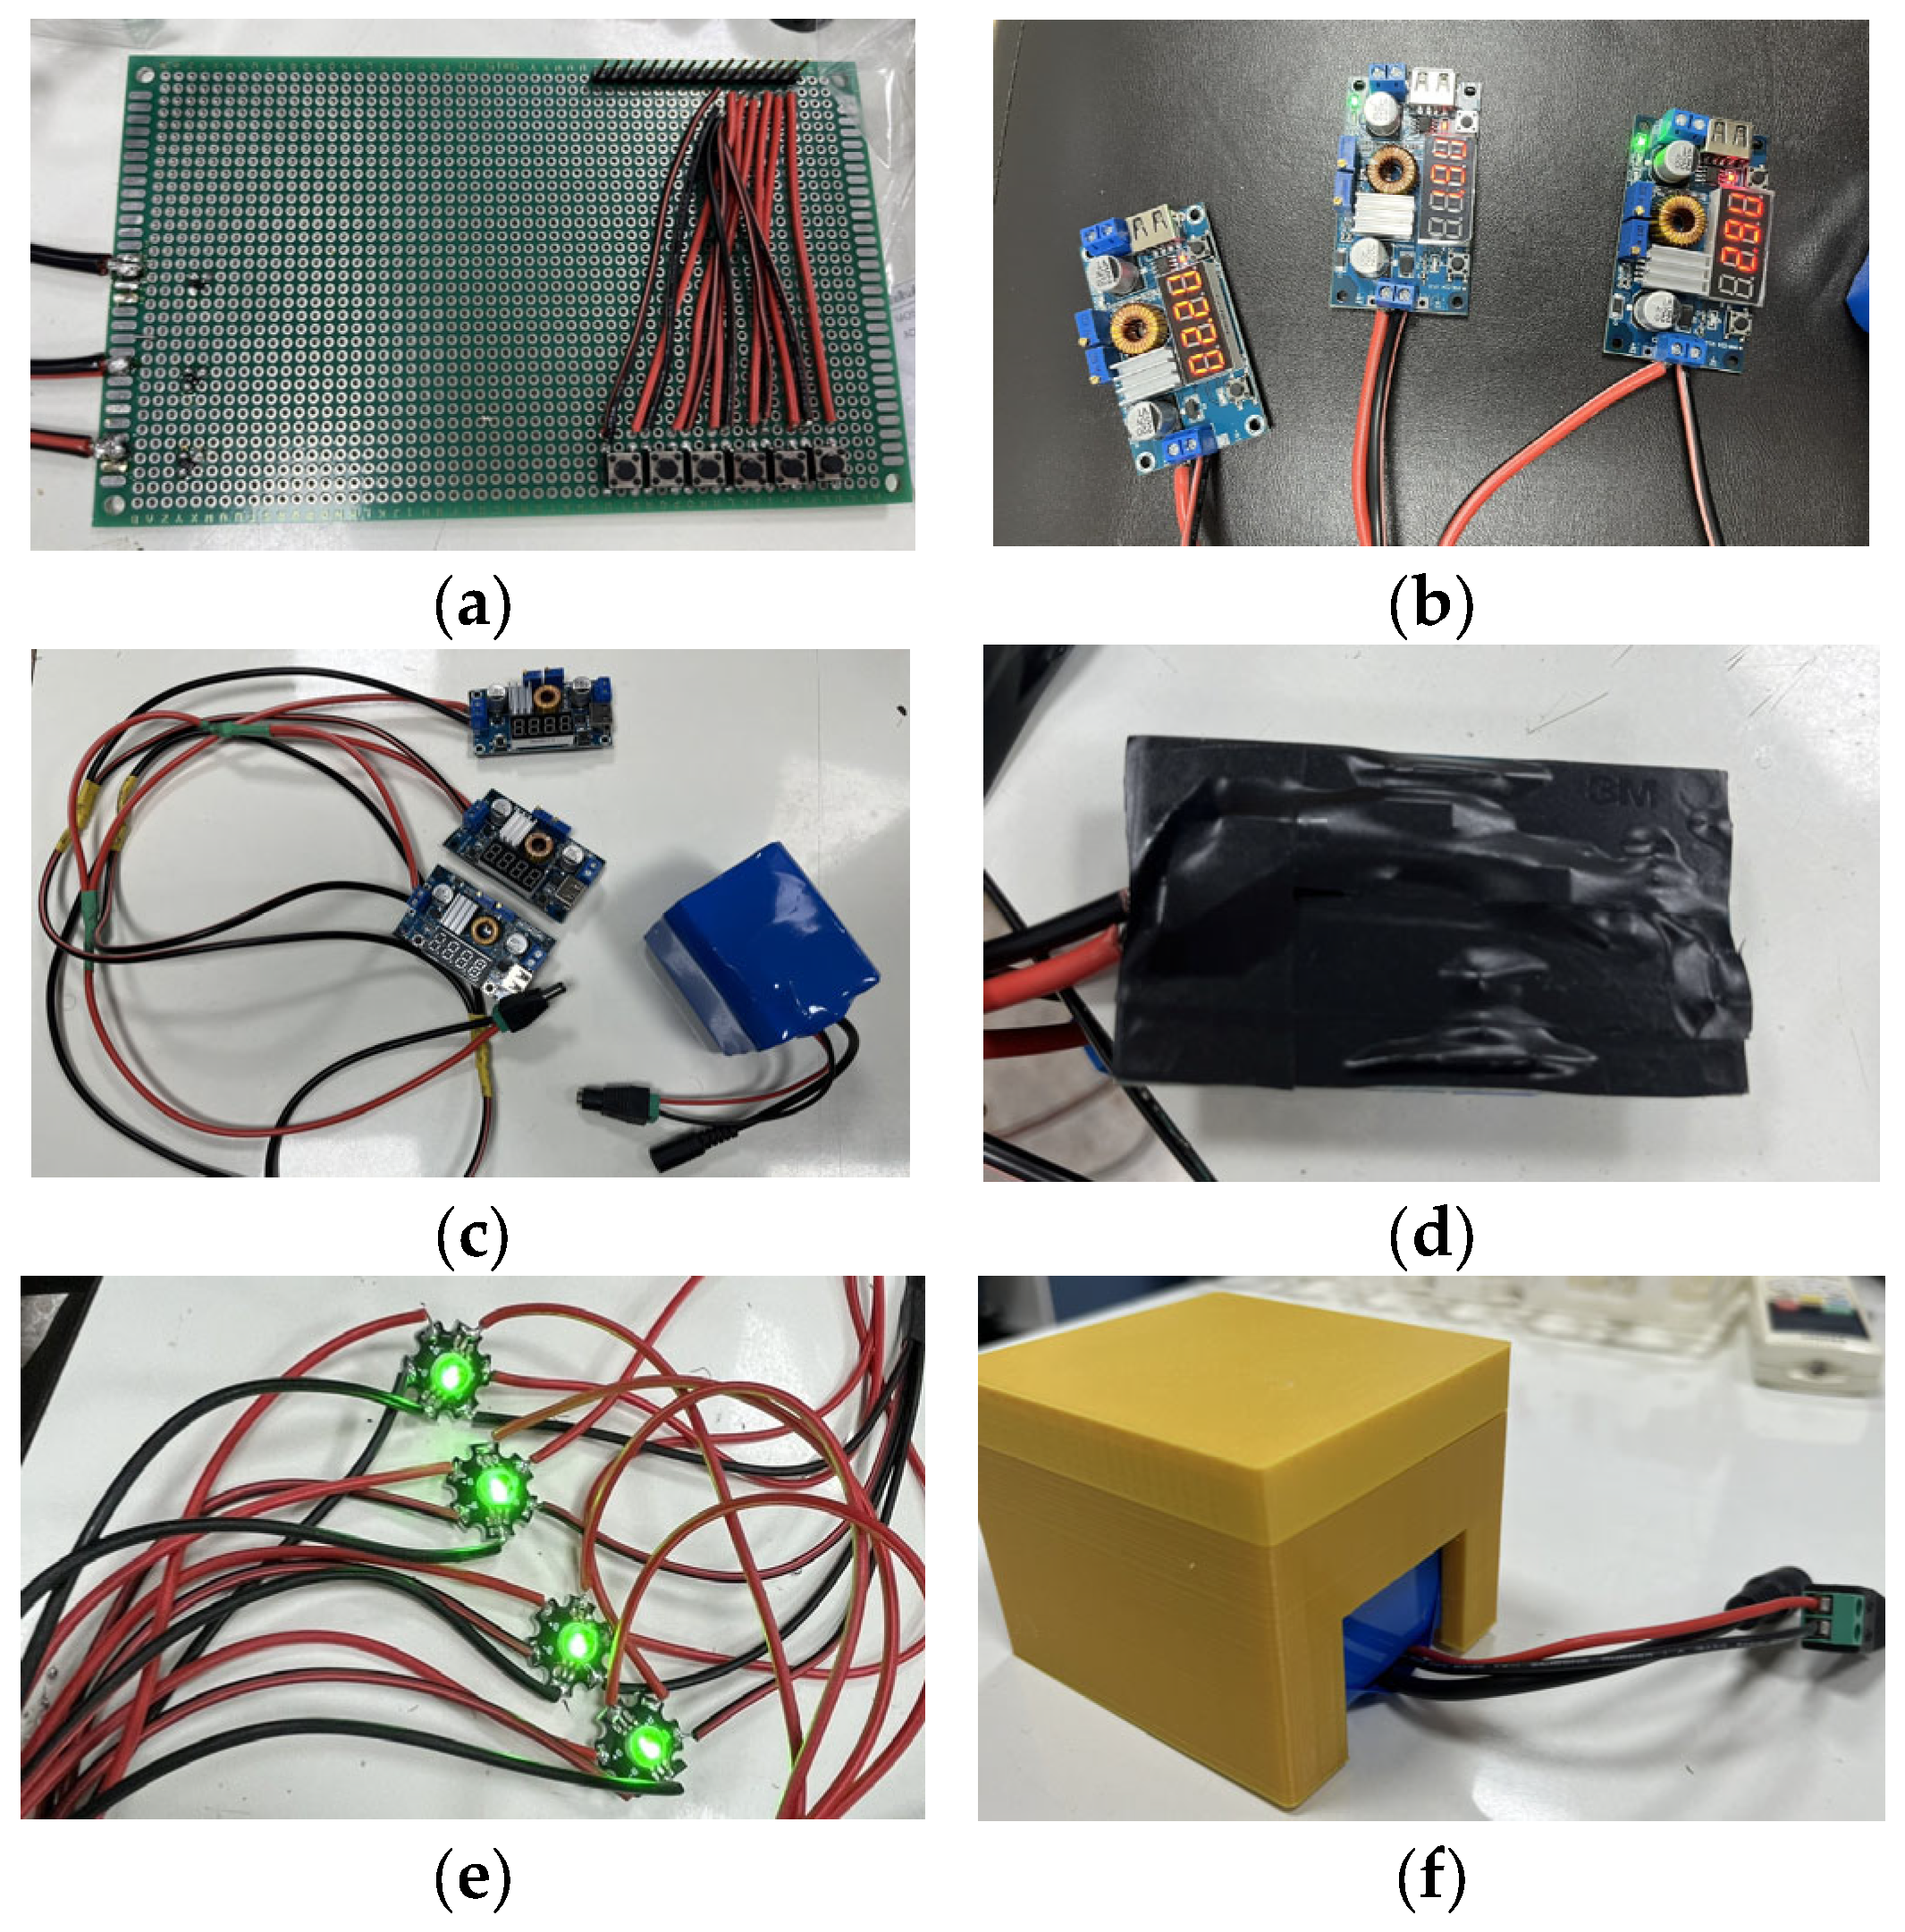
2.1. Hardware
2.2. Dataset
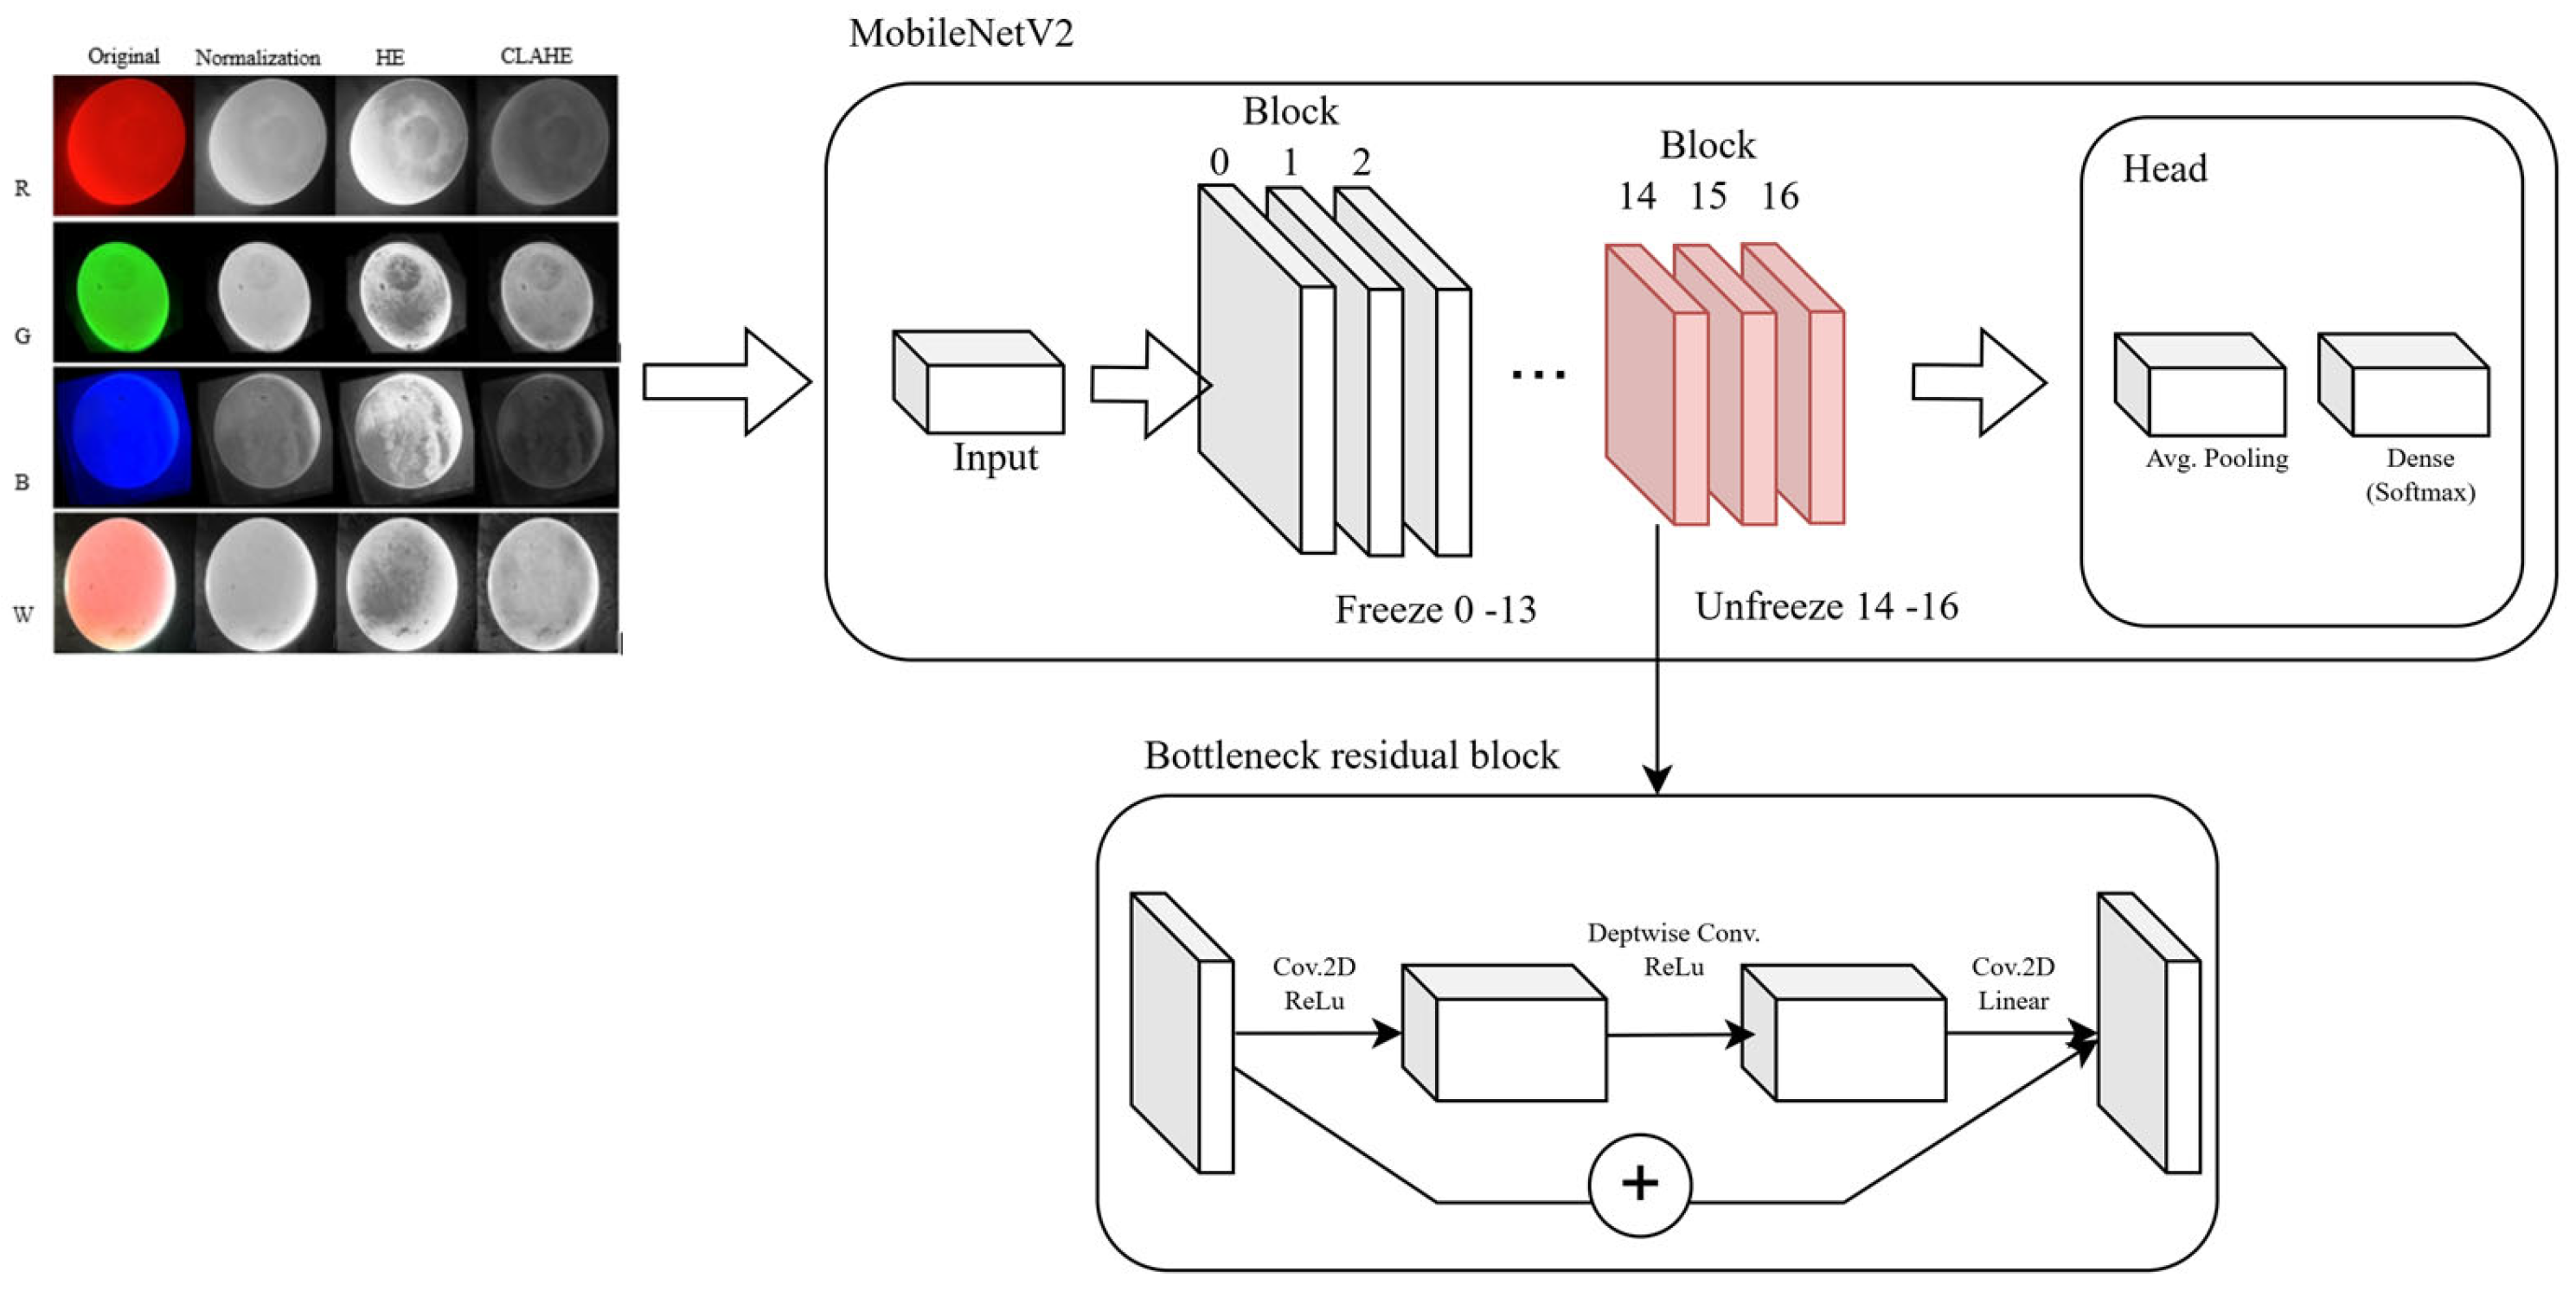
2.2.1. Normalization
2.2.2. Histogram Equalization (HE)
2.2.3. Contrast Limited Adaptive Histogram Equalization (CLAHE)
2.3. Model Selection
2.4. Experimental Environment Settings and Model Evaluation Indicator
- TP (true positives): Correctly predicted positive cases;
- TN (true negatives): Correctly predicted negative cases;
- FP (false positives): Incorrectly predicted positive cases;
- FN (false negatives): Incorrectly predicted negative cases.
3. Results
3.1. Hardware Implementation
3.2. Model Training
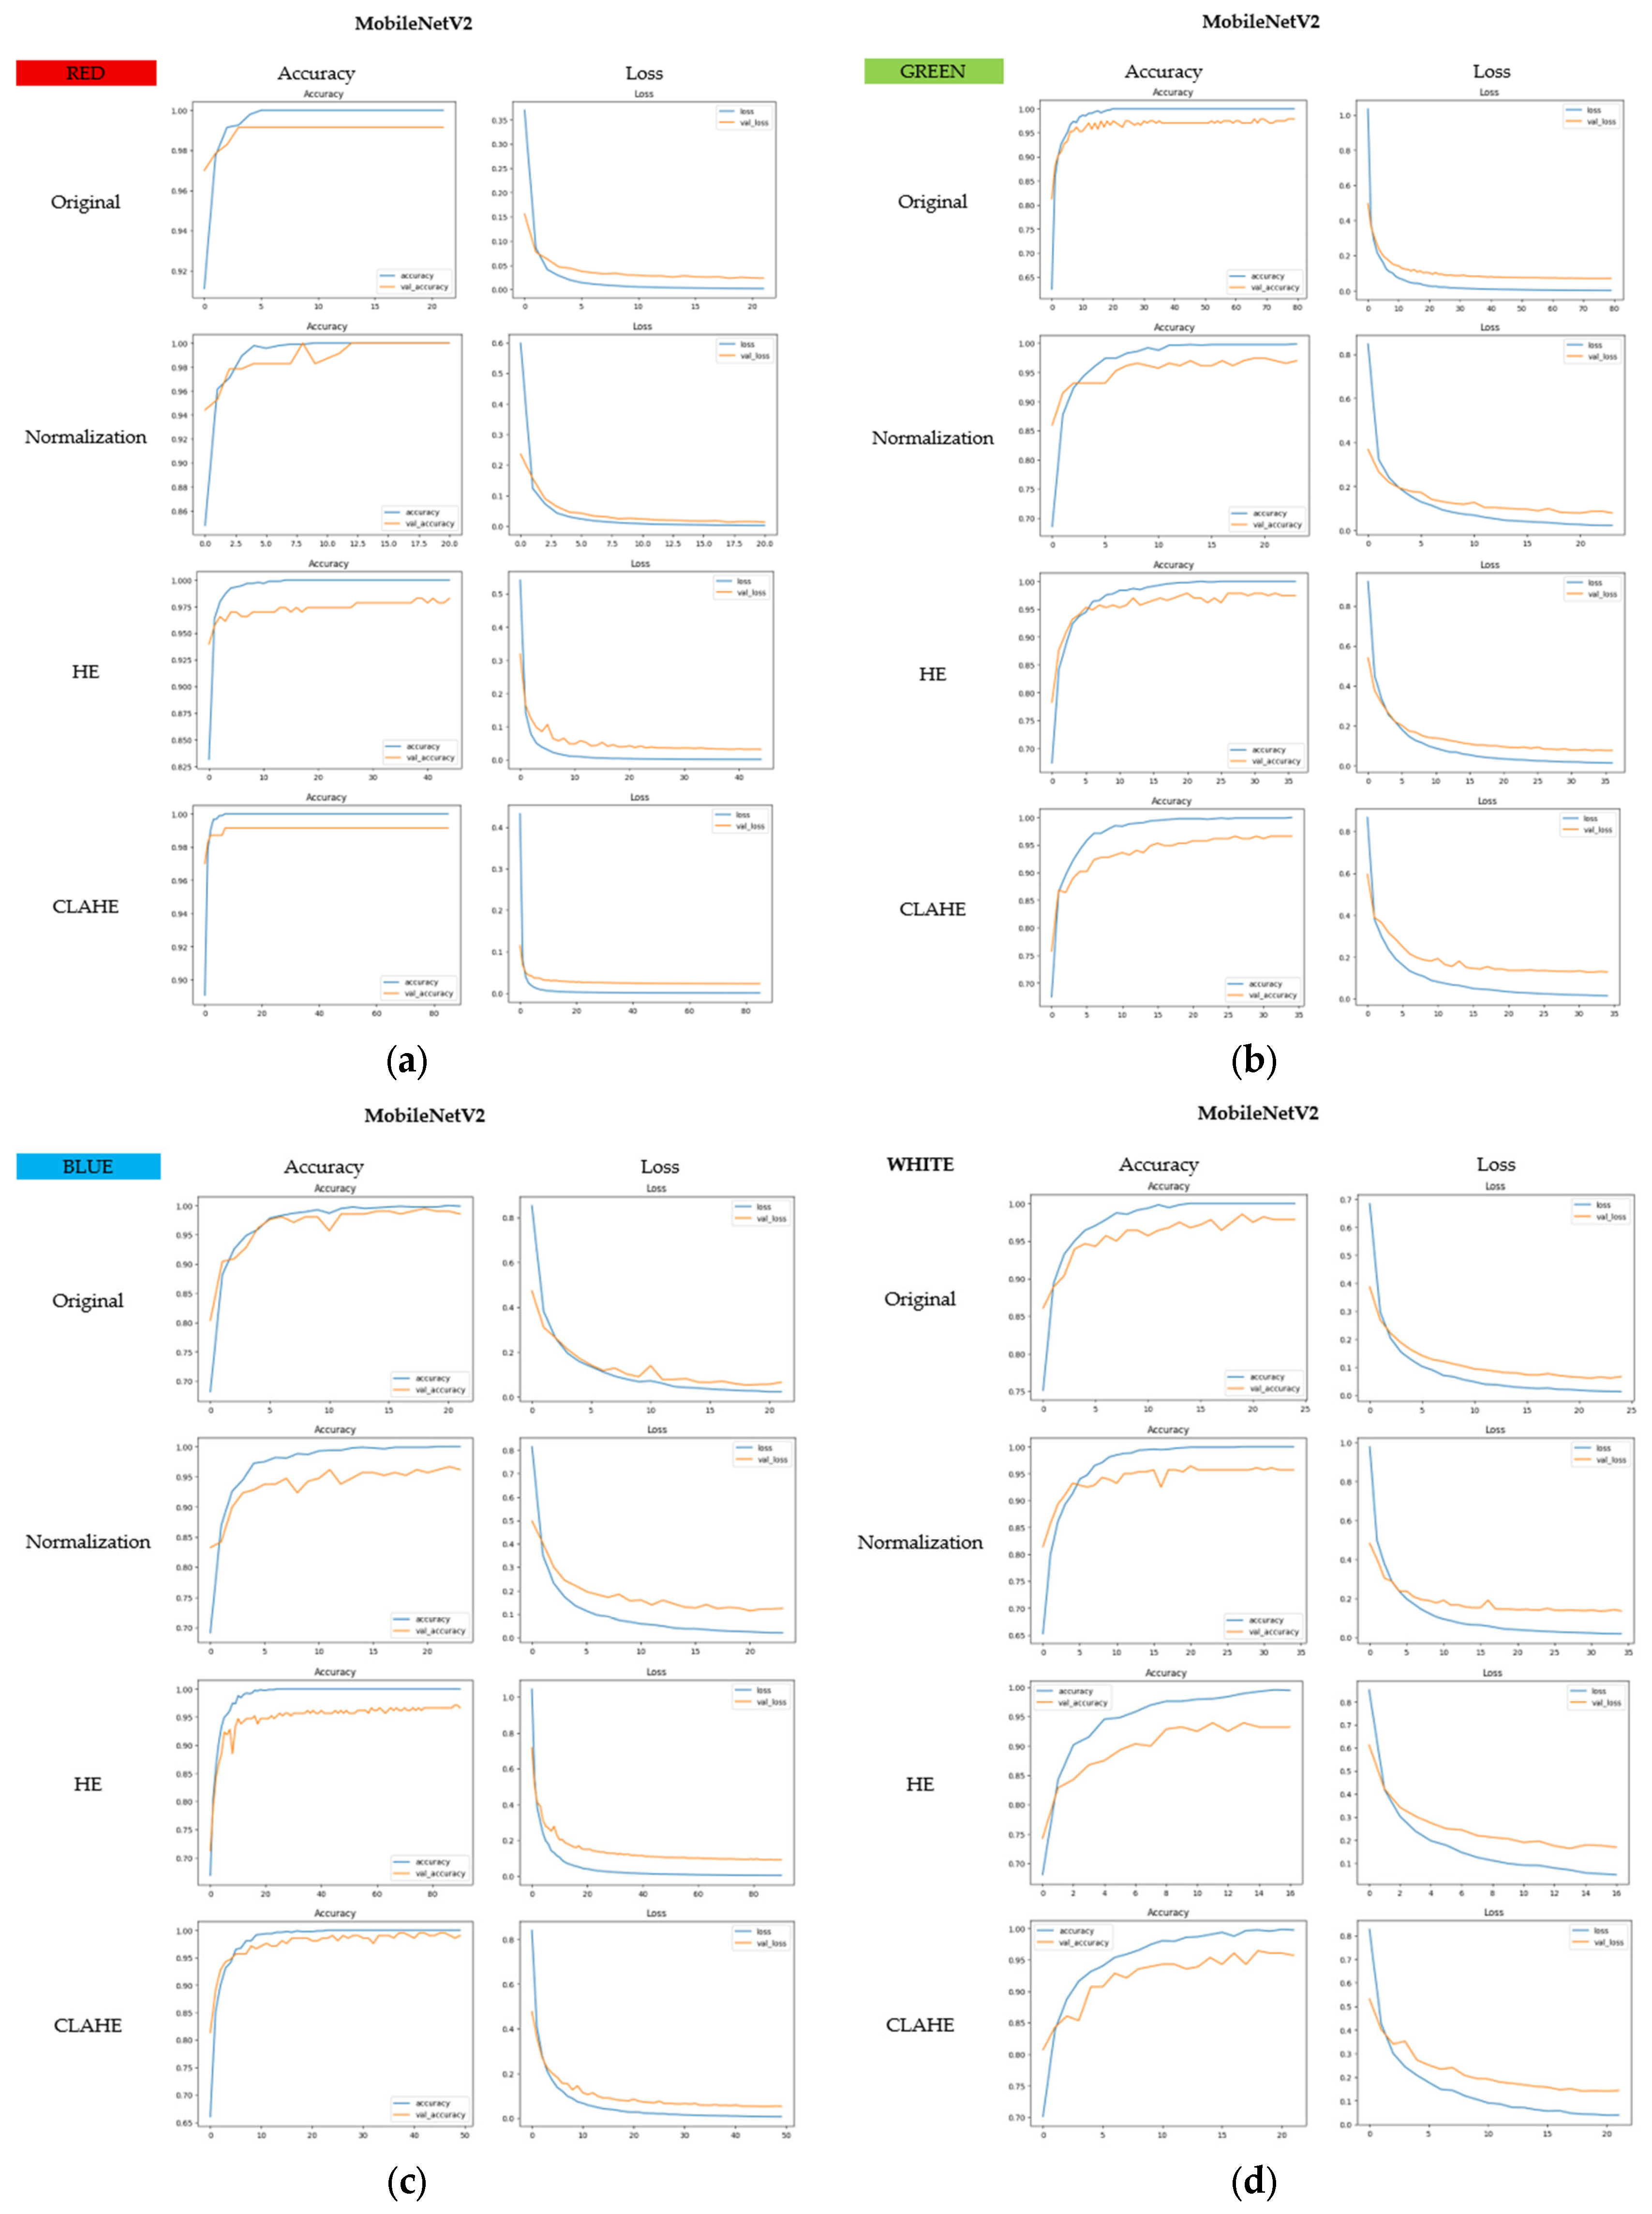
3.2.1. MobileNetV2
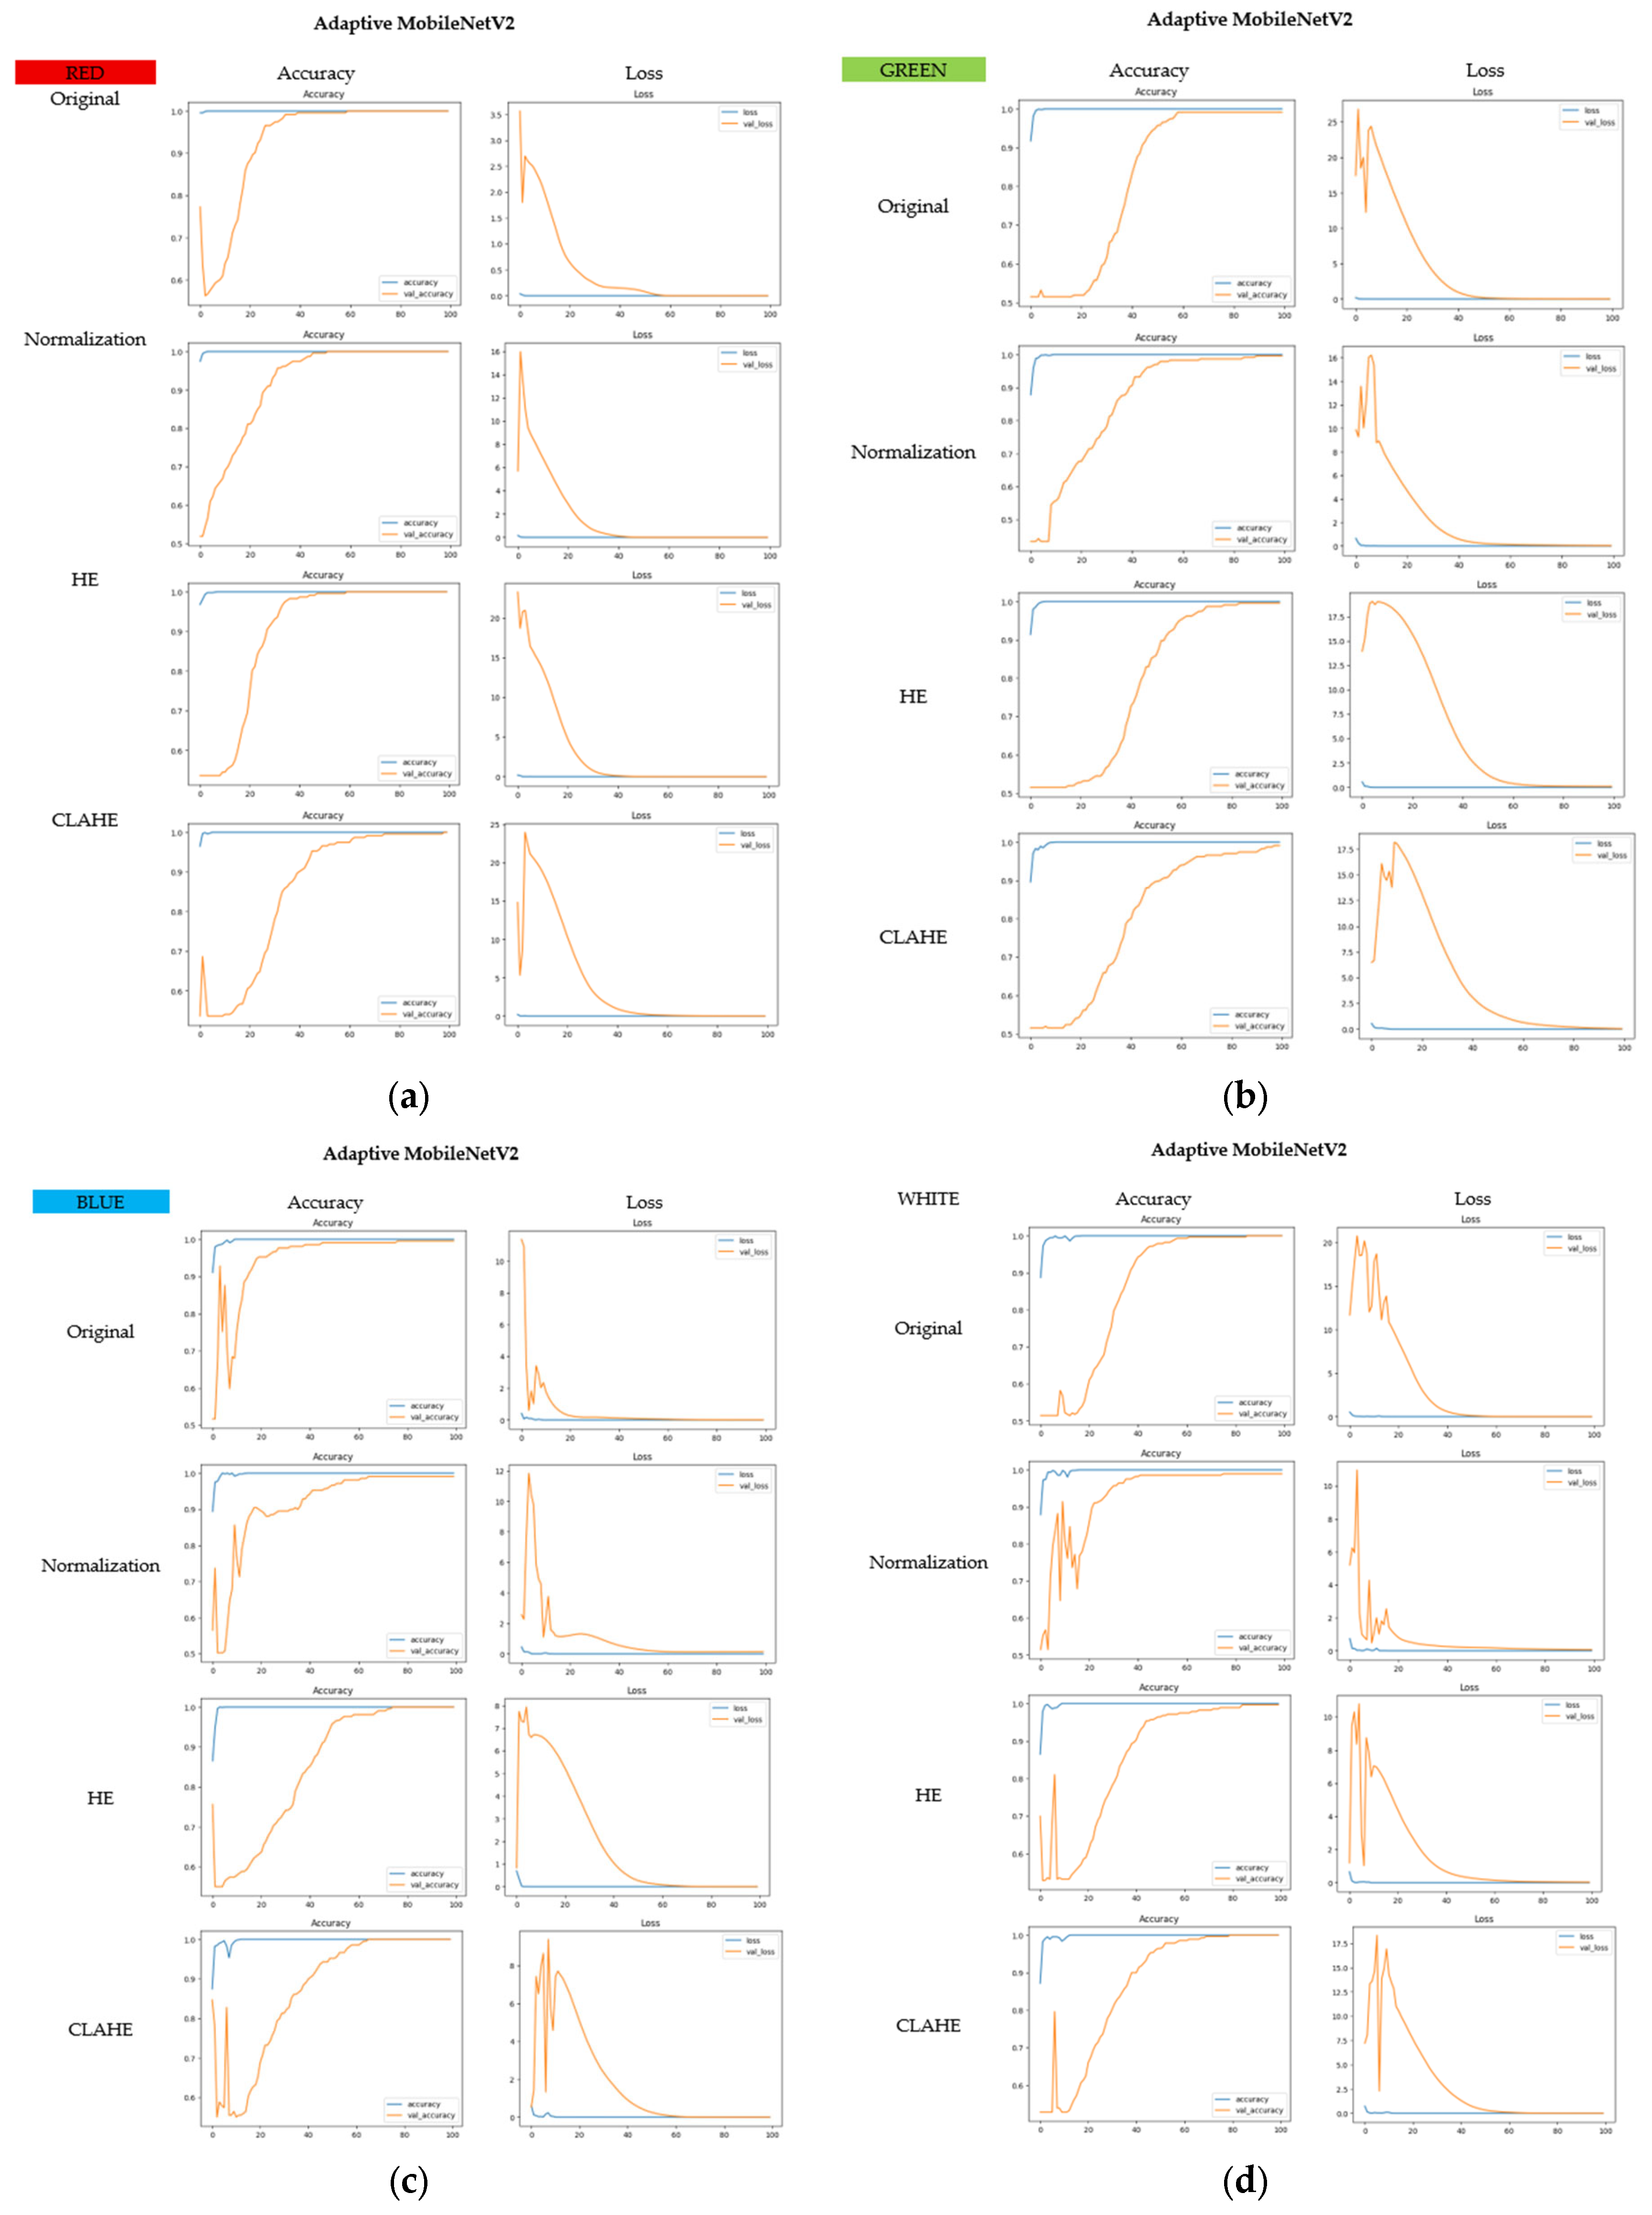
3.2.2. Adaptive MobileNetV2
4. Conclusions
Author Contributions
Funding
Institutional Review Board Statement
Informed Consent Statement
Data Availability Statement
Acknowledgments
Conflicts of Interest
References
- Virtue Market Research. Duck Eggs Market. Virtue Market Research. Available online: https://virtuemarketresearch.com/report/duck-eggs-market (accessed on 23 May 2025).
- Kaewmanee, T.; Benjakul, S.; Visessanguan, W. Changes in chemical composition, physical properties and microstructure of duck egg as influenced by salting. Food Chem. 2009, 112, 560–569. [Google Scholar] [CrossRef]
- Arthur, J.; Wiseman, K.; Cheng, K.M. Salted and preserved duck eggs: A consumer market segmentation analysis. J. Food Process Eng. 2015, 94, 1942–1956. [Google Scholar] [CrossRef] [PubMed]
- Lai, C.-C.; Li, C.-H.; Huang, K.-J.; Cheng, C.-W. Duck Eggshell Crack Detection by Nondestructive Sonic Measurement and Analysis. Sensors 2021, 21, 7299. [Google Scholar] [CrossRef] [PubMed]
- Sun, K.; Ma, L.; Pan, L.; Tu, K. Sequenced wave signal extraction and classification algorithm for duck egg crack on-line detection. Comput. Electron. Agric. 2017, 142, 429–439. [Google Scholar] [CrossRef]
- Caguioa, J.V.B.D.P.; Guinto, R.N.E.; Mesias, L.R.T.; De Goma, J.C. Duck Egg Quality Classification Based on its Shell Visual Property Through Transfer Learning Using ResNet-50. In Proceedings of the 12th Annual International Conference on Industrial Engineering and Operations Management, Istanbul, Turkey, 7–10 March 2022. [Google Scholar]
- Sun, L.; Feng, S.; Chen, C.; Liu, X.; Cai, J. Identification of eggshell crack for hen egg and duck egg using correlation analysis based on acoustic resonance method. J. Food Process Eng. 2020, 43, e13430. [Google Scholar] [CrossRef]
- Liu, C.; Wen, H.; Yin, G.; Ling, X.; Ibrahim, S.M. Research on Intelligent Recognition Method of Egg Cracks Based on EfficientNet Network Model. J. Phys. Conf. Ser. 2023, 2560, 012015. [Google Scholar] [CrossRef]
- Botta, B.; Gattam, S.S.R.; Datta, A.K. Eggshell crack detection using deep convolutional neural networks. J. Food Eng. 2022, 315, 110798. [Google Scholar] [CrossRef]
- Botta, B.; Datta, A.K. Deep transfer learning-based approach for detection of cracks on eggs. J. Food Process Eng. 2023, 46, e14425. [Google Scholar] [CrossRef]
- Shi, C.; Li, Y.; Jiang, X.; Sun, W.; Zhu, C.; Mo, Y.; Yan, S.; Zhang, C. Real-Time ConvNext-Based U-Net with Feature Infusion for Egg Microcrack Detection. Agriculture 2024, 14, 1655. [Google Scholar] [CrossRef]
- Chen, H.; Ma, J.; Zhuang, Q.; Zhao, S.; Xie, Y. Submillimeter Crack Detection Technology of Eggs Based on Improved Light Source. In Proceedings of the IOP Conference Series: Earth and Environmental Science, Guangzhou, China, 22–25 January 2021; Volume 697, p. 012018. [Google Scholar]
- Bao, G.; Jia, M.; Xun, Y.; Cai, S.; Yang, Q. Cracked egg recognition based on machine vision. Comput. Electron. Agric. 2019, 158, 159–166. [Google Scholar] [CrossRef]
- Balci, Z.; Yabanova, I. Artificial Intelligence Based Determination of Cracks in Eggshell Using Sound Signals. Sak. Univ. J. Sci. 2022, 26, 579–589. [Google Scholar] [CrossRef]
- Abbaspour-Gilandeh, Y.; Omid, M.; Alimardani, R. Identification of cracks in eggs shell using computer vision and hough transform. Yüzüncü Yıl Üniversitesi Tarım Bilim. Derg. 2018, 28, 375–383. [Google Scholar] [CrossRef]
- Kanjanasurat, I.; Krungseanmuang, W.; Chaowalittawin, V.; Purahong, B. Egg-Counting System Using Image Processing and a Website for Monitoring. In Proceedings of the 7th International Conference on Engineering, Applied Sciences and Technology (ICEAST), Pattaya, Thailand, 1–3 July 2021. [Google Scholar]
- Türkoğlu, M. Defective egg detection based on deep features and Bidirectional Long-Short-Term-Memory. Comput. Electron. Agric. 2021, 185, 106152. [Google Scholar] [CrossRef]
- Purahong, B.; Chaowalittawin, V.; Krungseanmuang, W.; Sathaporn, P.; Anuwongpinit, T.; Lasakul, A. Crack Detection of Eggshell Using Image Processing and Computer Vision. J. Phys. Conf. Ser. 2022, 2261, 012021. [Google Scholar] [CrossRef]
- Purahong, B.; Krungseanmuang, W.; Chaowalittawin, V.; Pumee, T.; Kanjanasurat, I.; Lasakul, A. Classification of Overlapping Eggs Based on Image Processing. J. Phys. Conf. Ser. 2022, 2261, 012023. [Google Scholar] [CrossRef]
- Li, H.; Wang, W.; Wang, M.; Li, L.; Vimlund, V. A review of deep learning methods for pixel-level crack detection. J. Traffic Transp. Eng. (Engl. Ed.) 2022, 9, 945–968. [Google Scholar] [CrossRef]
- Cha, Y.J.; Choi, W.; Büyüköztürk, O. Deep Learning-Based Crack Damage Detection Using Convolutional Neural Networks. Comput.-Aided Civ. Infrastruct. Eng. 2017, 32, 361–378. [Google Scholar] [CrossRef]
- Ali, R.; Chuah, J.H.; Talip, M.S.A.; Mokhtar, N.; Shoaib, M.A. Structural crack detection using deep convolutional neural networks. Autom. Constr. 2022, 133, 103989. [Google Scholar] [CrossRef]
- Chen, K.; Huang, Z.; Chen, C.; Cheng, Y.; Shang, Y.; Zhu, P.; Jv, H.; Li, L.; Li, W.; Wang, S. Surface Crack Detection of Steel Structures in Railroad Industry Based on Multi-Model Training Comparison Technique. Processes 2023, 11, 1208. [Google Scholar] [CrossRef]
- Shen, Y.; Wu, J.; Chen, J.; Weiwei, Z.; Yang, X.; Ma, H. Quantitative Detection of Pipeline Cracks Based on Ultrasonic Guided Waves and Convolutional Neural Network. Sensors 2024, 24, 1204. [Google Scholar] [CrossRef] [PubMed]
- Wu, J.; Hao, H.; Li, J.; Wang, Y.; Wu, Z.; Ma, H. Defect detection in pipe structures using stochastic resonance of Duffing oscillator and ultrasonic guided waves. Int. J. Press. Vessel. Pip. 2020, 187, 104168. [Google Scholar] [CrossRef]
- Ali, L.; Alnajjar, F.; Jassmi, H.A.; Gocho, M.; Khan, W.; Serhani, M.A. Performance Evaluation of Deep CNN-Based Crack Detection and Localization Techniques for Concrete Structures. Sensors 2021, 21, 1688. [Google Scholar] [CrossRef] [PubMed]
- Fan, Z.; Li, C.; Chen, Y.; Di Mascio, P.; Chen, X.; Zhu, G.; Loprencipe, G. Ensemble of Deep Convolutional Neural Networks for Automatic Pavement Crack Detection and Measurement. Coatings 2020, 10, 152. [Google Scholar] [CrossRef]
- Chen, X.; Meng, F.; Zhang, C.; Hu, D.; Yang, F.; Lu, J. Surface Crack Detection Method for Coal Rock Based on Improved YOLOv5. Appl. Sci. 2022, 12, 9695. [Google Scholar] [CrossRef]
- Sandler, M.; Howard, A.; Zhu, M.; Zhmoginov, A.; Chen, L.C. MobileNetV2: Inverted Residuals and Linear Bottlenecks. In Proceedings of the IEEE Conference on Computer Vision and Pattern Recognition, Salt Lake City, UT, USA, 18–22 June 2018; pp. 4510–4520. [Google Scholar]


| Model | Validation Accuracy (%) | |||
|---|---|---|---|---|
| Red | Green | Blue | White | |
| DenseNet121 | 98.50 | 93.28 | 89.96 | 90.00 |
| DenseNet169 | 99.62 | 85.82 | 92.89 | 91.87 |
| DenseNet201 | 98.87 | 93.28 | 82.01 | 91.87 |
| EfficientNetB0 | 52.63 | 54.85 | 44.35 | 45.31 |
| EfficientNetB1 | 57.14 | 45.15 | 44.35 | 45.94 |
| EfficientNetB2 | 47.37 | 45.15 | 47.28 | 54.69 |
| EfficientNetB3 | 52.63 | 55.22 | 52.72 | 60.94 |
| EfficientNetB4 | 54.51 | 54.85 | 55.23 | 55.94 |
| EfficientNetB5 | 56.39 | 56.34 | 50.63 | 46.56 |
| EfficientNetB6 | 47.37 | 45.15 | 51.05 | 53.75 |
| EfficientNetB7 | 56.02 | 54.85 | 51.05 | 47.50 |
| InceptionResNetV2 | 98.50 | 90.30 | 90.79 | 80.31 |
| InceptionV3 | 98.12 | 91.79 | 80.75 | 85.62 |
| MobileNet | 99.62 | 92.16 | 86.19 | 93.12 |
| MobileNetV2 | 99.62 | 91.04 | 94.14 | 93.75 |
| MobileNetV3Large | 59.77 | 69.40 | 63.6 | 61.56 |
| MobileNetV3Small | 52.63 | 54.85 | 55.65 | 49.38 |
| NASNetMobile | 98.87 | 85.45 | 87.87 | 88.44 |
| ResNet101 | 48.87 | 67.54 | 57.74 | 59.38 |
| ResNet101V2 | 98.50 | 91.79 | 90.79 | 90.00 |
| ResNet152 | 63.53 | 58.96 | 64.44 | 61.87 |
| ResNet152V2 | 96.99 | 92.16 | 87.45 | 91.25 |
| ResNet50 | 56.39 | 54.85 | 70.71 | 54.06 |
| ResNet50V2 | 99.25 | 92.91 | 93.72 | 93.44 |
| VGG16 | 92.11 | 74.25 | 67.78 | 75.94 |
| VGG19 | 92.86 | 83.58 | 69.87 | 74.37 |
| Xception | 96.99 | 87.69 | 85.36 | 90.94 |
| Color | The Best Pre-Processing | Details |
|---|---|---|
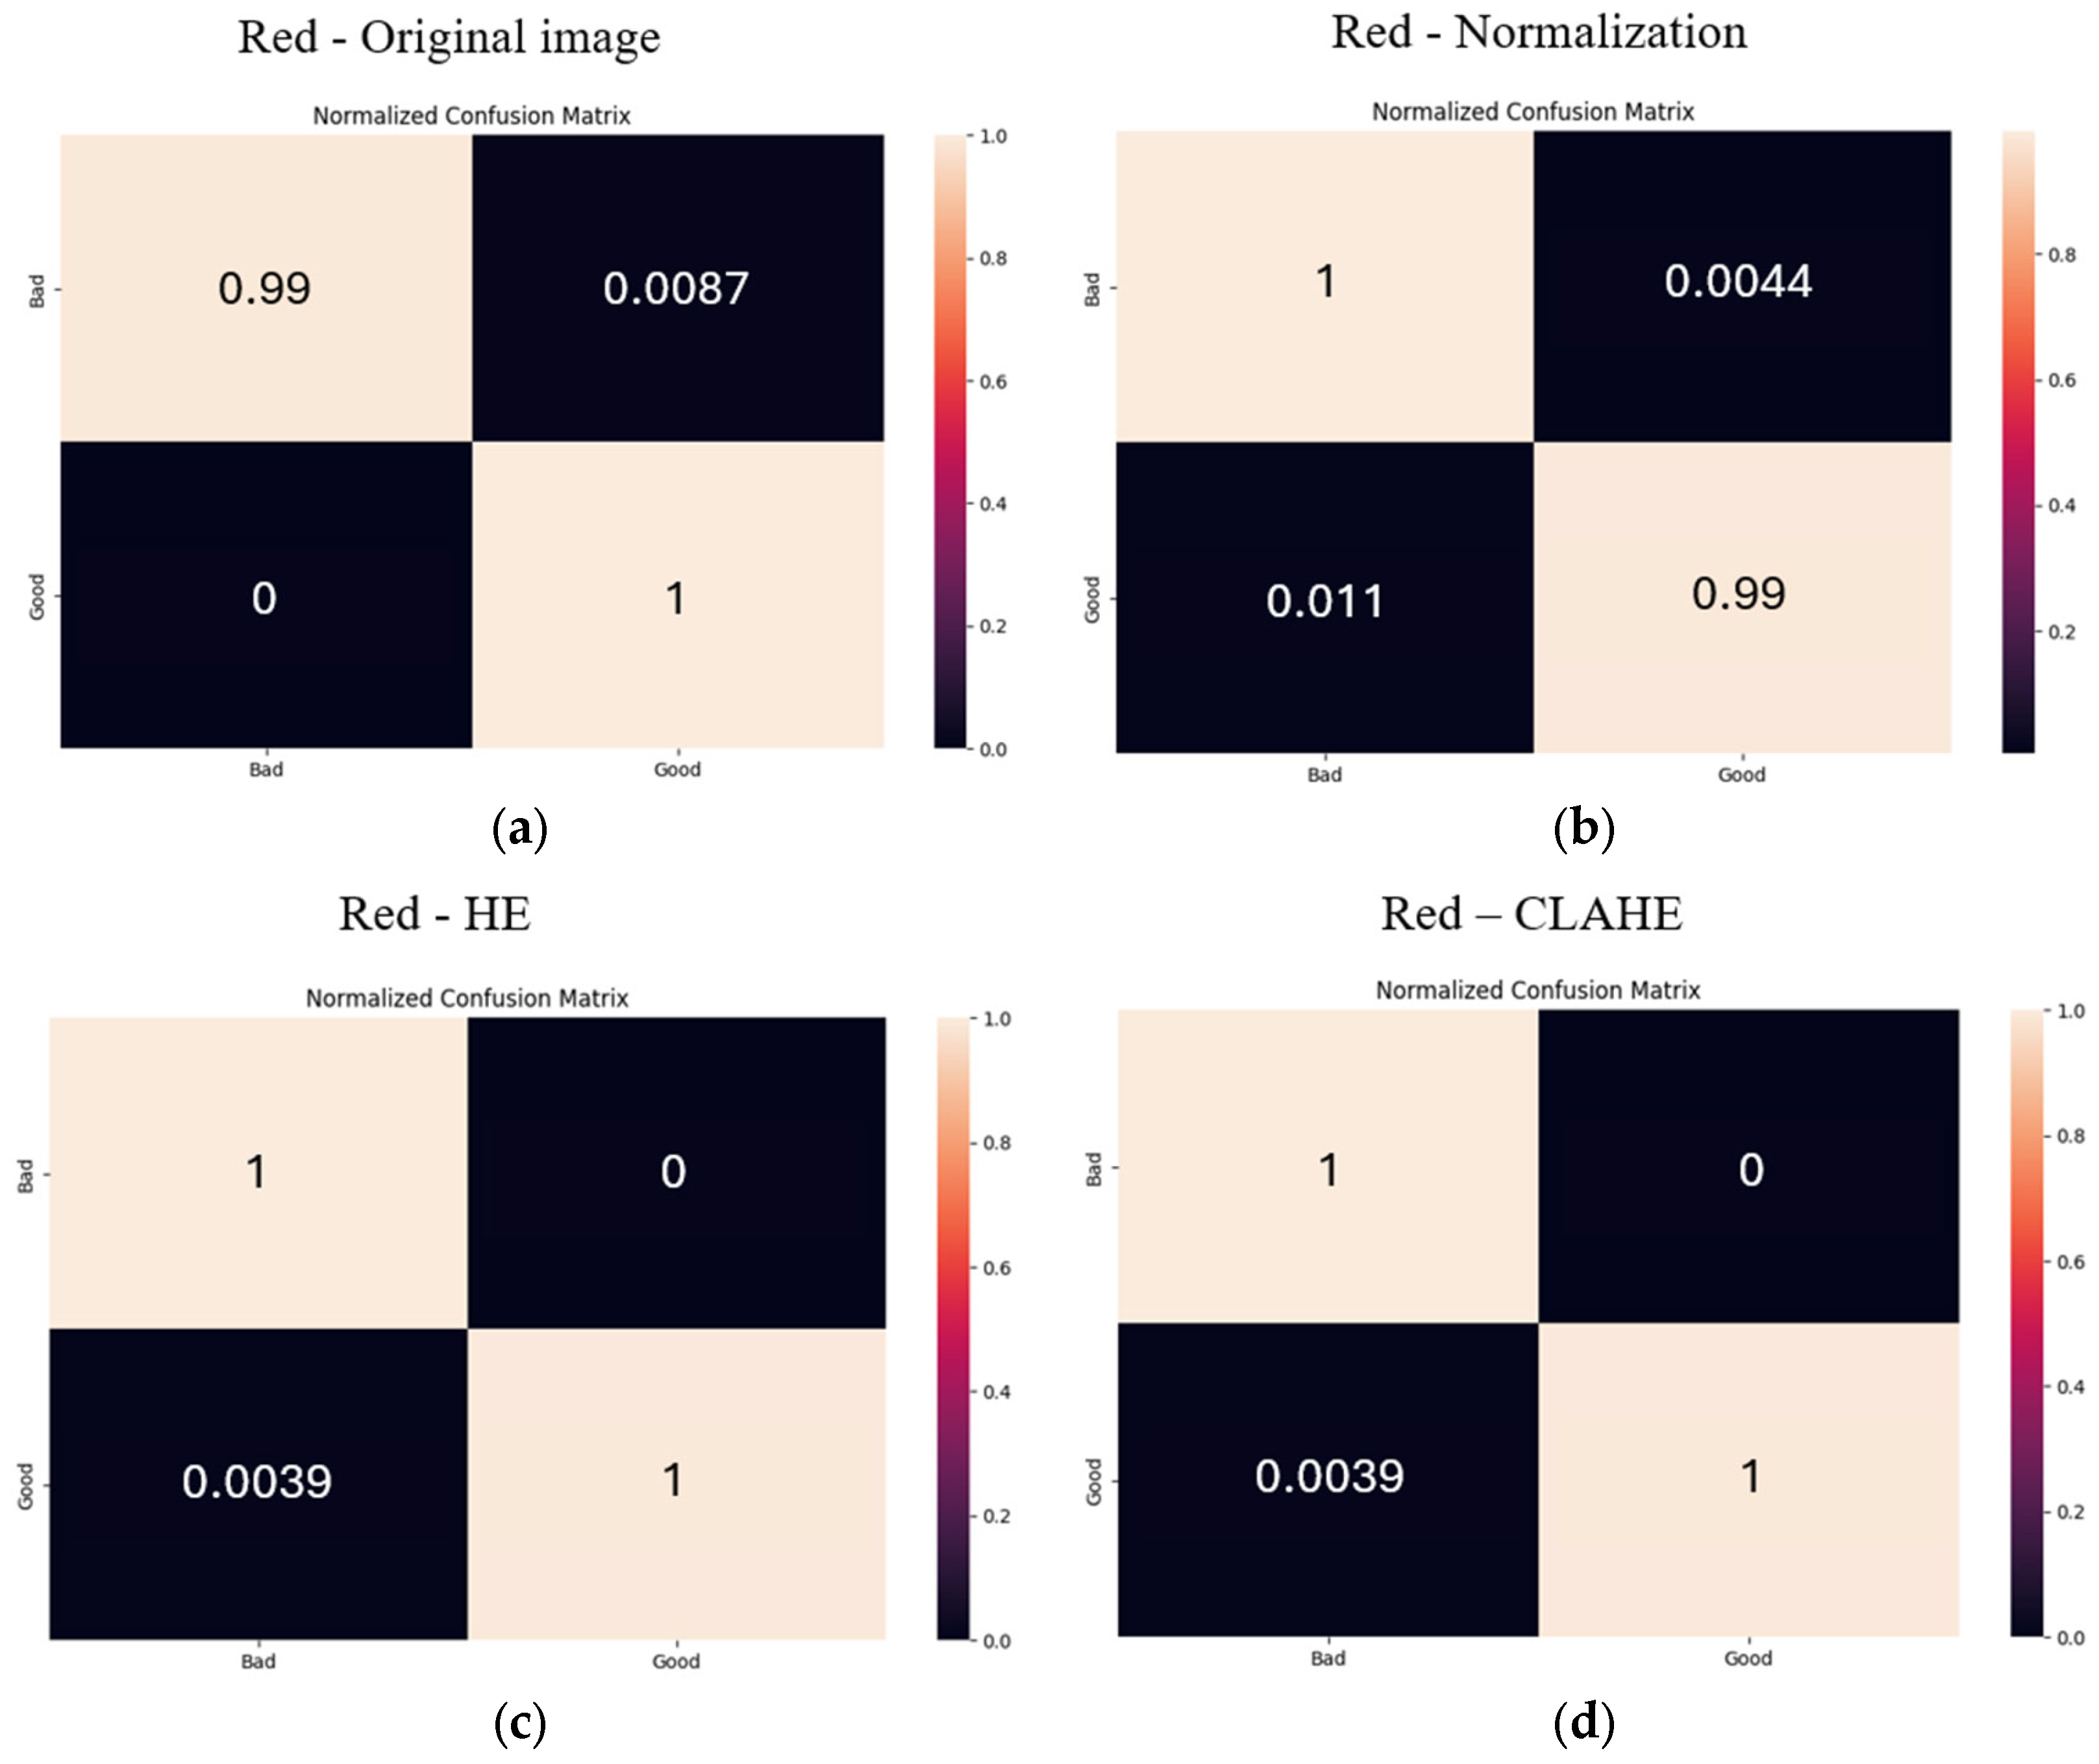
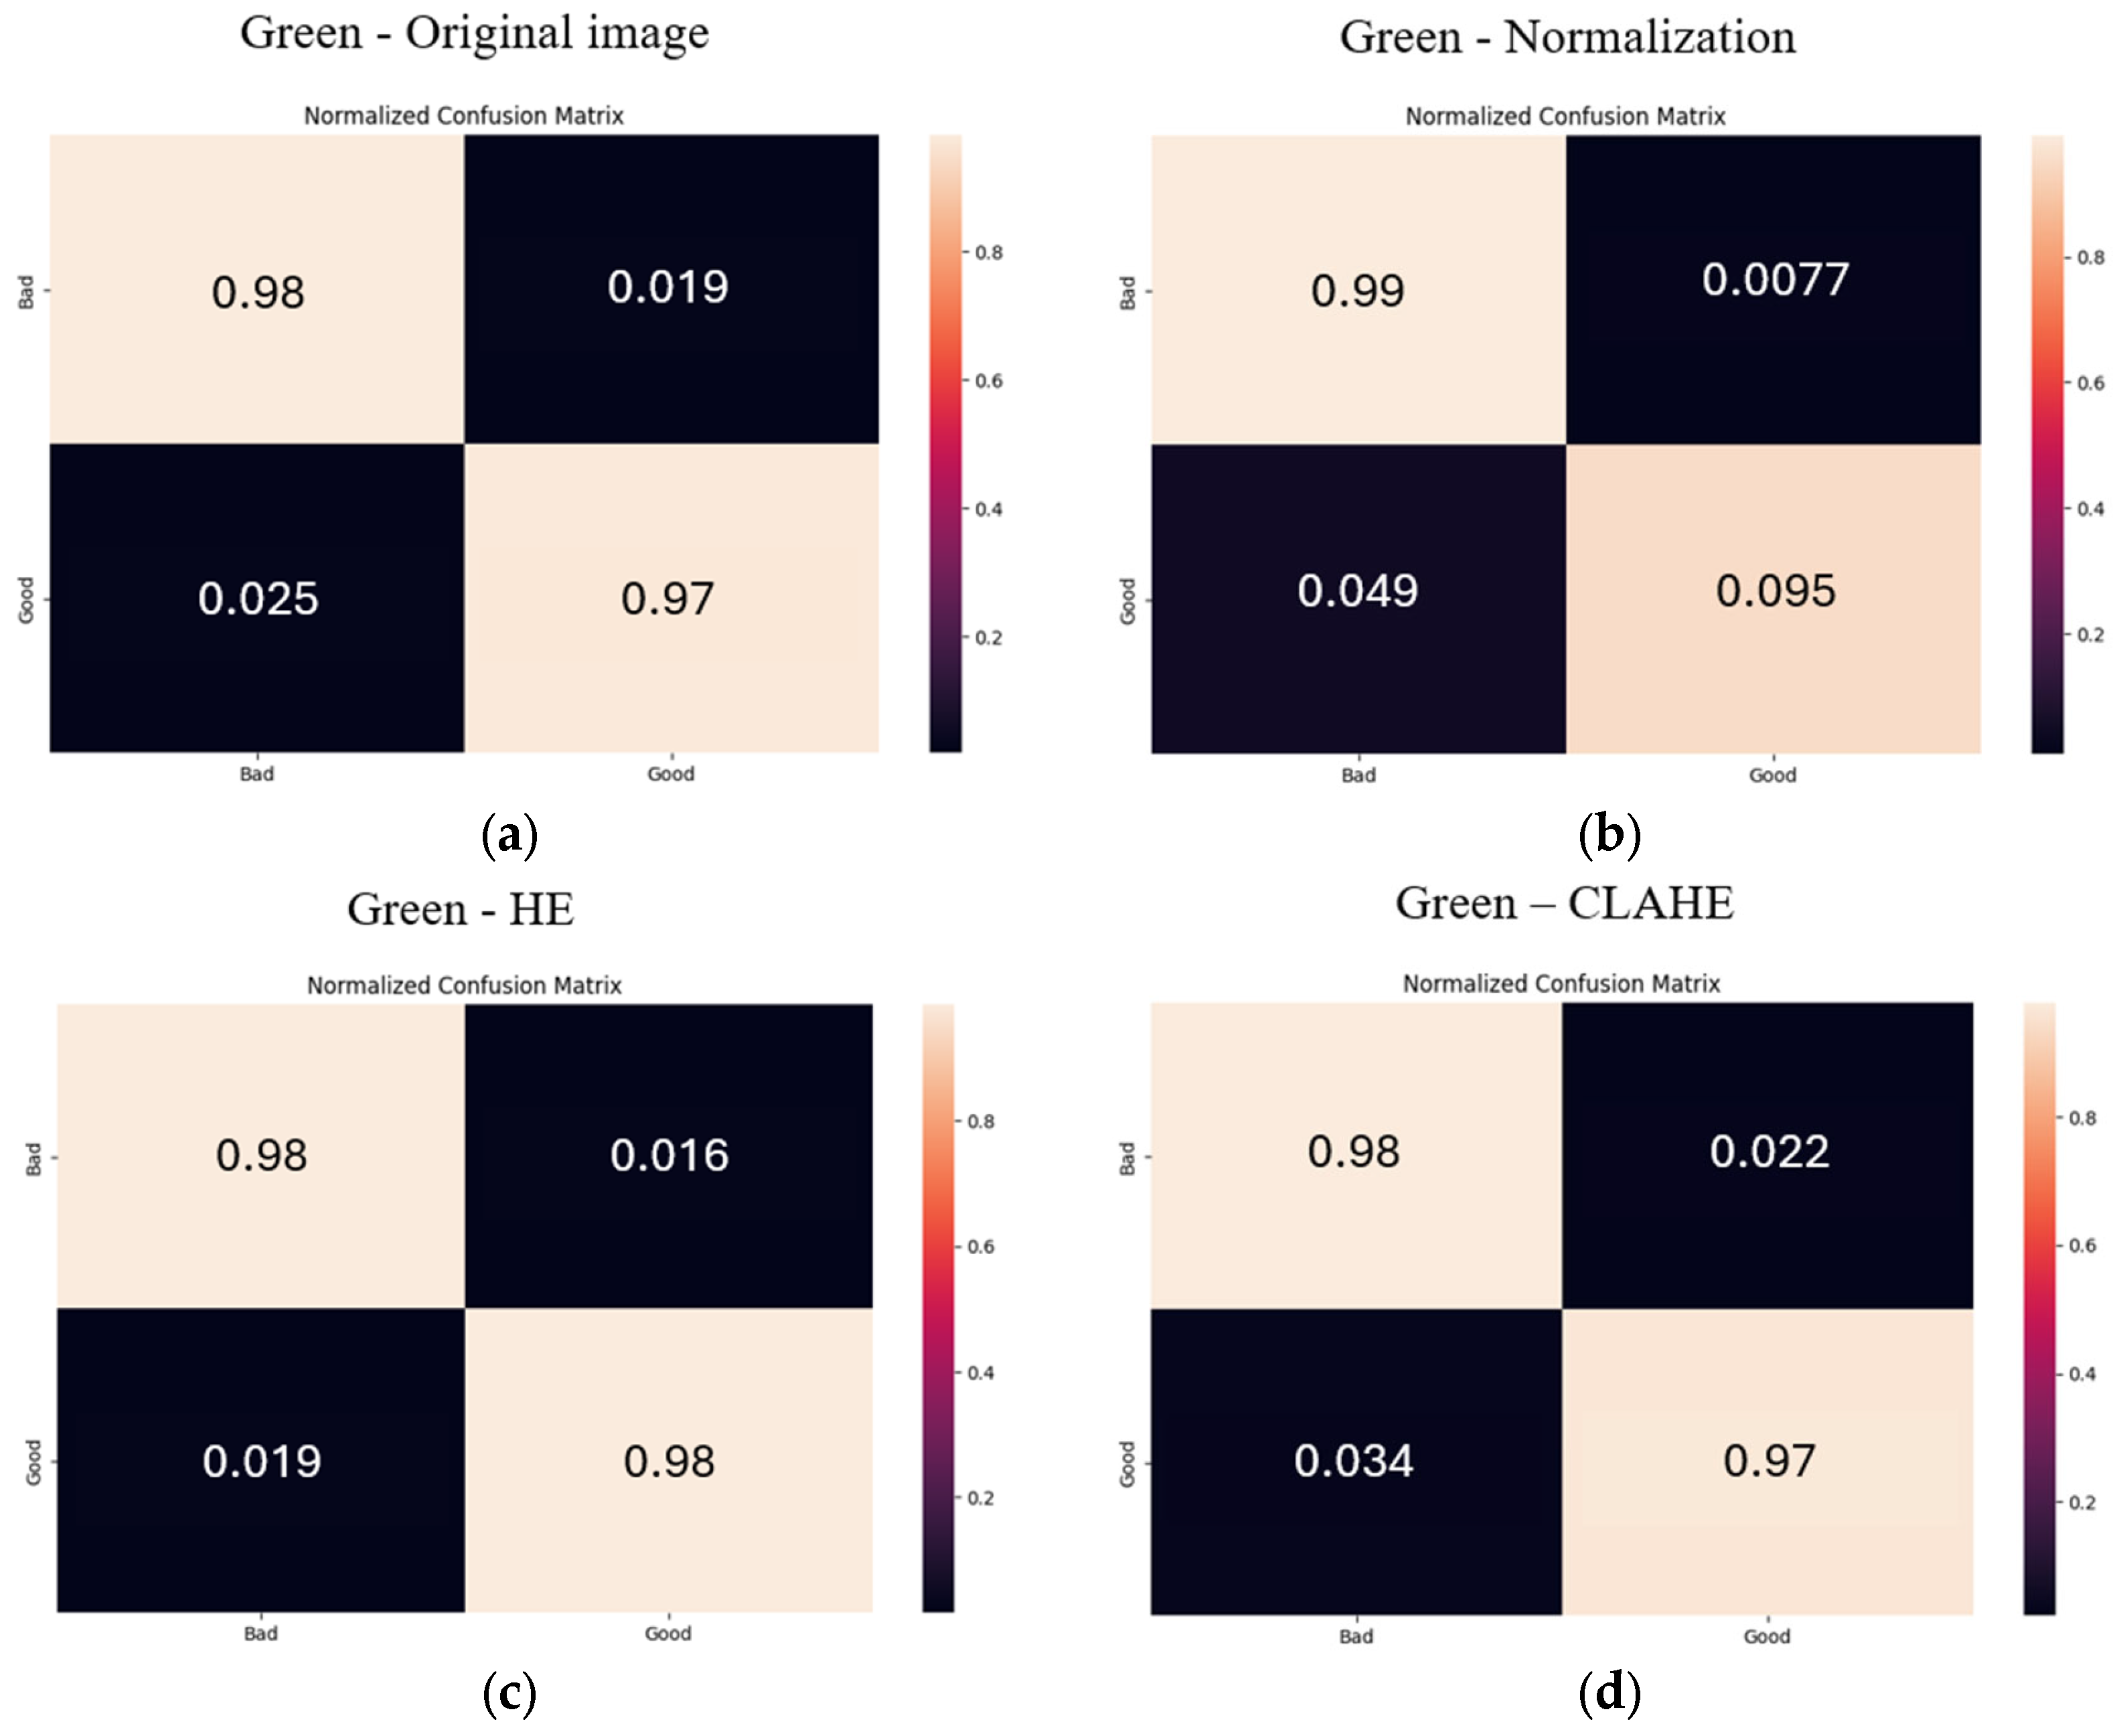
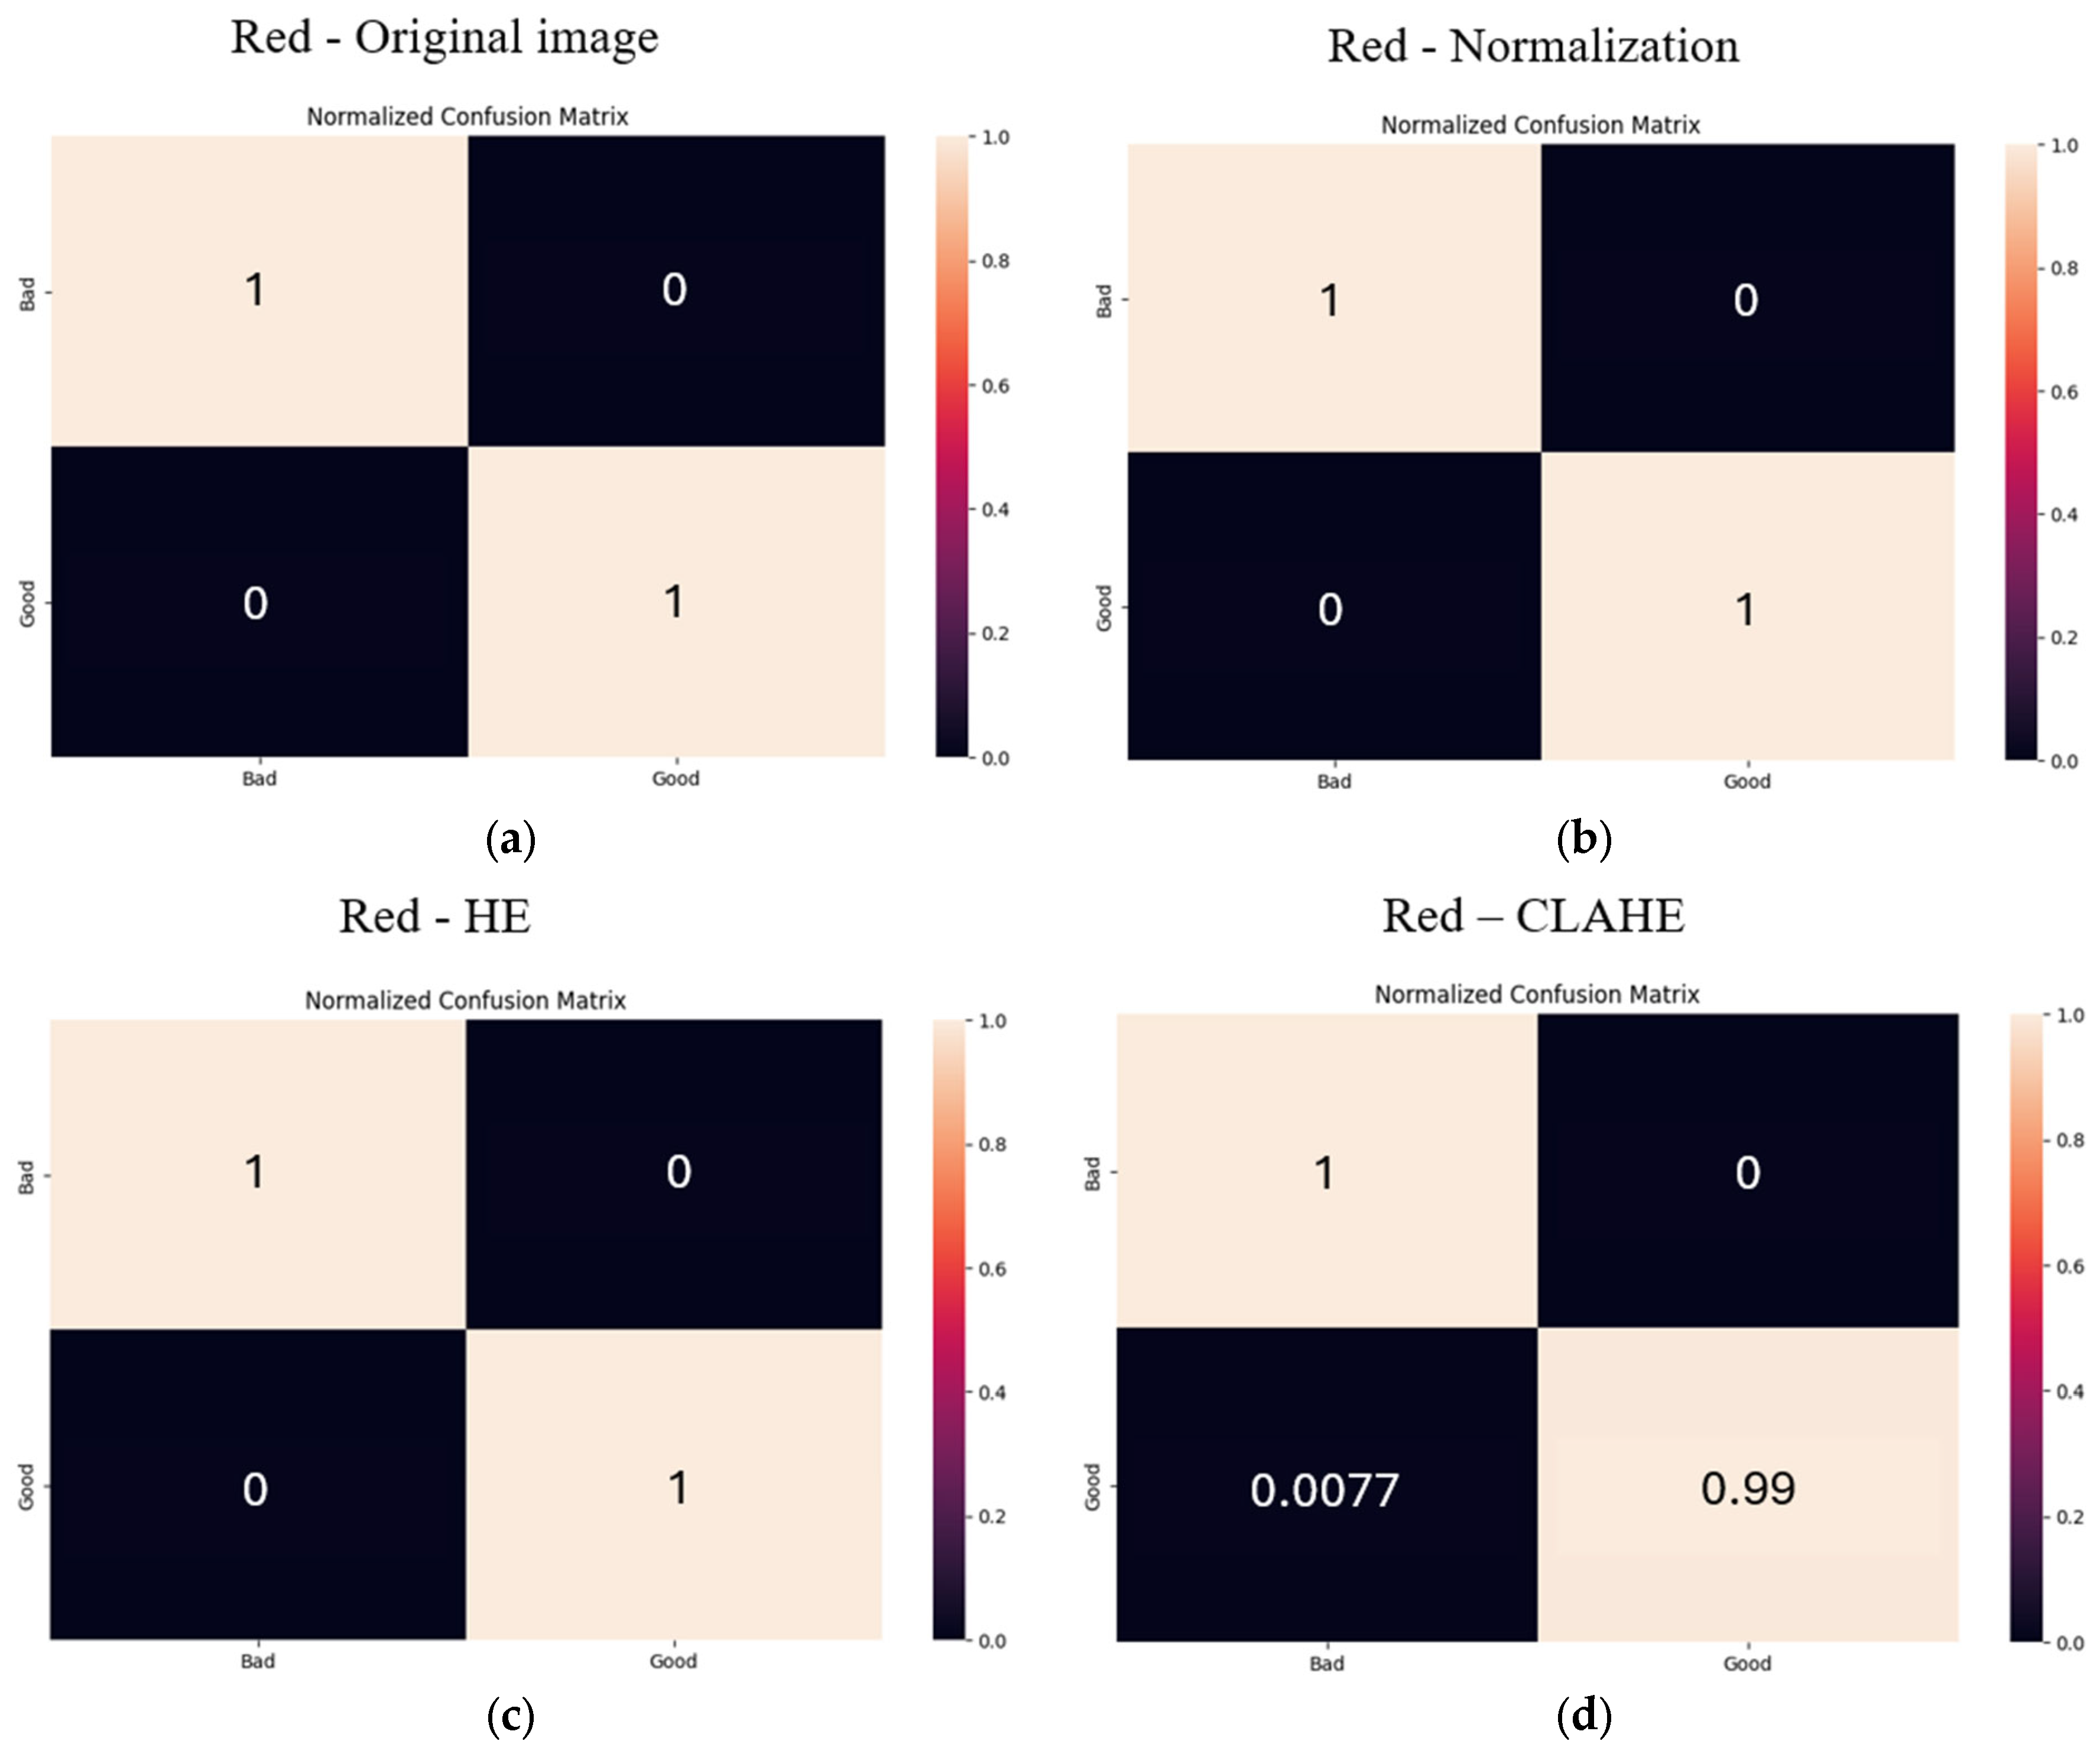
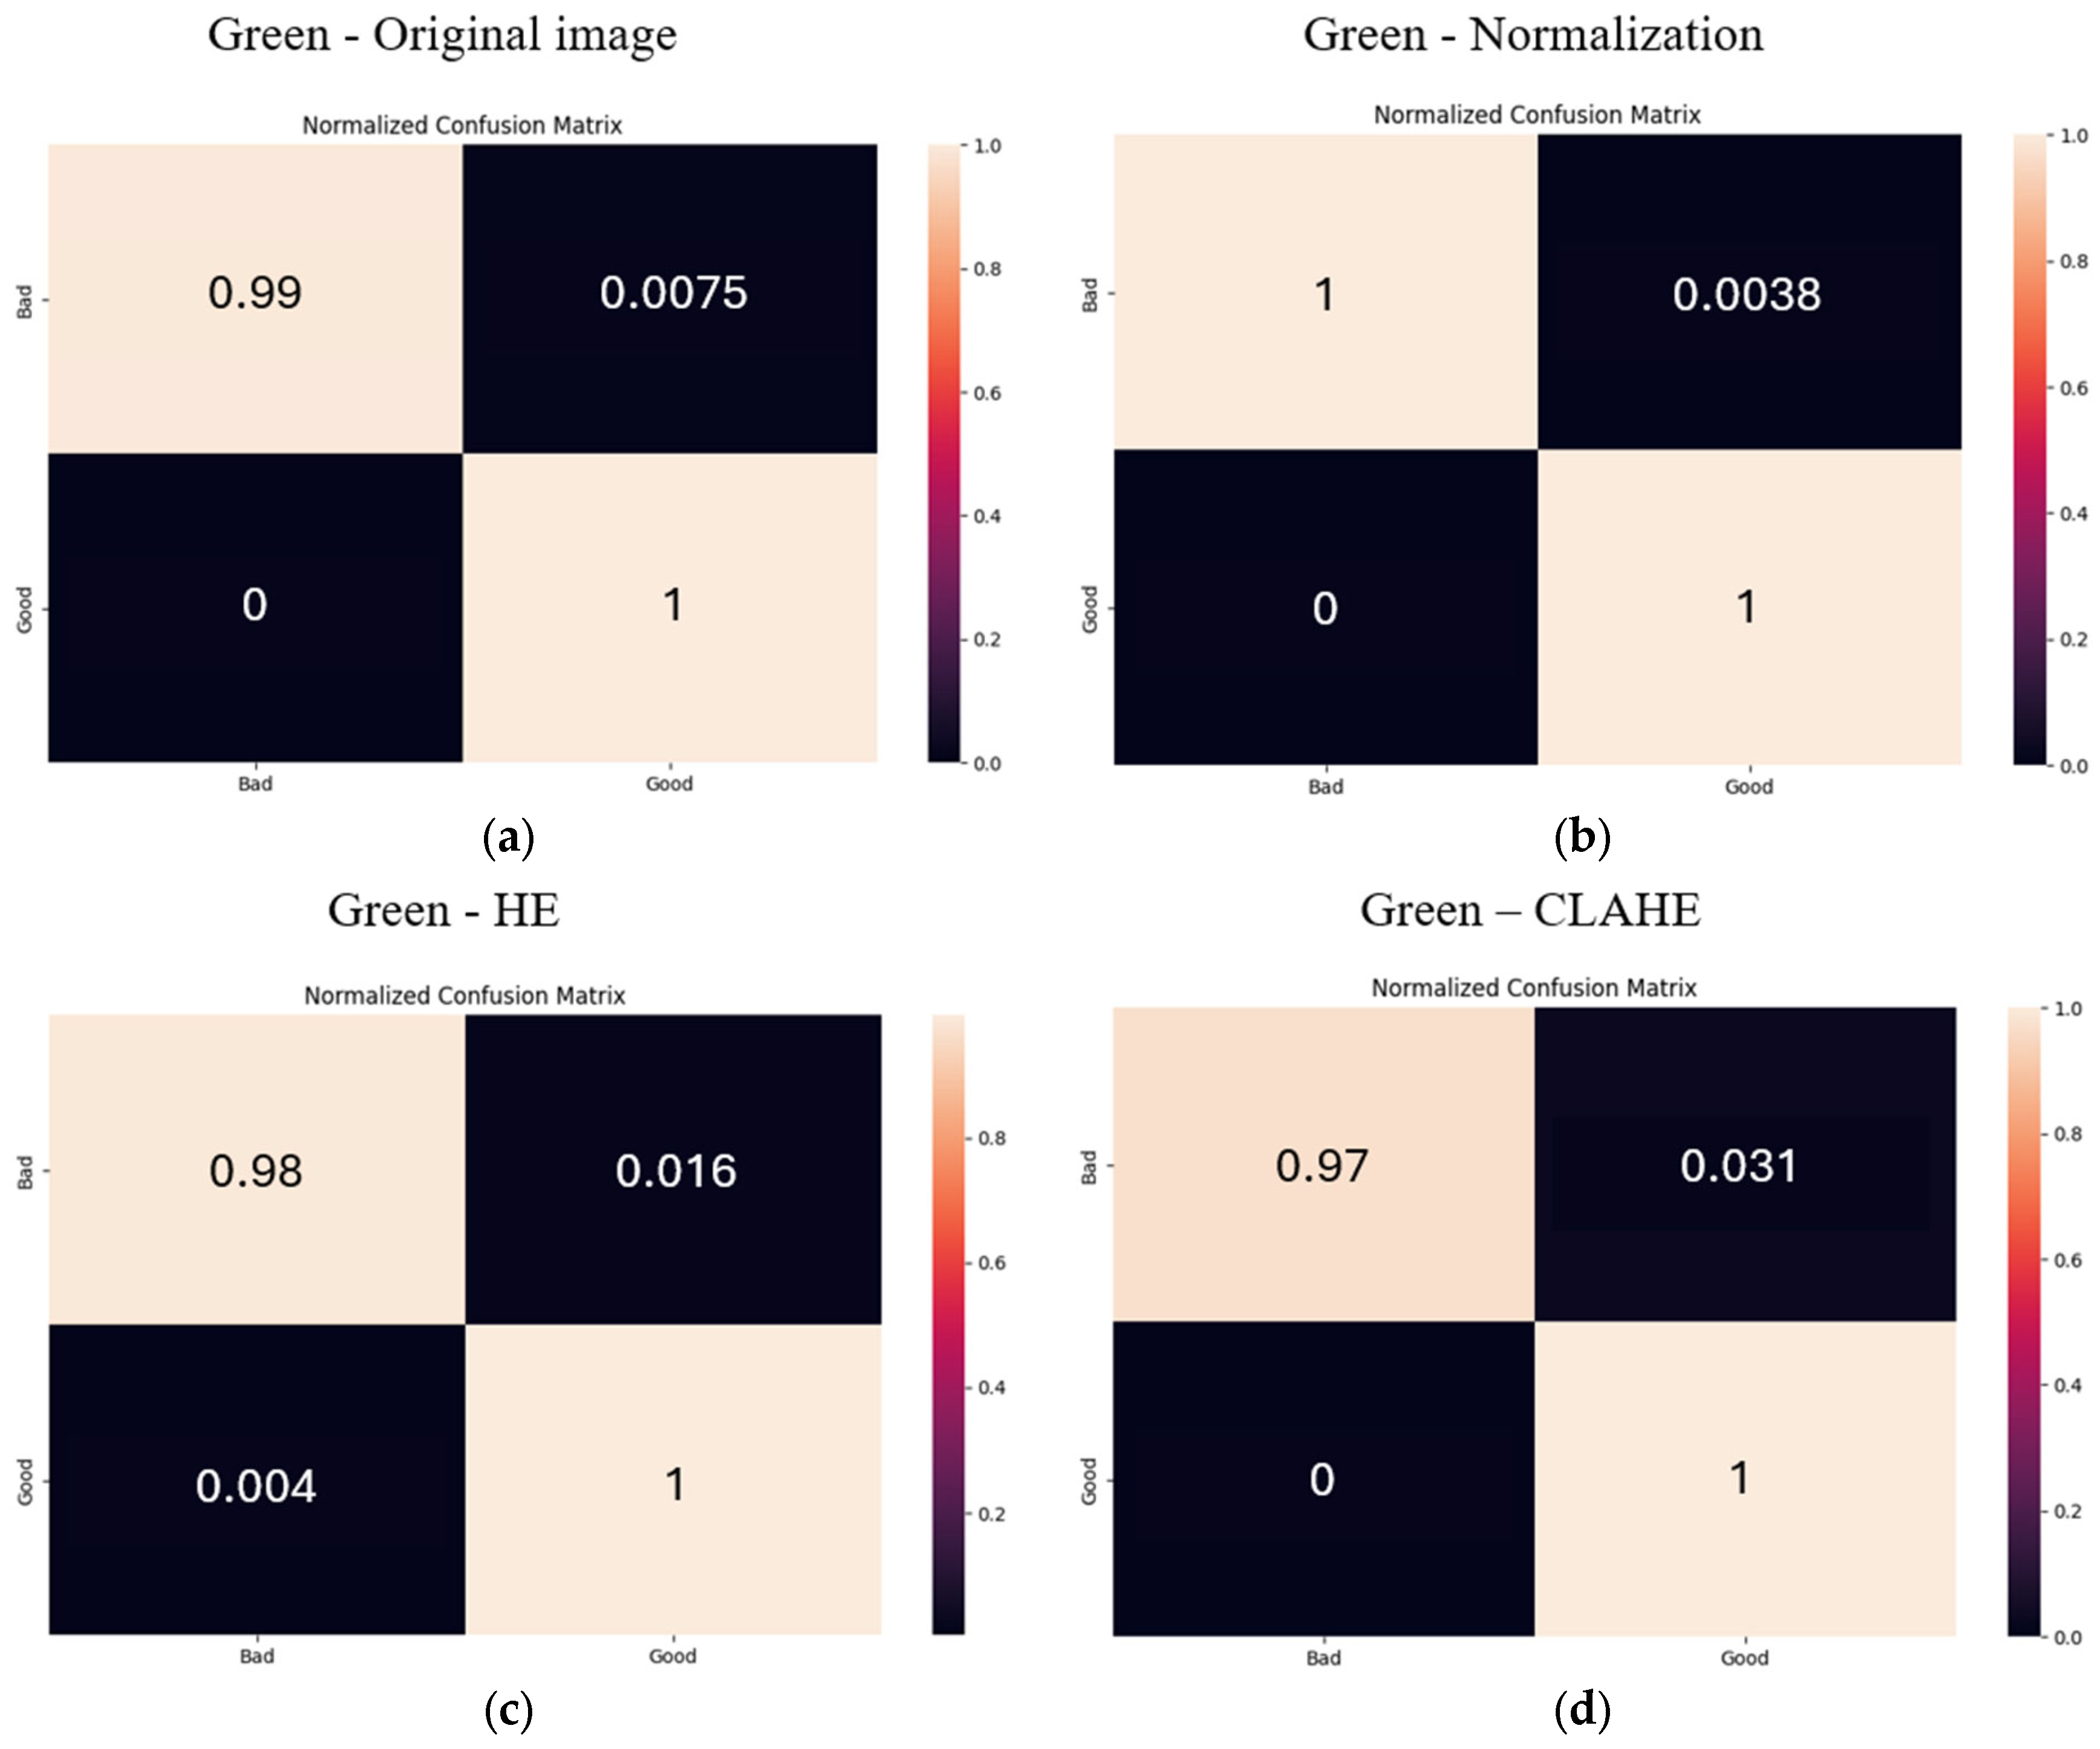
| Red | HE and CLAHE | Lowest FP and FN = 0 |
| Green | Normalization | Highest TP, FP lower than HE |
| Blue | CLAHE | Reduces FP most effectively without reducing TP |
| White | Original | HE/CLAHE degrades performance. |
| Light Color | Pre-Processing | Model | Accuracy (%) | Precision (%) | Recall (%) | F1-Score (%) |
|---|---|---|---|---|---|---|
| Red | Original | MobilNetV2 | 99.60 | 99.63 | 99.57 | 99.60 |
| Normalization | 99.20 | 99.16 | 99.23 | 99.19 | ||
| HE | 99.80 | 99.80 | 99.80 | 99.80 | ||
| CLAHE | 99.80 | 99.80 | 99.80 | 99.80 | ||
| Green | Original | 97.82 | 97.83 | 98.80 | 97.82 | |
| Normalization | 97.23 | 97.36 | 97.16 | 97.22 | ||
| HE | 98.22 | 98.21 | 98.22 | 98.22 | ||
| CLAHE | 97.23 | 97.24 | 97.19 | 97.21 | ||
| Blue | Original | 99.55 | 99.55 | 99.56 | 99.55 | |
| Normalization | 97.33 | 97.34 | 97.32 | 97.33 | ||
| HE | 96.21 | 96.21 | 96.29 | 96.21 | ||
| CLAHE | 97.77 | 97.89 | 97.71 | 97.77 | ||
| White | Original | 98.34 | 98.34 | 98.34 | 98.34 | |
| Normalization | 97.67 | 97.68 | 97.69 | 97.67 | ||
| HE | 94.68 | 94.68 | 94.65 | 94.67 | ||
| CLAHE | 94.02 | 94.02 | 94.00 | 94.01 |
| Color | The Best Pre-Processing | Details |
|---|---|---|
| Red | Original, Normalization, HE | Stable, no need to customize |
| Green | Normalization | CLAHE has highest FN |
| Blue | HE | Normalization has highest FP |
| White | Original, HE | CLAHE has a slight TP reduction effect |
| Light Color | Pre-Processing | Model | Accuracy (%) | Precision (%) | Recall (%) | F1-Score (%) |
|---|---|---|---|---|---|---|
| Red | Original | Adaptive MobilNetV2 | 100.00 | 100.00 | 100.00 | 100.00 |
| Normalization | 100.00 | 100.00 | 100.00 | 100.00 | ||
| HE | 100.00 | 100.00 | 100.00 | 100.00 | ||
| CLAHE | 99.60 | 99.59 | 99.61 | 99.60 | ||
| Green | Original | 99.60 | 99.58 | 99.63 | 99.60 | |
| Normalization | 99.80 | 99.79 | 99.81 | 99.80 | ||
| HE | 99.01 | 99.01 | 99.02 | 99.01 | ||
| CLAHE | 98.42 | 98.44 | 98.44 | 98.42 | ||
| Blue | Original | 99.78 | 99.77 | 99.79 | 99.78 | |
| Normalization | 98.22 | 98.25 | 98.25 | 98.22 | ||
| HE | 100.00 | 100.00 | 100.00 | 100.00 | ||
| CLAHE | 99.33 | 99.32 | 99.34 | 99.33 | ||
| White | Original | 99.83 | 99.83 | 99.84 | 99.83 | |
| Normalization | 99.50 | 99.50 | 99.51 | 99.50 | ||
| HE | 99.83 | 99.84 | 99.83 | 99.83 | ||
| CLAHE | 99.50 | 99.51 | 99.50 | 99.50 |
Disclaimer/Publisher’s Note: The statements, opinions and data contained in all publications are solely those of the individual author(s) and contributor(s) and not of MDPI and/or the editor(s). MDPI and/or the editor(s) disclaim responsibility for any injury to people or property resulting from any ideas, methods, instructions or products referred to in the content. |
© 2025 by the authors. Licensee MDPI, Basel, Switzerland. This article is an open access article distributed under the terms and conditions of the Creative Commons Attribution (CC BY) license (https://creativecommons.org/licenses/by/4.0/).
Share and Cite
Chaowalittawin, V.; Krungseanmuang, W.; Sathaporn, P.; Purahong, B. Duck Egg Crack Detection Using an Adaptive CNN Ensemble with Multi-Light Channels and Image Processing. Appl. Sci. 2025, 15, 7960. https://doi.org/10.3390/app15147960
Chaowalittawin V, Krungseanmuang W, Sathaporn P, Purahong B. Duck Egg Crack Detection Using an Adaptive CNN Ensemble with Multi-Light Channels and Image Processing. Applied Sciences. 2025; 15(14):7960. https://doi.org/10.3390/app15147960
Chicago/Turabian StyleChaowalittawin, Vasutorn, Woranidtha Krungseanmuang, Posathip Sathaporn, and Boonchana Purahong. 2025. "Duck Egg Crack Detection Using an Adaptive CNN Ensemble with Multi-Light Channels and Image Processing" Applied Sciences 15, no. 14: 7960. https://doi.org/10.3390/app15147960
APA StyleChaowalittawin, V., Krungseanmuang, W., Sathaporn, P., & Purahong, B. (2025). Duck Egg Crack Detection Using an Adaptive CNN Ensemble with Multi-Light Channels and Image Processing. Applied Sciences, 15(14), 7960. https://doi.org/10.3390/app15147960