Article

Investigation of Gluten Contamination in Commercial Hydrated Cassava Starch and Its Physicochemical Properties

by
Marina Magalhães Cardoso Malta
,
Giovanna Musco Twardowski Pinto
,
Isabela Caldas Castañon Guimarães
,
Lauro Melo
,
Ailton Cesar Lemes
* and
Karen Signori Pereira
*
School of Chemistry, Federal University of Rio de Janeiro, Rio de Janeiro 21941-909, RJ, Brazil
*
Authors to whom correspondence should be addressed.
Appl. Sci. 2025, 15(13), 7510; https://doi.org/10.3390/app15137510
Submission received: 11 May 2025 / Revised: 30 June 2025 / Accepted: 1 July 2025 / Published: 4 July 2025
(This article belongs to the Special Issue Advances in Safety Detection and Quality Control of Food)

Abstract

Featured Application

The findings highlight the urgent need for industry and regulatory agencies to implement routine gluten screening in hydrated cassava starch, ensuring safer options for the growing gluten-free market and protecting celiac consumers from hidden health risks.

Abstract

Hydrated cassava starch is widely consumed for its convenience and to appeal to health-conscious individuals, including those with celiac disease, due to its gluten-free nature. However, potential gluten contamination during processing and the lack of specific regulations underscores the need for careful monitoring to ensure safety. Thus, this study aimed to evaluate the presence of gluten in different commercially available hydrated cassava starches and to partially characterize them regarding their physicochemical properties. Thirty-five samples of hydrated cassava starch from local markets in various regions of Brazil were analyzed. The samples underwent partial physicochemical characterization, including pH, moisture content, and particle size distribution. Additionally, gluten presence was assessed using a rapid detection kit. The hydrated cassava starch samples showed a wide pH range (3.4–4.6) and high moisture content (36.0–41.4%), indicating high perishability. Granulometry varied significantly, with samples above 39% moisture forming larger particles which result in irregular texture and inconsistency in tapioca production. Gluten contamination found in 5.71% of the 35 samples presents a risk to gluten-sensitive individuals, underscoring the urgent need for industry and regulatory agencies to implement routine gluten screening.

1. Introduction

The global cassava market was valued at USD 198.90 billion in 2024 and is projected to grow from USD 207.22 billion in 2025 to USD 299.62 billion by 2034 [1]. In Brazil, cassava production was estimated at approximately 19 million tons, cultivated over a total area of 1.24 million hectares [2], generating more than 2 billion BRL (Brazilian reais) during this period [3]. This value highlights the economic importance of cassava, a tuber widely utilized for human consumption in the form of flours, starches, and other derivatives, as well as in animal feed [4]. Additionally, cassava finds applications in industrial sectors, including biofuel production [5], biodegradable packaging [6], and cosmetics manufacturing [7].
Among the derivatives obtained from cassava processing, hydrated cassava starch stands out, accounting for approximately 755,000 tons of the total cassava produced and processed in Brazil [8]. Hydrated cassava starch is produced by hydrating cassava starch, followed by moisture adjustment (30–40%) through drying and/or pressing and subsequent sieving [9]. Although initially a traditional craft product, the production of hydrated cassava starch has become more industrialized in recent years. However, it still lacks standardization, resulting in variations in product characteristics depending on the manufacturer and the processing methods employed [10].
The increase in domestic consumption and the growing interest in international markets have driven the industrialization of hydrated cassava starch [11]. Additionally, its popularity is linked to its appeal as a healthy food, emphasizing natural and functional ingredients, and its suitability for gluten-free diets, as it is naturally gluten-free [12]. However, the lack of specific regulations and standardized processing methods raises the risk of cross-contamination with gluten, particularly in environments where gluten-containing foods are consumed, handled, or processed [13].
Cross-contamination with gluten is a common issue in the alternative starch and flour industry, affecting even naturally gluten-free foods such as hydrated cassava starch [14]. Gluten contamination in hydrated cassava starch production may occur due to shared equipment with gluten-containing products, use of uncertified raw materials, contamination from handlers, airborne particles, inadequate cleaning, contaminated packaging, improper storage, and secondary ingredients containing gluten traces. The ingestion of gluten, even in trace amounts, can trigger severe symptoms in genetically predisposed individuals, including gastrointestinal and neurological issues, as well as more serious complications [14,15,16].
It is estimated that up to 3% of the global population is affected by celiac disease [17]. Gluten ingestion can trigger an immune response that results in inflammation, villous atrophy, and crypt hyperplasia in the small intestine [18,19]. These changes lead to reduced nutrient absorption, weight loss, abdominal pain, diarrhea, and steatorrhea, considered typical symptoms [20,21]. Additionally, atypical symptoms may occur, affecting various body systems, including anemia, osteoporosis, infertility, headaches, and neurological deficits [21,22,23].
Although hydrated cassava starch is naturally gluten-free, it can become contaminated when processed in facilities that do not implement strict precautions or fail to ensure the complete absence of gluten. This is particularly concerning when cross-contact occurs with other products carrying gluten due to the processing methods employed. The risk of cross-contamination increases in environments where production control is not clearly defined or enforced, making rigorous monitoring essential to prevent contact with gluten sources and ensure consumer safety [14,24,25,26].
Therefore, a partial characterization of hydrated cassava starch is essential to understand its behavior under different production conditions and to ensure it is free from allergens such as gluten. Parameters such as pH, moisture content, and particle size were prioritized due to their direct influence on hydration, swelling capacity, texture, and their strong relationship with the technological stability and shelf-life of the product. This process guarantees product quality and enhances safety, enabling the supply of a consistent and reliable product for consumers. Thus, this study aimed to assess the presence of gluten in different commercially available hydrated cassava starch samples and to partially characterize them regarding their physicochemical properties, including pH, moisture content, and particle size distribution.

2. Materials and Methods

2.1. Material

The hydrated cassava starch (HCS) samples were purchased from local markets in different regions of Brazil, obtained from different manufacturers and commercialized in hermetically sealed plastic packages of up to 500 g, stored at room temperature. The HCS packages were transported to the laboratory and subjected to external cleaning and sanitization to prevent contamination during handling. The samples were stored in a fresh, ventilated environment, following the manufacturers’ recommendations, until analysis. The samples were labeled (HCS: hydrated cassava starch) and assigned unique identification codes to ensure the manufacturers’ anonymity.

2.2. Partial Physicochemical Characterization of Hydrated Cassava Starch

2.2.1. pH

The hydrated cassava starch samples were analyzed for pH, moisture content, and particle size distribution using official and specific methods for each parameter [27,28]. The pH was determined by homogenizing 10 g of the sample in 100 mL of distilled water and stirring for 5 min [28]. After homogenization, the pH was measured using a previously calibrated bench pH meter (Tecnal, model TR-107 PT100, Piracicaba, Brazil).

2.2.2. Moisture

The moisture was determined using the AOAC (Association of Official Analytical Chemists) method [28]. For this, 1 g of the sample was placed in a drying oven at 105 °C until a constant weight was reached, with the moisture content being determined.

2.2.3. Granulometry

The particle size distribution was performed according to Sakhare et al. [29] with adaptations and using a set of six sieves and a bottom pan, with the following classifications (Tyler) and respective openings in millimeters: 12 (1.397), 14 (1.168), 20 (0.833), 28 (0.589), 32 (0.495), 35 (0.417), and bottom pan. The sieve set was shaken for 10 min, and the sieve sample amounted to 100 g.

2.3. Detection of Gluten in Solid Samples

The gluten detection was performed using the “3M Rapid Gluten Protein Test Kit”, which has a detection limit of 5 ppm for raw materials and processed foods, according to the manufacturer’s specifications, following the manufacturer’s manual. This kit is recognized as an AOAC® International Performance Tested Method SM #011601. For this, 0.2 g of each sample was added to 1.8 mL of extraction solution, as per the supplier’s guidelines. The tubes were then vortexed to obtain the extracted sample. Subsequently, the tubes were centrifuged for 20 to 30 s at 3000× g. A 100 μL aliquot of the supernatant was transferred to the well of the detection device using a clean pipette and tip. The result was read visually after 10–15 min and compared with the control line for validation. The result was considered positive for gluten protein when both the test and control lines were visible, or negative for gluten protein when only the control line appeared visible.

2.4. Statistical Analysis

All determinations were performed at least in triplicate, and the results were shown as mean with standard deviation. The data were analyzed using analysis of variance (ANOVA), and the average values obtained were compared using Tukey’s test, with statistical significance (α) set at p < 0.05. Principal component analysis (PCA) with Pearson’s correlation matrix and agglomerative hierarchical cluster analysis were performed based on the Euclidean distance using Ward’s method. All analyses were conducted using the XLSTAT software, version 2018.6 (Addinsoft, Paris, France).

3. Results and Discussion

The significant variability in hydrated cassava starch arises from the lack of specific regulations and standardized processes, necessitating partial characterization to understand this variability and identify potential risks. The pH and moisture content were evaluated due to their significant influence on the product’s characteristics, as well as their relationship to safety parameters and shelf life. Table 1 presents the pH and moisture content results of the hydrated cassava starch, highlighting significant variability in these parameters across the analyzed products. The pH values among the 35 commercially available samples ranged from 3.4 to 4.6, indicating noticeable fluctuations in acidity levels. Meanwhile, the moisture content varied from 36.0% to 41.4%, further reflecting the variability in product characteristics. This lack of consistency underscores the absence of standardization for pH and moisture content in commercially available hydrated cassava starch.
Lower pH values are generally associated with reduced microbial proliferation. However, studies indicate that many microorganisms, including pathogenic ones, have been able to grow under these conditions, depending on the type of acid present in the medium [30,31]. Filamentous fungi are generally more resistant to acidic conditions, followed by yeasts, and then by bacteria [32,33]. Although lower pH values can serve as a form of microbial control, they should be complemented by other practices such as good manufacturing practices, proper packaging, and adequate storage and transportation conditions, among others [34,35].
A high moisture content is observed (36.0–40.0%), which is a critical characteristic for product safety and shelf life. This elevated moisture level can promote microbial growth and the occurrence of chemical and enzymatic reactions, potentially compromising not only safety but also the nutritional, sensory, and technological properties of the product. Proper moisture control is essential to ensure product quality and prevent spoilage over time [36].
High moisture content is a critical factor for the survival and proliferation of various microorganisms, which can be pathogenic (harmful to health), spoilage-causing (accelerating the loss of sensory quality through changes in texture, odor, and flavor), or indicators of quality and hygienic-sanitary conditions [37,38]. Pathogenic microorganisms include Escherichia coli, Salmonella spp., Staphylococcus aureus, Bacillus cereus, and Clostridium perfringens. Spoilage microorganisms are primarily fungi (yeasts and filamentous fungi) such as Candida spp., Yarrowia lipolytica, Penicillium spp., and Aspergillus spp., but also bacteria like Bacillus spp. and lactic acid bacteria, such as Lactobacillus spp., Pediococcus spp., and Oenococcus spp., as well as other species from the genera Klebsiella and Enterobacter and the Enterobacteriaceae family. Finally, indicator microorganisms include total coliforms, enterococci, and yeasts, molds, and mesophiles [38,39]. These microorganisms can be potential contaminants in such products due to their properties, lack of standardization, and possible hygiene issues and contamination during the processing.
Considering the pH, moisture conditions, and carbohydrate availability in hydrated cassava starch, food safety, and quality can be better ensured through barrier protection, which combines factors such as temperature, pH, water activity, and the addition of preservatives and specific packaging to inhibit microbial growth and extend shelf life [40,41]. This approach creates multiple barriers to microorganism development, reducing the need for extreme measures that could affect sensory parameters [39,42].
Therefore, to group the samples based on their similarities, a cluster analysis was conducted using pH and moisture values as the key parameters. This segmentation aimed to identify patterns and classify the samples into distinct groups with similar characteristics. The resulting clusters, along with their respective compositions, are presented in Table 2. Additives, specifically acidulants and preservatives, were present in 34% and 54% of the samples, respectively. Citric acid was the most used acidulant, found in 12 samples, while potassium sorbate was the predominant preservative, detected in 20 samples. The presence of acidulants and preservatives did not appear to influence any specific product patterns, as samples containing or lacking these additives were distributed across all groups. Moreover, it is important to highlight that the efficacy of these additives depends on the use of adequate concentrations and optimal processing conditions to ensure their intended functional performance.
Initially, it was observed that hydrated cassava starch produced by the same manufacturer were predominantly grouped together in the same cluster. These were GMH7 and GMH24; GMH9 and GMH12; GMH16 and GMH24; GMH5 and GMH35; GMH13 and GMH34; GMH31 and GMH32; GMH8, GMH21 and GMH22; and GMH20 and GMH23. An exception in this case was observed with the hydrated cassava starch GMH1 and GMH19, which, despite being produced by the same manufacturer, were placed in separate clusters. This highlights a lack of consistency (homogeneity), even in processes that are adopted and standardized by the same manufacturer [43].
Table 3 compares the range and average values of the analyzed variables of the groups formed in the cluster analysis, where it is possible to observe the main characteristics of each group.
It can be observed that the moisture range covered by all groups is similar, varying from 36% to 41%. As for pH, G1 consisted of the most acidic hydrated cassava starch, followed by G4 and G3, which included hydrated cassava starch with intermediate acidity. Finally, G2 consisted of the least acidic hydrated cassava starch. Furthermore, it was also observed that no clear relationship was found between pH values and the presence of acidulants and/or preservatives in the hydrated cassava starch composition. It was expected that hydrated cassava starch with acids in their composition would present lower pH values; however, this phenomenon was not observed (Table 3), which may indicate improper addition in terms of process conditions or insufficient quantities to achieve the desired technological functionality [13].
The groups obtained through segmentation did not show significant differences in moisture content, which ranged from 38.14% to 39.03%. Similar moisture values were found in a study on developing a hydrated cassava starch colored with bioactive compounds from beetroot [44]. Regarding pH, significant differences were observed, with G1 being the group with the lowest pH (3.6), followed by G4 (3.84), G3 (4.13), and G2 (4.45), which had the highest pH. Therefore, the samples in groups G2 and G3 can be classified as acidic (4.0 < pH < 4.5), while those in groups G1 and G4 are classified as very acidic (pH < 4.0) [32].
These pH and moisture values are, respectively, below and above those found for tapioca flours [45,46] and cassava starches [46,47], which generally present pH values > 4.5 and moisture content < 15%. The lower pH values found for hydrated cassava starch can be explained by the lack of standardization and control in the production process [13], by the need for medium acidification to improve the effectiveness of preservatives [48,49,50], or by the acidification of the medium caused by the multiplication of deteriorative microorganisms, such as Lactobacillus species, which are lactic acid producers [13].

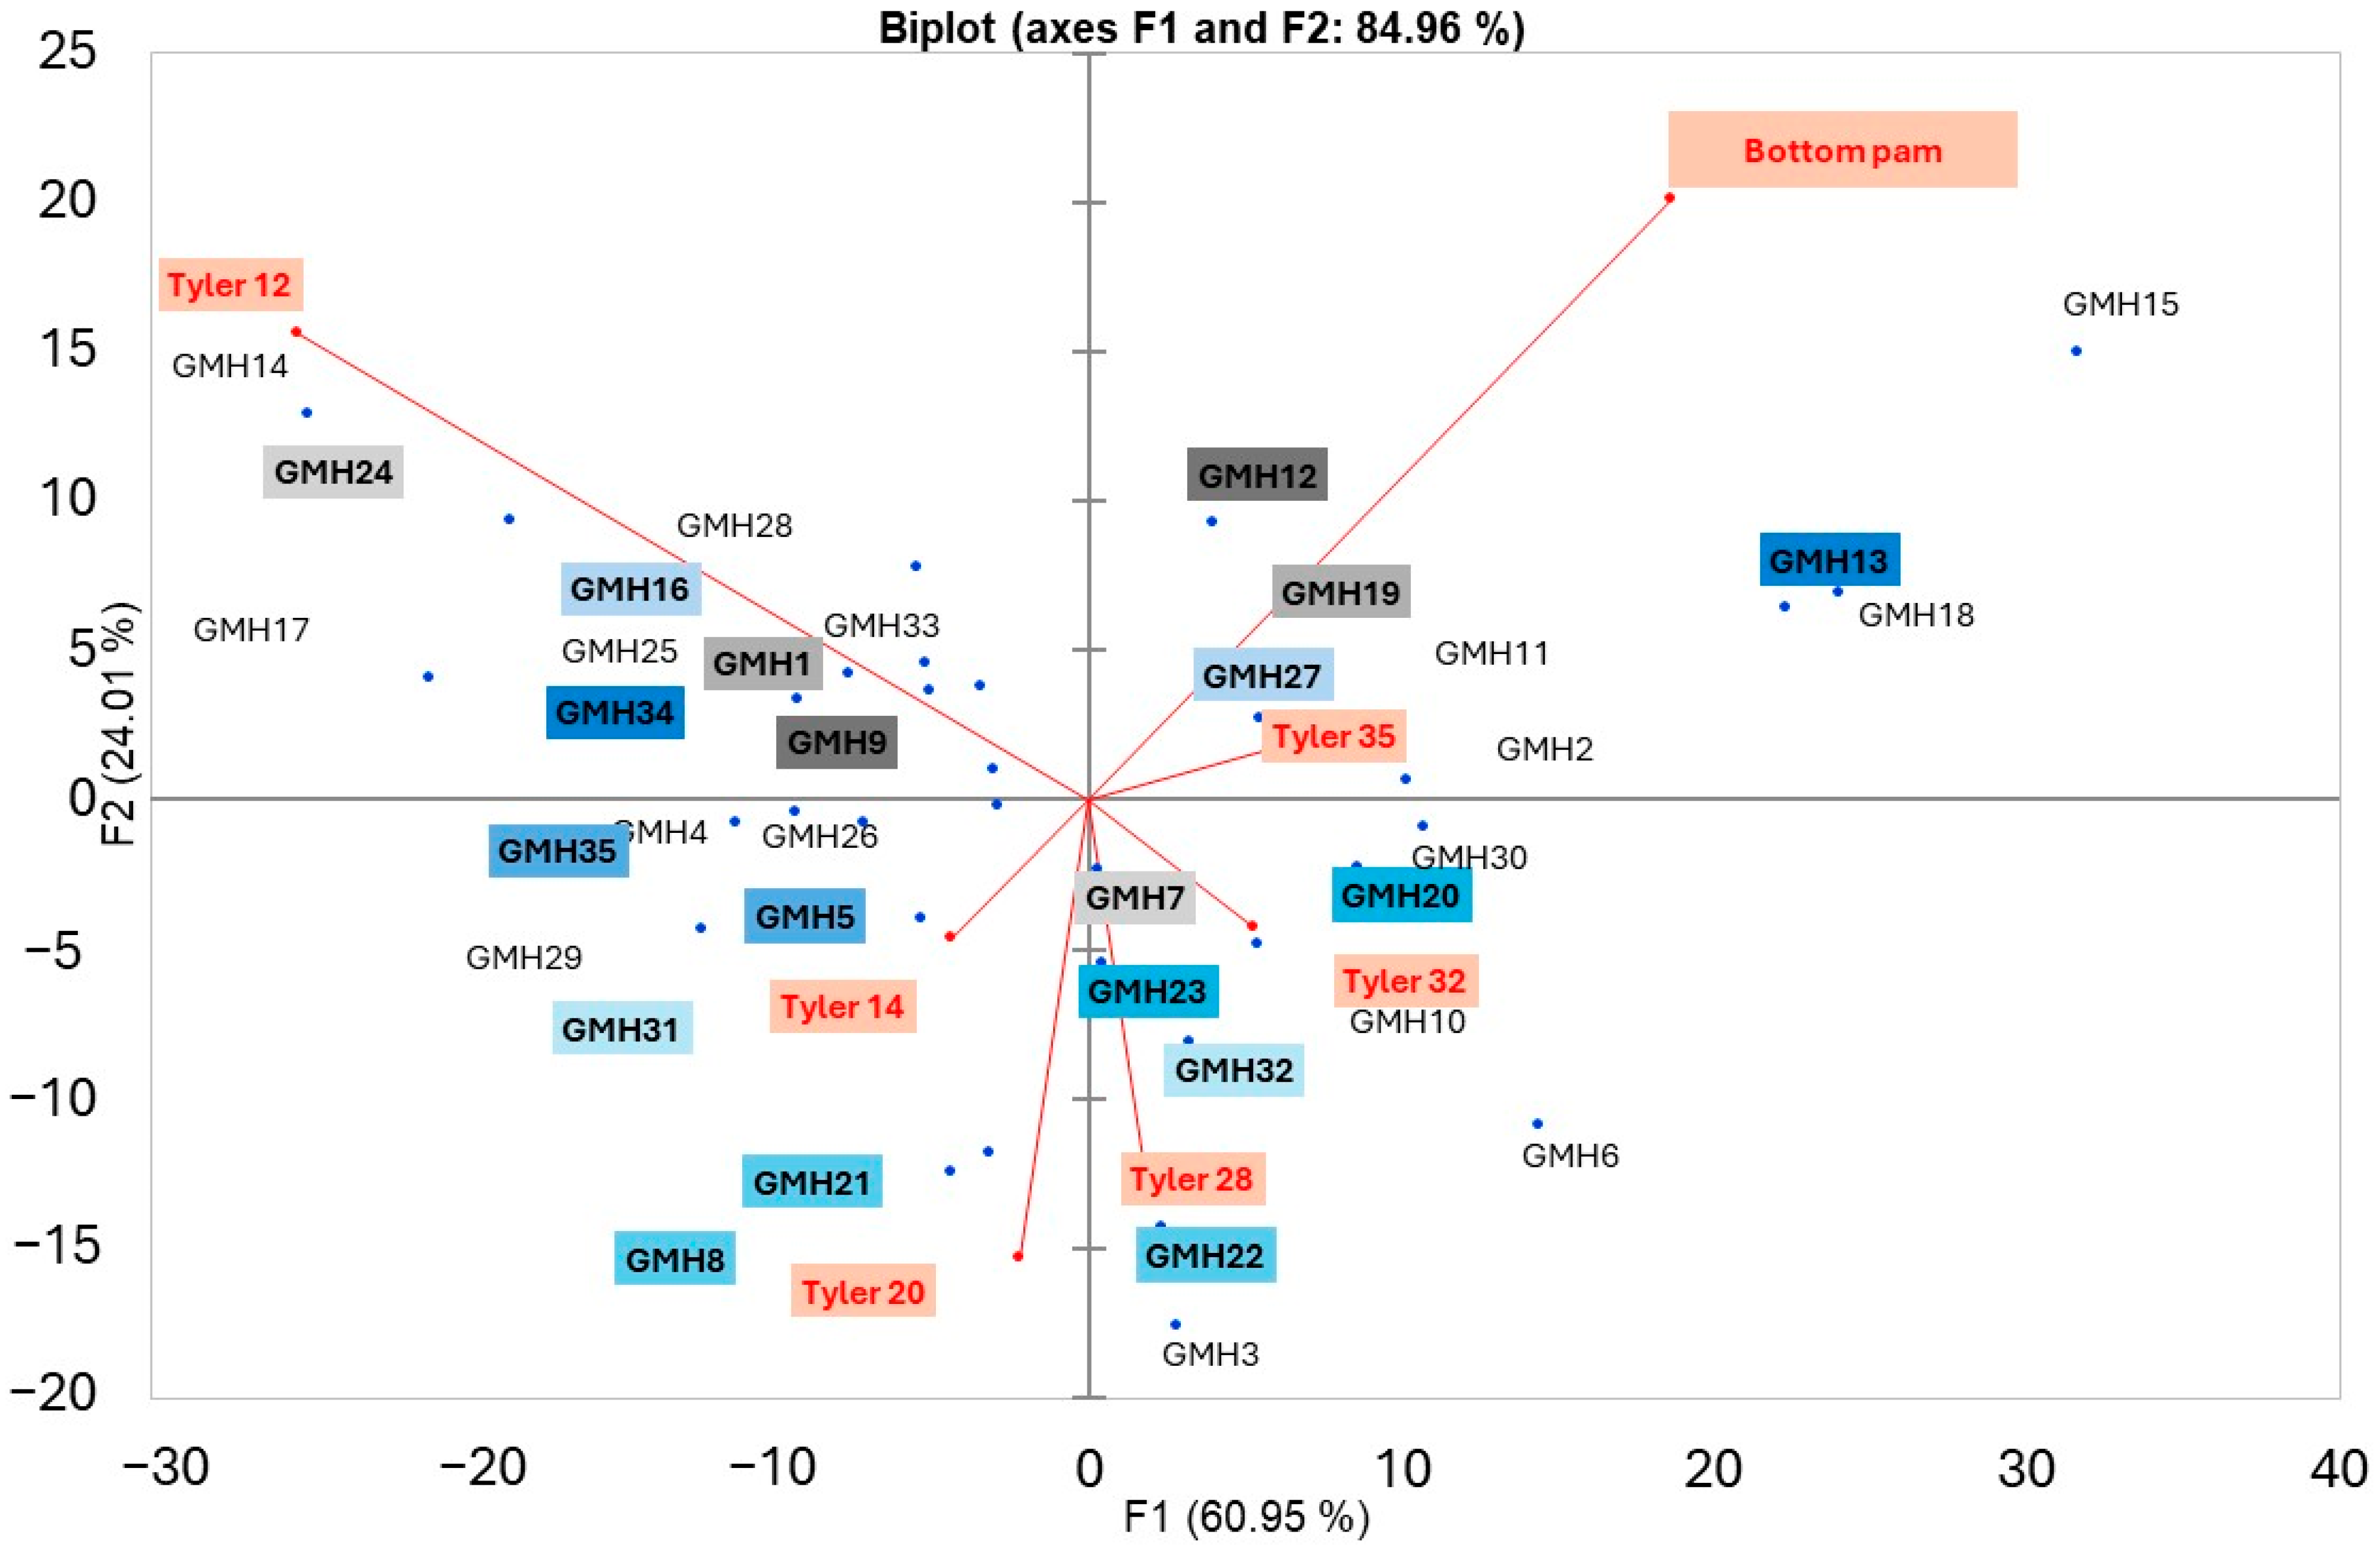
3.1. Particle Size Distribution

Determining the particle size distribution in powder products is essential for various reasons. It affects not only the solubility and texture but also the stability, flowability, and packing properties of the product. A well-defined particle size can optimize product performance, enhance processing efficiency, and ensure consistent quality. Furthermore, it plays a significant role in storage and conservation, as finer particles may have a higher surface area, making them more susceptible to moisture absorption, oxidation, or microbial growth. Therefore, understanding and controlling particle size is crucial for improving the usability, shelf life, and safety of powder-based products [51,52]. Additionally, variation in particle size distribution can result in a heterogeneous mixture of granules, directly affecting the textural properties of the final product. Such variability may lead to irregular textures and inconsistencies during both the production process and consumer experience, compromising product quality and uniformity. The particle size distribution obtained for the 35 samples of hydrated cassava starch is shown in Table 4.
For better visualization, principal component analysis was performed, with sieve openings considered as variables and the hydrated cassava starch samples as observations. As shown in Figure 1, 84.96% of the data variability was explained by the first two components (F1 and F2). Samples closer to a specific sieve opening are primarily characterized by that opening, and vice versa. Furthermore, samples that are closer together indicate a similarity in their distribution. Thus, once again, the lack of standardization is evident, this time regarding the granulometric characterization of the hydrated cassava starch.
Several samples, especially with lower moisture contents, were predominantly characterized by intermediate sieve openings, 0.833 mm (Tyler 20), 0.589 mm (Tyler 28), and 0.495 mm (Tyler 32). Additionally, it is noteworthy that most samples with moisture content higher than 39% were primarily characterized by larger sieve openings, namely 1.397 mm (Tyler 12) and 1.168 mm (Tyler 14). In other words, the higher moisture content in the sample tends to result in a distribution with larger particles [52], as moisture can act as a binder, facilitating the formation of agglomerates, which can have impacts during the processing or storage of the product [53,54].

3.2. Detection of the Presence/Absence of Gluten in Commercial Hydrated Cassava Starch

Following the partial characterization, the samples were analyzed for the presence or absence of gluten using a rapid gluten protein test kit. Gluten was detected in 5.71% of the evaluated samples, as illustrated in Figure 2. Among the samples that tested positive for gluten, there were products that, in addition to cassava starch, contained other plant-based ingredients, such as beetroot. Including non-mandatory ingredients can represent a potential source of contamination, as it introduces additional variables into the process that need to be strictly controlled to prevent gluten cross-contamination. In such cases, it is essential to use certified suppliers and ensure that the production process flow is well-established, with rigorous measures in place to prevent the presence of this allergen in the final products.
Notably, despite the detection of gluten in these samples, all commercially available products were labeled with the claim “gluten-free” on their packaging. This discrepancy raises significant concerns regarding the accuracy of labeling and potential risks to individuals with celiac disease or gluten sensitivity, as even trace amounts of gluten can trigger severe adverse reactions in this population. The allergenic potential of gluten present in food varies from person to person and may trigger different symptoms depending on factors such as age group and pre-existing conditions. Therefore, it is important not only to establish the presence of gluten but also to determine the individual threshold of tolerance through personalized diagnostics. This approach supports a more precise and balanced dietary management, avoiding unnecessary food restrictions [55]. Considering that the test used has a detection limit of 5 ppm, any positive result may be relevant, especially for individuals with celiac disease, whose tolerated daily intake ranges from 10 to 100 mg. For wheat-allergic individuals, particularly children, reactions can be triggered by doses in the low milligram range [55].
Celiac disease affects around 3% of the global population [17] and is triggered by gluten intake, leading to immune-related damage in the small intestine [18,19]. This results in poor nutrient absorption and common symptoms like weight loss, abdominal pain, and diarrhea. It can also cause atypical symptoms such as anemia, osteoporosis, infertility, and neurological issues [20,21,22,23].
Despite being inherently gluten-free, hydrated cassava starch is susceptible to cross-contamination when processed in facilities lacking stringent control measures and dedicated gluten-free protocols. This risk is heightened in environments where processing equipment or production lines are shared with gluten-containing products, potentially leading to unintentional gluten exposure. Inadequate separation and insufficient enforcement of hygiene standards contribute significantly to this hazard. Therefore, comprehensive monitoring and strict adherence to contamination prevention protocols are critical to maintaining the gluten-free integrity of cassava starch and ensuring its safety for individuals with gluten-related disorders [24,26].
Studies from different countries have reported concerning gluten contamination levels in products labeled “gluten-free.” In Mexico, detectable amounts of gluten were found in 20% of evaluated products claiming to be “gluten-free” [56]. Similarly, in India, 10% of “gluten-free” labeled products tested positive for gluten, including naturally gluten-free items like hydrated cassava starch, where approximately 12% showed gluten contamination [57]. In Italy, a study revealed that 16% of naturally gluten-free products were contaminated with gluten [58]. Although the contamination rates reported in these studies exceed those found in the present study, it is worth noting that the sample sizes in those investigations were larger.
Globally, regulatory agencies adopt different thresholds for allowable gluten content in food products. These range from the widely accepted limit of 20 ppm, as established by the FDA in the United States (21 CFR § 101.91—Food Labeling; Gluten-Free Labeling of Foods) and by Regulation (EU) N° 828/2014 in the European Union [59], to more restrictive standards such as the prohibition of any detectable gluten in products labeled “gluten-free” (B.24.018). Although there are no official numerical limits for gluten content in Japanese regulations, wheat must be declared an allergen on product labels. Additionally, organizations such as the Japan Celiac Association recommend a maximum gluten level of 1 ppm for products labeled “zero gluten”. In general, even in the absence of national legislation, many countries adopt the regulatory criteria of their main export markets.
Cross-contamination with gluten is recognized as a global issue [57], and it can occur at various processing stages [60,61]. Therefore, industries must implement stringent preventive measures to ensure food safety for consumers. These measures include establishing dedicated production lines for gluten-free products, thorough cleaning and sanitization protocols for shared equipment, strict raw material sourcing from certified gluten-free suppliers, regular employee training on cross-contamination risks, and routine testing of final products to verify the absence of gluten contamination [24,26].
The presence of gluten in foods labeled as gluten-free poses a significant health risk to consumers with dietary restrictions to this component. For individuals with gluten-related disorders, such as celiac disease, the only effective treatment is strict adherence to a gluten-free diet. The unintentional consumption of gluten not only delays recovery but can also lead to serious adverse health effects. This underscores the critical importance of rigorous quality control and accurate labeling to protect vulnerable populations [25,57].
In addition to what has been previously mentioned, it is the responsibility of the regulatory agencies in each country to establish clear guidelines and ensure that products naturally free of gluten or labeled “gluten-free” truly possess this characteristic, thereby safeguarding consumer trust and food safety.
It is important to highlight that the test used in this study is qualitative, providing only the presence or absence of gluten. While rapid qualitative methods are valuable for initial screening, more precise quantitative analyses are essential to accurately determine gluten levels. Considering that these products are consumed by a specific and sensitive population, it is crucial to employ a combination of detection methods, including both rapid tests and more sensitive quantitative assays, to ensure the reliable identification and measurement of gluten presence. Our research group intends, in future studies, to perform detailed quantitative analyses to better assess the extent of gluten contamination in products marketed as “gluten-free” and thus more accurately define the scope of the issue.

4. Conclusions

A partial characterization of hydrated cassava starch samples was performed, revealing significant variability in terms of pH (3.4–4.6), moisture content (36–41%), and particle size distribution. These parameters collectively compromise the safety, quality, and usability of the product. Additionally, gluten was detected in some tapioca samples, which raises critical concerns since this product is often marketed to individuals with celiac disease, who can experience severe adverse effects from consuming this allergen. These findings highlight the urgent need for stricter quality control and standardization to ensure consumer safety and product reliability.

Author Contributions

Conceptualization, A.C.L. and K.S.P.; methodology, M.M.C.M., L.M., A.C.L. and K.S.P.; software, L.M.; formal analysis, M.M.C.M., G.M.T.P. and I.C.C.G.; investigation, M.M.C.M., G.M.T.P., I.C.C.G., L.M., A.C.L. and K.S.P.; data curation, L.M., A.C.L. and K.S.P.; writing—original draft preparation, M.M.C.M.; writing—review and editing, L.M., A.C.L. and K.S.P.; visualization, L.M., A.C.L. and K.S.P.; supervision, A.C.L. and K.S.P.; project administration, A.C.L. and K.S.P.; funding acquisition, A.C.L. and K.S.P. All authors have read and agreed to the published version of the manuscript.

Funding

This research was funded by CAPES (Fundação Coordenação de Aperfeiçoamento de Pessoal de Nível Superior–Código de Financiamento 001), CNPq (Conselho Nacional de Desenvolvimento Científico e Tecnológico), and FAPERJ (Fundação de Amparo à Pesquisa do Estado do Rio de Janeiro).

Institutional Review Board Statement

Not applicable.

Informed Consent Statement

Not applicable.

Data Availability Statement

Data are contained within the article.

Acknowledgments

We sincerely thank 3M for the generous donation of the kits through the 3M Food Safety project, which was essential for completing this research.

Conflicts of Interest

The authors declare no conflict of interest. The authors declare that this study received support from 3M. The company was not involved in the study design; the collection, analysis, or interpretation of data; the writing of this article; or the decision to submit it for publication.

References

  1. MRF. Cassava Market Research Report Information by Category (Conventional and Organic), by Application (Food & Beverages, Animal Feed, and Others), by Form (Solid and Liquid) and by Region (North America, Europe, Asia-Pacific, And Rest of the World)—Market Forecast Till 2034. Available online: https://www.marketresearchfuture.com/reports/cassava-market-4629?utm_term=&utm_campaign=&utm_source=adwords&utm_medium=ppc&hsa_acc=2893753364&hsa_cam=19912237177&hsa_grp=148712481999&hsa_ad=659589502539&hsa_src=g&hsa_tgt=dsa-2080758264400&hsa_kw=&hsa_mt=&hsa_net=adwords&hsa_ver=3&gad_source=1 (accessed on 2 May 2025).
  2. Conab. Mandioca—Análise Mensal—Fevereiro 2024. Available online: https://www.conab.gov.br/info-agro/analises-do-mercado-agropecuario-e-extrativista/analises-do-mercado/historico-mensal-de-mandioca/item/23156-mandioca-analise-mensal-fevereiro-2024 (accessed on 16 December 2024).
  3. IBGE. Produção de Mandioca. Available online: https://www.ibge.gov.br/explica/producao-agropecuaria/mandioca/br (accessed on 16 December 2024).
  4. Verma, R.; Chauhan, N.; Singh, B.; Chandra, S.; Author, C.; Sengar, R. Cassava processing and its food application: A review. Pharma Innov. J. 2022, 11, 415–422. [Google Scholar]
  5. Krajang, M.; Malairuang, K.; Sukna, J.; Rattanapradit, K.; Chamsart, S. Single-step ethanol production from raw cassava starch using a combination of raw starch hydrolysis and fermentation, scale-up from 5-L laboratory and 200-L pilot plant to 3000-L industrial fermenters. Biotechnol. Biofuels 2021, 14, 68. [Google Scholar] [CrossRef] [PubMed]
  6. Ezeoha, S.L.; Ezenwanne, J.N. Production of Biodegradable Plastic Packaging Film from Cassava Starch. IOSR J. Eng. 2013, 3, 14–20. [Google Scholar] [CrossRef]
  7. Olivato, J.B. Chapter 11—Starch: A natural, safe, and multifunctional ingredient for cosmetic formulations. In Starch Industries: Processes and Innovative Products in Food and Non-Food Uses; Cereda, M.P., Vilpoux, O.F., Eds.; Academic Press: Cambridge, MA, USA, 2024; pp. 255–269. [Google Scholar] [CrossRef]
  8. Sindipan, M.T. Tapioca se Populariza e Ganha Espaço no Mercado Nacional. Available online: https://www.marciorodrigues.com.br/mostraNoticia.php?codnoticia=900 (accessed on 19 December 2024).
  9. Freitas, A.F.; Mattietto, R.A.; Carvalho, A.V. Composição Físico-Química de Farinha de Tapioca Comercializadas em Belém, Pará; Oriental, E.A., Ed.; Embrapa Amazônia Oriental: Belém, Brazil, 2022; p. 19. [Google Scholar]
  10. Vilpoux, O.F.; Cereda, M.P. Chapter 9—Traditional Brazilian foods based on partial gelatinization of cassava starch: Tapioca pearls (“sagu”), Brazilian tapioca (“tapioquinha”), broken tapioca pearls (“tapioca”), and popped tapioca pearls (“farinha de tapioca”). In Starch Industries: Processes and Innovative Products in Food and Non-Food Uses; Cereda, M.P., Vilpoux, O.F., Eds.; Academic Press: Cambridge, MA, USA, 2024; pp. 211–232. [Google Scholar] [CrossRef]
  11. Landim Parente, G.D.; Almeida Macêdo, F.D.; Melo Diniz, N.C.; da Conceição, M.M.; Ubbink, J.; Mattos Braga, A.L. Observations on the formation and textural properties of “tapiocas”, a traditional cassava-based food from the Northeast of Brazil. Int. J. Gastron. Food Sci. 2021, 26, 100417. [Google Scholar] [CrossRef]
  12. Arslain, K.; Gustafson, C.R.; Baishya, P.; Rose, D.J. Determinants of gluten-free diet adoption among individuals without celiac disease or non-celiac gluten sensitivity. Appetite 2021, 156, 104958. [Google Scholar] [CrossRef]
  13. Guilherme, A.B. Avaliação Das Boas Práticas De Fabricação E Análises Microbiológicas Em Uma Indústria De Tapioca. Bachelor’s Thesis, Federal University of Rio de Janeiro, Rio de Janeiro, Brazil, 2021. [Google Scholar]
  14. Wieser, H.; Segura, V.; Ruiz-Carnicer, Á.; Sousa, C.; Comino, I. Food Safety and Cross-Contamination of Gluten-Free Products: A Narrative Review. Nutrients 2021, 13, 2244. [Google Scholar] [CrossRef]
  15. Bianchi, D.M.; Maurella, C.; Gallina, S.; Gorrasi, I.S.R.; Caramelli, M.; Decastelli, L. Analysis of Gluten Content in Gluten-Free Pizza from Certified Take-Away Pizza Restaurants. Foods 2018, 7, 180. [Google Scholar] [CrossRef]
  16. Farage, P.; Zandonadi, R.P.; Gandolfi, L.; Pratesi, R.; Falcomer, A.L.; Araújo, L.S.; Nakano, E.Y.; Ginani, V.C. Accidental Gluten Contamination in Traditional Lunch Meals from Food Services in Brasilia, Brazil. Nutrients 2019, 11, e1924. [Google Scholar] [CrossRef]
  17. Gatti, S.; Rubio-Tapia, A.; Makharia, G.; Catassi, C. Patient and Community Health Global Burden in a World with More Celiac Disease. Gastroenterology 2024, 167, 23–33. [Google Scholar] [CrossRef]
  18. Jedrychowski, J.; Wichers, H.J. Chemical and Biological Properties of Food Allergens, 1st ed.; CRC Press: Boca Raton, FL, USA, 2019. [Google Scholar]
  19. Sabença, C.; Ribeiro, M.; Sousa, T.D.; Poeta, P.; Bagulho, A.S.; Igrejas, G. Wheat/Gluten-Related Disorders and Gluten-Free Diet Misconceptions: A Review. Foods 2021, 10, 1765. [Google Scholar] [CrossRef]
  20. Cui, C.; Basen, T.; Philipp, A.T.; Yusin, J.; Krishnaswamy, G. Celiac disease and nonceliac gluten sensitivity. Ann. Allergy Asthma Immunol. Off. Publ. Am. Coll. Allergy Asthma Immunol. 2017, 118, 389–393. [Google Scholar] [CrossRef] [PubMed]
  21. McAllister, B.P.; Williams, E.; Clarke, K. A Comprehensive Review of Celiac Disease/Gluten-Sensitive Enteropathies. Clin. Rev. Allergy Immunol. 2019, 57, 226–243. [Google Scholar] [CrossRef]
  22. DeGeorge, K.C.; Frye, J.W.; Stein, K.M.; Rollins, L.K.; McCarter, D.F. Celiac Disease and Gluten Sensitivity. Prim. Care Clin. Off. Pract. 2017, 44, 693–707. [Google Scholar] [CrossRef]
  23. Therrien, A.; Kelly, C.P.; Silvester, J.A. Celiac Disease: Extraintestinal Manifestations and Associated Conditions. J. Clin. Gastroenterol. 2020, 54, 8–21. [Google Scholar] [CrossRef]
  24. Damasceno, R.P.B.; Zandonadi, R.P.; Mendes, M.; Cunha Junior, L.C.; Raposo, A.; Teixeira-Lemos, E.; Chaves, C.; Farage, P. Risk of Gluten Cross-Contamination Due to Food Handling Practices: A Mini-Review. Nutrients 2024, 16, e1198. [Google Scholar] [CrossRef]
  25. Raju, N.; Joshi, A.K.R.; Vahini, R.; Deepika, T.; Bhaskarachari, K.; Devindra, S. Gluten contamination in labelled and naturally gluten-free grain products in southern India. Food Addit. contaminants. Part A Chem. Anal. Control Expo. Risk Assess. 2020, 37, 531–538. [Google Scholar] [CrossRef]
  26. Vargas, F.M.D.; Cardoso, L.T.; Didoné, A.; Lima, J.P.M.; Venzke, J.G.; de Oliveira, V.R. Celiac Disease: Risks of Cross-Contamination and Strategies for Gluten Removal in Food Environments. Int. J. Environ. Res. Public Health 2024, 21, 124. [Google Scholar] [CrossRef] [PubMed]
  27. Lutz, I.A. Normas Analíticas do Instituto Adolfo Lutz, 4th ed.; Editora MS: Brasília, Brazil, 2005; p. 1020. [Google Scholar]
  28. AOAC. Official Methods of Analysis of AOAC International; Association of Official Analytical Chemists: Washington, DC, USA, 1995. [Google Scholar]
  29. Sakhare, S.D.; Inamdar, A.A.; Soumya, C.; Indrani, D.; Rao, G.V. Effect of flour particle size on microstructural, rheological and physico-sensory characteristics of bread and south Indian parotta. J. Food Sci. Technol. 2014, 51, 4108–4113. [Google Scholar] [CrossRef] [PubMed]
  30. Felix, H.B.; Angela, M.F. Chapter 11—Acidified Foods: Food Safety Considerations for Food Processors. In Food Industry; Innocenzo, M., Ed.; IntechOpen: Rijeka, Croatia, 2013; pp. 231–239. [Google Scholar] [CrossRef]
  31. Dar, B.N.; Shah, M.A.; Mir, S.A. Shelf Life and Food Safety, 1st ed.; CRC Press: Boca Raton, FL, USA, 2022. [Google Scholar]
  32. Pinto, U.M.; Landgraf, M.; Franco, B.D.G.d.M. Deterioração Microbiana dos Alimentos, 1st ed.; Rubio: Rio de Janeiro, Brazil, 2019; p. 272. [Google Scholar]
  33. Sar, T.; Marchlewicz, A.; Harirchi, S.; Mantzouridou, F.T.; Hosoglu, M.I.; Akbas, M.Y.; Hellwig, C.; Taherzadeh, M.J. Resource recovery and treatment of wastewaters using filamentous fungi. Sci. Total Environ. 2024, 951, 175752. [Google Scholar] [CrossRef]
  34. Gouveia, B.G.; Rijo, P.; Gonçalo, T.S.; Reis, C.P. Good manufacturing practices for medicinal products for human use. J. Pharm. Bioallied Sci. 2015, 7, 87–96. [Google Scholar] [CrossRef]
  35. Rymbai, H.; Meena, A. Futuristic Trends in Agriculture Engineering & Food Sciences; Iterative International Publishers (IIP), Selfypage Developers Pvt Ltd.: Chikmagalur, India, 2024; p. 297. [Google Scholar]
  36. Silva, A.R.A.D.; Santelli, R.E.; Braz, B.F.; Silva, M.M.N.; Melo, L.; Lemes, A.C.; Ribeiro, B.D. A Comparative Study of Dairy and Non-Dairy Milk Types: Development and Characterization of Customized Plant-Based Milk Options. Foods 2024, 13, 2169. [Google Scholar] [CrossRef]
  37. Aladhadh, M. A Review of Modern Methods for the Detection of Foodborne Pathogens. Microorganisms 2023, 11, 1111. [Google Scholar] [CrossRef]
  38. Rawat, S. Food Spoilage: Microorganisms and their prevention. Asian J. Plant Sci. Res. 2015, 5, 47–56. [Google Scholar]
  39. Sahu, M.; Bala, S. Food Processing, Food Spoilage and their Prevention: An Overview. Int. J. Life-Sci. Sci. Res. 2017, 3, 753–759. [Google Scholar] [CrossRef]
  40. Augusto, P.E.D.; Soares, B.M.C.; Castanha, N. Chapter 1—Conventional Technologies of Food Preservation. In Innovative Technologies for Food Preservation; Barba, F.J., Sant’Ana, A.S., Orlien, V., Koubaa, M., Eds.; Academic Press: Cambridge, MA, USA, 2018; pp. 3–23. [Google Scholar] [CrossRef]
  41. Singh, S.; Shalini, R. Effect of Hurdle Technology in Food Preservation: A Review. Crit. Rev. Food Sci. Nutr. 2016, 56, 641–649. [Google Scholar] [CrossRef] [PubMed]
  42. Putnik, P.; Pavlić, B.; Šojić, B.; Zavadlav, S.; Žuntar, I.; Kao, L.; Kitonić, D.; Kovačević, D.B. Innovative Hurdle Technologies for the Preservation of Functional Fruit Juices. Foods 2020, 9, e699. [Google Scholar] [CrossRef]
  43. Tomaz, F.S.C. Profile of customers of a provider of cellular services company: Application of Ward’s clustering method. Multi-Sci. J. 2017, 1, 92–95. [Google Scholar] [CrossRef]
  44. Gomes, E.A. Development of Colored Cassava Gum with Bioactives from Beetroot (Beta vulgaris). Bachelor’s Thesis, Federal University of Paraiba, João Pessoa, Brazil, 2017. [Google Scholar]
  45. Silva, P.A.; Cunha, R.L.; Lopes, A.S.; Pena, R.d.S. Caracterização de farinhas de tapioca produzidas no estado do Pará. Ciência Rural 2013, 43, 185–191. [Google Scholar] [CrossRef]
  46. Silva, P.A.; Oliveira, I.V.D.; Aguiar, R.O.; Cruz, W.P.D.; Martins, L.H.D.S.; Carvalho, F.I.M.; Lopes, A.S.; Pena, R.D.S. Development and characterization of tapioca flour obtained from cassava starches cultivated in the Northeast of Pará. Braz. J. Dev. 2020, 6, 42264–42281. [Google Scholar] [CrossRef]
  47. Mendes, M.L.B.; Torres, C.T.S.; Souza, I.T.; Souza, N.B.D.; Batista, N.B.; Wetmann, S.M.; Pires, C.R.F.; Zuniga, A.D.G.; Silva, C.A.S. Propriedades físico-químicas e tecnológicas de féculas de mandioca (Esculenta crantz) comercializada na região metropolitana de Palmas—TO. Tecnol. De Aliment. Tópicos Físicos Químicos E Biológicos 2020, 2, 531–544. [Google Scholar]
  48. Hernández-Cánovas, J.D.; Guillén-López, I.; Vizcaíno-Milla, P.; Andreo-López, M.I.; Sánchez-Rubio, M.; Taboada-Rodríguez, A.; Marín-Iniesta, F. Antimicrobial activity of Citrus spp. and Anethum graveolens components against Candida metapsilosis in ranch sauce. J. Food Sci. Technol. 2020, 57, 2713–2721. [Google Scholar] [CrossRef] [PubMed]
  49. Mohammadzadeh-Aghdash, H.; Akbari, N.; Esazadeh, K.; Ezzati Nazhad Dolatabadi, J. Molecular and technical aspects on the interaction of serum albumin with multifunctional food preservatives. Food Chem. 2019, 293, 491–498. [Google Scholar] [CrossRef]
  50. Musyoka, J.N.; Abong′, G.O.; Mbogo, D.M.; Fuchs, R.; Low, J.; Heck, S.; Muzhingi, T. Effects of Acidification and Preservatives on Microbial Growth during Storage of Orange Fleshed Sweet Potato Puree. Int. J. Food Sci. 2018, 2018, 8410747. [Google Scholar] [CrossRef] [PubMed]
  51. McGuire, C.; Siliveru, K.; Chakraborty, S.; Ambrose, K.; Alavi, S. Flow Properties of Coarse Powders Used in Food Extrusion as a Function of Moisture Content. Processes 2024, 12, 1246. [Google Scholar] [CrossRef]
  52. Voelker, A.L.; Sommer, A.A.; Mauer, L.J. Moisture sorption behaviors, water activity-temperature relationships, and physical stability traits of spices, herbs, and seasoning blends containing crystalline and amorphous ingredients. Food Res. Int. 2020, 136, 109608. [Google Scholar] [CrossRef]
  53. Dawoodbhai, S.; Rhodes, C. The Effect of Moisture on Powder Flow and on Compaction and Physical Stability of Tablets. Drug Dev. Ind. Pharm. 2008, 15, 1577–1600. [Google Scholar] [CrossRef]
  54. Fitzpatrick, J.J. Characterization of the Caking Behaviour of Food Powders. In Food Powders Properties and Characterization; Ermiş, E., Ed.; Springer International Publishing: Cham, Switzerland, 2021; pp. 73–89. [Google Scholar] [CrossRef]
  55. Hischenhuber, C.; Crevel, R.; Jarry, B.; Mäki, M.; Moneret-Vautrin, D.A.; Romano, A.; Troncone, R.; Ward, R. Review article: Safe amounts of gluten for patients with wheat allergy or coeliac disease. Aliment. Pharmacol. Ther. 2006, 23, 559–575. [Google Scholar] [CrossRef]
  56. Calderón de la Barca, A.M.; Luna-Alcocer, V.; Valenzuela-Miranda, J.R.; Mejía-León, M.E. Gluten-Free Labeling Is Misused Frequently in Foods Marketed in Northwestern Mexico. Front. Nutr. 2021, 8, 687843. [Google Scholar] [CrossRef]
  57. Mehtab, W.; Sachdev, V.; Singh, A.; Agarwal, S.; Singh, N.; Malik, R.; Malhotra, A.; Ahuja, V.; Makharia, G. Gluten content in labeled and unlabeled gluten-free food products used by patients with celiac disease. Eur. J. Clin. Nutr. 2021, 75, 1245–1253. [Google Scholar] [CrossRef]
  58. Verma, A.K.; Gatti, S.; Galeazzi, T.; Monachesi, C.; Padella, L.; Baldo, G.D.; Annibali, R.; Lionetti, E.; Catassi, C. Gluten Contamination in Naturally or Labeled Gluten-Free Products Marketed in Italy. Nutrients 2017, 9, e115. [Google Scholar] [CrossRef]
  59. Guennouni, M.; Admou, B.; El khoudri, N.; Bourrhouat, A.; Zogaam, L.G.; Elmoumou, L.; Hilali, A. Gluten contamination in labelled gluten-free, naturally gluten-free and meals in food services in low-, middle- and high-income countries: A systematic review and meta-analysis. Br. J. Nutr. 2021, 127, 1528–1542. [Google Scholar] [CrossRef] [PubMed]
  60. Chen, Y.; Fritz, R.D.; Kock, L.; Garg, D.; Davis, R.M.; Kasturi, P. A stepwise, ‘test-all-positives’ methodology to assess gluten-kernel contamination at the serving-size level in gluten-free (GF) oat production. Food Chem. 2018, 240, 391–395. [Google Scholar] [CrossRef] [PubMed]
  61. Khairuddin, M.A.N.; Lasekan, O. Gluten-Free Cereal Products and Beverages: A Review of Their Health Benefits in the Last Five Years. Foods 2021, 10, 2523. [Google Scholar] [CrossRef] [PubMed]
Figure 1. Principal components analysis (PCA) for particle size distribution. Active variables () and observations (). Samples highlighted with the same color indicate hydrated cassava starch produced by the same manufacturer.
Applsci 15 07510 g001
Figure 2. Presence of gluten in commercial hydrated cassava starch samples. Gluten-free () and with gluten (●).
Applsci 15 07510 g002
Table 1. pH and moisture content were measured for the 35 hydrated cassava starch samples obtained from local markets in various regions of Brazil. The values are expressed as mean ± standard deviation. Means with different superscript letters in the same column are statistically different according to Tukey’s test (p < 0.05).
SamplesRegionpHMoisture (%)
GMH1South3.61 ± 0.16 h,i,j36.04 ± 2.53 g,h
GMH2Southeast4.36 ± 0.23 a,b,c,d38.42 ± 0.58 b,c,d,e,f,g,h
GMH3Southeast4.13 ± 0.06 c,d,e,f,g36.09 ± 0.48 g,h
GMH4Northeast3.83 ± 0.12 f,g,h,i,j39.72 ± 0.59 a,b,c,d
GMH5Southeast4.60 ± 0.26 a,b37.13 ± 1.45 d,e,f,g,h
GMH6South3.87 ± 0.15 f,g,h,i,j40.54 ± 0.35 a,b
GMH7Northeast3.70 ± 0.10 h,i,j39.08 ± 0.74 a,b,c,d,e,f
GMH8Southeast3.77 ± 0.06 g,h,i,j36.80 ± 0.23 f,g,h
GMH9Southeast3.67 ± 0.12 h,i,j38.07 ± 0.81 b,c,d,f,g,h
GMH10Southeast4.50 ± 0.17 a,b,c39.57 ± 0.63 a,b,c,d,e
GMH11Southeast3.83 ± 0.06 f,g,h,i,j37.28 ± 1.98 d,e,f,g,h
GMH12Southeast3.67 ± 0.23 h,i,j37.08 ± 0.45 d,e,f,g,h
GMH13Southeast4.40 ± 0.01 a,b,c,d38.51 ± 0.68 b,c,d,e,f,g,h
GMH14Northeast3.50 ± 0.01 i,j38.69 ± 1.06 b,c,d,e,f,g,h
GMH15Southeast4.43 ± 0.15 a,b,c38.65 ± 0.18 b,c,d,e,f,g,h
GMH16Central–West3.67 ± 0.23 h,i,j39.03 ± 1.24 a,b,c,d,e,f
GMH17Southeast4.17 ± 0.06 c,d,e,f,g36.00 ± 0.61 h
GMH18South3.63 ± 0.12 h,i,j40.55 ± 1.25 a,b
GMH19South3.83 ± 0.15 f,g,h,i,j38.68 ± 0.48 b,c,d,e,f,g,h
GMH20Southeast3.90 ± 0.10 e,f,g,h,i,j38.54 ± 0.47 b,c,d,e,f,g,h
GMH21Southeast3.87 ± 0.15 f,g,h,i,j37.15 ± 0.35 d,e,f,g,h
GMH22Southeast3.77 ± 0.06 g,h,i,j36.81 ± 0.29 e,f,g,h
GMH23Southeast3.90 ± 0.01 e,f,g,h,i39.45 ± 0.29 a,b,c,d,e,f
GMH24Northeast3.50 ± 0.10 i,j39.24 ± 0.22 a,b,c,d,e,f
GMH25Northeast3.63 ± 0.06 h,i,j39.56 ± 0.75 a,b,c,d,e
GMH26Northeast4.20 ± 0.10 b,c,d,e,f39.50 ± 0.53 a,b,c,d,e,f
GMH27Central–West3.60 ± 0.17 h,i,j41.47 ± 0.70 a
GMH28Southeast4.50 ± 0.01 a,b,c40.28 ± 0.49 a,b,c
GMH29Southeast3.47 ± 0.12 j40.56 ± 0.29 a,b
GMH30South4.17 ± 0.12 c,d,e,f,g40.31 ± 0.85 a,b,c
GMH31South4.63 ± 0.06 a39.30 ± 0.48 a,b,c
GMH32South4.40 ± 0.10 a,b,c,d37.66 ± 0.81 c,d,e,f,g,h
GMH33South4.00 ± 0.20 d,e,f,g,h38.78 ± 0.03 a,b,c,d,e,f,g
GMH34Southeast4.40 ± 0.10 a,b,c,d36.88 ± 0.71 e,f,g,h
GMH35Southeast4.30 ± 0.10 a,b,c,d,e37.58 ± 0.35 c,d,e,f,g,h
Table 2. Groups of hydrated cassava starch, obtained by segmentation analysis. Identical lowercase letters indicate hydrated cassava starches produced by the same manufacturer. A—acidulant in the composition; P—preservative in the composition.
Group 1 (G1)Group 2 (G2)Group 3 (G3)Group 4 (G4)
GMH1 a,A,PGMH2 PGMH3 A,PGMH4
GMH7 bGMH5 e,PGMH17 A,PGMH6 A,P
GMH9 c,A,PGMH10 PGMH26GMH8 h
GMH12 c,A,PGMH13 f,A,PGMH30 PGMH11
GMH14 PGMH15 A,PGMH33 PGMH19 a,A,P
GMH16 dGMH28 A,P GMH20 i
GMH18 AGMH31 g,P GMH21 h
GMH24 bGMH32 g,P GMH22 h
GMH25GMH34 f,A,P GMH23 i
GMH27 dGMH35 e,P
GMH29
Table 3. pH and moisture (%) range and average values for each group of hydrated cassava starch. * Values are expressed as mean ± standard deviation. Means with different superscript letters in the same column are statistically different according to Tukey’s test (p < 0.05).
ParameterG1G2G3G4
pH3.47–3.704.30–4.634.00–4.203.77–3.91
pH average *3.60 ± 0.05 d4.45 ± 0.08 a4.13 ± 0.09 b3.84 ± 0.07 c
Moisture (%)36.04–41.4736.88–40.2836.00–40.3136.8–40.54
Moisture (%) average *39.03 ± 1.50 a38.4 ± 1.05 a38.14 ± 1.77 a38.33 ± 1.31 a
Table 4. Particle size distribution (%) of 35 commercial samples of hydrated cassava starch. Values are expressed as mean ± standard deviation. Means with different superscript letters in the same column are statistically different according to Tukey’s test (p < 0.05).
SamplesTyler
121420283235Bottom
GMH130.44 ± 0.6 d,e,f,g10.84 ± 0.3 d,e,f,g16.62 ± 0.2 e,f,g,h13.76 ± 1.7 b,c,d,e10.49 ± 3.0 c,d,e,f,g,h8.17 ± 0.5 a,b,c,d,e,f9.10 ± 4.2 c,d,e,f,g,h,i,j,k
GMH217.10 ± 2.3 k,l,m,n,o,p9.87 ± 0.5 e,f,g,h,i,j15.31 ± 0.2 f,g,h15.11 ± 1.3 b,c,d,e14.44 ± 1.3 b,c,d,e,f,g13.42 ± 0.7 a14.55 ± 4.7 c,d,e,f,g
GMH315.02 ± 8.4 m,n,o,p10.87 ± 3.2 d,e,f,g24.58 ± 5.2 b,c28.71 ± 8.7 a11.45 ± 8.7 c,d,e,f,g,h5.91 ± 6.9 b,c,d,e,f2.14 ± 1.8 j,k
GMH431.85 ± 9.6 d,e,f11.45 ± 0.9 d,e,f18.14 ± 2.6 d,e,f18.47 ± 9.2 b,d,c,e7.07 ± 4.1 e,f,g,h6.28 ± 3.1 a,b,c,d,e,f5.00 ± 2.5 f,g,h,i,j,k
GMH527.88 ± 0.9 d,e,f,g,h,i9.63 ± 0.5 e,f,g,h,i,j16.52 ± 0.6 e,f,h,g23.52 ± 4.0 a,b11.56 ± 1.4 c,d,e,f,g,h4.29 ± 1.0 b,d,c,e,f4.90 ± 0.5 g,h,i,j,k
GMH69.41 ± 2.0 op6.80 ± 1.4 i,j,k16.36 ± 1.2 e,f,g,h22.36 ± 5.6 a,b,c23.60 ± 4.6 a11.21 ± 4.7 a,b8.35 ± 5.1 d,e,f,g,h,i,j,k
GMH723.46 ± 1.36 d,e,f,g,h,i,j,k,l,m9.50 ± 0.6 e,f,g,h,i,j16.10 ± 0.1 e,f,g,h15.55 ± 0.5 b,d,c,e16.38 ± 1.5 a,b,c10.56 ± 0.4 a,b6.17 ± 1.0 e,f,g,h,i,j,k
GMH821.13 ± 3.0 g,h,i,j,k,l,m16.06 ± 0.6 a,b31.45 ± 0.5 a16.29 ± 1.5 b,d,c,e6.12 ± 1.1 g,h2.93 ± 0.7 c,d,e,f3.53 ± 0.3 i,j,k
GMH927.44 ± 0.2 d,e,f,g,h,i,j9.43 ± 0.1 e,f,g,h,i,j16.83 ± 0.6 d,e,f,g13.23 ± 0.7 c,d,e13.49 ± 3.2 b,d,c,e,f,g9.42 ± 1.1 a,b,d,c,e7.13 ± 5.0 d,e,f,g,h,i,j,k
GMH1017.94 ± 3.8 j,k,l,m,n,o10.88 ± 1.5 d,e,f,g18.06 ± 1.5 d,e,f,g15.80 ± 1.3 b,d,c,e15.91 ± 2.7 a,b,c,d11.05 ± 0.8 a,b8.18 ± 1.9 d,e,f,g,h,i,j,k
GMH1119.84 ± 4.0 h,i,j,k,l,m,n10.17 ± 0.6 e,f,g,h,i17.20 ± 1.6 d,e,f,g14.63 ± 0.5 b,d,c,e11.19 ± 0.7 c,d,e,f,g,h9.63 ± 0.8 a,b,c,d15.17 ± 1.4 c,d,e,f
GMH1225.90 ± 0.7 d,e,f,g,h,i,j,k,l8.75 ± 0.1 f,g,h,i,j15.12 ± 0.3 f,g,h12.21 ± 0.0 d,e9.22 ± 0.3 c,d,e,f,g,h7.79 ± 0.3 a,b,c,d,e,f18.94 ± 0.5 b,c
GMH1310.39 ± 2.8 n,o,p7.34 ± 1.2 h,i,j,k16.60 ± 0.7 e,f,g,h14.31 ± 0.9 b,d,c,e11.16 ± 0.8 c,d,e,f,g,h9.48 ± 0.4 a,b,c,d28.70 ± 3.2 b
GMH1450.48 ± 2.4 a10.32 ± 0.4 d,e,f,g,h13.28 ± 0.5 g,h10.99 ± 1.2 e6.84 ± 1.2 f,g,h2.24 ± 0.4 e,f4.03 ± 1.5 h,i,j,k
GMH157.50 ± 1.3 p4.62 ± 1.2 k11.91 ± 1.8 h13.47 ± 0.4 c,d,e10.35 ± 0.2 f,g,h10.97 ± 1.5 a,b39.92 ± 5.0 a
GMH1632.29 ± 1.2 c,d,e12.02 ± 0.5 c,d,e,f18.29 ± 0.6 d,e,f12.44 ± 0.4 d,e8.29 ± 2.0 f,g,h6.17 ± 0.4 b,d,c,e,f9.03 ± 0.7 c,d,e,f,g,h,i,j,k
GMH1742.33 ± 2.4 a,b,c15.50 ± 1.1 a,b17.52 ± 0.4 d,e,f,g12.61 ± 2.2 c,d,e7.03 ± 1.9 f,g,h2.00 ± 0.8 f1.39 ± 0.6 k
GMH189.46 ± 1.4 o,p6.74 ± 1.0 j,k14.48 ± 0.4 f,g,h14.84 ± 0.3 b,d,c,e12.84 ± 0.3 b,d,c,e,f,g11.16 ± 0.6 a,b29.06 ± 2.5 b
GMH1921.68 ± 0.7 f,g,h,i,j,k,l,m9.32 ± 0.9 e,f,g,h,i,j16.50 ± 0.9 e,f,g,h13.47 ± 0.5 c,d,e11.26 ± 1.0 c,d,e,f,g,h8.95 ± 1.1 a,b,c,d,e,f16.88 ± 3.9 c,d
GMH2017.09 ± 4.7 l,m,n,o,p9.74 ± 0.3 e,f,g,h,i,j17.12 ± 0.7 d,e,f,g16.50 ± 0.8 b,d,c,e15.35 ± 1.8 a,b,c,d,e,f10.79 ± 1.8 a,b12.43 ± 6.6 c,d,e,f,g,h,i
GMH2120.71 ± 1.2 g,h,i,j,k,l,m15.30 ± 0.5 a,b,c30.49 ± 0.5 a16.35 ± 0.3 b,d,c,e6.90 ± 0.8 f,g,h4.39 ± 0.7 b,d,c,e,f4.05 ± 0.5 h,i,j,k
GMH2216.23 ± 1.4 l,m,n,o,p12.03 ± 1.2 c,d,e,f29.16 ± 2.2 a,b20.98 ± 0.4 a,b,c,d9.74 ± 1.2 c,d,e,f,g,h5.26 ± 1.8 b,d,c,e,f5.20 ± 0.9 f,g,h,i,j,k
GMH2322.49 ± 1.4 e,f,g,h,i,j,k,l,m8.82 ± 0.4 f,g,h,i,j6.37 ± 0.8 e,f,g,h17.98 ± 4.7 b,d,c,e21.14 ± 1.8 a,b6.89 ± 4.2 a,b,c,d,e,f4.66 ± 2.3 g,h,i,j,k
GMH2443.84 ± 1.7 a,b10.21 ± 0.7 e,f,g,h,i15.40 ± 0.5 f,g,h11.98 ± 1.4 d,e7.60 ± 0.5 d,e,f,g,h4.86 ± 1.3 b,d,c,e,f5.49 ± 2.3 f,g,h,i,j,k
GMH2533.70 ± 4.0 b,c,d9.57 ± 0.3 e,f,g,h,i,j14.82 ± 1.1 f,g,h14.11 ± 3.4 b,d,c,e13.56 ± 3.0 b,d,c,e,f,g5.73 ± 2.0 b,d,c,e,f5.55 ± 1.9 f,g,h,i,j,k
GMH2627.37 ± 1.0 d,e,f,g,h,i,j,k9.31 ± 0.9 e,f,g,h,i,j16.03 ± 0.5 e,f,g,h16.34 ± 3.8 b,d,c,e15.64 ± 4.28 a,b,d,c,e6.68 ± 3.1 a,b,c,d,e,f7.16 ± 5.4 d,e,f,g,h,i,j,k
GMH2721.82 ± 0.8 f,g,h,i,j,k,l,m8.94 ± 0.2 f,g,h,i,j15.77 ± 0.4 e,f,g,h14.46 ± 0.6 b,d,c,e13.41 ± 0.6 b,d,c,e,f,g9.94 ± 0.7 a,b,c14.04 ± 0.2 c,d,e,f,g,h
GMH2832.68 ± 3.9 c,d,e9.69 ± 0.4 e,f,g,h,i,j15.95 ± 0.5 e,f,g,h12.44 ± 0.6 d,e8.89 ± 0.6 c,d,e,f,g,h6.64 ± 0.4 a,b,c,d,e,f12.25 ± 2.9 c,d,e,f,g,h,i,j
GMH2930.77 ± 0.9 d,e,f,g17.08 ± 0.6 a24.81 ± 3.0 b,c14.21 ± 1.7 b,d,c,e4.18 ± 2.5 h2.50 ± 1.7 d,e,f2.88 ± 3.0 i,j,k
GMH3014.48 ± 0.5 m,n,o,p12.69 ± 0.8 b,d,c,e18.54 ± 2.2 d,e,f14.35 ± 1.6 b,d,c,e10.37 ± 0.9 c,d,e,f,g,h7.62 ± 1.1 a,b,c,d,e,f16.24 ± 2.2 c,d,e
GMH3129.97 ± 2.3 d,e,f,g,h10.90 ± 0.5 d,e,f,g20.41 ± 0.5 c,d,e16.43 ± 0.5 b,d,c,e8.54 ± 2.1 c,d,e,f,g,h5.00 ± 0.8 b,d,c,ef6.63 ± 3.7 e,f,g,h,i,j,k
GMH3218.68 ± 3.9 i,j,k,l,m,n,o7.74 ± 2.0 g,h,i,j,k18.57 ± 0.7 d,e,f20.91 ± 4.1 a,b,c,d15.40 ± 4.5 a,b,c,d,e,f8.07 ± 5.1 a,b,c,d,e,f5.27 ± 1.7 f,g,h,i,j,k
GMH3328.84 ± 1.5 d,e,f,g,h,i8.77 ± 1.1 f,g,h,i,j15.68 ± 1.3 e,f,g,h13.68 ± 0.5 b,d,c,e10.58 ± 2.0 c,d,e,f,g,h7.97 ± 0.8 a,b,c,d,e,f9.30 ± 4.2 c,d,e,f,g,h,i,j,k
GMH3430.92 ± 2.6 d,e,f,g9.05 ± 1.5 f,g,h,i,j14.91 ± 0.7 f,h,g15.33 ± 3.2 b,d,c,e9.55 ± 0.3 c,d,e,f,g,h7.38 ± 1.8 a,b,c,d,e,f9.33 ± 4.1 c,d,e,f,g,h,i,j,k
GMH3532.58 ± 2.7 c,d,e13.64 ± 0.6 b,c,d21.46 ± 0.4 c,d14.41 ± 2.6 b,d,c,e7.66 ± 2.2 d,e,f,g,h3.09 ± 0.5 c,d,e,f4.80 ± 1.8 g,h,i,j,k
Disclaimer/Publisher’s Note: The statements, opinions and data contained in all publications are solely those of the individual author(s) and contributor(s) and not of MDPI and/or the editor(s). MDPI and/or the editor(s) disclaim responsibility for any injury to people or property resulting from any ideas, methods, instructions or products referred to in the content.

