

The Characterization of Peach Pomace and the Influence of Its Incorporation on the Chemical Composition of Biscuits


Abstract
1. Introduction
2. Materials and Methods
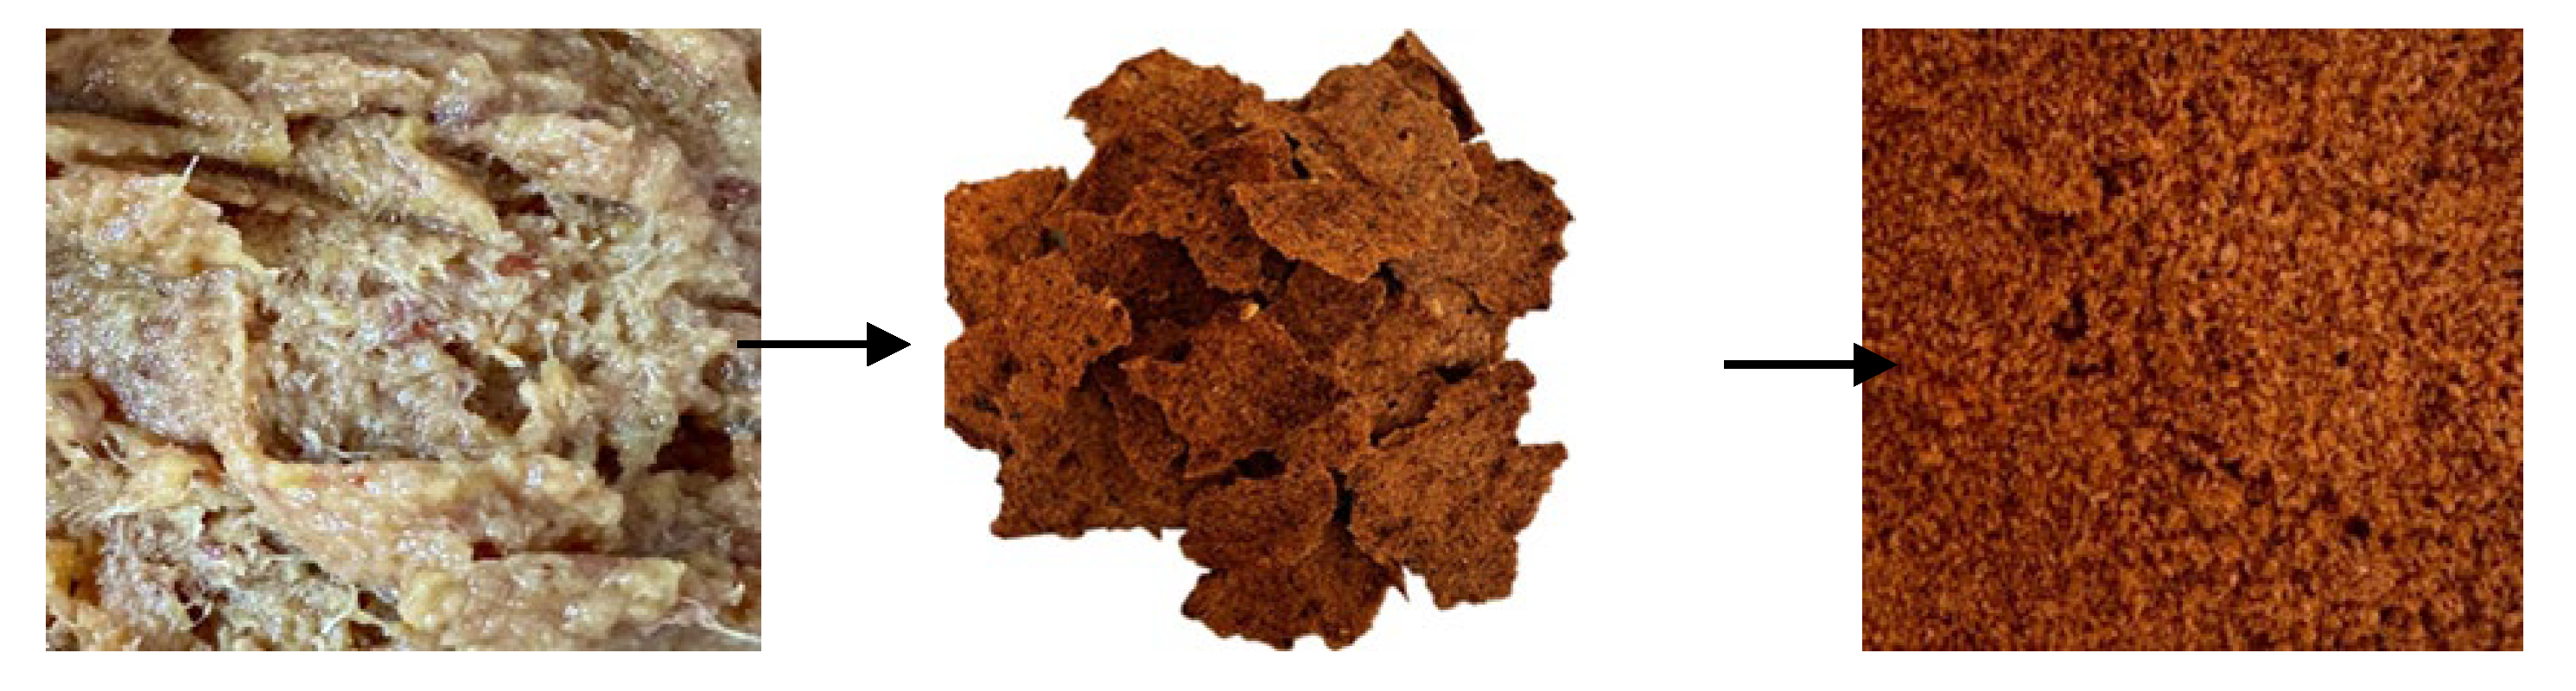
2.1. Vegetal Material
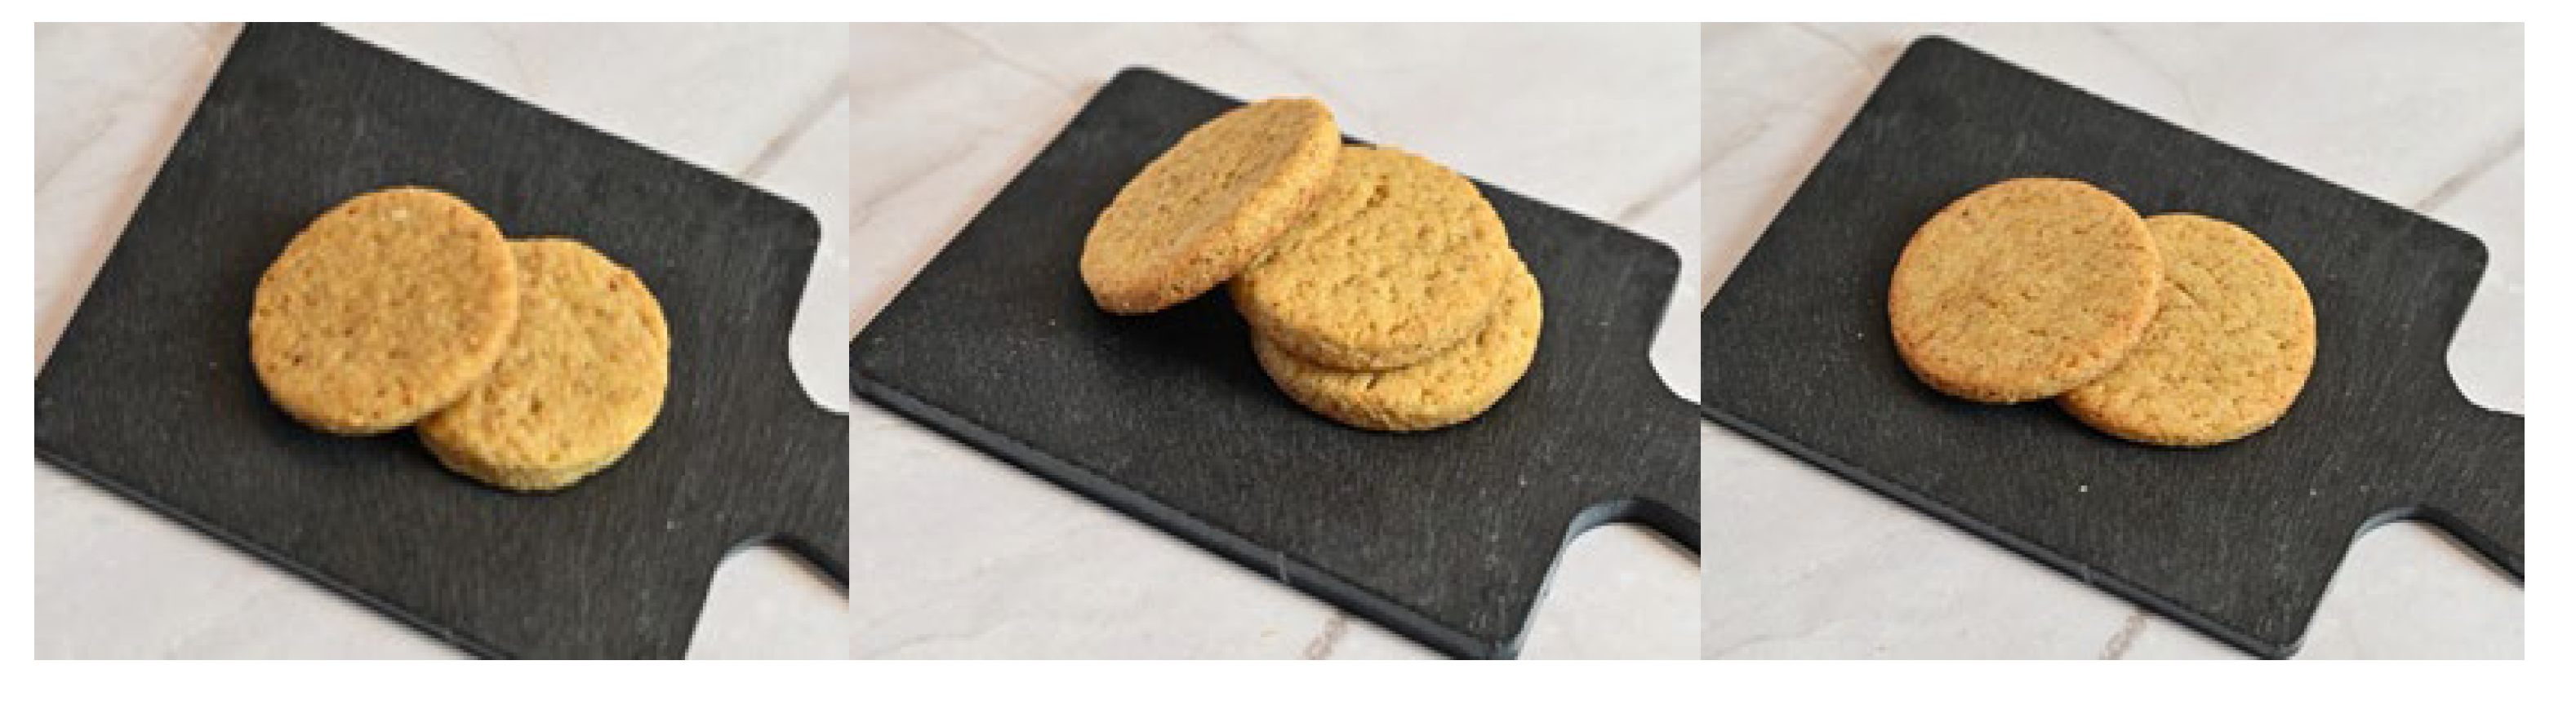
2.2. The Technological Method Applied to Obtain Biscuits
2.3. The Procedure for the Extraction of Polyphenols, Flavonoids, Anthocyanins, and Sugars
2.4. Determination of Total Polyphenol Content
2.5. Determination of Total Flavonoids Content
2.6. Determination of Total Anthocyanin Content
2.7. Determination of Total Sugar Content
2.8. Determination of Components with Anti-Radical Potential
2.9. HPLC Analysis
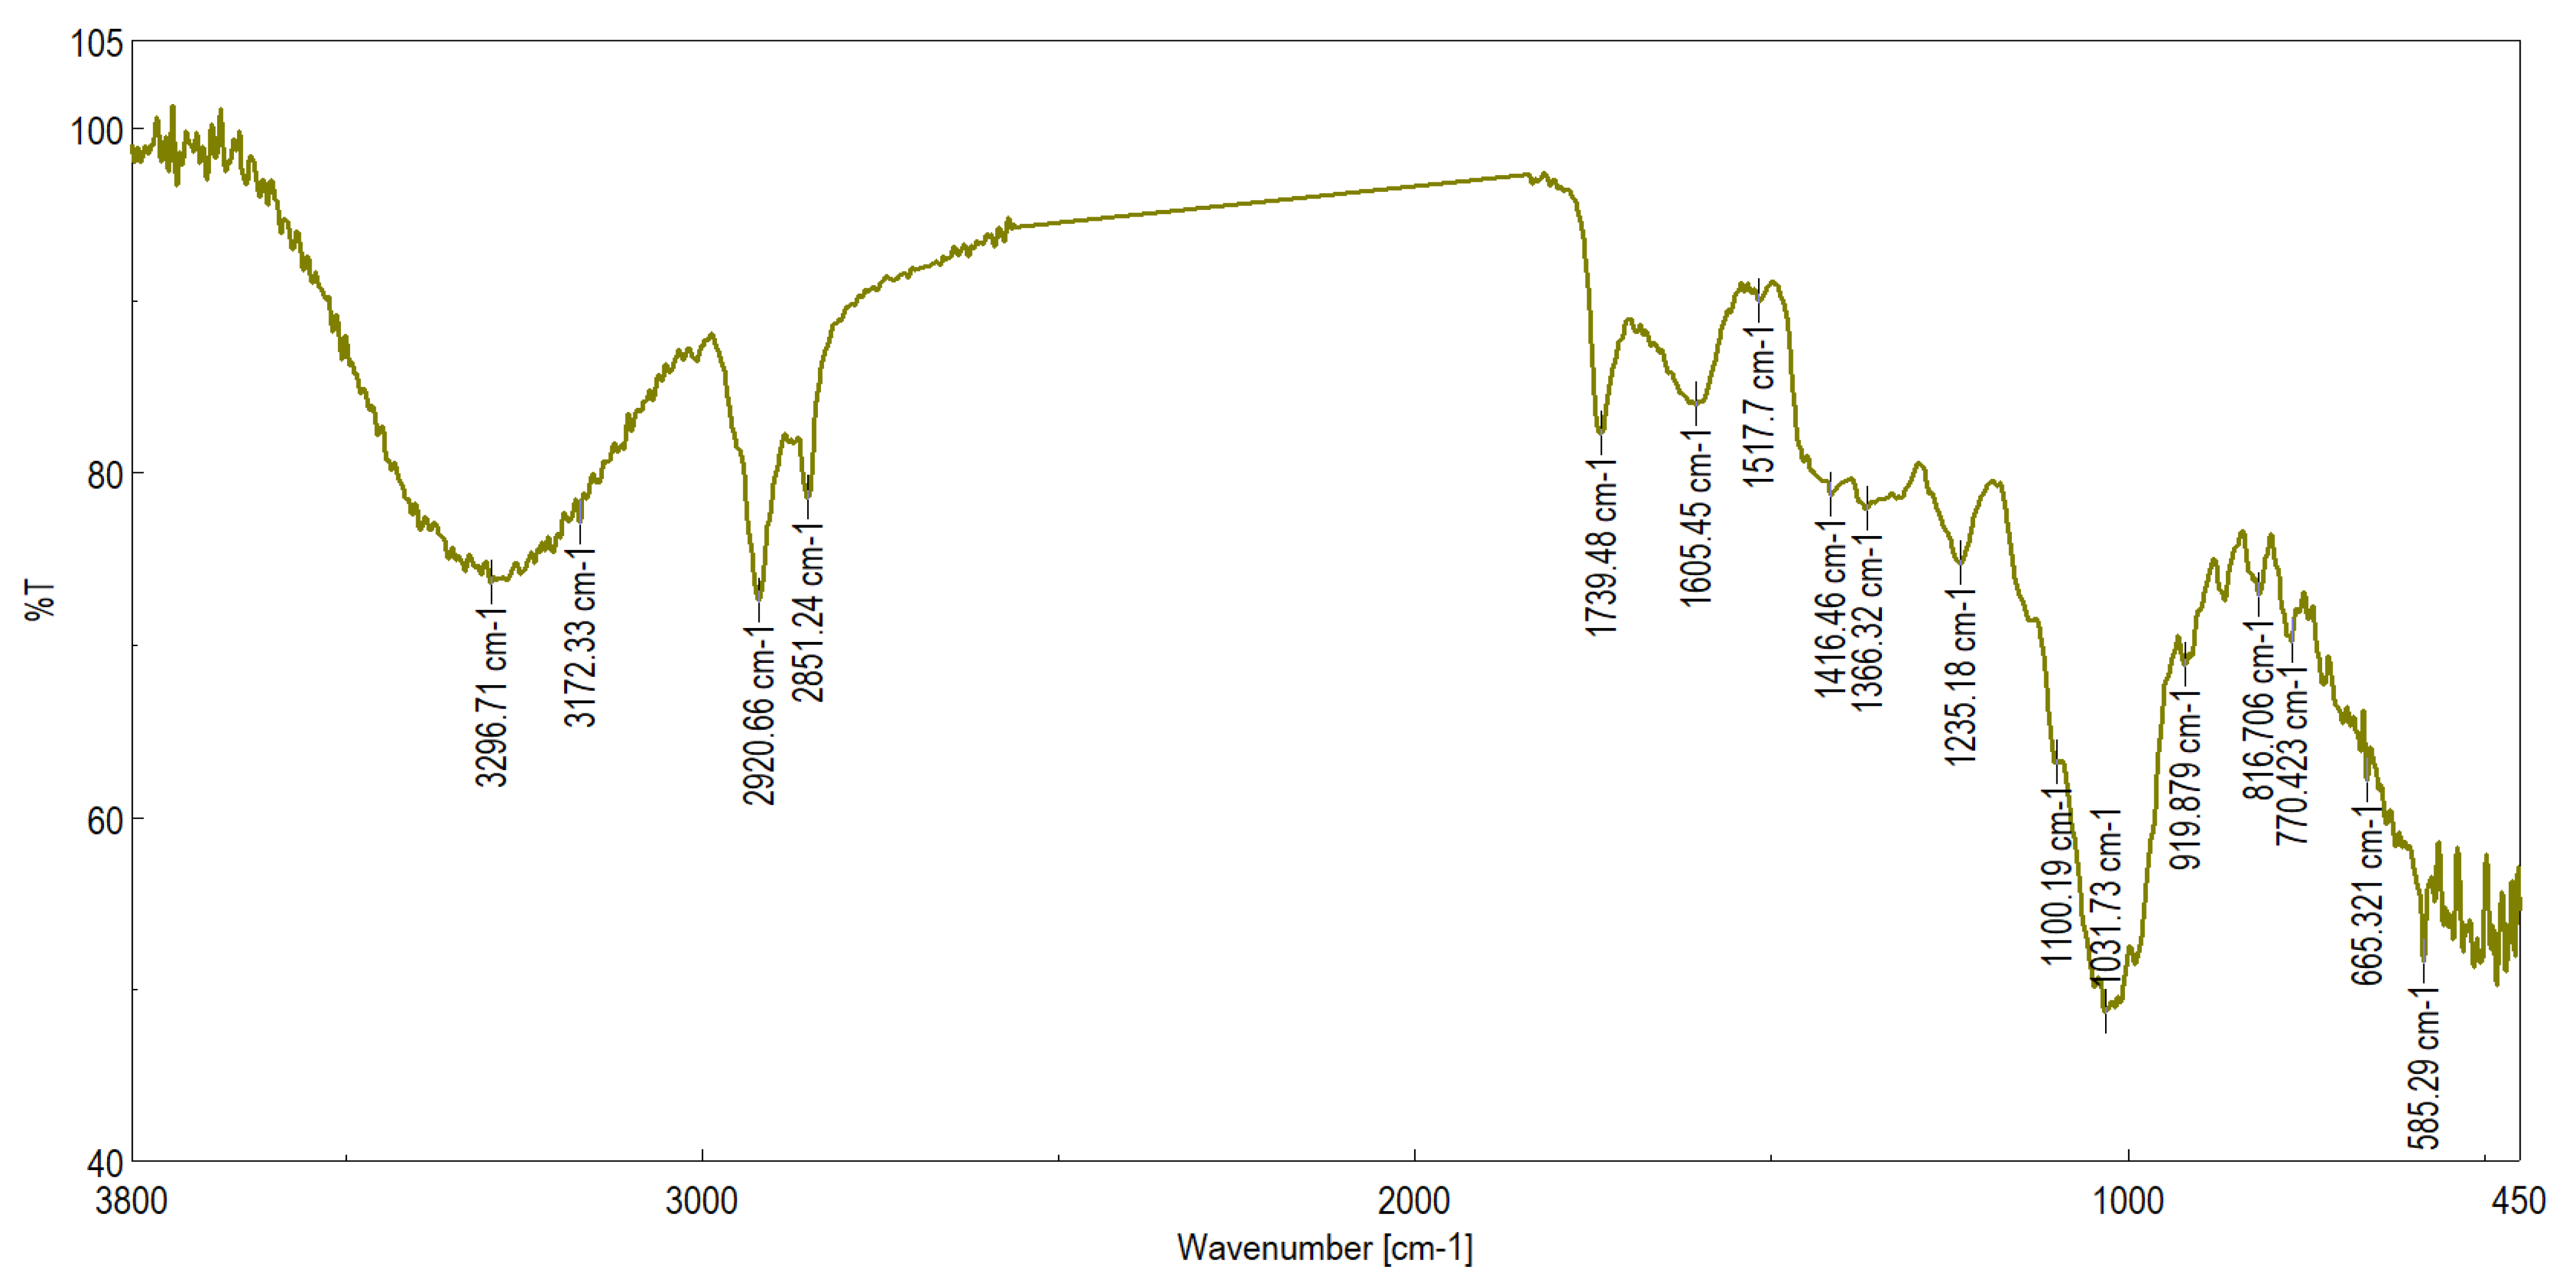
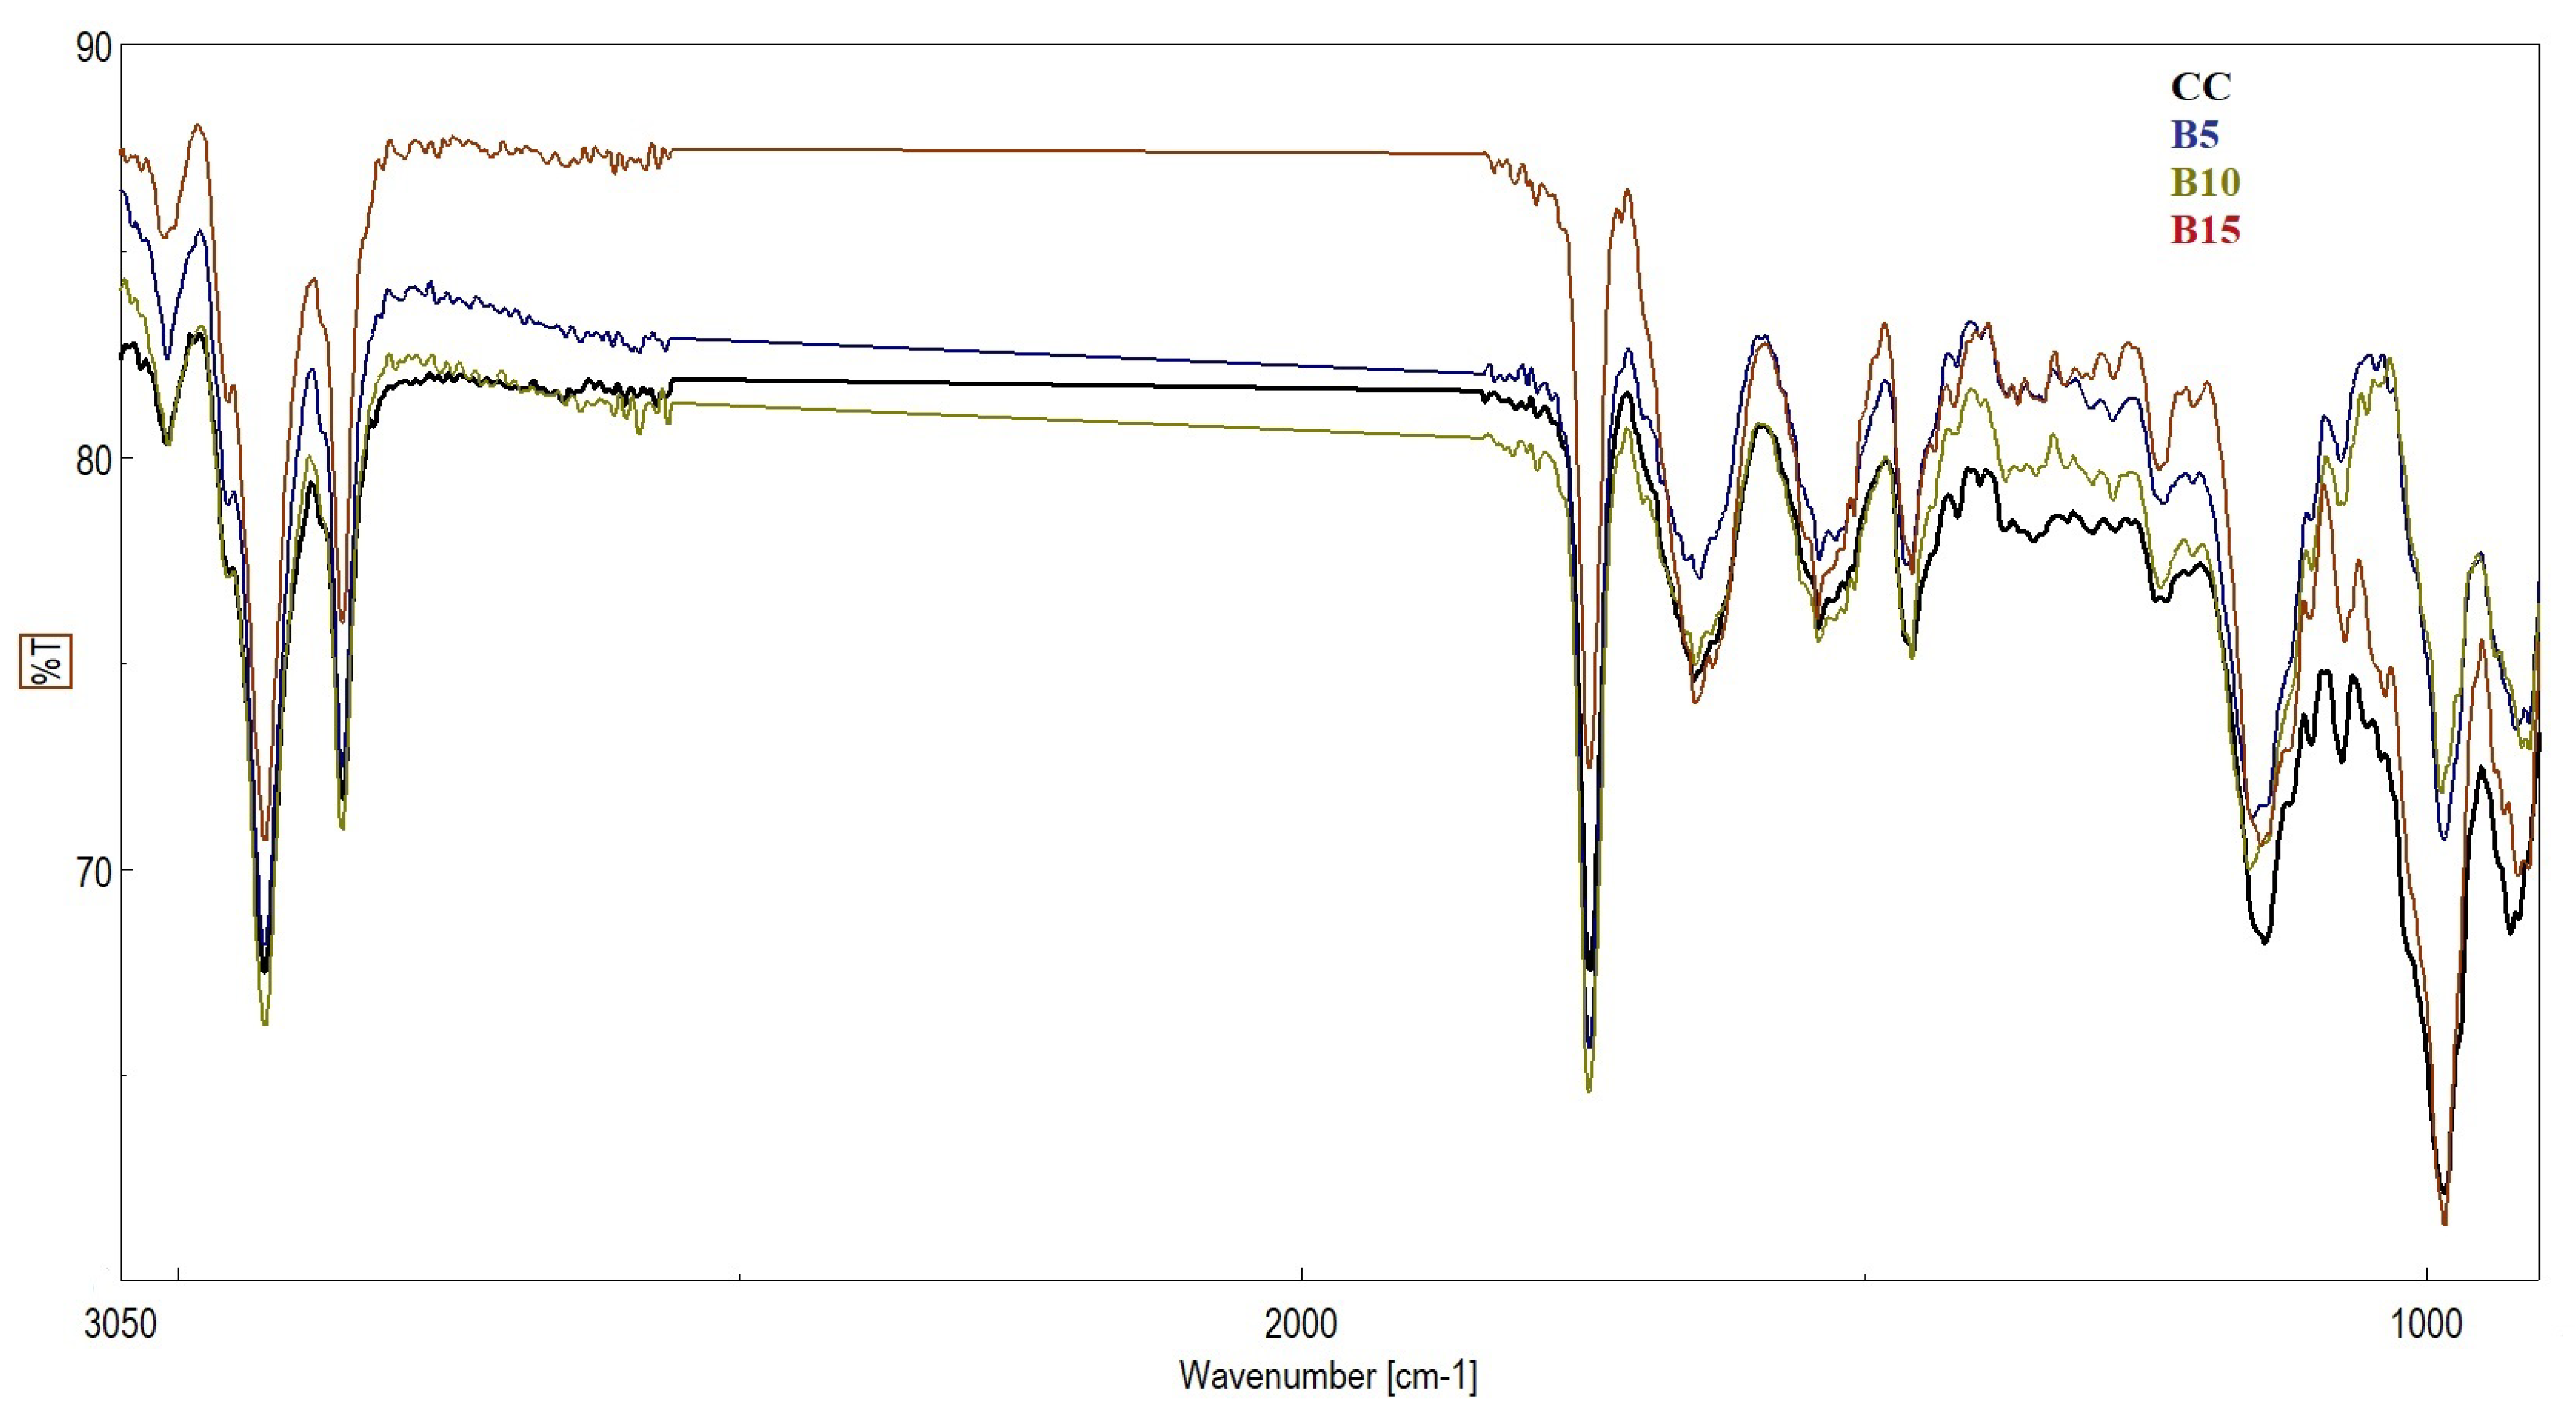
2.10. FTIR Analysis
2.11. Statistical Analysis
3. Resultsand Discussions
3.1. Chemical Composition of Peach Pomace
3.2. Chemical Analysis of Biscuits with the Addition of Peach Pomace
4. Conclusions
Supplementary Materials
Author Contributions
Funding
Institutional Review Board Statement
Informed Consent Statement
Data Availability Statement
Conflicts of Interest
References
- Jose, M.; Himashree, P.; Sengar, A.S.; Sunil, C.K. Valorization of Food Industry By-Product (Pineapple Pomace): A Study to Evaluate Its Effect on Physicochemical and Textural Properties of Developed Cookies. Meas. Food 2022, 6, 100031. [Google Scholar] [CrossRef]
- Lucini Mas, A.; Brigante, F.I.; Salvucci, E.; Ribotta, P.; Martinez, M.L.; Wunderlin, D.A.; Baroni, M.V. Novel cookie formulation with defatted sesame flour: Evaluation of its technological and sensory properties. Changes in phenolic profile, antioxidant activity, and gut microbiota after simulated gastrointestinal digestion. Food Chem. 2022, 389, 133122. [Google Scholar] [CrossRef] [PubMed]
- Hu, X.; Hu, L.; Zheng, J.; Rong, J. Classification, processing procedures, and market demand of Chinese biscuits and the breeding of special wheat for biscuit making. J. Food Qual. 2022, 2022, 6679776. [Google Scholar] [CrossRef]
- Pinto, D.; Moreira, M.M.; Vieira, E.F.; Svarc-Gajic, J.; Vallverdu-Queralt, A.; Brezo-Borjan, T.; Delerue-Matos, C.; Rodrigues, F. Development and Characterization of Functional Cookies Enriched with Chestnut Shells Extract as Source of Bioactive Phenolic Compounds. Foods 2023, 12, 640. [Google Scholar] [CrossRef]
- Šťastná, K.; Sumczynski, D.; Yalcin, E. Nutritional composition, in vitro antioxidant activity and phenolic profile of shortcrust cookies supplemented by edible flowers. Foods 2021, 10, 2531. [Google Scholar] [CrossRef]
- Naseem, Z.; Bhat, N.A.; Mir, S.A. Valorisation of apple pomace for the development of high-fibre and polyphenol-rich wheat flour cookies. Sci. Rep. 2024, 14, 25912. [Google Scholar] [CrossRef]
- Lyu, F.; Luiz, S.F.; Azeredo, D.R.P.; Cruz, A.G.; Ajlouni, S.; Ranadheera, C.S. Apple pomace as a functional and healthy ingredient in food products: A review. Processes 2020, 8, 319. [Google Scholar] [CrossRef]
- Kruczek, M.; Drygaś, B.; Habryka, C. Pomace in fruit industry and their contemporary potential application. World Sci. News 2016, 48, 259–265. [Google Scholar]
- Han, X.; Shen, T.; Lou, H. Dietary Polyphenols and Their Biological Significance. Int. J. Mol. Sci. 2007, 8, 950–988. [Google Scholar] [CrossRef]
- Sun, S.; Liu, Z.; Lin, M.; Gao, N.; Wang, X. Polyphenols in Health and Food Processing: Antibacterial, Anti-Inflammatory, and Antioxidant Insights. Front. Nutr. 2024, 11, 1456730. [Google Scholar] [CrossRef]
- Gutiérrez-Grijalva, E.P.; Picos-Salas, M.A.; Leyva-López, N.; Criollo-Mendoza, M.S.; Vazquez-Olivo, G.; Heredia, J.B. Flavonoids and Phenolic Acids from Oregano: Occurrence, Biological Activity and Health Benefits. Plants 2018, 7, 2. [Google Scholar] [CrossRef] [PubMed]
- Saini, R.K.; Khan, M.I.; Shang, X.; Kumar, V.; Kumari, V.; Kesarwani, A.; Ko, E.-Y. Dietary Sources, Stabilization, Health Benefits, and Industrial Application of Anthocyanins—A Review. Foods 2024, 13, 1227. [Google Scholar] [CrossRef] [PubMed]
- Szot, I.; Łysiak, G.P.; Sosnowska, B.; Chojdak-Łukasiewicz, J. Health-Promoting Properties of Anthocyanins from Cornelian Cherry (Cornus mas L.) Fruits. Molecules 2024, 29, 449. [Google Scholar] [CrossRef] [PubMed]
- FAO. FAOSTAT. 2022. Available online: http://www.fao.org/faostat (accessed on 24 May 2025).
- Rudke, C.R.M.; Zielinski, A.A.F.; Ferreira, S.R.S. From Biorefinery to Food Product Design: Peach (Prunus persica) By-Products Deserve Attention. Food Bioprocess Technol. 2023, 16, 1197–1215. [Google Scholar] [CrossRef]
- Solomakou, N.; Drosaki, A.M.; Kaderides, K.; Mourtzinos, I.; Goula, A.M. Valorization of Peach By-Products: Utilizing Them as Valuable Resources in a Circular Economy Model. Sustainability 2024, 16, 1289. [Google Scholar] [CrossRef]
- Plakantonaki, S.; Roussis, I.; Bilalis, D.; Priniotakis, G. Dietary Fiber from Plant-Based Food Wastes: A Comprehensive Approach to Cereal, Fruit, and Vegetable Waste Valorization. Processes 2023, 11, 1580. [Google Scholar] [CrossRef]
- Parfitt, J.; Barthel, M.; Macnaughton, S. Food Waste within Food Supply Chains: Quantification and Potential for Change to 2050. Phil. Trans. R. Soc. B 2010, 365, 3065–3081. [Google Scholar] [CrossRef]
- Cosmulescu, S.; Trandafir, I.; Nour, V.; Botu, M. Total phenolic, flavonoid distribution and antioxidant capacity in skin, pulp and fruit extracts of plum cultivars. J. Food Biochem. 2015, 39, 64–69. [Google Scholar] [CrossRef]
- Stamin, F.D.; Vijan, L.E.; Topală, C.M.; Cosmulescu, S.N. The Influence of Genotype, Environmental Factors, and Location on the Nutraceutical Profile of Rosa canina L. Fruits. Agronomy 2024, 14, 2847. [Google Scholar] [CrossRef]
- Cosmulescu, S.N.; Trandafir, I.; Cornescu, F. Antioxidant capacity, total phenols, total flavonoids and colour component of cornelian cherry (Cornus mas L.) wild genotypes. Not. Bot. Horti Agrobot. 2019, 47, 390–394. [Google Scholar] [CrossRef]
- Stoenescu, A.-M.; Trandafir, I.; Cosmulescu, S. Determination of Phenolic Compounds Using HPLC-UV Method in Wild Fruit Species. Horticulturae 2022, 8, 84. [Google Scholar] [CrossRef]
- Vîjan, L.E.; Mazilu, I.C.; Enache, C.; Enache, S.; Topală, C.M. Botanical Origin Influence on Some Honey Physicochemical Characteristics and Antioxidant Properties. Foods 2023, 12, 2134. [Google Scholar] [CrossRef] [PubMed]
- Topală, C.M.; Vîjan, L.E.; Giura, S.; Botu, M. Attenuated Total Reflection Fourier Transform Infrared (ATR-FTIR): A Method for the Biochemical Study of Walnut Leaves. Curr. Trends Nat. Sci. 2020, 9, 266–272. [Google Scholar] [CrossRef]
- Plazzotta, S.; Ibarz, R.; Manzocco, L.; Martín-Belloso, O. Modelling the Recovery of Biocompounds from Peach Waste Assisted by Pulsed Electric Fields or Thermal Treatment. J. Food Eng. 2021, 290, 110196. [Google Scholar] [CrossRef]
- Hong, Y.; Wang, Z.; Barrow, C.J.; Dunshea, F.R.; Suleria, H.A.R. High-Throughput Screening and Characterization of Phenolic Compounds in Stone Fruits Waste by LC-ESI-QTOF-MS/MS and Their Potential Antioxidant Activities. Antioxidants 2021, 10, 234. [Google Scholar] [CrossRef]
- Ciccoritti, R.; Ciorba, R.; Ceccarelli, D.; Amoriello, M.; Amoriello, T. Phytochemical and Functional Properties of Fruit and Vegetable Processing By-Products. Appl. Sci. 2024, 14, 9172. [Google Scholar] [CrossRef]
- Rudke, C.R.M.; Rudke, A.R.; Germano, A.T.; Vitali, L.; Zielinski, A.A.F.; Ferreira, S.R.S. Phenolic compounds and pectin-rich extracts recovered from peach pomace by sequential pressurized liquid extractions. Food Bioprocess Technol. 2025, 1, 16. [Google Scholar] [CrossRef]
- Liu, H.; Cao, J.; Jiang, W. Evaluation and comparison of vitamin C, phenolic compounds, antioxidant properties and metal chelating activity of pulp and peel from selected peach cultivars. LWT-Food Sci. Technol. 2015, 63, 1042–1048. [Google Scholar] [CrossRef]
- Saidani, F.; Gimenez, R.; Aubert, C.; Challot, G. Phenolic, sugar and acid profiles and the antioxidant composition in the peel and pulp of peach fruits. J. Food Comp. Anal. 2017, 62, 126–133. [Google Scholar] [CrossRef]
- Del Prado García-Aparicio, M.; Castro-Rubio, F.; Marina, M.L. Unlocking peach juice byproduct potential in food waste biorefineries: Phenolic compounds profile, antioxidant capacity and fermentable sugars. Bioresour. Technol. 2024, 396, 130441. [Google Scholar] [CrossRef]
- Singh, S.; Kulshrestha, K. Peach juice and pomace powder; nutritive value and use of pomace powder in biscuits. Int. J. Food Sci. Technol (IJFST) 2016, 6, 5–16. [Google Scholar]
- Baltacioğlu, C.; Baltacioğlu, H.; Okur, İ.; Yetişen, M.; Alpas, H. Recovery of phenolic compounds from peach pomace using conventional solvent extraction and different emerging techniques. J. Food Sci. 2024, 89, 1672–1683. [Google Scholar] [CrossRef] [PubMed]
- Al-Dhabi, N.A.; Arasu, M.V.; Park, C.H.; Park, S.U. An up-to-date review of rutin and its biological and pharmacological activities. EXCLI J. 2015, 14, 59–63. [Google Scholar] [CrossRef] [PubMed]
- Sharma, S.; Ali, A.; Ali, J.; Sahni, J.K.; Baboota, S. Rutin: Therapeutic Potential and Recent Advances in Drug Delivery. Expert Opin. Investig. Drugs 2013, 22, 1063–1079. [Google Scholar] [CrossRef] [PubMed]
- Thummajitsakul, S.; Samaikam, S.; Tacha, S.; Silprasit, K. Study on FTIR spectroscopy, total phenolic content, antioxidant activity and anti-amylase activity of extracts and different tea forms of Garcinia schomburgkiana leaves. LWT 2020, 134, 110005. [Google Scholar] [CrossRef]
- Bolade, O.P.; Akinsiku, A.A.; Adeyemi, A.O.; Jolayemi, G.E.; Williams, A.B.; Benson, N.U. Qualitative analysis, total phenolic content, FT-IR and GC-MS characterisation of Canna indica: Bioreducing agent for nanoparticles synthesis. J. Phys. Conf. Ser. 2019, 1299, 012135. [Google Scholar] [CrossRef]
- Okur, I.; Baltacıoğlu, C.; Ağçam, E.; Baltacıoğlu, H.; Alpas, H. Evaluation of the effect of different extraction techniques on sour cherry pomace phenolic content and antioxidant activity and determination of phenolic compounds by FTIR and HPLC. Waste Biomass Valorization 2019, 10, 3545–3555. [Google Scholar] [CrossRef]
- Aziz, A.H.A.; Engliman, N.S.; Mansor, M.F.; Nasaruddin, R.R. Extraction of Phenolic Compound Using Natural Deep Eutectic Solvent from Biomass Waste. IOP Conf. Ser. Mater. Sci. Eng. 2021, 1192, 012001. [Google Scholar] [CrossRef]
- Patle, T.K.; Shrivas, K.; Kurrey, R.; Upadhyay, S.; Jangde, R.; Chauhan, R. Phytochemical screening and determination of phenolics and flavonoids in Dilleniapentagyna using UV–vis and FTIR spectroscopy. Spectrochim. Acta Part. A Mol. Biomol. Spectrosc. 2020, 242, 118717. [Google Scholar] [CrossRef]
- Agatonovic-Kustrin, S.; Gegechkori, V.; Petrovich, D.S.; Ilinichna, K.T.; Morton, D.W. HPTLC and FTIR Fingerprinting of Olive Leaves Extracts and ATR-FTIR Characterisation of Major Flavonoids and Polyphenolics. Molecules 2021, 26, 6892. [Google Scholar] [CrossRef]
- Filipović, V.; Lončar, B.; Filipović, J.; Nićetin, M.; Knežević, V.; Šeregelj, V.; Košutić, M.; Solarov, M.B. Addition of combinedly dehydrated peach to the cookies—Technological quality testing and optimization. Foods 2022, 11, 1258. [Google Scholar] [CrossRef] [PubMed]
- EFSA Panel on Dietetic Products, Nutrition and Allergies (NDA). Scientific Opinion on the Substantiation of Health Claims Related to Various Food(s)/Food Constituent(s) and Protection of Cells from Premature Aging, Antioxidant Activity, Antioxidant Content and Antioxidant Properties, and Protection of DNA, Proteins and Lipids from Oxidative Damage Pursuant to Article 13(1) of Regulation (EC) No 1924/2006. EFSA J. 2010, 8, 1489. [Google Scholar] [CrossRef]
- USA Food and Drug Administration. Code of Federal Regulations (Annual Edition); Office of the Federal Register, National Archives and Records Administration: College Park, MD, USA, 2022. [Google Scholar]
- Antoniolli, A.; Becerra, L.; Piccoli, P.; Fontana, A. Phenolic, Nutritional and Sensory Characteristics of Bakery Foods Formulated with Grape Pomace. Plants 2024, 13, 590. [Google Scholar] [CrossRef] [PubMed]
- EFSA Panel on Food Additives and Nutrient Sources Added to Food (ANS). Scientific Opinion on the Re-Evaluation of Anthocyanins (E 163) as a Food Additive. EFSA J. 2013, 11, 3145. [Google Scholar]
- Matsumoto, H.; Inaba, H.; Kishi, M.; Tominaga, S.; Hirayama, M.; Tsuda, T. Orally Administered Delphinidin 3-Rutinoside and Cyanidin 3-Rutinoside Are Directly Absorbed in Rats and Humans and Appear in the Blood as the Intact Forms. J. Agric. Food Chem. 2001, 49, 1546–1551. [Google Scholar] [CrossRef]
- Gonçalves, A.C.; Nunes, A.R.; Falcão, A.; Alves, G.; Silva, L.R. Efecteledietetice ale antocianilorînsănătateaumană: O revizuirecuprinzătoare. Farmaceutice 2021, 14, 690. [Google Scholar] [CrossRef]
- Mandache, M.B.; Vijan, L.E.; Cosmulescu, S. Insight into Bioactive Compounds and Antioxidant Activity of Bakery Products Fortified with Fruit Pomace. Foods 2025, 14, 806. [Google Scholar] [CrossRef]
- Imeneo, V.; Romeo, R.; Gattuso, A.; De Bruno, A.; Piscopo, A. Functionalized Biscuits with Bioactive Ingredients Obtained by Citrus Lemon Pomace. Foods 2021, 10, 2460. [Google Scholar] [CrossRef]
- Tyagi, P.; Chauhan, A.K.; Aparna. Optimization and characterization of functional cookies with addition of Tinospora cordifolia as a source of bioactive phenolic antioxidants. LWT 2020, 130, 109639. [Google Scholar] [CrossRef]
- Czubaszek, A.; Czaja, A.; Sokół-Łętowska, A.; Kolniak-Ostek, J.; Kucharska, A.Z. Changes in Antioxidant Properties and Amounts of Bioactive Compounds during Simulated In Vitro Digestion of Wheat Bread Enriched with Plant Extracts. Molecules 2021, 26, 6292. [Google Scholar] [CrossRef]
- Chethan, S.; Malleshi, N.G. Finger millet polyphenols: Optimization of extraction and the effect of pH on their stability. Food Chem. 2007, 105, 862–870. [Google Scholar] [CrossRef]
- Pérez-Gregorio, M.R.; Garcia-Falcon, M.S.; Simal-Gandara, J. Flavonoids changes in fresh-cut onions during storage in different packaging systems. Food Chem. 2011, 124, 652–658. [Google Scholar] [CrossRef]
- Ioannou, I.; Hafsa, I.; Hamdi, S.; Charbonnel, C.; Ghoul, M. Review of the effects of food processing and formulation on flavonol and anthocyanin behaviour. J. Food Eng. 2012, 111, 208–217. [Google Scholar] [CrossRef]
- Reis, S.F.; Rai, D.K.; Abu-Ghannam, N. Apple pomace as a potential ingredient for the development of new functional foods. Int. J. Food Sci. Technol. 2014, 49, 1743–1750. [Google Scholar] [CrossRef]
- Ou, J.; Wang, M.; Zheng, J.; Ou, S. Positive and negative effects of polyphenol incorporation in baked foods. Food Chem. 2019, 284, 90–99. [Google Scholar] [CrossRef]
- Blanch, G.P.; Ruiz del Castillo, M.L. Effect of Baking Temperature on the Phenolic Content and Antioxidant Activity of Black Corn (Zea mays L.) Bread. Foods 2021, 10, 1202. [Google Scholar] [CrossRef]

| Polyphenols (mg GAE 100 g−1) | Flavonoids (mg RE 100 g−1) | Anthocyanins (mg C3G 100 g−1) | Sugars (g GLuE 100 g−1) | RSA (%) |
|---|---|---|---|---|
| 1771.64 ± 48.07 | 478.99 ± 32.29 | 21.18 ± 0.98 | 35.38 ± 0.69 | 40.41 ± 0.66 |
| Phenolic Compounds (mg 100 g−1 DW) | |||||||
|---|---|---|---|---|---|---|---|
| Gallic acid | Ellagic acid | Neochlorogenic acid | Chlorogenic acid | Caffeic acid | Sinapic acid | Myricetin | Rutin |
| 1.32 ± 0.20 | 2.05 ± 0.06 | 0.82 ± 0.08 | 3.77 ± 0.23 | 0.11 ± 0.02 | 2.70 ± 0.20 | 1.49 ± 0.15 | 8.12 ± 0.21 |
| Wavenumber (cm−1) | Functional Grouping | Vibration Type | Corresponding Compounds |
|---|---|---|---|
| ~3400 | –OH (Hydroxyl) | Stretching | Water, alcohols, polyphenols, cellulose, pectins |
| ~2920 and ~2850 | C–H (aliphatic) | Stretching (symmetrical/asymmetrical) | Lignin waxes, lipids, aliphatic chains |
| ~1740–1700 | C=O (carbonyl) | Stretching | Carboxylic acids, esters (pectin), aldehydes |
| ~1600 | C=C (aromatic) | Stretching | Lignin, polyphenols |
| ~1510–1450 | C–H and C=C (aromatic) | Deformation and stretching | Lignin, phenolic compounds |
| ~1250–1000 | C–O, C–O–C, C-O-C glycosidic bond | Stretching | Cellulose, hemicellulose, pectins, sugars |
| ~900–600 | C–H (aromatic out-of-plane) | Deformation from the plane | Lignin, phenolic structures |
| Sample | Concentration | Polyphenols (mg GAE 100g−1) | Flavonoids (mg RE 100 g−1) | Anthocyanins (mg C3GE 100 g−1) | Sugars (g GluE 100 g−1) | RSA (%) |
|---|---|---|---|---|---|---|
| Control sample | 0% | 390.21 ± 0.39 d | 120.13 ± 0.46 d | 18.78 ± 0.30 d | 39.16 ± 0.36 c | 18.77 ± 0.63 c |
| Biscuits with added peach pomace | 5% | 425.25 ± 2.93 c | 186.19 ± 0.23 c | 23.37 ± 0.32 c | 45.04 ± 0.40 b | 21.46 ± 0.23 b |
| 10% | 434.54 ± 2.47 b | 201.39 ± 0.34 b | 24.38 ± 0.17 b | 45.45 ± 0.02 b | 22.04 ± 0.48 b | |
| 15% | 444.04 ± 1.97 a | 211.11 ± 0.50 a | 25.43 ± 0.19 a | 46.48 ± 0.63 a | 27.21 ± 0.34 a |
| Wavenumber (cm−1) | Attribution | |||
|---|---|---|---|---|
| Control Sample | Biscuits with Added Peach Pomace | |||
| 5% | 10% | 15% | ||
| 3009 | 3009 | 3008 | 3011 | N-H stretching; = C-H groups that are related to olefinbands or unsaturated fatty acids |
| 2922 | 2922 | 2921 | 2922 | Asymmetric stretching vibration of CH2 |
| 2853 | 2853 | 2853 | 2853 | Symmetric stretching vibration of CH2 |
| 1743 | 1744 | 1744 | 1744 | C=O stretching (lipids) |
| 1651 | 1646 | 1650 | 1650 | Amide I (C=O stretching) |
| 1539 | 1539 | 1540 | 1540 | Amide II (N-H bending, C-N stretching) |
| 1456 | 1457 | 1457 | 1456 | CH3 bending vibration (lipids and proteins) |
| 1340 | 1374 | 1363 | Stretching C-O, deformation C-H, deformation N-H | |
| 1231 | 1233 | 1237 | 1238 | Amide III (C-N stretching, N-H bending) |
| 1143, 1075 | 1154, 1077 | 1158, 1078 | 1146, 1073 | C-O stretching vibration |
| 983 | 984 | 986 | 983 | Stretching OCH3 |
| 848, 790, 722, 699 | 848, 798, 721, 709 | 848, 794, 709, 700 | 848, 797, 701, 690 | Out-of-plane bending vibrations |
Disclaimer/Publisher’s Note: The statements, opinions and data contained in all publications are solely those of the individual author(s) and contributor(s) and not of MDPI and/or the editor(s). MDPI and/or the editor(s) disclaim responsibility for any injury to people or property resulting from any ideas, methods, instructions or products referred to in the content. |
© 2025 by the authors. Licensee MDPI, Basel, Switzerland. This article is an open access article distributed under the terms and conditions of the Creative Commons Attribution (CC BY) license (https://creativecommons.org/licenses/by/4.0/).
Share and Cite
Mandache, M.; Topală, C.M.; Vijan, L.E.; Cosmulescu, S. The Characterization of Peach Pomace and the Influence of Its Incorporation on the Chemical Composition of Biscuits. Appl. Sci. 2025, 15, 6983. https://doi.org/10.3390/app15136983
Mandache M, Topală CM, Vijan LE, Cosmulescu S. The Characterization of Peach Pomace and the Influence of Its Incorporation on the Chemical Composition of Biscuits. Applied Sciences. 2025; 15(13):6983. https://doi.org/10.3390/app15136983
Chicago/Turabian StyleMandache, Maria, Carmen Mihaela Topală, Loredana Elena Vijan, and Sina Cosmulescu. 2025. "The Characterization of Peach Pomace and the Influence of Its Incorporation on the Chemical Composition of Biscuits" Applied Sciences 15, no. 13: 6983. https://doi.org/10.3390/app15136983
APA StyleMandache, M., Topală, C. M., Vijan, L. E., & Cosmulescu, S. (2025). The Characterization of Peach Pomace and the Influence of Its Incorporation on the Chemical Composition of Biscuits. Applied Sciences, 15(13), 6983. https://doi.org/10.3390/app15136983