Abstract
The purpose of this study was to determine the power produced by knee muscles in normal adults when performing self-selected walking. The power of a single knee muscle is not directly measurable without invasive methods. An EMG-to-force processing (EFP) model was developed, which scaled muscle–tendon unit (MTU) power output to gait EMG. Positive power by each muscle occurred when force was developed during concentric contractions, and negative power occurred with lengthening contractions. The sum of EFP power produced by knee muscles was compared with the kinematics plus kinetics (KIN) knee power at percent gait cycle intervals. Closeness-of-fit of the EFP and KIN power curves (during active muscle forces) was used to validate the model. Key findings were that most knee muscles have a characteristic eccentric-then-concentric contraction pattern, and greatest power was produced by the Semimembranosis, with peak magnitude nearly matched by two vastus muscles (VL, VMO). The EMG-to-force processing approach provides reasonable estimates of active individual knee muscle power in self-selected speed walking in neurologically intact adults. Further, a prolonged period of the gait cycle showed substantial knee flexion or extension in the absence of power produced by muscles acting at the knee.
1. Introduction
Knowledge of individual muscle power profiles may augment our understanding of their functional tasks and how alterations in power production after impairment may affect movement [1]. Muscle forces may be associated with concentric (shortening) contractions, eccentric (lengthening) contractions, or isometric contractions. Muscle power is the mathematical product of that muscle force and that muscle’s contraction velocity, where positive power is associated with power that generates movement (positive power) or restrains movement (negative power). There is a lack of consensus regarding the role of individual knee muscles during level, self-selected speed gait in neurologically intact adults [2,3]. The differences in the interpretation of muscle responsibilities in gait are important, as rehabilitation protocols are developed, in part, based on these assumptions. Our understanding of the factors that contribute to normal walking would be advanced if each muscle’s power—and, as such, their unique role(s)—could be determined in vivo.
Muscle power is an important quantity in the analysis of human movement. Its relationship to mechanical work has been examined in walking, running, and other locomotor activities [4,5,6,7,8]. Joint work, which is computed as the integral of the net power at a joint (via standard inverse dynamics techniques), may represent mechanical work by the muscle–tendon unit (MTU) most accurately as compared to internal or external work estimates. Muscle work and storage of elastic energy have been analyzed in walking, mostly using muscle-activated forward dynamics simulations. Perhaps the most comprehensive collection of work estimating muscle forces via an EMG-driven model was by Hof and colleagues [9,10,11,12,13,14]. This early work showed realistic estimates of in vivo muscle forces during adult human walking, while primarily limited to calf (triceps surae) muscles. Arnold and colleagues [15] examined muscle activity and coordination in the terminal swing phase of adult walking. They note that knee motions in early swing were influenced by muscles that cross the knee and by moment at adjacent joints (ankle and hip). They demonstrated that the hamstrings decelerated the forward motion of the swing-limb shank, without influencing rotational motion about the knee (simultaneously accelerating the pelvis forward and the hip into extension). However, that work stopped short of estimating forces and power in individual muscles (the model included some “lumping” of synergistic muscles), and the EMG profiles used as model input were of longer duration than is typically found in clinical trials. The use of surface EMG may have been an additional confound (related to intramuscular crosstalk).
Sasaki et al. [16], using a forward-dynamics approach, examined muscle forces and power at the ankle, knee, and hip via a sagittal plane musculoskeletal bipedal model. Surface electromyograms (EMGs) were used to determine periods of muscle force. An outstanding feature of this work was its inclusion of passive moments in the model. The model was limited to muscles primarily in the (examined) sagittal plane and EMG relative intensity scaled to peak gait activity. This non-physiological step likely led to the overestimation of muscles that have relatively little activation in gait (e.g., hamstrings) and underestimation of muscles that have contraction intensity close to maximum contraction (e.g., soleus). Despite these limitations, the aforementioned studies have advanced our knowledge of the role of selected lower extremity muscles in gait.
The power produced by synergistic muscles (or joint power) may be used to establish the scope of muscle groups to generate or restrain movement [17,18,19,20,21,22,23,24,25] and seems to be a valid indicator of a person’s ability to control their limbs [26,27,28]. Concentric power typically produces motion, while negative power implies motion restraint (isometric contractions have zero power due to a contraction velocity of zero).
However, the in vivo power produced by any single muscle cannot be directly determined. Hence other methods are required. An impediment to the easy assessment of muscle power—and the potential role of individual knee muscles—is that the knee has more muscles crossing that joint than are necessary to perform basic movements. This overabundance of muscles leads to statistical indetermination, where the number of unknown muscle forces is greater than the available solution set of equations [29]. Combining individual muscles into muscle groups simplifies the appraisal, as the number of unknown synergistic power generators is equal to or less than the solution set of equations [30,31,32]. Consequently, power calculation approaches are typically based on inverse dynamics techniques. This method solves the actuator-redundancy problem. However, conventional power analysis cannot define the unique power contribution of a single muscle (except in uncommon cases where only a single muscle is responsible for the observed movement). Co-contraction of agonists and antagonists is an additional confound [33,34,35]. As a result, there may not be a direct link between a muscle’s power output (via inverse dynamics techniques) and that muscle’s true role in gait. A single cost function is typically minimized or maximized (e.g., muscle endurance, muscle stress, and metabolic cost) as kinematic data is combined with certain objective function assumptions [34,35,36,37]. However, two aspects related to optimization research remain limitations. First, obtaining a solution can be very time-intensive [29]. A more important issue that cannot be circumvented is that the determination of objective functions remains subjective, as several solution sets may satisfy the stated criteria [28].
Muscle force estimates have been made via an electromyogram-driven model [9,10,11,12,13,14,27,38,39,40,41]. Determining muscle power follows from force estimates as the power produced by each muscle is the product of its force output and contraction velocity. The EMG-to-force processing method has the advantage of providing a unique solution set [42,43]. Thus far, only estimations of knee muscle forces have been reported, independent of the method selected (optimization theory and neuromuscular modeling) to examine the role of individual muscles. That is, muscle forces—and not power—have been the emphasis of prior efforts. This work broadens these analyses as the role of muscles can now be assessed based on both muscle force and power production (type of contraction). Muscle force estimates have been made via inference from the joint moments. However, the type of muscle contraction—eccentric, isometric, and concentric—cannot be determined solely from joint moments.
The purpose of this study was to determine each knee muscle’s contribution to knee joint power and to provide insight into the distinctive role of these muscles during normal, self-selected speed walking. Knee muscle power during level, self-selected speed walking was determined via an EMG-to-force processing (EFP) model and by standard inverse dynamics (kinematics plus kinetics, KIN) during the same gait trial for each study participant.
2. Methods
Subjects
A convenience sample of eighteen neurologically intact adult males was recruited to participate in this study [39]. The study participants had a mean age of 27 ± 3.2 years (range 23–34 years) and a mean mass of 73.9 ± 6.6 kg. Each study participant performed two self-selected speed walking trials due to the extensive number of muscles examined. Data was selected from each trial. All study participants completed the multiple required trials in less than fifteen days between the first and second data collection. All examined parameters were consistent across trials [44], and the use of multiple trials for each study participant was not a confounding factor. The mean walking velocity for study participants was 82.0 ± 3.6 m per minute (≈1.37 m/s). Subjects agreed to participate in this study following an explanation of the procedure. This research was conducted at Rancho Los Amigos National Rehabilitation Hospital and approved by that Institute’s Review Board (Rancho Research Institute) (Figure 1).
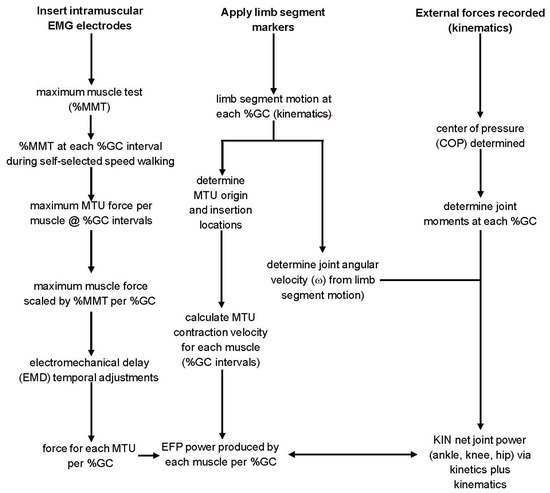
Figure 1.
The flowchart demonstrates the steps used to determine the power produced by EMG-to-force processing (EFP, left column) and inverse dynamics (kinetics plus kinematics, KIN, center and right columns).
3. Data Acquisition and Processing
3.1. Kinetics and Kinematics
The motion and EMG data used for this study were part of a larger data set, and the acquisition and processing steps have been described in greater detail elsewhere [39]. Each gait trial began with quiet standing, then each study participant reached their comfortable (self-selected) walking speed after a few strides. Stance and swing times, contact forces, moments, and power (kinetics), limb-segment kinematics, and EMG data acquired simultaneously. The gait walkway was twelve meters in length. Study participants reached a comfortable and consistent walking velocity using the last few meters of the walkway to decelerate. Gait analysis was limited to the middle six meters of the trial [41]. Study participants wore light shirts, shorts, and their own flat-soled shoes. Stance (approximately sixty percent of the gait cycle) and swing times (the remaining forty percent of the gait cycle) were determined using contact-closing footswitches [44] placed in the study participant’s shoes. The lower extremity joint centers were estimated by placing round reflective markers over pre-determined anatomic landmarks [40].
Study participants performed several preliminary walking trails to become acclimated to the test environment. Normal gait is essentially symmetric [45]; thus, only data from the right leg were analyzed. Data from five (consecutive) noise-free trials were averaged for each study participant.
Motion data was sampled at 100 Hz with an eight-camera system (Motion Analysis Corporation Model Hawk, Rohnert Park, CA, USA). A fourth-order Butterworth filter, with a cut-off frequency of 6 Hz, was used for bi-directional smoothing of marker coordinates. Angles and orientation of limb segments (and their first (velocity) and second (acceleration) derivatives) were determined as described elsewhere [23]. Ground reaction force (GRF) data, collected at 600 Hz, were acquired with paired force platforms (AMTI type OR6-7). The center of pressure location was determined from smoothed GRF data as described elsewhere [23]. Ground reaction force and motion data were temporally paired, and the inertial properties (body segment parameters) of the limb segments were used to determine joint moments [46]. Inverse dynamics (kinetics plus kinematics, KIN) knee power was determined from the product of the net knee moment and its angular velocity using in-house software.
3.2. EMG-to-Force Processing—Force Processor
A generic neuromusculoskeletal model, including lower extremity skeletal structures plus all lower extremity muscles, was developed. The model consisted of kinematic descriptions of the ankle, knee, and hip, 3D representations of bones and muscle–tendon paths, and a nominal biomechanical model of each musculotendinous unit (MTU) [47,48,49]. A Hill-type muscle in series with an elastic tendon was scaled to estimate the force-generating properties of the MTU [50]. The model included a contractile element plus parallel and series elastic components. Power for each muscle was obtained by scaling the Model that included four parameters: (1) peak isometric force; (2) optimal muscle fiber length; (3) pennation angle, and (4) tendon slack length. Peak isometric force for each muscle was correlated with that muscle’s physiological cross-sectional area [51]. Muscle fiber length is the length that matches peak active muscle force [52]. Pennation angle is the angle between the long axis of that muscle’s associated tendon and its muscle fibers. Optimal fiber length and pennation angles were adapted from Wickiewicz, where available [53]; otherwise, values reported by Friedrich were used [54]. Tendon slack length was the MTU length, beyond which, force develops with tendon elongation [51]. The Force Processor was scaled in a non-linear manner to reflect the force–velocity characteristics associated with muscle eccentric and/or concentric contractions [54,55]. Muscle contraction type and history, plus muscle force–velocity relations, were considered [4,56].
3.3. EMG-to-Force Processing—Dynamic Electromyography (EMG)
Electromyographic (EMG) was obtained from fourteen muscles crossing the knee. Included were four knee extensors (Vastus Lateralis (VL), Vastus Intermedius (VI), Vastus Medialis Oblique (VMO), Rectus Femoris (RF)), four knee flexors (Semitendinosis (STEND), Semimembranosis (SMEMB), Biceps Femoris, Long Head (BFLH), Biceps Femoris, Short Head BFSH)), plus other muscles with compound functions (Sartorius (SART), Gracilis (GRAC), Tensor Fascia Lata (TFL), Medial Gastrocnemius (MGAST), Lateral Gastrocnemius (LGAST), and Popliteus (POP)). Electromyographic activity was recorded with paired, insulated 50µ stainless steel wire electrodes. The insulation was removed 2 mm from the wire ends, the tips curved (to limit electrode migration),and inserted into each tested muscle near the presumed motor point of the muscle [57] with a hypodermic needle [58] (Figure 2). The needle was then withdrawn, and electrode placement was achieved via both voluntary muscle contraction and electrical stimulation via the indwelling electrode. A ground electrode was placed over a lower extremity bony landmark.
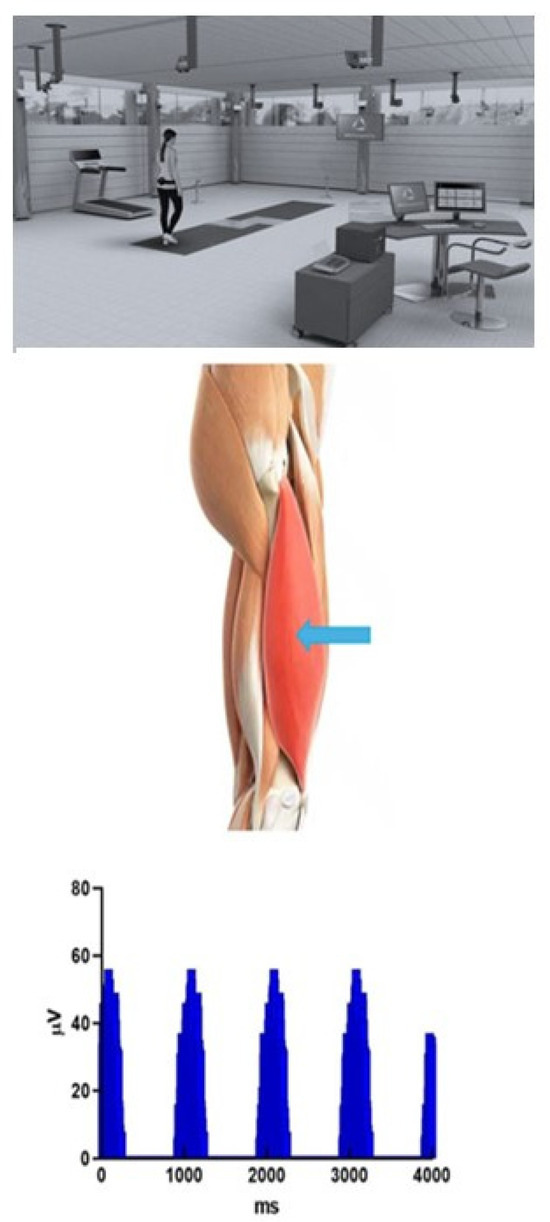
Figure 2.
Graphical depiction of motion, external force, and EMG data acquisition environment. The figure shows the motion analysis laboratory setting (multiple video acquisition cameras and paired embedded force platforms in line with the walking direction (indicated by curved arrows). The middle figure shows the insertion site for intramuscular (“wire”) electrodes inserted at the motor point of the muscle (Vastus Lateralis, at blue arrow). Finally, several consecutive strides of rectified, non-normalized EMG from that same muscle are shown in the lower figure.
The EMG system bandwidth was 10–1000 Hz, with an overall gain of 1000 [59] (Model MA-300, Motion Laboratory Systems, Baton Rouge, LA, USA). The limbs were positioned to ensure a maximum voluntary contraction (MVC) [60], and the signal was normalized to the MVC [61]. Maximum muscle tests were performed by a single Board-Certified rehabilitation physician (RB). The manual muscle test was five seconds in duration [61]. The one-second interval in that test with the highest mean voltage was established. A second maximum muscle test was performed at the end of each gait trial to assure continued electrode insertion integrity [62]. The higher value obtained by the two tests was used as the MMT reference value (one hundred percent maximum voluntary contraction reference value (100%MVC)).
Footswitches were used to record the gait cycle interval and foot support patterns. EMG and footswitch data were collected at 2500 Hz. The digitized EMG data were then rectified, and baseline noise was corrected with a resting run. The %MVC value at each percent gait cycle interval was determined by normalization the stride data.
EMG was input to the force processor model via two sequential processing steps. First, on a stride-by-stride basis, each muscle’s EMG linear envelope was determined [45]. Here, the raw EMG signal was rectified, and the mean relative intensity was determined for the first fifty-sample interval. The analysis window was advanced one data point, and a new fifty-sample mean was established. This moving-window averaging process was repeated for the entire gait cycle [62]. The several thousand EMG data points per stride were reduced to one hundred EMG relative intensity values—one for each percent gait cycle—via a linear interpolation method. The within-subject EMG profiles were then determined from individual stride EMG data [63].
A muscle’s electromyographic activity predictably precedes that muscle’s force production. This timing mismatch between the onset of a muscle’s EMG and force production (electromechanical delay, EMD) typically is in the range of 20 ms [64]. EMG and MTU force production were also not temporally matched during the continued muscle contraction, with MTU force maintained after that muscle’s EMG activity had returned to baseline. The “relaxation EMD” is considerably longer than the delay observed at the onset of muscle contraction (250–275 ms) [65]. As a result, the use of a constant offset correction between EMG timing and predictions of force generation is contraindicated. Thus, a second-order critically damped Butterworth low-pass digital filter was applied to temporally match EMG activity and muscle force [39]. This method led to a relatively brief onset of EMD and more prolonged relaxation of EMD. The EMG input to the model (activation dynamics, (e(t)) was defined by
where E represents the percent maximum voluntary contraction for the within-subject EMG profiles, e the percent maximum voluntary contraction for the within-subject EMG profiles following filtering, and the constant γ (=EMAX/eMAX) minimizes further attenuation of the EMG signal due to signal processing. The constants κ1–κ5 are derived from the sampling frequency-to-cutoff frequency ratio (Fs/Fc), where a single Fs/Fc ratio was empirically determined [66] and was like previously reported values [39,42,67,68,69,70].
e(t) = g{k1E(t) + k2E(t − 1) + k3E(t − 2) + k 4e(t − 1) + k5e(t − 2)}.
Muscle–tendon unit length (LMTU) and force (FMTU) were determined at percent gait cycle intervals. Muscle shortening or lengthening contraction velocity was established by mathematical differentiation of MTU length (vMTU = dLMTU/dt). Positive velocities were related to concentric (shortening) muscle contractions. Concentric (shortening) contractions were defined as positive, whereas negative power occurred when the muscle length increased during force production (suggesting a role in restraining movement). Power generated by each muscle was the dot product of that muscle’s contraction force (above) and its contraction velocity along its line of pull (co-linear).
The EFP net knee power for each study participant was obtained by summing the power produced by each muscle crossing the knee. Summed values for all fourteen muscles were determined at percent gait cycle intervals. The correlation between the across-subject mean EFP knee power and the mean kinetics plus kinematics knee power for these same study participants was performed, where
3.4. Statistics
Assessment Duration
Approximately one-third of the gait cycle has non-zero KIN knee moments yet absent or low-amplitude EMG. Forces and moments at adjacent joints can initiate motion at the knee [71,72,73]. At least four factors—not directly associated with muscle forces acting at the knee joint—contribute to the observed pre-swing and early swing knee flexion (Figure 3).
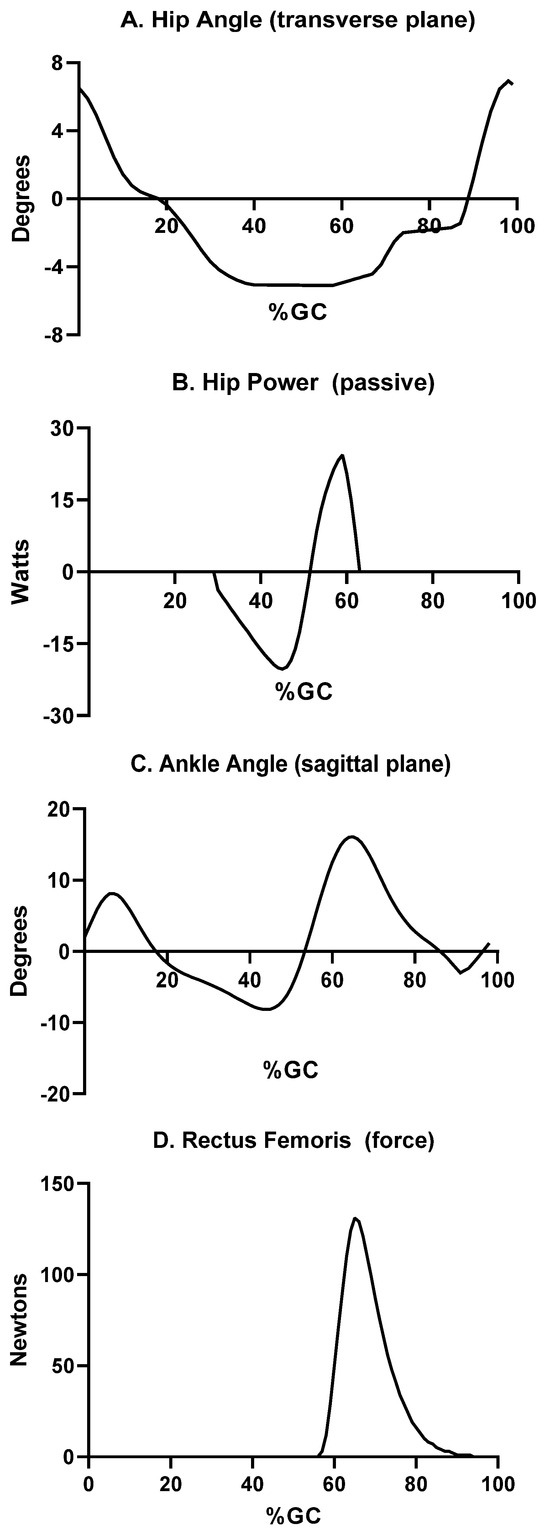
Figure 3.
Periods of the gait cycle where power is produced by factors other than knee muscle forces. These factors include (A) transverse plane rotation of the hip during pre-swing and early swing to advance the ipsilateral limb; (B) power is produced at the anterior hip by the hip joint capsule via elastic recoil; pre-swing plantar flexion (C) then passively flexes the knee prior to the onset of the swing phase. Concentric contraction by one of the quadriceps muscles (Rectus Femoris) actively flexes the hip (D), which leads to passive flexion of the ipsilateral knee. The percent gait cycle for each is shown on the abscissa for each curve.
Coincident with contralateral initial foot contact, the transverse plane (horizontal) hip rotation changes direction (Figure 3A). This directional change in hip rotation begins in pre-swing as the ipsilateral hip rotates forward along the line of progression. Thus, the swing phase step length is enhanced. Non-contractile elements, such as the anterior aspect of the hip joint capsule, generate forces that generally restrain motion [40,74,75]. These forces (and resultant power) are substantial, particularly at the end range of motion. The net result at the hip is energy stored during pre-swing, then released as positive power to augment swing phase hip flexion (Figure 3).
The vigorous plantar flexion observed in pre-swing (Figure 3C) leads to substantial knee flexion, as part of a closed kinetic chain [76]. Finally, early swing is notable for activation of ipsilateral hip flexors (Figure 3D) and associated knee flexion [39]. The combination of these four sequential events—hip transverse rotation, hip flexion due to passive soft tissue forces, ankle plantar flexion, and hip flexion due to concentric forces by hip muscles—leads to knee flexion in the absence of substantial force production by muscles crossing the knee.
As the swing phase continues, hip flexion slows, and knee extension is generated due to the transfer of energy between linked leg segments [76]. Consequently, the EMG-to-force processing examination period began in early swing (68%GC) and concluded when all vastus or hamstring muscle activity ended (32% of the ensuing stride). Thus, each EMG-activity period was about 770 ms in duration, and two-thirds (about 64%GC) of the gait cycle had large power produced by only knee muscles.
EMG activity was recorded from several muscles that cross both the knee and hip, affecting the net knee moment, yet their power production has been reported previously [39,40]. The rectus femoris (RF) power was out of phase with the other quadriceps muscles (VL, VI, VMO). RF is unique among the knee extensors as it is biarticular, and previous work has demonstrated its primary (perhaps only) role in gait is as a hip flexor [42]. Tensor Fascia Lata provides a modest amount of power and is included in this analysis to compare EFP and KIN methods only. TFL gait power has been reported elsewhere [42]. Finally, gastrocnemius pre-swing power (MGAST, LGAST) directly results in knee flexion [41]. Neither MGAST nor LGAST is active in swing and thus does not contribute to the knee flexion observed during that gait period. The power produced by these plantar flexor muscles has also been reported elsewhere [42].
3.5. Assessment of Model (Analysis)
The Pearson correlation coefficient (r) was used to measure the variance of the two values at the knee.
where xi and yi are the data points, x and y are the mean of the x- and y-values, respectively. Data inspection suggested that the model and experimental data satisfied parametric statistical assumptions [77]. The correlation between EFP and KIN knee power was calculated, and consistent with other EMG-to-Force Processing models, an r > 0.70 was required for acceptance of the Model.
4. Results
The EMG-to-Force Processing (EFP) and Kinematics plus Kinetics (KIN) power curves were highly correlated (r = 0.81; Figure 4), which satisfies Equation (2). EFP showed slightly greater positive power than KIN in early swing, nearly identical power magnitude and direction in late swing (net difference < 2 W), with EFP power estimates—both positive and negative—were more modest than KIN values in the weight acceptance and early single support phases.
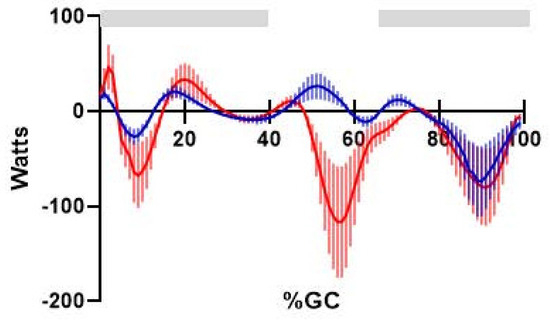
Figure 4.
Comparison of knee power produced by EFP (blue solid line, ±one standard deviation) and KIN methods (red solid line, ±one standard deviation). Percents gait cycle is shown on the abscissa. Horizontal bars (gray) indicate the EFP versus KIN analysis interval, where power is produced by muscles crossing the knee.
Terminal swing showed the highest values for negative power for knee muscles, demonstrated by the hamstring muscles. Each of the hamstring muscles (peak power SMEMB, −55 W; BFLH, −24 W; STEND, <−10 W) showed negative power in swing to slow ipsilateral knee extension in preparation for the subsequent stance phase. STEND produced more positive power than negative power, in contrast with the other hamstring muscles, but its power production always had similar timing and direction (if not magnitude) as the other hamstring muscles. In each case, the negative power in swing was used to decelerate what is essentially passive knee extension, then positive power in weight acceptance (SMEMB > BFLH > STEND) to extend the hip [43] (Figure 5). The hamstrings do not appear to have a role at the knee during stance.
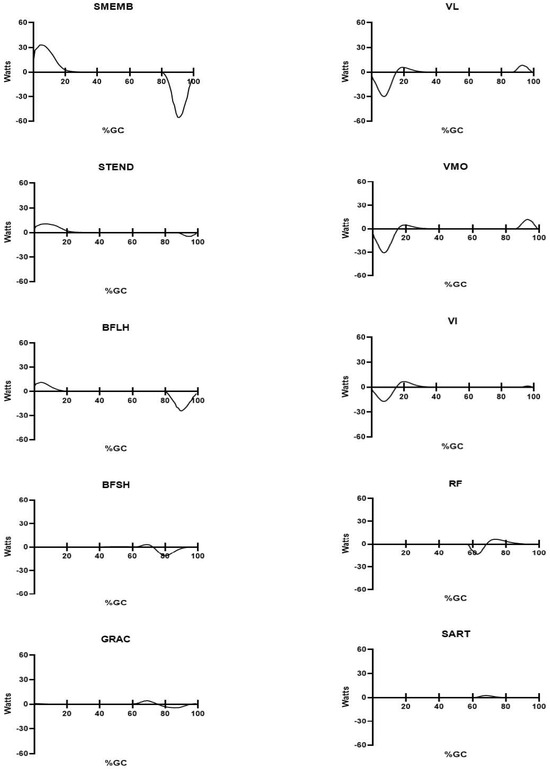
Figure 5.
Mean power produced during self-selected walking for the ten muscles crossing the knee. The percent gait cycle is shown on the abscissa; power produced by each muscle (in Watts) is shown on the ordinate. All figures are identically scaled. Stance phase duration is approximately 60%GC.
Smaller magnitude positive power was produced by the quadriceps muscles in swing (all < 13 Watts, with VMO > VL > VI) (Figure 5). Knee extensor power transitioned from positive (late swing, above) to negative power in the subsequent ipsilateral stance phase. VMO and VL each produced peak power larger peak power (≈−30 Watts) with VI producing slightly less negative power (−17 W).
Other muscles that cross the knee produce substantially lesser amounts of peak (positive) power, and their respective power production is essentially limited to early swing (during what is mostly passive knee flexion). Peak power for these muscles was <5 Watts, each (GRAC < 4 W: BFSH < 3 W, and SART slightly more than 2 W).
Ankle plantar flexors produce a substantial amount of force and power and were included in the net EFP power estimates. Their greatest power production was in late single support and pre-swing (Figure 5). The positive power produced in pre-swing is related to their role at the ankle and is discussed in greater detail elsewhere [39,42].
Unlike muscles crossing the hip [40], each of the knee muscles has simpler architecture. That is, they all have a single innervation source, and distinct functional segments have not been reported for any of these muscles. However, one knee muscle—the popliteus—was notable for nearly as many EMG firing patterns as study participants. Variations included (a) activity throughout the entire gait cycle, (b) a paucity of EMG activity in both stance and swing at the other extreme, and (c) individuals with popliteus EMG (and presumably, force and power) in either stance or swing. In each case, the amplitude of the EMG signal was small, as would be force and power regardless of EMG timing. Thus, in the absence of a consistent pattern and little likely direct input to knee motion, further analysis of this muscle was not performed.
5. Discussion
5.1. Power Production by Individual Muscles
The integration of muscle work and power allows us to have an improved understanding of each muscle’s role at each joint crossed. The mechanical behavior of the lower extremities in gait is like that of an inverted triple pendulum. That is, power (and motion) produced at an adjacent joint may affect the kinematics of the adjacent joint via transfer of energy across segments [18]. This is particularly evident during the pre-swing and early swing phases of gait, as the adjacent ankle and, to a lesser extent, hip joint muscle forces and power influence knee kinematics.
While active knee flexor and extensor power is largely limited to late swing, it is instructive to examine joint power in pre-swing and early swing, where power is independent of activity by muscles crossing the knee. Pre-swing positive plantar flexion power initiates knee flexion [39]. Hip flexion continues into early swing to advance the ipsilateral, trailing limb. Here, hip flexion also coincides temporally with negative power by muscles and soft tissues crossing the hip [43]. Thus, the substantial power produced by the planter flexors may also initiate hip flexion. As ipsilateral stance transitions to swing, positive hip muscle power begins due to concentric contractions by both rectus femoris and iliopsoas, and positive hip power continues into mid-swing (approximately 75%GC [43]).
Positive hip power advances the ipsilateral limb in early swing [42]. As noted, muscles that do not span a joint can contribute to forces and moments a that joint [42]. The biarticular hamstrings, via their effect on slowing hip flexion (via negative power), result in passive knee extension as energy is transferred across segments. Hamstrings’ negative power continues through the swing. Later in the swing (≈90%GC), positive power is produced by the vastus muscles to enhance the swing phase knee extension. This relatively small amount of positive power (Figure 5) slightly increases step length to increase walking velocity.
The roles of both hamstrings and vastus muscles change abruptly at the transition from swing to stance. The hamstrings are lengthened throughout the swing phase, with their MTU length at ≈105% L0 at the transition from swing to stance (Figure 6). As stance commences, these muscles continue to produce force, yet now concentrically contracting (positive power). This initiates hip extension, which continues through stance as the body’s center of mass horizontally translates over the fixed foot. The hamstrings’ collective role at the hip is described in greater detail elsewhere [40], and they have no active role at the knee during the remainder of stance.
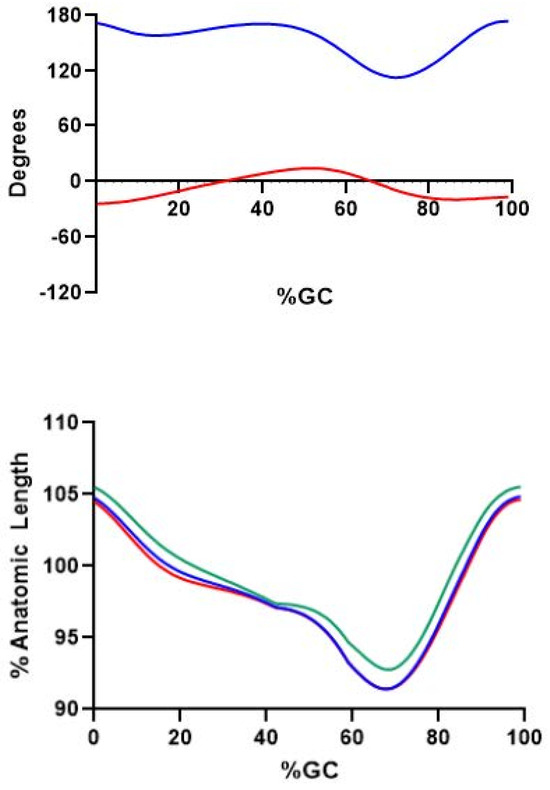
Figure 6.
(Upper): Knee (solid blue line) and hip (solid red line) sagittal plane angles during gait. Percent gait cycle is shown on the abscissa. Positive values indicated extension of the respective joint(s). (Lower): Percent anatomic length (L0) for three hamstring muscles during gait. SMEMB (solid blue line), STEND (solid green line), and BFLH (solid red line) are shown.
The transition from swing to stance also changes the role of the vastus muscles. Positive power began in late swing to maximize step length and is likely to prepare for the mechanical demands of the subsequent stance phase. However, vastus power turns from positive to negative at the transition from swing to stance. All vastus muscles are lengthened in weight acceptance, and with force production produce negative power to regulate stance phase knee flexion.
A slight amount of positive vastus power is produced in stance, progressing from initial double support to single limb support. After a brief period of positive power (18–30%GC), knee extension continues. The forward progression of the body’s center of mass over the fixed-in-space foot extends the knee without the need for active muscle forces or power.
5.2. Closeness of Fit and Potential Error Sources
One goal of this research was to examine whether a method could be developed to yield reasonable estimates of in vivo muscle power from a unique study participant’s EMG and anthropometry applied to a generic muscle model. The closeness of fit between the EFP and KIN power curves during the assessment interval indicates that the EFP power estimates are credible. In theory, a comparison of directly measured muscle power with the EMG-to-force processing model estimates would be the preferred way to validate this model. However, direct measurement of in vivo muscle power for muscles crossing the human knee is not possible. Thus, inverse dynamics are often used as a proxy. The fact that the net EFP and KIN knee power curves, when the muscles were known to be active as demonstrated by EMG, were closely correlated and comparable in magnitude supports the use of EFP to establish representative estimates of knee muscle power. Potentially, self-canceling errors could be present, yet the closeness of fit between the EFP and KIN power curves (when muscles were known to be active) indicates that the power estimates for individual muscles are acceptable. One important aspect of the RFP approach is that the power of individual muscles can be determined. Notably, all input variables to the model (electromechanical delay, percent maximum voluntary contraction) were determined a priori, and thus this approach was not a curve-fitting exercise.
Previous efforts at EMG-to-force processing have generally been limited to predictions of muscle force (not power) [9,10,11,12,13,14,38,39,40]. Hof and colleagues made the largest contribution to our understanding of EMG-to-force processing [11,12,13,14,27]. They noted that “what makes this line of work so interesting is that one can in fact ‘see’ not the muscle itself and in that way gain insights about, not only how movements are performed, but also why they are performed in the way that they are” [10]. A perfect neuromuscular model—one that can accurately predict muscle forces across the spectrum of human movements—does not exist. Like all models the EFP approach has built-in “error sources”.
It is possible that the predicted power (via EFP) is closer to actual power produced for some muscles and less so for others. Muscle fiber type, physiological cross-sectional area [52], optimal muscle fiber length [53,78], and tendon slack length [51] are well-established and can influence muscle power. Other muscle properties that can influence power output include activation dynamics and MTU length rate-of-change and are less well-defined in gait and thus warrant further investigation. Estimates of muscle force per percent gait cycle are dependent on voluntary contraction efforts that represent 100% maximum force output. Observed muscle forces (and power) were dependent on accurate maximum muscle tests (MMT) to scale muscle–tendon unit forces. The obvious risk is that the MMT may not represent true maximum effort and could result in an overestimate of MTU forces and power. The muscles tested are large and powerful in this subject population, and it is technically difficult to obtain a “true” 100%MVC for several muscles tested. Substantial efforts were made to minimize this risk, including careful positioning of the limb during muscle testing [63] and using the larger value pre- or post-test MMT as a reference. Visual examination of the EFP and KIN power curves indicates that errors in muscle force and power amplitude were minor. The slight error in normalizing the EMG signal would lead to slightly liberal estimates of these muscles throughout the gait cycle.
Knee muscles are typically eccentrically contracted, then concentrically contracted, during gait. The tendons have some compliance, and the in-series tendons can store—and later release—elastic energy to change the rate of muscular work [51]. Energy can also be stored in the cross-bridge heads during eccentric contractions, later released to augment muscle force during the concentric contraction that immediately follows [4]. The muscle contraction history was accounted for in the EFP model [39].
Muscle contraction velocity can affect power estimates. While normal gait, examined here, is notable for relatively slow muscle contractions and thus minimal error in predicting individual muscle power, one should exercise caution when extrapolating this approach to more dynamic movements.
Intramuscular (“wire”) electrodes were required to minimize crosstalk and to record activity from deep muscles. A concern has been extrapolating the results are extrapolated from the smaller muscle volume examined (as compared to surface EMG recordings). This is a reasonable concern, yet generalizing the wire EMG data to the entire muscle (in neurologically intact individuals) is well-supported in the literature [39,41,79,80,81,82,83,84]. Previous work has demonstrated that the normalized EMG amplitude is not significantly different for wire versus surface electrodes [85]. Surface electrodes could have been used to record data from superficial muscles but could not have been used to record data from deep muscles (e.g., Vastus Intermedius). Thus, a single electrode type—intramuscular (wire) electrodes—was used to examine all tested knee muscles to remove a potential confound.
6. Conclusions and Future Directions
A surprising portion of the gait cycle has relatively large knee motion, particularly in the sagittal plane, with a paucity of corresponding muscle power. This period, roughly from late single support (38%GC) to mid swing (68%GC), shows knee motion that is generated by muscles acting at either the ankle (single support) or hip (swing phase). This is an important finding, as robotic devices now being introduced into rehabilitation therapies typically employ a knee actuator to generate this motion, will the power to move the joint is supplied in vivo by forces acting elsewhere.
Current gait analysis techniques (EMG, measurement of external forces, determination of joint moments) are extremely useful yet may not provide a picture complete enough for the best patient outcomes. Neuromuscular models hold great promise to enhance clinical decision-making, yet have not become established in routing movement analysis [1]. To date, modeling of the MTU has not been a routine part of the management of abnormal tone or other more general rehabilitation techniques. Knowledge of dysfunction by individual muscles is important, as they are addressed by surgeries such as tendon lengthening or transfer as part of a generalizable model for muscle force output after CNS injury [86,87,88]. This will likely be available in the foreseeable future; however, the determination of individual muscle forces and power in neurologically intact individuals is the necessary first step. A next phase in this process—not yet completed—is to create a neuromuscular model that is individually tailored; that is, unique to everyone, independent of age, gender, presence of CNS injuries, or other trauma. Unfortunately, that step is not yet available; thus, the information presented here, in addition to serving as a baseline for the determination of MTU forces and power, is likely currently limited to making improved choices in the selection of currently available rehabilitation therapies.
The Model predictions of ankle, knee, and hip muscle forces [39,40,41] and power [42,43] were limited to normal human gait, thus, relatively slow muscle contractions. Future work will likely require enhanced collaboration between clinicians and engineers (or others with advanced technical expertise) [1]. Simplification of the models used—fewer degrees of freedom, fewer muscles examined—may also lead to increased use of models as an adjunct for the purpose of clinical decision-making.
Funding
This research received no external funding.
Institutional Review Board Statement
The data collection and processing used in this research were approved by the Rehabilitation Research Institute (RRI) of the Rancho Los Amigos National Rehabilitation Hospital in accordance with the Declaration of Helsinki Ethical Guidelines for research. The RRI is the Institutional Review Board (IRB) for that hospital.
Informed Consent Statement
No information was published that could potentially identify an individual. Written consent was obtained from all study participants, and the contents of the submitted manuscript were shared with all study participants. The study participants granted permission to publish in all cases.
Data Availability Statement
Original data are available upon reasonable request.
Acknowledgments
The author acknowledges the contribution of Lee Barnes to this and prior manuscript, who provided the computer code, ultimately used for data analysis.
Conflicts of Interest
The author declares no conflicts of interest.
Abbreviations
| BFLH | Long Head of the Biceps Femoris |
| BFSH | Short Head of the Biceps Femoris |
| EFP | EMG-to-Force Processing |
| EMD | Electromechanical Delay |
| EMG | Electromyogram |
| GC | Gait Cycle |
| GRAC | Gracilis |
| GRF | Ground Reaction Force |
| Hz | Hertz |
| Kg | Kilograms |
| KIN | Combination of Kinetics plus Kinematics |
| LE | Linear Envelope |
| LGAST | Lateral Gastrocnemius |
| M | Moment |
| MGAST | Medial Gastrocnemius |
| MMT | Maximum Muscle Test |
| MTU | Muscle–Tendon Unit |
| MVC | Maximum Voluntary Contraction |
| POP | Popliteus |
| RF | Rectus Femoris |
| SART | Sartorius |
| SMEMB | Semimembranosis |
| STEND | Semitendinosis |
| TFL | Tensor Fascia Lata |
| VI | Vastus Intermedius |
| VL | Vastus Lateralis |
| VMO | Vastus Medialis Oblique |
| %GC | Percent Gait Cycle |
References
- Trinler, U.; Hollands, L.; Jones, R.; Baker, R. A systematic review of approaches to modelling lower limb muscle forces during gait: Applicability to clinical gait analysis. Gait Posture 2018, 61, 353–361. [Google Scholar] [CrossRef] [PubMed]
- White, S.; Winter, D. Predicting muscle forces in gait from EMG signals and musculotendon kinematics. J. Electromyogr. Kinesiol. 1993, 2, 217–231. [Google Scholar] [CrossRef] [PubMed]
- Perry, J.; Weiss, W.; Burnfield, J.; Gronley, J. Determination of muscle and joint forces: A new technique to solve the indeterminate problem. Arch. Phys. Med. Rehabil. 2004, 85, 1335–1350. [Google Scholar]
- Cavagna, G.; Kaneko, M. Mechanical work and efficiency in level walking and running. J. Physiol. 1977, 268, 467–481. [Google Scholar] [CrossRef]
- DeVita, P.; Helseth, J.; Hortobagyi, T. Muscles do more positive than negative work in human locomotion. J. Exp. Biol. 2007, 210, 3361–3373. [Google Scholar] [CrossRef]
- Minetti, A. A model equation for the prediction of mechanical internal work of terrestrial locomotion. J. Biomech. 1998, 31, 463–468. [Google Scholar] [CrossRef]
- Cavagna, G.; Saibene, F.; Margaria, R. Mechanical work in running. J. Appl. Physiol. 1964, 19, 249–256. [Google Scholar] [CrossRef]
- Jacobs, R.; Bobbert, M.; van Ingen Schenau, G. Function of mono- and biarticular muscles in running. Med. Sci. Sports Exerc. 1993, 25, 1163–1173. [Google Scholar] [CrossRef]
- Hof, A.; Pronk, C.; van Best, J. Comparison between EMG to force processing and kinetic analysis for the calf muscle moment in walking and stepping. J. Biomech. 1987, 20, 167–178. [Google Scholar] [CrossRef]
- Hof, A. Assessment of muscle force in complex movements by EMG. In Biomechanics XI-A; deGroot, G., Hollander, A., Huijing, P., van Ingen Schenau, G., Eds.; University Park Press: Amsterdam, The Netherlands, 1990; pp. 111–117. [Google Scholar]
- Hof, A.; van den Berg, J. EMG to force processing I: An electrical analogue of the Hill muscle model. J. Biomech. 1981, 14, 747–758. [Google Scholar] [CrossRef]
- Hof, A.; van den Berg, J. EMG to force processing II: Estimation of parameters of the Hill muscle model for the human triceps surae by means of a calfergometer. J. Biomech. 1981, 14, 759–770. [Google Scholar] [CrossRef] [PubMed]
- Hof, A.; van den Berg, J. EMG to force processing III: Estimation of model parameters for the human triceps surae muscle and assessment of the accuracy by means of a torque plate. J. Biomech. 1981, 14, 771–785. [Google Scholar] [CrossRef] [PubMed]
- Hof, A.; van den Berg, J. EMG to force processing IV: Eccentric-concentric contractions on a spring-flywheel set up. J. Biomech. 1981, 14, 787–792. [Google Scholar] [CrossRef] [PubMed]
- Arnold, A.; Thelen, D.; Schwartz, M.; Anderson, F.; Delp, S. Muscular coordination of knee motion during the terminal-swing phase of normal gait. J. Biomech. 2007, 40, 3314–3324. [Google Scholar] [CrossRef][Green Version]
- Sasaki, K.; Neptune, R.; Kautz, S. The relationships between muscle, external, internal and joint mechanical work during normal walking. J. Exp. Biol. 2009, 212, 738–744. [Google Scholar] [CrossRef]
- Sadeghi, H.; Allard, P.; Labelle, R.; Aissaoui, R.; Sadeghi, S.; Perrault, R. Relationship between ankle frontal muscle powers and three-D gait patterns. Am. J. Phys. Med. Rehabil. 2002, 81, 429–436. [Google Scholar] [CrossRef]
- Siegel, K.; Kepple, T.; Stanhope, S. Joint moment control of mechanical energy flow during normal gait. Gait Posture 2004, 19, 69–75. [Google Scholar] [CrossRef]
- Olney, S.; Griffin, M.; Monga, T.; McBride, I. Work and power in gait of stroke patients. Arch. Phys. Med. Rehabil. 1991, 72, 309–314. [Google Scholar]
- Vardaxis, V.; Allard, P.; Lachance, R.; Duhaime, M. Classification of able-bodied gait by using 3-D muscle powers. Hum. Mov. Sci. 1998, 17, 121–136. [Google Scholar] [CrossRef]
- Norris, J.; Granata, K.; Mitros, M.; Byrne, E.; Marsh, A. Effect of augmented plantar flexion power on preferred walking speed and economy in young and older adults. Gait Posture 2007, 25, 620–627. [Google Scholar] [CrossRef]
- Sadeghi, H.; Sadeghi, S.; Allard, P.; Labelle, H.; Duhaime, M. Lower limb muscle power relationships in bilateral able-bodied gait. Am. J. Phys. Med. Rehabil. 2001, 80, 821–830. [Google Scholar] [CrossRef] [PubMed]
- Gitter, A.; Czerniecki, J.; DeGroot, D. Biomechanical analysis of the influence of prosthetic feet on below-knee amputee walking. Am. J. Phys. Med. Rehabil. 1991, 70, 142–148. [Google Scholar] [CrossRef] [PubMed]
- Powers, C.; Torburn, L.; Perry, J.; Ayyappa, E. Influence of prosthetic foot design on sound limb loading in adults with unilateral below-knee amputations. Arch. Phys. Med. Rehabil. 1994, 75, 825–829. [Google Scholar] [CrossRef] [PubMed]
- Olney, S.; MacPhail, H.; Hedden, D.; Boyce, W. Work and power in hemiplegic cerebral palsy gait. Phys. Ther. 1990, 70, 431–438. [Google Scholar] [CrossRef]
- Kim, D.; KaLantri, A.; Guha, S.; Wainapel, S. Dorsal cutaneous nerve conduction: Diagnostic aid in ulnar neuropathy. Arch. Neurol. 1981, 38, 321–322. [Google Scholar] [CrossRef]
- Hof, A.; van den Berg, J. EMG to force processing under dynamic conditions. In Biomechanics VI-A; Komi, P., Ed.; University Park Press: Baltimore, MD, USA, 1978; pp. 221–228. [Google Scholar]
- Seirig, A.; Arkivar, R. A mathematical model for evaluation of forces in lower extremities of the musculo-skeletal system. J. Biomech. 1973, 6, 313–326. [Google Scholar] [CrossRef]
- Chao, E.-S.; Rim, K. Application of optimization principles in determining the applied moments in human leg joints during gait. J. Biomech. 1973, 6, 497–510. [Google Scholar] [CrossRef]
- Davy, D.; Audu, M. A dynamic optimization technique for predicting muscle foeces in the swing phae of gait. J. Biomech. 1987, 20, 187–201. [Google Scholar] [CrossRef]
- Herzog, W.; Leonard, T. Validation of optimization models that estimate forces exerted by synergistic muscles. J. Biomech. 1991, 24, 331–339. [Google Scholar] [CrossRef]
- Pedotti, A.; Krishnan, V.V.; Stark, L. Optimization of muscle-force sequencing in human locomotion. Math. Biosci. 1978, 38, 57–76. [Google Scholar] [CrossRef]
- Flaxman, T.; Speirs, A.; Benoit, D. Joint stabilizers of moment actuators: The role of knee joint muscles while weight-bearing. J. Biomech. 2012, 45, 2570–2576. [Google Scholar] [CrossRef] [PubMed]
- Falconer, K.; Winters, D. Quantitative assessment of co-contraction at the ankle joint in walking. Electromyogr. Clin. Neurophysiol. 1985, 25, 135–149. [Google Scholar] [PubMed]
- Hughes, R.; Bean, J.; Chaffin, D. Evaluating the effect of co-contraction in optimization models. J. Biomech. 1995, 7, 875–878. [Google Scholar] [CrossRef] [PubMed]
- Hatze, H. The complete optimization of a human motion. Math. Biosci. 1976, 28, 99–135. [Google Scholar] [CrossRef]
- McGill, S.; Chaimberg, J.; Frost, D.; Fenwick, C. Evidence of a double peak in muscle activation to enhance strike speed and force: An example with elite mixed martial arts fighters. J. Strength Cond. Res. 2010, 24, 348–357. [Google Scholar] [CrossRef]
- Bogey, R.; Perry, J.; Gitter, A. An EMG-to-force processing approach for determining ankle muscle forces during normal human gait. IEEE Trans. Neural Syst. Rehabil. Eng. 2005, 13, 302–310. [Google Scholar] [CrossRef]
- Bogey, R. An EMG-to-force processing approach to estimating knee muscle forces during adult, self-selected speed gait. Bioengineering 2023, 10, 980. [Google Scholar] [CrossRef]
- Bogey, R.; Barnes, L. An EMG-to-force processing approach for estimating in vivo hip forces in normal adult walking. IEEE Trans. Neural Syst. Rehabil. Eng. 2016, 25, 1172–1179. [Google Scholar] [CrossRef]
- Bogey, R.; Gitter, A.; Barnes, L. Determination of ankle muscle power in normal gait using an EMG-to-force processing approach. J. Electromyogr. Kinesiol. 2010, 20, 46–54. [Google Scholar] [CrossRef]
- Bogey, R.; Barnes, L. Estimates of individual muscle power production in normal walking. J. Neuroeng. Rehabil. 2017, 14, 92–100. [Google Scholar] [CrossRef]
- Murray, M. Gait as a total pattern of movement. Am. J. Phys. Med. 1967, 46, 290–326. [Google Scholar] [PubMed]
- Perry, J.; Bekey, G. EMG-Force relationships in skeletal muscle. CRC Crit. Rev. Biomed. Eng. 1981, 7, 1–22. [Google Scholar]
- Arsenault, A.; Winter, D.; Marteniuk, R. Is there a ‘normal’ profile of EMG activity in gait? Med. Biol. Eng. Comput. 1986, 24, 337–343. [Google Scholar] [CrossRef] [PubMed]
- Dempster, W. Space requirements of the seated operator. Geometrical, kinematic, and mechanical aspects of the body with special reference to the limbs. In Aero Medical Laboratory; WADC Technical Report 55–159; Wright Air Development Center, Air Research and Development Command, Wright-Patterson Air Force Base: Dayton, OH, USA, 1955; pp. 1–253. [Google Scholar]
- Delp, S.; Loan, J.; Hoy, M.; Zajak, F.; Topp, E.; Rosen, J. An interactive graphics-based model of the lower extremity to study orthopaedic surgical procedures. IEEE Trans. Biomed. Eng. 1990, 37, 757–767. [Google Scholar] [CrossRef]
- Delp, S.; Loan, J. A graphics-based software system to develop and analyze models of musculoskeletal structures. Comput. Biol. Med. 1995, 25, 21–34. [Google Scholar] [CrossRef]
- Fox, M.; Reinbolt, J.; Ounpuu, S.; Delp, S. Mechanisms of improved knee function after rectus femoris transfer surgery. J. Biomech. 2009, 42, 614–619. [Google Scholar] [CrossRef]
- Hill, A. The heat of shortening and the dynamic constants in muscle. Proc. R. Soc. (Biol.) 1938, 126, 136–195. [Google Scholar]
- Hoy, H.; Zajac, F.; Gordon, M. A musculoskeletal model of the human lower extremity: The effect of muscle, tendon, and moment arm on the moment-angle relationship of musculotendon actuators at the hip, knee, and ankle. J. Biomech. 1990, 23, 157–169. [Google Scholar] [CrossRef]
- Wickiewicz, T.; Roy, R.; Powell, P.; Edgerton, V. Muscle architecture of the human lower limb. Clin. Orthop. Relat. Res. 1983, 179, 275–283. [Google Scholar] [CrossRef]
- Friedrich, J.; Brand, R. Muscle fiber architecture in the human lower limb. J. Biomech. 1990, 23, 91–95. [Google Scholar] [CrossRef]
- Gordon, A.; Huxley, A.; Julian, P. The variation in isometric tension with sarcomere length in vertebrate muscle fibers. J. Physiol. 1966, 184, 170–192. [Google Scholar] [CrossRef] [PubMed]
- Page, S.; Huxley, H. Filament lengths in striated muscle. J. Cell Biol. 1963, 19, 369–390. [Google Scholar] [CrossRef] [PubMed]
- Cavagna, G. Storage and utilization of elastic energy in skeletal muscle. Exerc. Sports Sci. Rev. 1977, 5, 89–129. [Google Scholar] [CrossRef]
- Park, T.; Harris, G. Guided intramuscular fine wire electrode placement: A new technique. Am. J. Phys. Med. Rehabil. 1996, 75, 232–234. [Google Scholar] [CrossRef]
- Basmajian, J.; Stedio, G. A new bipolar indwelling electrode for electromyography. J. Appl. Physiol. 1962, 17, 849–858. [Google Scholar] [CrossRef]
- Perry, J.; Hoffer, M. Preoperative and postoperative dynamic electromyography as an aid in planning tendon transfers in children with Cerebral Palsy. J. Bone Jt. Surg. 1977, 59, 531–537. [Google Scholar] [CrossRef]
- Hislop, H.; Montgomery, J. Daniels and Worthingham’s Muscle Testing: Techniques of Manual Examination; WB Saunders Company: Philadelphia, PA, USA, 2007. [Google Scholar]
- Perry, J.; Ireland, M.; Gronley, J.; Hoffer, M. Predictive value of manual muscle testing and gait analysis in normal ankles by electromyography. Foot Ankle 1986, 6, 254–259. [Google Scholar] [CrossRef]
- Perry, J.; Bontrager, E.; Bogey, R.; Gronley, J.; Barnes, L. The Rancho EMG Analyzer: A computerized system for gait analysis. J. Biomed. Eng. 1993, 15, 487–496. [Google Scholar] [CrossRef]
- Bogey, R.; Barnes, L.; Perry, J. A computer algorithm for determining the group electromyographic profile from individual gait EMG profiles. Arch. Phys. Med. Rehabil. 1993, 74, 286–291. [Google Scholar]
- Milner-Brown, H.; Stein, R. The relation between the surface electromyogram and muscular force. J. Physiol. 1975, 246, 549–569. [Google Scholar] [CrossRef]
- Metral, S.; Cassar, G. Relationship between force and integrated EMG activity during voluntary isometric anisotonic contraction. Eur. J. Appl. Physiol. 1981, 46, 185–198. [Google Scholar] [CrossRef] [PubMed]
- Crosby, P. Use of surface electromyography as a measure of dynamic force in human limb muscles. Med. Biol. Eng. Comput. 1978, 16, 519–524. [Google Scholar] [CrossRef] [PubMed]
- Milner-Brown, H.; Stein, R.; Yemm, R. Changes in firing rate of human motor units during linearly changing voluntary contractions. J. Physiol. 1973, 230, 371–390. [Google Scholar] [CrossRef] [PubMed]
- Milner-Brown, H.; Stein, R.; Yemm, R. The contractile properties of human motor units during voluntary isometric contractions. J. Physiol. 1973, 228, 285–306. [Google Scholar] [CrossRef]
- Anderson, F.; Goldberg, S.; Pandy, M.; Delp, S. Contributions of muscle forces and toe-off kinematics to peak knee flexion during the swing phase of normal gait: An induced position analysis. J. Biomech. 2004, 37, 731–737. [Google Scholar] [CrossRef]
- Kerrigan, D.; Roth, R.; Riley, P. The modelling of adult spastic paretic stiff-legged gait swing period based on actual kinematic data. Gait Posture 1998, 7, 117–124. [Google Scholar] [CrossRef]
- Piazza, S.; Delp, S. The influence of muscles on knee flexion during the swing phase of gait. J. Biomech. 1996, 29, 723–733. [Google Scholar] [CrossRef]
- Yoon, Y.; Mansour, J. The passive elastic moment at the hip. J. Biomech. 1982, 15, 905–910. [Google Scholar] [CrossRef]
- Silder, A.; Heiderscheit, B.; Thelen, D. Active and passive contributions to joint kinetics during walking in older adults. J. Biomech. 2008, 41, 1520–1527. [Google Scholar] [CrossRef]
- Perry, J. Gait Analysis: Normal and Pathological Function; McGraw-Hill, Inc.: New York, NY, USA, 1992. [Google Scholar]
- Neptune, R.; Zajac, F.; Kautz, S. Muscle force redistributes segmental power for body progression during walking. Gait Posture 2004, 19, 194–205. [Google Scholar] [CrossRef]
- Pandy, M.; Andriacchi, T. Muscle and joint function in human locomotion. Annu. Rev. Biomed. Eng. 2010, 12, 401–433. [Google Scholar] [CrossRef] [PubMed]
- Kirk, R. Experimental Design: Procedures for the Behavioral Sciences; Wadsworth Publishing Company: Belmont, CA, USA, 1968; p. 577. [Google Scholar]
- Griffiths, R. Shortening of muscle fibres during stretch of the active cat medial gastrocnemius muscle: The role of tendon compliance. J. Physiol. 1991, 436, 219–236. [Google Scholar] [CrossRef] [PubMed]
- Bodine-Fowler, S.; Garfinkel, A.; Roy, R. Spatial distribution of muscle fibers within the territory of a motor unit. Muscle Nerve 1990, 13, 1133–1145. [Google Scholar] [CrossRef] [PubMed]
- Bouisset, S.; Maton, B. Quantitative relationship between surface EMG and intramuscular electromyographic activity in voluntary muscle. Am. J. Phys. Med. 1972, 51, 285–295. [Google Scholar]
- Perry, J.; Easterday, C.; Antonelli, D. Surface versus intramuscular electrodes for electromyography of superficial and deep muscles. Phys. Ther. 1981, 61, 7–15. [Google Scholar] [CrossRef]
- Kadaba, M.; Wooten, M.; Gainey, J.; Cochran, G. Repeatability of phasic muscle activity: Performance of surface and intramuscular wire electrodes in gait analysis. J. Orthop. Res. 1985, 3, 350–359. [Google Scholar] [CrossRef]
- Bradford, J.; Tweedell, A.; Leahy, L. High-density surface and intramuscular EMG data from the tibialis anterior during dynamic contractions. Sci. Data 2023, 10, 434. [Google Scholar] [CrossRef]
- Hofste, A.; Soer, R.; Salomons, E.; Peuscher, J.; Wolff, A.; van der Hoeven, H. Intramuscular EMG versus surface EMG of lumbar multifidus and erector spinae in healthy participants. Spine 2020, 45, E1319–E1325. [Google Scholar] [CrossRef]
- Bogey, R.; Cerny, K.; Mohammed, O. Repeatability of wire and surface electrodes in gait. Am. J. Phys. Med. Rehabil. 2003, 82, 338–344. [Google Scholar] [CrossRef]
- Delp, S.; Ringewski, D.; Carroll, N. Transfer of the rectus femoris: Effects of transfer site on moment arms about the knee and hip. J. Biomech. 1994, 27, 1201–1211. [Google Scholar] [CrossRef]
- Delp, S.; Slater, K.; Carroll, N. Preserving plantarflexion strength after surgical treatment for contracture of the triceps surae: A computer simulation study. J. Orthop. Res. 1994, 13, 96–104. [Google Scholar] [CrossRef]
- Delp, S. Surgery Simulation: A Computer Graphics System to Analyze and Design Musculoskeletal Reconstructions of the Lower Limb. Doctoral Dissertation, Stanford University, Stanford, CA, USA, 1990. [Google Scholar]
Disclaimer/Publisher’s Note: The statements, opinions and data contained in all publications are solely those of the individual author(s) and contributor(s) and not of MDPI and/or the editor(s). MDPI and/or the editor(s) disclaim responsibility for any injury to people or property resulting from any ideas, methods, instructions or products referred to in the content. |
© 2025 by the author. Licensee MDPI, Basel, Switzerland. This article is an open access article distributed under the terms and conditions of the Creative Commons Attribution (CC BY) license (https://creativecommons.org/licenses/by/4.0/).