1. Introduction
Electromyography (EMG) is a technique for detecting depolarization and repolarization that occur on the sarcolemma of the skeletal muscle fiber. It is used to diagnose muscle conditions and motor nerves that transmit electrical signals to initiate muscle contraction [
1,
2,
3]. The analysis of electrical signals is commonly used in both post-traumatic and neurological rehabilitation and is becoming increasingly common in sports [
4,
5,
6]. The EMG signal can be recorded by needle electrodes inserted through the skin into muscle tissue or electrodes placed on the skin above the measured muscle. In the latter case, the recorded signal is a superposition of individual motor unit action potential (MUAP) [
7]. This method of EMG signal acquisition is referred to as surface EMG (sEMG).
Surface EMG is often utilized in sports and physiotherapy [
8] due to its non-invasive nature. In sports, for example, the standard Functional Movement Screen (FMS) exercises (one of them is the overhead deep squat) are a screening method used to assess the proper functioning and condition of the muscular system of an amateur trainer or athlete [
6,
9]. In physical therapy, in turn, assessing the correctness of the exercise is crucial for the effectiveness of therapy and patient safety.
The main goal of our work is to evaluate the parameters determined on the basis of sEMG, which could support objective analysis of muscle work during FSM exercises, especially in overhead deep squat. We are looking for the parameters that correlate well with how properly the deep squat is performed. In the future, the determined parameters could help in predicting and preventing injuries and also support movement optimization. Finding the appropriate parameters for monitoring fatigue and training effectiveness, allowing for personalization and improvement of athletes’ training, is a difficult task; however, our attempt may contribute to supporting the efforts made in this field. Below, we present some literature reports on this topic. The correctness of physical exercises, for example, squats, is very often assessed by physiotherapists who evaluate parameters such as stance width, foot rotation, trunk position, tibia position, squat depth, and others [
10]. There is also a great deal of the literature in which we can find studies on assessing the correctness of exercise performance based on the analysis of sEMG signals [
11]. For example, in [
12], step-up included the step-up, crossover step-up, diagonal step-up, and lateral step-up exercises, in which the activation of the chosen muscles was studied. The authors filtered sEMG signals with a band-pass filter of 10 to 450 Hz and used the magnitude of muscle excitation, which was represented by the root mean square (RMS) (125-millisecond moving window) of sEMG and expressed as a percentage of maximal voluntary isometric contraction (MVIC). The measure of the relative contributions of four hip and thigh muscles while performing squats at three depths was examined in [
13]. In that paper, no details regarding sEMG signal processing were given. However, the signals were normalized by being expressed as a percent contribution to the total electrical activity of all the muscles examined. Muscle recruitment in the back squat was presented in [
14]. To obtain the envelope of sEMG, the authors applied the bandpass filter at 10 to 450 Hz and smoothed the signal using the RMS algorithm with a 50 ms window time. In [
15], the authors compared the muscle activation level during barbell deadlift and hex bar deadlift exercises. The sEMG signals were converted to root mean square signals (using a hardware circuit network (100 ms window)) and sampled at 100 Hz using a 16-bit A/D converter. The back squat and barbell were analyzed in [
16]. The authors first filtered the sEMG using a 10–500 Hz bandpass filter, next used full-wave rectification, and then smoothed the data using RMS with a 100 ms window, and the peak data were normalized to a mean peak of a 1000 ms window from MVIC. Three exercises, monopodal squat, forward lunge, and lateral step-up exercises, were analyzed in [
17]. To process the sEMG signal, the authors applied the RMS algorithm and normalized the smoothed signal by MVIC value.
The overhead deep squat is also one of the exercises that is very often used as a fitness test, as it requires flexibility and mobility in the hips, knees, ankles, and lower back strength to drop into the squat, hold it, and rise [
18]. The squat is one of the most commonly prescribed exercises in the rehabilitation process [
10]. Muscle activation patterns based on the sEMG signal during different squat techniques are studied in [
19]. The authors draw attention to the fact that although many sports medicine and performance professionals encourage patients to execute squats, there is rather little information regarding differences in muscle activation patterns in the lower limbs during squats. Meanwhile, a poorly performed squat may expose the lower limb joints to excessive torques, which may require adaptive muscle activation strategies to stabilize the lower limb joints.
Since the assessment of the correctness of exercise performance by physiotherapists may be subjective, we proposed some parameters based on the sEMG signal to support the assessment of the chosen muscles’ work in the overhead deep squat. In this paper, we focus on the statistical analysis of the excitation of selected muscles and parameters of sEMG signal recorded for athletes with different levels of correctness of overhead deep squat performance.
2. Materials and Methods
The analyzed muscles in this study were proposed by physiotherapists as the main muscles that should be activated in the overhead deep squat. There were three muscles in the lower part of the body, rectus femoris (RF), vastus medialis (VM), and biceps femoris (BF), and two in the upper part, deltoid muscle (D) and latissimus dorsi muscle (L). As well, the gluteus muscle (GM) was also considered in this analysis. In the next part of this article, we will use the term deep squat in place of overhead deep squat.
The proposed method focuses on the statistical analysis of the chosen muscles’ excitation expressed in the percentage of maximum voluntary contraction (%MVC) in reference to the level of correctness of the deep squat performance evaluated by the physiotherapists. In addition, the potential to differentiate the degree of correctness of deep squat performance based on the other sEMG parameters, such as mean frequency (
), median frequency (
), kurtosis (
), and co-activation index (
), was also examined. Frequency parameters in the sEMG signal provide information about the frequency characteristics of muscle activity, and their analysis allows for a better understanding of muscle function and changes related to fatigue. The co-activation index, in turn, provides quantitative information about the simultaneous activation of muscles during movement, in particular agonist and antagonist. In
Figure 1, we present the simplified workflow of this study.
2.1. Studied Group Characteristic
The %MVC,
,
,
, and
values were obtained as the results of analysis of the archival, raw sEMG signals. In this study, the sEMG signals recorded for 20 adult men were analyzed. The average age of the examined persons was 25.89 years (range: 23–29), and the average body mass index (BMI) was 24.78 kg/m
2 (range: 22.4–26.8). The study group consisted of representatives of various sports, including basketball players, volleyball players, and personal trainers. All participants train regularly as active sportsmen and have not suffered from previous injuries or contusions. According to the physiotherapists, the athletes selected for this study did not have over-trained muscles. During sEMG recordings, standard silver/chloride (Ag/AgCl) surface electrodes were used. The conductive surface of the electrode was about 38 mm
2. The electrodes were placed according to SENIAM (Surface Electromyography for the Non-Invasive Assessment of Muscles) recommendations [
20]. Examples of actual electrode placement are shown in
Figure 2. The sEMG signals were acquired with the VICON system, with the sampling frequency set at 1000 Hz, and processed in MATLAB (R2023a).
In these studies, the correctness of the deep squat performance was assessed by physiotherapists on a point scale, which was based on 13 dichotomous variables with Yes/No (1/0) categories. Finally, the obtained sum of scores from the deep squat assessment was rescaled to a percentage scale from 0% to 100%. Physiotherapists evaluated the view of the front, side, and back, as well as the trunk, shoulders, and depth of squat, which is the usual procedure described in the literature [
21,
22]. A detailed description of the criteria for physiotherapist assessment is presented in
Table 1.
According to the physiotherapists’ assessment, three groups were distinguished in the analyzed data: group 1, with the evaluation of the correctness of deep squat ranging from 23% to 54%; group 2 (62–77%), and group 3 (85–92%). The higher the group index, the more accurately the deep squat was performed.
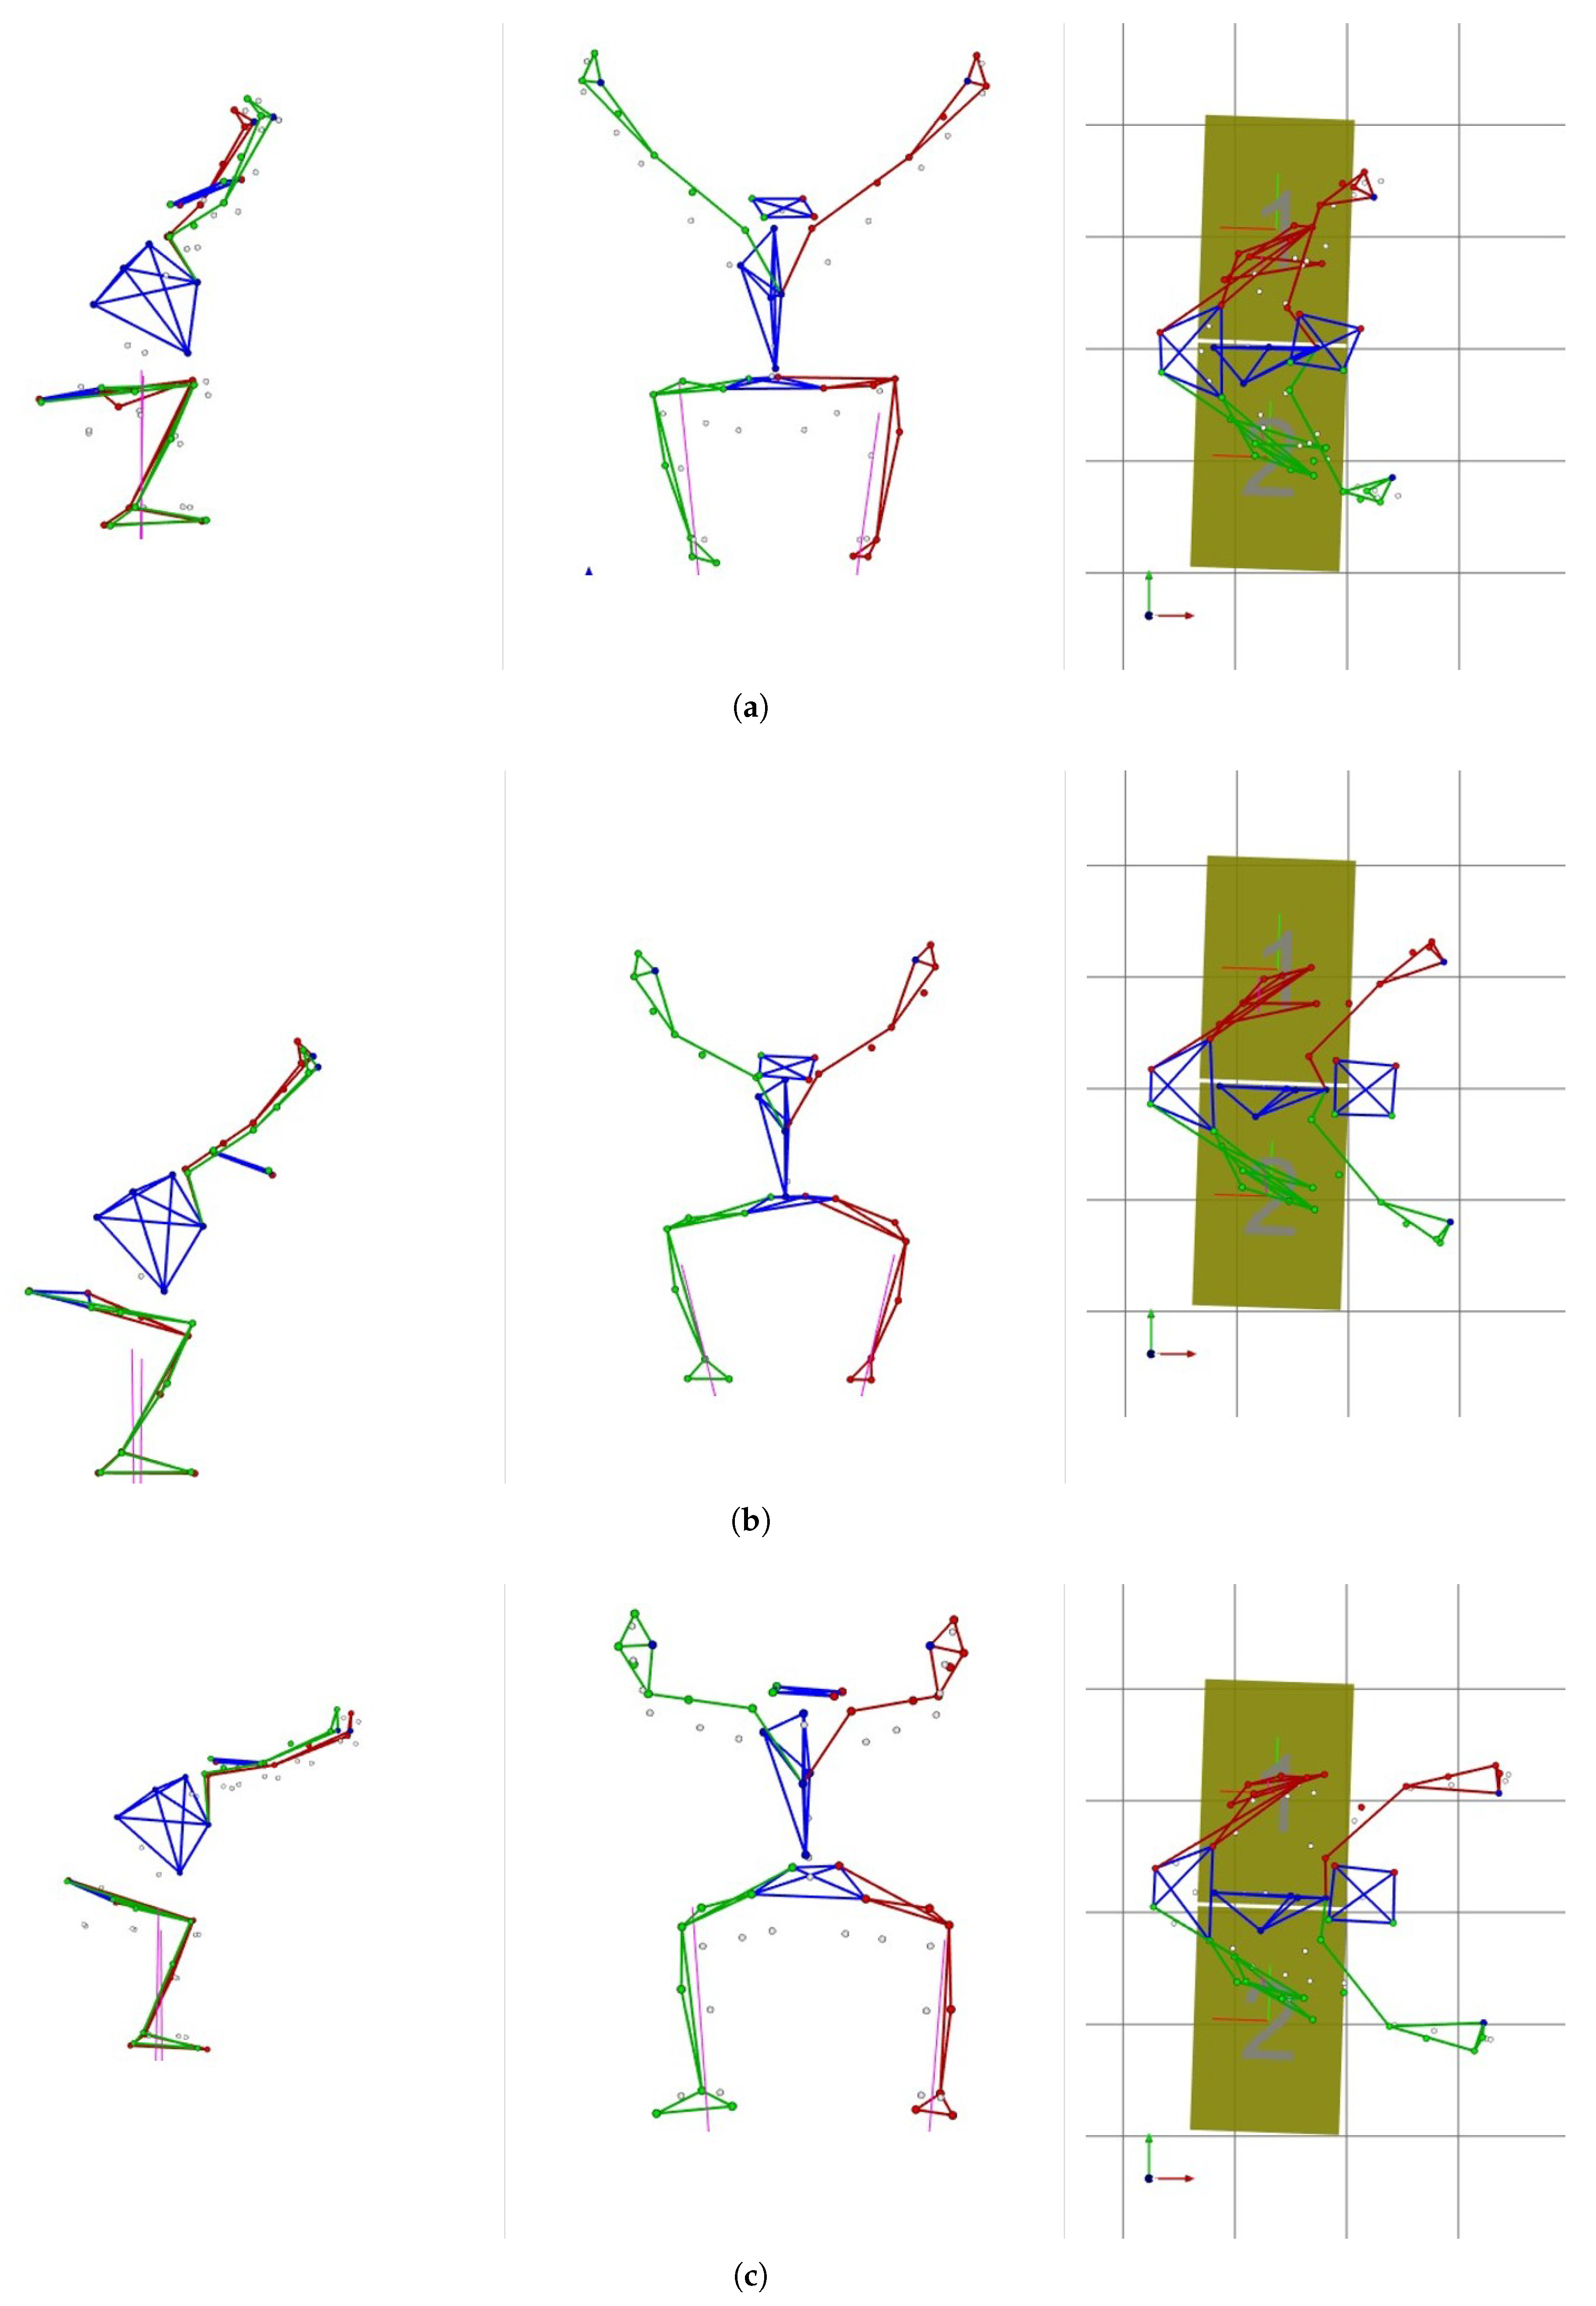
Examples of orthogonal views of right, front, and top projection during deep squat for each examined group are shown in
Figure 3. The presented drawings were created in MOKKA (Motion Kinematic & Kinetic Analyzer (ver. 0.6.2)) software based on the values of trajectory markers recorded during deep squat exercises with the VICON system.
The number of subjects in the indicated groups was 5, 11, and 4, respectively, which means a total of 240 sEMG signals were analyzed (20 subjects × 2 (left and right sides) × 6 muscles).
2.2. Investigated Parameters Description
2.2.1. Maximum Voluntary Contraction
Maximum voluntary contraction (MVC) was determined for each muscle under consideration using sEMG signals recorded during deep squat. Then, MVC values were normalized to obtain the %MVC parameters. The MVC normalization process divided MVC by the maximum voluntary isometric contraction. To determine MVIC, an extra normalization sEMG signal was recorded for each considered muscle and subject involved in the experiment, before the deep squat performance. The participants were asked to generate a maximum voluntary isometric contraction for about 5 s, and this activity was repeated two times.
The main advantage of MVC normalization, pointed out in the literature [
7], is the fact that such normalization rescales the sEMG data and expresses them as a percentage of a reference value unique and standardized for all participants in the study. Such approaches eliminate any varying influence of local signal recording conditions, allowing a direct quantitative comparison of sEMG findings between subjects. In line with [
7], “Group statistics and normative data can be developed and statistically, be verified.” Determining the value of muscle excitation (ME) and MVC requires processing the sEMG signals, which involves removing artifacts by appropriate signal filtering and smoothing, for example, using a method based on the root mean square (RMS) calculation. Details regarding sEMG signal processing and determination of ME, MVC, and %MVC values are widely presented in the literature [
5,
23,
24,
25,
26].
In this work, to determine muscle excitation and maximum voluntary contraction, we used the method we proposed and described in the previous papers [
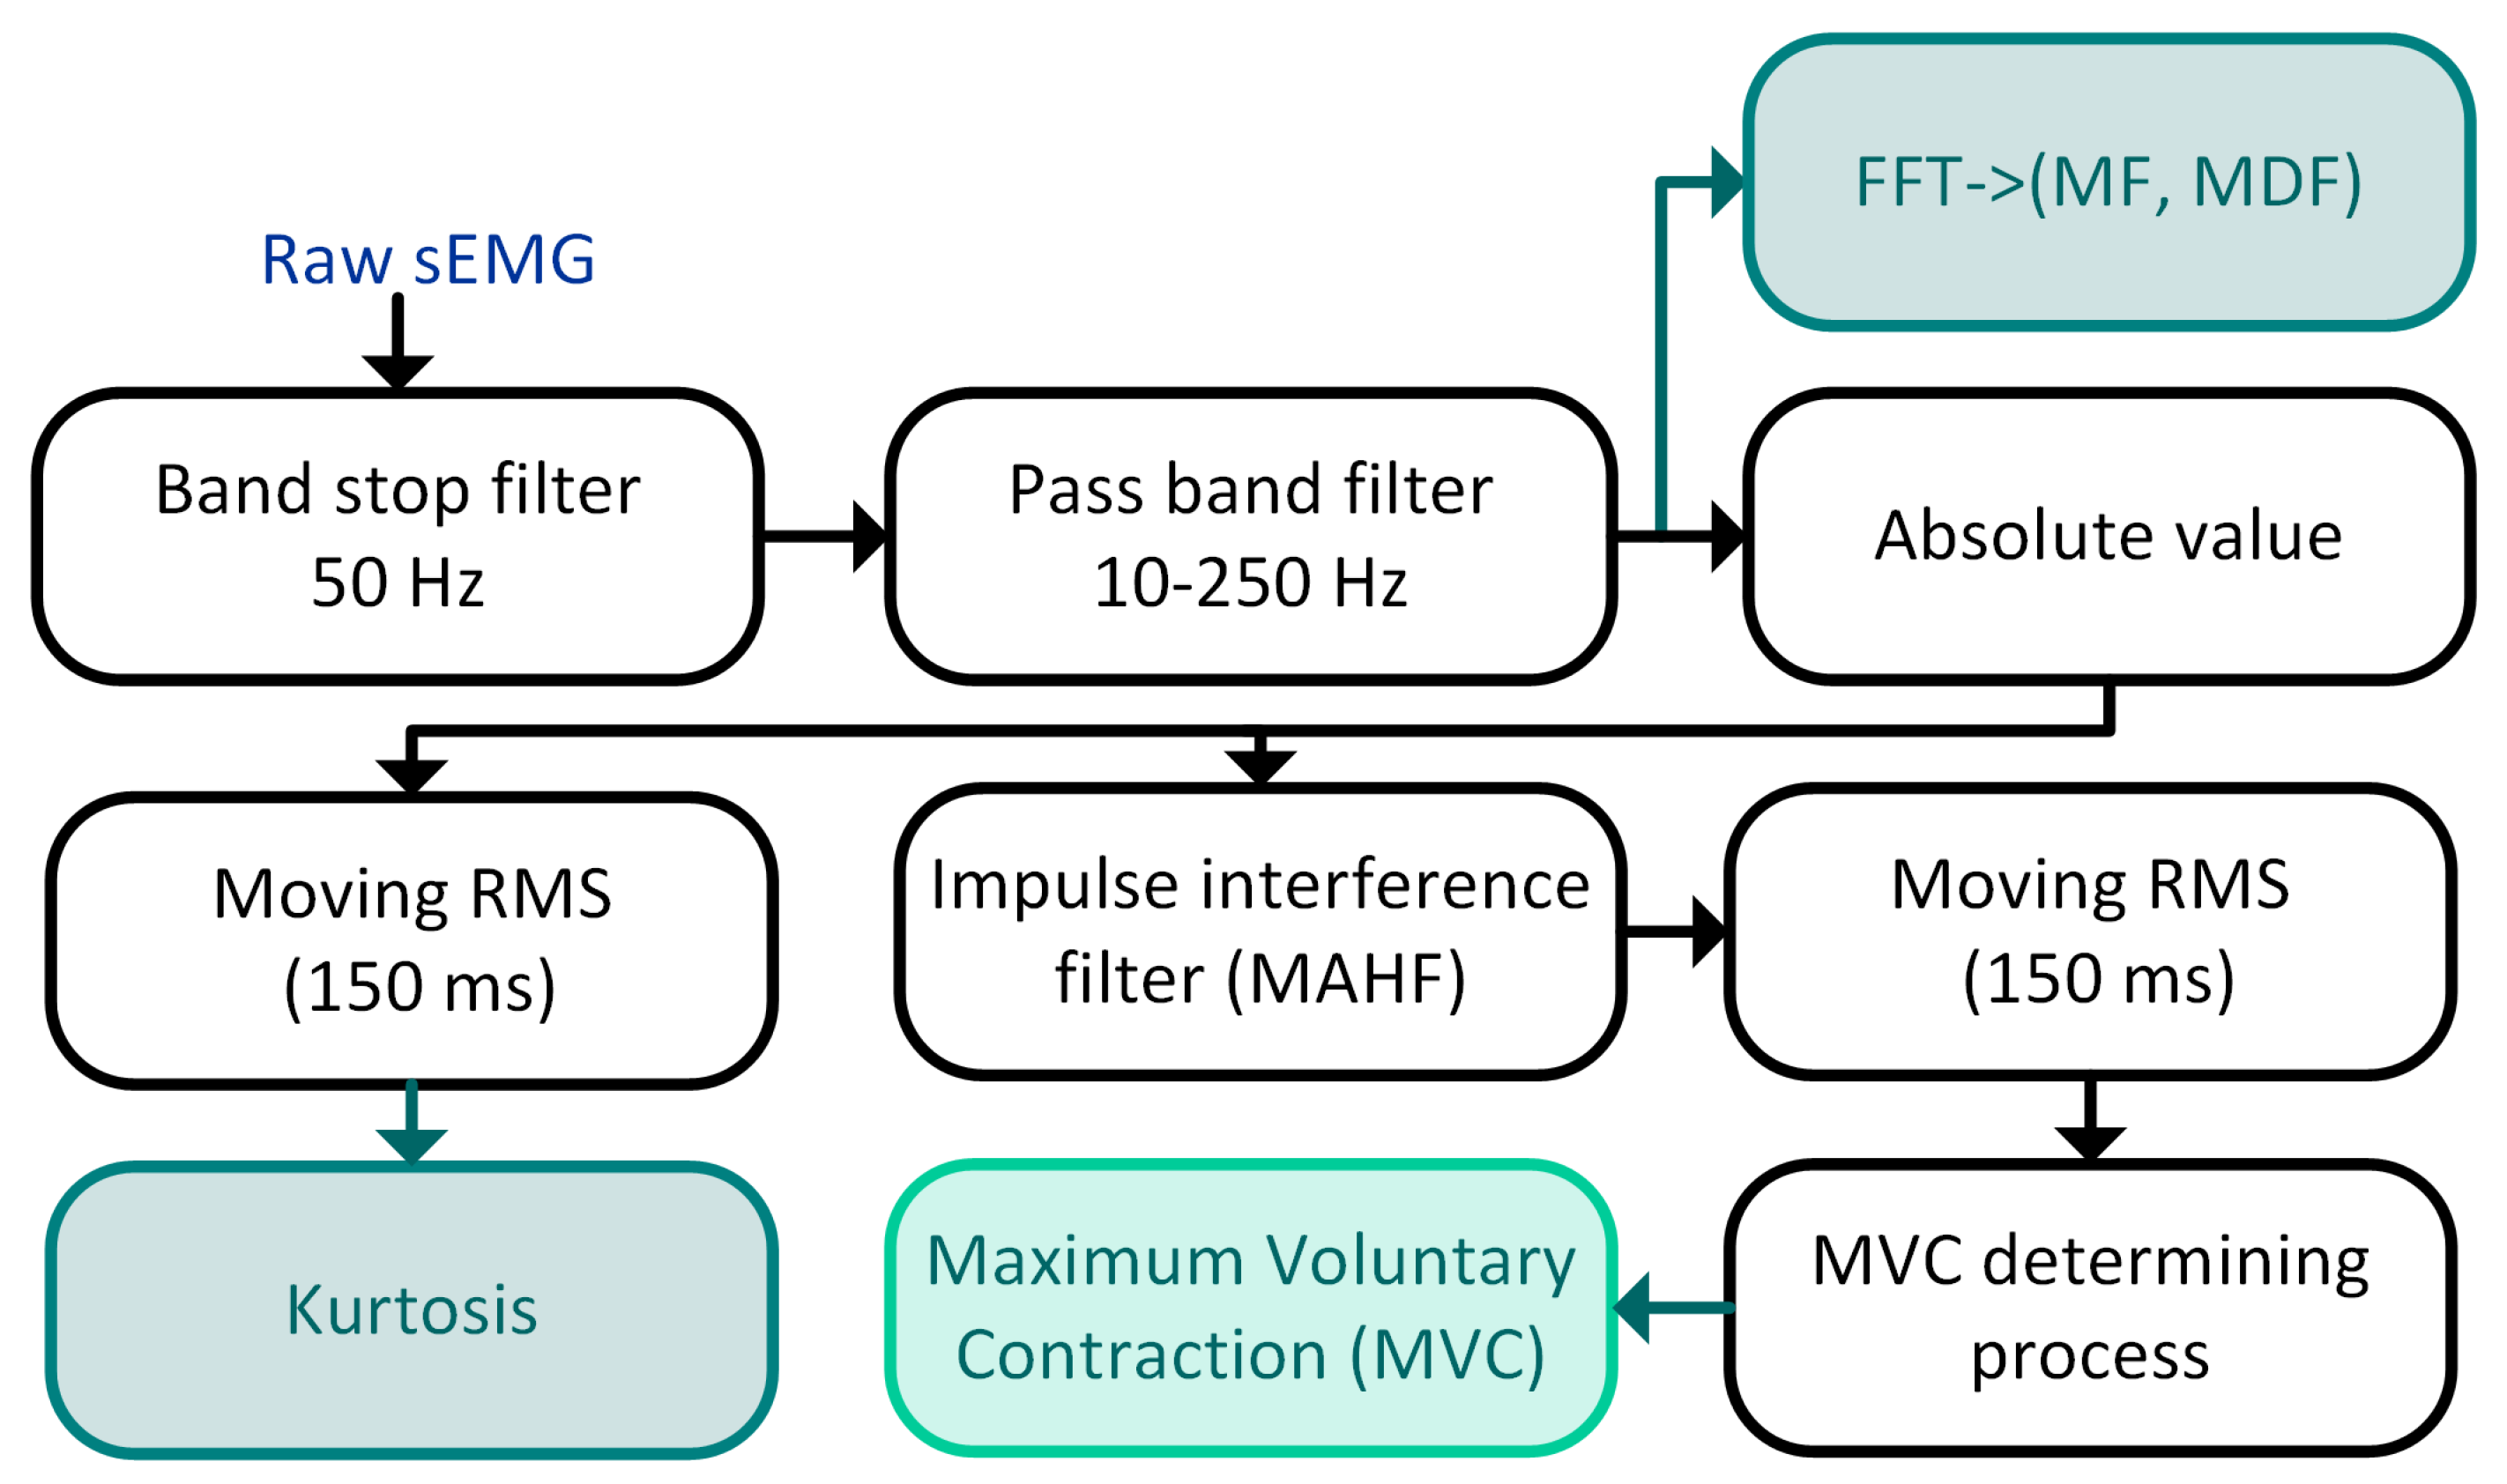
27,
28]. This method consists of the following main stages: filtering the raw sEMG signal, removing the impulse interference, calculating the envelope of sEMG, and the MVC determining process. The sEMG processing pipeline is shown in
Figure 4. In the next two paragraphs, we present some details of our method.
Surface EMG Filtering and Enveloping
The sEMG signal was filtered by two digital finite impulse response filters (FIR): the band stop 852-order filter to attenuate the main interference (50 Hz) and the bandpass filter from 10 to 250 Hz (cascaded connection of 266-order high-pass and 5-order low-pass filters with 60 dB attenuation). The frequency characteristics of the used filters are shown in
Figure 5.
The impulse interference was removed by the moving average [
29,
30] hole filter (MAHF) [
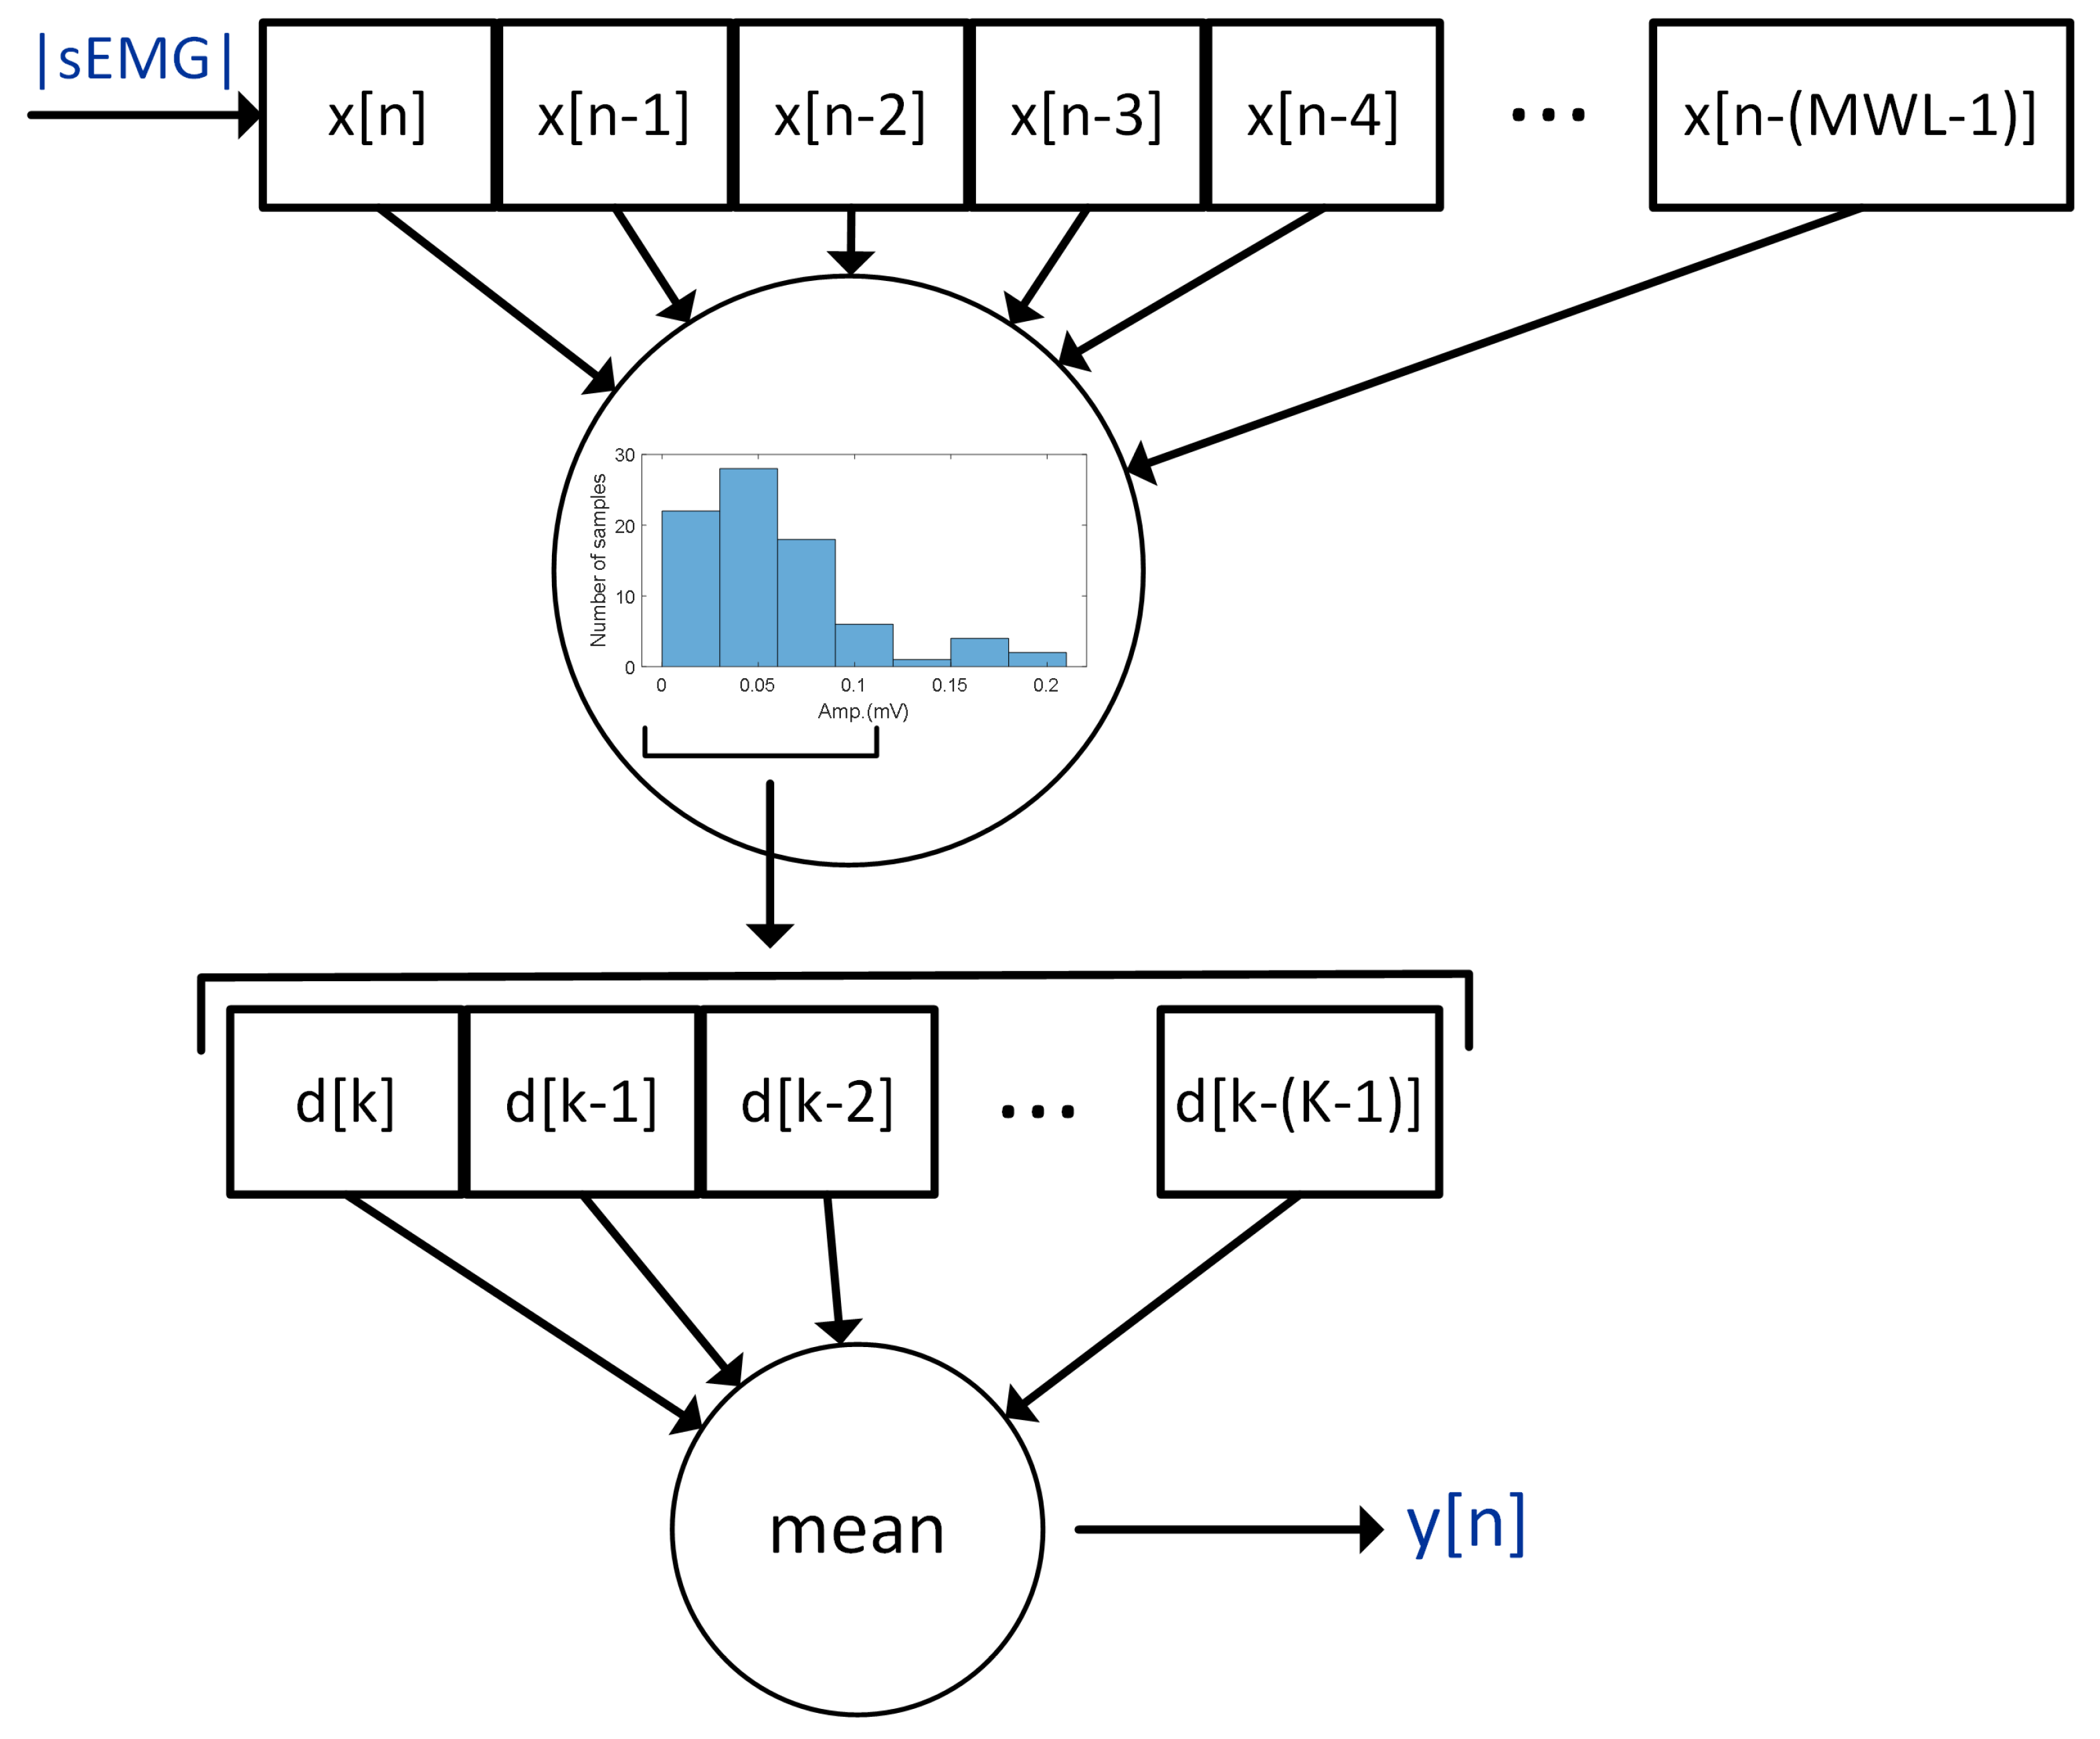
27]. MAHF calculates a 7-bin histogram in a moving window (
1) of 80 ms length (
) containing the absolute value of sEMG samples.
where
x is an absolute value of a sEMG signal sample,
n is the number of samples, and
is the moving window length. Next, the four most numerous bins are found, and the vector
D of the sEMG samples (
, for
, where
) belonging to the detected most numerous bins, is created. The mean value of
D is the output of MAHF. The principle of the operation of MAHF is presented in
Figure 6. After the filtering stage, the signal was processed using a moving root mean square (MRMS) with a window length of 150 ms. In the next step, the variance analysis of the processed sEMG derivative was used to determine muscle excitation levels. The details of the threshold process are given below.
Thresholding
The processed sEMG signal representing muscle excitation was divided into 100 ms segments to determine the muscle excitation threshold. For each segment, the first derivative and the variance (the measure of dispersion) of the derivative are calculated to find the level of artifacts. Then, the mean (
) and standard deviation values of variance (
) from whole segments of derivatives are calculated according to Formulas (
2) and (
3), respectively.
where
denotes the variance of derivatives of i-th segments of sEMG signal for all (
N) sEMG segments under consideration. (
) and (
) values give information on sEMG amplitude changes.
Based on the calculated
and
, the threshold level for detecting artifacts (
) is determined using the following formula:
where
(
2) and
(
3) are the mean and standard deviation [
30] of variance from the segments of derivatives, respectively, and
is a constant that determines the sensitivity of artifact detection. In our case,
was set to
.
In the next step, the variance value of each segment is compared with
. If the variance of the first derivative of a given segment exceeds
, the analyzed segment of sEMG is marked as noisy and excluded from further analysis. Then, the maximum amplitude of sEMG signal (
) is determined according to (
5):
where
is a processed discrete sEMG signal and
K is the length of analyzed (not marked noisy) sEMG.
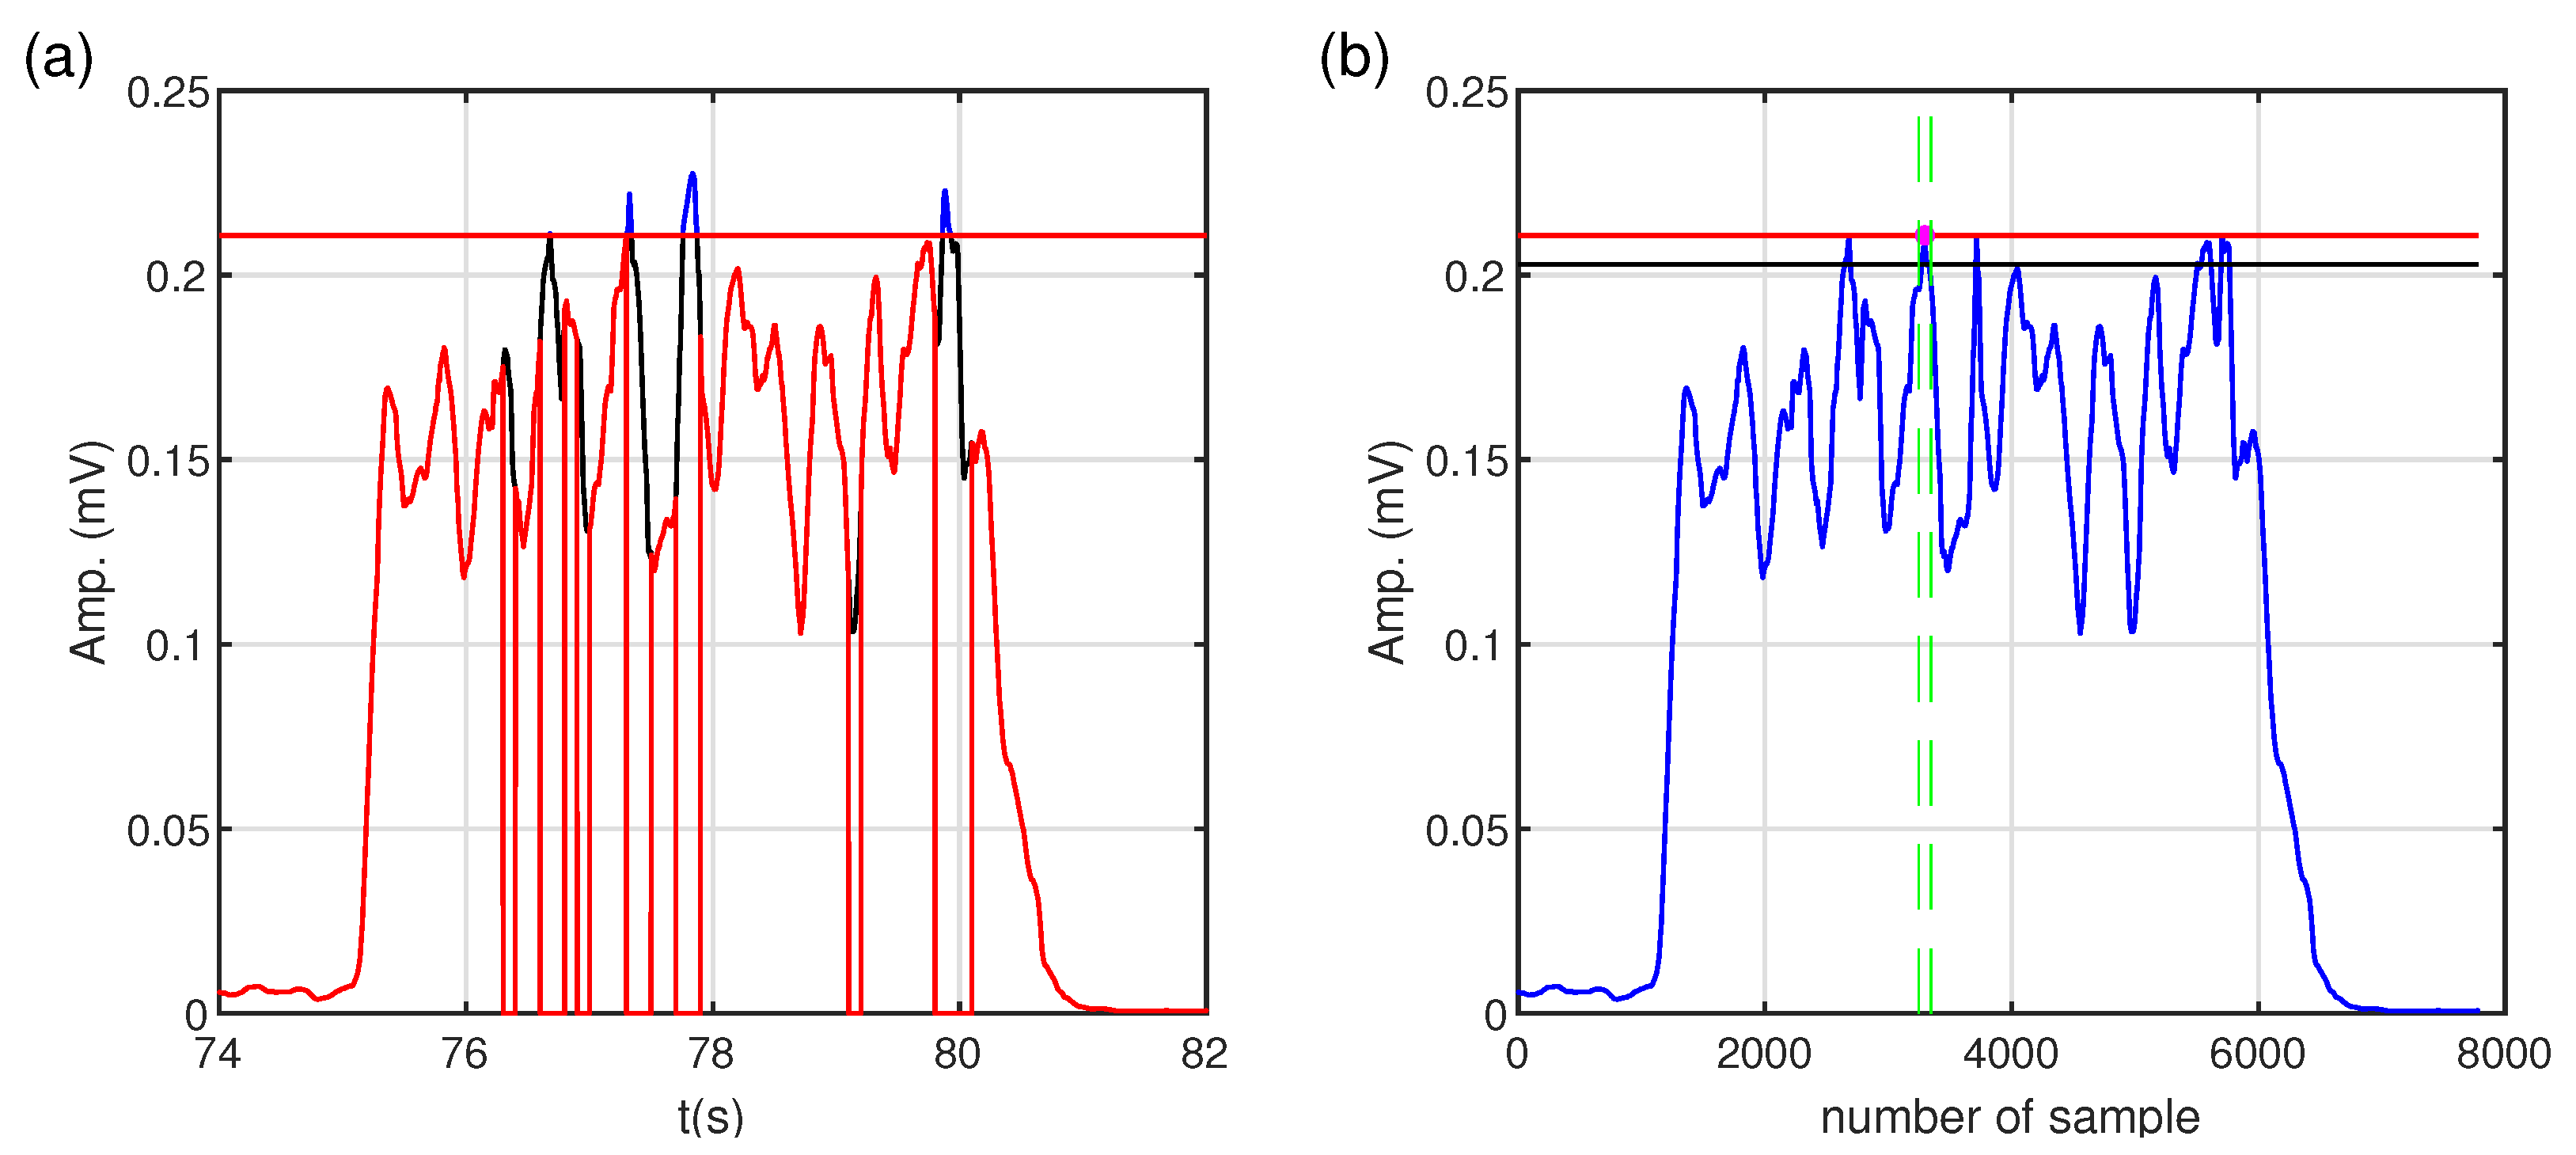
In the further steps, all samples of the sEMG signal exceeding the determined maximum amplitude are ignored. The maximum value and time location are searched in the sEMG signal prepared in this way. Finally, a symmetric window of a
length is created relative to the found time location. The threshold value is defined as the mean of the sEMG signal in the assumed window and refers to the level of muscle excitation. The illustration of the threshold process is shown in
Figure 7.
For a brief presentation of using proposed method of sEMG signal processing, an example of a raw sEMG signal and the determined MVC value of the chosen muscle (biceps femoris) are shown in
Figure 8 and
Figure 9, respectively.
2.2.2. Frequency Parameters: Mean and Median Frequency
Median frequency (
) is a frequency at which the EMG power spectrum is divided into two regions with equal amplitude.
is a measure that indicates the frequency of muscle activation, and its relationship to %MVC can be useful in assessing how effectively muscles are engaged during exercise. Mean frequency (
) is a weighted average of all frequencies in the EMG signal and is a typical indicator of muscle fatigue. Within sEMG frequency analysis,
,
, and the zero-crossing rate (ZCR) (which is not used in this work) are the most important parameters in fatigue studies [
7,
31,
32]. In our analysis, as far as the frequency parameters are concerned, we focus on the
mainly because it is less susceptible to interference than the mean frequency, and its decreasing value, similar to the
value, also indicates muscle fatigue. However,
is a more stable measure than
.
and
are calculated according to Formulas (
6) and (
7) [
33]:
where
is the frequency value of the sEMG power spectrum at the frequency bin
j,
is the sEMG power spectrum at the frequency bin
j, and
M is the length of frequency bin.
2.2.3. Kurtosis
Kurtosis for an sEMG signal is a measure of distribution, that is, how often extreme (high) values occur relative to the normal distribution. It can provide information about the structure of the muscle signal, including changes related to muscle activation, fatigue, or contraction type. High kurtosis means that a signal has more “spikes”, and the presence of extreme values, i.e., values that deviate from the average EMG value, may indicate more impulsive muscle activity (e.g., recruitment of large motor units). Some muscles are more or less active than the average, which may indicate various factors, such as specific movement patterns, muscle fatigue, or the presence of pathological processes. Low kurtosis means the signal has the “flatter” plot, and it may in turn indicate even more activation or fatigue (decrease in intense impulses). In classic terms, kurtosis is expressed by (
8) [
34]:
where
s is a signal and
is the expected value of the signal
s. In our study, to calculate the kurtosis of a discrete sEMG signal, the following formula (
9) is used:
where
is the mean of the discrete signal
and
N is the number of signal samples. Kurtosis for the Gaussian random variable (
s) calculated according to Formula (
9) is equal to 3.
2.2.4. Co-Activation Index
The co-activation index (
) is a quantitative measure used to assess the simultaneous activation of agonist and antagonist muscles during movement.
is calculated as follows [
35,
36]:
where
and
are the normalized sEMG values (e.g., %MVC) of two muscles (typically agonist and antagonist), while
is the smaller of the two values. The value of
ranges from 0 to 1. A value of 0 indicates no co-activation, while 1 indicates equal and maximal simultaneous activation of both muscles.
The selection of muscle pairs for the
calculation was guided by their functional roles during the deep squat. The goal was to capture co-contraction patterns between muscles that either act as agonist–antagonist pairs or play a stabilizing role. Surface EMG signals normalized to %MVC were used to
calculation. Muscle pairs selected for
analysis are presented in
Table 2.
2.3. Statistical Analysis of sEMG Parameters
Statistical analysis was performed to establish whether there are relationships between the degree of correctness of exercise performance (in this case, deep squat) and parameters %MVC, , , and calculated based on sEMG of the individual muscles: deltoid muscle, latissimus dorsi muscle, gluteus muscle, rectus femoris, vastus medialis, and biceps femoris. Statistical analysis was performed by TIBCO Software Inc. (2017), Statistica (data analysis software system), version 13.
The nonparametric Kruskal–Wallis ANOVA and multiple comparison post hoc Dunn’s tests with Bonferroni correction were applied for groups 1–3 for the muscles of the lower part of the body, and the Mann–Whitney U test for muscles of the upper part of the body. For all statistical analyses, the significance
-level was set to 0.05. For a more complete interpretation of the obtained results, the effect size was also calculated for the Kruskal–Wallis, post hoc Dunn’s tests, and Mann–Whitney U test. Such an approach allows assessment of the practical meaning of the obtained results, especially their statistical significance. Two indexes were used to calculate the size effect,
for Kruskal–Wallis and
r for the post hoc Dunn’s and Mann–Whitney U tests. The parameters
and
r measuring the effects size are expressed by the following formulas [
37], respectively:
where
H is the value of Kruskal–Wallis test statistic,
k is the number of groups, and
N is the sample size,
where
Z is the value of the Dunn Z test statistic, and
N is the sample size (i.e., the sum of samples of each group).
In the case of the Kruskal–Wallis test, parameter
is defined as a very small effect size,
is a small effect size,
is a moderate effect size, and
is a large effect size [
38]. The
r parameter measures the effect size based on the
Z statistic of the Dunn’s test. In this case, if
(small effect size), this means that differences between groups exist, but they are relatively weak and hard to notice in the data, so they could be less practically significant. In the case
(moderate effect size), the differences between groups are noticeable, and the differences that are statistically significant could also be practically significant even though they are not too big. If the
, the effect size is large, and it indicates strong differences between groups. In this case, the differences are clear and could be easily noticed in the analyzed data; such results have potentially high practical significance [
38].
3. Results
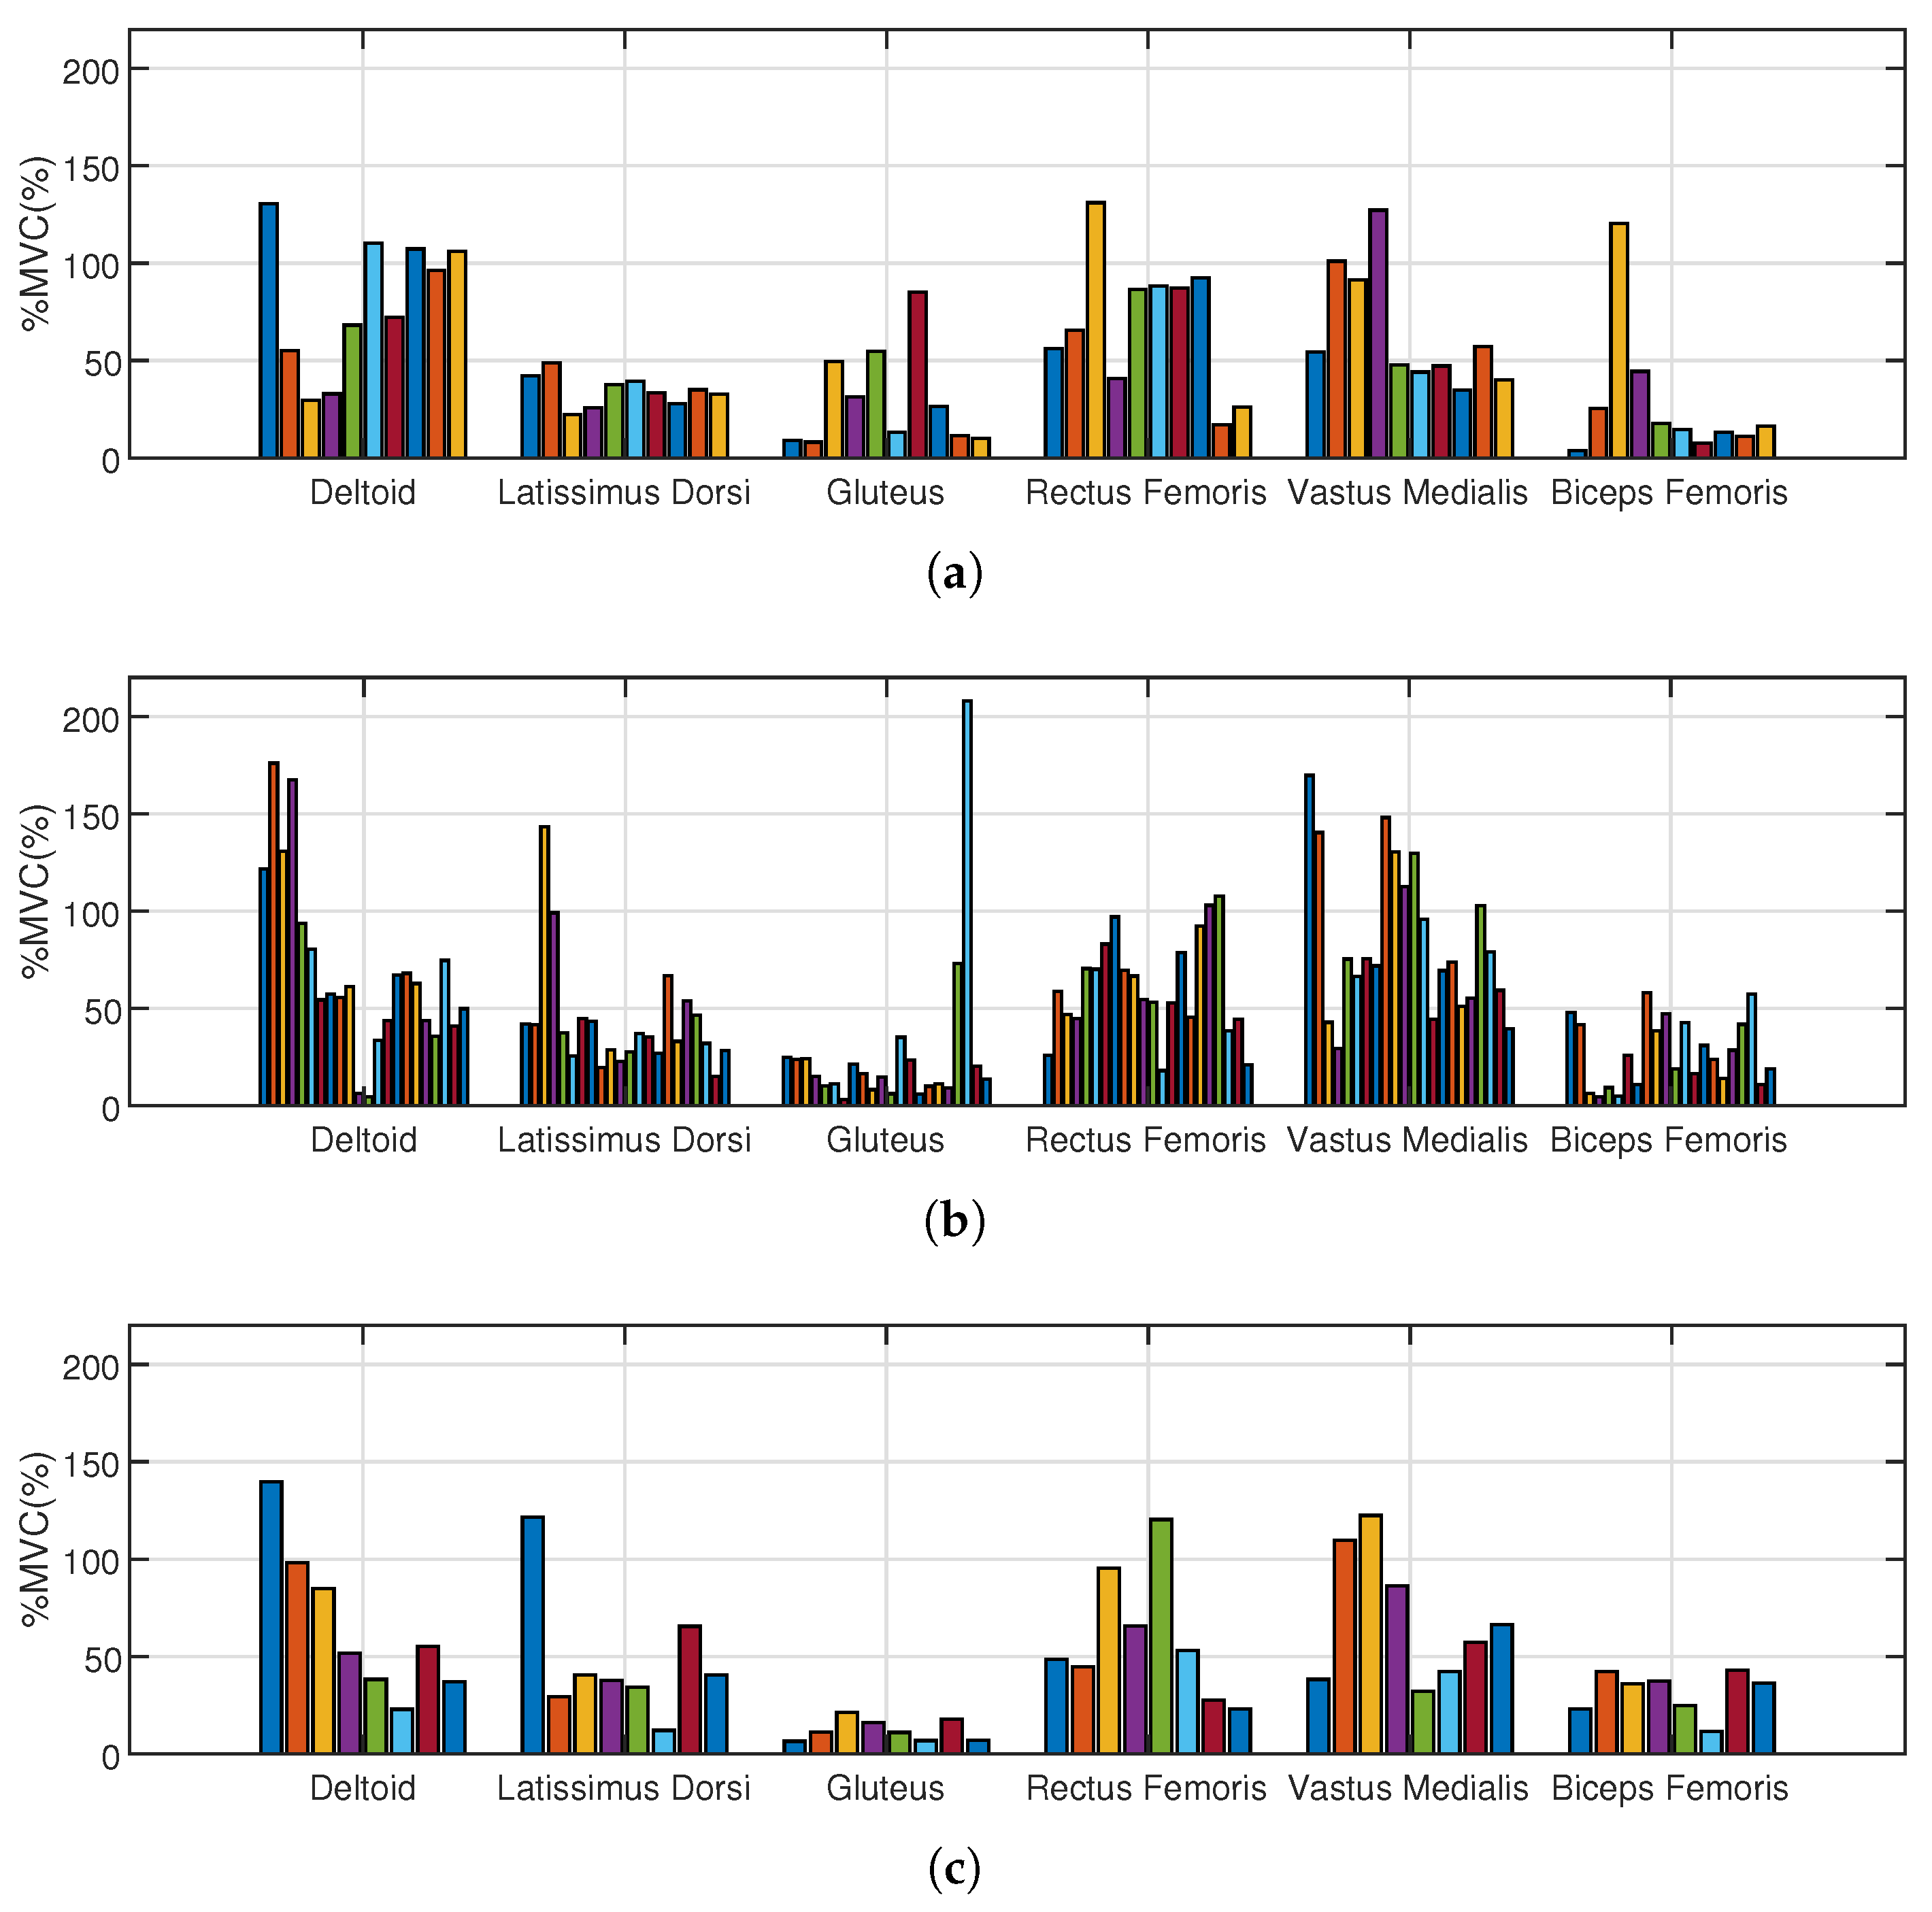
The determined normalized excitation values taken into account in the analysis of selected muscles for individual groups 1-3 are shown in
Figure 10.
In the first step of the statistical analysis, the assumptions concerning normal distribution and homogeneity of variance for all examined parameters of individual muscles were verified. According to the Shapiro–Wilk test (for normality) and the Levene test (for homogeneity of variance), we had to reject the null hypothesis of a normal distribution of %MVC, , , and for most (except for the rectus femoris) of the muscles considered, as well as the null hypothesis of equality of means of %MVC, , , and for muscles taken into account.
Since the conditions regarding normal distribution and homogeneity of variance were not met, and additionally due to the small sample size, the nonparametric Kruskal–Wallis ANOVA test (based on ranks) was applied for further analysis.
The statistical relationship between selected parameters (% MVC, , , and ) and the quality of deep squat technique was tested for muscles in the upper (deltoid and latissimus dorsi) and lower (gluteus muscle, rectus femoris, vastus medialis, and biceps femoris) parts of the body. The most interesting results (significant statistical differences) were obtained for %MVC and , so in further analysis, we focus on these parameters. We present the accurate results of %MVC analysis as well as the summarized (Table 8) results for .
In the Kruskal–Wallis test performed for the rectus femoris, vastus medialis, biceps femoris, and gluteus muscles, without division into groups and with a variable grouping of the muscles, there appeared a statistically significant (
p < 0.00001) difference in %MVC for the tested muscles. In the next step, the analysis was performed on groups 1–3 (group 1 (23–54%) of correctness exercises, group 2 (62–77%), and group 3 (85–92%)). The higher the group index, the better the deep squat was performed. Further analysis for individual groups 1–3 confirmed a significant difference in %MVC for muscles tested in individual groups for group 1 (
p = 0.0021), group 2 (
p< 0.00001), and group 3 (
p = 0.0001) with the large effect size in each group (
Table 3).
The question arises as to which muscle excitation level in particular groups results in the emergence of statistically significant differences in these groups. Multiple comparison post hoc tests were performed to answer the question of which of the pairs of the compared muscles were responsible for rejecting the null hypothesis: n independent samples come from the same population (distribution) or the population with the same median. The results obtained by the post hoc Dunn’s tests with Bonferroni correction are presented in
Table 4,
Table 5 and
Table 6. In the presented
p-values, the correction for the number of comparisons was taken into account to simplify the comparison with the assumed
-significance level. The statistically significant differences between muscle excitation are highlighted in red in
Table 4,
Table 5 and
Table 6.
The same analysis was performed for upper body muscles, in our case the deltoid and latissimus. For the same reasons as for the muscles of the lower part of body, that is, lack of normality and homogeneity of variance, as well as a small sample size, the Mann–Whitney U test was performed to verify the null hypothesis that the two random chosen samples come from the same population or, more precisely, from the population with the same median. Based on the Mann–Whitney U test, we can state significant differences in excitation (expressed in %MVC) between the deltoid and latissimus muscles in group 1 (p = 0.0451) and group 2 (p = 0.0037) with moderate effect size. However, we can not reject the null hypothesis for group 3.
To clarify, based on further discussion of
Table 7 and
Table 8, we collected all statistically significant differences and effect sizes of muscle excitation (in %MVC) and median frequency, respectively, for groups 1–3 and all muscles (upper and lower parts of the body) considered in this study.
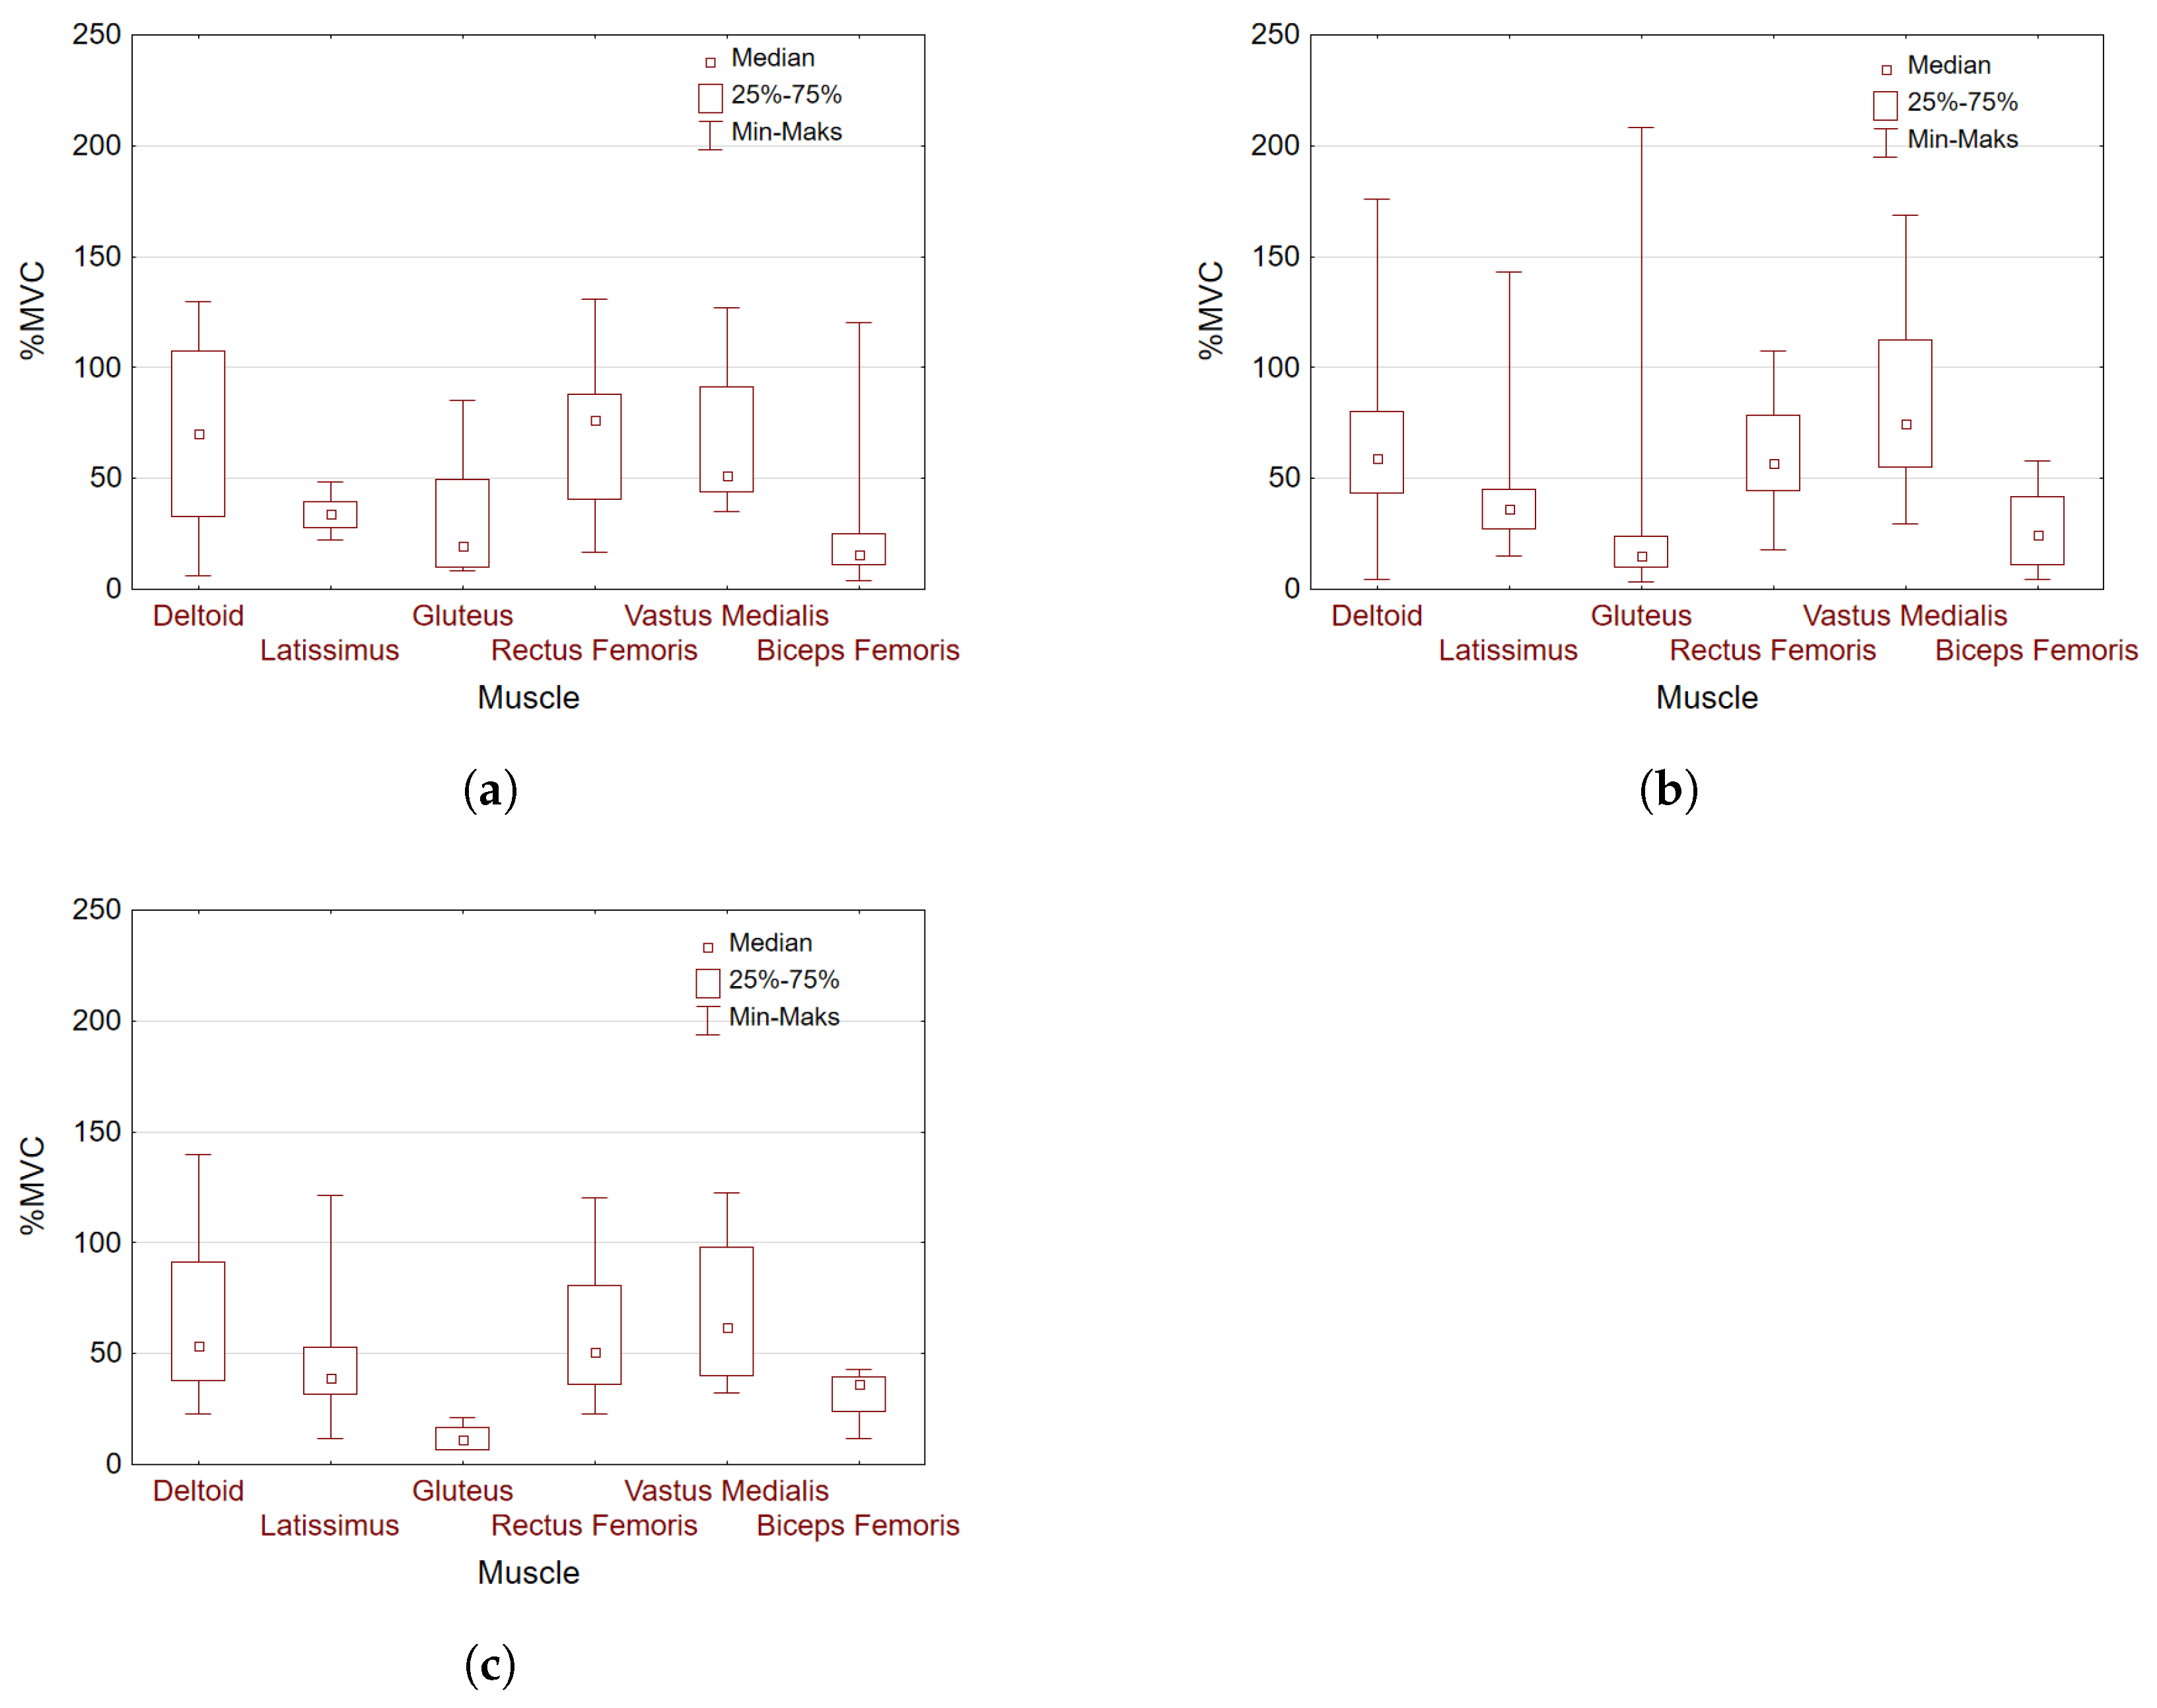
Figure 11 presents box plots for %MVC with division into deep squat level performance groups for all muscles concerned.
The average co-activation indexes calculated based on %MVC for selected muscle pairs and individual groups 1-3 are presented in
Table 9.
4. Discussion
The fundamental question we are looking to answer in this study is whether, based on the sEMG signal recorded during physical exercise and our proposed parameters (%MVC,
,
, kurtosis, and
), we can assess the correctness of a deep squat performance. It is an important issue because if the squat is executed correctly, it can be not only a safe and effective exercise in the rehabilitation process but also a good development exercise for athletes [
10]. Our research can provide useful parameters that could support the development of an objective method for assessing the quality of performing a deep squat. All indicated parameters were analyzed, but the most interesting results were obtained for %MVC,
, and
, so in the Discussion we focus on these three parameters. The statistical analysis for the lower and upper body muscles (
Table 7 and
Table 8) indicated statistically significant differences with at least moderate and in some cases even large effect sizes in muscle excitation and median frequency in individual groups 1–3, depending on the technical quality of the deep squat performance. The results of the statistical analysis for %MVC and
are promising and confirm that our thesis is valid for a small sample size, but it still needs further justification.
In the first group, where physiotherapists evaluated the technical quality of the deep squat as the worst, there were significant differences in muscle excitation expressed in %MVC between RF and BF (
p = 0.0193) and between VM and BF (
p = 0.0333). The
parameter confirms the statistically significant difference between RF and BF (
p = 0.0039) but also indicates statistically significant differences for RF and VM (
p = 0.0117) and for RF and GM (
p = 0.0011). It can suggest that the quadriceps muscle (RF, VM) takes over the work, which may indicate an incorrect movement pattern (e.g., too much forward knee). According to Slater et al. [
19], a poorly performed squat may change lower limb alignment, increasing the knee valgus, which may expose the lower limb joints too much torque, which may require adaptive muscle activation strategies to stabilize the lower limbs joints. In this group, the average
values (
Table 9) are the lowest, which can indicate problems with knee and shoulder joint control. Similar findings concerning co-activation were reported by Barrata et al. [
39]. They concluded that co-activation of the antagonist is necessary to aid the ligaments in maintaining joint stability.
In the second group, in which the correctness of performing the deep squat increased, statistically significant differences in excitation were also observed between RF and BF (
p = 0.0019) and between VM and BF (
p = 0.0000), as they were for group 1, but additionally, a statistically significant difference appears in the excitation of RF and GM (
p = 0.0000) and of VM and GM (
p = 0.0000). We can observe greater involvement of quadriceps muscles (VM, RF) and moderate activity of the gluteus and biceps femoris; there is no dominance of one segment. In this group,
also confirmed the statistically significant differences obtained for the first group (RF and BF, RF and VM, RF and GM), but in addition, a significant difference between VM and GM was detected. Muscle co-activation indexes (
Table 9) in this group were slightly higher than those in group 1, suggesting improved coordination. The research of Aagaard et al. [
40] showed that co-activation of agonist and antagonist muscles (e.g., quadriceps and biceps femoris) is important for knee joint stabilization, which may translate into improved technique in exercises such as the overhead squat but still does not guarantee full control and stability in demanding movements.
In the third group of subjects, who performed the deep squat the best, there was a statistically significant difference only between the excitation of RF and GM (
p = 0.0011) and of VM and GM (
p = 0.0002). These results are consistent with the findings of Casterisano et al. [
13,
41], who stated that there are no significant differences in muscle activation between the biceps femoris and two quadriceps muscles, vastus medialis and vastus lateralis, at various depths of squat in weightlifters. The
parameter confirmed the statistically significant differences between RF and GM and also between RF and BF. The effect size for both %MVC and
in this group is large (
Table 7 and
Table 8). In the analysis of co-activation between the rectus femoris and biceps femoris, as well as between the vastus medialis and biceps femoris, a clear upward trend (
Table 9) in
values was observed with the improvement of the exercise technique. In line with [
42], the squat does not compromise knee stability and can enhance stability if performed correctly. Similar co-activation results were also reported during the pre-squatting phase by Dionisio et al. [
43] to keep the knee joint torque stable and into slight flexion. The highest
values in group 3 indicate a better balance of activation between the knee extensors and flexors, which may indicate more effective motor control and knee stabilization. The co-activation of antagonist muscles is a protective mechanism that increases joint stiffness and protects it from uncontrolled movements [
44].
In line with our study, the gluteus muscle plays a vital role in the link between the degree of correctness of deep squat performance and muscle excitation of the lower part of the body. Syed et al. in [
45] also report “that presented systematic review supports the evidence indicating gluteus medius activity showing moderate to strong relationship with weight-bearing activities like squatting with patellofemoral pain syndrome”. The lower activity of the gluteus muscle in group 3 is not an abnormality but the result of a more economical and integrated movement pattern. According to Remian et al. [
11,
45], the gluteus medius works as a stabilizer of the femur and pelvis during weight-bearing activities. It may indicate that individuals in this group use more effective stabilization mechanisms. If the deep squat is performed correctly, the activation of the gluteus muscle is small in relation to the rectus femoris and the vastus medialis. Slater et al. in [
19] also notice that increased squat depth using relative loads may not increase gluteal activation and changes in squat performance may alter muscle involvement. Along with the deteriorating quality of the deep squat performance, statistically significant differences in excitation appeared between other pairs of muscles. In group 2, along with the decrease in the quality performance of the exercise, a statistically significant difference occurs in the excitation of RF and BF and of VM and BF, which can indicate that the activation of the biceps femoris could compensate for the lack of correctness of exercise performance. In group 1, where the exercise was performed the worst, no significant difference can be pointed out in the excitation of RF and GM and of VM and GM, which was the characteristic feature of group 3 with the best-performed deep squat. However, a statistically significant difference is still preserved between the excitation of RF and BF and of VM BF, which was characteristic of group 2. Our observations are consistent with the findings of Slater et al. [
19], who also reported that poorly performed squats are related to altered gluteal activation, indicating that the changes in squat performance may change muscle involvement.
The appearance of statistically significant differences of RF and BF and of VM and BF in groups 1 and 2 can be related to less correctly performed exercise. Gorsuch et al. [
41], in their studies, stated the hypothesis that the increased hip extension necessary to return from a deeper parallel squat will significantly increase biceps femoris activity compared to a shallow partial squat, but they proved something directly opposite. In contrast to their hypothesis, the activity of the biceps femoris did not increase during a parallel squat regardless of the depth of the squat. Our studies also did not observe increased biceps femoris excitation in group 3, where the deep squat was performed the best.
Analyzing
Table 7 according to the decreasing correctness of deep squat performance, it is easy to notice changes in statistically significant differences in the excitation of individual muscle pairs. In addition,
Table 7 and
Table 8 also contain information on the appearance of a statistically significant difference and effect size in upper body muscle (deltoid and latissimus) in excitation and median frequency. For %MVC, when the correctness of deep squat performance was evaluated below 85% (that is, in groups 1–2), we can observe statistically significant differences with moderate effect size, but for
, they can be observed in each group with large effect size. The box plots shown in
Figure 11 also suggest statistically significant differences in the excitation of the tested muscle pairs in line with the results summarized in
Table 7.
Strengths and Limitations
This study focuses on whether sEMG analysis could effectively assess deep squat performance. Even though such an approach has some limitations (homogeneity of the research group and lack of more detailed analysis of exclusions), our goal was to check how sEMG signals from different muscles together responded to incorrectly performed physical exercises, particularly the deep squat. The main parameter involved in the analysis was %MVC, unique and standardized for all study participants, making the results more reliable. Additional parameters, such as slope calculation of sEMG and muscle fatigue analysis, could be added to the analysis to verify how they influence the obtained results. The method based on sEMG could be applied in the case of limited access to physiotherapists and may also find application in predicting injuries, for example, in athletes, where an “abnormal EMG” may occur significantly earlier than changes in the typically assessed exercise performance parameters. The presented method can also support the objective assessment of rehabilitation progress. The results presented in this work concerned potentially healthy and young people; however, not all of them were qualified for the third group with the highest correctness of performing deep squat, which confirms that evaluating the correctness of exercise performance is essential to avoid bad habits and, in the long term, harmful consequences. Although the results are promising, the sample size of the study should be extended, mainly with regard to the third group.


